attendance data to action toolkit
TRANSCRIPT

ATTENDANCE DATA TO ACTION TOOLKIT
March 2021

Accountability Reporting- Attendance Data in Action Toolkit- March 2021 1
Attendance Data in Action- Accountability Reporting
Table of Contents Why Review Attendance Data? ..................................................................................................................................2
About Attendance data within the Accountability Reporting Application .................................................................3
School Data ..............................................................................................................................................................3
Questions to ponder: ..............................................................................................................................................4
School Data in Action .............................................................................................................................................4
Student Data ...........................................................................................................................................................5
Digging Deeper into Student Level Attendance Data .............................................................................................6
Questions to Ponder ...............................................................................................................................................7
Student Attendance Data in Action ........................................................................................................................7
About Tiered Supports ...............................................................................................................................................8
Report Data ............................................................................................................................................................. 11
Questions to Ponder: ........................................................................................................................................... 13
Report Data in Action ........................................................................................................................................ 13
Data Driven Systemic Approach to Improve Regular School Attendance ............................................................ 14

Accountability Reporting- Attendance Data in Action Toolkit- March 2021 2
Attendance Data in Action- Accountability Reporting
Why Review Attendance Data?
To benefit from instruction, students must have access to learn, this is why attendance is a leading
indicator. An indicator is a measure used to track progress over time. Attendance indicators examine the
opportunities students had to access instructional time to support their learning.
In a year of distance, hybrid and face-to-face models, measuring attendance will provide relevant data to
evaluate conditions of learning. Regardless of cause, when students are absent from learning and absenteeism
becomes chronic (e.g., missing 10% or more of enrolled school days offered through your school calendar),
students may be at risk of falling behind. Chronic absence is a powerful predictor of academic progress and
performance because it means a student has missed a substantial portion of instructional time. Chronic
absenteeism affects students at all grades, which is why it is measured across grades K-12.
Because attendance is a leading indicator, we ask that you review your real-time attendance
data displayed in the Accountability Reporting application, prior to the Wave rolling over. Doing so
allows you to:
Identify students who may be at risk of falling behind due to lost instructional time;
Evaluate tiered interventions to determine what is working and what can be improved
to plan next steps; and
Make corrections in your local student information system to improve the accuracy of
your data to inform next steps
Opportunity Measures Observed Growth Status Postsecondary Readiness
Leading Indicators Outcome Indicators
Engagement
and
Attendance
Student
Progress
Assessment
Performance
Graduation
Rates

Accountability Reporting- Attendance Data in Action Toolkit- March 2021 3
Attendance Data in Action- Accountability Reporting
About Attendance data within the Accountability Reporting Application To access attendance data available within the Accountability Reporting Application, sign into your Single Sign-
On account and click Accountability Reporting.
Attendance data housed within the Accountability Reporting application allows you to monitor how well you are
supporting ALL students in having regular school attendance. Levels of data include SCHOOL DATA, STUDENT
DATA and REPORTS. We will explore each level and connect the knowledge and actions each provides.
School Data
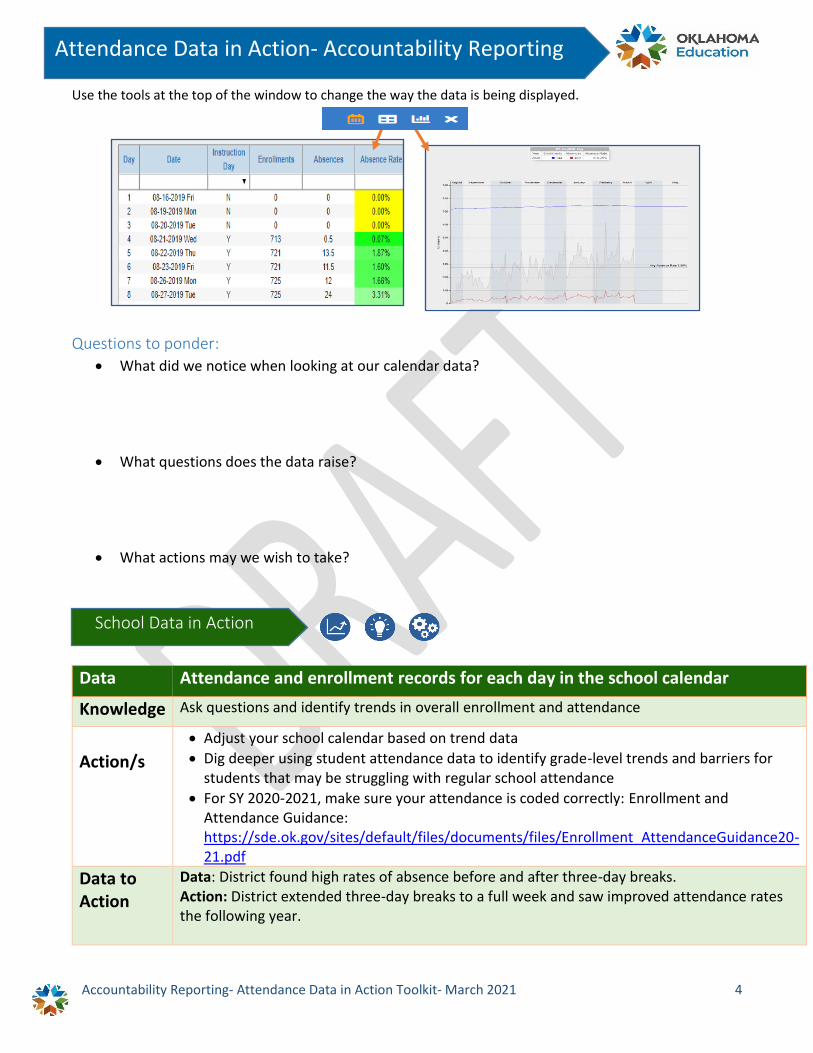
Click on View to open a calendar and display real-time attendance and enrollment data by school day. The top number in each day communicates your enrollment and the bottom number communicates the number of absences for that day.
Days highlighted in green have
statistically fewer absences
compared to other days.
Days highlighted in yellow have
no absences and alert you to a
possible coding error in your SIS
Days highlighted in pink/red
have statistically more absences
compared to other days.
Click on SCHOOL DATA and then
choose SCHOOL CALENDAR to display
attendance and enrollment trends
Accountability Reporting- Attendance Data in Action Toolkit- March 2021 4
Attendance Data in Action- Accountability Reporting
Use the tools at the top of the window to change the way the data is being displayed.
Questions to ponder:
What did we notice when looking at our calendar data?
What questions does the data raise?
What actions may we wish to take?
School Data in Action
Data Attendance and enrollment records for each day in the school calendar
Knowledge Ask questions and identify trends in overall enrollment and attendance
Action/s
Adjust your school calendar based on trend data
Dig deeper using student attendance data to identify grade-level trends and barriers for students that may be struggling with regular school attendance
For SY 2020-2021, make sure your attendance is coded correctly: Enrollment and Attendance Guidance: https://sde.ok.gov/sites/default/files/documents/files/Enrollment_AttendanceGuidance20-21.pdf
Data to Action
Data: District found high rates of absence before and after three-day breaks. Action: District extended three-day breaks to a full week and saw improved attendance rates the following year.

Accountability Reporting- Attendance Data in Action Toolkit- March 2021 5
Attendance Data in Action- Accountability Reporting
Student Data
Data displayed on the attendance tab is based on days absent; therefore, students that have not been counted
absent will not be displayed here. Data can be filtered, as shown in the example, to identify students that may
be at risk of falling behind due to lost instructional time to help you ask questions about tier two and three
interventions in place and that may be needed.
Data can also be filtered by grade level, as shown in this example, to help you gauge the effectiveness of your
tier one strategies in supporting each grade level’s regular attendance.
Students that have been counted absent
10% or more of the instructional days in
which they have been enrolled are
identified with a red box in the Absence
Rate Column.
Click on STUDENT DATA and
then choose ATTENDANCE
Accountability Reporting- Attendance Data in Action Toolkit- March 2021 6
Attendance Data in Action- Accountability Reporting
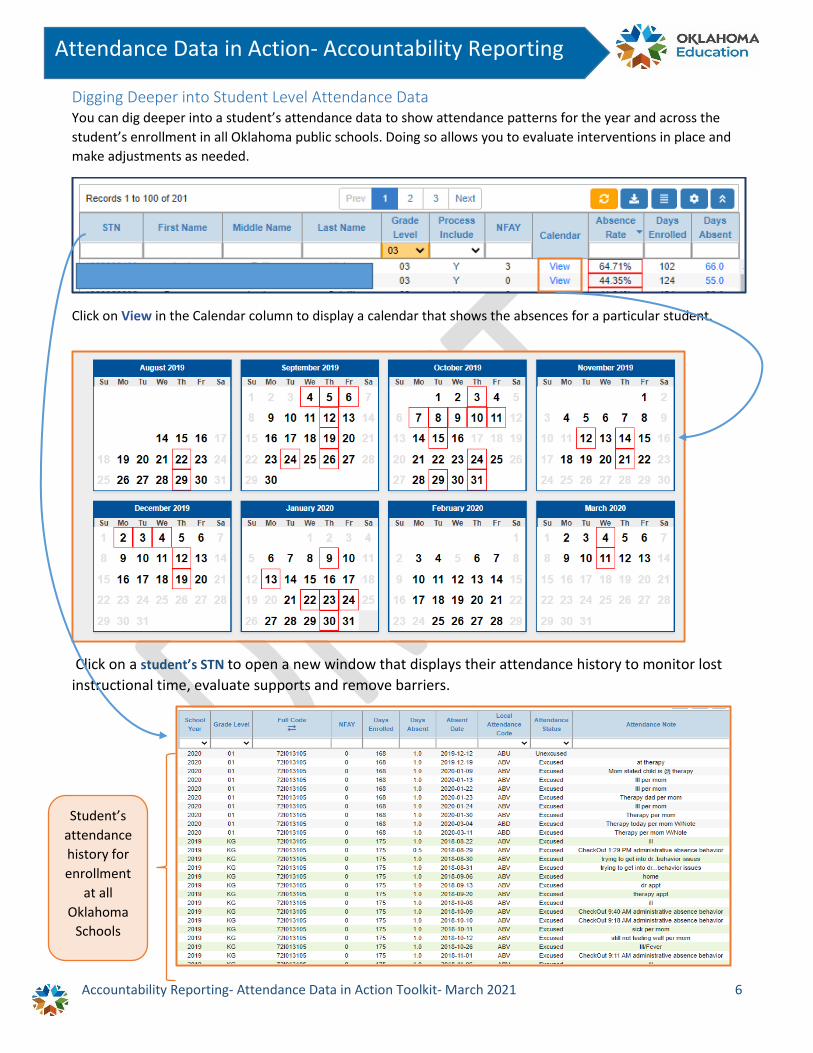
Digging Deeper into Student Level Attendance Data You can dig deeper into a student’s attendance data to show attendance patterns for the year and across the
student’s enrollment in all Oklahoma public schools. Doing so allows you to evaluate interventions in place and
make adjustments as needed.
Click on View in the Calendar column to display a calendar that shows the absences for a particular student.
Click on a student’s STN to open a new window that displays their attendance history to monitor lost
instructional time, evaluate supports and remove barriers.
Student’s
attendance
history for
enrollment
at all
Oklahoma
Schools
Accountability Reporting- Attendance Data in Action Toolkit- March 2021 7
Attendance Data in Action- Accountability Reporting
Questions to Ponder
When you think about your students that are chronically absent, what barriers do you see?
What are you currently doing to improve attendance rates?
What do you think is working? What evidence do you have?
What do you think needs to improve? What next steps will you take?
Student Attendance Data in Action
Data Attendance data by grade-level and individual student
Knowledge Ask questions and identify trends in grade-level and student- level attendance for past and in real-time so that you can monitor the effectiveness of interventions and identify needs.
Action/s
Filter student attendance data by grade-level to monitor number of students in each grade that may be or were struggling with regular attendance and connect effectiveness of interventions in place to leverage what is working and identify steps for improvement.
For past years, identify students that have been chronically absent to monitor lost instructional time and evaluate effectiveness of interventions.
In real-time, promote a tiered approach to supporting students that begins with prevention, allows for frequent monitoring, and building a culture of belonging and engagement that helps everyone understand why daily attendance matters. This will also help families and students overcome barriers.
Data to Action
Data: Data showed that more kindergarten students were struggling with regular attendance.
Action Taken: The site implemented a breakfast club for students at risk that met each week and provided the opportunity for parents or guardians to attend once each month. The site saw improved attendance and more positive partnerships with their parents.

Accountability Reporting- Attendance Data in Action Toolkit- March 2021 8
Attendance Data in Action- Accountability Reporting
About Tiered Supports
Interventions that support regular school attendance thereby increasing access to instruction, regardless of
model, fit nicely into the three-tiered system as shown in the graphic and outlined in this section.
Tier I Strategies rely on school wide steps to encourage attendance among ALL students through: Effective messaging and engagement; Removing barriers to good attendance; and Improving school climate.
Examples of Tier 1 Strategies for Distance or Hybrid Learning from Attendance Works.
Clear, concise and consistent communication about schedules and expectations Predictable daily/weekly routines, rituals and celebrations Community building to create belonging and connection Taking attendance in a caring manner Personalized outreach and communication to families when students are absent Recognition of good and improved attendance Individual wellness check and connectivity assessments Facilitate access to food, health/telehealth and supports for other basic needs Regular monitoring of attendance data to activate supports and identify trends
Foundational Whole School Supports
Tier 3:
Intensive Intervention for students facing the greatest
challenges to getting to school
Tier 2:
Early Intervention for students who need more support to avoid chronic
absence
Tier 1:
Whole School Preventions to encourage good attendance for all students

Accountability Reporting- Attendance Data in Action Toolkit- March 2021 9
Attendance Data in Action- Accountability Reporting
Additional Tier 1 Strategies from the Attendance Playbook
Tier 2 Interventions target students at greater risk of chronic absenteeism, those close to or already
missing 10% of the school year.
Examples of Tier 2 Practices for Distance or Hybrid Learning from Attendance Works
Using absenteeism data to activate targeted supports Virtual/physically distanced family meeting or home visit when absences add-up Individual attendance plan developed with families and students Additional tech support and training for families and students Mentoring (in-person and virtual) Tailored physical and mental health supports Prioritizing participation in expanded learning
Additional Tier 2 Interventions from the Attendance Playbook
Transportation
A Safer Walk to School
Breakfast for All
Laundry at School
Threshold Greetings
Rethinking Recess
Restorative Discipline Practices
Nudging Parents and Students
Home Visits
Positive Messaging
Relevant - and Culturally Relevant -Curriculum
Healthy School Buildings
School-based Health Services
Telehealth
Early Warning Systems
Mentors
Youth Engagement
Addressing Asthma
Targeted Transportation
Accountability Reporting- Attendance Data in Action Toolkit- March 2021 10
Attendance Data in Action- Accountability Reporting
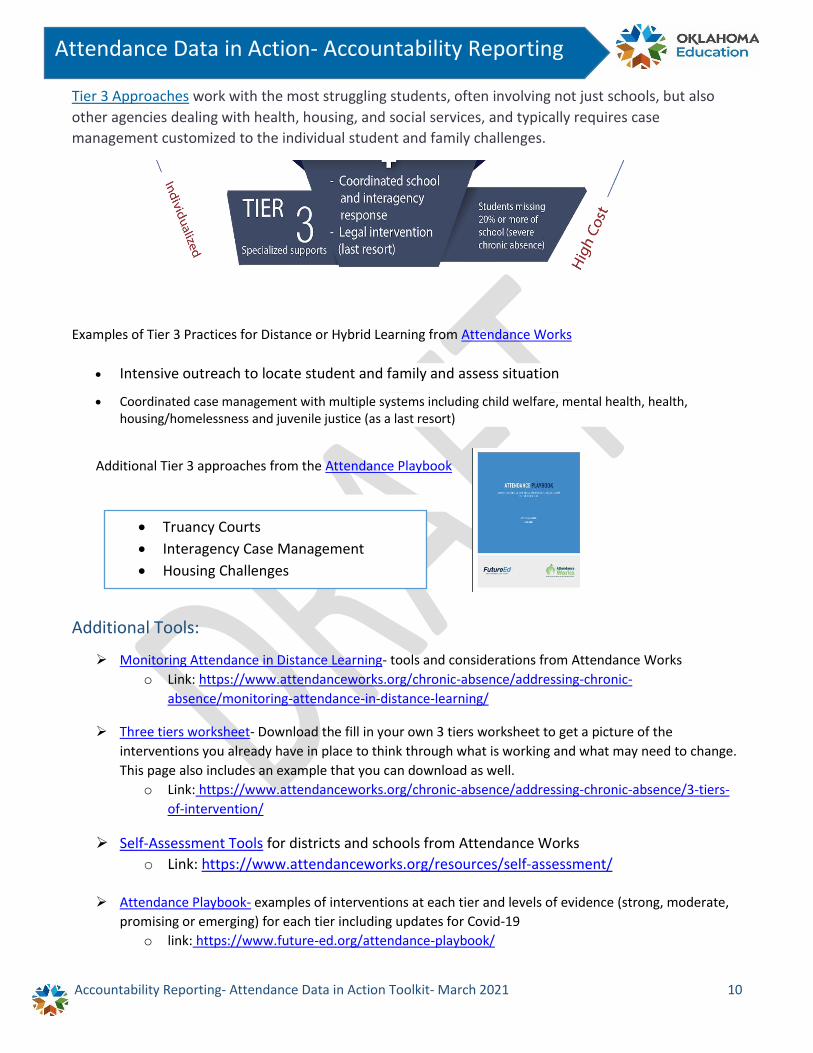
Tier 3 Approaches work with the most struggling students, often involving not just schools, but also
other agencies dealing with health, housing, and social services, and typically requires case
management customized to the individual student and family challenges.
Examples of Tier 3 Practices for Distance or Hybrid Learning from Attendance Works
Intensive outreach to locate student and family and assess situation
Coordinated case management with multiple systems including child welfare, mental health, health, housing/homelessness and juvenile justice (as a last resort)
Additional Tier 3 approaches from the Attendance Playbook
Additional Tools:
Monitoring Attendance in Distance Learning- tools and considerations from Attendance Works
o Link: https://www.attendanceworks.org/chronic-absence/addressing-chronic-
absence/monitoring-attendance-in-distance-learning/
Three tiers worksheet- Download the fill in your own 3 tiers worksheet to get a picture of the
interventions you already have in place to think through what is working and what may need to change.
This page also includes an example that you can download as well.
o Link: https://www.attendanceworks.org/chronic-absence/addressing-chronic-absence/3-tiers-
of-intervention/
Self-Assessment Tools for districts and schools from Attendance Works
o Link: https://www.attendanceworks.org/resources/self-assessment/
Attendance Playbook- examples of interventions at each tier and levels of evidence (strong, moderate,
promising or emerging) for each tier including updates for Covid-19
o link: https://www.future-ed.org/attendance-playbook/
Truancy Courts
Interagency Case Management
Housing Challenges

Accountability Reporting- Attendance Data in Action Toolkit- March 2021 11
Attendance Data in Action- Accountability Reporting
Report Data
Use the drop down menu beside
VIEW BY STUDENT GROUP to
display performance for each
ESSA Student Group.
Use the REPORTING YEAR tab to
change the year and compare
performance over time.
Click on the Denominator to
open a table that displays
data for all your students as
shown on the next page.
Click on reports and then choose SCHOOL
REPORT CARD to display your overall
report card so that you can see how the
indicators fit together. Choose CHRONIC
ABSENTEEISM to analyze your trends.
Viewing
performance by
STUDENT
GROUP helps
you gauge how
well your
interventions
are working to
engage ALL
learners.
Viewing your OVERALL
REPORT CARD helps you see
how the indicators fit
together.

Accountability Reporting- Attendance Data in Action Toolkit- March 2021 12
Attendance Data in Action- Accountability Reporting
Data can be filtered to show students that
were considered chronically absent; and
Data can also be filtered by grade level
and then filtered to show just students
that were chronically absent in each
grade;
Data can be downloaded into an excel
spreadsheet.
Click on Student Groups
to display percentage of
students not chronically
absent in each
demographic group.
Click on the numerator
or denominator to open
a spreadsheet of the
students in each group.
Note that Priority
Student groups are
included. Recall that
students are only
counted once based on
the first group with
which they associate.
The Contextual Attendance Report
includes all students enrolled at
your site at the end of the year.

Accountability Reporting- Attendance Data in Action Toolkit- March 2021 13
Attendance Data in Action- Accountability Reporting
Questions to Ponder:
1. When we compare across years, are there students groups or grade levels what do we notice?
2. What questions does the data raise?
3. What actions may we wish to take?
Report Data in Action
Data Grade level and student group trends for chronic absenteeism
Knowledge Ask questions and identify trends in grade-level and student level attendance for past years so that you can promote a tiered approach, evaluate interventions and barriers
Action/s
Evaluate your tiered approach in place Examples of interventions at each tier, including levels of evidence [strong, moderate,
promising or emerging) for each tier including updates for Covid-19] can be found here: Attendance Playbook- https://www.future-ed.org/wp-content/uploads/2020/06/REPORT_Attendance-Playbook-Covid-Edition-1.pdf
Identify trends in grade and/or student-level data to determine chronic absence levels to think through these questions: Does it affect students across the board? Consistently high levels across the board are a
sign of systemic challenges and barriers.
Are some student populations, grades or neighborhoods more affected than others? If so, resources should be targeted to better understand and address the challenges for students who face higher levels of chronic absence.
Are the chronic absence levels at your school or for particular student populations better or worse than those in other schools or districtwide? High levels for multiple schools suggest challenges related to policy barriers in the school or community. (Source: Using CA data to Improve Conditions for Learning)
Monitor lost instructional time and use findings to Evaluate effectiveness of interventions already in place;
Identify and address barriers;
Strengthen and/or expand community partnerships;
Improve conditions for learning; and
Build/strengthen partnerships between school and home.
Problem to Action Example
Problem- The district data showed that students with Disabilities had higher rates of chronic absenteeism in each grade level.
Action Taken- The site reviewed the SDE Guidance for SWD and revised IEPs and 504s when needed to ensure that when the student was receiving services they were able to count them as present.

Accountability Reporting- Attendance Data in Action Toolkit- March 2021 14
Attendance Data in Action- Accountability Reporting
Data Driven Systemic Approach to Improve Regular School Attendance As the graphic below shows, improving attendance is a team not a solo sport and ultimately requires a
systemic approach. Attendance Work’s experience working across the country tells us that while
attendance improvements can begin in a single classroom or school, the most effective and sustainable
approaches are data-driven, and are supported by strong district, school and community leadership.
Capacity Building- starts with professional development around the skills and knowledge
needed to take a data-driven, positive, problem-solving and multi-tiered approach to
supporting student attendance, participation and engagement.
Actionable Data- consists of quantitative and qualitative measures that show how much
instructional time students are missing to inform tiered approaches and activate positive
supports to remove barriers and improve access to learning.
Positive Engagement- starts by taking a positive, not punitive, approach to absenteeism
centered on a sense of belonging and understanding as to why regular attendance matters.
Strategic Partnerships- consist of partnerships between the district, school and community
working together to provide targeted resources and supports to address barriers to regular
attendance.
Adequate, Equitable Resources- ensure all students have similar opportunities to thrive and
achieve in school and consist of resources and funding.
Shared Accountability- absenteeism is a leading indicator that can be improved through
systems of support and understanding that students, families, educators, agencies and
community partners can work together.
Resources to support Systemic Change can be found at Attendance Works: Link: https://www.attendanceworks.org/resources/
Image and content used with permission from Attendance Works