local action toolkit - urban practitioner's 'toolbox
DESCRIPTION
As part of the Local Action Project, a framework for the assessment of costs and benefits of catchment management programmes in urban landscapes has been developed. Information gathered has been used to develop a framework for the quantification of benefits resulting from interventions designed to enhance ecosystem service provision or mitigate loss of provision in urban landscapes. This framework is scalable, to ensure that it can be applied to a broad spectrum of urban situations, and includes a widely applicable series of metrics that allow all potential benefits to be measured (whether monetisable value or not). The list of interventions was compiled by reviewing existing typologies of green infrastructure components and sustainable drainage systems. They were categorised into ‘existing assets’ and ‘interventions’ based on the likelihood of being implemented as a new feature.TRANSCRIPT
1
LOCAL ACTION TOOLKIT
Ecosystem services in urban water environments
Working with local communities to enhance the value of natural capital in our towns, cities
and other urban spaces to improve people’s lives, the environment and economic prosperity.
Urban Practitioner’s ‘Toolbox’ of Interventions
2
CONTENTS:
How to use this toolbox: .............................................................................. 3
Elements of the toolbox: ............................................................................... 3
Elements of the interventions: ..................................................................... 4
The Benefits Indicators: ................................................................................. 5
Interventions Toolbox – Methods: ............................................................. 6
URBAN INTERVENTIONS .......................................................................... 8
Swales ............................................................................................................. 9
Amenity Lawns ............................................................................................ 12
Wetlands ...................................................................................................... 15
Trees ............................................................................................................. 19
Retention Ponds/Basins ............................................................................... 25
Detention Ponds/Basins .............................................................................. 28
Intensive Green Roofs ................................................................................. 31
Extensive Green Roofs ................................................................................ 34
Permeable Pavements ................................................................................ 37
Rainwater Harvesting/Water Butts ........................................................... 40
EXISTING GREEN & BLUE INFRASTRUCTURE ................................. 43
Public Parks and Gardens ........................................................................... 44
Community Gardens & Allotments ........................................................... 48
Urban Rivers ................................................................................................. 53
Private Gardens ........................................................................................... 57
Access ........................................................................................................... 62
3
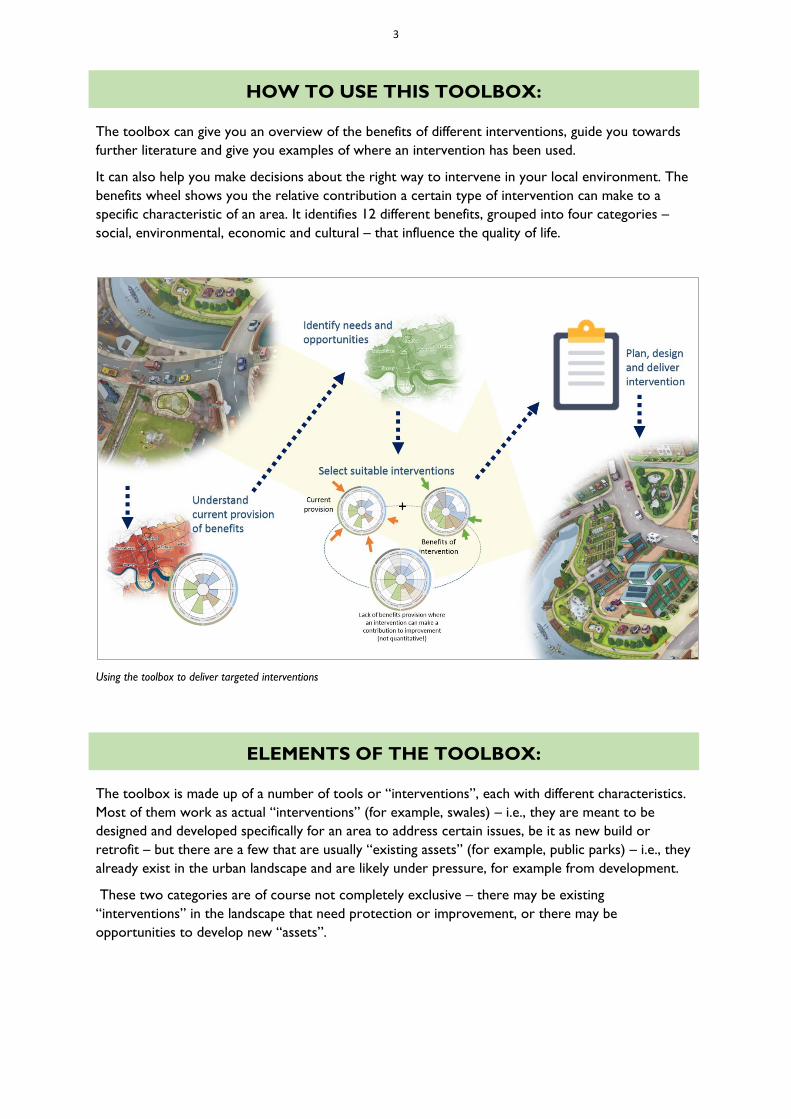
HOW TO USE THIS TOOLBOX:
The toolbox can give you an overview of the benefits of different interventions, guide you towards
further literature and give you examples of where an intervention has been used.
It can also help you make decisions about the right way to intervene in your local environment. The
benefits wheel shows you the relative contribution a certain type of intervention can make to a
specific characteristic of an area. It identifies 12 different benefits, grouped into four categories –
social, environmental, economic and cultural – that influence the quality of life.
Using the toolbox to deliver targeted interventions
ELEMENTS OF THE TOOLBOX:
The toolbox is made up of a number of tools or “interventions”, each with different characteristics.
Most of them work as actual “interventions” (for example, swales) – i.e., they are meant to be
designed and developed specifically for an area to address certain issues, be it as new build or
retrofit – but there are a few that are usually “existing assets” (for example, public parks) – i.e., they
already exist in the urban landscape and are likely under pressure, for example from development.
These two categories are of course not completely exclusive – there may be existing
“interventions” in the landscape that need protection or improvement, or there may be
opportunities to develop new “assets”.
4
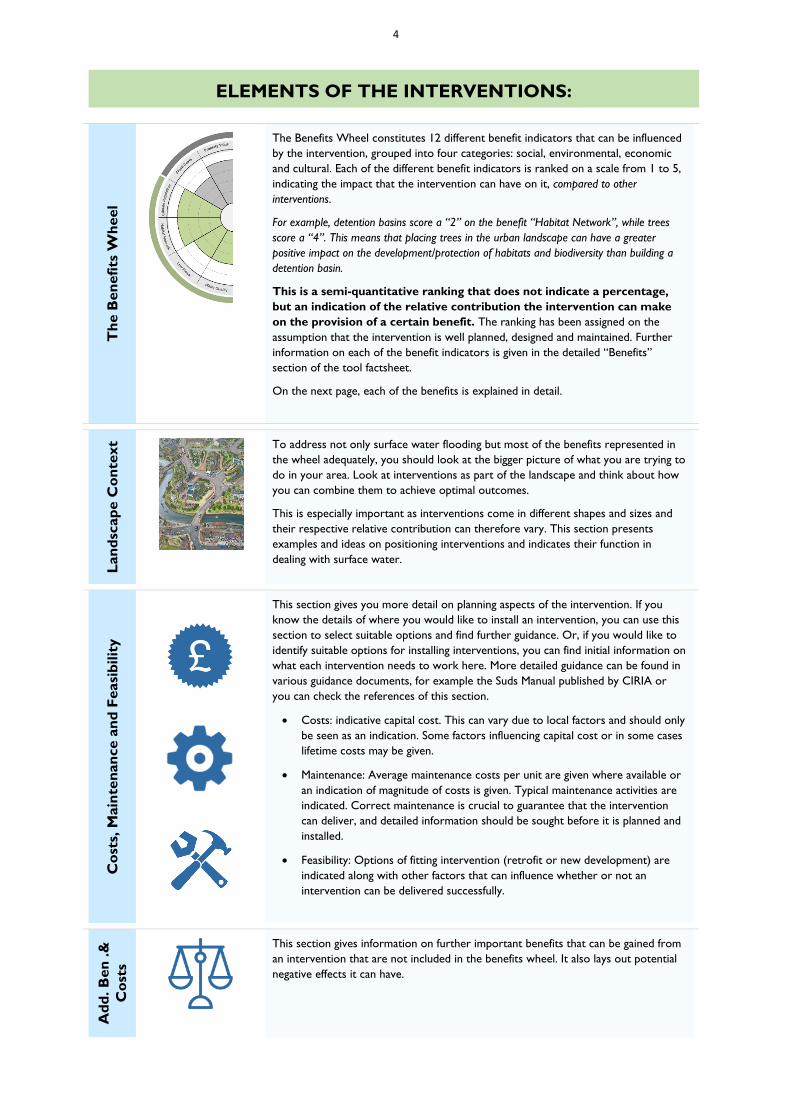
ELEMENTS OF THE INTERVENTIONS:
Th
e B
en
efi
ts W
heel
The Benefits Wheel constitutes 12 different benefit indicators that can be influenced
by the intervention, grouped into four categories: social, environmental, economic
and cultural. Each of the different benefit indicators is ranked on a scale from 1 to 5,
indicating the impact that the intervention can have on it, compared to other
interventions.
For example, detention basins score a “2” on the benefit “Habitat Network”, while trees
score a “4”. This means that placing trees in the urban landscape can have a greater
positive impact on the development/protection of habitats and biodiversity than building a
detention basin.
This is a semi-quantitative ranking that does not indicate a percentage,
but an indication of the relative contribution the intervention can make
on the provision of a certain benefit. The ranking has been assigned on the
assumption that the intervention is well planned, designed and maintained. Further
information on each of the benefit indicators is given in the detailed “Benefits”
section of the tool factsheet.
On the next page, each of the benefits is explained in detail.
Lan
dsc
ap
e C
on
text
To address not only surface water flooding but most of the benefits represented in
the wheel adequately, you should look at the bigger picture of what you are trying to
do in your area. Look at interventions as part of the landscape and think about how
you can combine them to achieve optimal outcomes.
This is especially important as interventions come in different shapes and sizes and
their respective relative contribution can therefore vary. This section presents
examples and ideas on positioning interventions and indicates their function in
dealing with surface water.
Co
sts,
Main
ten
an
ce a
nd
Feasi
bilit
y
This section gives you more detail on planning aspects of the intervention. If you
know the details of where you would like to install an intervention, you can use this
section to select suitable options and find further guidance. Or, if you would like to
identify suitable options for installing interventions, you can find initial information on
what each intervention needs to work here. More detailed guidance can be found in
various guidance documents, for example the Suds Manual published by CIRIA or
you can check the references of this section.
Costs: indicative capital cost. This can vary due to local factors and should only
be seen as an indication. Some factors influencing capital cost or in some cases
lifetime costs may be given.
Maintenance: Average maintenance costs per unit are given where available or
an indication of magnitude of costs is given. Typical maintenance activities are
indicated. Correct maintenance is crucial to guarantee that the intervention
can deliver, and detailed information should be sought before it is planned and
installed.
Feasibility: Options of fitting intervention (retrofit or new development) are
indicated along with other factors that can influence whether or not an
intervention can be delivered successfully.
Ad
d. B
en
.&
Co
sts
This section gives information on further important benefits that can be gained from
an intervention that are not included in the benefits wheel. It also lays out potential
negative effects it can have.
5
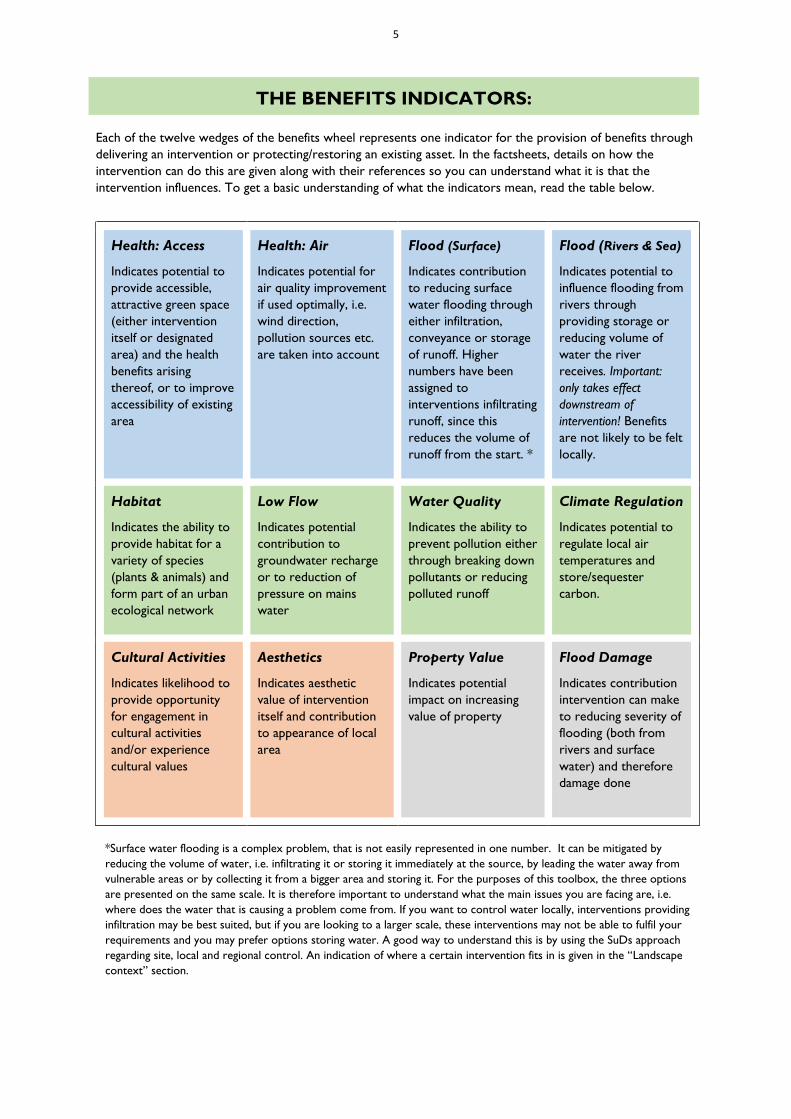
THE BENEFITS INDICATORS:
Each of the twelve wedges of the benefits wheel represents one indicator for the provision of benefits through
delivering an intervention or protecting/restoring an existing asset. In the factsheets, details on how the
intervention can do this are given along with their references so you can understand what it is that the
intervention influences. To get a basic understanding of what the indicators mean, read the table below.
Health: Access
Indicates potential to
provide accessible,
attractive green space
(either intervention
itself or designated
area) and the health
benefits arising
thereof, or to improve
accessibility of existing
area
Health: Air
Indicates potential for
air quality improvement
if used optimally, i.e.
wind direction,
pollution sources etc.
are taken into account
Flood (Surface)
Indicates contribution
to reducing surface
water flooding through
either infiltration,
conveyance or storage
of runoff. Higher
numbers have been
assigned to
interventions infiltrating
runoff, since this
reduces the volume of
runoff from the start. *
Flood (Rivers & Sea)
Indicates potential to
influence flooding from
rivers through
providing storage or
reducing volume of
water the river
receives. Important:
only takes effect
downstream of
intervention! Benefits
are not likely to be felt
locally.
Habitat
Indicates the ability to
provide habitat for a
variety of species
(plants & animals) and
form part of an urban
ecological network
Low Flow
Indicates potential
contribution to
groundwater recharge
or to reduction of
pressure on mains
water
Water Quality
Indicates the ability to
prevent pollution either
through breaking down
pollutants or reducing
polluted runoff
Climate Regulation
Indicates potential to
regulate local air
temperatures and
store/sequester
carbon.
Cultural Activities
Indicates likelihood to
provide opportunity
for engagement in
cultural activities
and/or experience
cultural values
Aesthetics
Indicates aesthetic
value of intervention
itself and contribution
to appearance of local
area
Property Value
Indicates potential
impact on increasing
value of property
Flood Damage
Indicates contribution
intervention can make
to reducing severity of
flooding (both from
rivers and surface
water) and therefore
damage done
*Surface water flooding is a complex problem, that is not easily represented in one number. It can be mitigated by
reducing the volume of water, i.e. infiltrating it or storing it immediately at the source, by leading the water away from
vulnerable areas or by collecting it from a bigger area and storing it. For the purposes of this toolbox, the three options
are presented on the same scale. It is therefore important to understand what the main issues you are facing are, i.e.
where does the water that is causing a problem come from. If you want to control water locally, interventions providing
infiltration may be best suited, but if you are looking to a larger scale, these interventions may not be able to fulfil your
requirements and you may prefer options storing water. A good way to understand this is by using the SuDs approach
regarding site, local and regional control. An indication of where a certain intervention fits in is given in the “Landscape
context” section.
6
INTERVENTIONS TOOLBOX – METHODS:
General Approach
The list of interventions was compiled by reviewing existing typologies of green infrastructure components and
sustainable drainage systems. They were categorised into “existing assets” and “interventions” based on the
likelihood of being implemented as a new feature. Parks, allotments, urban rivers/watercourses and private
gardens were classed as “existing assets” as they are usually under pressure from various factors, for example
new development. While their size or number may be increased in some cases, it is more often the case that
existing ones have to be protected (see for example Smith, 2010; Heritage Lottery Fund, 2014). Throughout
the process of collating information, the list of interventions was modified in order to allow for interventions
with similar features to be treated together, making the toolbox more manageable and easier to use.
Information was collated from a variety of sources in the grey as well as academic literature. Grey literature
was mostly used to provide initial information and signposting to academic publications, but also as a source in
its own right, especially where it was published by accredited organisations such as Forest Research or the
Environment Agency. A semi-structured literature review using the snowball method was carried out to gain a
broad range of information on each intervention respectively. Especially information on costs and maintenance
was taken mainly from grey literature, as this is not a topic academic publications are usually concerned with.
Additionally, the Natural England Ecosystem Services Transfer Toolkit and the SuDS Manual (Kellagher et al.,
2015) was used to provide an overview as well as limited validation of findings where it was suitable.
Benefits Wheel Indicators
To allow comparability and consistency throughout the use of the output from the Local Action Project, and
to make the use of the toolbox as simple as possible, the same twelve indicators for benefits were used to
describe interventions as for the GIS based needs assessment.
The indicators are given a ranking from 1 to 5 based on the ability of an intervention to increase the provision
of certain ecosystem services/benefits from ecosystem services in the urban landscape. This describes its ability
to increase a benefit compared to other interventions, with 1 signifying “low/unlikely” and 5 signifying
“high/very likely”. Benefit indicators are semi-quantitative measures that allow comparison between different
interventions, but not the quantification of the increase of a benefit or the ability to add benefits together. It
does also not allow comparison of benefit indicators within a wheel. For example: this means that an
intervention ranked 1 on the benefit indicator “Cultural Activities” and 5 on “Aesthetics” is unlikely to
contribute to the provision of opportunities for cultural activities, compared to an intervention that is ranked
5. It does not mean that the intervention contributes 5 times as much to an aesthetically pleasing environment
than to providing opportunity for cultural activities.
The rankings are based on the collated literature. The value given to each indicator was based on set of
characteristics and their comparison within the different interventions. Literature was identified specific to
each intervention, however where it was likely that findings could be transferrable (e.g. due to similar
characteristics in one aspect), and information on a specific intervention was not easily available, evidence that
was not specific to the intervention was accepted. For each indicator, a number of sources were used where
possible to provide an overall estimate of the performance of the intervention. More weight was given to
academic literature reviews and grey literature from accredited sources presenting evidence, but case study
evidence and academic papers were used to complement these.
As a measure of confidence, a “traffic light” system was used to indicate the evidence base the ranking was
based on. Each of the indicators on each intervention was given an asterisk in red, amber or green, designating
a level of certainty: red meaning little availability of and/or high uncertainty within the literature; amber
meaning mainly positive evidence in the literature but little literature available or sometimes uncertainty in
literature; green meaning that a strong evidence base confirms the positive influence of the intervention.
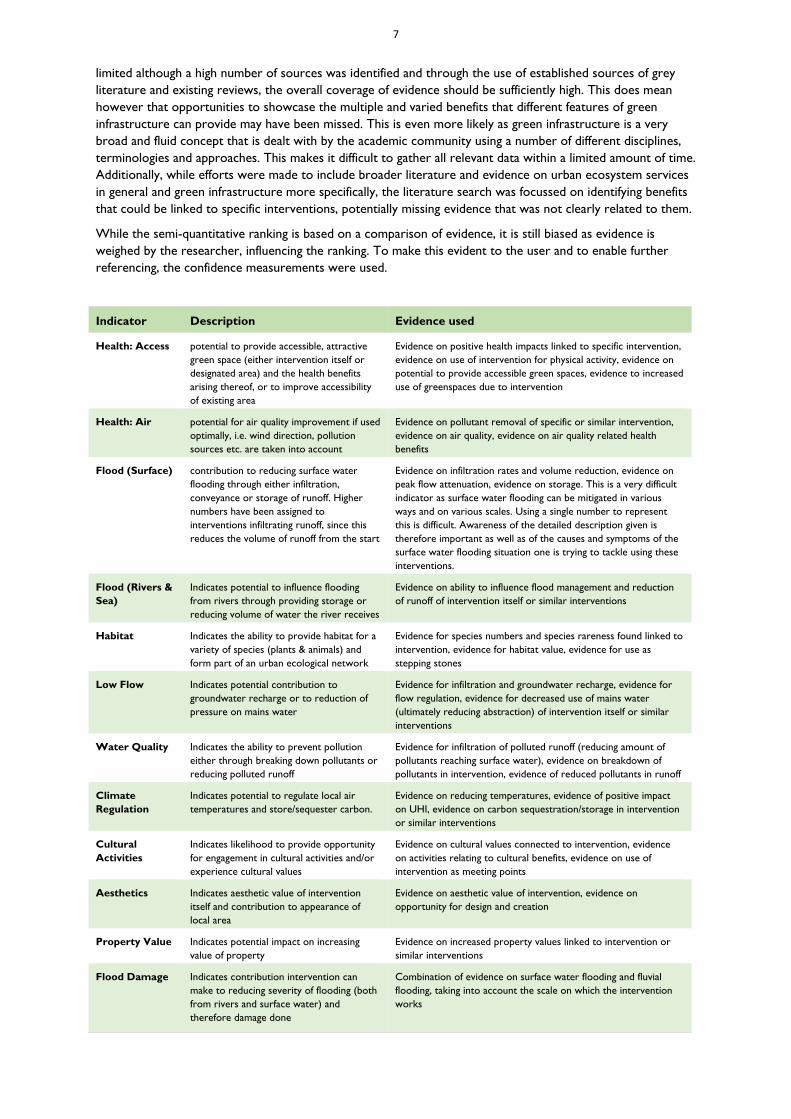
Table 1 gives an overview of each indicator and its characteristics.
Limitations
While the approach taken was similar to a structured literature review, it did not use the same methods of
classifying and weighing different sources in a structured way. Due to time constraints, the literature used was
7
limited although a high number of sources was identified and through the use of established sources of grey
literature and existing reviews, the overall coverage of evidence should be sufficiently high. This does mean
however that opportunities to showcase the multiple and varied benefits that different features of green
infrastructure can provide may have been missed. This is even more likely as green infrastructure is a very
broad and fluid concept that is dealt with by the academic community using a number of different disciplines,
terminologies and approaches. This makes it difficult to gather all relevant data within a limited amount of time.
Additionally, while efforts were made to include broader literature and evidence on urban ecosystem services
in general and green infrastructure more specifically, the literature search was focussed on identifying benefits
that could be linked to specific interventions, potentially missing evidence that was not clearly related to them.
While the semi-quantitative ranking is based on a comparison of evidence, it is still biased as evidence is
weighed by the researcher, influencing the ranking. To make this evident to the user and to enable further
referencing, the confidence measurements were used.
Indicator Description Evidence used
Health: Access potential to provide accessible, attractive
green space (either intervention itself or
designated area) and the health benefits
arising thereof, or to improve accessibility
of existing area
Evidence on positive health impacts linked to specific intervention,
evidence on use of intervention for physical activity, evidence on
potential to provide accessible green spaces, evidence to increased
use of greenspaces due to intervention
Health: Air potential for air quality improvement if used
optimally, i.e. wind direction, pollution
sources etc. are taken into account
Evidence on pollutant removal of specific or similar intervention,
evidence on air quality, evidence on air quality related health
benefits
Flood (Surface) contribution to reducing surface water
flooding through either infiltration,
conveyance or storage of runoff. Higher
numbers have been assigned to
interventions infiltrating runoff, since this
reduces the volume of runoff from the start
Evidence on infiltration rates and volume reduction, evidence on
peak flow attenuation, evidence on storage. This is a very difficult
indicator as surface water flooding can be mitigated in various
ways and on various scales. Using a single number to represent
this is difficult. Awareness of the detailed description given is
therefore important as well as of the causes and symptoms of the
surface water flooding situation one is trying to tackle using these
interventions.
Flood (Rivers &
Sea)
Indicates potential to influence flooding
from rivers through providing storage or
reducing volume of water the river receives
Evidence on ability to influence flood management and reduction
of runoff of intervention itself or similar interventions
Habitat Indicates the ability to provide habitat for a
variety of species (plants & animals) and
form part of an urban ecological network
Evidence for species numbers and species rareness found linked to
intervention, evidence for habitat value, evidence for use as
stepping stones
Low Flow Indicates potential contribution to
groundwater recharge or to reduction of
pressure on mains water
Evidence for infiltration and groundwater recharge, evidence for
flow regulation, evidence for decreased use of mains water
(ultimately reducing abstraction) of intervention itself or similar
interventions
Water Quality Indicates the ability to prevent pollution
either through breaking down pollutants or
reducing polluted runoff
Evidence for infiltration of polluted runoff (reducing amount of
pollutants reaching surface water), evidence on breakdown of
pollutants in intervention, evidence of reduced pollutants in runoff
Climate
Regulation
Indicates potential to regulate local air
temperatures and store/sequester carbon.
Evidence on reducing temperatures, evidence of positive impact
on UHI, evidence on carbon sequestration/storage in intervention
or similar interventions
Cultural
Activities
Indicates likelihood to provide opportunity
for engagement in cultural activities and/or
experience cultural values
Evidence on cultural values connected to intervention, evidence
on activities relating to cultural benefits, evidence on use of
intervention as meeting points
Aesthetics Indicates aesthetic value of intervention
itself and contribution to appearance of
local area
Evidence on aesthetic value of intervention, evidence on
opportunity for design and creation
Property Value Indicates potential impact on increasing
value of property
Evidence on increased property values linked to intervention or
similar interventions
Flood Damage Indicates contribution intervention can
make to reducing severity of flooding (both
from rivers and surface water) and
therefore damage done
Combination of evidence on surface water flooding and fluvial
flooding, taking into account the scale on which the intervention
works
8
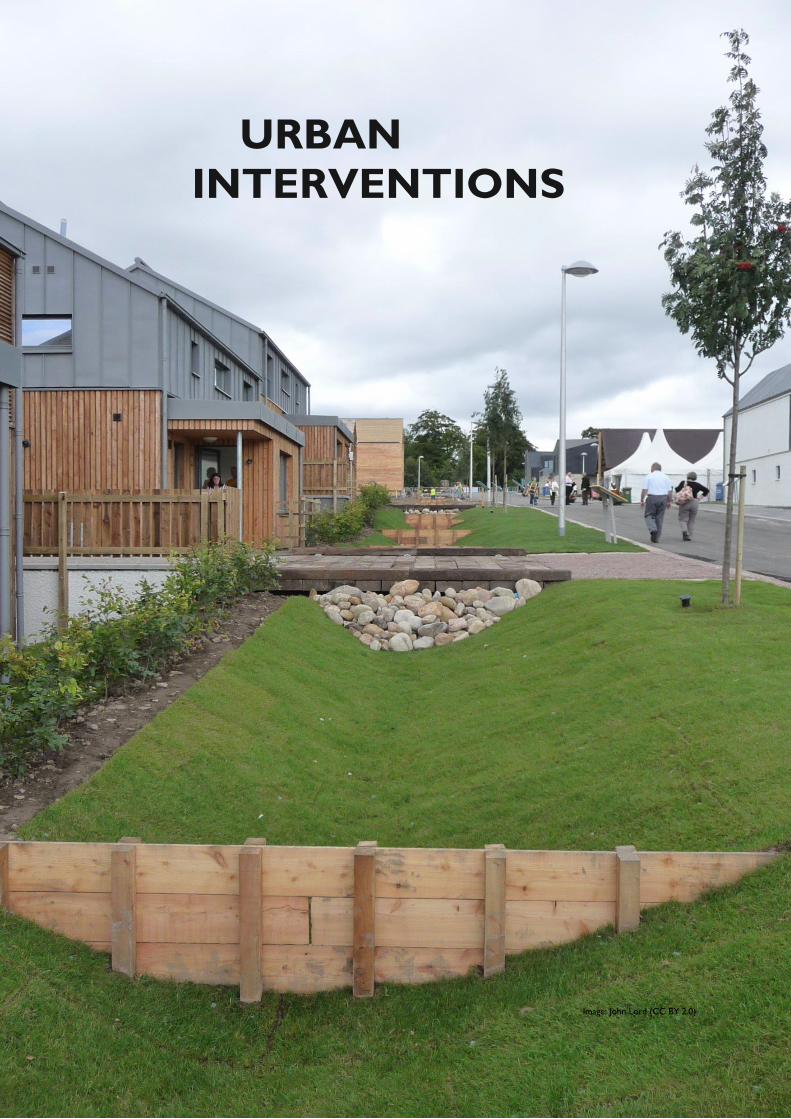
URBAN
INTERVENTIONS
Image: John Lord (CC BY 2.0)
9
SWALES
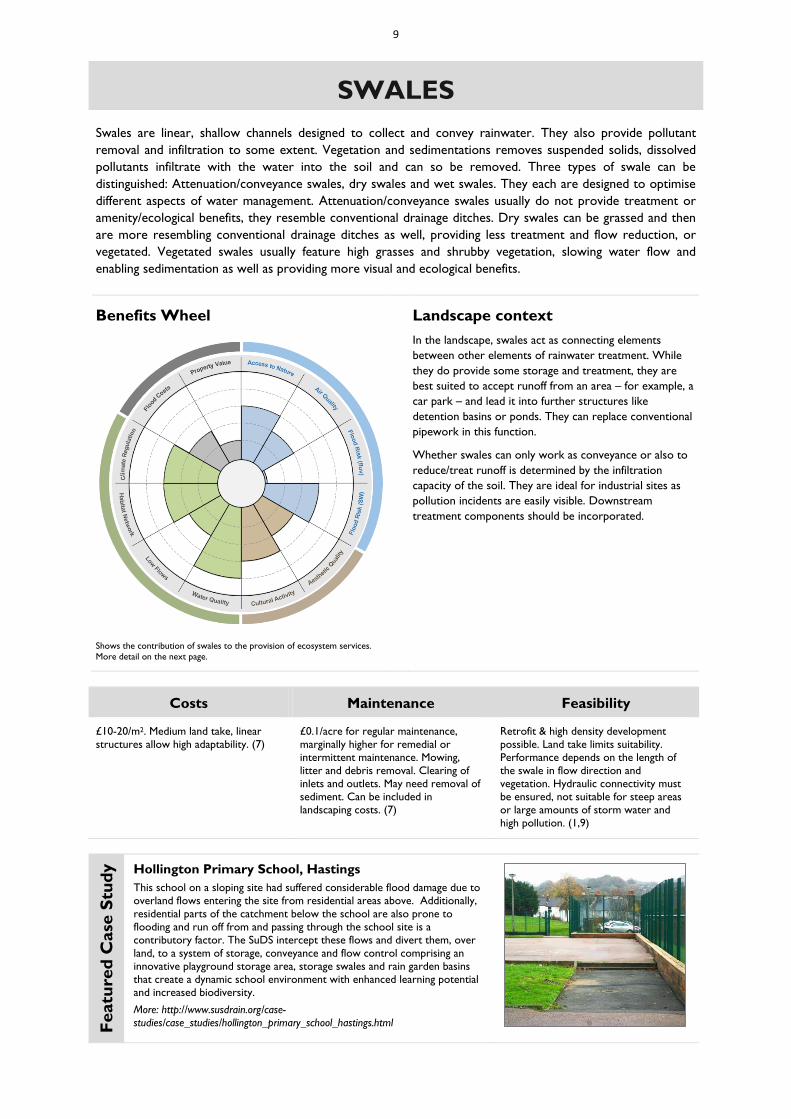
Swales are linear, shallow channels designed to collect and convey rainwater. They also provide pollutant
removal and infiltration to some extent. Vegetation and sedimentations removes suspended solids, dissolved
pollutants infiltrate with the water into the soil and can so be removed. Three types of swale can be
distinguished: Attenuation/conveyance swales, dry swales and wet swales. They each are designed to optimise
different aspects of water management. Attenuation/conveyance swales usually do not provide treatment or
amenity/ecological benefits, they resemble conventional drainage ditches. Dry swales can be grassed and then
are more resembling conventional drainage ditches as well, providing less treatment and flow reduction, or
vegetated. Vegetated swales usually feature high grasses and shrubby vegetation, slowing water flow and
enabling sedimentation as well as providing more visual and ecological benefits.
Benefits Wheel
Landscape context
Shows the contribution of swales to the provision of ecosystem services.
More detail on the next page.
In the landscape, swales act as connecting elements
between other elements of rainwater treatment. While
they do provide some storage and treatment, they are
best suited to accept runoff from an area – for example, a
car park – and lead it into further structures like
detention basins or ponds. They can replace conventional
pipework in this function.
Whether swales can only work as conveyance or also to
reduce/treat runoff is determined by the infiltration
capacity of the soil. They are ideal for industrial sites as
pollution incidents are easily visible. Downstream
treatment components should be incorporated.
Costs Maintenance Feasibility
£10-20/m2. Medium land take, linear
structures allow high adaptability. (7)
£0.1/acre for regular maintenance,
marginally higher for remedial or
intermittent maintenance. Mowing,
litter and debris removal. Clearing of
inlets and outlets. May need removal of
sediment. Can be included in
landscaping costs. (7)
Retrofit & high density development
possible. Land take limits suitability.
Performance depends on the length of
the swale in flow direction and
vegetation. Hydraulic connectivity must
be ensured, not suitable for steep areas
or large amounts of storm water and
high pollution. (1,9)
Featu
red
Case
Stu
dy
Hollington Primary School, Hastings
This school on a sloping site had suffered considerable flood damage due to
overland flows entering the site from residential areas above. Additionally,
residential parts of the catchment below the school are also prone to
flooding and run off from and passing through the school site is a
contributory factor. The SuDS intercept these flows and divert them, over
land, to a system of storage, conveyance and flow control comprising an
innovative playground storage area, storage swales and rain garden basins
that create a dynamic school environment with enhanced learning potential
and increased biodiversity.
More: http://www.susdrain.org/case-
studies/case_studies/hollington_primary_school_hastings.html
10
Social Benefits Environmental Benefits
Health: Access. * Depends on the design of the swale and
its surroundings, but swales can provide accessible small
greenspaces. This is often in the context of a larger green
area and the impact of the swale itself can therefore not be
seen separately. (1)
Air Quality. * Vegetation of any kind takes up pollutants
from the air. Closely mown grass is unlikely to contribute
significantly. (14)
Surface Water. * Swales can infiltrate 40% of all rainfall
events and reduce runoff for an additional 40%, with an
overall volume reduction of 50-60% - often low peak
discharge or volume control provided by swales. This
depends on their design. (1,2,6,9,11,12,13)
Fluvial Flood. * Swales have no impact on fluvial flooding.
Water Quality. * Swales perform well removing TSS (usually
above 65%) and metals but less for nutrients (30-40% or less,
with P showing better removal than N). Fine particles are
often not captured. Accumulation of pollutants can be a
problem. Vegetated swales are sometimes said to perform
better.(2,4,5,9,10,13)
Habitat Provision. * Can function as green corridors and
provide habitat to different species. Especially use of native
plants and varied vegetation is valuable. (1,8)
Climate Regulation. * Evaporation can have positive effects
on UHI effect. Little carbon storage possible.(15)
Low Flows. * Groundwater recharge is usually provided, but
care has to be taken to prevent pollution. Water from swale
can be discharged into streams and so directly improve low
flows – depends on water quality. (1,13)
Cultural Benefits Economic Benefits
Aesthetics. * Depends on design. Higher growing native
vegetation can provide interesting meadow-like appearances.
Meandering swales have a more natural look. The design can
easily be adapted to suit surroundings. (1, 9)
Cultural Activities. * Can be used as an educational
resource, design of the swale should take this into account.
Case studies have demonstrated the use of swales as
“outdoor classrooms” etc. (1, 9)
Property Value. * Swales are unlikely to contribute much to
property value.
Flood Damage. * Through their impact on reducing and
removing surface water runoff, swales can reduce severity of
surface water floods.
Additional Benefits and Potential Costs
No additional benefits Water quality. In peak events, nutrients and metals can be
released from the swale and reach watercourses. Correct
design and maintenance should work to prevent this.
Aesthetics. If maintenance and plant selection is not careful,
the swale’s appearance could deteriorate. For swales near
roadsides, salt resistant plants should be chosen to be able to
survive de-icing in winter.
*** Indication of confidence. * Literature confirms positive influence. * Mostly positive results in literature and/or little literature
available. * Varying results in literature, little literature available
11
References:
(1) http://www.susdrain.org/delivering-suds/using-
suds/suds-components/swales-and-conveyance-
channels/swales.html
(2) Ahiablame, L. M., Engel, B. A. and Chaubey, I. (no
date) Effectiveness of Low Impact Development
Practices: Literature Review and Suggestions for
Future Research.
(3) Ashley, R. M., Nowell, R., Gersonius, B. and
Walker, L. (2011) ‘Surface Water Management and
Urban Green Infrastructure’, 44(0), pp. 1–76.
(4) Berwick, N. and Wade, D. R. (2013) A Critical
Review of Urban Diffuse Pollution Control :
Methodologies to Identify Sources , Pathways and
Mitigation Measures with Multiple Benefits.
(5) Deletic, A. (2005) ‘Sediment transport in urban
runoff over grassed areas’, Journal of Hydrology,
301(1-4), pp. 108–122.
(6) Ellis, J. B., Shutes, R. B. E. and Revitt, M. D. (2003)
Constructed Wetlands and Links with Sustainable
Drainage Systems.
(7) Environment Agency (2015) Cost estimation for
SUDS - summary of evidence. Bristol.
(8) Kazemi, F., Beecham, S. and Gibbs, J. (2011)
‘Streetscape biodiversity and the role of
bioretention swales in an Australian urban
environment’, Landscape and Urban Planning,
101(2), pp. 139–148.
(9) Kellagher, R., Martin, P., Jefferies, C., Bray, R.,
Shaffer, P., Wallingford, H. R., Woods-Ballard, B.,
Woods Ballard, B., Construction Industry Research
and Information Association, Great Britain,
Department of Trade and Industry and
Environment Agency (2015) The SUDS manual,
CIRIA. London.
(10) Lucke, T., Mohamed, M. and Tindale, N. (2014)
‘Pollutant Removal and Hydraulic Reduction
Performance of Field Grassed Swales during Runoff
Simulation Experiments’, Water. Multidisciplinary
Digital Publishing Institute, 6(7), pp. 1887–1904.
(11) Pratt, C. J. (2004) Sustainable Drainage. A Review
of Published Material on the Performance of
Various SUDS Components. Bristol.
(12) Qin, H., Li, Z. and Fu, G. (2013) ‘The effects of low
impact development on urban flooding under
different rainfall characteristics.’, Journal of
environmental management, 129, pp. 577–85.
(13) Stagge, J. H., Davis, A. P., Jamil, E. and Kim, H.
(2012) ‘Performance of grass swales for improving
water quality from highway runoff.’, Water
research, 46(20), pp. 6731–42.
(14) Forest Research (no date) Improving Air Quality.
(15) Lehmann, S. (2014) ‘Low carbon districts: Mitigating
the urban heat island with green roof
infrastructure’, City, Culture and Society, 5(1), pp. 1–
8.
12
AMENITY LAWNS
Amenity grassland is usually intensively managed, closely mown grassland found in parks, sports grounds, village
greens or around buildings. It provides a permeable surface and so enables source control and infiltration.
Vegetation can filter and trap sediments.
Benefits Wheel
Landscape context
Shows the contribution of amenity lawns to the provision of ecosystem
services. More detail on the next page.
Grassed areas intercept runoff and allow infiltration while
also slowing flows down. Impermeability of urban areas is
one of the main factors in exacerbating surface water
flooding. The cumulative effect of vegetated areas in
infiltrating runoff can mitigate this, although it has to be
taken into account that waterlogged soils will effectively
be impermeable. Amenity areas are present along
roadsides, under trees, in public open spaces and as
recreation grounds.
Designing amenity areas with surface water in mind can
help maximise the benefits. Slightly depressed areas can
provide attenuation and collect runoff from additional
areas (in effect working similar to detention basins or
swales) and keeping open, vegetated areas alongside
rivers provides a space to safely attenuate floods.
Costs Maintenance Feasibility
£0.07/m2 – £0.6/m2.
Factors: Instalment of a new lawn may
include stripping down old one. Options
for establishing new grass area are
natural colonisation (minimal cost),
grass seed mixtures and turf. (16)
1,600-2,200£/ha/a (0.02-0.22£/m2/a).
Depends on how it is maintained
(hand/gang mown, frequency). Mowing,
intensity depends on aesthetic
requirements. However, maintenance
costs likely to increase proportionally
with smaller size. (17)
Suitable in all areas, any size, as long as
soil infiltration rates are sufficiently high.
If high footfall is expected or vehicular
access necessary, soil can be structurally
strengthened (increasing cost). Infiltration
rates depend on soil type and intensity of
use. High groundwater levels can slow
infiltration down.
Featu
red
Case
Stu
dy
More Meadows, Birmingham & Black Country
This report investigates the opportunities for amenity grassland in parks and
open spaces to be managed for biodiversity and wildlife. Social benefits arise
from the use of local volunteers and engaging park staff, enhancing social
cohesion and sense of place.
The project showcases the importance of engagement of the local
community and staff and generating understanding of the project objectives
prior to implementation.
More: www.bbcwildlife.org.uk/sites/default/files/grasslands.pdf
Image: BBC

13
Social Benefits Environmental Benefits
Health: Access. * Potential for dual use as sports ground or
similar. Amenity lawns should be highly accessible, but design
and maintenance are important factors. (1,10)
Air Quality. * Vegetation and soil can trap air pollutants and
dust. (5)
Surface Water. * Can be very high when runoff is
eliminated, a reduction of up to 99% of runoff compared to
asphalt is possible, reducing peak flows and flow volume. This
may be compromised by high footfall on the area and
subsequent compaction as well as soil type. Once soil
becomes waterlogged, area acts as impermeable surface.
(1,2,3,4,5,9,12,14)
Fluvial Flood. * Strategically placed open green spaces can
act as storage for fluvial flooding. (2)
Water Quality. * Sediment and pollutants can be trapped
and to an extent degraded in the soil. However, fertilisation
and pesticide application can impact water quality negatively.
(2,4,7,12,14)
Habitat Provision. * Invertebrates can find habitat in highly
managed grassed areas, for other animals (e.g. birds) it is likely
the area would have to be less managed (e.g. transformed into
rough grassland). Adding structural diversity can provide
significant benefits. (4,6, 13, 15)
Climate Regulation. * Surface temperatures of grassed
areas are much lower (up to 25dC) than asphalt. Additionally,
carbon can be sequestered (in plants and soil), but
management activities are likely to offset the net carbon
benefits. (4,5,8,19)
Low Flows. * Potential for groundwater recharge. (4,5)
Cultural Benefits Economic Benefits
Aesthetics. * Greenspace can improve the visual quality of
urban areas. It is very versatile, but a less interesting feature
than other interventions. (1,2,4)
Cultural Activities. * Potentially important part of cultural
spaces, e.g. village greens. Allows cultural activities like
picnicking, playing golf, etc. Depends on size and accessibility,
although even the view of lawns plays a part in cultural
identity and place making. (4,5,10)
Property Value. * Lawn areas on properties have been
shown to add value to properties, but only when well
maintained. Lawn in public spaces can also increase rental
prices in a neighbourhood. (11)
Flood Damage. * Taking up water from their own area and
surrounding areas can help reduce the risk of flooding and the
extent of flooding on a larger scale.
Additional Benefits and Potential Costs
Noise reduction. soft lawns can decrease noise by 3db,
providing mental and physical health benefits and so
improved wellbeing.
Multifunctional. highly multifunctional area that can easily
be enhanced by other SuDS/GI and does not have any safety
concerns that may come with water bodies.
Health. closely mown grasses have the benefit of less risk of
triggering allergies. The proximity of greenspace is beneficial
on mental and physical health, improving social wellbeing and
saving health related costs. Grass areas are main predictors
for the potential of a greenspace to have restorative effects
(with size of a greenspace being the most important factor),
providing stress relief and an “escape”.
Water quality. Poor maintenance may lead to erosion,
litter. This can lead to a decrease in the visual quality and also
impact the watercourses the area might drain to, by clogging
the soil and increasing pollutant load.
Climate regulation. Dry vegetation can be perceived as
ugly or dangerous. Irrigation to counteract this can decrease
the ability to infiltrate water, but increases the cooling
potential of the area. However, it means a greater demand
on water use and energy. This could to an extent be
mitigated by rainwater harvesting on site.
Social disbenefits. poor maintenance and design can
encourage anti-social behaviour and so have a negative
impact on the surrounding areas.
*** Indication of confidence. * Literature confirms positive influence. * Mostly positive results in literature and/or little literature
available. * Varying results in literature, little literature available
14
References:
(1) CIRIA. (2014). Demonstrating the multiple benefits
of SuDS - a business case.
(2) Woods Ballard, B., Wilson, S., Udale-Clarke, H.,
Illman, S., Ahsley, R., Kellagher, R. (2015): The
Suds Manual. London: CIRIA.
(3) Armson, D., Stringer, P. and Ennos, A. R. (2013)
‘The effect of street trees and amenity grass on
urban surface water runoff in Manchester, UK’,
Urban Forestry & Urban Greening, 12(3), pp. 282–
286.
(4) Beard, James B, and Robert L. Green. (1994) “The
Role of Turfgrasses in Environmental Protection
and Their Benefits to Humans.” Journal of
Environment Quality 23 (3). American Society of
Agronomy, Crop Science Society of America, and
Soil Science Society of America: 452.
(5) Bolund, Per, and Sven Hunhammar. (1999)
“Ecosystem Services in Urban Areas.” Ecological
Economics 29 (2): 293–301.
(6) Chamberlain, D.E., S. Gough, H. Vaughan, J.A.
Vickery, and G.F. Appleton. (2007) “Determinants
of Bird Species Richness in Public Green Spaces:
Capsule Bird Species Richness Showed Consistent
Positive Correlations with Site Area and Rough
Grass.” Bird Study 54 (1). Taylor & Francis Group:
87–97.
(7) Davis, A. P., Shokouhian, M., Sharma, H. and
Minami, C. (2001) ‘Laboratory study of biological
retention for urban stormwater management.’,
Water environment research : a research publication of
the Water Environment Federation, 73(1), pp. 5–14.
(8) Gill, S.E., M.A. Rahman, J.F. Handley, and A.R.
Ennos. (2013) “Modelling Water Stress to Urban
Amenity Grass in Manchester UK under Climate
Change and Its Potential Impacts in Reducing
Urban Cooling.” Urban Forestry & Urban
Greening 12 (3): 350–58.
(9) Lamond, Jessica E., Carly B. Rose, and Colin A.
Booth. (2015) “Evidence for Improved Urban
Flood Resilience by Sustainable Drainage Retrofit.”
Proceedings of the Institution of Civil Engineers -
Urban Design and Planning, September. Thomas
Telford Ltd.
(10) Nordh, H., Hartig, T., Hagerhall, C. M. and Fry, G.
(2009) ‘Components of small urban parks that
predict the possibility for restoration’, Urban
Forestry & Urban Greening, 8(4), pp. 225–235.
(11) Saphores, Jean-Daniel, and Wei Li. (2012)
“Estimating the Value of Urban Green Areas: A
Hedonic Pricing Analysis of the Single Family
Housing Market in Los Angeles, CA.” Landscape
and Urban Planning 104 (3-4): 373–87.
(12) Yang, Jin-Ling, and Gan-Lin Zhang. (2011) “Water
Infiltration in Urban Soils and Its Effects on the
Quantity and Quality of Runoff.” Journal of Soils
and Sediments 11 (5): 751–61.
(13) http://www.newport.gov.uk/en/Leisure-
Tourism/Countryside--Parks/Wildlife-
walks/Amenity-grassland.aspx
(14) Susdrain (2016):
http://www.susdrain.org/delivering-suds/using-
suds/suds-components/source-control/other-
permeable-surfaces/index.html
(15) Forestry Commission (2016):
http://www.forestry.gov.uk/fr/urgc-7edjsm
(16) Costs:
http://www.thegrassseedstore.co.uk/environmental
/grass-only-meadow/native-meadowgrass.html,
http://www.rolawn.co.uk/turf/rolawn-medallion-
turf?gclid=CNvH5f7OrssCFQcUGwod3v4L-
A#tabDescription, http://www.turfonline.co.uk/
(17) The Woodland Trust (2011) Trees or Turf ?
(18) Armson, D., Stringer, P. and Ennos, A. R. (2012)
‘The effect of tree shade and grass on surface and
globe temperatures in an urban area’, Urban
Forestry & Urban Greening, 11(3), pp. 245–255.
15
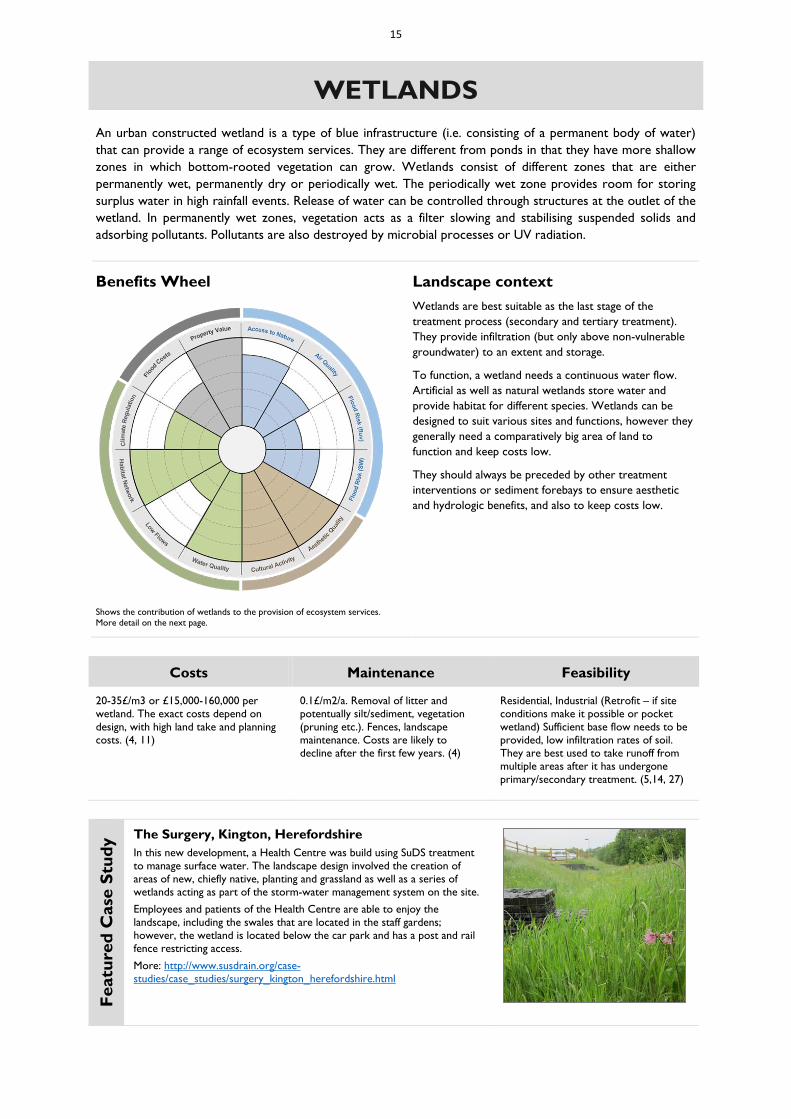
WETLANDS
An urban constructed wetland is a type of blue infrastructure (i.e. consisting of a permanent body of water)
that can provide a range of ecosystem services. They are different from ponds in that they have more shallow
zones in which bottom-rooted vegetation can grow. Wetlands consist of different zones that are either
permanently wet, permanently dry or periodically wet. The periodically wet zone provides room for storing
surplus water in high rainfall events. Release of water can be controlled through structures at the outlet of the
wetland. In permanently wet zones, vegetation acts as a filter slowing and stabilising suspended solids and
adsorbing pollutants. Pollutants are also destroyed by microbial processes or UV radiation.
Benefits Wheel
Landscape context
Shows the contribution of wetlands to the provision of ecosystem services.
More detail on the next page.
Wetlands are best suitable as the last stage of the
treatment process (secondary and tertiary treatment).
They provide infiltration (but only above non-vulnerable
groundwater) to an extent and storage.
To function, a wetland needs a continuous water flow.
Artificial as well as natural wetlands store water and
provide habitat for different species. Wetlands can be
designed to suit various sites and functions, however they
generally need a comparatively big area of land to
function and keep costs low.
They should always be preceded by other treatment
interventions or sediment forebays to ensure aesthetic
and hydrologic benefits, and also to keep costs low.
Costs Maintenance Feasibility
20-35£/m3 or £15,000-160,000 per
wetland. The exact costs depend on
design, with high land take and planning
costs. (4, 11)
0.1£/m2/a. Removal of litter and
potentually silt/sediment, vegetation
(pruning etc.). Fences, landscape
maintenance. Costs are likely to
decline after the first few years. (4)
Residential, Industrial (Retrofit – if site
conditions make it possible or pocket
wetland) Sufficient base flow needs to be
provided, low infiltration rates of soil.
They are best used to take runoff from
multiple areas after it has undergone
primary/secondary treatment. (5,14, 27)
Featu
red
Case
Stu
dy
The Surgery, Kington, Herefordshire
In this new development, a Health Centre was build using SuDS treatment
to manage surface water. The landscape design involved the creation of
areas of new, chiefly native, planting and grassland as well as a series of
wetlands acting as part of the storm-water management system on the site.
Employees and patients of the Health Centre are able to enjoy the
landscape, including the swales that are located in the staff gardens;
however, the wetland is located below the car park and has a post and rail
fence restricting access.
More: http://www.susdrain.org/case-
studies/case_studies/surgery_kington_herefordshire.html
16
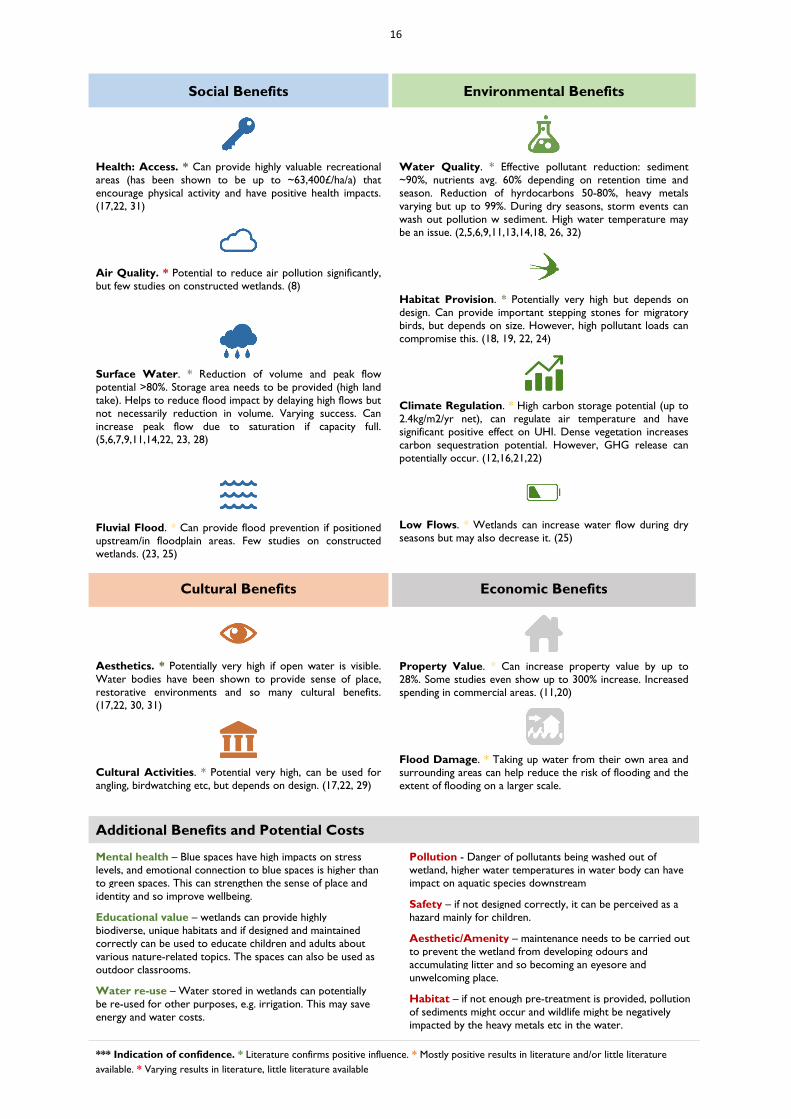
Social Benefits Environmental Benefits
Health: Access. * Can provide highly valuable recreational
areas (has been shown to be up to ~63,400£/ha/a) that
encourage physical activity and have positive health impacts.
(17,22, 31)
Air Quality. * Potential to reduce air pollution significantly,
but few studies on constructed wetlands. (8)
Surface Water. * Reduction of volume and peak flow
potential >80%. Storage area needs to be provided (high land
take). Helps to reduce flood impact by delaying high flows but
not necessarily reduction in volume. Varying success. Can
increase peak flow due to saturation if capacity full.
(5,6,7,9,11,14,22, 23, 28)
Fluvial Flood. * Can provide flood prevention if positioned
upstream/in floodplain areas. Few studies on constructed
wetlands. (23, 25)
Water Quality. * Effective pollutant reduction: sediment
~90%, nutrients avg. 60% depending on retention time and
season. Reduction of hyrdocarbons 50-80%, heavy metals
varying but up to 99%. During dry seasons, storm events can
wash out pollution w sediment. High water temperature may
be an issue. (2,5,6,9,11,13,14,18, 26, 32)
Habitat Provision. * Potentially very high but depends on
design. Can provide important stepping stones for migratory
birds, but depends on size. However, high pollutant loads can
compromise this. (18, 19, 22, 24)
Climate Regulation. * High carbon storage potential (up to
2.4kg/m2/yr net), can regulate air temperature and have
significant positive effect on UHI. Dense vegetation increases
carbon sequestration potential. However, GHG release can
potentially occur. (12,16,21,22)
Low Flows. * Wetlands can increase water flow during dry
seasons but may also decrease it. (25)
Cultural Benefits Economic Benefits
Aesthetics. * Potentially very high if open water is visible.
Water bodies have been shown to provide sense of place,
restorative environments and so many cultural benefits.
(17,22, 30, 31)
Cultural Activities. * Potential very high, can be used for
angling, birdwatching etc, but depends on design. (17,22, 29)
Property Value. * Can increase property value by up to
28%. Some studies even show up to 300% increase. Increased
spending in commercial areas. (11,20)
Flood Damage. * Taking up water from their own area and
surrounding areas can help reduce the risk of flooding and the
extent of flooding on a larger scale.
Additional Benefits and Potential Costs
Mental health – Blue spaces have high impacts on stress
levels, and emotional connection to blue spaces is higher than
to green spaces. This can strengthen the sense of place and
identity and so improve wellbeing.
Educational value – wetlands can provide highly
biodiverse, unique habitats and if designed and maintained
correctly can be used to educate children and adults about
various nature-related topics. The spaces can also be used as
outdoor classrooms.
Water re-use – Water stored in wetlands can potentially
be re-used for other purposes, e.g. irrigation. This may save
energy and water costs.
Pollution - Danger of pollutants being washed out of
wetland, higher water temperatures in water body can have
impact on aquatic species downstream
Safety – if not designed correctly, it can be perceived as a
hazard mainly for children.
Aesthetic/Amenity – maintenance needs to be carried out
to prevent the wetland from developing odours and
accumulating litter and so becoming an eyesore and
unwelcoming place.
Habitat – if not enough pre-treatment is provided, pollution
of sediments might occur and wildlife might be negatively
impacted by the heavy metals etc in the water.
*** Indication of confidence. * Literature confirms positive influence. * Mostly positive results in literature and/or little literature
available. * Varying results in literature, little literature available
17
References:
(1) Ashley, R. M., Nowell, R., Gersonius, B. and
Walker, L. (2011) ‘Surface Water Management and
Urban Green Infrastructure’, 44(0), pp. 1–76.
(2) Brown, R. G. (1984) “Effects of an Urban Wetland
on Sediment and Nutrient Loads in Runoff.”
Wetlands 4 (1): 147–58.
(3) de Klein, Jeroen J.M., and Adrie K. van der Werf.
(2014) “Balancing Carbon Sequestration and GHG
Emissions in a Constructed Wetland.” Ecological
Engineering 66 (May): 36–42.
(4) Environment Agency (2015) Cost estimation for
SUDS - summary of evidence. Bristol.
(5) Kellagher, R., Martin, P., Jefferies, C., Bray, R.,
Shaffer, P., Wallingford, H. R., Woods-Ballard, B.,
Woods Ballard, B. (2015) The SUDS manual,
CIRIA. London.
(6) Pratt, C. J. (2004) Sustainable Drainage. A Review
of Published Material on the Performance of
Various SUDS Components. Bristol.
(7) Lawrence, A. I., Marsalek, J., Ellis, J. B. and
Urbonas, B. (1996) ‘Stormwater detention &
BMPs’, Journal of Hydraulic Research. Taylor &
Francis Group, 34(6), pp. 799–813
(8) Forest Research (no date) Improving Air Quality.
(9) J B Ellis, R B E Shutes and M D Revitt (2003)
Constructed Wetlands and Links with Sustainable
Drainage Systems.
(10) Malaviya, Piyush, and Asha Singh. (2016)
“Constructed Wetlands for Management of Urban
Stormwater Runoff Constructed Wetlands for
Management of Urban Stormwater Runoff”
(11) CIRIA (2014) ‘Demonstrating the multiple benefits
of SuDS - a business case’
(12) Charlesworth, S. M. (2010) ‘A review of the
adaptation and mitigation of global climate change
using sustainable drainage in cities’, Journal of
Water and Climate Change. IWA Publishing, 1(3),
p. 165.
(13) Charlesworth, S. M., Harker, E. and Rickard, S.
(2003) ‘A Review of Sustainable Drainage Systems
(SuDS): A Soft Option for Hard Drainage
Questions?’, Geography, 88(2), pp. 99–107.
(14) Ellis, J. B., R. B. E. Shutes, and D. M. Revitt. (2003)
“Guidance Manual for Constructed Wetlands.”
(15) Fleming-Singer, Maia S., and Alexander J. Horne.
(2006) “Balancing Wildlife Needs and Nitrate
Removal in Constructed Wetlands: The Case of
the Irvine Ranch Water District’s San Joaquin
Wildlife Sanctuary.” Ecological Engineering 26 (2):
147–66.
(16) Forestry Commission (2013) Air temperature
regulation by urban trees and green infrastructure.
Farnham.
(17) Ghermandi, Andrea, and Edna Fichtman. (2015)
“Cultural Ecosystem Services of Multifunctional
Constructed Treatment Wetlands and Waste
Stabilization Ponds: Time to Enter the
Mainstream?” Ecological Engineering 84
(November): 615–23.
(18) Helfield, James Mark, and Miriam L. Diamond.
(1997) “Use of Constructed Wetlands for Urban
Stream Restoration: A Critical Analysis.”
Environmental Management 21 (3): 329–41.
(19) Hsu, Chorng-Bin, Hwey-Lian Hsieh, Lei Yang,
Sheng-Hai Wu, Jui-Sheng Chang, Shu-Chuan Hsiao,
Hui-Chen Su, Chao-Hsien Yeh, Yi-Shen Ho, and
Hsing-Juh Lin. (2011) “Biodiversity of Constructed
Wetlands for Wastewater Treatment.” Ecological
Engineering 37 (10): 1533–45.
(20) International Association of Certified Home
Inspectors, Inc. (InterNACHI) (2016): Constructed
Wetlands: The Economic Benefits of Runoff
Controls.
(21) Kayranli, Birol, Miklas Scholz, Atif Mustafa, and Åsa
Hedmark. (2009) “Carbon Storage and Fluxes
within Freshwater Wetlands: A Critical Review.”
Wetlands 30 (1): 111–24.
(22) Moore, T. L. C. and Hunt, W. F. (2012)
‘Ecosystem service provision by stormwater
wetlands and ponds - a means for evaluation?’,
Water research, 46(20), pp. 6811–23.
(23) Persson, J., Somes, N. L. G. and Wong, T. H. F.
(1999) ‘Hydraulics Efficiency of Constructed
Wetlands and Ponds’, Water Science and
Technology. IWA Publishing, 40(3), pp. 291–300.
(24) Semeraro, Teodoro, Cosimo Giannuzzi, Leonardo
Beccarisi, Roberta Aretano, Antonella De Marco,
M. Rita Pasimeni, Giovanni Zurlini, and Irene
Petrosillo. (2015) “A Constructed Treatment
Wetland as an Opportunity to Enhance
Biodiversity and Ecosystem Services.” Ecological
Engineering 82 (September): 517–26.
(25) Shutes, B, M Revitt, and L Scholes. (2009)
“Constructed Wetlands for Flood Prevention and
Water Reuse.”
(26) Shutes, R.B.E. (2001) “Artificial Wetlands and
Water Quality Improvement.” Environment
International 26 (5-6): 441–47.
(27) U.S. Environmental Protection Agency (2009)
Stormwater Wet Pond and Wetland Management
Guidebook.
(28) Villarreal, E. L., Semadeni-Davies, A. and
Bengtsson, L. (2004) ‘Inner city stormwater

18
control using a combination of best management
practices’, Ecological Engineering, 22(4-5), pp. 279–
298.
(29) Völker, S. and Kistemann, T. (2013) ‘“I’m always
entirely happy when I'm here!” Urban blue
enhancing human health and well-being in Cologne
and Düsseldorf, Germany.’, Social science &
medicine (1982), 78, pp. 113–24.
(30) Völker, S. and Kistemann, T. (2015) ‘Developing
the urban blue: Comparative health responses to
blue and green urban open spaces in Germany’,
Health & Place, 35, pp. 196–205.
(31) White, M., Smith, A., Humphryes, K., Pahl, S.,
Snelling, D. and Depledge, M. (2010) ‘Blue space:
The importance of water for preference, affect,
and restorativeness ratings of natural and built
scenes’, Journal of Environmental Psychology,
30(4), pp. 482–493.
(32) Wong, T., Breen, P. and Somes, N. (1999) ‘Ponds
vs Wetlands - Performance Considerations in
Stormwater Quality Management’, in
Comprehensive Stormwater and Aquatic
Ecosystems Management. Auckland, pp. 223–231.
19
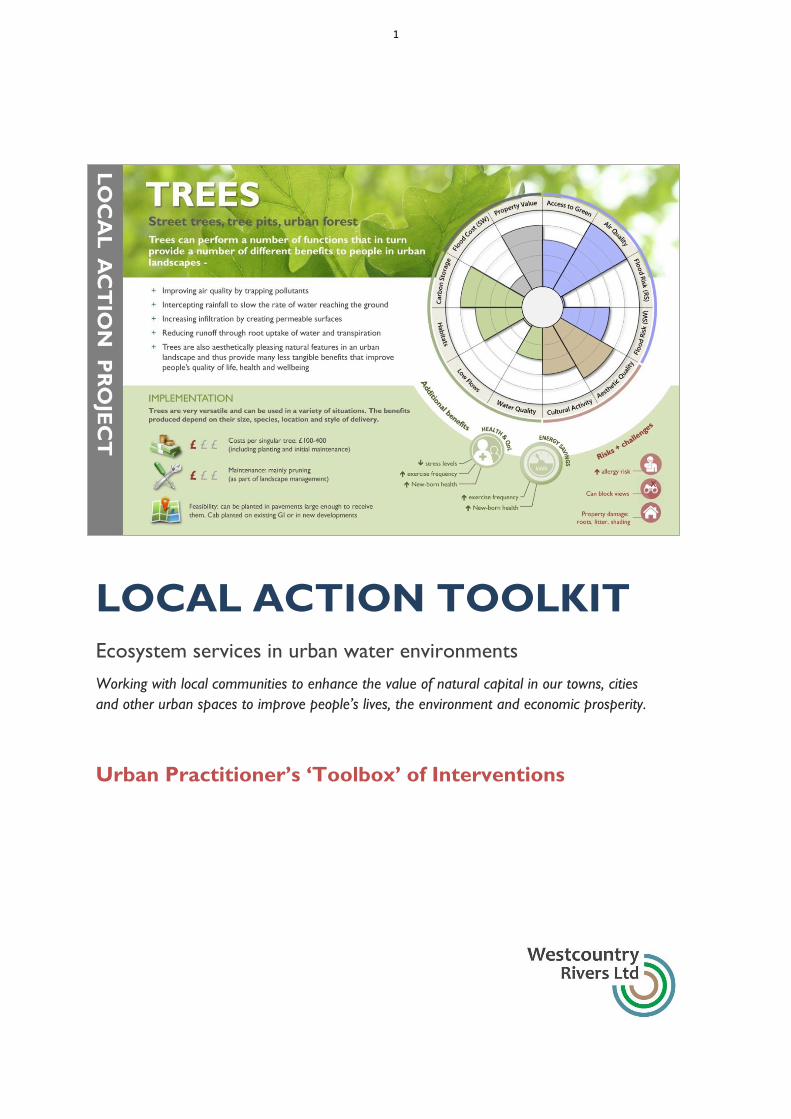
TREES
Trees can provide a number of different services that depend on their size, species, and location. Their leaves
can trap air pollutants either through taking them up or through deposition, thus removing them from the
surrounding air. They also intercept rainfall and so slow the rate with which water reaches the ground,
increasing infiltration where permeable surfaces are available and additionally reducing runoff through
evaporation and root uptake. Through their wide variation in shape, size and demands they are very versatile
and can be used in multiple settings. Trees are generally perceived as aesthetically pleasing additions to the
landscape and thus provide many less tangible benefits that increase quality of life considerably.
Benefits Wheel
Landscape context
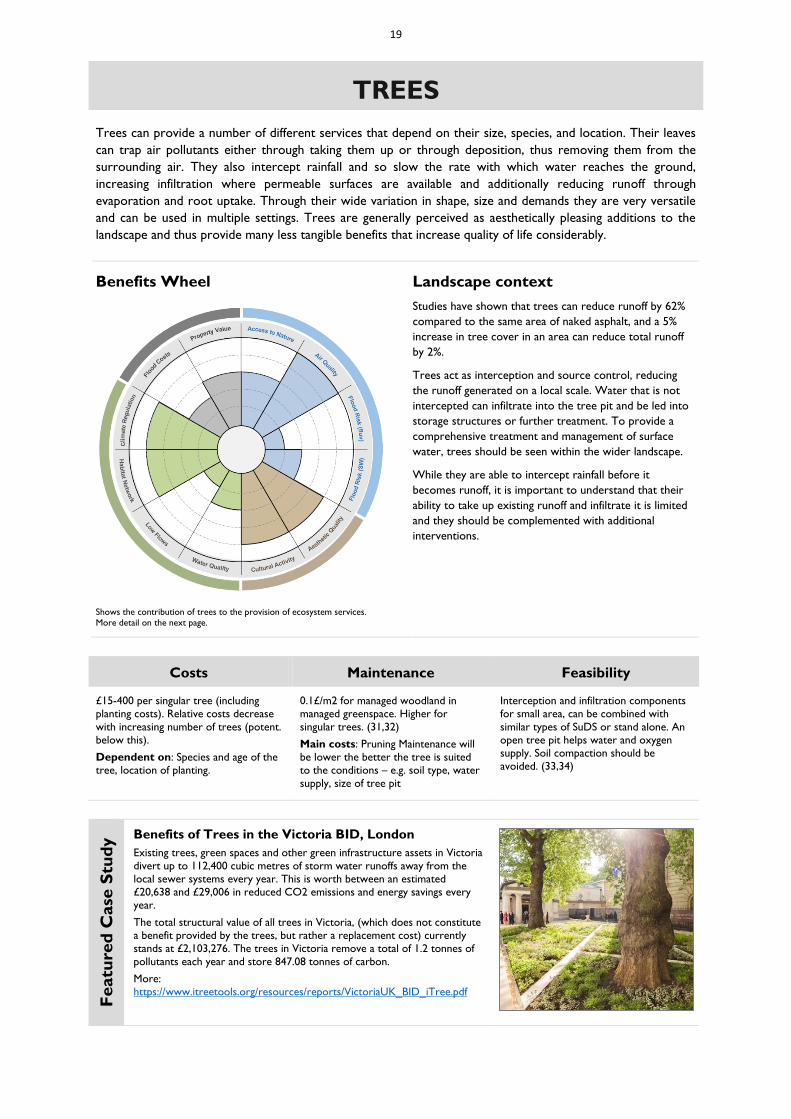
Shows the contribution of trees to the provision of ecosystem services.
More detail on the next page.
Studies have shown that trees can reduce runoff by 62%
compared to the same area of naked asphalt, and a 5%
increase in tree cover in an area can reduce total runoff
by 2%.
Trees act as interception and source control, reducing
the runoff generated on a local scale. Water that is not
intercepted can infiltrate into the tree pit and be led into
storage structures or further treatment. To provide a
comprehensive treatment and management of surface
water, trees should be seen within the wider landscape.
While they are able to intercept rainfall before it
becomes runoff, it is important to understand that their
ability to take up existing runoff and infiltrate it is limited
and they should be complemented with additional
interventions.
Costs Maintenance Feasibility
£15-400 per singular tree (including
planting costs). Relative costs decrease
with increasing number of trees (potent.
below this).
Dependent on: Species and age of the
tree, location of planting.
0.1£/m2 for managed woodland in
managed greenspace. Higher for
singular trees. (31,32)
Main costs: Pruning Maintenance will
be lower the better the tree is suited
to the conditions – e.g. soil type, water
supply, size of tree pit
Interception and infiltration components
for small area, can be combined with
similar types of SuDS or stand alone. An
open tree pit helps water and oxygen
supply. Soil compaction should be
avoided. (33,34)
Featu
red
Case
Stu
dy
Benefits of Trees in the Victoria BID, London
Existing trees, green spaces and other green infrastructure assets in Victoria
divert up to 112,400 cubic metres of storm water runoffs away from the
local sewer systems every year. This is worth between an estimated
£20,638 and £29,006 in reduced CO2 emissions and energy savings every
year.
The total structural value of all trees in Victoria, (which does not constitute
a benefit provided by the trees, but rather a replacement cost) currently
stands at £2,103,276. The trees in Victoria remove a total of 1.2 tonnes of
pollutants each year and store 847.08 tonnes of carbon.
More:
https://www.itreetools.org/resources/reports/VictoriaUK_BID_iTree.pdf
20
Social Benefits Environmental Benefits
Health: Access. * While trees are not themselves
‘accessible’, they make areas more attractive. Streets with
trees have 20% higher bicycle traffic than those without (26).
Parks with a number of trees are used more than those
without, however dense tree stands can increase fear of
crime.(1,2,3,4,5,6,8,9,7)
Air Quality. * A single tree can reduce PM concentration by
15-20%. Street trees reduce prevalence of asthma in children
and death rates from respiratory diseases. (9,16,30)
Surface Water. * 10-15% of rainfall are intercepted by
canopies (2,000-3,000 litres per year, according to US studies
(15)). Open tree pits increase infiltration, with leaf litter
acting like a sponge, and so reduces runoff even further (up
to 62% reduction of total rainfall volume on area, compared
to 10-20% for asphalt). In severely compacted soils, tree
roots can improve infiltration by 153%. (13,14,28, 29,33,37)
Fluvial Flood. * Trees along river banks (i.e. in the riparian
zone) can act to slow water flow and reduce fluvial flooding.
Water Quality. * By allowing increased infiltration, trees
improve water quality. Leaf litter on the ground reduces soil
erosion, trees intercept pollutants and infiltrate them.
(27,28,37)
Habitat Provision. * Depends on location, size and species
of tree, but can provide important corridors. Especially large
trees are of high importance for biodiversity. Preservation of
trees in developments and preservation of especially larger
areas of existing woodland can have a high impact on urban
biodiversity.) (22,23,24)
Climate Regulation. * Reduce air temperature/UHI
(increasing green cover by 10% reduces temperatures by 3
degrees, areas under canopies can be 1-10 degrees cooler
than open areas). iTree studies in the UK have estimated
annual C sequestration to be 3.65 – 7.4kg/tree. (19,20,21)
Low Flows. * Infiltration allows groundwater recharge or
releases water slowly into the water bodies. This can mean a
positive impact on low flows.
Cultural Benefits Economic Benefits
Aesthetics. * Aesthetic benefits have been proven multiple
times, impact on mental health (people feel more relaxed in
areas with trees), place shaping. (7,12,37)
Cultural Activities. * Trees can be important cultural
assets and facilitate some cultural activities. This is dependent
on their context – for example, old trees that are part of
village greens may have different cultural meanings than newly
planted street trees. (12)
Property Value. * Trees in the surrounding environment can
lead to a 5-10% increase in property value, and increase
spending in business areas making areas more attractive to
businesses. (10,11,37)
Flood Damage.* Due to their impact on surface water
flooding, trees can influence the extent of a flood – however,
singular trees are unable to make a big impact and can only
contribute little to fluvial flooding.
Additional Benefits and Potential Costs
(Mental) Health. Urban parks with trees reduce stress
levels more than those without. Trees have positive impacts
on exercise regularity. They have also been connected to
positive impacts on health of new-borns/maternal health.
Energy Savings. Strategically placed trees can reduce
cooling/heating costs in buildings and save energy (10%
savings on energy costs due to cooling). Shelterbelts can
reduce heating costs by up to 18%
Noise Reduction. Trees can act as buffers against noise and
placed strategically minimise the impact of highly used roads.
Property Value. Potential negative impact on properties
(shading, roots, litter), unhealthy trees can pose safety risk.
Trees can also obscure views, leading to less aesthetic value
and in some cases even higher perceptions of unsafety.
Climate Regulation. Release of VOC can have negative
impacts on GHG emissions, as can fuel-intense maintenance.
It is therefore important to select the right species and keep
maintenance as low carbon as possible.
Health. Allergy attacks due to pollen are possible and some
trees can produce VOCs and increase ozone generation.
Selection of species is important as well as their placing in the
urban landscape to avoid trapping of pollutants.
*** Indication of confidence. * Literature confirms positive influence. * Mostly positive results in literature and/or little literature
available. * Varying results in literature, little literature available
21
References:
Access
(1) Nordh, H., Hartig, T., Hagerhall, C. M. and Fry, G.
(2009) ‘Components of small urban parks that
predict the possibility for restoration’, Urban
Forestry & Urban Greening, 8(4), pp. 225–235.
In densifying cities, small green spaces such as pocket
parks are likely to become more important as settings
for restoration. The variables most predictive of the
likelihood of restoration were the percentage of ground
surface covered by grass, the amount of trees and
bushes visible from the given viewing point, and
apparent park size.
(2) Commission for Architecture and the Built
Environment (2005) ‘Decent parks? Decent
behaviour?: The link between the quality of parks
and user behaviour Contents Foreword’, pp. 1–
17.
This publication provides practical suggestions for
improving public spaces in ways that can help reduce
vandalism and other anti-social behaviour. It is
informed by research commissioned by CABE Space in
2004. The research, carried out by GreenSpace,
involved over twenty local authorities and seventy-five
community representatives concerned with green
spaces.
Health, Wellbeing and Cultural Benefits
(3) Alcock, I., White, M. P., Wheeler, B. W., Fleming,
L. E. and Depledge, M. H. (2014) ‘Longitudinal
effects on mental health of moving to greener and
less green urban areas.’, Environmental science &
technology. American Chemical Society, 48(2), pp.
1247–55.
This study used panel data to explore three different
hypotheses about how moving to greener or less green
areas may affect mental health over time. Moving to
greener urban areas was associated with sustained
mental health improvements, suggesting that
environmental policies to increase urban green space
may have sustainable public health benefits.
(4) Donovan, G. H., Butry, D. T., Michael, Y.
L., Prestemon, J. P., Liebhold, A. M., Gatziolis, D.
and Mao, M. Y. (2013) ‘The relationship between
trees and human health: evidence from the spread
of the emerald ash borer.’, American journal of
preventive medicine, 44(2), pp. 139–45
Results suggest that loss of trees to the emerald ash
borer increased mortality related to cardiovascular and
lower-respiratory-tract illness. This finding adds to the
growing evidence that the natural environment
provides major public health benefits.
(5) Donovan, G. H., Michael, Y. L., Butry, D. T.,
Sullivan, A. D. and Chase, J. M. (2011) ‘Urban trees
and the risk of poor birth outcomes’, Health and
Place, 17(1), pp. 390–393.
This paper investigated whether greater tree-canopy
cover is associated with reduced risk of poor birth
outcomes in Portland, Oregon. We found that a 10%
increase in tree-canopy cover within 50. m of a house
reduced the number of small for gestational age births
by 1.42 per 1000 births (95% CI-0.11-2.72). Results
suggest that the natural environment may affect
pregnancy outcomes and should be evaluated in future
research.
(6) Lovasi, G. S., Quinn, J. W., Neckerman, K.
M., Perzanowski, M. S. and Rundle, A. (2008)
‘Children living in areas with more street trees
have lower prevalence of asthma.’, Journal of
epidemiology and community health, 62(7), pp.
647–9.
Street trees were associated with a lower prevalence of
early childhood asthma. This study does not permit
inference that trees are causally related to asthma at
the individual level.
(7) Milligan, C. and Bingley, A. (2007) ‘Restorative
places or scary spaces? The impact of woodland
on the mental well-being of young adults.’, Health
& place, 13(4), pp. 799–811.
Engaging with notions of restoration and therapeutic
landscapes literatures, the paper maintains that we
cannot accept uncritically the notion that the natural
environment is therapeutic. Indeed, from this paper it
is clear that a range of influences acts to shape young
people's relationship with woodland environments, but
not all of these influences do so in positive ways.
(8) University of Washington (2012) ‘Crime and Public
Safety. How Trees and Vegetation Relate to
Aggression and Violence.’ 1 of 13.
(9) Faculty of Public Health (2010) ‘Great Outdoors :
How Our Natural Health Service Uses Green
Space To Improve Wellbeing’, pp. 1–8.
(10) Luttik, J. (2000) ‘The value of trees, water and
open space as reflected by house prices in the
Netherlands’, Landscape and Urban Planning, 48(3-
4), pp. 161–167.
This study found the largest increases in house prices
due to environmental factors (up to 28%) for houses
with a garden facing water, which is connected to a
sizeable lake. We were also able to demonstrate that
a pleasant view can lead to a considerable increase in
house price, particularly if the house overlooks water
(8–10%) or open space (6–12%). In addition, the
analysis revealed that house price varies by landscape
type. Attractive landscape types were shown to attract
a premium of 5–12% over less attractive
environmental settings.
(11) Saphores, J.-D. and Li, W. (2012) ‘Estimating the
value of urban green areas: A hedonic pricing
analysis of the single family housing market in Los
22
Angeles, CA’, Landscape and Urban Planning, 104(3-
4), pp. 373–387.
This study analyses 20,660 transactions of single
family detached houses sold in 2003 and 2004 in the
city of Los Angeles, CA, to estimate the value of urban
trees, irrigated grass, and non-irrigated grass areas.
(12) Tabbush, P (2010) ‘Cultural Values of
Trees, Woods and Forests’ Forest Research.
This report presents the results of a literature review
and primary research into the importance of the
cultural values of trees, woods and forests for
sustainable forest management (SFM). The concept of
‘cultural capital’ emerged as helpful in distinguishing
between the values and norms that
stakeholders (including visitors and local communities)
bring to woodlands (‘embodied cultural capital’), and
physical attributes of the woodlands that are of cultural
value (‘objectified cultural capital’, or ‘assets’).
Surface Water Management
(13) Armson, D., Stringer, P. and Ennos, A. R. (2013)
‘The effect of street trees and amenity grass on
urban surface water runoff in Manchester, UK’,
Urban Forestry & Urban Greening, 12(3), pp. 282–
286.
This study assessed the impact of trees upon urban
surface water runoff by measuring the runoff from 9
m2 plots covered by grass, asphalt, and asphalt with a
tree planted in the centre. It was found that, while
grass almost totally eliminated surface runoff, trees
and their associated tree pits, reduced runoff from
asphalt by as much as 62%. The reduction was more
than interception alone could have produced, and
relative to the canopy area was much more than
estimated by many previous studies.
(14) Davies, H. and Doick, K. (2015) ‘Valuing the
carbon sequestration and rainwater interception
ecosystem services provided by Britain’s urban
trees.’ Bonn.
(15) Seitz, J. and Escobedo, F. (2014) ‘Urban Forests
in Florida : Trees Control Stormwater Runoff and
Improve Water Quality’. University of Florida.
Neighbourhoods with fewer trees have the potential for
increased stormwater, pollutants, and chemicals
flowing into their water supply and systems, resulting in
health risks, flood damage, and increased taxpayers’
dollars to treat the water. In Santa Monica, CA, rainfall
interception was measured for 29,229 street and park
trees. Researchers found that the trees intercepted
1.6% of total precipitation over a year, providing an
estimated value of $110,890 ($3.80 per tree) saved
on avoided stormwater costs.
Air quality
(16) Forest Research (no date) Improving Air Quality.
Climate Regulation
(17) Armson, D., Stringer, P. and Ennos, A. R. (2012)
‘The effect of tree shade and grass on surface and
globe temperatures in an urban area’, Urban
Forestry & Urban Greening, 11(3), pp. 245–255.
The results from this study show that both grass and
trees can effectively cool surfaces and so can provide
regional cooling, helping reduce the urban heat island
in hot weather. In contrast grass has little effect upon
local air or globe temperatures, so should have little
effect on human comfort, whereas tree shade can
provide effective local cooling.
(18) Davies, H. and Doick, K. (2015) ‘Valuing the
carbon sequestration and rainwater interception
ecosystem services provided by Britain’s urban
trees.’ Bonn.
(19) Forestry Commission (2013) Air temperature
regulation by urban trees and green infrastructure.
Farnham.
Vegetation has a key role to play in contributing to the
overall temperature regulation of cities. Informed
selection and strategic placement of trees and green
infrastructure can reduce the UHI and cool the air by
between 2ºC and 8ºC, reducing heat-related stress and
premature human deaths during high-temperature
events.
(20) Nowak, D. J., Greenfield, E. J., Hoehn, R. E.
and Lapoint, E. (2013) ‘Carbon storage and
sequestration by trees in urban and community
areas of the United States’, Environmental
Pollution, (178), pp. 229–236.
Urban whole tree carbon storage densities average
7.69 kg C m2 of tree cover and sequestration densities
average 0.28 kg C m2 of tree cover per year. Total
tree carbon storage in U.S. urban areas (c. 2005) is
estimated at 643 million tonnes ($50.5 billion value;
95% CI ¼ 597 million and 690 million tonnes) and
annual sequestration is estimated at 25.6 million
tonnes ($2.0 billion value; 95% CI ¼ 23.7 million to
27.4 million tonnes).
(21) Lehmann, S. (2014) ‘Low carbon districts:
Mitigating the urban heat island with green roof
infrastructure’, City, Culture and Society, 5(1), pp. 1–
8. doi: 10.1016/j.ccs.2014.02.002.
The integration of trees, shrubs and flora into green
spaces and gardens in the city is particularly important
in helping to keep the urban built environment cool,
because buildings and pavements increase heat
absorption and reflection (what is called the urban
heat island effect). Integrated urban development with
a focus on energy, water, greenery and the urban
microclimate will have to assume a lead role and
urban designers will engage with policy makers in
order to drastically reduce our cities’ consumption of
energy and resources. This paper introduces the
holistic concept of green urbanism as a framework for
environmentally conscious urban development.
Habitat Provision
(22) Alvey, A. A. (2006) ‘Promoting and preserving
biodiversity in the urban forest’, Urban Forestry &
Urban Greening, 5(4), pp. 195–201.
The potential for urban areas to harbor considerable
amounts of biodiversity needs to be recognized by city
planners and urban foresters so that management
practices that preserve and promote that diversity can
be pursued. Management options should focus on
23
increasing biodiversity in all aspects of the urban forest,
from street trees to urban parks and woodlots.
(23) Mörtberg, U. and Wallentinus, H.-G. (2000) ‘Red-
listed forest bird species in an urban environment
— assessment of green space corridors’,
Landscape and Urban Planning, 50(4), pp. 215–
226.
The logistic regression models showed that important
properties of remnants of natural vegetation were
large areas of forest on rich soils, together with
connectivity in the form of amounts of this habitat in
the landscape. These properties were associated with
the green space corridors. Implications for the design
of urban green space corridors would be to treat
mature and decaying trees and patches of moist
deciduous forest as a resource for vulnerable species,
and to conserve large areas of natural vegetation
together with a network of important habitats in the
whole landscape, in this case forest on rich soils, also in
built-up areas.
(24) Stagoll, K., Lindenmayer, D. B., Knight, E., Fischer,
J. and Manning, A. D. (2012) ‘Large trees are
keystone structures in urban parks’, Conservation
Letters, 5(2), pp. 115–122.
This study found that (1) large trees had a consistent,
strong, and positive relationship with five measures of
bird diversity, and (2) as trees became larger in size,
their positive effect on bird diversity increased. Large
urban trees are therefore keystone structures that
provide crucial habitat resources for wildlife. Hence, it
is vital that they are managed appropriately. With
evidence-based tree preservation policies that
recognize biodiversity values, and proactive planning
for future large trees, the protection and perpetuation
of these important keystone structures can be
achieved.
General/broader References (for multiple
benefits)
(25) Bird, W. (2007) ‘Natural Thinking’, Royal Society
for the Protection of Birds, pp. 1–116.
(26) McPherson, E. G., Simpson, J. R., Peper, P. J.,
Gardner, S. L., Vargas, K. E. and Xiao, Q. (2007)
Northeast Community Tree Guide.
Presents benefits and costs for representative small,
medium, and large deciduous trees and coniferous
trees in the Northeast region derived from models
based on indepth research carried out in the borough
of Queens, New York City. Average annual net benefits
(benefits minus costs) increase with mature tree size
and differ based on location: $5 (yard) to $9 (public)
for a small tree, $36 (yard) to $52 (public) for a
medium tree, $85 (yard) to $113 (public) for a large
tree, $21 (yard) to $33 (public) for a conifer.
(27) Roy, S., Byrne, J. and Pickering, C. (2012) ‘A
systematic quantitative review of urban tree
benefits, costs, and assessment methods across
cities in different climatic zones’, Urban Forestry &
Urban Greening, 11(4), pp. 351–363.
Urban trees can potentially mitigate environmental
degradation accompanying rapid urbanisation via a
range of tree benefits and services. But uncertainty
exists about the extent of tree benefits and services
because urban trees also impose costs (e.g. asthma)
and may create hazards (e.g. windthrow). Few
researchers have systematically assessed how urban
tree benefits and costs vary across different cities,
geographic scales and climates. This paper provides a
quantitative review of 115 original urban tree studies,
examining: (i) research locations, (ii) research methods,
and (iii) assessment techniques for tree services and
disservices.
(28) The Mersey Forest (2014) Urban Catchment
Forestry: The strategic use of urban trees and
woodlands to reduce flooding, improve water
quality, and bring wider benefits.
(29) U.S. Environmental Protection Agency
(2013) Stormwater to Street Trees. Washington,
DC.
(30) Wang, Y., Bakker, F., de Groot, R. and Wörtche,
H. (2014) ‘Effect of ecosystem services provided
by urban green infrastructure on indoor
environment: A literature review’, Building and
Environment, 77, pp. 88–100.
The economic effects of adjoining vegetation and green
roofs on climate regulation provided energy savings of
up to almost $250/tree/year, while the air quality
regulation was valued between $0.12 and $0.6/m2
tree cover/year. Maximum monetary values attributed
to noise regulation and aesthetic appreciation of urban
green were $20 – $25/person/year, respectively. Of
course these values are extremely time- and context-
dependent but do give an indication of the potential
economic effects of investing in urban green
infrastructure.
Guidance
(31) The Woodland Trust (2002) ‘Urban woodland
management guide 4: Tree planting and woodland
creation.’
(32) The Woodland Trust (2011) Trees or Turf ?
The costs of woodland in managed green space are
£1,500/ha/a for the first 4 years after establishment,
after which they become a cheaper alternative to
amenity grassland, reducing annual maintenance costs
per hectare to £630.
(33) The Woodland Trust (2015) ‘Practical Guidance:
Residential Developments and Trees’.
Planting trees can slow the flow of water and reduce
surface water runoff by up to 62 per cent compared to
asphalt. A single young tree planted in a small pit over
an impermeable asphalt surface can reduce runoff by
around 60 per cent, even during the winter when it is
not in leaf. Tree roots can increase infiltration rates in
compacted soils by 63 per cent, and in severely
compacted soils by 153 per cent. A single tree has
been estimated to reduce PM concentration by 15-20
per cent. Natural England has estimated that access to
quality green space could save around £2.1 billion in
health care costs. The presence of trees is perceived as
indicating a more cared for neighbourhood and the

24
presence of street trees was associated with a
decreased incidence of crime.
(34) Sustrans (no date): Introducing plants and trees
into your street.
(35) Forestry Commission (2009) ‘The London Trees
and Woodlands Standard Costs .’
(36) Trees for Cities:
http://www.treesforcities.org/about-
us/information-resources/benefits-of-urban-trees/
(37) Warwick District Council (2003) ‘The Benefits of
Urban Trees. A summary of the benefits of urban
trees accompanied by a selection of research
papers and pamphlets.’
This briefing note is an attempt to summarise some of
the benefits of urban trees. A number of papers
relevant to the subject of the benefits of urban trees
have, with the kind permission of their authors, been
included in the appendices.
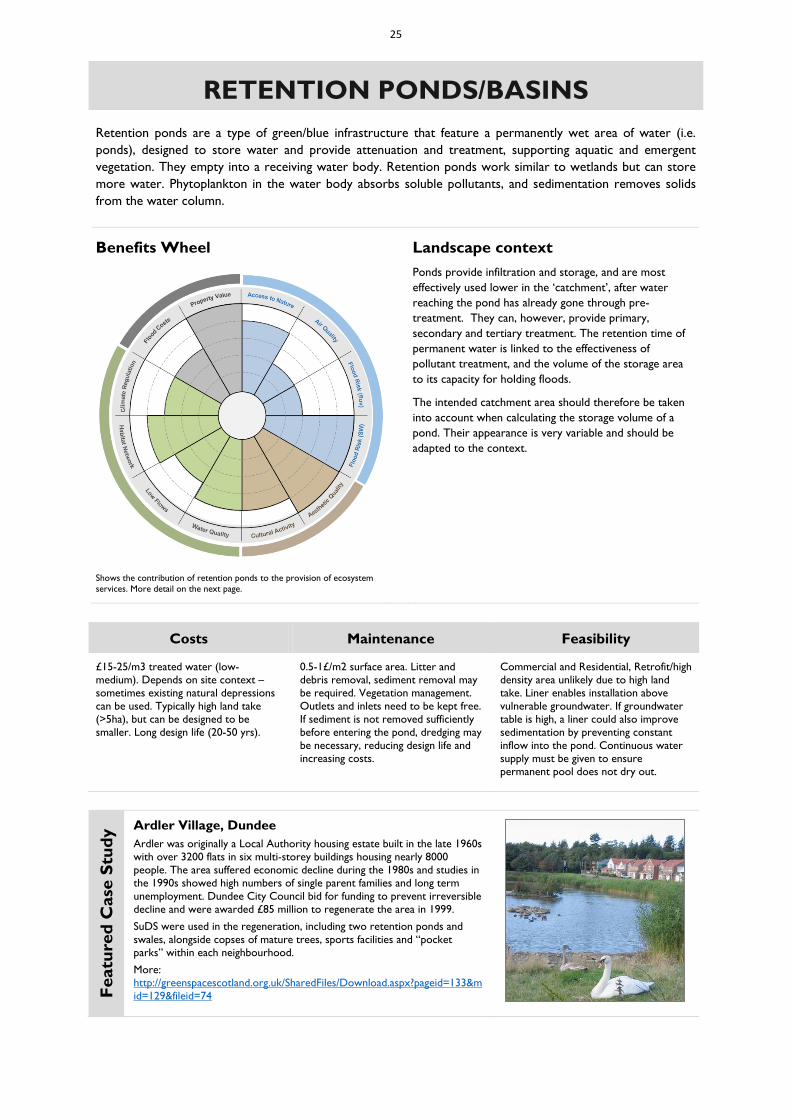
25
RETENTION PONDS/BASINS
Retention ponds are a type of green/blue infrastructure that feature a permanently wet area of water (i.e.
ponds), designed to store water and provide attenuation and treatment, supporting aquatic and emergent
vegetation. They empty into a receiving water body. Retention ponds work similar to wetlands but can store
more water. Phytoplankton in the water body absorbs soluble pollutants, and sedimentation removes solids
from the water column.
Benefits Wheel
Landscape context
Shows the contribution of retention ponds to the provision of ecosystem
services. More detail on the next page.
Ponds provide infiltration and storage, and are most
effectively used lower in the ‘catchment’, after water
reaching the pond has already gone through pre-
treatment. They can, however, provide primary,
secondary and tertiary treatment. The retention time of
permanent water is linked to the effectiveness of
pollutant treatment, and the volume of the storage area
to its capacity for holding floods.
The intended catchment area should therefore be taken
into account when calculating the storage volume of a
pond. Their appearance is very variable and should be
adapted to the context.
Costs Maintenance Feasibility
£15-25/m3 treated water (low-
medium). Depends on site context –
sometimes existing natural depressions
can be used. Typically high land take
(>5ha), but can be designed to be
smaller. Long design life (20-50 yrs).
0.5-1£/m2 surface area. Litter and
debris removal, sediment removal may
be required. Vegetation management.
Outlets and inlets need to be kept free.
If sediment is not removed sufficiently
before entering the pond, dredging may
be necessary, reducing design life and
increasing costs.
Commercial and Residential, Retrofit/high
density area unlikely due to high land
take. Liner enables installation above
vulnerable groundwater. If groundwater
table is high, a liner could also improve
sedimentation by preventing constant
inflow into the pond. Continuous water
supply must be given to ensure
permanent pool does not dry out.
Featu
red
Case
Stu
dy
Ardler Village, Dundee
Ardler was originally a Local Authority housing estate built in the late 1960s
with over 3200 flats in six multi-storey buildings housing nearly 8000
people. The area suffered economic decline during the 1980s and studies in
the 1990s showed high numbers of single parent families and long term
unemployment. Dundee City Council bid for funding to prevent irreversible
decline and were awarded £85 million to regenerate the area in 1999.
SuDS were used in the regeneration, including two retention ponds and
swales, alongside copses of mature trees, sports facilities and “pocket
parks” within each neighbourhood.
More:
http://greenspacescotland.org.uk/SharedFiles/Download.aspx?pageid=133&m
id=129&fileid=74

26
Social Benefits Environmental Benefits
Health: Access. * Water bodies encourage low intensity
activities and the areas around ponds can be designed to offer
space for recreational activities. (4, 11, 12, 18, 26, 27)
Air Quality. *Plants in the area surrounding the pond as
well as the soil are likely to take up a certain amount of
pollutants. (7)
Surface Water. * Provide peak discharge control for small
and medium storms (10 yr return period) or even large
storms if carefully designed. Performance depends on storage
volume permitted. Volume reduction depends on infiltration
and storage time. (1, 4, 5, 6, 9, 11, 12, 19, 20, 22, 23)
Fluvial Flood. * By storing water and attenuating peak flow,
retention ponds can positively influence the risk of flooding
downstream. (4, 11,22,23)
Water Quality. * Avg sediment removal efficiency of 90%, N
30%, P 50%, metals 50-80%. Depends on the retention time
provided by the pond. (2, 4, 5, 8, 9, 11, 16, 17, 21,27)
Habitat Provision. * Ponds can harbour wildlife and aquatic
vegetation and also function as habitat corridors and stepping
stones for wildlife. They perform an ecologically highly
important function, especially in the urban environment. (4, 12,
18)
Climate Regulation. * Water bodies can balance
temperatures and mitigate the UHI effect. Vegetation can take
up CO2 that can consequently be buried, but Methane and
other GHG can also be released. (10, 14, 18)
Low Flows. * Ponds can potentially release water during dry
periods, and the possibility to re-use water can reduce
pressure on mains water. (4)
Cultural Benefits Economic Benefits
Aesthetics. * Ponds are an aesthetically pleasing landscape
feature, providing a sense of beauty and so promoting
wellbeing. (4, 11, 12, 13, 18)
Cultural Activities. * Water bodies have been shown to
provide opportunity for reflection and social interaction and
so are important cultural points if maintained and designed
adequately. Can be used as educational facilities. (4, 11, 13,
24, 25, 26)
Property Value. * Can add significant property value to
development and increase business and tourism. 150%
increase in property value in residential area where view of
the water is available. (4, 11, 13, 18)
Flood Damage. * Through their impact on reducing and
removing surface water runoff, retention basins can reduce
severity of surface water floods.
Additional Benefits and Potential Costs
Water re-use. Depending on the water quality, water from
ponds can be reused for watering greenspaces or other non-
potable uses.
Mental Health. Bodies of standing and running water
(excluding marshes/swamps) have been shown to provide
more mental health and aesthetic benefits than built urban
environment without water and even in greenspaces, those
featuring water are ranked as being more interesting and
restorative.
Water quality. Eutrophication in summer. Avoid by
providing constant baseflow, prevent runoff of water directly
from fertilised areas around pond (e.g. lawns). It is important
to provide an initial stage of water treatment (e.g. traps, filter
strips, sediment forebays) before runoff is discharged into
ponds.
Cultural Activities. If all surrounding area managed
intensively, the ecological potential of the intervention sinks.
But, if vegetation is not managed at all, the area may have low
potential for recreational activities.
Habitat. Invasive species can be problematic.
Climate. Waterbodies may emit GHG.
*** Indication of confidence. * Literature confirms positive influence. * Mostly positive results in literature and/or little literature
available. * Varying results in literature, little literature available
27
References:
(1) Ashley, R. M., Nowell, R., Gersonius, B. and
Walker, L. (2011) ‘Surface Water Management and
Urban Green Infrastructure’, 44(0), pp. 1–76.
(2) Berwick, N. and Wade, D. R. (2013) A Critical
Review of Urban Diffuse Pollution Control :
Methodologies to Identify Sources , Pathways and
Mitigation Measures with Multiple Benefits.
(3) Environment Agency (2015) Cost estimation for
SUDS - summary of evidence. Bristol.
(4) Kellagher, R., Martin, P., Jefferies, C., Bray, R.,
Shaffer, P., Wallingford, H. R., Woods-Ballard, B.,
Woods Ballard, B. (2015) The SUDS manual,
CIRIA. London.
(5) Pratt, C. J. (2004) Sustainable Drainage. A Review
of Published Material on the Performance of
Various SUDS Components. Bristol.
(6) Lawrence, A. I., Marsalek, J., Ellis, J. B. and
Urbonas, B. (1996) ‘Stormwater detention &
BMPs’, Journal of Hydraulic Research. Taylor &
Francis Group, 34(6), pp. 799–813
(7) Forest Research (no date) Improving Air Quality.
(8) Birch, G. F. and Fazelli, M. S. (2006): Efficiency of a
Retention/detention Basin to Remove
contaminants from Urban Stormwater’, Urban
Water Journal, 3.2, 69–77
(9) J B Ellis, R B E Shutes and M D Revitt (2003)
Constructed Wetlands and Links with Sustainable
Drainage Systems.
(10) McPhillips, L. and Walter, T.(2015): Hydrologic
Conditions Drive Denitrification and Greenhouse
Gas Emissions in Stormwater Detention Basins’,
Ecological Engineering, 85 (2015), 67–75
(11) Susdrain (2016):
http://www.susdrain.org/delivering-suds/using-
suds/suds-
components/retention_and_detention/retention_p
onds.html
(12) CIRIA (2014) ‘Demonstrating the multiple benefits
of SuDS - a business case’
(13) Bastien, N. R. P., Arthur, S. and McLoughlin, M. J.
(2012) ‘Valuing amenity: public perceptions of
sustainable drainage systems ponds’, Water and
Environment Journal, 26(1), pp. 19–29.
(14) Charlesworth, S. M. (2010) ‘A review of the
adaptation and mitigation of global climate change
using sustainable drainage in cities’, Journal of
Water and Climate Change. IWA Publishing, 1(3),
p. 165.
(15) Charlesworth, S. M., Harker, E. and Rickard, S.
(2003) ‘A Review of Sustainable Drainage Systems
(SuDS): A Soft Option for Hard Drainage
Questions?’, Geography, 88(2), pp. 99–107.
(16) Comings, K. J., Booth, D. B. and Horner, R. R.
(2000) ‘Storm Water Pollutant Removal by Two
Wet Ponds in Bellevue, Washington’, Journal of
Environmental Engineering. American Society of
Civil Engineers, 126(4), pp. 321–330.
(17) Heal, K. (2000) SUDS Ponds in Scotland -
Performance Outcomes to Date.
(18) Moore, T. L. C. and Hunt, W. F. (2012)
‘Ecosystem service provision by stormwater
wetlands and ponds - a means for evaluation?’,
Water research, 46(20), pp. 6811–23.
(19) Persson, J., Somes, N. L. G. and Wong, T. H. F.
(1999) ‘Hydraulics Efficiency of Constructed
Wetlands and Ponds’, Water Science and
Technology. IWA Publishing, 40(3), pp. 291–300.
(20) Persson, J. and Wittgren, H. B. (2003) ‘How
hydrological and hydraulic conditions affect
performance of ponds’, Ecological Engineering,
21(4-5), pp. 259–269.
(21) Sniffer (2004) SUDS in Scotland - The Monitoring
Programme.
(22) U.S. Environmental Protection Agency (2009)
Stormwater Wet Pond and Wetland Management
Guidebook.
(23) Villarreal, E. L., Semadeni-Davies, A. and
Bengtsson, L. (2004) ‘Inner city stormwater
control using a combination of best management
practices’, Ecological Engineering, 22(4-5), pp. 279–
298.
(24) Völker, S. and Kistemann, T. (2013) ‘“I’m always
entirely happy when I'm here!” Urban blue
enhancing human health and well-being in Cologne
and Düsseldorf, Germany.’, Social science &
medicine (1982), 78, pp. 113–24.
(25) Völker, S. and Kistemann, T. (2015) ‘Developing
the urban blue: Comparative health responses to
blue and green urban open spaces in Germany’,
Health & Place, 35, pp. 196–205.
(26) White, M., Smith, A., Humphryes, K., Pahl, S.,
Snelling, D. and Depledge, M. (2010) ‘Blue space:
The importance of water for preference, affect,
and restorativeness ratings of natural and built
scenes’, Journal of Environmental Psychology,
30(4), pp. 482–493.
(27) Wong, T., Breen, P. and Somes, N. (1999) ‘Ponds
vs Wetlands - Performance Considerations in
Stormwater Quality Management’, in
Comprehensive Stormwater and Aquatic
Ecosystems Management. Auckland, pp. 223–231.
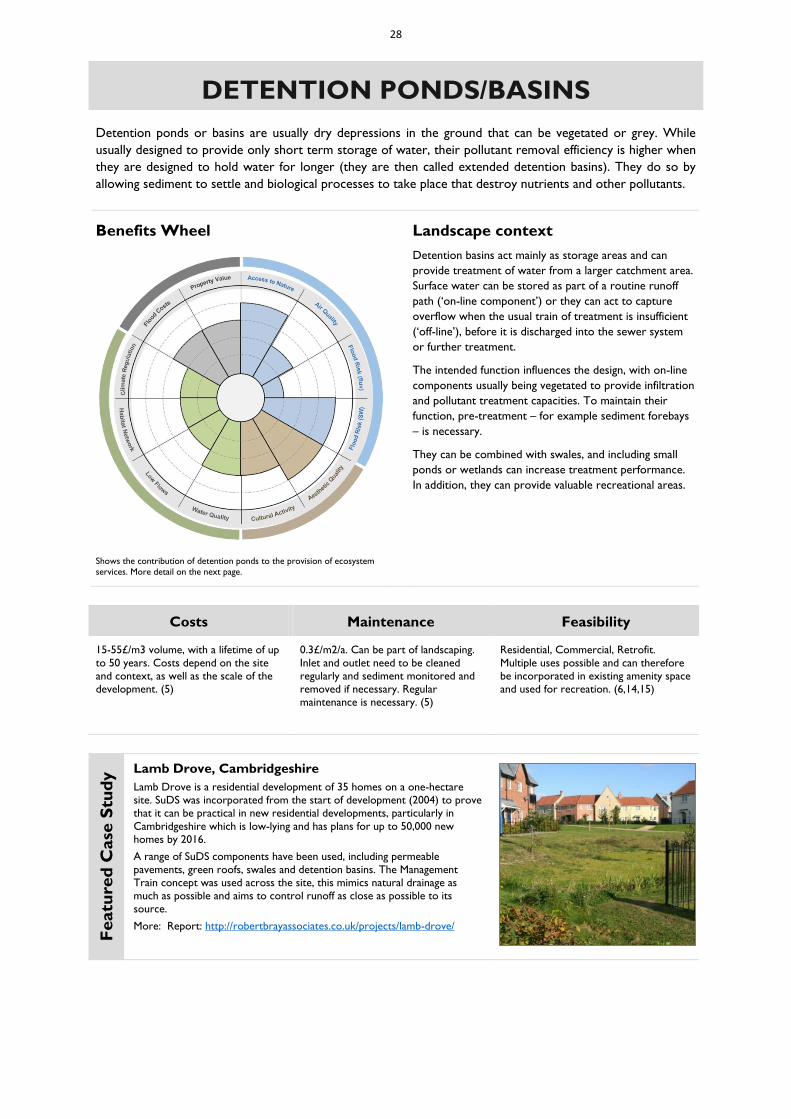
28
DETENTION PONDS/BASINS
Detention ponds or basins are usually dry depressions in the ground that can be vegetated or grey. While
usually designed to provide only short term storage of water, their pollutant removal efficiency is higher when
they are designed to hold water for longer (they are then called extended detention basins). They do so by
allowing sediment to settle and biological processes to take place that destroy nutrients and other pollutants.
Benefits Wheel
Landscape context
Shows the contribution of detention ponds to the provision of ecosystem
services. More detail on the next page.
Detention basins act mainly as storage areas and can
provide treatment of water from a larger catchment area.
Surface water can be stored as part of a routine runoff
path (‘on-line component’) or they can act to capture
overflow when the usual train of treatment is insufficient
(‘off-line’), before it is discharged into the sewer system
or further treatment.
The intended function influences the design, with on-line
components usually being vegetated to provide infiltration
and pollutant treatment capacities. To maintain their
function, pre-treatment – for example sediment forebays
– is necessary.
They can be combined with swales, and including small
ponds or wetlands can increase treatment performance.
In addition, they can provide valuable recreational areas.
Costs Maintenance Feasibility
15-55£/m3 volume, with a lifetime of up
to 50 years. Costs depend on the site
and context, as well as the scale of the
development. (5)
0.3£/m2/a. Can be part of landscaping.
Inlet and outlet need to be cleaned
regularly and sediment monitored and
removed if necessary. Regular
maintenance is necessary. (5)
Residential, Commercial, Retrofit.
Multiple uses possible and can therefore
be incorporated in existing amenity space
and used for recreation. (6,14,15)
Featu
red
Case
Stu
dy
Lamb Drove, Cambridgeshire
Lamb Drove is a residential development of 35 homes on a one-hectare
site. SuDS was incorporated from the start of development (2004) to prove
that it can be practical in new residential developments, particularly in
Cambridgeshire which is low-lying and has plans for up to 50,000 new
homes by 2016.
A range of SuDS components have been used, including permeable
pavements, green roofs, swales and detention basins. The Management
Train concept was used across the site, this mimics natural drainage as
much as possible and aims to control runoff as close as possible to its
source.
More: Report: http://robertbrayassociates.co.uk/projects/lamb-drove/
29
Social Benefits Environmental Benefits
Health: Access. * Detention basins can be used as
multifunctional areas and so provide opportunities for
recreation and sport. (2,6,14)
Air Quality. * Potentially, pollutants can be adsorbed by
vegetation and soil. (9)
Surface Water. * Detention basins have a high impact on
peak flows and can reduce volume of runoff (20-90%), but are
most effective for small storms. Extended detention basins
can achieve better outcomes. (7, 8, 10, 11)
Fluvial Flood. * Detention basins may influence fluvial floods
downstream by reducing the amount of water discharged into
rivers. (2)
Water Quality. * Especially high sediment removal (40-70%)
but also for metals and insoluble pollutants, but lower for
soluble pollutants. Higher for extended detention basins. (3, 4,
7, 10, 11)
Habitat Provision. * Low potential but planting of native
vegetation and shrubs can improve habitat conditions for
wildlife. Invasive species can be a problem. (6, 13, 15)
Climate Regulation. * DB can reduce the UHI effect and
store carbon if vegetated. Long storage times, while improving
nutrient removal, can increase GHG emissions. (2, 13,16)
Low Flows. * Groundwater recharge is possible. (6,13)
Cultural Benefits Economic Benefits
Aesthetics. * Depending on design the aesthetic value can
be significant. In highly urbanised areas where grey design is
required, this can be enhanced to look appealing and
provide multifunctional space. (6,13,15)
Cultural Activities. * Depending on design, detention
basins can provide space for cultural activities. (6, 14, 15)
Property Value. * Good design increases property value in
close vicinity to detention basins. (11)
Flood Damage. * Through their impact on reducing and
removing surface water runoff, detention basins can reduce
severity of surface water floods.
Additional Benefits and Potential Costs
No additional benefits Climate Regulation. Depending on the design, NH4 and
CH4 can be emitted, more so when storage times are longer.
This should be considered when designing the basin and
outlet.
Aesthetics. Lack of maintenance can lead to swampy areas
at the outlet of the basin which can be perceived as
dangerous or simply ugly, and can also have an impact on the
multi-functionality of the space.
Water quality. Sediment removal needs to be taken care of
if accumulation of metals happens at the bottom of the basin.
Otherwise, the soil can become contaminated and high
pollution can occur in the outflow of the basin.
*** Indication of confidence. * Literature confirms positive influence. * Mostly positive results in literature and/or little literature
available. * Varying results in literature, little literature available
30
References:
(1) Ahiablame, L. M., Engel, B. A. and Chaubey, I.
(2012) Effectiveness of Low Impact Development
Practices: Literature Review and Suggestions for
Future Research.
(2) Ashley, R. M., Nowell, R., Gersonius, B. and
Walker, L. (2011) ‘Surface Water Management and
Urban Green Infrastructure’, 44(0), pp. 1–76.
(3) Berwick, N. and Wade, D. R. (2013) A Critical
Review of Urban Diffuse Pollution Control :
Methodologies to Identify Sources , Pathways and
Mitigation Measures with Multiple Benefits.
(4) Deletic, A. (2005) ‘Sediment transport in urban
runoff over grassed areas’, Journal of Hydrology,
301(1-4), pp. 108–122.
(5) Environment Agency (2015) Cost estimation for
SUDS - summary of evidence. Bristol.
(6) Kellagher, R., Martin, P., Jefferies, C., Bray, R.,
Shaffer, P., Wallingford, H. R., Woods-Ballard, B.,
Woods Ballard, B. (2015) The SUDS manual,
CIRIA. London.
(7) Pratt, C. J. (2004) Sustainable Drainage. A Review
of Published Material on the Performance of
Various SUDS Components. Bristol.
(8) Lawrence, A. I., Marsalek, J., Ellis, J. B. and
Urbonas, B. (1996) ‘Stormwater detention &
BMPs’, Journal of Hydraulic Research. Taylor &
Francis Group, 34(6), pp. 799–813
(9) Forest Research (no date) Improving Air Quality.
(10) Birch, G. F. and Fazelli, M. S. (2006): Efficiency of a
Retention/detention Basin to Remove
contaminants from Urban Stormwater’, Urban
Water Journal, 3.2, 69–77
(11) J B Ellis, R B E Shutes and M D Revitt (2003)
Constructed Wetlands and Links with Sustainable
Drainage Systems.
(12) Lee, J. S. and Li, M. (2009): The Impact of
Detention Basin Design on Residential Property
Value: Case Studies Using GIS in the Hedonic Price
Modeling’, Landscape and Urban Planning, 89.1-2,
7–16
(13) McPhillips, L. and Walter, T.(2015): Hydrologic
Conditions Drive Denitrification and Greenhouse
Gas Emissions in Stormwater Detention Basins’,
Ecological Engineering, 85 (2015), 67–75
(14) Susdrain (2016):
http://www.susdrain.org/delivering-suds/using-
suds/suds-
components/retention_and_detention/Detention_
basins.html
(15) CIRIA (2014) ‘Demonstrating the multiple benefits
of SuDS - a business case’, (October), p. 45.
(16) Armson, D., Stringer, P. and Ennos, A. R. (2012)
‘The effect of tree shade and grass on surface and
globe temperatures in an urban area’, Urban
Forestry & Urban Greening, 11(3), pp. 245–255.
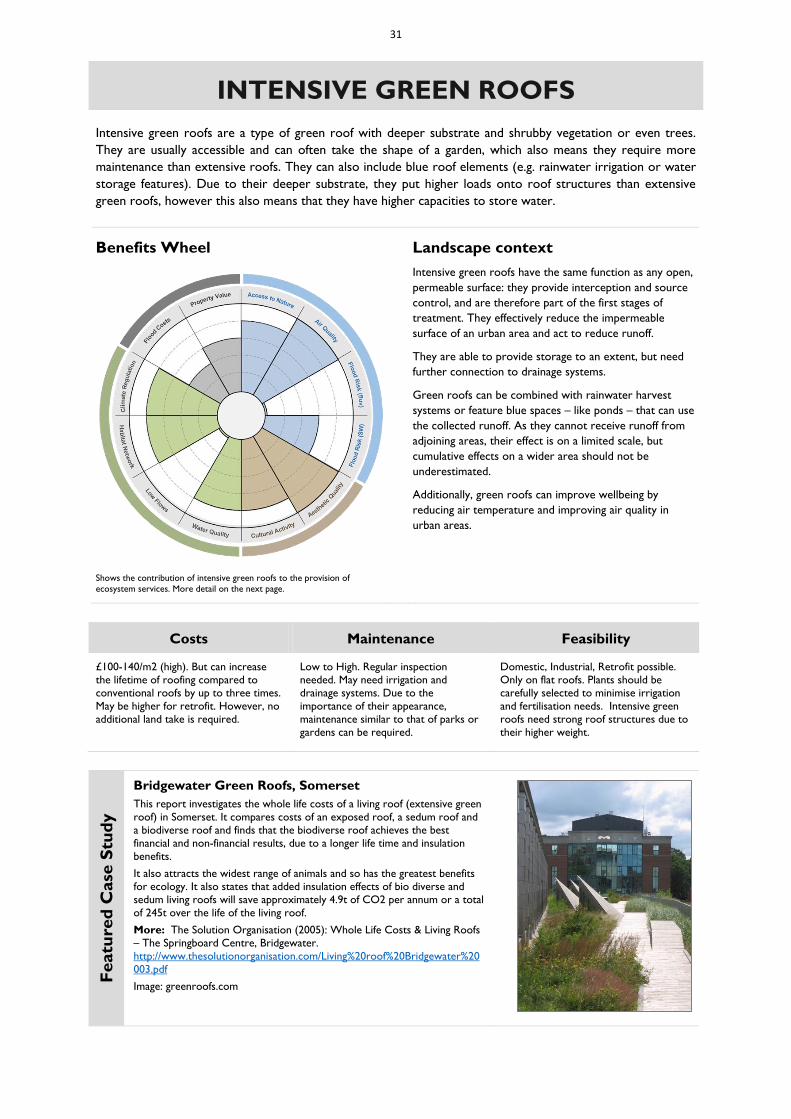
31
INTENSIVE GREEN ROOFS
Intensive green roofs are a type of green roof with deeper substrate and shrubby vegetation or even trees.
They are usually accessible and can often take the shape of a garden, which also means they require more
maintenance than extensive roofs. They can also include blue roof elements (e.g. rainwater irrigation or water
storage features). Due to their deeper substrate, they put higher loads onto roof structures than extensive
green roofs, however this also means that they have higher capacities to store water.
Benefits Wheel
Landscape context
Shows the contribution of intensive green roofs to the provision of
ecosystem services. More detail on the next page.
Intensive green roofs have the same function as any open,
permeable surface: they provide interception and source
control, and are therefore part of the first stages of
treatment. They effectively reduce the impermeable
surface of an urban area and act to reduce runoff.
They are able to provide storage to an extent, but need
further connection to drainage systems.
Green roofs can be combined with rainwater harvest
systems or feature blue spaces – like ponds – that can use
the collected runoff. As they cannot receive runoff from
adjoining areas, their effect is on a limited scale, but
cumulative effects on a wider area should not be
underestimated.
Additionally, green roofs can improve wellbeing by
reducing air temperature and improving air quality in
urban areas.
Costs Maintenance Feasibility
£100-140/m2 (high). But can increase
the lifetime of roofing compared to
conventional roofs by up to three times.
May be higher for retrofit. However, no
additional land take is required.
Low to High. Regular inspection
needed. May need irrigation and
drainage systems. Due to the
importance of their appearance,
maintenance similar to that of parks or
gardens can be required.
Domestic, Industrial, Retrofit possible.
Only on flat roofs. Plants should be
carefully selected to minimise irrigation
and fertilisation needs. Intensive green
roofs need strong roof structures due to
their higher weight.
Featu
red
Case
Stu
dy
Bridgewater Green Roofs, Somerset
This report investigates the whole life costs of a living roof (extensive green
roof) in Somerset. It compares costs of an exposed roof, a sedum roof and
a biodiverse roof and finds that the biodiverse roof achieves the best
financial and non-financial results, due to a longer life time and insulation
benefits.
It also attracts the widest range of animals and so has the greatest benefits
for ecology. It also states that added insulation effects of bio diverse and
sedum living roofs will save approximately 4.9t of CO2 per annum or a total
of 245t over the life of the living roof.
More: The Solution Organisation (2005): Whole Life Costs & Living Roofs
– The Springboard Centre, Bridgewater.
http://www.thesolutionorganisation.com/Living%20roof%20Bridgewater%20
003.pdf
Image: greenroofs.com
32
Social Benefits Environmental Benefits
Health: Access. * Accessible intensive green roofs can
provide stress relief, space for exercise, and improve mental
health. However, access may be restricted. (4,17)
Air Quality. * IGR provide high potential for removing
pollutants from the air. Studies in Chicago have estimated
removal of 50% O3, 27% NO2 and 7% SO2.Through their
mix of different vegetation types, IGR have the potential to
remove 3x as many pollutants in total compared to those
with only grass. Removal depends on season, species, and
local factors. (13, 15, 16, 19)
Surface Water. * Intensive green roofs are considered to
have an attenuation capacity of 90-100%, capturing 70+% of
rainfall volume and delaying peak flows. (2,4,5,6,7,10,16,24)
Fluvial Flood. * Green roofs are unlikely to contribute to
reducing fluvial flooding.
Water Quality. * Overall, they have a positive impact on
water quality. Pollution reduction can exceed 90% for various
metals and phosphorus up to 64%. First flush effects may
occur. (2,4, 5, 13, 16)
Habitat Provision. * Green roofs can provide important
ecological stepping stones and habitats for invertebrates.
Intensive green roofs face more disturbance through
maintenance and use. Ecological potential can be maximised
through the selection of suitable vegetation. (4,6,11)
Climate Regulation. * The carbon sequestration/storage
potential depends on the vegetation used. Additionally, IGR
regulate air temperature – green surface areas can reduce
temperatures by up to 3 degrees. (1,4,8,9,13)
Low Flows. * IGR could even need irrigation and so increase
demand on water resources.
Cultural Benefits Economic Benefits
Aesthetics. * Green roofs can provide the same high
aesthetic benefits as public parks or gardens, however there
is little literature analysing this benefit. (6,23)
Cultural Activities. * Where access is given, these places
can provide settings for social bonding, strengthen
communities and potentially allow cultural activities like
gardening and farming. (6,17)
Property Value. * Studies have mentioned increases in
property value through installation of green roofs but have not
quantified them.
Flood Damage. * By reducing the impermeability of an urban
area, green roofs can help to reduce severity of floods.
Additional Benefits and Potential Costs
Energy saving. Green roofs can reduce temperatures in
buildings (up to 75% reduction in cooling demand shown in
extensive roofs, and higher for intensive). A case study in
Bridgewater, Somerset (see below) estimated a fuel saving of
GBP 5.20/m² per year.
Mental health. Green spaces have positive effects on
physical and mental health that are related to exercise and
the ability to view green/natural areas. Green roofs, can
therefore be a contribution to raising quality of life especially
in highly urbanised areas.
Noise reduction. Green roofs have been shown to reduce
noise. One study has shown a reduction of 8dB.
Education. In highly dense urban environments, accessible
green roofs can provide a safe and convenient outdoor
learning environment that not only gives access to natural
habitats but can also increase focus and wellbeing of
pupils/students.
Aesthetics vs Runoff control – The wish and need to
maintain lush and aesthetically pleasing vegetation can mean
that irrigation and/or fertilisation is necessary during dry
spells. This may decrease the ability to store/absorb
precipitation; increases water consumption and, in the case
of fertilisation, decrease the water quality of the runoff. To
an extent, this can be avoided by coupling water harvesting
systems with green roofs, so that dry periods can be
overcome with water from previous storm events. This also
increases storage capacity of the roof. If designed adequately,
the stored water can even be used to enhance the landscape
by providing aesthetically pleasing water features (blue roof).
*** Indication of confidence. * Literature confirms positive
influence. * Mostly positive results in literature and/or little
literature available. * Varying results in literature, little literature
available
33
References:
(1) Coutts, A.M. et al., 2013. Assessing practical
measures to reduce urban heat: Green and cool
roofs. Building and Environment, 70, pp.266–276.
(2) Czemiel Berndtsson, J., 2010. Green roof
performance towards management of runoff water
quantity and quality: A review. Ecological
Engineering, 36(4), pp.351–360.
A runoff reduction of 27-81% for extensive roofs.
Exact amount depends on rainfall intensity, substrate
and drainage. Runoff water quality varies greatly but
they can contribute significantly to pollutant reduction.
Green roofs can be an effective tool to manage small
storms in urbanised areas, but additional measures
need to be taken for larger storms.
(3) Environment Agency (2015) Cost estimation for
SUDS - summary of evidence. Bristol.
(4) Forest Research, 2010. Benefits of Green
Infrastructure, Farnham: Forest Research.
Extensive green roofs can reduce pollution compared
to convetional roofs. They can reduce runoff by 45%,
and also provide ecological services, being used by
birds and invertebrates.
(5) Glass, C.C., 2007. Green Roof Water Quality and
Quantity Monitoring,
(6) Kellagher, R., Martin, P., Jefferies, C., Bray, R.,
Shaffer, P., Wallingford, H. R., Woods-Ballard, B.,
Woods Ballard, B. (2015) The SUDS manual,
CIRIA. London.
Intensive green roofs require maintenance and are
usually accessible. They provide good contribution to
thermal performance of buildings, as well as good
water retention capacity. Pollution removal is variable.
Can provide great amenity benefits.
(7) Lamera, C. et al., 2013. Green roof impact on the
hydrological cycle components. In EGU 10th
General Assembly. p. 8038.
(8) Lehmann, S., 2014. Low carbon districts: Mitigating
the urban heat island with green roof
infrastructure. City, Culture and Society, 5(1),
pp.1–8
(9) Liu, K.K.Y. & Baskaran, B., 2003. Thermal
performance of green roofs through field
evaluation, Ottawa.
(10) Mentens, J., Raes, D. & Hermy, M., 2006. Green
roofs as a tool for solving the rainwater runoff
problem in the urbanized 21st century? Landscape
and Urban Planning, 77(3), pp.217–226.
(11) Oberndorfer, E., Lundholm, J., Bass, B., Coffmann,
R. R., Doshi, H., Dunnett, N., Gaffin, S., Koehler,
M., Liu, K. K. Y. and Rowe, B. (2007) ‘Green Roofs
as Urban Ecosystems: Ecological Structures,
Functions, and Services’, BioScience. Oxford
University Press, 57(10), p. 823.
(12) Red Rose Forest, 2014. University of Manchester
Green Roof - Green Wall Policy and Guidance,
Manchester.
(13) Rowe, D.B., 2011. Green roofs as a means of
pollution abatement. Environmental pollution,
159(8-9), pp.2100–10.
Comprehensive literature review of peer reviewed
English language literature. Up to 0.5kg of PM/m2 are
removed by grassed green roofs. Intensive roofs reduce
even more – vegetation plays a key role. They can also
sequester carbon, however their construction is often
more carbon intensive than those of conventional roofs.
Green roofs can effectively retain pollutants like heavy
metals by up to 99%, however this depends on their
age, time of year and magnitude of rainfall.
(14) Royal Haskoning DHV, 2012. Costs and Benefits of
Sustainable Drainage Systems,
(15) Speak, A.F. et al., 2012. Urban particulate pollution
reduction by four species of green roof vegetation
in a UK city. Atmospheric Environment, 61,
pp.283–293.
Green roofs can remove 0.425 (sedum roof) to 3.21g
(grass) PM10/m2/a. Intensive roofs have higher
impacts than extensive roofs.
(16) U.S. Environmental Protection Agency, 2008.
Green Roofs. In Reducing Urban Heat Islands:
Compendium of Strategies. Wasington D.C.: U.S.
Environmental Protection Agency.
Studies have shown up to 75% reduction in demand
for cooling, and 10% for heating (both studies carried
out in Canada). They improve air quality by removing
pollutants, studies having shown a removal of 0.2kg of
PM/m2/a. They can also reduce heavy metals in runoff
by up to 95% and reduce peak runoff as well as total
runoff by 50-100%.
(17) Wolch, J.R., Byrne, J. & Newell, J.P., 2014. Urban
green space, public health, and environmental
justice: The challenge of making cities “just green
enough.” Landscape and Urban Planning, 125,
pp.234–244.
(18) Wong, N. H., Tay, S. F., Wong, R., Ong, C. L. and
Sia, A. (2003) ‘Life cycle cost analysis of rooftop
gardens in Singapore’, Building and Environment,
38(3), pp. 499–509.
(19) Yang, J., Yu, Q. & Gong, P., 2008. Quantifying air
pollution removal by green roofs in Chicago.
Atmospheric Environment, 42(31), pp.7266–7273.
(20) www.thegreenroofcentre.co.uk/green_roofs/faq
(21) http://livingroofs.org/
(22) http://www.greenroofguide.co.uk/
(23) Lee, K. E., Williams, K. J. H., Sargent, L. D.,
Williams, N. S. G. and Johnson, K. A. (2015) ‘40-
second green roof views sustain attention: The
role of micro-breaks in attention restoration’,
Journal of Environmental Psychology, 42, 182–189.
(24) Mentens, J., Raes, D. & Hermy, M., 2006. Green
roofs as a tool for solving the rainwater runoff
problem in the urbanized 21st century? Landscape
and Urban Planning, 77(3), pp.217–226.
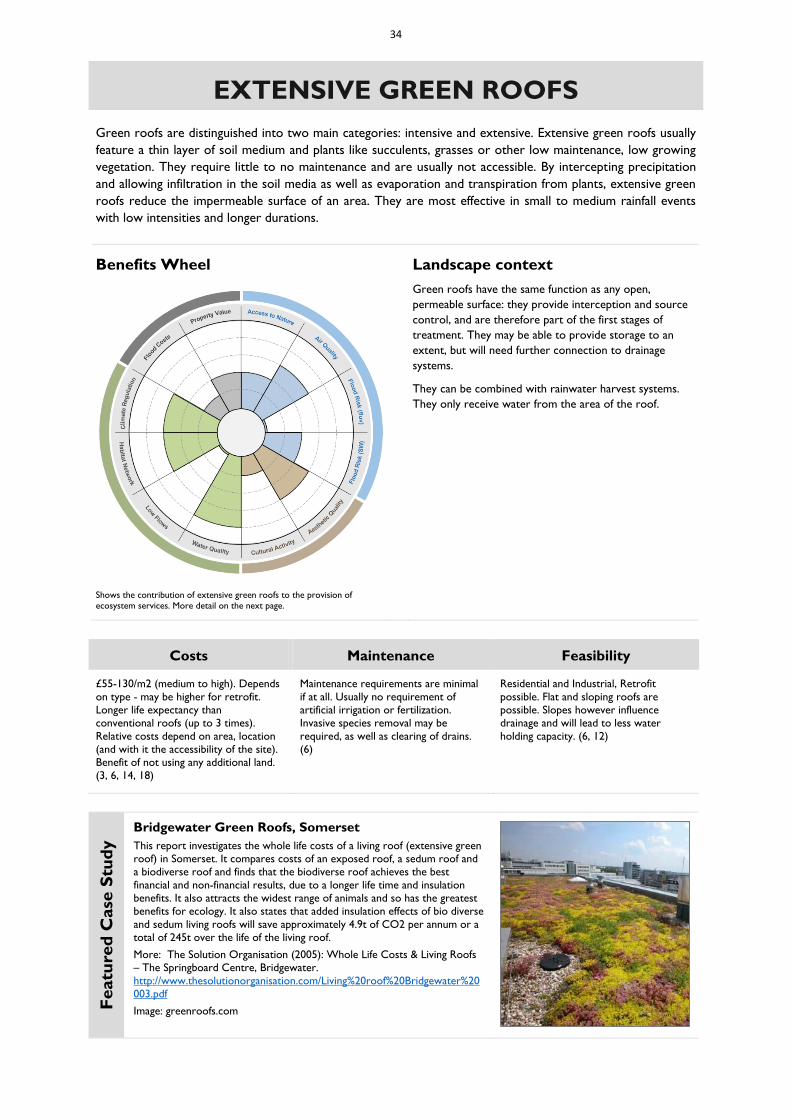
34
EXTENSIVE GREEN ROOFS
Green roofs are distinguished into two main categories: intensive and extensive. Extensive green roofs usually
feature a thin layer of soil medium and plants like succulents, grasses or other low maintenance, low growing
vegetation. They require little to no maintenance and are usually not accessible. By intercepting precipitation
and allowing infiltration in the soil media as well as evaporation and transpiration from plants, extensive green
roofs reduce the impermeable surface of an area. They are most effective in small to medium rainfall events
with low intensities and longer durations.
Benefits Wheel
Landscape context
Shows the contribution of extensive green roofs to the provision of
ecosystem services. More detail on the next page.
Green roofs have the same function as any open,
permeable surface: they provide interception and source
control, and are therefore part of the first stages of
treatment. They may be able to provide storage to an
extent, but will need further connection to drainage
systems.
They can be combined with rainwater harvest systems.
They only receive water from the area of the roof.
Costs Maintenance Feasibility
£55-130/m2 (medium to high). Depends
on type - may be higher for retrofit.
Longer life expectancy than
conventional roofs (up to 3 times).
Relative costs depend on area, location
(and with it the accessibility of the site).
Benefit of not using any additional land.
(3, 6, 14, 18)
Maintenance requirements are minimal
if at all. Usually no requirement of
artificial irrigation or fertilization.
Invasive species removal may be
required, as well as clearing of drains.
(6)
Residential and Industrial, Retrofit
possible. Flat and sloping roofs are
possible. Slopes however influence
drainage and will lead to less water
holding capacity. (6, 12)
Featu
red
Case
Stu
dy
Bridgewater Green Roofs, Somerset
This report investigates the whole life costs of a living roof (extensive green
roof) in Somerset. It compares costs of an exposed roof, a sedum roof and
a biodiverse roof and finds that the biodiverse roof achieves the best
financial and non-financial results, due to a longer life time and insulation
benefits. It also attracts the widest range of animals and so has the greatest
benefits for ecology. It also states that added insulation effects of bio diverse
and sedum living roofs will save approximately 4.9t of CO2 per annum or a
total of 245t over the life of the living roof.
More: The Solution Organisation (2005): Whole Life Costs & Living Roofs
– The Springboard Centre, Bridgewater.
http://www.thesolutionorganisation.com/Living%20roof%20Bridgewater%20
003.pdf
Image: greenroofs.com

35
Social Benefits Environmental Benefits
Health: Access. * Extensive green roofs are usually not
accessible but can provide mental health benefits if they are
visible from other places. (4,17)
Air Quality. * Sedum covered green roofs can remove up
to 200g PM/a/m2 from the atmosphere and provide benefits
through the improvement of air quality. Different types of
vegetation can account for even higher reductions. Studies
have shown that 19m2 of extensive green roof can reduce
pollution by the same amount as a medium sized tree. (13, 15,
16, 19)
Surface Water. * About 50% (27-81%) of runoff can be
retained in small to medium rainfall events by extensive green
roofs, depending on soil thickness and vegetation
characteristics. A study in Brussels has shown that greening
only 10% of possible roofs would lead to overall runoff
reduction of 2.7%. (2, 4, 5, 6, 7, 10, 16)
Fluvial Flood. * Not given.
Water Quality. * The capacity of green roofs to reduce
pollutants is linked to their age (more mature roofs capture
more pollutants), design, season (removal rates are higher in
summer) and species. Overall, they have a positive impact on
water quality. Studies have shown retention of PO4 of up to
80%, and retention of heavy metals of 80-99%. Sedum roofs
are less effective at reducing pollution than herbaceous
perennials. (2,4, 5, 13, 16)
Habitat Provision. * Green roofs can provide important
ecological stepping stones for wildlife and habitats to a number
of even endangered invertebrates. This depends on their
design and species selection as well as maintenance. (4, 6, 11)
Climate Regulation. * Green roofs can reduce
temperatures (up to 75% reduction in cooling demand shown).
They impact positively on the UHI effect by lowering the air
temperature (vegetated areas can decrease air temperatures
by up to 3 degrees). Depending on their vegetation, they can
store and sequester carbon. (1, 4, 8, 9, 13)
Low Flows. * Not given.
Cultural Benefits Economic Benefits
Aesthetics. * Ext. green roofs can be designed to be
aesthetically pleasing.
Cultural Activities. * As they are usually not accessible,
ext. green roofs have little potential to provide cultural
benefits.
Property Value. * Studies have mentioned increases in
property value through installation of green roofs but have not
quantified them.
Flood Damage. * By reducing the impermeability of an urban
area, green roofs can help to reduce severity of floods.
Additional Benefits and Potential Costs
Energy savings. Depending on temperature, green roofs
can provide substantial energy savings by cooling a building in
summer (up to 75%0 and providing isolation in winter (up to
10%). Electricity savings could amount to £5.20/m2/yr. They
could play an important role in adapting cities to climate
change.
Mental health. The view of green roofs can provide
relaxation and restoration and so have beneficial effects on
the mental health of those in vicinity.
Noise reduction. Green roofs can impact on acoustic
transfer into and out of a building.
Water quality. Runoff can include high pollution loads from
green roofs than can either be a symptom of the “first flush”
effect after longer dry periods, due to the vegetation or – in
some cases – fertilization. Care needs to be taken to avoid
this through informed design.
*** Indication of confidence. * Literature confirms positive influence. * Mostly positive results in literature and/or little literature
available. * Varying results in literature, little literature available
36
References:
(1) Coutts, A.M. et al., 2013. Assessing practical
measures to reduce urban heat: Green and cool
roofs. Building and Environment, 70, pp.266–276.
(2) Czemiel Berndtsson, J., 2010. Green roof
performance towards management of runoff water
quantity and quality: A review. Ecological
Engineering, 36(4), pp.351–360.
Numerous studies show a runoff reduction of 27-81%
for extensive roofs. Exact amount depends on rainfall
intensity, substrate and drainage. Runoff water quality
varies greatly but they can contribute significantly to
pollutant reduction. Green roofs can be an effective
tool to manage small storms in urban areas, but
additional measures required for larger storms.
(3) Environment Agency (2015) Cost estimation for
SUDS - summary of evidence. Bristol.
(4) Forest Research, 2010. Benefits of Green
Infrastructure, Farnham: Forest Research.
Extensive green roofs can reduce pollution compared
to convetional roofs. They can reduce runoff by 45%,
and also provide ecological services, being used by
birds and invertebrates.
(5) Glass, C.C., 2007. Green Roof Water Quality and
Quantity Monitoring,
(6) Kellagher, R., Martin, P., Jefferies, C., Bray, R.,
Shaffer, P., Wallingford, H. R., Woods-Ballard, B.,
Woods Ballard, B. (2015) The SUDS manual,
CIRIA. London.
Intensive green roofs require maintenance and are
usually accessible. They provide good contribution to
thermal performance of buildings, as well as good
water retention capacity. Pollution removal is variable.
Can provide great amenity benefits.
(7) Lamera, C. et al., 2013. Green roof impact on the
hydrological cycle components. In EGU 10th
General Assembly. p. 8038.
(8) Lehmann, S., 2014. Low carbon districts: Mitigating
the urban heat island with green roof
infrastructure. City, Culture and Society, 5(1),
pp.1–8
(9) Liu, K.K.Y. & Baskaran, B., 2003. Thermal
performance of green roofs through field
evaluation, Ottawa.
(10) Mentens, J., Raes, D. & Hermy, M., 2006. Green
roofs as a tool for solving the rainwater runoff
problem in the urbanized 21st century? Landscape
and Urban Planning, 77(3), pp.217–226.
(11) Oberndorfer, E., Lundholm, J., Bass, B., Coffmann,
R. R., Doshi, H., Dunnett, N., Gaffin, S., Koehler,
M., Liu, K. K. Y. and Rowe, B. (2007) ‘Green Roofs
as Urban Ecosystems: Ecological Structures,
Functions, and Services’, BioScience. Oxford
University Press, 57(10), p. 823.
(12) Red Rose Forest, 2014. University of Manchester
Green Roof - Green Wall Policy and Guidance,
Manchester.
(13) Rowe, D.B., 2011. Green roofs as a means of
pollution abatement. Environmental pollution,
159(8-9), pp.2100–10.
Comprehensive literature review of peer reviewed
English language literature. Up to 0.5kg of PM/m2 are
removed by grassed green roofs. Intensive roofs reduce
even more – vegetation plays a key role. They can also
sequester carbon, however their construction is often
more carbon intensive than those of conventional roofs.
Green roofs can effectively retain pollutants like heavy
metals by up to 99%, however this depends on their
age, time of year and magnitude of rainfall.
(14) Royal Haskoning DHV, 2012. Costs and Benefits of
Sustainable Drainage Systems,
(15) Speak, A.F. et al., 2012. Urban particulate pollution
reduction by four species of green roof vegetation
in a UK city. Atmospheric Environment, 61,
pp.283–293.
Green roofs can remove 0.425 (sedum roof) to 3.21g
(grass) PM10/m2/a. Intensive roofs have higher
impacts than extensive roofs.
(16) U.S. Environmental Protection Agency, 2008.
Green Roofs. In Reducing Urban Heat Islands:
Compendium of Strategies. Wasington D.C.: U.S.
Environmental Protection Agency.
Extensive green roofs reduce runoff by 50-75%.
Studies have shown up to 75% reduction in demand
for cooling, and 10% for heating (both studies carried
out in Canada). They improve air quality by removing
pollutants, studies having shown a removal of 0.2kg of
PM/m2/a. They can also reduce heavy metals in runoff
by up to 95% and reduce peak runoff as well as total
runoff by 50-100%.
(17) Wolch, J.R., Byrne, J. & Newell, J.P., 2014. Urban
green space, public health, and environmental
justice: The challenge of making cities “just green
enough.” Landscape and Urban Planning, 125,
pp.234–244.
(18) Wong, N. H., Tay, S. F., Wong, R., Ong, C. L. and
Sia, A. (2003) ‘Life cycle cost analysis of rooftop
gardens in Singapore’, Building and Environment,
38(3), pp. 499–509.
(19) Yang, J., Yu, Q. & Gong, P., 2008. Quantifying air
pollution removal by green roofs in Chicago.
Atmospheric Environment, 42(31), pp.7266–7273.
(20) http://www.thegreenroofcentre.co.uk/green_roofs/
faq
(21) http://livingroofs.org/
(22) http://www.greenroofguide.co.uk/
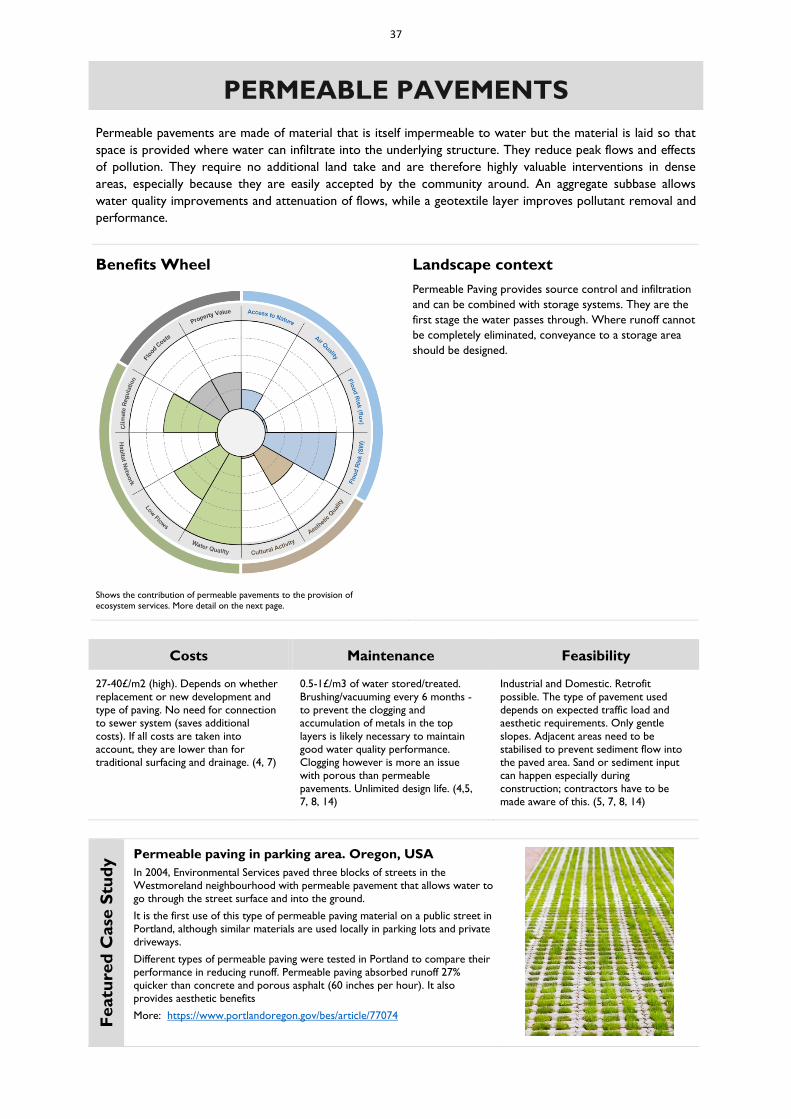
37
PERMEABLE PAVEMENTS
Permeable pavements are made of material that is itself impermeable to water but the material is laid so that
space is provided where water can infiltrate into the underlying structure. They reduce peak flows and effects
of pollution. They require no additional land take and are therefore highly valuable interventions in dense
areas, especially because they are easily accepted by the community around. An aggregate subbase allows
water quality improvements and attenuation of flows, while a geotextile layer improves pollutant removal and
performance.
Benefits Wheel
Landscape context
Shows the contribution of permeable pavements to the provision of
ecosystem services. More detail on the next page.
Permeable Paving provides source control and infiltration
and can be combined with storage systems. They are the
first stage the water passes through. Where runoff cannot
be completely eliminated, conveyance to a storage area
should be designed.
Costs Maintenance Feasibility
27-40£/m2 (high). Depends on whether
replacement or new development and
type of paving. No need for connection
to sewer system (saves additional
costs). If all costs are taken into
account, they are lower than for
traditional surfacing and drainage. (4, 7)
0.5-1£/m3 of water stored/treated.
Brushing/vacuuming every 6 months -
to prevent the clogging and
accumulation of metals in the top
layers is likely necessary to maintain
good water quality performance.
Clogging however is more an issue
with porous than permeable
pavements. Unlimited design life. (4,5,
7, 8, 14)
Industrial and Domestic. Retrofit
possible. The type of pavement used
depends on expected traffic load and
aesthetic requirements. Only gentle
slopes. Adjacent areas need to be
stabilised to prevent sediment flow into
the paved area. Sand or sediment input
can happen especially during
construction; contractors have to be
made aware of this. (5, 7, 8, 14)
Featu
red
Case
Stu
dy
Permeable paving in parking area. Oregon, USA
In 2004, Environmental Services paved three blocks of streets in the
Westmoreland neighbourhood with permeable pavement that allows water to
go through the street surface and into the ground.
It is the first use of this type of permeable paving material on a public street in
Portland, although similar materials are used locally in parking lots and private
driveways.
Different types of permeable paving were tested in Portland to compare their
performance in reducing runoff. Permeable paving absorbed runoff 27%
quicker than concrete and porous asphalt (60 inches per hour). It also
provides aesthetic benefits
More: https://www.portlandoregon.gov/bes/article/77074

38
Social Benefits Environmental Benefits
Health: Access. * Can be used in multifunctional areas but
does not provide same benefits as greenspace. Can provide
area for recreational use. (8,15, 14)
Air Quality. Not given.
Surface Water. * 40% more effective peak flow reduction
than conventional pavements, other studies have found runoff
reductions of up to 100%, treating the paved area and to an
extent even runoff from adjacent areas. Runoff generation can
be eliminated. (1, 2, 3, 6, 9, 10, 13, 14)
Fluvial Flood. * Can provide flood prevention downstream
by reducing runoff into rivers.
Water Quality. * Pollutant reductions are very high but can
depend on maintenance. TSS reductions of >60% (58-94),
motor oil, diesel and metals (20-99) can be (nearly) completely
removed. N and P have varying degrees of removal, dependent
on the design of the structure (below ground infiltration). (1,
2, 6, 10, 12)
Habitat Provision. Not given.
Climate Regulation. * Potential to mitigate UHI through
evaporation and storage of water but this depends on various
factors. If combined with other technologies (see below) may
help to reduce emissions. (11, 12, 14)
Low Flows. * Permeable pavements can potentially allow
groundwater recharge and combined with rainwater
harvesting reduce pressure on mains water. (8)
Cultural Benefits Economic Benefits
Aesthetics. * May allow grass to grow, creating attractive
green area where otherwise only paving would be present.
Depends on type of pavement used. (7,15)
Cultural Activities. Not given.
Property Value. * Depending on type and quality may add
value. (14)
Flood Damage. * Taking up water from their own area and
surrounding areas can help reduce the risk of flooding and the
extent of flooding on a larger scale.
Additional Benefits and Potential Costs
Water re-use potential –There is high potential of
combination with RWH systems that allow using the water
for non-potable uses. The combination with geothermal heat
pumps (GHPs) enables re-use of water (e.g. for gardening)
along with energy efficient heating/cooling of buildings. This
of course depends on the site context but can provide
sustainable heating without need for fossil fuels (therefore
reducing emissions).
Multi-functionality – Paved surface enables safe and
comfortable use for vehicles and pedestrians while allowing
infiltration and benefitting vegetation, providing treatment
and flow management. While it is not a greenspace itself, it
can improve the accessibility of greenspaces by providing
convenient, safe paths through existing green infrastructure
that integrate well with the landscape.
No additional impacts
*** Indication of confidence. * Literature confirms positive
influence. * Mostly positive results in literature and/or little
literature available. * Varying results in literature, little literature
available
39
References:
(1) Ahiablame, L. M., Engel, B. A. and Chaubey, I.
(2012) ‘Effectiveness of Low Impact Development
Practices: Literature Review and Suggestions for
Future Research’, Water, Air, & Soil Pollution,
223(7), pp. 4253–4273.
Studies show runoff reductions by 50-93%, with
pollutant removal for various substances ranging
from 20-99%(metals), 58-94%(TSS), 75-85%(N)
and 10-78%(P). Runoff generation can be
eliminated, PPS are therefore a valuable source
control system.
(2) Ashley, R. M., Nowell, R., Gersonius, B. and
Walker, L. (2011) ‘Surface Water Management and
Urban Green Infrastructure’, 44(0), pp. 1–76.
(3) Booth, D.B. & Leavitt, J., (1999) Field Evaluation of
Permeable Pavement Systems for Improved
Stormwater Management. Journal of the American
Planning Association, 65(3), pp.314–325.
(4) Environment Agency (2015) Cost estimation for
SUDS - summary of evidence. Bristol.
(5) Harley, M. & Jenkins, C., (2014). Research to
ascertain the proportion of block paving sales in
England that are permeable, Report for the Sub-
Committee of the Committee on Climate Change.
(6) Imran, H.M., Akib, S. & Karim, M.R., (2013).
Permeable pavement and stormwater management
systems: a review. Environmental technology, 34(17-
20), pp.2649–56.
(7) Interpave, (2008). Understanding Permeable Paving,
Leicester.
Design guidance and description of various available
systems and performances.
(8) Kellagher, R., Martin, P., Jefferies, C., Bray, R.,
Shaffer, P., Wallingford, H. R., Woods-Ballard, B.,
Woods Ballard, B. (2015) The SUDS manual,
CIRIA. London.
(9) Qin, H., Li, Z. & Fu, G., (2013). The effects of low
impact development on urban flooding under
different rainfall characteristics. Journal of
environmental management, 129, pp.577–85.
Runoff reduction of 75% on average through permeable
pavement. Best for smaller storms with short
durations, with peaks in the middle of the event.
(10) Scholz, M. & Grabowiecki, P., (2007). Review of
permeable pavement systems. Building and
Environment, 42(11), pp.3830–3836.
Permeable and porous pavements provide 10-42% more
effective peak flow reduction compared to
conventional asphalts. They provide good water
quality treatment with TSS reductions of about
60% and nearly complete removal of motor oil,
diesel and metals.
(11) Starke, P., Goebel, P. & Coldewey, W., (2010).
Urban evaporation rates for water-permeable
pavements. Water Sci Technol, 62(5), pp.1161–9.
(12) Tota‐Maharaj, K. et al., (2010). The synergy of
permeable pavements and geothermal heat pumps
for stormwater treatment and reuse. Environmental
Technology, 31 (14), pp. 1517-31.
(13) U.S. Environmental Protection Agency (2013).
Stormwater to Street Trees. Washington: USEPA.
(14) Royal Horticultural Society (2016): Front gardens:
permeable paving.
(15) http://www.susdrain.org/delivering-suds/using-
suds/suds-components/source-control/pervious-
surfaces/pervious-surfaces-overview.html
40
RAINWATER HARVESTING/WATER BUTTS
By collecting water from impermeable surfaces, rainwater harvesting can reduce the volume of runoff and peak
flows and so have a positive impact on surface water flooding. It can vary in scale from single water butts
installed on private properties to underground storage tanks on commercial areas. Costs and effectiveness of
the intervention depend on its scale and design, but benefits from reduced runoff are only significant for larger
systems.
Benefits Wheel
Landscape context
Shows the contribution of rainwater harvesting to the provision of
ecosystem services. More detail on the next page.
Rainwater Harvesting acts as source control and storage.
It prevents runoff by taking it up at its source. In one
year, it is estimated that 24,000l can on average be saved
from a roof in the UK, preventing this additional runoff.
Once RWH systems have reached their capacity, they
cannot contribute any more to reducing runoff. Ways of
dealing with overflows have to be incorporated – this
could be infiltration systems like Rain Gardens, for
example, taking up water spilling out of water butt
outlets.
The impact of RWH is mostly realised on a local scale,
but cumulative effects where RWH is implemented on as
many properties as possible are to be expected.
Costs Maintenance Feasibility
£10+ for water butts, £2000-4000 for a
complete domestic system. Retrofit is
possible but likely more expensive for
entire systems. Depends on scale and
type of the system (e.g. gravity fed or
pump system) and existing connections.
Costs: £0.1-0.4 per m2 (4,7)
Typical maintenance activities: cleaning
and inspection. Depends on context
and type of system.
Context: Residential, Industrial. Retrofit
and use in high density urban areas
possible.
Connection to rainwater pipes is
necessary. More water is collected from
sloping roofs. (7)
Featu
red
Case
Stu
dy
Rainwater Harvesting at Calke Abbey, National
Trust
With total costs of £11,181.86, the National Trust installed a
Rainwater Harvesting System on its property in Calke Abbey to
reduce pressures on mains water and make use of the relatively
high volumes of rainfall. Estimated savings from mains water use
are £625 per year at the moment, and the harvested rainwater is
now the main supply for garden irrigation where previously mains
water was used.
More: https://www.nationaltrust.org.uk/calke-
abbey/documents/calke-abbey---building-design-guide.pdf
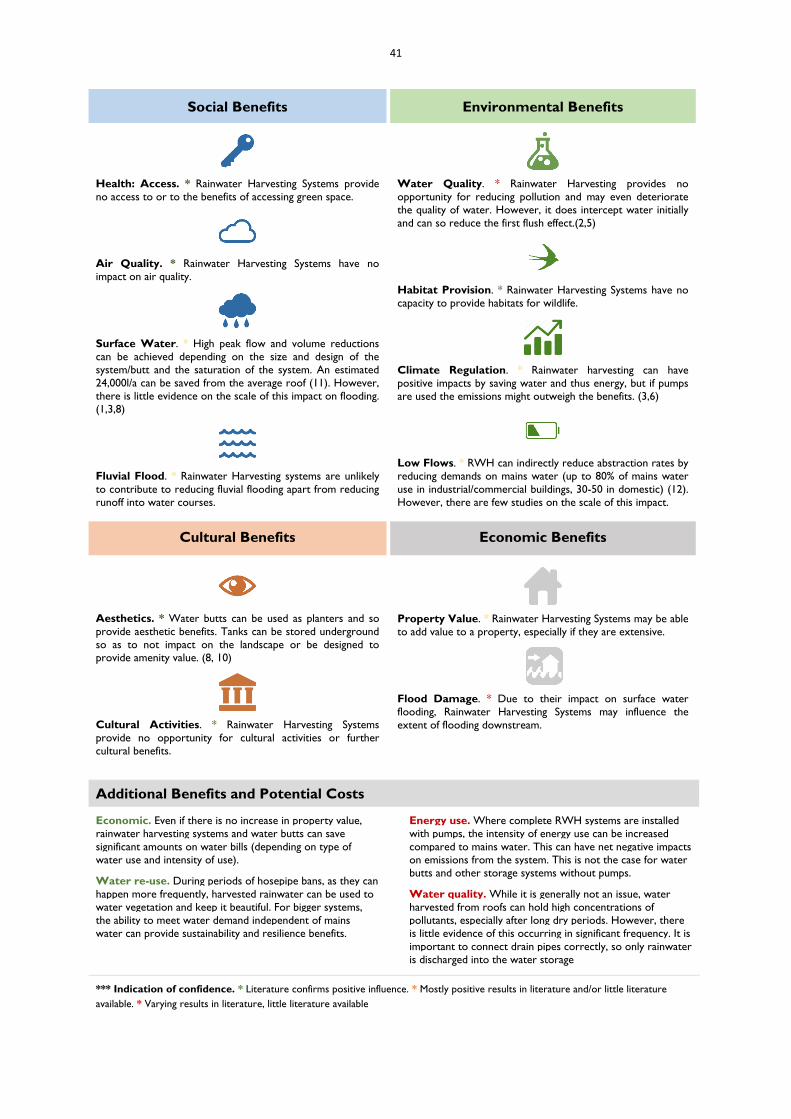
41
Social Benefits Environmental Benefits
Health: Access. * Rainwater Harvesting Systems provide
no access to or to the benefits of accessing green space.
Air Quality. * Rainwater Harvesting Systems have no
impact on air quality.
Surface Water. * High peak flow and volume reductions
can be achieved depending on the size and design of the
system/butt and the saturation of the system. An estimated
24,000l/a can be saved from the average roof (11). However,
there is little evidence on the scale of this impact on flooding.
(1,3,8)
Fluvial Flood. * Rainwater Harvesting systems are unlikely
to contribute to reducing fluvial flooding apart from reducing
runoff into water courses.
Water Quality. * Rainwater Harvesting provides no
opportunity for reducing pollution and may even deteriorate
the quality of water. However, it does intercept water initially
and can so reduce the first flush effect.(2,5)
Habitat Provision. * Rainwater Harvesting Systems have no
capacity to provide habitats for wildlife.
Climate Regulation. * Rainwater harvesting can have
positive impacts by saving water and thus energy, but if pumps
are used the emissions might outweigh the benefits. (3,6)
Low Flows. * RWH can indirectly reduce abstraction rates by
reducing demands on mains water (up to 80% of mains water
use in industrial/commercial buildings, 30-50 in domestic) (12).
However, there are few studies on the scale of this impact.
Cultural Benefits Economic Benefits
Aesthetics. * Water butts can be used as planters and so
provide aesthetic benefits. Tanks can be stored underground
so as to not impact on the landscape or be designed to
provide amenity value. (8, 10)
Cultural Activities. * Rainwater Harvesting Systems
provide no opportunity for cultural activities or further
cultural benefits.
Property Value. * Rainwater Harvesting Systems may be able
to add value to a property, especially if they are extensive.
Flood Damage. * Due to their impact on surface water
flooding, Rainwater Harvesting Systems may influence the
extent of flooding downstream.
Additional Benefits and Potential Costs
Economic. Even if there is no increase in property value,
rainwater harvesting systems and water butts can save
significant amounts on water bills (depending on type of
water use and intensity of use).
Water re-use. During periods of hosepipe bans, as they can
happen more frequently, harvested rainwater can be used to
water vegetation and keep it beautiful. For bigger systems,
the ability to meet water demand independent of mains
water can provide sustainability and resilience benefits.
Energy use. Where complete RWH systems are installed
with pumps, the intensity of energy use can be increased
compared to mains water. This can have net negative impacts
on emissions from the system. This is not the case for water
butts and other storage systems without pumps.
Water quality. While it is generally not an issue, water
harvested from roofs can hold high concentrations of
pollutants, especially after long dry periods. However, there
is little evidence of this occurring in significant frequency. It is
important to connect drain pipes correctly, so only rainwater
is discharged into the water storage
*** Indication of confidence. * Literature confirms positive influence. * Mostly positive results in literature and/or little literature
available. * Varying results in literature, little literature available
42
References:
(1) Ashley, R. M., Nowell, R., Gersonius, B., & Walker,
L. (2011). Surface Water Management and Urban
Green Infrastructure, 44(0), 1–76.
(2) Berwick, N., & Wade, D. R. (2013). A Critical
Review of Urban Diffuse Pollution Control :
Methodologies to Identify Sources , Pathways and
Mitigation Measures with Multiple Benefits.
(3) CIRIA. (2014). Demonstrating the multiple benefits
of SuDS - a business case.
(4) Environment Agency. (2015). Cost estimation for
SUDS - summary of evidence. Bristol.
(5) Helmreich, B., & Horn, H. (2009). Opportunities in
rainwater harvesting. Desalination, 248(1-3), 118–
124.
(6) Parkes, C., Kershaw, H,, Hart, J. Sibille, R., Grant,
Z (2010):Energy and carbon implications of
rainwater harvesting and greywater recycling.
Bristol: Environment Agency.
(7) Woods Ballard, B., Wilson, S., Udale-Clarke, H.,
Illman, S., Ahsley, R., Kellagher, R. (2015): The
Suds Manual. London: CIRIA.
(8) Susdrain (2016):
http://www.susdrain.org/delivering-suds/using-
suds/suds-components/source-control/rainwater-
harvesting.html
(9) Savetherain.info (2016):
http://www.savetherain.info/media-
centre/rainwater-harvesting-faa qs.aspx
(10) Rainwaterharvesting Ltd (2016):
http://www.rainwaterharvesting.co.uk/rainwaterhar
vesting-simple-guide.php
(11) BBC (2016)
http://www.bbc.co.uk/gardening/basics/techniques/
watering_savingwater1.shtml
(12) YouGen.co.uk (2016), Rain harvesting
http://www.yougen.co.uk/energy-
saving/Rain+Harvesting/.
43
EXISTING GREEN & BLUE
INFRASTRUCTURE
Image: Craig Boney (CC BY-NC-ND 2.0)
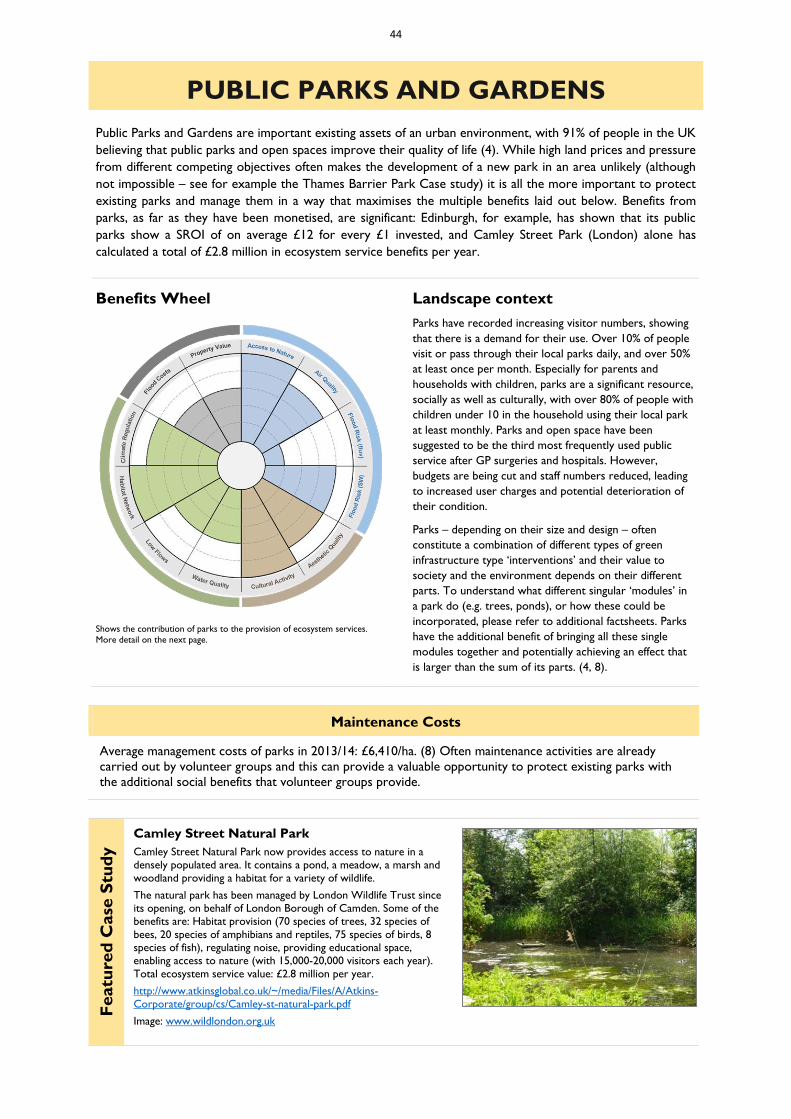
44
PUBLIC PARKS AND GARDENS
Public Parks and Gardens are important existing assets of an urban environment, with 91% of people in the UK
believing that public parks and open spaces improve their quality of life (4). While high land prices and pressure
from different competing objectives often makes the development of a new park in an area unlikely (although
not impossible – see for example the Thames Barrier Park Case study) it is all the more important to protect
existing parks and manage them in a way that maximises the multiple benefits laid out below. Benefits from
parks, as far as they have been monetised, are significant: Edinburgh, for example, has shown that its public
parks show a SROI of on average £12 for every £1 invested, and Camley Street Park (London) alone has
calculated a total of £2.8 million in ecosystem service benefits per year.
Benefits Wheel
Landscape context
Shows the contribution of parks to the provision of ecosystem services.
More detail on the next page.
Parks have recorded increasing visitor numbers, showing
that there is a demand for their use. Over 10% of people
visit or pass through their local parks daily, and over 50%
at least once per month. Especially for parents and
households with children, parks are a significant resource,
socially as well as culturally, with over 80% of people with
children under 10 in the household using their local park
at least monthly. Parks and open space have been
suggested to be the third most frequently used public
service after GP surgeries and hospitals. However,
budgets are being cut and staff numbers reduced, leading
to increased user charges and potential deterioration of
their condition.
Parks – depending on their size and design – often
constitute a combination of different types of green
infrastructure type ‘interventions’ and their value to
society and the environment depends on their different
parts. To understand what different singular ‘modules’ in
a park do (e.g. trees, ponds), or how these could be
incorporated, please refer to additional factsheets. Parks
have the additional benefit of bringing all these single
modules together and potentially achieving an effect that
is larger than the sum of its parts. (4, 8).
Maintenance Costs
Average management costs of parks in 2013/14: £6,410/ha. (8) Often maintenance activities are already
carried out by volunteer groups and this can provide a valuable opportunity to protect existing parks with
the additional social benefits that volunteer groups provide.
Featu
red
Case
Stu
dy
Camley Street Natural Park
Camley Street Natural Park now provides access to nature in a
densely populated area. It contains a pond, a meadow, a marsh and
woodland providing a habitat for a variety of wildlife.
The natural park has been managed by London Wildlife Trust since
its opening, on behalf of London Borough of Camden. Some of the
benefits are: Habitat provision (70 species of trees, 32 species of
bees, 20 species of amphibians and reptiles, 75 species of birds, 8
species of fish), regulating noise, providing educational space,
enabling access to nature (with 15,000-20,000 visitors each year).
Total ecosystem service value: £2.8 million per year.
http://www.atkinsglobal.co.uk/~/media/Files/A/Atkins-
Corporate/group/cs/Camley-st-natural-park.pdf
Image: www.wildlondon.org.uk
45
Social Benefits Environmental Benefits
Health: Access. * A greater quantity of urban green space is
generally associated with better health. The “healthiest” areas
in England (i.e. with the higher levels of activity and lowest
levels of obesity) have 20% higher green spaces than the least
healthy areas. Being exposed to park settings has also been
linked to better attention performance, reduced
cardiovascular morbidity in males and better recovery rates.
However, even though a lot of evidence points to this
positive link, there are diverse results in the literature –
which possibly points to the importance of park design in
enabling the provision of benefits. (2,4,5,6,9,10,12,13,14,20)
Air Quality. * While research focusing on parks specifically
is limited, it is clear that trees have a big impact on air quality.
Air quality within parks is often better than outside, as are air
temperatures. This is true for PM10 but also other pollutants
like NOx and SOx. (2, 6, 10, 18, 20)
Surface Water. * Due to high infiltration rates, grassed
areas are able to nearly completely eliminate runoff, therefore
having a positive impact on surface water flooding. In
Manchester areas with less green space are more susceptible
to surface water flooding. The effect however depends on
type of vegetation and intensity/duration or rainfall as well as
factors like soil type and compaction. (2, 9, 15, 16, 18)
Fluvial Flood. * To an extent, parks can provide flood
storage if they are designed to do so, and this should be taken
into account when designing new parks as well as when
existing ones are restored or redeveloped. (18)
Water Quality. * Through water infiltration, parks can
prevent pollutants from reaching waterbodies and streams.
Fertilization and pesticide use however can have a negative
impact. (2, 16, 18)
Habitat Provision. * Often, parks have been found to be the
most biodiverse type of urban of green space. However, this
can be due to exotic species. Larger, more diverse and less
isolated parks harbour more native species. (2,3, 16, 17, 20,
22)
Climate Regulation. * Parks, especially those with high tree
cover, can act as carbon sinks. A study in Leicester has shown
that 97.3% of the carbon pool stored in urban vegetation is
stored in trees. Parks provide resilience against increasing
temperatures and the UHI effect. Air temperatures in London
have been shown to be 2-8 degrees lower in greenspaces. This
could mean that the current provision on green space in
London saves 16-22 lives per day during heatwaves. Parks can
influence the air quality in surrounding areas as the
temperature difference can lead to “park breeze” into
surrounding built up areas. (1,2, 6, 7, 9, 18, 20)
Low Flows. * Parks have been shown to contribute
significantly to groundwater recharge due to their high
infiltration rates (over 30%). Grassed areas are able to nearly
completely eliminate runoff. (9,16)
Cultural Benefits Economic Benefits
Aesthetics. * The aesthetic value of parks can be very high
and is for example shown through their impact on property
values as well as stress and mental fatigue. A study in Zurich
found parks and urban forests to be associated with an 87%
recovery ration for stress and 40% enhancement of positive
feelings. Some studies show these benefits even from just
viewing green space (2, 19)
Cultural Activities. * Many parks provide venues for
annual festivals, meeting spaces for community groups and
therefore add to the cultural service provision in an area.
Parks, as accessible local green spaces, can give rise to
cultural activities like bird watching, painting or
photography. (2,4, 6, 20)
Property Value. * There are wide ranges between different
cities and countries but parks almost always have a positive
impact on property values. While park size is a factor, even
small parks can have an impact. (e.g. a study in the
Netherlands has shown an increase in 5-12% for houses
overlooking attractive areas, and 6-12% for houses
overlooking open spaces) (2, 11, 18, 20)
Flood Damage. * Due to their impact on surface water
and their potential contribution to mitigating fluvial flooding,
parks can reduce severity of flooding and the damage caused
by it.
46
Additional Benefits and Potential Costs
Crime: Higher levels of high quality green space provision
are correlated with lower crimes. Apart from the economic
benefits, this means a positive impact on the community and
the mental wellbeing of residents. Studies in the US have
shown more than 25% reduced crime rates and aggressive
behaviour in areas with green space provision than in those
with less. This seems to be due to the environment deterring
criminal activity by increasing use of the space and natural
surveillance, but also to green space preventing mental
fatigue. (4,9, 21)
Local Economy: Small businesses are more likely to settle
in areas with good parks, open spaces and recreational areas.
Visitor spending has been shown to be higher in attractive
areas, and while this is not specific to parks, they are often
connected to shopping trips in one way or another. (9, 18)
Mental health Parks provide important mental health
benefits by offering somewhere to escape from daily life,
exercise and build a connection with nature. 30% lower
depression rates in areas with higher greenspace have been
shown. Biodiversity has also been shown to impact on the
psychological benefit of visiting parks, with the species
richness being more important than the area of the green
space. A study in Bristol has shown that children are more
likely to engage in active play in areas with green spaces. A
study in Greenwich showed that dissatisfaction with urban
green space is related to poor mental health. (4, 8, 9)
Social Cohesion: A study in Vienna has shown an increased
“attachment” to an area in places with a perceived higher
supply and quality of greenspace. There is evidence showing
that particularly if teenagers are catered for with specific
facilities and equipment, parks have the potential to cater for
multiple ethnic groups, potentially improving social cohesion
in the neighbourhood. (4,9,20)
Crime: Poor quality green space can actually enforce
antisocial behaviour. Parks that are not maintained well can
become hotspots for crime and vandalism, and lead to
perceptions of unsafety.
Property value: As with crime, poor quality green space
can actually have the reverse effect of what it is meant to
achieve and reduce values of properties where it is perceived
to be an unsafe area.
*** Indication of confidence. * Literature confirms positive influence. * Mostly positive results in literature and/or little literature
available. * Varying results in literature, little literature available
References:
(1) Armson, D., P. Stringer, and A.R. Ennos. 2012.
“The Effect of Tree Shade and Grass on Surface
and Globe Temperatures in an Urban Area.”
Urban Forestry & Urban Greening 11 (3): 245–55.
(2) BOP Consulting. 2013. “Green Spaces: The
Benefits for London.”
(3) Chamberlain, D.E., S. Gough, H. Vaughan, J.A.
Vickery, and G.F. Appleton. 2007. “Determinants
of Bird Species Richness in Public Green Spaces:
Capsule Bird Species Richness Showed Consistent
Positive Correlations with Site Area and Rough
Grass.” Bird Study 54 (1). Taylor & Francis Group:
87–97.
(4) Commission for Architecture and the Built
Environment. 2005. “Decent Parks? Decent
Behaviour? The Link between the Quality of Parks
and User Behaviour” 1–17.
(5) Coombes, Emma, Andrew P Jones, and Melvyn
Hillsdon. 2010. “The Relationship of Physical
Activity and Overweight to Objectively Measured
Green Space Accessibility and Use.” Social Science
& Medicine (1982) 70 (6): 816–22.
(6) Faculty of Public Health. 2010. “Great Outdoors:
How Our Natural Health Service Uses Green
Space To Improve Wellbeing”.
(7) Forestry Commission. 2013. “Air Temperature
Regulation by Urban Trees and Green
Infrastructure.” Farnham.
(8) Heritage Lottery Fund. 2014. “State of UK Public
Parks.” London.
(9) Konijnendijk, Cecil C, Matilda Annerstedt, Anders
Busse Nielsen, and Sreetheran Maruthaveeran.
2013. “Benefits of Urban Parks. A Systematic
Review.” Copenhagen&Alnarp.
(10) Lovasi, G S, J W Quinn, K M Neckerman, M S
Perzanowski, and A Rundle. 2008. “Children Living
in Areas with More Street Trees Have Lower
Prevalence of Asthma.” Journal of Epidemiology
and Community Health 62 (7): 647–49.
(11) Luttik, Joke. 2000. “The Value of Trees, Water and
Open Space as Reflected by House Prices in the
Netherlands.” Landscape and Urban Planning 48
(3-4): 161–67.
47
(12) McCormack, Gavin R, Melanie Rock, Ann M
Toohey, and Danica Hignell. 2010. “Characteristics
of Urban Parks Associated with Park Use and
Physical Activity: A Review of Qualitative
Research.” Health & Place 16 (4): 712–26.
(13) Mitchell, Richard, and Frank Popham. 2007.
“Greenspace, Urbanity and Health: Relationships
in England.” Journal of Epidemiology and
Community Health 61 (8): 681–83.
(14) Richardson, Elizabeth A, and Richard Mitchell.
2010. “Gender Differences in Relationships
between Urban Green Space and Health in the
United Kingdom.” Social Science & Medicine
(1982) 71 (3): 568–75.
(15) Rogers, K., Jaluzot, A. and Neilan, C. (2011) Green
Benefits in Victoria Business Improvement District.
(16) Speak, A. F., Mizgajski, A. and Borysiak, J. (2015)
‘Allotment gardens and parks: Provision of
ecosystem services with an emphasis on
biodiversity’, Urban Forestry & Urban Greening,
14(4), pp. 772–781.
(17) Stagoll, Karen, David B. Lindenmayer, Emma
Knight, Joern Fischer, and Adrian D. Manning.
2012. “Large Trees Are Keystone Structures in
Urban Parks.” Conservation Letters 5 (2): 115–22.
(18) Sunderland, T. 2012. “Microeconomic Evidence for
the Benefits of Investment in the Environment -
Review.” Natural England Research Reports,
Number 033. Vol. 2.
(19) Tyrväinen, Liisa, Ann Ojala, Kalevi Korpela, Timo
Lanki, Yuko Tsunetsugu, and Takahide Kagawa.
2014. “The Influence of Urban Green
Environments on Stress Relief Measures: A Field
Experiment.” Journal of Environmental Psychology
38 (June): 1–9.
(20) Woolley, Helen, Sian Rose, Matthew Carmona,
and Jonathan Freedman. 2004. “The Value of
Public Space.” Exchange Organizational Behavior
Teaching Journal. London.
(21) Kuo, F. E. and Sullivan, W. C. (2001) ‘Environment
and Crime in the Inner City: Does Vegetation
Reduce Crime?’, Environment and Behavior, 33(3),
pp. 343–367.
(22) Forestry Commission. Benefits of Greenspace:
Park and Garden Habitats.
http://www.forestry.gov.uk/fr/urgc-7edjrw
Web references and useful weblinks:
American Planning Association: How Cities Use Parks
for Green Infrastructure, Briefing Paper.
https://www.planning.org/cityparks/briefingpapers/greeni
nfrastructure.htm
National Recreation and Park Association: Pocket Parks
https://www.nrpa.org/uploadedFiles/nrpaorg/Grants_and
_Partners/Recreation_and_Health/Resources/Issue_Brie
fs/Pocket-Parks.pdf
Forest Research: Greenspace initiatives. Urban Parks
and Gardens: http://www.forestry.gov.uk/fr/urgc-7ekebr
Greenspace Scotland.: http://greenspacescotland.org.uk/
Big Lottery Fund. Parks for People Funding:
https://www.biglotteryfund.org.uk/prog_parks_people.
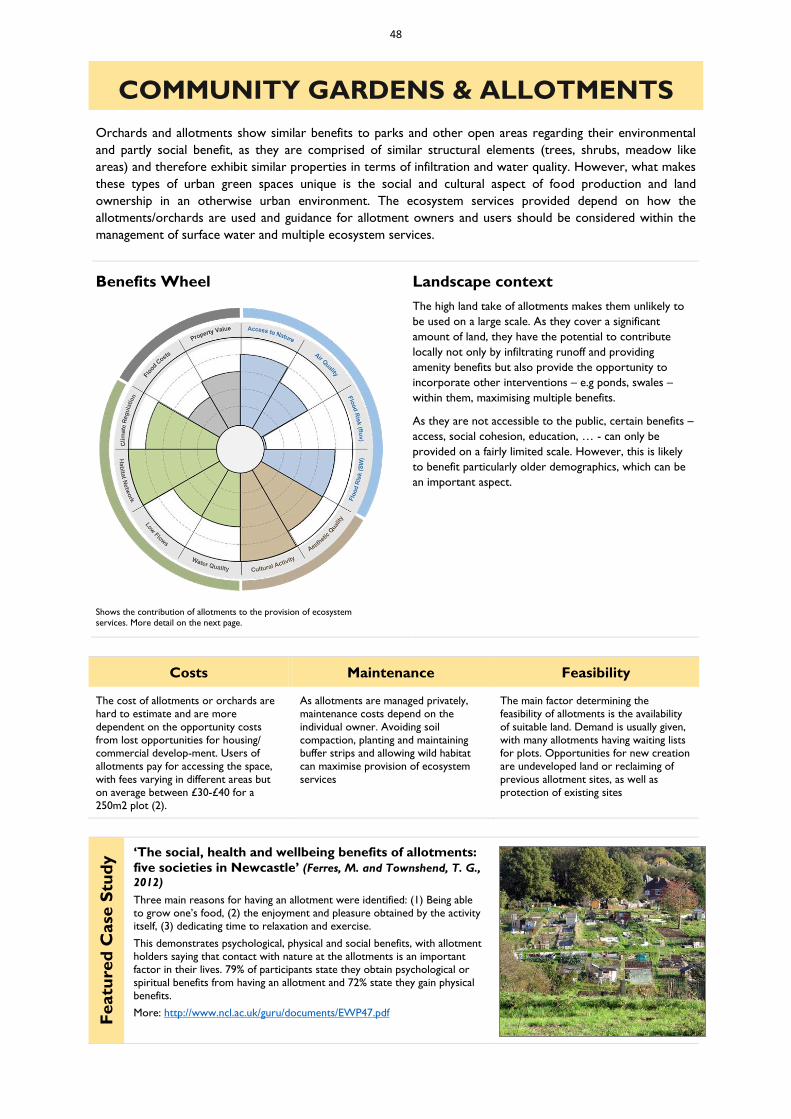
48
COMMUNITY GARDENS & ALLOTMENTS
Orchards and allotments show similar benefits to parks and other open areas regarding their environmental
and partly social benefit, as they are comprised of similar structural elements (trees, shrubs, meadow like
areas) and therefore exhibit similar properties in terms of infiltration and water quality. However, what makes
these types of urban green spaces unique is the social and cultural aspect of food production and land
ownership in an otherwise urban environment. The ecosystem services provided depend on how the
allotments/orchards are used and guidance for allotment owners and users should be considered within the
management of surface water and multiple ecosystem services.
Benefits Wheel
Landscape context
Shows the contribution of allotments to the provision of ecosystem
services. More detail on the next page.
The high land take of allotments makes them unlikely to
be used on a large scale. As they cover a significant
amount of land, they have the potential to contribute
locally not only by infiltrating runoff and providing
amenity benefits but also provide the opportunity to
incorporate other interventions – e.g ponds, swales –
within them, maximising multiple benefits.
As they are not accessible to the public, certain benefits –
access, social cohesion, education, … - can only be
provided on a fairly limited scale. However, this is likely
to benefit particularly older demographics, which can be
an important aspect.
Costs Maintenance Feasibility
The cost of allotments or orchards are
hard to estimate and are more
dependent on the opportunity costs
from lost opportunities for housing/
commercial develop-ment. Users of
allotments pay for accessing the space,
with fees varying in different areas but
on average between £30-£40 for a
250m2 plot (2).
As allotments are managed privately,
maintenance costs depend on the
individual owner. Avoiding soil
compaction, planting and maintaining
buffer strips and allowing wild habitat
can maximise provision of ecosystem
services
The main factor determining the
feasibility of allotments is the availability
of suitable land. Demand is usually given,
with many allotments having waiting lists
for plots. Opportunities for new creation
are undeveloped land or reclaiming of
previous allotment sites, as well as
protection of existing sites
Featu
red
Case
Stu
dy
‘The social, health and wellbeing benefits of allotments:
five societies in Newcastle’ (Ferres, M. and Townshend, T. G.,
2012)
Three main reasons for having an allotment were identified: (1) Being able
to grow one’s food, (2) the enjoyment and pleasure obtained by the activity
itself, (3) dedicating time to relaxation and exercise.
This demonstrates psychological, physical and social benefits, with allotment
holders saying that contact with nature at the allotments is an important
factor in their lives. 79% of participants state they obtain psychological or
spiritual benefits from having an allotment and 72% state they gain physical
benefits.
More: http://www.ncl.ac.uk/guru/documents/EWP47.pdf
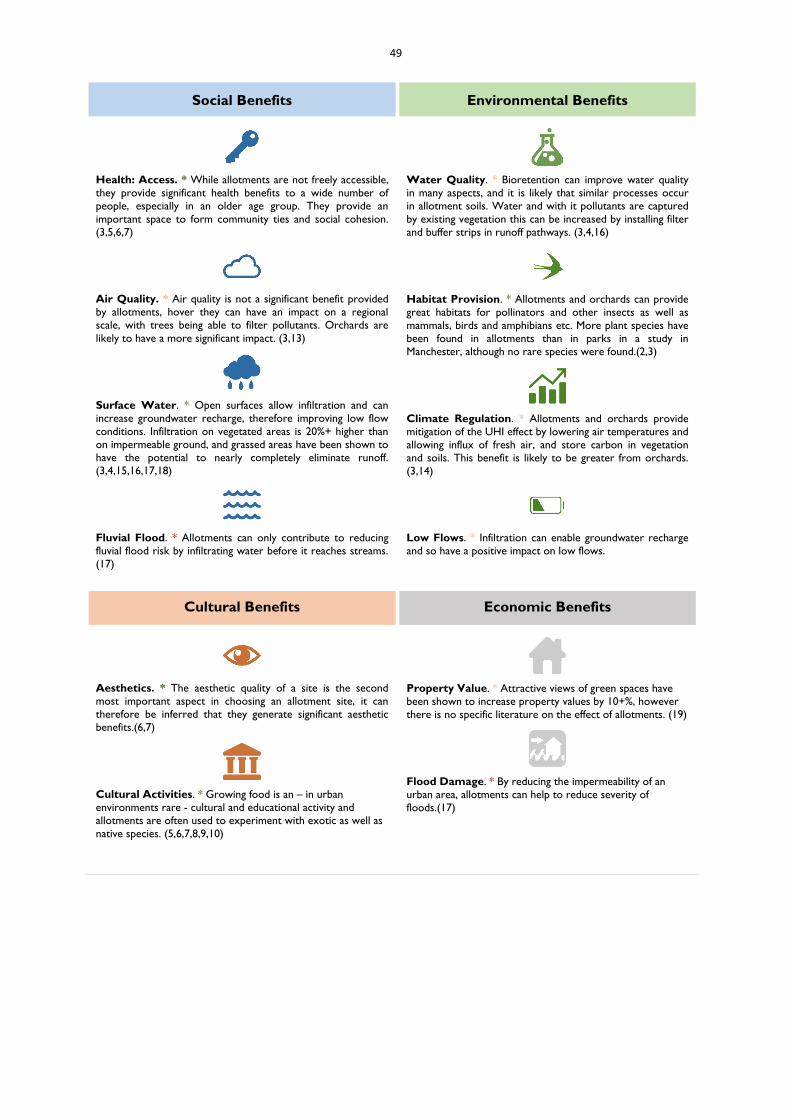
49
Social Benefits Environmental Benefits
Health: Access. * While allotments are not freely accessible,
they provide significant health benefits to a wide number of
people, especially in an older age group. They provide an
important space to form community ties and social cohesion.
(3,5,6,7)
Air Quality. * Air quality is not a significant benefit provided
by allotments, hover they can have an impact on a regional
scale, with trees being able to filter pollutants. Orchards are
likely to have a more significant impact. (3,13)
Surface Water. * Open surfaces allow infiltration and can
increase groundwater recharge, therefore improving low flow
conditions. Infiltration on vegetated areas is 20%+ higher than
on impermeable ground, and grassed areas have been shown to
have the potential to nearly completely eliminate runoff.
(3,4,15,16,17,18)
Fluvial Flood. * Allotments can only contribute to reducing
fluvial flood risk by infiltrating water before it reaches streams.
(17)
Water Quality. * Bioretention can improve water quality
in many aspects, and it is likely that similar processes occur
in allotment soils. Water and with it pollutants are captured
by existing vegetation this can be increased by installing filter
and buffer strips in runoff pathways. (3,4,16)
Habitat Provision. * Allotments and orchards can provide
great habitats for pollinators and other insects as well as
mammals, birds and amphibians etc. More plant species have
been found in allotments than in parks in a study in
Manchester, although no rare species were found.(2,3)
Climate Regulation. * Allotments and orchards provide
mitigation of the UHI effect by lowering air temperatures and
allowing influx of fresh air, and store carbon in vegetation
and soils. This benefit is likely to be greater from orchards.
(3,14)
Low Flows. * Infiltration can enable groundwater recharge
and so have a positive impact on low flows.
Cultural Benefits Economic Benefits
Aesthetics. * The aesthetic quality of a site is the second
most important aspect in choosing an allotment site, it can
therefore be inferred that they generate significant aesthetic
benefits.(6,7)
Cultural Activities. * Growing food is an – in urban
environments rare - cultural and educational activity and
allotments are often used to experiment with exotic as well as
native species. (5,6,7,8,9,10)
Property Value. * Attractive views of green spaces have
been shown to increase property values by 10+%, however
there is no specific literature on the effect of allotments. (19)
Flood Damage. * By reducing the impermeability of an
urban area, allotments can help to reduce severity of
floods.(17)
50
Additional Benefits and Potential Costs
Mental Health. Allotments have been shown to generate a
sense of pride, engagement with nature and an increased
well-being is reported by 80% of allotment gardeners. They
are especially important as community resources and
generate multi-cultural meeting spaces.
Food Production. People who own an allotment eat more
fresh fruit and vegetables than those who 0don’t. A study in
Manchester has quantified the economic benefit of food
production on allotments to be on average 698£ per plot and
year (3). Another report has found the total food production
in London in urban gardens to be £1.4 million per year.
Water Quality. The use of pesticides and fertilizer can have
a negative impact on the water quality of receiving systems.
Organic fertilizer and pest control through natural
mechanisms (e.g. providing habitat for natural predators)
should be encouraged.
Flooding. Allowing runoff to collect in allotments is only
viable as long as the area does not suffer from permanent
waterlogging. Hydraulic connectivity should be as high as
possible, and structures increasing infiltration – e.g. trees or
infiltration trenches – as well as storage structures like ponds
should be incorporated.
*** Indication of confidence. * Literature confirms positive influence. * Mostly positive results in literature and/or little literature
available. * Varying results in literature, little literature available
References:
General/Guidance:
(1) Environment Strategy Unit Chichester District
Council (no date) A Guide to Setting up and
Managing a Community Orchard.
(2) Natural England (2007). Wildlife on Allotments.
This document gives guidance on obtaining an
allotment and making it a valuable resource for
wildlife, advising that prizes for a plot of 250m2 are
on average between £30 and 40, but can be much
higher in dense areas. The habitat can be enhanced by
installing nesting boxes, hedgerows, ponds or similar,
and the report gives further guidance on what plants
to use and how to manage a plot in order to
encourage biodiversity.
(3) Speak, A. F., Mizgajski, A. and Borysiak, J. (2015)
‘Allotment gardens and parks: Provision of
ecosystem services with an emphasis on
biodiversity’, Urban Forestry & Urban Greening,
14(4), pp. 772–781.
This study is an attempt to assess and compare the
ecosystem services provided by AGs in Manchester,
UK, and Poznań, Poland as well as a comparison to
city parks. The results of this study show that AGs can
be highly species-rich environments and may offer a
method of food production that does not incur as
many trade-offs with biodiversity as other land uses.
The study also shows that the highest potential for
benefits arises from provisioning and cultural services,
e.g. generating knowledge, recreation, food production
and genetic resources. It is worth noting that many of
the additional ecosystem services beyond food
production, provided by AGs, have spatial impacts
beyond the confines of the gardens. Local climate
regulation, flood protection and air quality regulation
will especially benefit a large number of local residents
in cities at the neighbourhood scale.
(4) Ashley, R. M., Nowell, R., Gersonius, B. and
Walker, L. (2011) ‘Surface Water Management and
Urban Green Infrastructure’, 44(0), pp. 1–76.
This report investigates the benefits of urban green
infrastructure, specifically with regards to the
management of surface water quantity and quality.
Social Benefits:
(5) van den Berg, A. E., van Winsum-Westra, M., de
Vries, S. and van Dillen, S. M. E. (2010) ‘Allotment
gardening and health: a comparative survey among
allotment gardeners and their neighbors without
an allotment.’, Environmental health : a global
access science source, 9, p. 74.
After adjusting for income, education level, gender,
stressful life events, physical activity in winter, and
access to a garden at home as covariates, both
younger and older allotment gardeners reported higher
levels of physical activity during the summer than
neighbors in corresponding age categories. The impacts
of allotment gardening on health and well-being were
moderated by age. Allotment gardeners of 62 years
and older scored significantly or marginally better on all
measures of health and well-being than neighbors in
the same age category. Health and well-being of
younger allotment gardeners did not differ from
younger neighbors. The greater health and well-being
benefits of allotment gardening for older gardeners
may be related to the finding that older allotment
gardeners were more oriented towards gardening and
being active, and less towards passive relaxation.
(6) Ferres, M. and Townshend, T. G. (2012) ‘The
social, health and wellbeing benefits of allotments:
five societies in Newcastle’, School of
Architecture, Planning and Landscape, 47, pp. 1–
47.
This report investigates the benefits of having an
allotment for residents of Newcastle. It seeks to fill a
gap in the knowledge around why people choose to
maintain an allotment. Three main reasons were
identified: growing one’s own food, enjoyment of the
activity itself, and dedicating time to relaxation and
exercise. In the study, 79% of participants state they
obtain psychological or spiritual benefits from having
an allotment and 72% state they gain physical
51
benefits. However, allotment holders also have
concerns regarding the future of the allotments in
Newcastle, with many people saying that the biggest
threat comes from development pressure by local
councils.
(7) Ferris, J., Norman, C. and Sempik, J. (2001)
‘People, Land and Sustainability: Community
Gardens and the Social Dimension of Sustainable
Development’, Social Policy & Administration,
35(5), pp. 559–568.
Community gardens vary enormously in what they
offer, according to local needs and circumstance. This
article reports on research and experience from the
USA. The context in which these findings are discussed
is the implementation of Local Agenda 21 and
sustainable development policies. In particular,
emphasis is given to exploring the social dimension of
sustainable development policies by linking issues of
health, education, community development and food
security with the use of green space in towns and
cities. The article concludes that the use of urban open
spaces for parks and gardens is closely associated with
environmental justice and equity.
(8) Glover, T. D., Parry, D. C., & Shinew, K. J. (2005).
Building relationships, accessing resources:
Mobilizing social capital in community garden
contexts. Journal of Leisure Research, 37(4), 450-
474.
This paper explores the role of social capital and
formation of relationships in the context of community
gardening. CG are presented as settings for building
social networks and a knowledge base and can
therefore provide important social and cultural
benefits.
(9) Flachs, A. (2010) ‘Food For Thought: The Social
Impact of Community Gardens in the Greater
Cleveland Area’, Electronic Green Journal, 1(30).
This paper explores the social and cultural effects of
urban gardening in the greater Cleveland area.
Gardening is shown to have a multitude of motivating
factors, including economic, environmental, political,
social, and nutritional.
(10) Joe Howe (2002) Planning for Urban Food: The
Experience of Two UK Cities, Planning Practice &
Research, 17:2, 125-144
This article puts urban food growing in the context of
the Agenda21 and discusses the role of allotments in
urban policy and sustainability. It finds multiple
important drivers in using an allotment, and pressures
on their development and use.
(11) Woolley, H., Rose, S., Carmona, M. and Freedman,
J. (2004) The Value of Public Space, Exchange
Organizational Behavior Teaching Journal. London.
This report mentions especially the social benefits of
allotment and community gardens as benefits gained
from this type of public space. Allotments have for
example been shown to encourage cross-cultural
community ties.
(12) Sustain (2014). Reaping Rewards. Can
Communities Grow a Million Meals for London?
Based on this analysis, and knowledge of the types and
sizes of food growing spaces throughout the 2,200+
membership of the Capital Growth network, this report
estimates that London's community food growers could
be growing as much as £1.4 million worth of food over
the course of a year.
(13) Forest Research (no date) Improving Air Quality.
(14) Forestry Commission (20130. Air Temperature
Regulation by Urban Trees and Green
Infrastructure. Farnham.
Surface Water Management
(15) Armson, D., Stringer, P. and Ennos, A. R. (2013)
‘The effect of street trees and amenity grass on
urban surface water runoff in Manchester, UK’,
Urban Forestry & Urban Greening, 12(3), pp. 282–
286. doi: 10.1016/j.ufug.2013.04.001.
This study assessed the impact of trees upon urban
surface water runoff by measuring the runoff from
9m2 plots covered by grass, asphalt, and asphalt with
a tree planted in the centre. It was found that, while
grass almost totally eliminated surface runoff, trees
and their associated tree pits, reduced runoff from
asphalt by as much as 62%.
(16) Davis, A. P., Shokouhian, M., Sharma, H. and
Minami, C. (2001) ‘Laboratory study of biological
retention for urban stormwater management.’,
Water environment research : a research publication of
the Water Environment Federation, 73(1), pp. 5–14.
Urban stormwater runoff contains a broad range of
pollutants that are transported to natural water
systems. A practice known as biological retention
(bioretention) has been suggested to manage
stormwater runoff from small, developed areas.
Bioretention facilities consist of porous soil, a topping
layer of hardwood mulch, and a variety of different
plant species. Reductions in concentrations of all
metals were excellent (> 90%) with specific metal
removals of 15 to 145 mg/m2 per event. Moderate
reductions of TKN, ammonium, and phosphorus levels
were found (60 to 80%).
(17) Perry, T. and Nawaz, R. (2008) ‘An investigation
into the extent and impacts of hard surfacing of
domestic gardens in an area of Leeds, United
Kingdom’, Landscape and Urban Planning, 86(1), pp.
1–13. doi: 10.1016/j.landurbplan.2007.12.004.
A study in Leeds has linked the increase in paved front
gardens (and therefore increase in impermeable area)
to an increased severity in surface water flooding in
that area. A 13% increase in paved area was observed
over 33 years, of which 75% is due to paving of front
gardens, that lead to a predicted 12% increase of
average surface water runoff. This prediction was
reflected by actual events in Leeds, where heavy
rainfall led to more frequent and severe flooding.
(18) Yao, L., Chen, L., Wei, W. and Sun, R. (2015)
‘Potential reduction in urban runoff by green
spaces in Beijing: A scenario analysis’, Urban
Forestry & Urban Greening, 14(2), pp. 300–308.

52
The results show that urban green space offers
significant potential for runoff mitigation. In 2012, a
total of 97.9 million m3 of excess surface runoff was
retained by urban green space; adding nearly 11%
more tree canopy was projected to increase runoff
retention by >30%, contributing to considerable
benefits of urban rainwater regulation. At a more
detailed scale, there were apparent internal variations.
Urban function zones with >70% developed land
showed less mitigation of runoff, while green zones
(vegetation >60%), which occupied only 15.54% of the
total area, contributed 31.07% of runoff reduction.
(19) Luttik, Joke. 2000. “The Value of Trees, Water and
Open Space as Reflected by House Prices in the
Netherlands.” Landscape and Urban Planning 48
(3-4): 161–67.
http://www.nsalg.org.uk/
https://www.cambridge.gov.uk/content/benefits-
allotment
http://greenspacescotland.org.uk/our-growing-
community.aspx
http://www.allotment-garden.org/

53
URBAN RIVERS
Rivers have in many cases provided the resources and benefits necessary for the development of cities. Yet, in
urban areas, rivers have often been seen as a threat to infrastructure and human health rather than as a
resource, leading to their increasing degradation. Many benefits that arise from protecting rivers and
restoration projects can be similar to those from public parks where access is given and the restoration is
designed to provide a similar environment, it can therefore be useful to refer to this factsheet to understand
further benefits. Opportunities for river restoration in parks and other open spaces may also be more easily
found than in higher density urban environments.
Benefits Wheel
Landscape context
Shows the contribution of rivers to the provision of ecosystem services.
More detail on the next page.
Rivers receive water as runoff from their surroundings,
even more so due to the increasing impermeability of the
urban environment. Sewers – meant to carry surface
water flow, but often also carrying pollutants from
misconnections – also discharge into watercourses. In
addition, other pressures are present in the urban
environment: air pollution from traffic can cause
acidification. Pesticides from roadsides or amenity areas
can reach the water, as well as fertilisers. Construction
sites can cause high sediment inflow. (Environment
Agency 2009). Past culverting and straightening streams
and disconnecting them from floodplains has also had a
degrading impact.
These pressures threaten the quality of rivers and their
value as habitats, but also the benefits they can bring to
people, some of which are represented in the benefits
wheel on the left, and explained in more detail on the
next page..
Maintenance Costs
To improve the state of urban rivers and restore the benefits they provide, there are many interventions that
can be taken. Habitat can be restored, for example by removing hard riverbanks and re-meandering.
Reducing runoff and pollution from hard surface by installing SuDS can improve water quality and work on a
wider scale (7, 8, 19). The costs for river restoration are very variable. A study on restoration projects
carried out in the EU has shown that costs can range between 100 to 3000€ (equivalent to about 70-2300£)
per metre of river restored (9). The cost of SuDS depends on their type – see other factsheets..
Featu
red
Case
Stu
dy
Mayesbrook Park
The Mayesbrook Park project demonstrates how a green infrastructure approach
to urban river restoration is a strong alternative to traditional hard engineering.
By using green infrastructure to address flood-water management, the project has
created an attractive public amenity, while the communities that surround the
park and the wildlife within it are now able to cope better with the effects of
climate change. The overall benefits are substantial relative to the planned
investment. The lifetime value of restoring the site across the four ecosystem
service categories (provisioning, regulatory, cultural and supporting) yields a grand
total of calculated benefits of around £27 million, even if ‘likely significant positive
benefits’ for the regulation of air quality and microclimate are excluded. This is
compared to the estimated costs of the whole Mayesbrook Park restoration
scheme at £3.8 million including the river restoration works. This produces an
excellent lifetime benefit-to-cost ratio of £7 of benefits for every £1 invested.
http://publications.naturalengland.org.uk/publication/11909565?category=49002
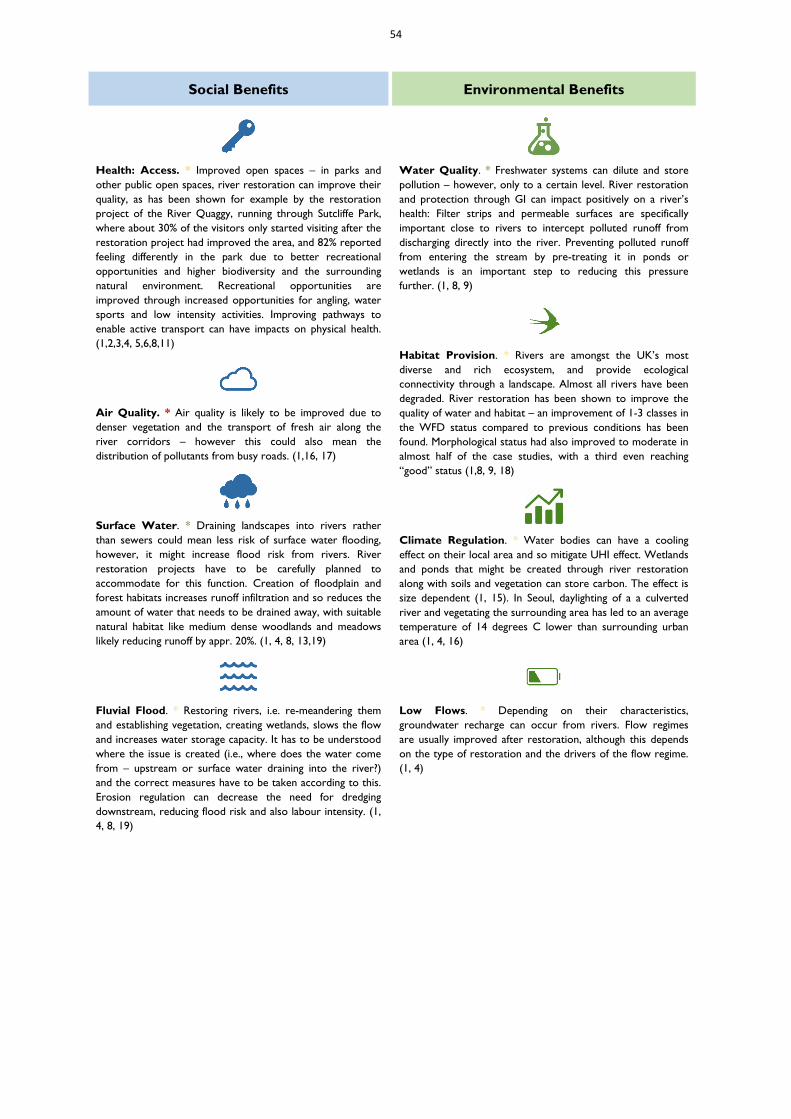
54
Social Benefits Environmental Benefits
Health: Access. * Improved open spaces – in parks and
other public open spaces, river restoration can improve their
quality, as has been shown for example by the restoration
project of the River Quaggy, running through Sutcliffe Park,
where about 30% of the visitors only started visiting after the
restoration project had improved the area, and 82% reported
feeling differently in the park due to better recreational
opportunities and higher biodiversity and the surrounding
natural environment. Recreational opportunities are
improved through increased opportunities for angling, water
sports and low intensity activities. Improving pathways to
enable active transport can have impacts on physical health.
(1,2,3,4, 5,6,8,11)
Air Quality. * Air quality is likely to be improved due to
denser vegetation and the transport of fresh air along the
river corridors – however this could also mean the
distribution of pollutants from busy roads. (1,16, 17)
Surface Water. * Draining landscapes into rivers rather
than sewers could mean less risk of surface water flooding,
however, it might increase flood risk from rivers. River
restoration projects have to be carefully planned to
accommodate for this function. Creation of floodplain and
forest habitats increases runoff infiltration and so reduces the
amount of water that needs to be drained away, with suitable
natural habitat like medium dense woodlands and meadows
likely reducing runoff by appr. 20%. (1, 4, 8, 13,19)
Fluvial Flood. * Restoring rivers, i.e. re-meandering them
and establishing vegetation, creating wetlands, slows the flow
and increases water storage capacity. It has to be understood
where the issue is created (i.e., where does the water come
from – upstream or surface water draining into the river?)
and the correct measures have to be taken according to this.
Erosion regulation can decrease the need for dredging
downstream, reducing flood risk and also labour intensity. (1,
4, 8, 19)
Water Quality. * Freshwater systems can dilute and store
pollution – however, only to a certain level. River restoration
and protection through GI can impact positively on a river’s
health: Filter strips and permeable surfaces are specifically
important close to rivers to intercept polluted runoff from
discharging directly into the river. Preventing polluted runoff
from entering the stream by pre-treating it in ponds or
wetlands is an important step to reducing this pressure
further. (1, 8, 9)
Habitat Provision. * Rivers are amongst the UK’s most
diverse and rich ecosystem, and provide ecological
connectivity through a landscape. Almost all rivers have been
degraded. River restoration has been shown to improve the
quality of water and habitat – an improvement of 1-3 classes in
the WFD status compared to previous conditions has been
found. Morphological status had also improved to moderate in
almost half of the case studies, with a third even reaching
“good” status (1,8, 9, 18)
Climate Regulation. * Water bodies can have a cooling
effect on their local area and so mitigate UHI effect. Wetlands
and ponds that might be created through river restoration
along with soils and vegetation can store carbon. The effect is
size dependent (1, 15). In Seoul, daylighting of a a culverted
river and vegetating the surrounding area has led to an average
temperature of 14 degrees C lower than surrounding urban
area (1, 4, 16)
Low Flows. * Depending on their characteristics,
groundwater recharge can occur from rivers. Flow regimes
are usually improved after restoration, although this depends
on the type of restoration and the drivers of the flow regime.
(1, 4)
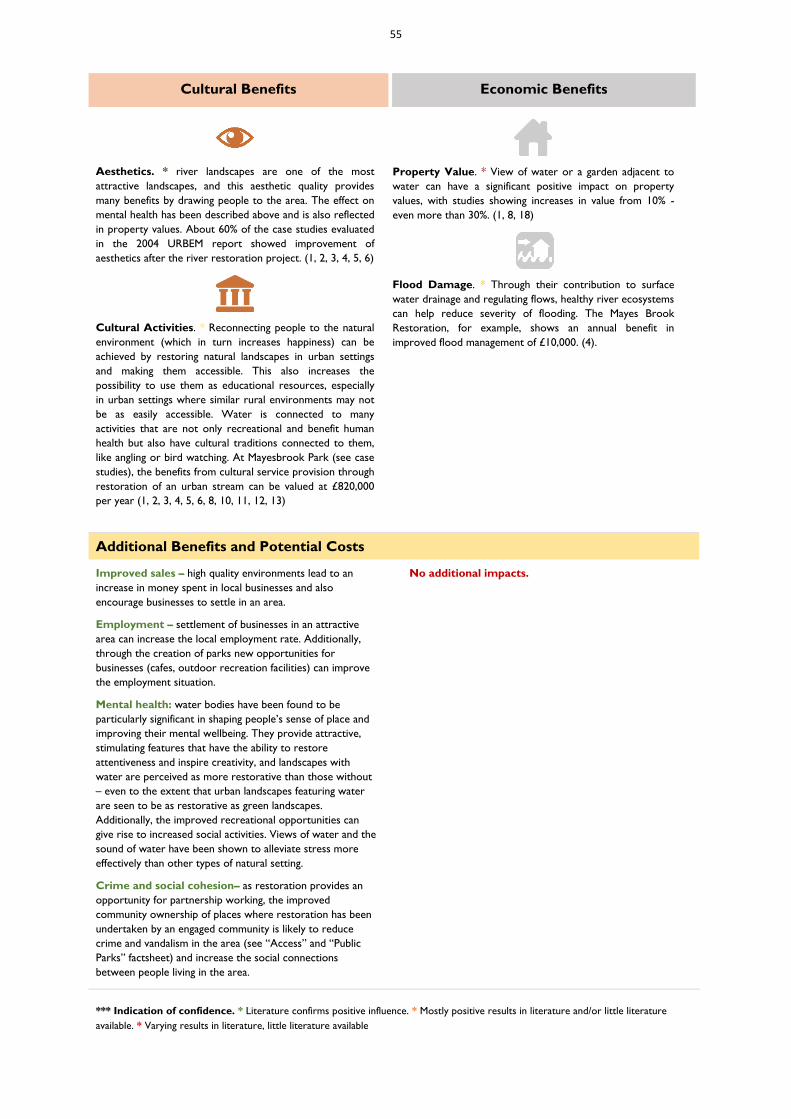
55
Cultural Benefits Economic Benefits
Aesthetics. * river landscapes are one of the most
attractive landscapes, and this aesthetic quality provides
many benefits by drawing people to the area. The effect on
mental health has been described above and is also reflected
in property values. About 60% of the case studies evaluated
in the 2004 URBEM report showed improvement of
aesthetics after the river restoration project. (1, 2, 3, 4, 5, 6)
Cultural Activities. * Reconnecting people to the natural
environment (which in turn increases happiness) can be
achieved by restoring natural landscapes in urban settings
and making them accessible. This also increases the
possibility to use them as educational resources, especially
in urban settings where similar rural environments may not
be as easily accessible. Water is connected to many
activities that are not only recreational and benefit human
health but also have cultural traditions connected to them,
like angling or bird watching. At Mayesbrook Park (see case
studies), the benefits from cultural service provision through
restoration of an urban stream can be valued at £820,000
per year (1, 2, 3, 4, 5, 6, 8, 10, 11, 12, 13)
Property Value. * View of water or a garden adjacent to
water can have a significant positive impact on property
values, with studies showing increases in value from 10% -
even more than 30%. (1, 8, 18)
Flood Damage. * Through their contribution to surface
water drainage and regulating flows, healthy river ecosystems
can help reduce severity of flooding. The Mayes Brook
Restoration, for example, shows an annual benefit in
improved flood management of £10,000. (4).
Additional Benefits and Potential Costs
Improved sales – high quality environments lead to an
increase in money spent in local businesses and also
encourage businesses to settle in an area.
Employment – settlement of businesses in an attractive
area can increase the local employment rate. Additionally,
through the creation of parks new opportunities for
businesses (cafes, outdoor recreation facilities) can improve
the employment situation.
Mental health: water bodies have been found to be
particularly significant in shaping people’s sense of place and
improving their mental wellbeing. They provide attractive,
stimulating features that have the ability to restore
attentiveness and inspire creativity, and landscapes with
water are perceived as more restorative than those without
– even to the extent that urban landscapes featuring water
are seen to be as restorative as green landscapes.
Additionally, the improved recreational opportunities can
give rise to increased social activities. Views of water and the
sound of water have been shown to alleviate stress more
effectively than other types of natural setting.
Crime and social cohesion– as restoration provides an
opportunity for partnership working, the improved
community ownership of places where restoration has been
undertaken by an engaged community is likely to reduce
crime and vandalism in the area (see “Access” and “Public
Parks” factsheet) and increase the social connections
between people living in the area.
No additional impacts.
*** Indication of confidence. * Literature confirms positive influence. * Mostly positive results in literature and/or little literature
available. * Varying results in literature, little literature available
56
References:
(1) Maltby, E., Ormerod, S., Acreman, M., Blackwell,
M., Durance, I., Everard, M., Morris, J., Spray, C.
(2011) Freshwaters – Open Waters, Wetlands and
Floodplains. In: The UK National Ecosystem
Assessment Technical Report. UK National
Ecosystem Assessment, UNEP-WCMC,
Cambridge.
(2) van den Berg, M., Wendel-Vos, W., van Poppel, M.,
Kemper, H., van Mechelen, W. and Maas, J. (2015)
‘Health benefits of green spaces in the living
environment: A systematic review of
epidemiological studies’, Urban Forestry & Urban
Greening, 14(4), pp. 806–816.
(3) Commission for Architecture and the Built
Environment (2005) Decent parks? Decent
behaviour?: The link between the quality of parks
and user behaviour, pp.1–17.
(4) Everard, M. and Moggridge, H. L. (2012)
‘Rediscovering the value of urban rivers’, (April
2011), pp. 293–314.
(5) Jackson, R. J., Watson, T. D., Tsiu, A., Shulaker, B.,
Hopp, S. and Popovic, M. (2014) Urban River
Parkways. Los Angeles.
(6) Nordh, H., Hartig, T., Hagerhall, C. M. and Fry, G.
(2009) ‘Components of small urban parks that
predict the possibility for restoration’, Urban
Forestry & Urban Greening, 8(4), pp. 225–235.
(7) Palmer, M. A., Bernhardt, E. S., Allan, J. D., Lake, P.
S., Alexander, G., Brooks, S (2005) ‘Standards for
ecologically successful river restoration’, Journal of
Applied Ecology, 42(2), pp. 208–217.
(8) RESTORE (2013) Rivers by Design. Bristol.
(9) Schanze, J., Olfert, A., Tourbier, J. T., Gersdorf, I.
and Schwager, T. (2004) Existing Urban River
Rehabilitation Schemes. Wallingford.
(10) Völker, S. & Kistemann, T., (2013) “I’m always
entirely happy when I'm here!” Urban blue
enhancing human health and well-being in Cologne
and Düsseldorf, Germany. Social science &
medicine (1982), 78, pp.113–24.
(11) White, M., Smith, A., Humphryes, K., Pahl, S.,
Snelling, D. and Depledge, M. (2010) ‘Blue space:
The importance of water for preference, affect,
and restorativeness ratings of natural and built
scenes’, Journal of Environmental Psychology, 30(4),
pp. 482–493.
(12) Zelenski, J.M. & Nisbet, E.K. (2012). Happiness and
Feeling Connected: The Distinct Role of Nature
Relatedness. Environment and Behavior, 46(1),
pp.3–23.
(13) Sunderland, T. (2012) Microeconomic Evidence for
the Benefits of Investment in the Environment -
Review, Natural England Research Reports, Number
033.
(14) Environment Agency (2009) Water for life and
livelihoods. River Basin and Management Plan Thames
River Basin District. Annex G: Pressures and risks.
(15) Kayranli, B., Scholz, M., Mustafa, A. and Hedmark,
Å. (2009) ‘Carbon Storage and Fluxes within
Freshwater Wetlands: a Critical Review’, Wetlands,
30(1), pp. 111–124.
(16) Hathway, E. A. and Sharples, S. (2012) ‘The
interaction of rivers and urban form in mitigating
the Urban Heat Island effect: A UK case study’,
Building and Environment, 58, pp. 14–22.
(17) Wood, C. R., Pauscher, L., Ward, H. C., Kotthaus,
S., Barlow, J., Gouvea, M., Lane, S. E. and
Grimmond, C. S. B. (2013) ‘Wind observations
above an urban river using a new lidar technique,
scintillometry and anemometry’, Science of the
Total Environment. Elsevier.
(18) International Association of Certified Home
Inspectors, Inc. (InterNACHI) (2016): Constructed
Wetlands: The Economic Benefits of Runoff
Controls.
(19) http://www.ecrr.org/RiverRestoration/Urban
RiverRestoration/tabid/3177/Default.aspx
More links:
(20) http://www.urbem.net/index.html
(21) https://www.restorerivers.eu/.
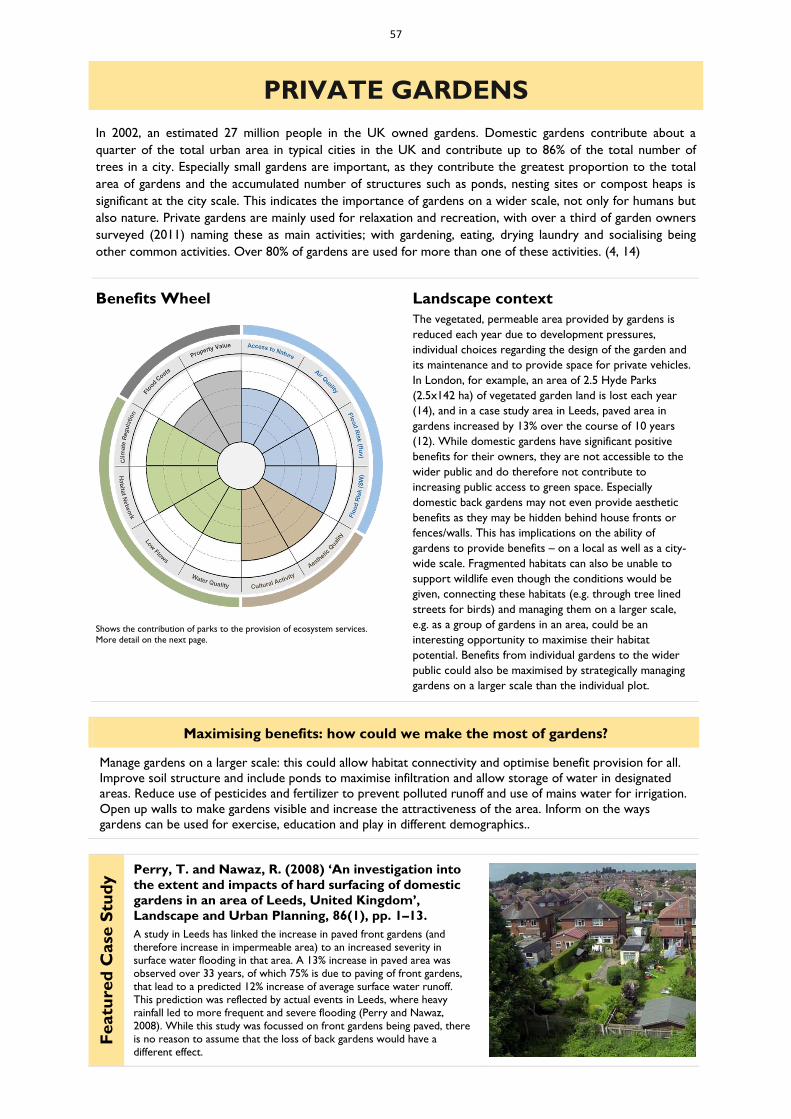
57
PRIVATE GARDENS
In 2002, an estimated 27 million people in the UK owned gardens. Domestic gardens contribute about a
quarter of the total urban area in typical cities in the UK and contribute up to 86% of the total number of
trees in a city. Especially small gardens are important, as they contribute the greatest proportion to the total
area of gardens and the accumulated number of structures such as ponds, nesting sites or compost heaps is
significant at the city scale. This indicates the importance of gardens on a wider scale, not only for humans but
also nature. Private gardens are mainly used for relaxation and recreation, with over a third of garden owners
surveyed (2011) naming these as main activities; with gardening, eating, drying laundry and socialising being
other common activities. Over 80% of gardens are used for more than one of these activities. (4, 14)
Benefits Wheel
Landscape context
Shows the contribution of parks to the provision of ecosystem services.
More detail on the next page.
The vegetated, permeable area provided by gardens is
reduced each year due to development pressures,
individual choices regarding the design of the garden and
its maintenance and to provide space for private vehicles.
In London, for example, an area of 2.5 Hyde Parks
(2.5x142 ha) of vegetated garden land is lost each year
(14), and in a case study area in Leeds, paved area in
gardens increased by 13% over the course of 10 years
(12). While domestic gardens have significant positive
benefits for their owners, they are not accessible to the
wider public and do therefore not contribute to
increasing public access to green space. Especially
domestic back gardens may not even provide aesthetic
benefits as they may be hidden behind house fronts or
fences/walls. This has implications on the ability of
gardens to provide benefits – on a local as well as a city-
wide scale. Fragmented habitats can also be unable to
support wildlife even though the conditions would be
given, connecting these habitats (e.g. through tree lined
streets for birds) and managing them on a larger scale,
e.g. as a group of gardens in an area, could be an
interesting opportunity to maximise their habitat
potential. Benefits from individual gardens to the wider
public could also be maximised by strategically managing
gardens on a larger scale than the individual plot.
Maximising benefits: how could we make the most of gardens?
Manage gardens on a larger scale: this could allow habitat connectivity and optimise benefit provision for all.
Improve soil structure and include ponds to maximise infiltration and allow storage of water in designated
areas. Reduce use of pesticides and fertilizer to prevent polluted runoff and use of mains water for irrigation.
Open up walls to make gardens visible and increase the attractiveness of the area. Inform on the ways
gardens can be used for exercise, education and play in different demographics..
Featu
red
Case
Stu
dy
Perry, T. and Nawaz, R. (2008) ‘An investigation into
the extent and impacts of hard surfacing of domestic
gardens in an area of Leeds, United Kingdom’,
Landscape and Urban Planning, 86(1), pp. 1–13.
A study in Leeds has linked the increase in paved front gardens (and
therefore increase in impermeable area) to an increased severity in
surface water flooding in that area. A 13% increase in paved area was
observed over 33 years, of which 75% is due to paving of front gardens,
that lead to a predicted 12% increase of average surface water runoff.
This prediction was reflected by actual events in Leeds, where heavy
rainfall led to more frequent and severe flooding (Perry and Nawaz,
2008). While this study was focussed on front gardens being paved, there
is no reason to assume that the loss of back gardens would have a
different effect.
58
Social Benefits Environmental Benefits
Health: Access. * For those able to use them, they can
provide increased physical fitness, connection to nature,
improved relaxation and recovery from trauma, and similar
benefits related to stress avoidance and cognitive function.
Gardening in one’s own garden has been shown to provide
greater satisfaction than gardening in community/shared
gardens. Where visible, the increased green space may help
reduce mental fatigue and so have a positive impact on crime
rates in an area. Private Gardens may have an especially
important effect on young children due to being more readily
accessible for children and providing a safe area for play and
exercise. Private Gardens can also be hugely important
resources for the elderly, however there can be barriers from
decreased physical ability and lack of support. (1, 2, 4, 6, 8,
13)
Air Quality. * Especially in gardens with trees (at least
certain types) air quality can be significantly improved. This is
dependent on the type of vegetation used and where it is
planted. Trees are especially positive if they are on the
leeward side of a high pollution area (e.g. a busy road). They
can not only benefit those owning the domestic garden but
the area surrounding them – depending on their size and
location. However, there is little direct evidence available and
effects are certainly only on a small scale. (2)
Surface Water. * Plants and trees intercept rain and slow
runoff, contributing to an attenuation of the peak flow and
volume reduction of runoff through increased infiltration.
However, heavy and prolonged rainfall, with potential
additional runoff from adjacent areas, can lead to waterlogging
of the soil. This depends on local characteristics such as soil
type and can be exacerbated by compacting the soil, e.g.
through heavy footfall or parking of vehicles. (2, 12, 13, 17)
Fluvial Flood. * Urbanisation and decreased permeability of
surfaces has been shown to impact the magnitude of flooding
by increasing the amount of runoff a river receives. Increasing
permeability of an area by 30% could lead to as much as a
doubling in the magnitude of 100 year return period floods.
Protecting permeable areas is therefore a significant
contribution to keeping flood risk as low as possible. (9)
Water Quality. * Reducing runoff improves water quality as
less pollutants are carried into surface water bodies, but also
because biological processes in the soil break down pollutants.
Bioretention (the breakdown of pollutants in structures
consisting of porous soil, mulch and various plants) has been
shown to have significant potential to reduce pollution in
runoff. Especially metals can be nearly completely (>90%)
removed, ammonium and phosphorous have been found to be
reduced by 60-80%. Nitrate, however, can be increased
through bioretention treatment. Private gardens, especially if
they are managed traditionally, are likely to contribute to
nitrogen and pesticide pollution and could so even have a
negative impact. (2,3)
Habitat Provision. * Especially for invertebrates and birds,
even small domestic gardens can provide an important habitat,
but also for some animals that used to be common in low-
intensity farmland (e.g. hedgehogs, frogs, bumblebees). They
are likely to support a fairly generalist array of species, though
the importance of this should not be underestimated. Gardens
have been shown to harbour more plant species (a study
found the entire garden flora across the UK to consist of 1056
species) than any other form of urban green space. Plant
composition can be homogenous though and include many
non-natives. Another important factor can be the size of
gardens: the ability to provide biodiversity is often related to
the area and connectivity. While gardens have the potential to
provide very valuable habitats, the way they are managed
influences the realisation thereof greatly. (2, 5, 7, 10, 11, 13,
15)
Climate Regulation. * A 10% increase in veg surfaces would
help control summer temperature increase (predicted 4
degrees) due to climate change (modelling study in
Manchester). Additionally, the soil can store carbon, especially
if disturbance is minimised. An average of 2.5 kg m-2 of carbon
is stored in domestic gardens with 83% in soil (to 600mm
depth), 16% in trees and shrubs and only 0.6% on average in
grass and herbaceous plants. (2, 13)
Low Flows. * Infiltration allows groundwater recharge.
Grassed areas are able to nearly completely eliminate runoff.
However, increased water use in summer may occur and
increase pressure on mains water. (2)
59
Cultural Benefits Economic Benefits
Aesthetics. * Gardens, where they are visible, provide high
aesthetic benefits for the neighbourhood. In a study in
Sheffield published in 2000, more than 50% surveyed stated
the fact that gardening created “a more beautiful
environment” as a contribution gardens make to the urban
environment. (4)
Cultural Activities. * Gardening has been linked to
increased sense of self-esteem, identity and ownership. They
can lead to strong place attachment and provide a forum for
interaction between family members. Gardens allow playful
activities as well as growing food, gardening to shape a place
after one’s own imagination or creative activities like
painting or photography. Private gardens may, however,
completely discourage wider social interaction by providing
a clear barrier to the outside through hedges and walls –
this is dependent on their layout and the way they are used.
Contrarily, it has also been found that private gardens
encourage social interaction between neighbours as
contacts are made across the garden fence – a study
published in 2000 found that 23% of garden users value the
opportunity to meet neighbours when in the garden. (1, 6,
8, 16)
Property Value. * It is widely accepted that gardens add
value to a property. A survey by HomeSearch found that a
garden added 20% in value compared to a house without a
garden. (19)
Flood Damage. * While a single garden will have no
significant impact, case studies like the previously mentioned
one in Leeds show that the loss of a proportion of gardens in
an area can contribute significantly to increased damage from
surface water flooding).
Additional Benefits and Potential Costs
Energy savings. Sheltering vegetation could reduce energy
costs for heating and cooling – on average 30% cooling
energy savings have been found. These can be maximised by
choosing vegetation with a high albedo to increase the
reflection of light and with it heat. At the same time, this
relates to soil water availability, as evaporation and
transpiration are the main reasons for the cooling effect.
Winter heating savings can also be gained if gardens are used
to plant hedges to insulate from wind (while avoiding shading
the house too much or directing wind tunnels towards the
house), 17% have been suggested for houses in Scotland,
although there is less literature. (2,17)
(Mental) Health. Gardens and gardening provide benefits
through the physical exercise that they can facilitate as well
as through providing a ‘retreat’ from everyday life and
enabling interaction with nature. Reduced mortality, lowered
blood pressure and cholesterol levels, increased bone density
have been linked to gardening, as well as a later onset of
dementia. Regular physical exercise reduces risk of coronary
heart disease. The low intensity, regular exercise that
gardening provides can be very beneficial. Gardening helps
reduce depression and anxiety, and encourages creativity and
self-expression. Views of nature encourage faster recovery
from illnesses and increase attention, alertness and improved
moods. Especially landscapes with high natural resemblance
provide restorative benefits. (1,2,4)
Food. Food production is another potential activity carried
out in private gardens. It has been shown that people owning
an allotment are more likely to consume fresh fruit and
vegetables, and this is likely transferable to private gardens.
However, there is little literature on the extent of food
production in private gardens or the implications it has. (16)
Carbon Emissions. Management of gardens can lead to an
increase in emissions. This can be due either to the products
and services used (greenhouses, peat, plastics etc) or the
activities carried out (lawn mowing…). This means it is
important to be conscious of how to manage a garden for it
to be environmentally sustainable. (2)
Water Use. The need for irrigation can increase water use
in a garden and so demand on mains water and energy. This
can have negative impacts on low flows and carbon
emissions, or if not done decrease the cooling potential and
aesthetic value. Choosing the right plants is important. (2)
Water Quality. Using fertilizers and pesticides can have
negative impacts on the water quality of receiving waters. If
possible, these should not be used or substituted by organic
products to minimise impacts. Keeping a compost heap can
provide fertilizer and reduce waste production. (3, 11)
Habitat Provision. Introduction of invasive species can be a
problem. Also, using pesticides can diminish the value of
gardens as a habitat. Native plants should be preferred and
management intensities should be kept at a reasonable level –
introducing areas for wildlife, like wildflower strips or leaving
piles of leaf litter and dead wood can increase the value as a
habitat. Domestic cats can also present a threat to wildlife.
(7, 11)
*** Indication of confidence. * Literature confirms positive influence. * Mostly positive results in literature and/or little literature
available. * Varying results in literature, little literature available
60
References:
(1) Bhatti, M. (2006) ‘“When I”m in the garden I can
create my own paradise’: Homes and gardens in
later life’, The Sociological Review, 54(2), pp. 318–
341.
(2) Cameron, R., Blanusa, T., Taylor, J.,
Salisbury, A., Halstead, A., Henricot, B. and
Thompson, K. (2012) The domestic garden:
its contribution to urban green
infrastructure. Urban Forestry and Urban
Greening, 11 (2). pp. 129-137.
The review suggests that there are significant
differences in both form and management of domestic
gardens which radically influence the benefits.
Nevertheless, gardens can play a strong role in
improving the environmental impact of the domestic
curtilage, e.g. by insulating houses against temperature
extremes they can reduce domestic energy use.
Gardens also improve localized air cooling, help
mitigate flooding and provide a haven for wildlife. Less
favourable aspects include contributions of gardens
and gardening to greenhouse gas emissions, misuse of
fertilizers and pesticides, and introduction of alien
plant species. Due to the close proximity to the home
and hence accessibility for many, possibly the greatest
benefit of the domestic garden is on human health and
well-being, but further work is required to define this
clearly within the wider context of green infrastructure.
(3) Davis, A. P., Shokouhian, M., Sharma, H. and
Minami, C. (2001) ‘Laboratory study of biological
retention for urban stormwater management.’,
Water environment research: a research
publication of the Water Environment Federation,
73(1), pp. 5–14.
(4) Dunnett, N. and Qasim, M. (2000)
‘Perceived Benefits to Human Well-being of
Urban Gardens’, HortTechnology, 10(1), pp.
40–45.
Private gardens occupy a significant proportion of the
total surface area of a British city. For many people,
the garden represents their only contact with nature
and their chance to express themselves creatively. Yet
relatively little research has been carried out on the
role and value of such gardens to human well-being.
We report in this paper on a major survey on the role
of private, urban gardens in human well-being,
conducted with a wide cross-section of randomly
selected garden owners from the city of Sheffield,
England, over the summer of 1995.
(5) Gaston, K. J., Warren, P. H., Thompson, K. and
Smith, R. M. (2005) ‘Urban Domestic Gardens
(IV): The Extent of the Resource and its
Associated Features’, Biodiversity and
Conservation, 14(14), pp. 3327–3349.
(6) Gigliotti, C. M. and Jarrott, S. E. (2010) ‘Effects of
Horticulture Therapy on Engagement and Affect’,
Canadian Journal on Aging / La Revue canadienne
du vieillissement. Cambridge University Press,
24(04), p. 367.
(7) Goddard, M. A., Dougill, A. J. and Benton, T.
G. (2010) ‘Scaling up from gardens:
biodiversity conservation in urban
environments.’, Trends in ecology &
evolution, 25(2), pp. 90–8.
A scale-dependent tension is apparent in garden
management, whereby the individual garden is much
smaller than the unit of management needed to retain
viable populations. To overcome this, here we suggest
mechanisms for encouraging 'wildlife-friendly'
management of collections of gardens across scales
from the neighbourhood to the city.
(8) Gross, H. and Lane, N. (2007) ‘Landscapes of the
lifespan: Exploring accounts of own gardens and
gardening’, Journal of Environmental Psychology,
27(3), pp. 225–241.
(9) Hollis, G. E. (1975) ‘The effect of
urbanization on floods of different
recurrence interval’, Water Resources
Research, 11(3), pp. 431–435.
Studies have shown that the urbanization of a
catchment can drastically change the flood
characteristics of a river. Published results are
synthesized to show the general relationship between
the increase in flood flows following urbanization and
both the percentage of the basin paved and the flood
recurrence interval. In general, (1) floods with a return
period of a year or longer are not affected by a 5%
paving of their catchment, (2) small floods may be
increased by 10 times by urbanization, (3) floods with
a return period of 100 yr may be doubled in size by a
30% paving of the basin, and (4) the effect of
urbanization declines, in relative terms, as flood
recurrence intervals increase.
(10) Loram, A., Thompson, K., Warren, P. H. and
Gaston, K. J. (2008) ‘Urban domestic gardens (XII):
The richness and composition of the flora in five
UK cities’, Journal of Vegetation Science, 19(3), pp.
321–330.
(11) Loram, A., Warren, P., Thompson, K. and Gaston,
K. (2011) ‘Urban domestic gardens: the effects of
human interventions on garden composition.’,
Environmental management, 48(4), pp. 808–24.
(12) Perry, T. and Nawaz, R. (2008) ‘An
investigation into the extent and impacts of
hard surfacing of domestic gardens in an
area of Leeds, United Kingdom’, Landscape
and Urban Planning, 86(1), pp. 1–13.
(13) Royal Horticultural Society (2011) Gardening
matters: Urban gardens. London.
(14) Smith, C. (2010) London: Garden City?
Investigating the changing anatomy of London’s
private gardens, and the scale of their loss.,

61
Greenspace Information for Greater London.
London.
(15) Smith, R. M., Warren, P. H., Thompson, K. and
Gaston, K. J. (2005) ‘Urban domestic gardens (VI):
environmental correlates of invertebrate species
richness’, Biodiversity and Conservation, 15(8), pp.
2415–2438.
(16) Taylor, J. R. and Lovell, S. T. (2013) ‘Urban home
food gardens in the Global North: research
traditions and future directions’, Agriculture and
Human Values, 31(2), pp. 285–305.
(17) Tompkins, E. L. and Eakin, H. (2012) ‘Managing
private and public adaptation to climate change’,
Global Environmental Change, 22(1), pp. 3–11.
(18) Royal Horticultural Society (2016) Waterlogging
and Flooding.
www.rhs.org.uk/Advice/Profile?PID=235 (accessed
on 04/05/16)
Advice on preventing and dealing with water logging
(19) This Is Money (2015): So the 'Waitrose effect'
adds 12% to your home's value - but what else
will? Ten top factors that boost a property's
price...
http://www.thisismoney.co.uk/money/mortgagesho
me/article-3033530/Ten-factors-boost-property-s-
price.html
(Accessed on 04/05/2016
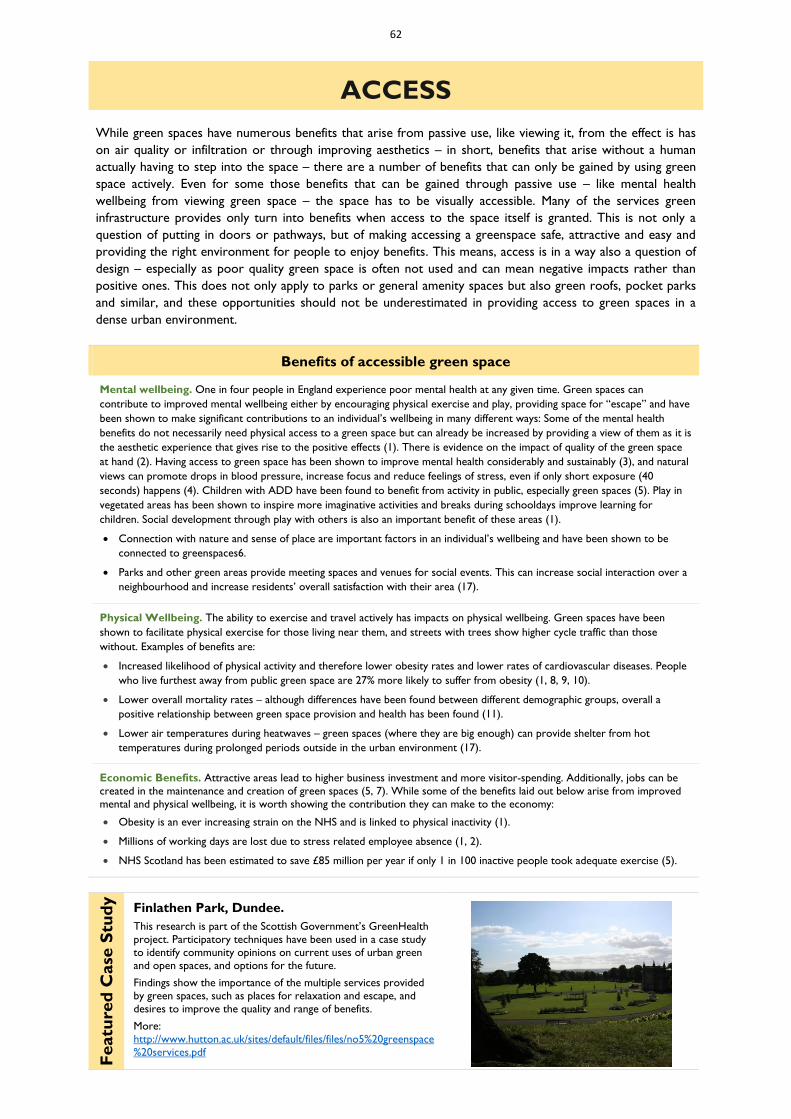
62
ACCESS
While green spaces have numerous benefits that arise from passive use, like viewing it, from the effect is has
on air quality or infiltration or through improving aesthetics – in short, benefits that arise without a human
actually having to step into the space – there are a number of benefits that can only be gained by using green
space actively. Even for some those benefits that can be gained through passive use – like mental health
wellbeing from viewing green space – the space has to be visually accessible. Many of the services green
infrastructure provides only turn into benefits when access to the space itself is granted. This is not only a
question of putting in doors or pathways, but of making accessing a greenspace safe, attractive and easy and
providing the right environment for people to enjoy benefits. This means, access is in a way also a question of
design – especially as poor quality green space is often not used and can mean negative impacts rather than
positive ones. This does not only apply to parks or general amenity spaces but also green roofs, pocket parks
and similar, and these opportunities should not be underestimated in providing access to green spaces in a
dense urban environment.
Benefits of accessible green space
Mental wellbeing. One in four people in England experience poor mental health at any given time. Green spaces can
contribute to improved mental wellbeing either by encouraging physical exercise and play, providing space for “escape” and have
been shown to make significant contributions to an individual’s wellbeing in many different ways: Some of the mental health
benefits do not necessarily need physical access to a green space but can already be increased by providing a view of them as it is
the aesthetic experience that gives rise to the positive effects (1). There is evidence on the impact of quality of the green space
at hand (2). Having access to green space has been shown to improve mental health considerably and sustainably (3), and natural
views can promote drops in blood pressure, increase focus and reduce feelings of stress, even if only short exposure (40
seconds) happens (4). Children with ADD have been found to benefit from activity in public, especially green spaces (5). Play in
vegetated areas has been shown to inspire more imaginative activities and breaks during schooldays improve learning for
children. Social development through play with others is also an important benefit of these areas (1).
Connection with nature and sense of place are important factors in an individual’s wellbeing and have been shown to be
connected to greenspaces6.
Parks and other green areas provide meeting spaces and venues for social events. This can increase social interaction over a
neighbourhood and increase residents’ overall satisfaction with their area (17).
Physical Wellbeing. The ability to exercise and travel actively has impacts on physical wellbeing. Green spaces have been
shown to facilitate physical exercise for those living near them, and streets with trees show higher cycle traffic than those
without. Examples of benefits are:
Increased likelihood of physical activity and therefore lower obesity rates and lower rates of cardiovascular diseases. People
who live furthest away from public green space are 27% more likely to suffer from obesity (1, 8, 9, 10).
Lower overall mortality rates – although differences have been found between different demographic groups, overall a
positive relationship between green space provision and health has been found (11).
Lower air temperatures during heatwaves – green spaces (where they are big enough) can provide shelter from hot
temperatures during prolonged periods outside in the urban environment (17).
Economic Benefits. Attractive areas lead to higher business investment and more visitor-spending. Additionally, jobs can be
created in the maintenance and creation of green spaces (5, 7). While some of the benefits laid out below arise from improved
mental and physical wellbeing, it is worth showing the contribution they can make to the economy:
Obesity is an ever increasing strain on the NHS and is linked to physical inactivity (1).
Millions of working days are lost due to stress related employee absence (1, 2).
NHS Scotland has been estimated to save £85 million per year if only 1 in 100 inactive people took adequate exercise (5).
Featu
red
Case
Stu
dy
Finlathen Park, Dundee.
This research is part of the Scottish Government’s GreenHealth
project. Participatory techniques have been used in a case study
to identify community opinions on current uses of urban green
and open spaces, and options for the future.
Findings show the importance of the multiple services provided
by green spaces, such as places for relaxation and escape, and
desires to improve the quality and range of benefits.
More:
http://www.hutton.ac.uk/sites/default/files/files/no5%20greenspace
%20services.pdf
63
Enabling Access
Physical Accessibility Maintenance Information
For many people, but especially for
groups like elderly or disabled, physical
access and the state of the environment
can inhibit use of a greenspace. Improve
access with:
Signs and maps close to and
throughout the park
Maintenance of footpaths
Public transport connections
Visible lack of maintenance can have a
negative impact on the use of green
space. Be aware of:
Litter removal and repair of
damage/vandalism
Overgrown vegetation and dog mess
(Potential trade-off: overgrown, wild
areas may be perceived as untidy but
be important factors for wildlife.
Make sure to designate specific
wildlife areas and provide
explanatory signs.)
Information on how and where
damage should be reported and
rapid response
Lack of information about existence or
facilities available in a greenspace can be
a barrier to its use.
Make information about facilities and
services and how they can be used
easily accessible (e.g. online)
Within the area, maps and signs help
find important services and areas
introduce staff (e.g. rangers,
gardeners, volunteers) into the area
to provide a first point of contact
and community interaction
Safety Comfort Community Ownership
Perceived safety risks are a key barrier
to the use of green spaces. Improve
access with:
Sufficient lighting. Street lighting has
been shown to reduce levels of
crime, and increase levels of
perceived safeness.
Avoid dense wooded13 or shrubby
areas, and maintain lines of sight and
visibility of exits throughout the
area, and take advantage of existing
infrastructure and buildings for
natural surveillance (e.g. visibility
form cafes, offices…).
Wide main paths to give pedestrians
enough space to pass by.
While a greenspace consisting of only
vegetation and pathways may provide a
nice corridor to walk through, ensuring
certain needs can be met locally can
increase time spent in a space and its
attractiveness to new groups.
Especially in bigger areas, having well
maintained facilities addressing
different target groups like cafes and
public toilets can increase use by
existing user groups and attract new
groups.
Providing specific areas for dogs
(increase use by dog owners and
make other user groups feel more
comfortable)
Local communities often want to be
involved of the management of ‘their’
space. This can work in multiple ways
and be coordinated via existing groups
(e.g. schools) or ones that are
specifically set up for a particular space:
Involving ‘problem groups’ can avoid
single group dominance in public
spaces and help increase use and
make the space safer.
Community lead green space
management can address local needs
differently and possibly allow better
maintenance without increased
budget
Working with other communities or
groups with similar remits and aims
opens opportunities for
collaboration and knowledge
transfer
Maximising benefits: how could we make the most of gardens?
Some benefits can be maximised by taking some things into consideration when restoring/designing green space:
Educational Value
Signs explaining natural features and informing target groups (e.g. schools) about accessibility of the area
Mental Restorative Value
Natural Components have been found to increase the restorative potential of greenspaces. Provision of certain
elements is therefore important (e.g. large, sparsely distributed trees, meadow-like areas with flowers, water
features) (14, 15, 16, 17)
Provide sheltered places (but keep visibility/safety aspects in mind)
Play areas for children of different ages. To maximise benefits especially for younger children, a challenging, varied
environment is likely to increase development of balance, co-ordination and creativity.
Access to natural ‘wild’ areas provide different social and cultural benefits – e.g. inspiring children to more imaginative
play and so increasing their cognitive abilities,
Physical Health
Facilities supporting recreational activities – this can also mean use of land like detention basins where they are not
vegetated – e.g. as skate boarding areas, basketball courts, etc (depending on size and suitability).
High and low intensity activities should be encouraged – walking paths as well as exercise areas are therefore useful
64
References:
(1) Bhatti, M1. BOP Consulting. Green Spaces : The
Benefits for London Green Spaces : The Benefits for
London. Topical Interest Paper (2013).
(2) 2. Commission for Architecture and the Built
Environment. Decent parks? Decent behaviour?:
The link between the quality of parks and user
behaviour Contents Foreword. 1–17 (2005).
(3) 3. Alcock, I., White, M. P., Wheeler, B. W.,
Fleming, L. E. & Depledge, M. H. Longitudinal
effects on mental health of moving to greener and
less green urban areas. Environ. Sci. Technol. 48,
1247–55 (2014).
(4) 4. Lee, K. E., Williams, K. J. H., Sargent, L. D.,
Williams, N. S. G. & Johnson, K. A. 40-second
green roof views sustain attention: The role of
micro-breaks in attention restoration. J. Environ.
Psychol. 42, 182–189 (2015).
(5) 5. Woolley, H., Rose, S., Carmona, M. &
Freedman, J. The Value of Public Space. Exchange
Organizational Behavior Teaching Journal (2004).
(6) 6. Zelenski, J. M. & Nisbet, E. K. Happiness and
Feeling Connected: The Distinct Role of Nature
Relatedness. Environ. Behav. 46, 3–23 (2012).
(7) 7. Forest Research. Benefits of Green
Infrastructure. (2010).
(8) 8. Coombes, E., Jones, A. P. & Hillsdon, M. The
relationship of physical activity and overweight to
objectively measured green space accessibility and
use. Soc. Sci. Med. 70, 816–22 (2010).
(9) 9. Faculty of Public Health. Great Outdoors :
How Our Natural Health Service Uses Green
Space To Improve Wellbeing. 1–8 (2010).
(10) 10. Mitchell, R. & Popham, F. Greenspace, urbanity
and health: relationships in England. J. Epidemiol.
Community Health 61, 681–3 (2007).
(11) 11. van den Berg, M. et al. Health benefits of green
spaces in the living environment: A systematic
review of epidemiological studies. Urban For. Urban
Green. 14, 806–816 (2015).
(12) 12. Sunderland, T. Microeconomic Evidence for the
Benefits of Investment in the Environment - Review.
Natural England Research Reports, Number 033 2,
(2012).
(13) 13. Milligan, C. & Bingley, A. Restorative places or
scary spaces? The impact of woodland on the
mental well-being of young adults. Health Place 13,
799–811 (2007).
(14) 14. Nordh, H., Hartig, T., Hagerhall, C. M. & Fry,
G. Components of small urban parks that predict
the possibility for restoration. Urban For. Urban
Green. 8, 225–235 (2009).
(15) 15. White, M. et al. Blue space: The importance of
water for preference, affect, and restorativeness
ratings of natural and built scenes. J. Environ.
Psychol. 30, 482–493 (2010).
(16) 16. Völker, S. & Kistemann, T. ‘I’m always entirely
happy when I'm here!’ Urban blue enhancing
human health and well-being in Cologne and
Düsseldorf, Germany. Soc. Sci. Med. 78, 113–24
(2013).
(17) 17. Foley, R. & Kistemann, T. Blue space
geographies: Enabling health in place. Health Place
35, 157–65 (2015).
References and Guidance on Giving Access
(18) Commission for Architecture and the Built
Environment. Decent parks? Decent behaviour?:
The link between the quality of parks and user
behaviour Contents Foreword. 1–17 (2005).
(19) Crime and Public Safety. How Trees and
Vegetation Relate to Aggression and Violence (no
date). Available at:
https://depts.washington.edu/hhwb/datasheets/GC
GH_datasheet.Crime.pdf
(20) Kuo, F. E. and Sullivan, W. C. (2001) ‘Environment
and Crime in the Inner City: Does Vegetation
Reduce Crime?’, Environment and Behavior, 33(3),
pp. 343–367.
(21) McCormack, G. R., Rock, M., Toohey, A. M. and
Hignell, D. (2010) ‘Characteristics of urban parks
associated with park use and physical activity: a
review of qualitative research.’, Health & place,
16(4), pp. 712–26.
(22) National Audit Office (2006) ‘Enhancing Urban
Green Space.’, Report by the Comptroller and
Auditor General (London).
Weblinks:
(23) Forestry Commission – Accessibility of Green
Space http://www.forestry.gov.uk/fr/urgc-7eeggr
(24) Enhancing Urban Greenspace:
https://www.nao.org.uk/wp-
content/uploads/2006/03/0506935.pdf
(25) National Recreation and Parks Association, US.
Pocket Parks:
https://www.nrpa.org/uploadedFiles/nrpaorg/Grant
s_and_Partners/Recreation_and_Health/Resource
s/Issue_Briefs/Pocket-Parks.pdf
(26) PlacemakingResource – Maximising the use and
benefits of public parks and spaces:
http://www.placemakingresource.com/article/1364
326/advice-maximising-use-benefits-public-parks-
spaces/