attachment a-1: acronyms
TRANSCRIPT

Attachment A-1 Acronyms
ACE - Affordable Clean Energy LTPPA - Long-Term Purchased Power AgreementAC - AirConditioning MMBtu - One million British thermal unitsADSTF - Anchor Data Set Task Force MMcf - One Million cubic feet (gas)AMI - Advanced Metering Initiative MPS - Montana Power StationAMS - Automated Metering System MS - Modeling SubcommitteeAPS - Arizona Public Service Company MVA - Mega Volt AmpATC - Available Transfer Capacity MVS - Modeling and Validation SubcommitteeBA - Balancing Area MW - Mega Watt (1000 kW)BPSPRTF - BPS Planning Task Force MWh - MegaWatt-hours (1000 kWh)BTM - Behind the Meter NAAQS - National Ambient Air Quality StandardsBtu - British thermal unit NARUC - National Association of Regulatory Utility Commissioners CAA - Clean Air Act NERC - North American Electric Reliability CouncilCAGR - Compound Annual Growth Rates NMAC - New Mexico Administrative CodeCAISO - California Independent System Operator NMPRC - New Mexico Public Regulation CommissionCC - Combined Cycle NMSA - New Mexico Statutes AnnotatedCCGT Combined Cycle Gas Turbine NOAA - National Oceanic and Atmospheric AdministrationCCN - Certificate of Convenience and Necessity NOx - Nitrogen OxideCDD - Cooling Degree Days NREL - National Renewable Energy LaboratoryCO2 - Carbon Dioxide OampM - Operation and Maintenance ExpensesCPP - Clean Power Plan OASIS - Open Access Same Time Information Systems CPP - Critical Peak Pricing OATT - Open Access Transmission TariffCT - Combustion Turbine PCAP - Perfect Capacitycts Cents PM - Particulate MatterCWIP - Construction Work in Progress PNM - Public Service Company of New Mexico DG - Distributed Generation PPA - Power Purchase AgreementDR - Demand Response PRM - Planning Reserve MarginDRPP - Demand Response Pilot Program PSLF - Positive Sequence Load FlowDS - Data Subcommittee PTP - Point to Point Transmission ServiceDSM - Demand Side Management PTR - Peak Time RebateE3 - Energy+Envronmental Economics PUCT - Public Utility Commission of TexasEE - Energy Efficiency PUHCA - Public Utility Holding Company ActEHV - Extra High Voltage PURPA - Public Utility Regulatory Policies ActEIM - Energy Imbalance Market PV - solar photovoltaicELCC - Effective Load Carrying Capability PVNGS - Palo Verde Nuclear Generating StationEPA - Environmental Protection Agency QF - Qualifying FacilityEPE - El Paso Electric RASS - Residential Appliance Saturation SurveyERCOT - Electric Reliability Council of Texas RAC - Reliability Assessment CommitteeEUEA - Efficient Use of Energy Act RCT - Reasonable Cost ThresholdEUL - Average Estimated Useful Life REA - New Mexico Renewable Energy ActEV - Electric Vehicle REC - Renewable Energy CertificateFCPP - Four Corners Power Plant Recip - Reciprocating EngineFERC - Federal Energy Regulatory Commission RFP - Request For ProposalFPPCAC - Fuel and Purchased Power Cost Adjustment Clause RGEC - Rio Grande Electric Co OperativeGE - General Electric RPS - Renewable Portfolio StandardGHG - Greenhouse Gas SCR - Short Circuit RatioGWh Giga Watt hours (1000 MWh) RTO - Regional Transmission OrganizationH2 - Hydrogen SDS - Scenario Development SubcommitteeHFAB - Holloman Air Force Base SEC - Securities and Exchange CommissionHDD - Heating Degree Days SNMIC - Southern New Mexico Import CapabilityHV - High Voltage SNMTS - Southern New Mexico Transmission SystemHVAC - Heating Ventilation and Air Conditioning SO2 - Sulfur dioxideHVDC - High Voltage Direct Current SPP - Southwest Power PoolIBR - Inverter Based Resource SRS - System Review SubcommitteeICAP - Installed Capacity SRP - Salt River ProjectIOU - Investor Owned Utility STATCOM - Static CompensatorIRP - Integrated Resource Plan SSP - Separate System PlanningITC - Investment Tax Credit SVC - Static VAR CompensatorJSIS - Joint Synchronized Information Subcommittee StS - Studies SubcommitteekV - kilo Volt SWAT - Southwest Area TransmissionkVA - kilo Volt Ampere TOD - Time-of-DaykW - kilo Watts TEP - Tucson Electric Power CompanykWh - kilo Watt hours TOU - Time-of-UseLampR - Loads and Resources Table TTC - Total Transfer CapabilityLC - Least Cost UPC - use per customerLCOE - Levelized Cost of Energy UVLS Under Voltage Load ShedLED - Light Emitting Diode VAR - volt-ampere reactiveLF - Load Factor VOC - Volatile Organic CompoundsLOLE - Loss of Load Expectation WECC - Western Electricity Coordinating CouncilLM - Load Management WSCC - Western Systems Coordinating CouncilLRTF - Loads and Resources Task Force WSPP - Western Systems Power Pool
Page 1 of 1
Attachment B-1 2021 Forecast
Page 1 of 2
Attachment B-1 2021 Forecast
Page 2 of 2
Atta
chm
ent B
-2
2021
Ene
rgy
Fore
cast
by
Juri
sdic
iton
Page
1 o
f 2
Nativ
e Sy
stem
Ene
rgy
2021
2022
2023
2024
2025
2026
2027
2028
2029
2030
Texa
sRe
side
ntial
269
252
0274
858
7280
156
2284
349
6288
974
5294
484
1301
222
7308
429
1315
986
1324
432
1Co
mmercial amp
Ind
ustrial Sm
all
197
388
8199
542
7200
073
7200
223
7200
400
5200
866
8201
424
1201
995
8202
782
4203
746
3Co
mmercial amp
Ind
ustrial La
rge
97205
097
638
498
000
598
299
598
543
698
739
998
894
699
013
099
099
999
159
3Street L
ighting
41523
42056
42506
42961
43420
43880
44323
44748
45182
45638
OPA
117
458
0119
392
2120
482
1121
593
7122
580
0123
538
3124
374
7124
823
3125
523
2126
259
7
Total Te
xas
685
456
1695
637
6702
963
0708
762
7714
840
7722
017
1730
348
5738
736
0747
909
8758
161
3
New
Mex
ico
Reside
ntial
84538
186
170
686
900
987
582
188
307
989
354
290
602
192
040
493
682
395
364
8Co
mmercial amp
Ind
ustrial Sm
all
52893
553
705
853
927
054
119
454
487
955
041
555
693
956
507
257
338
558
004
7Co
mmercial amp
Ind
ustrial La
rge
75359
74520
73908
73388
72906
72438
71976
71517
71059
70602
Street L
ighting
198
1202
0205
2208
3211
7215
0218
4221
8225
3228
7OPA
38232
138
851
038
920
839
051
639
089
539
178
139
325
039
519
039
770
740
120
6
Total Ne
w Mex
ico
183
397
6186
381
4187
344
7188
300
2189
387
5191
032
6193
037
1195
440
1198
122
7200
779
0
Compa
ny U
se13
815
13940
14065
14192
14319
14448
14578
14709
14842
14975
RGEC
69263
70552
71840
73128
74417
75705
76993
78282
79570
80858
Total Na
tive
System
877
161
6890
468
2898
898
2905
794
9913
101
8922
065
0932
542
7943
475
2955
473
7968
523
7 Attachment B-2 2021 Energy Forecast by Jurisdiction
Page 1 of 2
Atta
chm
ent B
-2
2021
Ene
rgy
Fore
cast
by
Juri
sdic
iton
Page
2 o
f 2
Nativ
e Sy
stem
Ene
rgy
Texa
sRe
side
ntial
Commercial amp
Ind
ustrial Sm
all
Commercial amp
Ind
ustrial La
rge
Street L
ighting
OPA To
tal Te
xas
New
Mex
ico
Reside
ntial
Commercial amp
Ind
ustrial Sm
all
Commercial amp
Ind
ustrial La
rge
Street L
ighting
OPA To
tal Ne
w Mex
ico
Compa
ny U
seRG
EC
Total Na
tive
System
2031
2032
2033
2034
2035
2036
2037
2038
2039
2040
333
498
3342
514
8352
517
0363
602
6375
962
4389
587
8404
605
4421
733
9441
440
3464
854
4204
512
9205
422
5206
458
0207
569
3208
712
3209
803
4210
956
8212
148
1213
518
9215
185
799
194
899
209
599
206
099
186
899
153
899
108
999
053
598
989
198
916
798
837
546
133
46630
47109
47569
48017
48461
48888
49300
49698
50084
126
833
5127
422
3128
043
5128
627
9129
128
0129
588
9130
154
2130
722
8131
363
7132
253
7
768
652
9779
232
0790
935
5803
743
5817
758
3832
935
1849
658
7868
523
9890
209
4916
139
8
96992
298
850
0100
911
0103
341
5106
103
0109
184
3112
739
2116
969
2121
992
0128
248
958
968
059
896
060
908
361
944
462
902
063
948
065
148
866
433
367
751
268
996
470
144
69687
69229
68772
68315
67857
67400
66943
66485
66028
232
3236
0239
7243
5247
3251
1254
9258
6262
3265
940
330
540
627
540
956
641
342
841
744
542
112
442
453
442
783
543
117
443
550
0
203
537
5206
578
2209
938
6213
749
4217
828
3222
281
5227
336
2233
138
8239
771
3247
663
9
15110
15246
15383
15522
15662
15803
15945
16088
16233
16379
82147
83435
84723
86012
87300
88589
89877
91165
92454
93742
981
916
1995
678
410
108
847
10276
463
10458
828
10656
557
10875
771
11123
881
11408
494
11748
158 Attachment B-2 2021 Energy
Forecast by JurisdictionPage 2 of 2
Atta
chm
ent B
-3
2021
Dem
and
Fore
cast
by
Juri
sdic
tion
Page
1 o
f 2
Nativ
e Sy
stem
Dem
and
2021
2022
2023
2024
2025
2026
2027
2028
2029
2030
Texa
sRe
side
ntial
653
667
681
689
703
717
735
751
773
795
Commercial amp
Ind
ustrial Sm
all
479
484
486
485
488
489
491
492
496
499
Commercial amp
Ind
ustrial La
rge
236
237
238
238
240
241
241
241
242
243
Street L
ighting
1010
1010
1111
1111
1111
OPA
285
290
293
295
298
301
303
304
307
309
Total Te
xas
166
2168
8170
8171
8174
0175
9178
2179
9183
0185
8
New
Mex
ico
Reside
ntial
201
205
207
208
211
214
217
220
224
229
Commercial amp
Ind
ustrial Sm
all
126
128
128
129
130
132
133
135
137
139
Commercial amp
Ind
ustrial La
rge
1818
1817
1717
1717
1717
Street L
ighting
00
00
11
11
11
OPA
9192
9393
9394
9494
9596
Total Ne
w Mex
ico
436
443
446
448
452
457
462
466
475
482
Compa
ny U
se3
33
33
44
44
4RG
EC19
2020
2021
2122
2223
23
Total Na
tive
System
212
1215
5217
7219
0221
6224
0226
9229
2233
1236
7 Attachment B-3 2021 Demand Forecast by Jurisdiction
Page 1 of 2
Atta
chm
ent B
-3
2021
Dem
and
Fore
cast
by
Juri
sdic
tion
Page
2 o
f 2
Nativ
e Sy
stem
Dem
and
Texa
sRe
side
ntial
Commercial amp
Ind
ustrial Sm
all
Commercial amp
Ind
ustrial La
rge
Street L
ighting
OPA To
tal Te
xas
New
Mex
ico
Reside
ntial
Commercial amp
Ind
ustrial Sm
all
Commercial amp
Ind
ustrial La
rge
Street L
ighting
OPA To
tal Ne
w Mex
ico
Compa
ny U
seRG
EC
Total Na
tive
System
2031
2032
2033
2034
2035
2036
2037
2038
2039
2040
819
841
871
901
936
973
102
0107
2113
4120
650
250
451
051
552
052
453
253
954
855
824
424
424
524
624
724
725
025
225
425
611
1112
1212
1212
1313
1331
231
331
631
932
232
432
833
233
734
3
188
8191
3195
4199
2203
6207
9214
2220
8228
6237
6
233
237
243
250
257
265
276
288
303
321
142
144
147
150
153
155
159
164
168
173
1717
1717
1716
1616
1717
11
11
11
11
11
9797
9910
010
110
210
410
510
710
9
489
496
506
517
528
540
556
574
595
620
44
44
44
44
44
2324
2425
2525
2627
2728
240
4243
6248
8253
8259
3264
8272
8281
3291
3302
8 Attachment B-3 2021 Demand Forecast by Jurisdiction
Page 2 of 2
Attachment B-4 Losses by Transmission and Distribution
Year Secondary Primary Transmission FERC Losses (MW)2021 130 4 4 0 1382022 133 4 4 0 1412023 135 4 4 0 1442024 137 4 4 0 1452025 139 4 4 0 1482026 141 4 4 0 1502027 144 4 5 0 1532028 146 4 5 0 1552029 149 4 5 0 1592030 152 5 5 0 1622031 155 5 5 0 1652032 157 5 5 0 1672033 160 5 5 0 1712034 163 5 5 0 1742035 166 5 5 0 1772036 169 5 5 0 1802037 173 5 5 0 1842038 176 5 6 0 1872039 179 5 6 0 1912040 182 5 6 0 194
Page 1 of 1
Attachment B-5 Typical Days Tables
Page 1 of 10
Attachment B-5 Typical Days Tables
Page 2 of 10
Attachment B-5 Typical Days Tables
Page 3 of 10
Attachment B-5 Typical Days Tables
Page 4 of 10
Attachment B-5 Typical Days Tables
Page 5 of 10
Attachment B-5 Typical Days Tables
Page 6 of 10
Attachment B-5 Typical Days Tables
Page 7 of 10
Attachment B-5 Typical Days Tables
Page 8 of 10
Attachment B-5 Typical Days Tables
Page 9 of 10
Attachment B-5 Typical Days Tables
Page 10 of 10
Page 1 of 7
Attachment C-1 Transmission Facilities TABLE 1 Existing EPE Transmission Lines 115 kV and Above
EL PASO ELECTRIC COMPANY
Existing 115 kV and Above Internal Lines
RATING LENGTH STATE
From To kV Circuit MVA
Normal MVA
Emerg Miles From To AMRAD EMPIRE 345 1 400 400 12510 TX NM CALIENTE AMRAD 345 1 785 785 567 TX NM CALIENTE PICANTE 345 1 788 788 73 TX TX EMPIRE EDDY 345 1 836 836 05 NM NM HIDALGO GREENLEE 345 1 765 765 600 NM AZ LUNA AFTON 345 1 921 987 573 NM NM LUNA DIABLO 345 1 939 939 849 NM NM LUNA HIDALGO 345 1 659 659 505 NM NM MACHO SPRINGS
LUNA 345 1 1031 1390 249 NM NM
MACHO SPRINGS
SPRINGERVILLE 345 1 728 728 2014 NM AZ
NEWMAN ARROYO 345 1 700 700 303 TX NM NEWMAN AFTON 345 1 924 1028 299 TX NM PICANTE NEWMAN 345 1 786 786 162 TX TX WESTMESA ARROYO 345 1 680 680 2018 NM NM MIMBRES TAP AIRPORT 115 1 123 163 27 NM NM
AMRAD HOLLOMAN 115 1 121 121 225 NM NM ANTHONY ARROYO 115 1 114 114 244 NM NM ANTHONY BORDER STEEL 115 1 165 220 52 NM TX ANTHONY SALOPEK 115 1 165 220 173 NM NM ANTHONY NEWMAN 115 1 165 212 123 NM TX ANTHONY NUWAY 115 1 165 220 66 NM TX ASCARATE TROWBRIDGE 115 1 181 181 05 TX TX ASCARATE COPPER 115 1 185 246 14 TX TX ASCARATE JUAREZ 115 1 185 247 24 TX AUSTIN MARLOW 115 1 227 227 12 TX TX BIGGS BLISS
INDUSTRIAL 115 1 185 246 22 TX TX
BLISS INDUSTRIAL
LIBERTY 115 1 185 246 22 TX TX
BUTTERFIELD FT BLISS 115 1 135 180 19 TX TX CALIENTE DIAMOND HEAD 115 1 185 247 61 TX TX CALIENTE MPS 115 1 69 87 85 TX TX CALIENTE MPS 115 2 268 332 31 TX TX CALIENTE MPS 115 3 268 332 31 TX TX CALIENTE VISTA 115 1 166 221 66 TX TX CHAPARRAL ORO GRANDE 115 1 135 165 354 NM NM COPPER PENDALE 115 1 185 246 51 TX TX
Page 2 of 7
EL PASO ELECTRIC COMPANY Existing 115 kV and Above
Internal Lines
RATING LENGTH STATE
From To kV Circuit MVA
Normal MVA
Emerg Miles From To COYOTE RGC_DELL CITY 115 1 23 23 108 TX TX COYOTE MONTWOOD 115 1 185 246 79 TX NM CROMO RIO GRANDE 115 1 135 180 09 TX TX DIABLO RIO GRANDE 115 1 332 441 29 NM TX DIABLO RIO GRANDE 115 2 332 441 29 NM NM DIABLO JUAREZ 115 1 185 247 23 NM DIAMOND HEAD
LANE 115 1 185 247 28 TX TX
DURAZNO ASCARATE 115 1 185 246 33 TX NM DYER SHEARMAN 115 1 135 180 96 TX TX DYER AUSTIN 115 1 185 246 21 TX TX EXECUTIVE RIO GRANDE 115 1 271 359 29 TX TX FT BLISS AUSTIN 115 1 135 180 18 TX TX GLOBAL REACH
VISTA 115 1 329 329 30 TX TX
HATCH JORNADA 115 1 45 45 334 NM NM JORNADA ARROYO 115 1 79 79 49 NM NM LANE WRANGLER 115 1 165 220 10 TX TX LAS CRUCES ARROYO 115 1 165 220 41 NM NM LAS CRUCES SALOPEK 115 1 165 220 50 NM NM LEO EAST DYER 115 1 185 246 38 TX TX LEO EAST MILAGRO 115 1 185 246 44 TX TX LIBERTY GLOBAL REACH 115 1 185 246 26 TX TX MAR LARGO 115 1 29 29 114 NM NM MARLOW TROWBRIDGE 115 1 181 181 11 TX TX MESA AUSTIN 115 1 165 220 61 TX TX MESA RIO GRANDE 115 1 268 268 23 TX NM MILAGRO NEWMAN 115 1 185 246 63 TX TX MONTWOOD CALIENTE 115 1 185 246 50 TX TX MPS COYOTE 115 1 249 387 31 TX TX MPS MONTWOOD 115 1 249 387 70 TX TX NEWMAN CHAPARRAL 115 1 135 180 29 TX NM NEWMAN BUTTERFIELD 115 1 135 280 167 TX TX NEWMAN SHEARMAN 115 1 135 280 73 TX TX NEWMAN PIPELINE 115 1 185 246 98 TX TX NEWMAN PICANTE 115 1 185 246 136 TX TX NUWAY MONTOYA 115 1 165 220 36 TX TX ORO GRANDE AMRAD 115 1 135 165 123 NM NM ORO GRANDE WHITE SANDS 115 1 75 75 228 NM NM PATRIOT NEWMAN 115 1 135 180 15 TX TX PATRIOT CROMO 115 1 135 180 184 TX TX PELICANO HORIZON 115 1 185 246 67 TX TX
Page 3 of 7
EL PASO ELECTRIC COMPANY Existing 115 kV and Above
Internal Lines
RATING LENGTH STATE
From To kV Circuit MVA
Normal MVA
Emerg Miles From To PELICANO MONTWOOD 115 1 185 246 38 TX TX PENDALE LANE 115 1 185 246 15 TX TX PICANTE GLOBAL REACH 115 1 185 246 60 TX TX PICANTE BIGGS 115 1 185 246 23 TX TX PIPELINE BIGGS 115 1 135 180 136 TX TX RIO GRANDE RIPLEY 115 1 165 220 30 NM TX RIPLEY THORN 115 1 135 180 19 TX TX SALOPEK ARROYO 115 1 135 180 107 NM NM SANTA TERESA MONTOYA 115 1 185 246 74 NM TX SANTA TERESA DIABLO 115 1 169 225 89 NM NM SCOTSDALE VISTA 115 1 135 180 52 TX TX SOL LANE 115 1 135 180 21 TX TX SOL VISTA 115 1 185 246 20 TX TX SPARKS HORIZON 115 1 185 246 38 TX TX SUNSET NORTH DURAZNO 115 1 185 246 46 TX TX SUNSET NORTH EXECUTIVE 115 1 271 359 23 TX TX THORN MONTOYA 115 1 135 180 30 TX TX WRANGLER SPARKS 115 1 185 246 40 TX TX
- Internal refers to lines within EPEs Balancing Area including lines connecting EPE to neighboring utilities however not including line segments partially owned by EPE external to EPEs control area
- Some transmission lines were identified to be capacity limited by smaller jumpers connected at the substations The line ratings reflected in the above table are based on-line jumper upgrade assumptions
- The ratings are generally based on conductor thermal capacities but may be derated due to sag limitations or other factors
- RGC_DC is Rio Grande Electric Cooperative Dell City - Emerg is short for Emergency
Page 4 of 7
TABLE 2 Existing 115 kV EPE Substation Transformers
EL PASO ELECTRIC COMPANY
Existing 115 kV Load amp Step-up Substation Transformers
RATING Normal Emergency State
MVA MVA AIRPORT 115239 336 376 NM AMRAD 115249 85 95 NM
ANTHONY T1 115239 336 376 NM ANTHONY T2 115239 560 627 NM ARROYO T2 115239 336 376 NM ARROYO T4 115239 336 376 NM
ASCARATE T4 11569 112 1288 TX ASCARATE T5 11569 112 1288 TX
AUSTIN T1 115138 500 560 TX AUSTIN T2 115138 560 627 TX
BORDER STEEL 115 T1 115138 392 439 TX
BORDER STEEL 115 T2 115138 392 439 TX BUTTERFIELD T1 115138 300 336 TX BUTTERFIELD T2 115138 300 336 TX
CALIENTE T3 115138 336 376 TX CENTRAL TEMP T1 115138 336 376 TX
CHAPARRAL T1 115138 336 376 NM CHAPARRAL T2 115138 336 376 NM
COPPER T1 115138 300 336 TX COPPER GEN T2 138115 840 941 TX
COX T2 11569 560
644 NM COYOTE T1 115138 300 336 TX CROMO T1 115138 300 336 TX CROMO T2 115138 336 376 TX
DIAMOND HEAD T1 115138 336 376 TX DURAZNO T1 115138 336 376 TX
DYER T3 11569 112 1288 TX EMRLD T1 115138 125 140 NM
EXECUTIVE T1 115138 560 627 TX EXECUTIVE T2 115138 560 627 TX
FT BLISS T1 115138 560 627 TX FT BLISS T2 115132 280 314 TX
GLOBAL REACH T1 115138 336 376 TX GLOBAL REACH T2 115138 560 627 TX
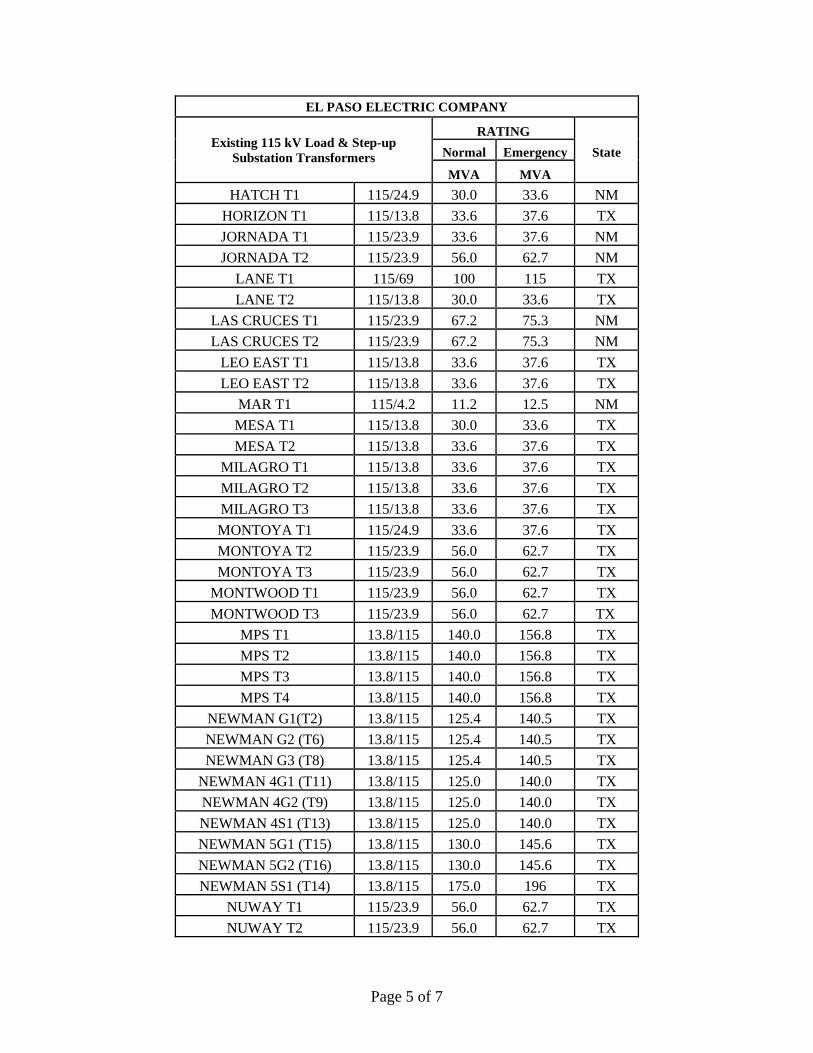
Page 5 of 7
EL PASO ELECTRIC COMPANY
Existing 115 kV Load amp Step-up Substation Transformers
RATING Normal Emergency State
MVA MVA HATCH T1 115249 300 336 NM
HORIZON T1 115138 336 376 TX JORNADA T1 115239 336 376 NM JORNADA T2 115239 560 627 NM
LANE T1 11569 100 115 TX LANE T2 115138 300 336 TX
LAS CRUCES T1 115239 672 753 NM LAS CRUCES T2 115239 672 753 NM
LEO EAST T1 115138 336 376 TX LEO EAST T2 115138 336 376 TX
MAR T1 11542 112 125 NM MESA T1 115138 300 336 TX MESA T2 115138 336 376 TX
MILAGRO T1 115138 336 376 TX MILAGRO T2 115138 336 376 TX MILAGRO T3 115138 336 376 TX MONTOYA T1 115249 336 376 TX MONTOYA T2 115239 560 627 TX MONTOYA T3 115239 560 627 TX
MONTWOOD T1 115239 560 627 TX MONTWOOD T3 115239 560 627 TX
MPS T1 138115 1400 1568 TX MPS T2 138115 1400 1568 TX MPS T3 138115 1400 1568 TX MPS T4 138115 1400 1568 TX
NEWMAN G1(T2) 138115 1254 1405 TX NEWMAN G2 (T6) 138115 1254 1405 TX NEWMAN G3 (T8) 138115 1254 1405 TX
NEWMAN 4G1 (T11) 138115 1250 1400 TX NEWMAN 4G2 (T9) 138115 1250 1400 TX NEWMAN 4S1 (T13) 138115 1250 1400 TX NEWMAN 5G1 (T15) 138115 1300 1456 TX NEWMAN 5G2 (T16) 138115 1300 1456 TX NEWMAN 5S1 (T14) 138115 1750 196 TX
NUWAY T1 115239 560 627 TX NUWAY T2 115239 560 627 TX
Page 6 of 7
EL PASO ELECTRIC COMPANY
Existing 115 kV Load amp Step-up Substation Transformers
RATING Normal Emergency State
MVA MVA PATRIOT T1 115138 336 376 TX
PELICANO T1 115239 560 627 TX PELICANO T2 115239 560 627 TX PENDALE T1 115138 336 376 TX PENDALE T2 115138 560 627 TX PICACHO T1 115249 560 627 NM REDEYE T1 115138 140 157 NM
RIO GRANDE T1 11569 112 1288 NM RIO GRANDE T2 11569 112 1288 NM
RIO GRANDE G8 (T7) 175115 1680 1882 NM RIO GRANDE G9 (T17) 138115 1320 1478 NM
RIPLEY T1 115138 336 376 TX RIPLEY T2 115138 560 627 TX
SALOPEK T1 115249 280 314 NM SALOPEK T2 115249 280 314 NM SALOPEK T3 115249 280 314 NM
SANTA TERESA T1 115239 336 376 NM SANTA TERESA T2 115239 336 376 NM
SCOTSDALE T1 11569 112 1288 TX SCOTSDALE T4 115138 560 627 TX SCOTSDALE T5 115138 560 627 TX SHEARMAN T1 115138 300 336 TX
SOL T1 115138 336 376 TX SOL T2 115138 300 336 TX
SPARKS T1 115138 336 376 TX SPARKS T2 115138 560 627 TX SPARKS T3
11569 100 115 TX
SUNSET NORTH T1 115138 336 376 TX SUNSET NORTH T2 115138 336 376 TX SUNSET NORTH T3 11569 112 1288 TX
TALAVERA TEMP T1 115239 165 185 NM THORN T1 115138 336 376 TX THORN T2 115138 336 376 TX
TRIUMPH TEMP T1 115239 336 376 TX VISTA T1 115138 300 336 TX VISTA T2 115138 300 336 TX
Page 7 of 7
EL PASO ELECTRIC COMPANY
Existing 115 kV Load amp Step-up Substation Transformers
RATING Normal Emergency State
MVA MVA WHITE SANDS T1 115138 300 336 NM
WRANGLER T1 115138 500 560 TX
Attachment C-2 Existing Units Operating CharacteristicsCapacity Factor ()Resources 2021 2024 2025 2027 2031 2035 2040 2045Newman 1 2 0 0 0 0 0 0 0Newman 2 1 0 0 0 0 0 0 0Newman 3 10 3 0 1 0 0 0 0Newman 4 14 5 2 3 1 0 0 0Newman 5 64 54 38 41 44 40 41 47Newman 6 0 12 7 8 6 3 4 6Copper 2 0 0 0 0 0 0 0Montana 1 26 29 20 21 20 11 19 23Montana 2 26 28 19 21 21 14 23 24Montana 3 17 17 13 14 12 5 11 16Montana 4 50 42 30 32 28 23 28 28Rio Grande 7 0 0 0 0 0 0 0 0Rio Grande 8 3 1 0 0 0 0 0 0Rio Grande 9 13 5 2 3 3 0 0 2Gas Peaker 0 0 0 0 0 3 3 5Palo Verde 1 94 94 94 94 94 94 94 94Palo Verde 2 94 94 94 94 94 94 94 94Palo Verde 3 94 94 94 94 94 94 94 94
Fuel Cost ($000)Resources 2021 2024 2025 2027 2031 2035 2040 2045Newman 1 431$ -$ -$ -$ -$ -$ -$ -$ Newman 2 273$ -$ -$ -$ -$ -$ -$ -$ Newman 3 2299$ 667$ 55$ 248$ 46$ -$ -$ -$ Newman 4 7893$ 2755$ 1080$ 1435$ 716$ -$ -$ -$ Newman 5 31126$ 24367$ 17006$ 19659$ 22951$ 21785$ 24625$ 28990$ Newman 6 -$ 5465$ 3596$ 4364$ 3762$ 1579$ 2380$ 4155$ Copper 1076$ 70$ -$ -$ -$ -$ -$ -$ Montana 1 4595$ 4852$ 3414$ 3784$ 4030$ 2455$ 4318$ 5534$ Montana 2 5153$ 5102$ 3468$ 4056$ 4447$ 3079$ 5285$ 5678$ Montana 3 3332$ 3087$ 2371$ 2768$ 2638$ 1279$ 2780$ 4139$ Montana 4 9507$ 7298$ 5383$ 5946$ 5665$ 4884$ 6297$ 6488$ Rio Grande 7 93$ -$ -$ -$ -$ -$ -$ -$ Rio Grande 8 1340$ 264$ 49$ 93$ -$ -$ -$ -$ Rio Grande 9 2675$ 987$ 413$ 603$ 706$ 42$ 22$ 429$ Gas Peaker -$ -$ -$ -$ -$ 1081$ 2239$ 5645$ Palo Verde 1 12111$ 12185$ 12222$ 12259$ 12370$ 12500$ 12667$ 12834$ Palo Verde 2 12169$ 12244$ 12281$ 12318$ 12430$ 12561$ 12728$ 12896$ Palo Verde 3 12111$ 12185$ 12222$ 12259$ 12370$ 12500$ 12667$ 12834$
Heat Rate (MMBtuMWh)Newman 1 1228Newman 2 1151Newman 3 1097Newman 4 1012Newman 5 7741Newman 6 10101Copper 19916Montana 1 9373Montana 2 9334Montana 3 9933Montana 4 9339Rio Grande 7 1179Rio Grande 8 11902Rio Grande 9 9881Gas Peaker 10101Palo Verde 1 10Palo Verde 2 10Palo Verde 3 10
Page 1 of 2
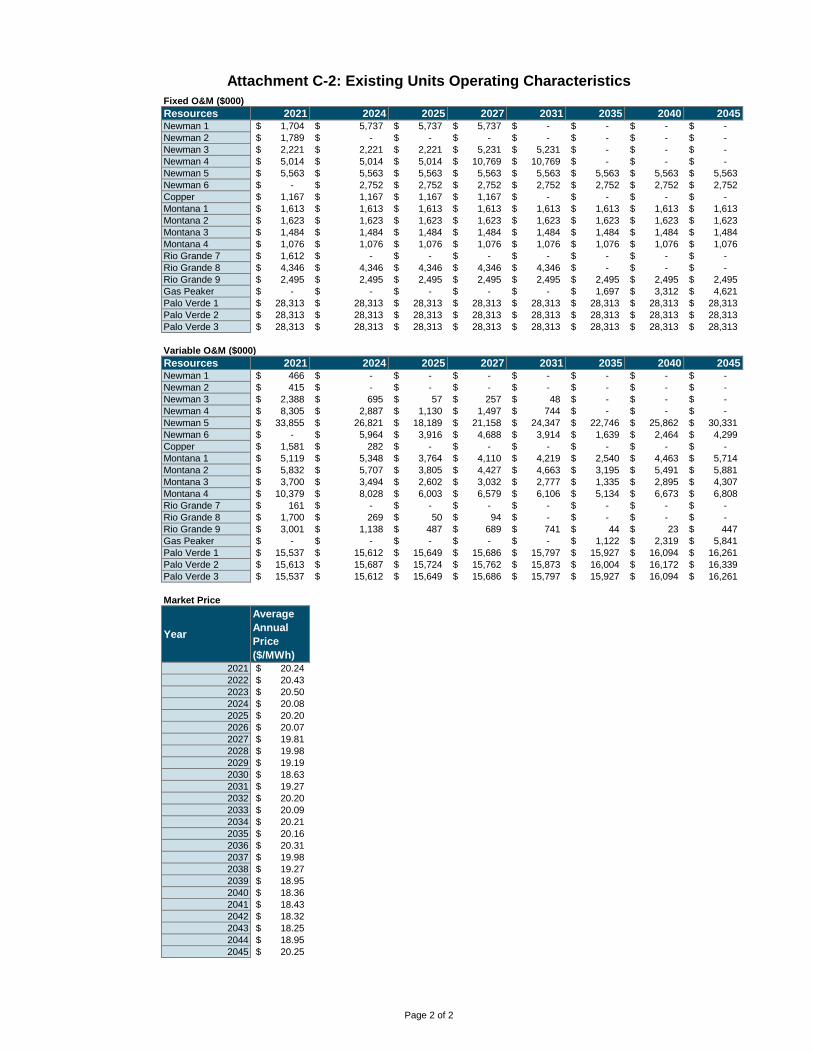
Attachment C-2 Existing Units Operating CharacteristicsFixed OampM ($000)Resources 2021 2024 2025 2027 2031 2035 2040 2045Newman 1 1704$ 5737$ 5737$ 5737$ -$ -$ -$ -$ Newman 2 1789$ -$ -$ -$ -$ -$ -$ -$ Newman 3 2221$ 2221$ 2221$ 5231$ 5231$ -$ -$ -$ Newman 4 5014$ 5014$ 5014$ 10769$ 10769$ -$ -$ -$ Newman 5 5563$ 5563$ 5563$ 5563$ 5563$ 5563$ 5563$ 5563$ Newman 6 -$ 2752$ 2752$ 2752$ 2752$ 2752$ 2752$ 2752$ Copper 1167$ 1167$ 1167$ 1167$ -$ -$ -$ -$ Montana 1 1613$ 1613$ 1613$ 1613$ 1613$ 1613$ 1613$ 1613$ Montana 2 1623$ 1623$ 1623$ 1623$ 1623$ 1623$ 1623$ 1623$ Montana 3 1484$ 1484$ 1484$ 1484$ 1484$ 1484$ 1484$ 1484$ Montana 4 1076$ 1076$ 1076$ 1076$ 1076$ 1076$ 1076$ 1076$ Rio Grande 7 1612$ -$ -$ -$ -$ -$ -$ -$ Rio Grande 8 4346$ 4346$ 4346$ 4346$ 4346$ -$ -$ -$ Rio Grande 9 2495$ 2495$ 2495$ 2495$ 2495$ 2495$ 2495$ 2495$ Gas Peaker -$ -$ -$ -$ -$ 1697$ 3312$ 4621$ Palo Verde 1 28313$ 28313$ 28313$ 28313$ 28313$ 28313$ 28313$ 28313$ Palo Verde 2 28313$ 28313$ 28313$ 28313$ 28313$ 28313$ 28313$ 28313$ Palo Verde 3 28313$ 28313$ 28313$ 28313$ 28313$ 28313$ 28313$ 28313$
Variable OampM ($000)Resources 2021 2024 2025 2027 2031 2035 2040 2045Newman 1 466$ -$ -$ -$ -$ -$ -$ -$ Newman 2 415$ -$ -$ -$ -$ -$ -$ -$ Newman 3 2388$ 695$ 57$ 257$ 48$ -$ -$ -$ Newman 4 8305$ 2887$ 1130$ 1497$ 744$ -$ -$ -$ Newman 5 33855$ 26821$ 18189$ 21158$ 24347$ 22746$ 25862$ 30331$ Newman 6 -$ 5964$ 3916$ 4688$ 3914$ 1639$ 2464$ 4299$ Copper 1581$ 282$ -$ -$ -$ -$ -$ -$ Montana 1 5119$ 5348$ 3764$ 4110$ 4219$ 2540$ 4463$ 5714$ Montana 2 5832$ 5707$ 3805$ 4427$ 4663$ 3195$ 5491$ 5881$ Montana 3 3700$ 3494$ 2602$ 3032$ 2777$ 1335$ 2895$ 4307$ Montana 4 10379$ 8028$ 6003$ 6579$ 6106$ 5134$ 6673$ 6808$ Rio Grande 7 161$ -$ -$ -$ -$ -$ -$ -$ Rio Grande 8 1700$ 269$ 50$ 94$ -$ -$ -$ -$ Rio Grande 9 3001$ 1138$ 487$ 689$ 741$ 44$ 23$ 447$ Gas Peaker -$ -$ -$ -$ -$ 1122$ 2319$ 5841$ Palo Verde 1 15537$ 15612$ 15649$ 15686$ 15797$ 15927$ 16094$ 16261$ Palo Verde 2 15613$ 15687$ 15724$ 15762$ 15873$ 16004$ 16172$ 16339$ Palo Verde 3 15537$ 15612$ 15649$ 15686$ 15797$ 15927$ 16094$ 16261$
Market Price
Year
Average Annual Price ($MWh)
2021 2024$ 2022 2043$ 2023 2050$ 2024 2008$ 2025 2020$ 2026 2007$ 2027 1981$ 2028 1998$ 2029 1919$ 2030 1863$ 2031 1927$ 2032 2020$ 2033 2009$ 2034 2021$ 2035 2016$ 2036 2031$ 2037 1998$ 2038 1927$ 2039 1895$ 2040 1836$ 2041 1843$ 2042 1832$ 2043 1825$ 2044 1895$ 2045 2025$
Page 2 of 2
Attachment D-1 E3 EPE Report Model Results June Page 1 of 34
Scenario Resource Type 2021 2024 2025 2027 2031 2035 2040 2045Least-Cost (Reference Case) Nuclear (Palo Verde) 5148 5148 5148 5148 5148 5148 5148 5148
Nuclear (SMR) - - - - - - - - Gas - Steam Turbine 140 34 7 3 - - - - Gas - Combined Cycle 1767 1373 1022 1111 1130 1065 1318 1502 Gas - Combustion Turbine 1027 1169 836 880 773 754 1250 1640 Biomass - - - - - - - - Geothermal - - - - - - - - Wind - - 379 382 375 336 409 720 Solar 289 952 1467 1551 2200 3058 3443 4239 Battery Storage - 12 (26) (48) (129) (217) (220) (250) Imports 391 336 260 259 282 273 358 440 Demand Response - - - - - - - - Hydrogen - - - - - - - - BTM Solar 37 135 165 225 344 460 601 763 Load 8771 9155 9258 9512 10123 10878 12308 14203 Excess Generation 14 130 430 342 496 657 373 475
Least-Cost Case + ETA Resources Nuclear (Palo Verde) 5148 5148 5148 5148 5148 5148 5148 5148 Nuclear (SMR) - - - - - - - - Gas - Steam Turbine 140 34 3 3 - - - - Gas - Combined Cycle 1767 1373 898 963 998 899 1053 1145 Gas - Combustion Turbine 1027 1169 720 761 686 461 790 1043 Biomass - - - - - - - - Geothermal - - - - - - - - Wind - - 670 688 675 555 653 815 Solar 289 953 1464 1530 2211 3351 4068 5345 Battery Storage - 12 (31) (45) (122) (241) (281) (370) Imports 391 336 220 239 184 245 275 314 Demand Response - - - - - - - - Hydrogen - - - - - - - - BTM Solar 37 135 165 225 344 460 601 763 Load 8771 9155 9258 9512 10123 10878 12308 14203 Excess Generation 14 130 564 480 558 1272 1040 940
Separate System Planning Nuclear (Palo Verde) 5148 5148 5148 5148 5148 5148 5148 5148 Nuclear (SMR) - - - - - - - - Gas - Steam Turbine 140 34 1 2 - - - - Gas - Combined Cycle 1766 1388 1031 1122 1141 969 1192 1385 Gas - Combustion Turbine 1040 1177 754 831 807 477 795 1105 Biomass - - - - - - - - Geothermal - - - - - - - - Wind - - 305 306 295 182 165 412 Solar 289 949 1648 1690 2236 3708 4532 5512 Battery Storage - 12 (54) (60) (138) (295) (350) (405) Imports 391 327 259 247 291 229 225 282 Demand Response - - - - - - - - Hydrogen - - - - - - - - BTM Solar 37 135 165 225 344 460 601 763 Load 8771 9155 9258 9512 10123 10878 12308 14203 Excess Generation 14 134 450 407 444 1288 2358 2353
Annual Energy (GWh)
Attachment D-1 E3 EPE Report Model Results June Page 2 of 34
Scenario Resource Type 2021 2024 2025 2027 2031 2035 2040 2045Annual Energy (GWh)
Separate System Planning (w H2) Nuclear (Palo Verde) 5148 5148 5148 5148 5148 5148 5148 5148 Nuclear (SMR) - - - - - - - - Gas - Steam Turbine 140 34 1 2 - - - - Gas - Combined Cycle 1766 1388 979 1049 1090 1035 1153 1384 Gas - Combustion Turbine 1040 1177 728 819 735 688 779 1129 Biomass - - - - - - - - Geothermal - - - - - - - - Wind - - 447 451 433 405 510 657 Solar 289 949 1594 1633 2242 3101 4087 5075 Battery Storage - 12 (56) (60) (136) (218) (297) (352) Imports 391 327 251 245 266 260 261 327 Demand Response - - - - - - - - Hydrogen - - - - - - 65 71 BTM Solar 37 135 165 225 344 460 601 763 Load 8771 9155 9258 9512 10123 10878 12308 14203 Excess Generation 14 133 444 402 574 772 872 919
Low Load Growth Nuclear (Palo Verde) 5148 5148 5148 5148 5148 5148 5148 5148 Nuclear (SMR) - - - - - - - - Gas - Steam Turbine 101 27 2 3 - - - - Gas - Combined Cycle 1596 1244 978 1065 1127 1025 1258 1472 Gas - Combustion Turbine 983 1065 799 875 806 644 1109 1492 Biomass - - - - - - - - Geothermal - - - - - - - - Wind - - 333 336 335 291 350 562 Solar 282 919 1293 1309 1805 2833 3220 3993 Battery Storage - 8 (29) (29) (96) (209) (215) (245) Imports 381 325 269 262 289 268 342 437 Demand Response - - - - - - - - Hydrogen - - - - - - - - BTM Solar 37 135 165 225 344 460 601 763 Load 8492 8862 8958 9194 9759 10459 11813 13623 Excess Generation 22 163 337 318 410 642 359 427
High Load Growth Nuclear (Palo Verde) 5148 5148 5148 5148 5148 5148 5148 5148 Nuclear (SMR) - - - - - - - - Gas - Steam Turbine 195 50 5 3 - - - - Gas - Combined Cycle 1909 1522 1067 1151 1118 1107 1388 1500 Gas - Combustion Turbine 1088 1256 865 914 776 867 1411 1747 Biomass - - - - - - - - Geothermal - - - - - - - - Wind - - 431 436 413 396 463 976 Solar 293 983 1651 1751 2569 3257 3642 4464 Battery Storage - 14 (47) (68) (159) (222) (222) (256) Imports 400 343 272 271 280 284 372 441 Demand Response - - - - - - - - Hydrogen - - - - - - - - BTM Solar 37 135 165 225 344 460 601 763 Load 9050 9447 9558 9830 10488 11297 12803 14783 Excess Generation 10 100 394 290 554 655 385 540
Attachment D-1 E3 EPE Report Model Results June Page 3 of 34
Scenario Resource Type 2021 2024 2025 2027 2031 2035 2040 2045Annual Energy (GWh)
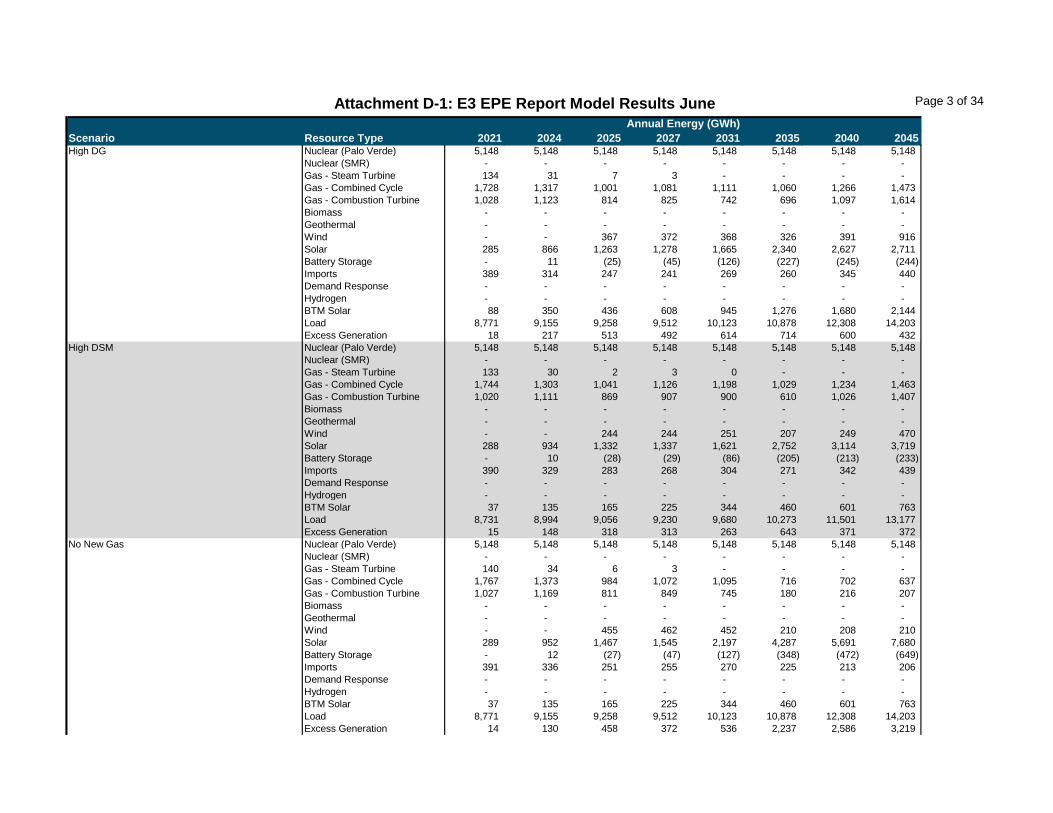
High DG Nuclear (Palo Verde) 5148 5148 5148 5148 5148 5148 5148 5148 Nuclear (SMR) - - - - - - - - Gas - Steam Turbine 134 31 7 3 - - - - Gas - Combined Cycle 1728 1317 1001 1081 1111 1060 1266 1473 Gas - Combustion Turbine 1028 1123 814 825 742 696 1097 1614 Biomass - - - - - - - - Geothermal - - - - - - - - Wind - - 367 372 368 326 391 916 Solar 285 866 1263 1278 1665 2340 2627 2711 Battery Storage - 11 (25) (45) (126) (227) (245) (244) Imports 389 314 247 241 269 260 345 440 Demand Response - - - - - - - - Hydrogen - - - - - - - - BTM Solar 88 350 436 608 945 1276 1680 2144 Load 8771 9155 9258 9512 10123 10878 12308 14203 Excess Generation 18 217 513 492 614 714 600 432
High DSM Nuclear (Palo Verde) 5148 5148 5148 5148 5148 5148 5148 5148 Nuclear (SMR) - - - - - - - - Gas - Steam Turbine 133 30 2 3 0 - - - Gas - Combined Cycle 1744 1303 1041 1126 1198 1029 1234 1463 Gas - Combustion Turbine 1020 1111 869 907 900 610 1026 1407 Biomass - - - - - - - - Geothermal - - - - - - - - Wind - - 244 244 251 207 249 470 Solar 288 934 1332 1337 1621 2752 3114 3719 Battery Storage - 10 (28) (29) (86) (205) (213) (233) Imports 390 329 283 268 304 271 342 439 Demand Response - - - - - - - - Hydrogen - - - - - - - - BTM Solar 37 135 165 225 344 460 601 763 Load 8731 8994 9056 9230 9680 10273 11501 13177 Excess Generation 15 148 318 313 263 643 371 372
No New Gas Nuclear (Palo Verde) 5148 5148 5148 5148 5148 5148 5148 5148 Nuclear (SMR) - - - - - - - - Gas - Steam Turbine 140 34 6 3 - - - - Gas - Combined Cycle 1767 1373 984 1072 1095 716 702 637 Gas - Combustion Turbine 1027 1169 811 849 745 180 216 207 Biomass - - - - - - - - Geothermal - - - - - - - - Wind - - 455 462 452 210 208 210 Solar 289 952 1467 1545 2197 4287 5691 7680 Battery Storage - 12 (27) (47) (127) (348) (472) (649) Imports 391 336 251 255 270 225 213 206 Demand Response - - - - - - - - Hydrogen - - - - - - - - BTM Solar 37 135 165 225 344 460 601 763 Load 8771 9155 9258 9512 10123 10878 12308 14203 Excess Generation 14 130 458 372 536 2237 2586 3219
Attachment D-1 E3 EPE Report Model Results June Page 4 of 34
Scenario Resource Type 2021 2024 2025 2027 2031 2035 2040 2045Annual Energy (GWh)
No Lifetime Extensions Nuclear (Palo Verde) 5148 5148 5148 5148 5148 5148 5148 5148 Nuclear (SMR) - - - - - - - - Gas - Steam Turbine 140 34 2 0 - - - - Gas - Combined Cycle 1767 1373 948 1015 1050 1056 1308 1502 Gas - Combustion Turbine 1027 1169 707 680 634 745 1242 1640 Biomass - - - - - - - - Geothermal - - - - - - - - Wind - - 397 400 370 364 442 722 Solar 289 953 1693 1897 2475 3050 3432 4237 Battery Storage - 12 (38) (94) (164) (216) (219) (250) Imports 391 336 235 241 267 271 354 440 Demand Response - - - - - - - - Hydrogen - - - - - - - - BTM Solar 37 135 165 225 344 460 601 763 Load 8771 9155 9258 9512 10123 10878 12308 14203 Excess Generation 14 129 634 428 592 661 374 475
High Gas Price Nuclear (Palo Verde) 5148 5148 5148 5148 5148 5148 5148 5148 Nuclear (SMR) - - - - - - - - Gas - Steam Turbine 125 31 3 3 - - - - Gas - Combined Cycle 1787 1400 983 1060 1062 999 1234 1347 Gas - Combustion Turbine 1008 1120 764 786 698 607 1121 1361 Biomass - - - - - - - - Geothermal - - - - - - - - Wind - - 486 493 483 422 516 926 Solar 290 956 1465 1542 2190 3165 3570 4490 Battery Storage - 9 (31) (46) (126) (226) (232) (274) Imports 403 360 274 301 325 303 350 440 Demand Response - - - - - - - - Hydrogen - - - - - - - - BTM Solar 37 135 165 225 344 460 601 763 Load 8771 9155 9258 9512 10123 10878 12308 14203 Excess Generation 13 127 470 386 546 811 486 705
Low Carbon Price Nuclear (Palo Verde) 5148 5148 5148 5148 5148 5148 5148 5148 Nuclear (SMR) - - - - - - - - Gas - Steam Turbine 127 23 3 3 - - - - Gas - Combined Cycle 1803 1433 955 1021 1036 971 1189 1333 Gas - Combustion Turbine 1001 1107 711 750 678 571 1063 1333 Biomass - - - - - - - - Geothermal - - - - - - - - Wind - - 609 624 604 523 642 936 Solar 289 958 1476 1548 2179 3178 3576 4573 Battery Storage - 11 (32) (45) (124) (229) (234) (279) Imports 394 345 223 238 258 256 322 395 Demand Response - - - - - - - - Hydrogen - - - - - - - - BTM Solar 37 135 165 225 344 460 601 763 Load 8771 9155 9258 9512 10123 10878 12308 14203 Excess Generation 14 125 512 426 579 876 532 725
Attachment D-1 E3 EPE Report Model Results June Page 5 of 34
Scenario Resource Type 2021 2024 2025 2027 2031 2035 2040 2045Annual Energy (GWh)
Medium Carbon Price Nuclear (Palo Verde) 5148 5148 5148 5148 5148 5148 5148 5148 Nuclear (SMR) - - - - - - - - Gas - Steam Turbine 120 22 3 3 - - - - Gas - Combined Cycle 1822 1496 876 941 974 922 1115 1270 Gas - Combustion Turbine 983 1036 548 590 606 475 950 1199 Biomass - - - - - - - - Geothermal - - - - - - - - Wind - - 754 779 766 646 805 1098 Solar 290 961 1600 1663 2221 3268 3695 4746 Battery Storage - 7 (37) (47) (122) (230) (242) (293) Imports 399 354 200 210 187 190 235 271 Demand Response - - - - - - - - Hydrogen - - - - - - - - BTM Solar 37 135 165 225 344 460 601 763 Load 8771 9155 9258 9512 10123 10878 12308 14203 Excess Generation 13 121 763 676 588 911 560 726
High Carbon Price Nuclear (Palo Verde) 5148 5148 5148 5148 5148 5148 5148 5148 Nuclear (SMR) - - - - - - - - Gas - Steam Turbine 119 21 2 3 0 - - - Gas - Combined Cycle 1835 1540 658 724 862 872 979 832 Gas - Combustion Turbine 962 989 428 458 488 393 630 544 Biomass - - - - - - - - Geothermal - - - - - - - - Wind - - 869 904 927 776 940 832 Solar 290 963 1847 1900 2307 3272 4088 6364 Battery Storage - 2 (40) (46) (115) (230) (271) (474) Imports 408 362 181 195 162 187 193 192 Demand Response - - - - - - - - Hydrogen - - - - - - - - BTM Solar 37 135 165 225 344 460 601 763 Load 8771 9155 9258 9512 10123 10878 12308 14203 Excess Generation 13 120 1270 1182 882 1065 1041 1596
80 Clean by 2035 Nuclear (Palo Verde) 5148 5148 5148 5148 5148 5148 5148 5148 Nuclear (SMR) - - - - - - - - Gas - Steam Turbine 140 34 7 3 - - - - Gas - Combined Cycle 1767 1373 1022 1111 1127 1050 1159 1295 Gas - Combustion Turbine 1027 1169 836 880 766 696 1057 1256 Biomass - - - - - - - - Geothermal - - - - - - - - Wind - - 379 382 375 331 683 1029 Solar 289 952 1466 1551 2212 3155 3653 4715 Battery Storage - 12 (26) (48) (129) (224) (234) (290) Imports 391 336 261 260 278 264 240 286 Demand Response - - - - - - - - Hydrogen - - - - - - - - BTM Solar 37 135 165 225 344 460 601 763 Load 8771 9155 9258 9512 10123 10878 12308 14203 Excess Generation 14 130 431 343 514 770 469 738
Attachment D-1 E3 EPE Report Model Results June Page 6 of 34
Scenario Resource Type 2021 2024 2025 2027 2031 2035 2040 2045Annual Energy (GWh)
20 CO2 Red by 2040 Nuclear (Palo Verde) 5148 5148 5148 5148 5148 5148 5148 5148 Nuclear (SMR) - - - - - - - - Gas - Steam Turbine 140 34 7 3 - - - - Gas - Combined Cycle 1767 1373 1022 1111 1130 1065 1318 1342 Gas - Combustion Turbine 1027 1169 836 880 773 751 1249 1353 Biomass - - - - - - - - Geothermal - - - - - - - - Wind - - 379 382 375 336 409 927 Solar 289 952 1466 1549 2204 3061 3445 4548 Battery Storage - 12 (26) (48) (129) (217) (220) (277) Imports 391 336 261 262 277 274 357 397 Demand Response - - - - - - - - Hydrogen - - - - - - - - BTM Solar 37 135 165 225 344 460 601 763 Load 8771 9155 9258 9512 10123 10878 12308 14203 Excess Generation 14 130 431 345 491 655 371 705
40 CO2 Red by 2040 Nuclear (Palo Verde) 5148 5148 5148 5148 5148 5148 5148 5148 Nuclear (SMR) - - - - - - - - Gas - Steam Turbine 140 34 7 3 - - - - Gas - Combined Cycle 1767 1373 1022 1111 1127 1051 1133 1135 Gas - Combustion Turbine 1027 1169 836 880 766 696 980 985 Biomass - - - - - - - - Geothermal - - - - - - - - Wind - - 379 382 375 331 763 1034 Solar 289 953 1466 1549 2211 3151 3692 5268 Battery Storage - 12 (26) (48) (128) (224) (241) (350) Imports 391 336 261 262 279 265 232 219 Demand Response - - - - - - - - Hydrogen - - - - - - - - BTM Solar 37 135 165 225 344 460 601 763 Load 8771 9155 9258 9512 10123 10878 12308 14203 Excess Generation 14 129 432 345 515 768 533 965
60 CO2 Red by 2040 Nuclear (Palo Verde) 5148 5148 5148 5148 5148 5148 5148 5148 Nuclear (SMR) - - - - - - - - Gas - Steam Turbine 140 34 7 3 - - - - Gas - Combined Cycle 1767 1373 1022 1111 1127 1052 864 852 Gas - Combustion Turbine 1027 1169 836 880 766 698 561 560 Biomass - - - - - - - - Geothermal - - - - - - - - Wind - - 379 382 375 331 927 838 Solar 289 953 1466 1552 2213 3150 4319 6337 Battery Storage - 12 (26) (48) (128) (224) (276) (470) Imports 391 336 261 259 278 263 164 174 Demand Response - - - - - - - - Hydrogen - - - - - - - - BTM Solar 37 135 165 225 344 460 601 763 Load 8771 9155 9258 9512 10123 10878 12308 14203 Excess Generation 14 130 432 342 513 769 1338 1586
Attachment D-1 E3 EPE Report Model Results June Page 7 of 34
Scenario Resource Type 2021 2024 2025 2027 2031 2035 2040 2045Annual Energy (GWh)
80 CO2 Red by 2040 Nuclear (Palo Verde) 5148 5148 5148 5148 5148 5148 5148 5148 Nuclear (SMR) - - - - - - - - Gas - Steam Turbine 140 34 3 3 - - - - Gas - Combined Cycle 1767 1373 910 976 1017 907 577 550 Gas - Combustion Turbine 1027 1169 734 777 696 468 168 183 Biomass - - - - - - - - Geothermal - - - - - - - - Wind - - 638 654 638 532 1260 1231 Solar 289 952 1463 1531 2158 3371 4812 6758 Battery Storage - 12 (30) (45) (123) (239) (338) (517) Imports 391 336 227 241 245 232 80 88 Demand Response - - - - - - - - Hydrogen - - - - - - - - BTM Solar 37 135 165 225 344 460 601 763 Load 8771 9155 9258 9512 10123 10878 12308 14203 Excess Generation 14 130 546 461 605 1183 2430 2751
90 CO2 Red by 2040 Nuclear (Palo Verde) 5148 5148 5148 5148 5148 5148 5148 5148 Nuclear (SMR) - - - - - - - - Gas - Steam Turbine 140 34 3 3 - - - - Gas - Combined Cycle 1767 1373 910 978 1018 808 340 313 Gas - Combustion Turbine 1027 1169 736 776 696 320 41 58 Biomass - - - - - - - - Geothermal - - - - - - - - Wind - - 637 655 639 463 1965 1995 Solar 289 952 1462 1527 2156 3764 4483 6350 Battery Storage - 12 (30) (45) (123) (278) (311) (472) Imports 391 336 226 244 245 193 40 47 Demand Response - - - - - - - - Hydrogen - - - - - - - - BTM Solar 37 135 165 225 344 460 601 763 Load 8771 9155 9258 9512 10123 10878 12308 14203 Excess Generation 14 130 547 465 603 1440 3210 3645
100 CO2 Red by 2040 Nuclear (Palo Verde) 5148 5148 5148 5148 5148 5148 5148 5148 Nuclear (SMR) - - - - - - - - Gas - Steam Turbine 140 34 6 3 - - - - Gas - Combined Cycle 1767 1373 984 1072 1095 716 - - Gas - Combustion Turbine 1027 1169 811 849 745 180 - - Biomass - - - - - - - - Geothermal - - - - - - - - Wind - - 455 462 452 210 969 1406 Solar 289 952 1467 1545 2197 4287 6734 7595 Battery Storage - 12 (27) (47) (127) (348) (1163) (1402) Imports 391 336 251 255 270 225 - - Demand Response - - - - - - - - Hydrogen - - - - - - - - BTM Solar 37 135 165 225 344 460 620 1455 Load 8771 9155 9258 9512 10123 10878 12308 14203 Excess Generation 14 130 458 372 536 2237 10954 12232
Attachment D-1 E3 EPE Report Model Results June Page 8 of 34
Scenario Resource Type 2021 2024 2025 2027 2031 2035 2040 2045Annual Energy (GWh)
100 CO2 Red by 2040 (w H2) Nuclear (Palo Verde) 5148 5148 5148 5148 5148 5148 5148 5148 Nuclear (SMR) - - - - - - - - Gas - Steam Turbine 140 34 3 4 - - - - Gas - Combined Cycle 1767 1373 868 928 983 689 - - Gas - Combustion Turbine 1027 1169 692 732 627 210 - - Biomass - - - - - - - - Geothermal - - - - - - - - Wind - - 743 765 755 469 1700 1650 Solar 289 952 1460 1525 2217 4074 4752 6753 Battery Storage - 12 (31) (46) (122) (300) (336) (515) Imports 391 336 209 230 171 129 - - Demand Response - - - - - - - - Hydrogen - - - - - - 442 404 BTM Solar 37 135 165 225 344 460 601 763 Load 8771 9155 9258 9512 10123 10878 12308 14203 Excess Generation 14 130 616 528 575 1636 3102 3585
Attachment D-1 E3 EPE Report Model Results June Page 9 of 34
Scenario Resource TypeLeast-Cost (Reference Case) Nuclear (Palo Verde)
Nuclear (SMR)Gas - Steam TurbineGas - Combined CycleGas - Combustion TurbineBiomassGeothermalWindSolarBattery StorageImportsDemand ResponseHydrogenBTM SolarLoadExcess Generation
Least-Cost Case + ETA Resources Nuclear (Palo Verde)Nuclear (SMR)Gas - Steam TurbineGas - Combined CycleGas - Combustion TurbineBiomassGeothermalWindSolarBattery StorageImportsDemand ResponseHydrogenBTM SolarLoadExcess Generation
Separate System Planning Nuclear (Palo Verde)Nuclear (SMR)Gas - Steam TurbineGas - Combined CycleGas - Combustion TurbineBiomassGeothermalWindSolarBattery StorageImportsDemand ResponseHydrogenBTM SolarLoadExcess Generation
2021 2024 2025 2027 2031 2035 2040 2045622 622 622 622 622 622 622 622 - - - - - - - - 426 307 307 307 234 - - - 493 493 493 493 493 266 266 266 503 731 731 731 668 952 1111 1318 - - - - - - - - - - - - - - - - - - 109 109 109 109 109 196 115 385 629 629 904 1241 1298 1580 - 50 183 256 582 1032 1116 1284 - - - - - - - - 46 53 56 61 71 81 93 93
- - - - - - - - 18 65 80 108 166 221 289 368
- - - - - - - - - - - - - - - - 622 622 622 622 622 622 622 622 - - - - - - - - 426 307 307 307 234 - - - 493 493 493 493 493 266 266 266 503 731 731 731 668 879 999 1154 - - - - - - - - - - - - - - - - - - 204 204 204 204 204 264 115 385 629 629 887 1482 1684 2050 - 50 183 236 552 1084 1252 1698 - - - - - - - - 46 53 56 61 71 81 93 93
- - - - - - - - 18 65 80 108 166 221 289 368
- - - - - - - - - - - - - - - - 622 622 622 622 622 622 622 622 - - - - - - - - 426 307 307 307 234 - - - 493 493 493 493 493 266 266 266 503 731 731 731 668 835 835 989 - - - - - - - - - - - - - - - - - - 87 87 87 87 87 159 115 385 707 707 905 1667 2322 2639 - 50 271 293 634 1480 2207 2579 - - - - - - - - 46 53 56 61 71 81 93 93
- - - - - - - - 18 65 80 108 166 221 289 368
- - - - - - - - - - - - - - - -
Installed Capacity (MW)
Attachment D-1 E3 EPE Report Model Results June Page 10 of 34
Scenario Resource TypeSeparate System Planning (w H2) Nuclear (Palo Verde)
Nuclear (SMR)Gas - Steam TurbineGas - Combined CycleGas - Combustion TurbineBiomassGeothermalWindSolarBattery StorageImportsDemand ResponseHydrogenBTM SolarLoadExcess Generation
Low Load Growth Nuclear (Palo Verde)Nuclear (SMR)Gas - Steam TurbineGas - Combined CycleGas - Combustion TurbineBiomassGeothermalWindSolarBattery StorageImportsDemand ResponseHydrogenBTM SolarLoadExcess Generation
High Load Growth Nuclear (Palo Verde)Nuclear (SMR)Gas - Steam TurbineGas - Combined CycleGas - Combustion TurbineBiomassGeothermalWindSolarBattery StorageImportsDemand ResponseHydrogenBTM SolarLoadExcess Generation
2021 2024 2025 2027 2031 2035 2040 2045Installed Capacity (MW)
622 622 622 622 622 622 622 622 - - - - - - - - 426 307 307 307 234 - - - 493 493 493 493 493 266 266 266 503 731 731 731 668 825 825 989 - - - - - - - - - - - - - - - - - - 129 129 129 129 172 212 115 385 672 672 936 1290 1645 1990 - 50 269 291 601 1038 1420 1741 - - - - - - - - 46 53 56 61 71 81 93 93
- - - - - 121 195 206 18 65 80 108 166 221 289 368
- - - - - - - - - - - - - - - - 622 622 622 622 622 622 622 622 - - - - - - - - 426 307 307 307 234 - - - 493 493 493 493 493 266 266 266 503 731 731 731 668 847 989 1182 - - - - - - - - - - - - - - - - - - 96 96 96 96 96 153 115 385 541 541 743 1162 1216 1489 - 50 192 193 454 1012 1093 1257 - - - - - - - - 46 53 56 61 71 81 93 93
- - - - - - - - 18 65 80 108 166 221 289 368
- - - - - - - - - - - - - - - - 622 622 622 622 622 622 622 622 - - - - - - - - 426 307 307 307 234 - - - 493 493 493 493 493 266 266 266 503 731 731 731 668 1062 1237 1451 - - - - - - - - - - - - - - - - - - 123 123 123 123 123 266 115 385 677 677 1046 1309 1369 1660 - 50 249 342 716 1048 1136 1307 - - - - - - - - 46 53 56 61 71 81 93 93
- - - - - - - - 18 65 80 108 166 221 289 368
- - - - - - - - - - - - - - - -
Attachment D-1 E3 EPE Report Model Results June Page 11 of 34
Scenario Resource TypeHigh DG Nuclear (Palo Verde)
Nuclear (SMR)Gas - Steam TurbineGas - Combined CycleGas - Combustion TurbineBiomassGeothermalWindSolarBattery StorageImportsDemand ResponseHydrogenBTM SolarLoadExcess Generation
High DSM Nuclear (Palo Verde)Nuclear (SMR)Gas - Steam TurbineGas - Combined CycleGas - Combustion TurbineBiomassGeothermalWindSolarBattery StorageImportsDemand ResponseHydrogenBTM SolarLoadExcess Generation
No New Gas Nuclear (Palo Verde)Nuclear (SMR)Gas - Steam TurbineGas - Combined CycleGas - Combustion TurbineBiomassGeothermalWindSolarBattery StorageImportsDemand ResponseHydrogenBTM SolarLoadExcess Generation
2021 2024 2025 2027 2031 2035 2040 2045Installed Capacity (MW)
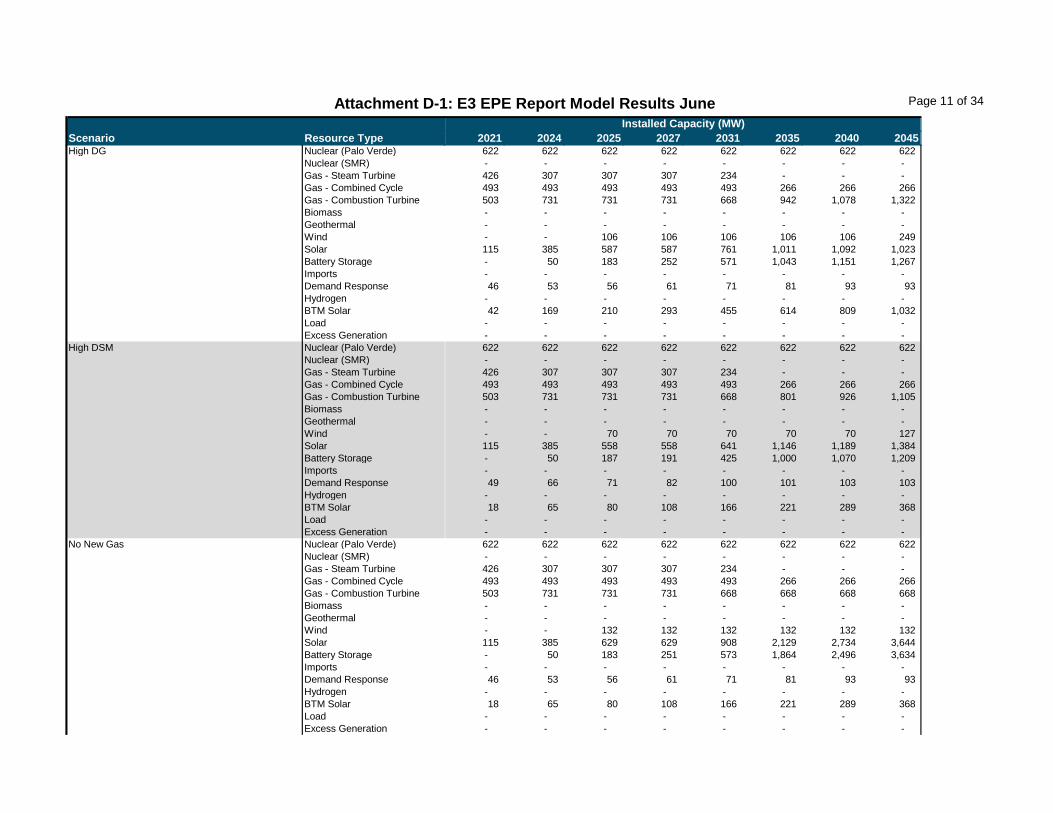
622 622 622 622 622 622 622 622 - - - - - - - - 426 307 307 307 234 - - - 493 493 493 493 493 266 266 266 503 731 731 731 668 942 1078 1322 - - - - - - - - - - - - - - - - - - 106 106 106 106 106 249 115 385 587 587 761 1011 1092 1023 - 50 183 252 571 1043 1151 1267 - - - - - - - - 46 53 56 61 71 81 93 93
- - - - - - - - 42 169 210 293 455 614 809 1032
- - - - - - - - - - - - - - - - 622 622 622 622 622 622 622 622 - - - - - - - - 426 307 307 307 234 - - - 493 493 493 493 493 266 266 266 503 731 731 731 668 801 926 1105 - - - - - - - - - - - - - - - - - - 70 70 70 70 70 127 115 385 558 558 641 1146 1189 1384 - 50 187 191 425 1000 1070 1209 - - - - - - - - 49 66 71 82 100 101 103 103
- - - - - - - - 18 65 80 108 166 221 289 368
- - - - - - - - - - - - - - - - 622 622 622 622 622 622 622 622 - - - - - - - - 426 307 307 307 234 - - - 493 493 493 493 493 266 266 266 503 731 731 731 668 668 668 668 - - - - - - - - - - - - - - - - - - 132 132 132 132 132 132 115 385 629 629 908 2129 2734 3644 - 50 183 251 573 1864 2496 3634 - - - - - - - - 46 53 56 61 71 81 93 93
- - - - - - - - 18 65 80 108 166 221 289 368
- - - - - - - - - - - - - - - -
Attachment D-1 E3 EPE Report Model Results June Page 12 of 34
Scenario Resource TypeNo Lifetime Extensions Nuclear (Palo Verde)
Nuclear (SMR)Gas - Steam TurbineGas - Combined CycleGas - Combustion TurbineBiomassGeothermalWindSolarBattery StorageImportsDemand ResponseHydrogenBTM SolarLoadExcess Generation
High Gas Price Nuclear (Palo Verde)Nuclear (SMR)Gas - Steam TurbineGas - Combined CycleGas - Combustion TurbineBiomassGeothermalWindSolarBattery StorageImportsDemand ResponseHydrogenBTM SolarLoadExcess Generation
Low Carbon Price Nuclear (Palo Verde)Nuclear (SMR)Gas - Steam TurbineGas - Combined CycleGas - Combustion TurbineBiomassGeothermalWindSolarBattery StorageImportsDemand ResponseHydrogenBTM SolarLoadExcess Generation
2021 2024 2025 2027 2031 2035 2040 2045Installed Capacity (MW)
622 622 622 622 622 622 622 622 - - - - - - - - 426 234 234 144 144 - - - 493 493 493 266 266 266 266 266 503 731 731 914 851 951 1109 1318 - - - - - - - - - - - - - - - - - - 118 118 118 118 118 196 115 385 769 769 1018 1235 1292 1579 - 50 230 434 743 1031 1115 1284 - - - - - - - - 46 53 56 61 71 81 93 93
- - - - - - - - 18 65 80 108 166 221 289 368
- - - - - - - - - - - - - - - - 622 622 622 622 622 622 622 622 - - - - - - - - 426 307 307 307 234 - - - 493 493 493 493 493 266 266 266 503 731 731 731 668 930 1088 1274 - - - - - - - - - - - - - - - - - - 142 142 142 142 142 264 115 385 629 629 905 1312 1369 1712 - 50 183 249 570 1047 1131 1312 - - - - - - - - 46 53 56 61 71 81 93 93
- - - - - - - - 18 65 80 108 166 221 289 368
- - - - - - - - - - - - - - - - 622 622 622 622 622 622 622 622 - - - - - - - - 426 307 307 307 234 - - - 493 493 493 493 493 266 266 266 503 731 731 731 668 920 1078 1267 - - - - - - - - - - - - - - - - - - 181 181 181 181 181 267 115 385 629 629 894 1312 1369 1747 - 50 183 240 559 1047 1131 1319 - - - - - - - - 46 53 56 61 71 81 93 93
- - - - - - - - 18 65 80 108 166 221 289 368
- - - - - - - - - - - - - - - -
Attachment D-1 E3 EPE Report Model Results June Page 13 of 34
Scenario Resource TypeMedium Carbon Price Nuclear (Palo Verde)
Nuclear (SMR)Gas - Steam TurbineGas - Combined CycleGas - Combustion TurbineBiomassGeothermalWindSolarBattery StorageImportsDemand ResponseHydrogenBTM SolarLoadExcess Generation
High Carbon Price Nuclear (Palo Verde)Nuclear (SMR)Gas - Steam TurbineGas - Combined CycleGas - Combustion TurbineBiomassGeothermalWindSolarBattery StorageImportsDemand ResponseHydrogenBTM SolarLoadExcess Generation
80 Clean by 2035 Nuclear (Palo Verde)Nuclear (SMR)Gas - Steam TurbineGas - Combined CycleGas - Combustion TurbineBiomassGeothermalWindSolarBattery StorageImportsDemand ResponseHydrogenBTM SolarLoadExcess Generation
2021 2024 2025 2027 2031 2035 2040 2045Installed Capacity (MW)
622 622 622 622 622 622 622 622 - - - - - - - - 426 307 307 307 234 - - - 493 493 493 493 493 266 266 266 503 731 731 731 668 909 1060 1248 - - - - - - - - - - - - - - - - - - 236 236 236 236 236 300 115 385 724 724 882 1312 1390 1813 - 50 183 228 547 1047 1136 1343 - - - - - - - - 46 53 56 61 71 81 93 93
- - - - - - - - 18 65 80 108 166 221 289 368
- - - - - - - - - - - - - - - - 622 622 622 622 622 622 622 622 - - - - - - - - 426 307 307 307 234 - - - 493 493 493 493 493 266 266 266 503 731 731 731 668 901 1001 1024 - - - - - - - - - - - - - - - - - - 300 300 300 300 300 301 115 385 927 927 972 1312 1640 2583 - 50 183 211 521 1047 1189 2082 - - - - - - - - 46 53 56 61 71 81 93 93
- - - - - - - - 18 65 80 108 166 221 289 368
- - - - - - - - - - - - - - - - 622 622 622 622 622 622 622 622 - - - - - - - - 426 307 307 307 234 - - - 493 493 493 493 493 266 266 266 503 731 731 731 668 938 1075 1253 - - - - - - - - - - - - - - - - - - 109 109 109 109 194 285 115 385 629 629 915 1312 1369 1805 - 50 183 256 580 1047 1131 1331 - - - - - - - - 46 53 56 61 71 81 93 93
- - - - - - - - 18 65 80 108 166 221 289 368
- - - - - - - - - - - - - - - -
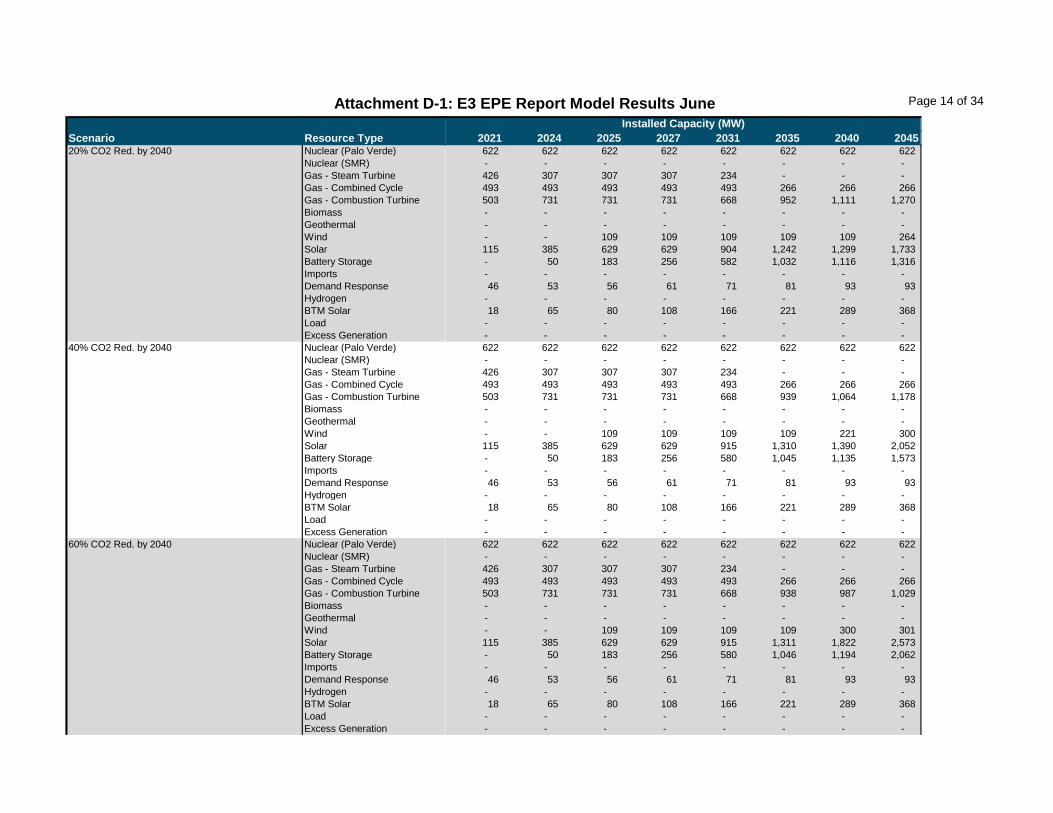
Attachment D-1 E3 EPE Report Model Results June Page 14 of 34
Scenario Resource Type20 CO2 Red by 2040 Nuclear (Palo Verde)
Nuclear (SMR)Gas - Steam TurbineGas - Combined CycleGas - Combustion TurbineBiomassGeothermalWindSolarBattery StorageImportsDemand ResponseHydrogenBTM SolarLoadExcess Generation
40 CO2 Red by 2040 Nuclear (Palo Verde)Nuclear (SMR)Gas - Steam TurbineGas - Combined CycleGas - Combustion TurbineBiomassGeothermalWindSolarBattery StorageImportsDemand ResponseHydrogenBTM SolarLoadExcess Generation
60 CO2 Red by 2040 Nuclear (Palo Verde)Nuclear (SMR)Gas - Steam TurbineGas - Combined CycleGas - Combustion TurbineBiomassGeothermalWindSolarBattery StorageImportsDemand ResponseHydrogenBTM SolarLoadExcess Generation
2021 2024 2025 2027 2031 2035 2040 2045Installed Capacity (MW)
622 622 622 622 622 622 622 622 - - - - - - - - 426 307 307 307 234 - - - 493 493 493 493 493 266 266 266 503 731 731 731 668 952 1111 1270 - - - - - - - - - - - - - - - - - - 109 109 109 109 109 264 115 385 629 629 904 1242 1299 1733 - 50 183 256 582 1032 1116 1316 - - - - - - - - 46 53 56 61 71 81 93 93
- - - - - - - - 18 65 80 108 166 221 289 368
- - - - - - - - - - - - - - - - 622 622 622 622 622 622 622 622 - - - - - - - - 426 307 307 307 234 - - - 493 493 493 493 493 266 266 266 503 731 731 731 668 939 1064 1178 - - - - - - - - - - - - - - - - - - 109 109 109 109 221 300 115 385 629 629 915 1310 1390 2052 - 50 183 256 580 1045 1135 1573 - - - - - - - - 46 53 56 61 71 81 93 93
- - - - - - - - 18 65 80 108 166 221 289 368
- - - - - - - - - - - - - - - - 622 622 622 622 622 622 622 622 - - - - - - - - 426 307 307 307 234 - - - 493 493 493 493 493 266 266 266 503 731 731 731 668 938 987 1029 - - - - - - - - - - - - - - - - - - 109 109 109 109 300 301 115 385 629 629 915 1311 1822 2573 - 50 183 256 580 1046 1194 2062 - - - - - - - - 46 53 56 61 71 81 93 93
- - - - - - - - 18 65 80 108 166 221 289 368
- - - - - - - - - - - - - - - -
Attachment D-1 E3 EPE Report Model Results June Page 15 of 34
Scenario Resource Type80 CO2 Red by 2040 Nuclear (Palo Verde)
Nuclear (SMR)Gas - Steam TurbineGas - Combined CycleGas - Combustion TurbineBiomassGeothermalWindSolarBattery StorageImportsDemand ResponseHydrogenBTM SolarLoadExcess Generation
90 CO2 Red by 2040 Nuclear (Palo Verde)Nuclear (SMR)Gas - Steam TurbineGas - Combined CycleGas - Combustion TurbineBiomassGeothermalWindSolarBattery StorageImportsDemand ResponseHydrogenBTM SolarLoadExcess Generation
100 CO2 Red by 2040 Nuclear (Palo Verde)Nuclear (SMR)Gas - Steam TurbineGas - Combined CycleGas - Combustion TurbineBiomassGeothermalWindSolarBattery StorageImportsDemand ResponseHydrogenBTM SolarLoadExcess Generation
2021 2024 2025 2027 2031 2035 2040 2045Installed Capacity (MW)
622 622 622 622 622 622 622 622 - - - - - - - - 426 307 307 307 234 - - - 493 493 493 493 493 266 266 266 503 731 731 731 668 885 885 885 - - - - - - - - - - - - - - - - - - 192 192 192 192 507 507 115 385 629 629 891 1475 2226 3013 - 50 183 238 556 1080 1416 2455 - - - - - - - - 46 53 56 61 71 81 93 93
- - - - - - - - 18 65 80 108 166 221 289 368
- - - - - - - - - - - - - - - - 622 622 622 622 622 622 622 622 - - - - - - - - 426 307 307 307 234 - - - 493 493 493 493 493 266 266 266 503 731 731 731 668 819 819 819 - - - - - - - - - - - - - - - - - - 192 192 192 192 764 772 115 385 628 628 891 1681 2284 3081 - 50 183 238 556 1276 1601 2627 - - - - - - - - 46 53 56 61 71 81 93 93
- - - - - - - - 18 65 80 108 166 221 289 368
- - - - - - - - - - - - - - - - 622 622 622 622 622 622 622 622 - - - - - - - - 426 307 307 307 234 - - - 493 493 493 493 493 266 266 266 503 731 731 731 668 668 668 668 - - - - - - - - - - - - - - - - - - 132 132 132 132 1228 1605 115 385 629 629 908 2129 4851 5217 - 50 183 251 573 1864 6191 7470 - - - - - - - - 46 53 56 61 71 81 93 93
- - - - - - - - 18 65 80 108 166 221 298 701
- - - - - - - - - - - - - - - -
Attachment D-1 E3 EPE Report Model Results June Page 16 of 34
Scenario Resource Type100 CO2 Red by 2040 (w H2) Nuclear (Palo Verde)
Nuclear (SMR)Gas - Steam TurbineGas - Combined CycleGas - Combustion TurbineBiomassGeothermalWindSolarBattery StorageImportsDemand ResponseHydrogenBTM SolarLoadExcess Generation
2021 2024 2025 2027 2031 2035 2040 2045Installed Capacity (MW)
622 622 622 622 622 622 622 622 - - - - - - - - 426 307 307 307 234 - - - 493 493 493 493 493 266 - - 503 731 731 731 668 774 - - - - - - - - - - - - - - - - - - - - 231 231 231 231 687 687 115 385 628 628 883 1801 2353 3200 - 50 183 233 548 1403 1804 2864 - - - - - - - - 46 53 56 61 71 81 93 93
- - - - - - 1040 1040 18 65 80 108 166 221 289 368
- - - - - - - - - - - - - - - -
Attachment D-1 E3 EPE Report Model Results June Page 17 of 34
Scenario Resource TypeLeast-Cost (Reference Case) Nuclear (Palo Verde)
Nuclear (SMR)Gas - Steam TurbineGas - Combined CycleGas - Combustion TurbineBiomassGeothermalWindSolarBattery StorageImportsDemand ResponseHydrogenBTM SolarLoadExcess Generation
Least-Cost Case + ETA Resources Nuclear (Palo Verde)Nuclear (SMR)Gas - Steam TurbineGas - Combined CycleGas - Combustion TurbineBiomassGeothermalWindSolarBattery StorageImportsDemand ResponseHydrogenBTM SolarLoadExcess Generation
Separate System Planning Nuclear (Palo Verde)Nuclear (SMR)Gas - Steam TurbineGas - Combined CycleGas - Combustion TurbineBiomassGeothermalWindSolarBattery StorageImportsDemand ResponseHydrogenBTM SolarLoadExcess Generation
2021 2024 2025 2027 2031 2035 2040 2045- - - - - - - - - - - - - - - - - - - - - - - - - - - - - - - - - 228 228 228 228 512 671 878 - - - - - - - - - - - - - - - - - - 109 109 109 109 109 196 - 270 514 514 789 1196 1280 1842 - 50 183 256 582 1032 1116 1334 - - - - - - - - 46 53 56 61 71 81 93 93
- - - - - - - - 18 65 80 108 166 221 289 368
- - - - - - - - - - - - - - - - - - - - - - - - - - - - - - - - - - - - - - - - - - - - - - - - - 228 228 228 228 439 559 714 - - - - - - - - - - - - - - - - - - 204 204 204 204 204 264 - 270 514 514 772 1437 1666 2312 - 50 183 236 552 1084 1252 1748 - - - - - - - - 46 53 56 61 71 81 93 93
- - - - - - - - 18 65 80 108 166 221 289 368
- - - - - - - - - - - - - - - - - - - - - - - - - - - - - - - - - - - - - - - - - - - - - - - - - 228 228 228 228 395 395 549 - - - - - - - - - - - - - - - - - - 87 87 87 87 87 159 - 270 592 592 790 1622 2304 2901 - 50 271 293 634 1480 2207 2629 - - - - - - - - 46 53 56 61 71 81 93 93
- - - - - - - - 18 65 80 108 166 221 289 368
- - - - - - - - - - - - - - - -
Cumulative Capacity Additions (MW)
Attachment D-1 E3 EPE Report Model Results June Page 18 of 34
Scenario Resource TypeSeparate System Planning (w H2) Nuclear (Palo Verde)
Nuclear (SMR)Gas - Steam TurbineGas - Combined CycleGas - Combustion TurbineBiomassGeothermalWindSolarBattery StorageImportsDemand ResponseHydrogenBTM SolarLoadExcess Generation
Low Load Growth Nuclear (Palo Verde)Nuclear (SMR)Gas - Steam TurbineGas - Combined CycleGas - Combustion TurbineBiomassGeothermalWindSolarBattery StorageImportsDemand ResponseHydrogenBTM SolarLoadExcess Generation
High Load Growth Nuclear (Palo Verde)Nuclear (SMR)Gas - Steam TurbineGas - Combined CycleGas - Combustion TurbineBiomassGeothermalWindSolarBattery StorageImportsDemand ResponseHydrogenBTM SolarLoadExcess Generation
2021 2024 2025 2027 2031 2035 2040 2045Cumulative Capacity Additions (MW)
- - - - - - - - - - - - - - - - - - - - - - - - - - - - - - - - - 228 228 228 228 385 385 549 - - - - - - - - - - - - - - - - - - 129 129 129 129 172 212 - 270 557 557 821 1245 1627 2252 - 50 269 291 601 1038 1420 1791 - - - - - - - - 46 53 56 61 71 81 93 93
- - - - - 121 195 206 18 65 80 108 166 221 289 368
- - - - - - - - - - - - - - - - - - - - - - - - - - - - - - - - - - - - - - - - - - - - - - - - - 228 228 228 228 407 549 742 - - - - - - - - - - - - - - - - - - 96 96 96 96 96 153 - 270 426 426 628 1117 1198 1751 - 50 192 193 454 1012 1093 1307 - - - - - - - - 46 53 56 61 71 81 93 93
- - - - - - - - 18 65 80 108 166 221 289 368
- - - - - - - - - - - - - - - - - - - - - - - - - - - - - - - - - - - - - - - - - - - - - - - - - 228 228 228 228 622 797 1011 - - - - - - - - - - - - - - - - - - 123 123 123 123 123 266 - 270 562 562 931 1264 1351 1922 - 50 249 342 716 1048 1136 1357 - - - - - - - - 46 53 56 61 71 81 93 93
- - - - - - - - 18 65 80 108 166 221 289 368
- - - - - - - - - - - - - - - -
Attachment D-1 E3 EPE Report Model Results June Page 19 of 34
Scenario Resource TypeHigh DG Nuclear (Palo Verde)
Nuclear (SMR)Gas - Steam TurbineGas - Combined CycleGas - Combustion TurbineBiomassGeothermalWindSolarBattery StorageImportsDemand ResponseHydrogenBTM SolarLoadExcess Generation
High DSM Nuclear (Palo Verde)Nuclear (SMR)Gas - Steam TurbineGas - Combined CycleGas - Combustion TurbineBiomassGeothermalWindSolarBattery StorageImportsDemand ResponseHydrogenBTM SolarLoadExcess Generation
No New Gas Nuclear (Palo Verde)Nuclear (SMR)Gas - Steam TurbineGas - Combined CycleGas - Combustion TurbineBiomassGeothermalWindSolarBattery StorageImportsDemand ResponseHydrogenBTM SolarLoadExcess Generation
2021 2024 2025 2027 2031 2035 2040 2045Cumulative Capacity Additions (MW)
- - - - - - - - - - - - - - - - - - - - - - - - - - - - - - - - - 228 228 228 228 502 638 882 - - - - - - - - - - - - - - - - - - 106 106 106 106 106 249 - 270 472 472 646 966 1074 1285 - 50 183 252 571 1043 1151 1317 - - - - - - - - 46 53 56 61 71 81 93 93
- - - - - - - - 42 169 210 293 455 614 809 1032
- - - - - - - - - - - - - - - - - - - - - - - - - - - - - - - - - - - - - - - - - - - - - - - - - 228 228 228 228 361 486 665 - - - - - - - - - - - - - - - - - - 70 70 70 70 70 127 - 270 443 443 526 1101 1171 1646 - 50 187 191 425 1000 1070 1259 - - - - - - - - 49 66 71 82 100 101 103 103
- - - - - - - - 18 65 80 108 166 221 289 368
- - - - - - - - - - - - - - - - - - - - - - - - - - - - - - - - - - - - - - - - - - - - - - - - - 228 228 228 228 228 228 228 - - - - - - - - - - - - - - - - - - 132 132 132 132 132 132 - 270 514 514 793 2084 2716 3906 - 50 183 251 573 1864 2496 3684 - - - - - - - - 46 53 56 61 71 81 93 93
- - - - - - - - 18 65 80 108 166 221 289 368
- - - - - - - - - - - - - - - -
Attachment D-1 E3 EPE Report Model Results June Page 20 of 34
Scenario Resource TypeNo Lifetime Extensions Nuclear (Palo Verde)
Nuclear (SMR)Gas - Steam TurbineGas - Combined CycleGas - Combustion TurbineBiomassGeothermalWindSolarBattery StorageImportsDemand ResponseHydrogenBTM SolarLoadExcess Generation
High Gas Price Nuclear (Palo Verde)Nuclear (SMR)Gas - Steam TurbineGas - Combined CycleGas - Combustion TurbineBiomassGeothermalWindSolarBattery StorageImportsDemand ResponseHydrogenBTM SolarLoadExcess Generation
Low Carbon Price Nuclear (Palo Verde)Nuclear (SMR)Gas - Steam TurbineGas - Combined CycleGas - Combustion TurbineBiomassGeothermalWindSolarBattery StorageImportsDemand ResponseHydrogenBTM SolarLoadExcess Generation
2021 2024 2025 2027 2031 2035 2040 2045Cumulative Capacity Additions (MW)
- - - - - - - - - - - - - - - - - - - - - - - - - - - - - - - - - 228 228 411 411 511 669 878 - - - - - - - - - - - - - - - - - - 118 118 118 118 118 196 - 270 654 654 903 1190 1274 1841 - 50 230 434 743 1031 1115 1334 - - - - - - - - 46 53 56 61 71 81 93 93
- - - - - - - - 18 65 80 108 166 221 289 368
- - - - - - - - - - - - - - - - - - - - - - - - - - - - - - - - - - - - - - - - - - - - - - - - - 228 228 228 228 490 648 834 - - - - - - - - - - - - - - - - - - 142 142 142 142 142 264 - 270 514 514 790 1267 1351 1974 - 50 183 249 570 1047 1131 1362 - - - - - - - - 46 53 56 61 71 81 93 93
- - - - - - - - 18 65 80 108 166 221 289 368
- - - - - - - - - - - - - - - - - - - - - - - - - - - - - - - - - - - - - - - - - - - - - - - - - 228 228 228 228 480 638 827 - - - - - - - - - - - - - - - - - - 181 181 181 181 181 267 - 270 514 514 779 1267 1351 2009 - 50 183 240 559 1047 1131 1369 - - - - - - - - 46 53 56 61 71 81 93 93
- - - - - - - - 18 65 80 108 166 221 289 368
- - - - - - - - - - - - - - - -
Attachment D-1 E3 EPE Report Model Results June Page 21 of 34
Scenario Resource TypeMedium Carbon Price Nuclear (Palo Verde)
Nuclear (SMR)Gas - Steam TurbineGas - Combined CycleGas - Combustion TurbineBiomassGeothermalWindSolarBattery StorageImportsDemand ResponseHydrogenBTM SolarLoadExcess Generation
High Carbon Price Nuclear (Palo Verde)Nuclear (SMR)Gas - Steam TurbineGas - Combined CycleGas - Combustion TurbineBiomassGeothermalWindSolarBattery StorageImportsDemand ResponseHydrogenBTM SolarLoadExcess Generation
80 Clean by 2035 Nuclear (Palo Verde)Nuclear (SMR)Gas - Steam TurbineGas - Combined CycleGas - Combustion TurbineBiomassGeothermalWindSolarBattery StorageImportsDemand ResponseHydrogenBTM SolarLoadExcess Generation
2021 2024 2025 2027 2031 2035 2040 2045Cumulative Capacity Additions (MW)
- - - - - - - - - - - - - - - - - - - - - - - - - - - - - - - - - 228 228 228 228 469 620 808 - - - - - - - - - - - - - - - - - - 236 236 236 236 236 300 - 270 609 609 767 1267 1372 2075 - 50 183 228 547 1047 1136 1393 - - - - - - - - 46 53 56 61 71 81 93 93
- - - - - - - - 18 65 80 108 166 221 289 368
- - - - - - - - - - - - - - - - - - - - - - - - - - - - - - - - - - - - - - - - - - - - - - - - - 228 228 228 228 461 561 584 - - - - - - - - - - - - - - - - - - 300 300 300 300 300 301 - 270 812 812 857 1267 1622 2845 - 50 183 211 521 1047 1189 2132 - - - - - - - - 46 53 56 61 71 81 93 93
- - - - - - - - 18 65 80 108 166 221 289 368
- - - - - - - - - - - - - - - - - - - - - - - - - - - - - - - - - - - - - - - - - - - - - - - - - 228 228 228 228 498 635 813 - - - - - - - - - - - - - - - - - - 109 109 109 109 194 285 - 270 514 514 800 1267 1351 2067 - 50 183 256 580 1047 1131 1381 - - - - - - - - 46 53 56 61 71 81 93 93
- - - - - - - - 18 65 80 108 166 221 289 368
- - - - - - - - - - - - - - - -
Attachment D-1 E3 EPE Report Model Results June Page 22 of 34
Scenario Resource Type20 CO2 Red by 2040 Nuclear (Palo Verde)
Nuclear (SMR)Gas - Steam TurbineGas - Combined CycleGas - Combustion TurbineBiomassGeothermalWindSolarBattery StorageImportsDemand ResponseHydrogenBTM SolarLoadExcess Generation
40 CO2 Red by 2040 Nuclear (Palo Verde)Nuclear (SMR)Gas - Steam TurbineGas - Combined CycleGas - Combustion TurbineBiomassGeothermalWindSolarBattery StorageImportsDemand ResponseHydrogenBTM SolarLoadExcess Generation
60 CO2 Red by 2040 Nuclear (Palo Verde)Nuclear (SMR)Gas - Steam TurbineGas - Combined CycleGas - Combustion TurbineBiomassGeothermalWindSolarBattery StorageImportsDemand ResponseHydrogenBTM SolarLoadExcess Generation
2021 2024 2025 2027 2031 2035 2040 2045Cumulative Capacity Additions (MW)
- - - - - - - - - - - - - - - - - - - - - - - - - - - - - - - - - 228 228 228 228 512 671 830 - - - - - - - - - - - - - - - - - - 109 109 109 109 109 264 - 270 514 514 789 1197 1281 1995 - 50 183 256 582 1032 1116 1366 - - - - - - - - 46 53 56 61 71 81 93 93
- - - - - - - - 18 65 80 108 166 221 289 368
- - - - - - - - - - - - - - - - - - - - - - - - - - - - - - - - - - - - - - - - - - - - - - - - - 228 228 228 228 499 624 738 - - - - - - - - - - - - - - - - - - 109 109 109 109 221 300 - 270 514 514 800 1265 1372 2314 - 50 183 256 580 1045 1135 1623 - - - - - - - - 46 53 56 61 71 81 93 93
- - - - - - - - 18 65 80 108 166 221 289 368
- - - - - - - - - - - - - - - - - - - - - - - - - - - - - - - - - - - - - - - - - - - - - - - - - 228 228 228 228 498 547 589 - - - - - - - - - - - - - - - - - - 109 109 109 109 300 301 - 270 514 514 800 1266 1804 2835 - 50 183 256 580 1046 1194 2112 - - - - - - - - 46 53 56 61 71 81 93 93
- - - - - - - - 18 65 80 108 166 221 289 368
- - - - - - - - - - - - - - - -
Attachment D-1 E3 EPE Report Model Results June Page 23 of 34
Scenario Resource Type80 CO2 Red by 2040 Nuclear (Palo Verde)
Nuclear (SMR)Gas - Steam TurbineGas - Combined CycleGas - Combustion TurbineBiomassGeothermalWindSolarBattery StorageImportsDemand ResponseHydrogenBTM SolarLoadExcess Generation
90 CO2 Red by 2040 Nuclear (Palo Verde)Nuclear (SMR)Gas - Steam TurbineGas - Combined CycleGas - Combustion TurbineBiomassGeothermalWindSolarBattery StorageImportsDemand ResponseHydrogenBTM SolarLoadExcess Generation
100 CO2 Red by 2040 Nuclear (Palo Verde)Nuclear (SMR)Gas - Steam TurbineGas - Combined CycleGas - Combustion TurbineBiomassGeothermalWindSolarBattery StorageImportsDemand ResponseHydrogenBTM SolarLoadExcess Generation
2021 2024 2025 2027 2031 2035 2040 2045Cumulative Capacity Additions (MW)
- - - - - - - - - - - - - - - - - - - - - - - - - - - - - - - - - 228 228 228 228 445 445 445 - - - - - - - - - - - - - - - - - - 192 192 192 192 507 507 - 270 514 514 776 1430 2208 3275 - 50 183 238 556 1080 1416 2505 - - - - - - - - 46 53 56 61 71 81 93 93
- - - - - - - - 18 65 80 108 166 221 289 368
- - - - - - - - - - - - - - - - - - - - - - - - - - - - - - - - - - - - - - - - - - - - - - - - - 228 228 228 228 379 379 379 - - - - - - - - - - - - - - - - - - 192 192 192 192 764 772 - 270 513 513 776 1636 2266 3343 - 50 183 238 556 1276 1601 2677 - - - - - - - - 46 53 56 61 71 81 93 93
- - - - - - - - 18 65 80 108 166 221 289 368
- - - - - - - - - - - - - - - - - - - - - - - - - - - - - - - - - - - - - - - - - - - - - - - - - 228 228 228 228 228 228 228 - - - - - - - - - - - - - - - - - - 132 132 132 132 1228 1605 - 270 514 514 793 2084 4833 5479 - 50 183 251 573 1864 6191 7470 - - - - - - - - 46 53 56 61 71 81 93 93
- - - - - - - - 18 65 80 108 166 221 298 701
- - - - - - - - - - - - - - - -
Attachment D-1 E3 EPE Report Model Results June Page 24 of 34
Scenario Resource Type100 CO2 Red by 2040 (w H2) Nuclear (Palo Verde)
Nuclear (SMR)Gas - Steam TurbineGas - Combined CycleGas - Combustion TurbineBiomassGeothermalWindSolarBattery StorageImportsDemand ResponseHydrogenBTM SolarLoadExcess Generation
2021 2024 2025 2027 2031 2035 2040 2045Cumulative Capacity Additions (MW)
- - - - - - - - - - - - - - - - - - - - - - - - - - - - - - - - - 228 228 228 228 334 - - - - - - - - - - - - - - - - - - - - 231 231 231 231 687 687 - 270 513 513 768 1756 2335 3462 - 50 183 233 548 1403 1804 2914 - - - - - - - - 46 53 56 61 71 81 93 93
- - - - - - 334 334 18 65 80 108 166 221 289 368
- - - - - - - - - - - - - - - -
Attachment D-1 E3 EPE Report Model Results June Page 25 of 34
Scenario Resource TypeLeast-Cost (Reference Case) Nuclear (Palo Verde)
Nuclear (SMR)Gas - Steam TurbineGas - Combined CycleGas - Combustion TurbineBiomassGeothermalWindSolarBattery StorageImportsDemand ResponseHydrogenBTM SolarLoadExcess Generation
Least-Cost Case + ETA Resources Nuclear (Palo Verde)Nuclear (SMR)Gas - Steam TurbineGas - Combined CycleGas - Combustion TurbineBiomassGeothermalWindSolarBattery StorageImportsDemand ResponseHydrogenBTM SolarLoadExcess Generation
Separate System Planning Nuclear (Palo Verde)Nuclear (SMR)Gas - Steam TurbineGas - Combined CycleGas - Combustion TurbineBiomassGeothermalWindSolarBattery StorageImportsDemand ResponseHydrogenBTM SolarLoadExcess Generation
2021 2024 2025 2027 2031 2035 2040 2045- - - - - - - - - - - - - - - - - (119) (119) (119) (192) (426) (426) (426) - - - - - (227) (227) (227) - - - - (63) (63) (63) (63) - - - - - - - - - - - - - - - - - - - - - - - - - - - - - (70) (97) (377) - - - - - - - (50) - - - - - - - - - - - - - - - - - - - - - - - - - - - - - - - - - - - - - - - - - - - - - - - - - - - - - - - - - - - - - - - - - (119) (119) (119) (192) (426) (426) (426) - - - - - (227) (227) (227) - - - - (63) (63) (63) (63) - - - - - - - - - - - - - - - - - - - - - - - - - - - - - (70) (97) (377) - - - - - - - (50) - - - - - - - - - - - - - - - - - - - - - - - - - - - - - - - - - - - - - - - - - - - - - - - - - - - - - - - - - - - - - - - - - (119) (119) (119) (192) (426) (426) (426) - - - - - (227) (227) (227) - - - - (63) (63) (63) (63) - - - - - - - - - - - - - - - - - - - - - - - - - - - - - (70) (97) (377) - - - - - - - (50) - - - - - - - - - - - - - - - - - - - - - - - - - - - - - - - - - - - - - - - - - - - - - - - -
Cumulative Capacity Retirements (MW)
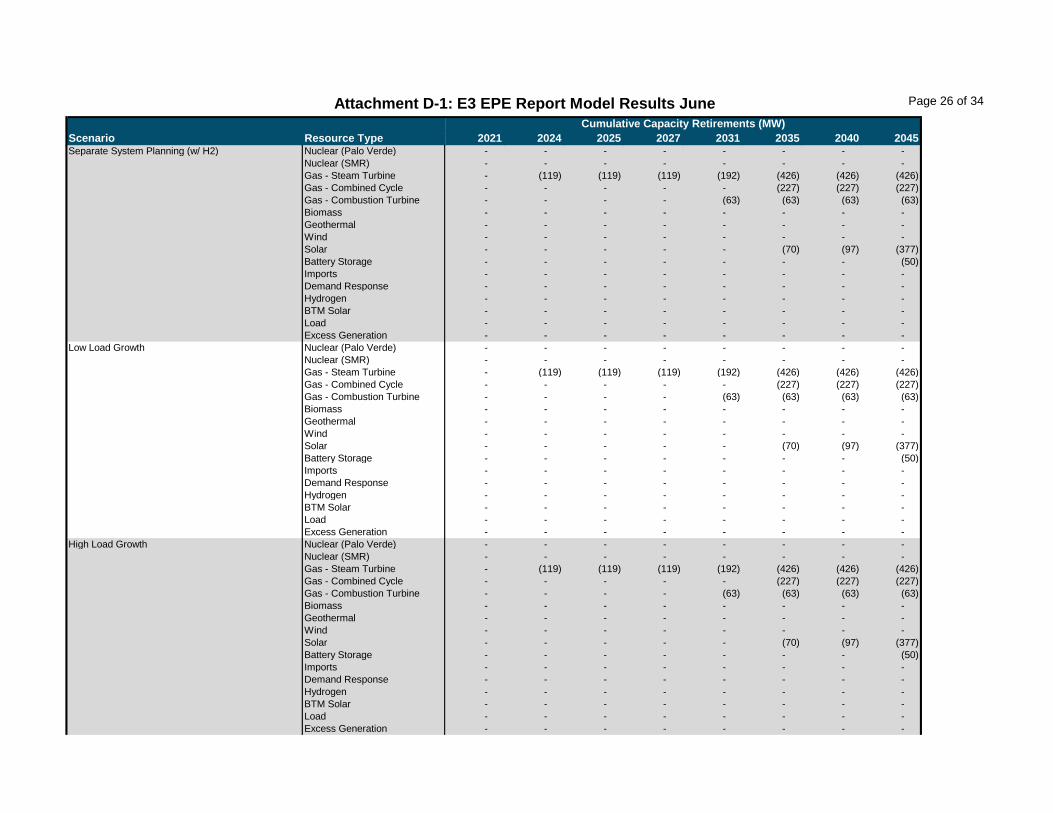
Attachment D-1 E3 EPE Report Model Results June Page 26 of 34
Scenario Resource TypeSeparate System Planning (w H2) Nuclear (Palo Verde)
Nuclear (SMR)Gas - Steam TurbineGas - Combined CycleGas - Combustion TurbineBiomassGeothermalWindSolarBattery StorageImportsDemand ResponseHydrogenBTM SolarLoadExcess Generation
Low Load Growth Nuclear (Palo Verde)Nuclear (SMR)Gas - Steam TurbineGas - Combined CycleGas - Combustion TurbineBiomassGeothermalWindSolarBattery StorageImportsDemand ResponseHydrogenBTM SolarLoadExcess Generation
High Load Growth Nuclear (Palo Verde)Nuclear (SMR)Gas - Steam TurbineGas - Combined CycleGas - Combustion TurbineBiomassGeothermalWindSolarBattery StorageImportsDemand ResponseHydrogenBTM SolarLoadExcess Generation
2021 2024 2025 2027 2031 2035 2040 2045Cumulative Capacity Retirements (MW)
- - - - - - - - - - - - - - - - - (119) (119) (119) (192) (426) (426) (426) - - - - - (227) (227) (227) - - - - (63) (63) (63) (63) - - - - - - - - - - - - - - - - - - - - - - - - - - - - - (70) (97) (377) - - - - - - - (50) - - - - - - - - - - - - - - - - - - - - - - - - - - - - - - - - - - - - - - - - - - - - - - - - - - - - - - - - - - - - - - - - - (119) (119) (119) (192) (426) (426) (426) - - - - - (227) (227) (227) - - - - (63) (63) (63) (63) - - - - - - - - - - - - - - - - - - - - - - - - - - - - - (70) (97) (377) - - - - - - - (50) - - - - - - - - - - - - - - - - - - - - - - - - - - - - - - - - - - - - - - - - - - - - - - - - - - - - - - - - - - - - - - - - - (119) (119) (119) (192) (426) (426) (426) - - - - - (227) (227) (227) - - - - (63) (63) (63) (63) - - - - - - - - - - - - - - - - - - - - - - - - - - - - - (70) (97) (377) - - - - - - - (50) - - - - - - - - - - - - - - - - - - - - - - - - - - - - - - - - - - - - - - - - - - - - - - - -
Attachment D-1 E3 EPE Report Model Results June Page 27 of 34
Scenario Resource TypeHigh DG Nuclear (Palo Verde)
Nuclear (SMR)Gas - Steam TurbineGas - Combined CycleGas - Combustion TurbineBiomassGeothermalWindSolarBattery StorageImportsDemand ResponseHydrogenBTM SolarLoadExcess Generation
High DSM Nuclear (Palo Verde)Nuclear (SMR)Gas - Steam TurbineGas - Combined CycleGas - Combustion TurbineBiomassGeothermalWindSolarBattery StorageImportsDemand ResponseHydrogenBTM SolarLoadExcess Generation
No New Gas Nuclear (Palo Verde)Nuclear (SMR)Gas - Steam TurbineGas - Combined CycleGas - Combustion TurbineBiomassGeothermalWindSolarBattery StorageImportsDemand ResponseHydrogenBTM SolarLoadExcess Generation
2021 2024 2025 2027 2031 2035 2040 2045Cumulative Capacity Retirements (MW)
- - - - - - - - - - - - - - - - - (119) (119) (119) (192) (426) (426) (426) - - - - - (227) (227) (227) - - - - (63) (63) (63) (63) - - - - - - - - - - - - - - - - - - - - - - - - - - - - - (70) (97) (377) - - - - - - - (50) - - - - - - - - - - - - - - - - - - - - - - - - - - - - - - - - - - - - - - - - - - - - - - - - - - - - - - - - - - - - - - - - - (119) (119) (119) (192) (426) (426) (426) - - - - - (227) (227) (227) - - - - (63) (63) (63) (63) - - - - - - - - - - - - - - - - - - - - - - - - - - - - - (70) (97) (377) - - - - - - - (50) - - - - - - - - - - - - - - - - - - - - - - - - - - - - - - - - - - - - - - - - - - - - - - - - - - - - - - - - - - - - - - - - - (119) (119) (119) (192) (426) (426) (426) - - - - - (227) (227) (227) - - - - (63) (63) (63) (63) - - - - - - - - - - - - - - - - - - - - - - - - - - - - - (70) (97) (377) - - - - - - - (50) - - - - - - - - - - - - - - - - - - - - - - - - - - - - - - - - - - - - - - - - - - - - - - - -
Attachment D-1 E3 EPE Report Model Results June Page 28 of 34
Scenario Resource TypeNo Lifetime Extensions Nuclear (Palo Verde)
Nuclear (SMR)Gas - Steam TurbineGas - Combined CycleGas - Combustion TurbineBiomassGeothermalWindSolarBattery StorageImportsDemand ResponseHydrogenBTM SolarLoadExcess Generation
High Gas Price Nuclear (Palo Verde)Nuclear (SMR)Gas - Steam TurbineGas - Combined CycleGas - Combustion TurbineBiomassGeothermalWindSolarBattery StorageImportsDemand ResponseHydrogenBTM SolarLoadExcess Generation
Low Carbon Price Nuclear (Palo Verde)Nuclear (SMR)Gas - Steam TurbineGas - Combined CycleGas - Combustion TurbineBiomassGeothermalWindSolarBattery StorageImportsDemand ResponseHydrogenBTM SolarLoadExcess Generation
2021 2024 2025 2027 2031 2035 2040 2045Cumulative Capacity Retirements (MW)
- - - - - - - - - - - - - - - - - (192) (192) (282) (282) (426) (426) (426) - - - (227) (227) (227) (227) (227) - - - - (63) (63) (63) (63) - - - - - - - - - - - - - - - - - - - - - - - - - - - - - (70) (97) (377) - - - - - - - (50) - - - - - - - - - - - - - - - - - - - - - - - - - - - - - - - - - - - - - - - - - - - - - - - - - - - - - - - - - - - - - - - - - (119) (119) (119) (192) (426) (426) (426) - - - - - (227) (227) (227) - - - - (63) (63) (63) (63) - - - - - - - - - - - - - - - - - - - - - - - - - - - - - (70) (97) (377) - - - - - - - (50) - - - - - - - - - - - - - - - - - - - - - - - - - - - - - - - - - - - - - - - - - - - - - - - - - - - - - - - - - - - - - - - - - (119) (119) (119) (192) (426) (426) (426) - - - - - (227) (227) (227) - - - - (63) (63) (63) (63) - - - - - - - - - - - - - - - - - - - - - - - - - - - - - (70) (97) (377) - - - - - - - (50) - - - - - - - - - - - - - - - - - - - - - - - - - - - - - - - - - - - - - - - - - - - - - - - -
Attachment D-1 E3 EPE Report Model Results June Page 29 of 34
Scenario Resource TypeMedium Carbon Price Nuclear (Palo Verde)
Nuclear (SMR)Gas - Steam TurbineGas - Combined CycleGas - Combustion TurbineBiomassGeothermalWindSolarBattery StorageImportsDemand ResponseHydrogenBTM SolarLoadExcess Generation
High Carbon Price Nuclear (Palo Verde)Nuclear (SMR)Gas - Steam TurbineGas - Combined CycleGas - Combustion TurbineBiomassGeothermalWindSolarBattery StorageImportsDemand ResponseHydrogenBTM SolarLoadExcess Generation
80 Clean by 2035 Nuclear (Palo Verde)Nuclear (SMR)Gas - Steam TurbineGas - Combined CycleGas - Combustion TurbineBiomassGeothermalWindSolarBattery StorageImportsDemand ResponseHydrogenBTM SolarLoadExcess Generation
2021 2024 2025 2027 2031 2035 2040 2045Cumulative Capacity Retirements (MW)
- - - - - - - - - - - - - - - - - (119) (119) (119) (192) (426) (426) (426) - - - - - (227) (227) (227) - - - - (63) (63) (63) (63) - - - - - - - - - - - - - - - - - - - - - - - - - - - - - (70) (97) (377) - - - - - - - (50) - - - - - - - - - - - - - - - - - - - - - - - - - - - - - - - - - - - - - - - - - - - - - - - - - - - - - - - - - - - - - - - - - (119) (119) (119) (192) (426) (426) (426) - - - - - (227) (227) (227) - - - - (63) (63) (63) (63) - - - - - - - - - - - - - - - - - - - - - - - - - - - - - (70) (97) (377) - - - - - - - (50) - - - - - - - - - - - - - - - - - - - - - - - - - - - - - - - - - - - - - - - - - - - - - - - - - - - - - - - - - - - - - - - - - (119) (119) (119) (192) (426) (426) (426) - - - - - (227) (227) (227) - - - - (63) (63) (63) (63) - - - - - - - - - - - - - - - - - - - - - - - - - - - - - (70) (97) (377) - - - - - - - (50) - - - - - - - - - - - - - - - - - - - - - - - - - - - - - - - - - - - - - - - - - - - - - - - -
Attachment D-1 E3 EPE Report Model Results June Page 30 of 34
Scenario Resource Type20 CO2 Red by 2040 Nuclear (Palo Verde)
Nuclear (SMR)Gas - Steam TurbineGas - Combined CycleGas - Combustion TurbineBiomassGeothermalWindSolarBattery StorageImportsDemand ResponseHydrogenBTM SolarLoadExcess Generation
40 CO2 Red by 2040 Nuclear (Palo Verde)Nuclear (SMR)Gas - Steam TurbineGas - Combined CycleGas - Combustion TurbineBiomassGeothermalWindSolarBattery StorageImportsDemand ResponseHydrogenBTM SolarLoadExcess Generation
60 CO2 Red by 2040 Nuclear (Palo Verde)Nuclear (SMR)Gas - Steam TurbineGas - Combined CycleGas - Combustion TurbineBiomassGeothermalWindSolarBattery StorageImportsDemand ResponseHydrogenBTM SolarLoadExcess Generation
2021 2024 2025 2027 2031 2035 2040 2045Cumulative Capacity Retirements (MW)
- - - - - - - - - - - - - - - - - (119) (119) (119) (192) (426) (426) (426) - - - - - (227) (227) (227) - - - - (63) (63) (63) (63) - - - - - - - - - - - - - - - - - - - - - - - - - - - - - (70) (97) (377) - - - - - - - (50) - - - - - - - - - - - - - - - - - - - - - - - - - - - - - - - - - - - - - - - - - - - - - - - - - - - - - - - - - - - - - - - - - (119) (119) (119) (192) (426) (426) (426) - - - - - (227) (227) (227) - - - - (63) (63) (63) (63) - - - - - - - - - - - - - - - - - - - - - - - - - - - - - (70) (97) (377) - - - - - - - (50) - - - - - - - - - - - - - - - - - - - - - - - - - - - - - - - - - - - - - - - - - - - - - - - - - - - - - - - - - - - - - - - - - (119) (119) (119) (192) (426) (426) (426) - - - - - (227) (227) (227) - - - - (63) (63) (63) (63) - - - - - - - - - - - - - - - - - - - - - - - - - - - - - (70) (97) (377) - - - - - - - (50) - - - - - - - - - - - - - - - - - - - - - - - - - - - - - - - - - - - - - - - - - - - - - - - -
Attachment D-1 E3 EPE Report Model Results June Page 31 of 34
Scenario Resource Type80 CO2 Red by 2040 Nuclear (Palo Verde)
Nuclear (SMR)Gas - Steam TurbineGas - Combined CycleGas - Combustion TurbineBiomassGeothermalWindSolarBattery StorageImportsDemand ResponseHydrogenBTM SolarLoadExcess Generation
90 CO2 Red by 2040 Nuclear (Palo Verde)Nuclear (SMR)Gas - Steam TurbineGas - Combined CycleGas - Combustion TurbineBiomassGeothermalWindSolarBattery StorageImportsDemand ResponseHydrogenBTM SolarLoadExcess Generation
100 CO2 Red by 2040 Nuclear (Palo Verde)Nuclear (SMR)Gas - Steam TurbineGas - Combined CycleGas - Combustion TurbineBiomassGeothermalWindSolarBattery StorageImportsDemand ResponseHydrogenBTM SolarLoadExcess Generation
2021 2024 2025 2027 2031 2035 2040 2045Cumulative Capacity Retirements (MW)
- - - - - - - - - - - - - - - - - (119) (119) (119) (192) (426) (426) (426) - - - - - (227) (227) (227) - - - - (63) (63) (63) (63) - - - - - - - - - - - - - - - - - - - - - - - - - - - - - (70) (97) (377) - - - - - - - (50) - - - - - - - - - - - - - - - - - - - - - - - - - - - - - - - - - - - - - - - - - - - - - - - - - - - - - - - - - - - - - - - - - (119) (119) (119) (192) (426) (426) (426) - - - - - (227) (227) (227) - - - - (63) (63) (63) (63) - - - - - - - - - - - - - - - - - - - - - - - - - - - - - (70) (97) (377) - - - - - - - (50) - - - - - - - - - - - - - - - - - - - - - - - - - - - - - - - - - - - - - - - - - - - - - - - - - - - - - - - - - - - - - - - - - (119) (119) (119) (192) (426) (426) (426) - - - - - (227) (227) (227) - - - - (63) (63) (63) (63) - - - - - - - - - - - - - - - - - - - - - - - - - - - - - (70) (97) (377) - - - - - - - (50) - - - - - - - - - - - - - - - - - - - - - - - - - - - - - - - - - - - - - - - - - - - - - - - -
Attachment D-1 E3 EPE Report Model Results June Page 32 of 34
Scenario Resource Type100 CO2 Red by 2040 (w H2) Nuclear (Palo Verde)
Nuclear (SMR)Gas - Steam TurbineGas - Combined CycleGas - Combustion TurbineBiomassGeothermalWindSolarBattery StorageImportsDemand ResponseHydrogenBTM SolarLoadExcess Generation
2021 2024 2025 2027 2031 2035 2040 2045Cumulative Capacity Retirements (MW)
- - - - - - - - - - - - - - - - - (119) (119) (119) (192) (426) (426) (426) - - - - - (227) (227) (227) - - - - (63) (63) (63) (63) - - - - - - - - - - - - - - - - - - - - - - - - - - - - - (70) (97) (377) - - - - - - - (50) - - - - - - - - - - - - - - - - - - - - - - - - - - - - - - - - - - - - - - - - - - - - - - - -
Attachment D-1 E3 EPE Report Model Results June Page 33 of 34
Scenario 2021 2024 2025 2027 2031 2035 2040 2045Least-Cost (Reference Case) 246$ 233$ 246$ 265$ 290$ 351$ 409$ 512$ Least-Cost Case + ETA Resources 246$ 233$ 249$ 266$ 291$ 356$ 412$ 519$ Separate System Planning 247$ 234$ 252$ 269$ 295$ 376$ 471$ 577$ Separate System Planning (w H2) 247$ 234$ 252$ 269$ 294$ 355$ 438$ 543$ Low Load Growth 239$ 227$ 239$ 255$ 275$ 327$ 380$ 478$ High Load Growth 253$ 239$ 256$ 277$ 307$ 377$ 439$ 546$ High DG 245$ 231$ 243$ 261$ 283$ 336$ 388$ 482$ High DSM 245$ 230$ 241$ 256$ 272$ 317$ 364$ 454$ No New Gas 246$ 233$ 247$ 265$ 290$ 394$ 470$ 601$ No Lifetime Extensions 246$ 228$ 246$ 276$ 307$ 354$ 412$ 515$ High Gas Price 257$ 242$ 252$ 272$ 297$ 358$ 418$ 522$ Low Carbon Price 291$ 277$ 285$ 304$ 329$ 390$ 450$ 556$ Medium Carbon Price 358$ 341$ 342$ 361$ 386$ 447$ 512$ 623$ High Carbon Price 469$ 449$ 433$ 452$ 478$ 539$ 609$ 730$ 80 Clean by 2035 246$ 233$ 246$ 265$ 290$ 352$ 409$ 512$ 20 CO2 Red by 2040 246$ 233$ 246$ 265$ 290$ 351$ 409$ 511$ 40 CO2 Red by 2040 246$ 233$ 246$ 265$ 290$ 352$ 409$ 519$ 60 CO2 Red by 2040 246$ 233$ 246$ 265$ 290$ 352$ 421$ 537$ 80 CO2 Red by 2040 246$ 233$ 248$ 266$ 290$ 356$ 464$ 580$ 90 CO2 Red by 2040 246$ 233$ 248$ 266$ 290$ 366$ 503$ 620$ 100 CO2 Red by 2040 246$ 233$ 247$ 265$ 290$ 394$ 1102$ 1269$ 100 CO2 Red by 2040 (w H2) 246$ 233$ 250$ 267$ 291$ 375$ 561$ 675$
Annual Revenue Requirement ($M)
Attachment D-1 E3 EPE Report Model Results June Page 34 of 34
Scenario Clean Energy Type 2021 2024 2025 2027 2031 2035 2040 2045Least-Cost (Reference Case) Renewable 4 12 22 23 28 35 36 40
Zero Carbon 62 68 77 76 79 81 77 75Least-Cost Case + ETA Resources Renewable 4 12 25 26 32 39 42 48
Zero Carbon 62 68 80 79 82 86 83 83Separate System Planning Renewable 4 12 23 23 28 39 42 46
Zero Carbon 62 68 78 77 78 85 83 81Separate System Planning (w H2) Renewable 4 12 24 24 29 36 41 45
Zero Carbon 62 68 79 78 80 82 83 80Low Load Growth Renewable 4 12 20 20 25 34 35 38
Zero Carbon 64 70 77 76 77 82 77 75High Load Growth Renewable 4 12 23 24 31 36 36 41
Zero Carbon 61 66 77 76 80 80 76 75High DG Renewable 4 13 22 24 29 35 37 40
Zero Carbon 63 70 78 77 79 82 78 76High DSM Renewable 4 12 19 20 23 33 34 37
Zero Carbon 63 69 76 75 75 82 78 75No New Gas Renewable 4 12 22 23 29 44 51 58
Zero Carbon 62 68 78 77 79 90 91 93No Lifetime Extensions Renewable 4 12 24 26 31 35 36 40
Zero Carbon 62 68 80 80 81 81 77 75High Gas Price Renewable 4 12 23 24 29 36 37 43
Zero Carbon 62 68 78 78 80 83 78 78Low Carbon Price Renewable 4 12 24 25 31 37 38 43
Zero Carbon 62 68 80 79 81 84 79 79Medium Carbon Price Renewable 4 12 27 28 33 39 41 46
Zero Carbon 62 68 83 82 83 86 82 81High Carbon Price Renewable 4 12 31 32 35 41 45 54
Zero Carbon 62 68 86 86 85 87 86 8980 Clean by 2035 Renewable 4 12 22 23 29 36 39 45
Zero Carbon 62 68 77 76 79 82 80 8020 CO2 Red by 2040 Renewable 4 12 22 23 29 35 36 43
Zero Carbon 62 68 77 76 79 81 77 7940 CO2 Red by 2040 Renewable 4 12 22 23 29 36 40 49
Zero Carbon 62 68 77 76 79 82 81 8460 CO2 Red by 2040 Renewable 4 12 22 23 29 35 46 54
Zero Carbon 62 68 77 76 79 82 87 8980 CO2 Red by 2040 Renewable 4 12 24 25 31 39 53 59
Zero Carbon 62 68 80 79 81 86 93 9490 CO2 Red by 2040 Renewable 4 12 24 25 31 42 56 62
Zero Carbon 62 68 80 79 81 88 97 97100 CO2 Red by 2040 Renewable 4 12 22 23 29 44 62 67
Zero Carbon 62 68 78 77 79 90 100 100100 CO2 Red by 2040 (w H2) Renewable 4 12 25 26 32 45 56 62
Zero Carbon 62 68 81 80 83 91 100 100
Clean Energy ( of Load)
Portfolio Analysis Results612021
El Paso Electric IRP
Modeling Update
Arne Olson Senior PartnerJack Moore Director
Joe Hooker Senior Managing ConsultantHuai Jiang Senior Consultant
Manu Mogadali Senior ConsultantChen Zhang Consultant
Attachment D-2 E-3 June IRP Presentation Page 1 of 37
2Confidential Draft
Agenda
Assumption updates
Updated Reference Case results
High DSM sensitivity results
New Mexico REA Requirements
New Mexico REA Scenario Results
Attachment D-2 E-3 June IRP Presentation Page 2 of 37
Assumption Updates
Attachment D-2 E-3 June IRP Presentation Page 3 of 37
4Confidential Draft
Unit Lifetime Extensions
E3 modeled unit lifetime extensions for the following units that are currently scheduled to retire prior to 2030
In the modeling unit extensions for Rio Grande 7 and Newman 2 are not selected but the other unit extensions are
Resource Planned Retirement Year
Extension Period
Capital + Fixed OampM
(2021 $kW-yr)Rio Grande 7 2022 5 years $11373Newman 1 2022 5 years $7859Newman 2 2022 5 years $7998Newman 3 2026 5 years $5812Newman 4 2026 5 years $4744
Attachment D-2 E-3 June IRP Presentation Page 4 of 37
5Confidential Draft
Planning Reserve Margin
The modeling assumes a 2-day-in-10-year reliability standard for 2025 as a transition to the more common 1-day-in-10-year reliability standard starting in 2030
Under this PRM all generators count toward the PRM based on their effective load carrying capability (ELCC)
Metric 2025 2030+
Reliability TargetTwo days with outages
every ten years on average (02 LOLE)
One day with outages every ten years on average (01 LOLE)
Target PCAP PRM 101 129
LOLE = Loss-of-Load Expectation PCAP = Perfect Capacity
Attachment D-2 E-3 June IRP Presentation Page 5 of 37
Updated Reference Case
Results
Attachment D-2 E-3 June IRP Presentation Page 6 of 37
7Confidential Draft
Scenarios and Sensitivities
Run Note Presented Previously
Presented Today
Least-Cost (Reference Case) Least-cost optimization used as reference case for all sensitivities
Least-Cost Case + REA Resources Additional resources added to Least-Cost Case for New Mexico REA
Separate System Planning New Mexico system planned separately for purposes of satisfying REA
Low Load Growth 3-4 higher native system load forecast
High Load Growth 3-4 lower native system load forecast
High DG High DG forecast
High DSM More smart thermostats doubling of energy efficiency
No New Gas No new gas after Newman 6
No Lifetime Extensions All plants retire as scheduled
High Gas Price Gas prices 15 higher
Low Carbon Price $8 per metric ton of CO2 in 2010 rising at 25 per year
Medium Carbon Price $20 per metric ton of CO2 in 2010 rising at 25 per year
High Carbon Price $40 per metric ton of CO2 in 2010 rising at 25 per year
80 Clean by 2035 80 zero-carbon energy
20 CO2 Red by 2040 20 reduction in CO2 emissions
40 CO2 Red by 2040 40 reduction in CO2 emissions
60 CO2 Red by 2040 60 reduction in CO2 emissions
80 CO2 Red by 2040 80 reduction in CO2 emissions
90 CO2 Red by 2040 90 reduction in CO2 emissions
100 CO2 Red by 2040 100 reduction in CO2 emissions
100 CO2 Red by 2040 (w H2) 100 reduction in CO2 emissions with hydrogen
Attachment D-2 E-3 June IRP Presentation Page 7 of 37
8Confidential Draft
Reference Case Additions and
Retirements
Total net additions by 2040
Storage ~1100 MW
Solar ~1500 MW
Wind ~100 MW
Gas (45) MW
DR = demand response BTM Solar = behind-the-meter solar
Attachment D-2 E-3 June IRP Presentation Page 8 of 37
9Confidential Draft
Reference Case Total Capacity
Total system capacity increases through 2045
bull Gas capacity declines 2027-2035 and then rises
bull Solar and storage capacity increase significantly
bull Wind and demand response increase more modestly
DR = demand response BTM Solar = behind-the-meter solar
Attachment D-2 E-3 June IRP Presentation Page 9 of 37
10Confidential Draft
Reference Case Annual Generation
BTM Solar = behind-the-meter solar
The amount of zero-carbon generation
increases markedly above current levels
Attachment D-2 E-3 June IRP Presentation Page 10 of 37
11Confidential Draft
Reference Case Effective Capacity
Load growth and resource
retirements together result in a
growing capacity need over time
which is met by a combination of
renewables storage demand
response and gas resources
Effective capacity is the amount of capacity that can be counted towards the PRM
Attachment D-2 E-3 June IRP Presentation Page 11 of 37
High DSM Sensitivity Results
Attachment D-2 E-3 June IRP Presentation Page 12 of 37
13Confidential Draft
High DSM Sensitivity Assumptions
Smart Thermostats Energy Efficiency
Base 50MW by 2040
High 60MW by 2040
Base 65 of native system load in 2040
High 13 of native system load in 2040
An incremental ~800 GWh in 2040 Corresponds to ~90 MW of savings on average throughout the year
Attachment D-2 E-3 June IRP Presentation Page 13 of 37
14Confidential Draft
High DSM Scenario Results
Change in Capacity Generation Mix
Attachment D-2 E-3 June IRP Presentation Page 14 of 37
New Mexico REA Requirements
Attachment D-2 E-3 June IRP Presentation Page 15 of 37
16Confidential Draft
New Mexico Renewable Energy Act
There are key requirements in the statutory language setting renewable energy and zero carbon requirements in New Mexico (emphasis added)
ldquoA public utility shall meet the renewable portfolio standard requirements as provided in this section to include renewable energy in its electric energy supply portfolio as demonstrated by its retirement of renewable energy certificates provided that the associated renewable energy is delivered to the public utility and assigned to the public utilitys New Mexico customershellip
(5) no later than January 1 2040 renewable energy resources shall supply no less than eighty percent of all retail sales of electricity in New Mexico provided that compliance with this standard until December 31 2047 shall not require the public utility to displace zero carbon resources in the utilitys generation portfolio on the effective date of this 2019 act and
(6) no later than January 1 2045 zero carbon resources shall supply one hundred percent of all retail sales of
electricity in New Mexico Reasonable and consistent progress shall be made over time toward this requirementrdquo
The scenarios analyzed consider multiple approaches for REA implementationbull Share of NM load served with renewable energy given that El Paso Electric serves NM load with
greater than 20 non-renewable zero-carbon resources (ie Palo Verde)
bull Annual vs hourly balancing periods for 100 zero-carbon generation
bull Whether combustion resources may be utilized to ensure reliability for NM customers
Attachment D-2 E-3 June IRP Presentation Page 16 of 37
17Confidential Draft
New Mexico REA Requirements in 2040+
The REA requires 80 RPS by 2040 unless doing so would require displacing existing zero-carbon generation
New Mexicorsquos share of Palo Verde 1 and 2 supplies 31 of New Mexicorsquos retail sales in 2040 and 27 in 2045
For purposes of IRP modeling El Paso Electric has directed E3 to require New Mexico zero-carbon generation (renewables + nuclear) to equal or exceed 100 of New Mexico retail sales or load starting in 2040
New Mexico Nuclear Generation amp Load
Nuclear Generation
Retail Sales
Total Load
Attachment D-2 E-3 June IRP Presentation Page 17 of 37
18Confidential Draft
Two Approaches for Modeling Zero-Carbon
Generation Balancing
bull New Mexico-allocated zero-carbon resources must generate enough energy on an annual basis to match the REA NM retail sales target
bull Natural gas resources andor imports can serve New Mexicorsquos energy needs in some hours if that generation is offset by additional zero-carbon generation in other hours
bull Annual balancing allows New Mexico customers to reap the benefits of being served by a larger system
Annual Balancing
bull New Mexico cannot receive power from gas resources or unspecified imports in any hour
bull Zero-carbon generation from New Mexico-allocated resources must serve New Mexico energy demand in all hours of the year
bull This would be a more stringent zero-carbon requirement as it would not allow for balancing between New Mexico and Texas resources
Hourly Balancing
NM-Allocated Resources
NM customers can be served by gas resources
and unspecified imports if offset in other hours
NM-Allocated Resources
Other Resources
NM customers cannot be served by gas resources
or unspecified imports an any hour
Attachment D-2 E-3 June IRP Presentation Page 18 of 37
19Confidential Draft
Two Approaches for Modeling Capacity
Pooling to Ensure Reliability
bull For reliability planning purposes NM and TX loads can be served by NM resources TX resources andor system resources
bull If the NM jurisdiction doesnrsquot have enough resources to satisfy load in an hour then it can rely on TX resources and vice versa
bull NM and TX customers must still pay for enough resources to satisfy their share of system reliability needs
Capacity Pooling Allowed
bull For planning purposes TX and NM must each have enough resources to ensure reliability across a range of potential conditions without relying on the other jurisdiction (ie on a standalone basis)
bull This would be a more stringent planning approach NM would need to plan to have enough resources without falling back on TX gas resources in some hours
Capacity Pooling NOT Allowed
NM-Allocated Resources
TX-Allocated Resources
NM-Allocated Resources
TX-Allocated Resources
All resources together ensure
systemwide reliability across all hours
subject to the reliability standard
For planning purposes each jurisdiction
ensures reliability on its own across all
hours subject to the reliability standard
Attachment D-2 E-3 June IRP Presentation Page 19 of 37
20Confidential Draft
New Mexico REA Scenarios and
Jurisdictional Allocation
E3 modeled a few scenarios with different approaches for how to satisfy the REA requirementsbull Different approaches of the REA requirements have meaningful implications on how
planning is performed for New Mexico customersbull The more stringent approaches of the REA requirements will result in higher system
costs relative to less stringent approaches
bull To ensure equitable treatment of customers across jurisdictions any incremental costs of satisfying the REA requirements would be allocated to New Mexico customers
For each scenario resources and costs are allocated between the New Mexico and Texas jurisdictionsbull The allocation of resources follows directly from a particular approach to modeling
REA compliance If a particular approach requires more resources to be added versus the least-cost case then those resources are allocated to the New Mexico jurisdiction
bull Capacity generation and cost for the New Mexico jurisdiction are presented for each scenario
Attachment D-2 E-3 June IRP Presentation Page 20 of 37
21Confidential Draft
Least Cost(ldquoLCrdquo)
Least Cost + REA Resources
(ldquoLC+REArdquo)
Separate System Planning
(ldquoSSPrdquo)
Portfoliooptimization
Least-cost system optimization
Reoptimize Least Cost to add additional renewables amp storage dedicated to NM to satisfy REA requirements
Optimize NM and TX systems independently
without modeling interactions between them
NM zero-carbon generation balancing period
Annual Annual Hourly
NM and TX capacity pooling to ensure reliability
Resource allocationResources allocated
proportionally more RECs allocated to NM
Incremental resources are allocated to New Mexico
Optimization identifies resources specifically for NM and TX jurisdictions
NM allocated new gas capacity
New Mexico REA Scenarios
More stringent REA interpretation
Attachment D-2 E-3 June IRP Presentation Page 21 of 37
New Mexico REA Scenario
Results
Attachment D-2 E-3 June IRP Presentation Page 22 of 37
23Confidential Draft
Least Cost(ldquoLCrdquo)
Least Cost + ETA Resources
(ldquoLC+ETArdquo)
Separate System Planning
(ldquoSSPrdquo)
Portfoliooptimization
Least-cost system optimization
Reoptimize Least Cost to add additional renewables amp storage dedicated to NM to satisfy ETA requirements
Optimize NM and TX systems independently
without modeling interactions between them
NM zero-carbon generation balancing period
Annual Annual Hourly
NM and TX capacity pooling to ensure reliability
Resource allocationResources allocated
proportionally more RECs allocated to NM
Incremental resources are allocated to New Mexico
Optimization identifies resources specifically for NM and TX jurisdictions
NM allocated new gas capacity
New Mexico REA Scenarios
Attachment D-2 E-3 June IRP Presentation Page 23 of 37
24Confidential Draft
Resource Portfolios and Costs by ScenarioLeast Cost Scenario
Total System New Mexico
This scenario allocates a share of new gas capacity to NM customers This capacity could be converted to run on a higher share of hydrogen fuel in the future More RECs would be allocated to NM customers to satisfy the REA
112 MW of new gas capacity is allocated to New Mexico customers by 2040
This analysis does not assume Palo Verde 3 generation is allocated to New Mexico resulting in a lower zero-carbon generation share than the rest of the system
Attachment D-2 E-3 June IRP Presentation Page 24 of 37
25Confidential Draft
Least Cost(ldquoLCrdquo)
Least Cost + REA Resources
(ldquoLC+REArdquo)
Separate System Planning
(ldquoSSPrdquo)
Portfoliooptimization
Least-cost system optimization
Reoptimize Least Cost to add additional renewables amp storage dedicated to NM to satisfy REA requirements
Optimize NM and TX systems independently
without modeling interactions between them
NM zero-carbon generation balancing period
Annual Annual Hourly
NM and TX capacity pooling to ensure reliability
Resource allocationResources allocated
proportionally more RECs allocated to NM
Incremental resources are allocated to New Mexico
Optimization identifies resources specifically for NM and TX jurisdictions
NM allocated new gas capacity
New Mexico REA Scenarios
Attachment D-2 E-3 June IRP Presentation Page 25 of 37
26Confidential Draft
Resource Portfolios and Costs by ScenarioLeast Cost + REA Scenario
Total System New Mexico
This scenario adds more solar and storage capacity for NM customers to satisfy the RPSREA targets while not allocating any new gas to NM customers This results in a modest cost increase vs Least Cost scenario
Gas generation serves a portion of New Mexico customersrsquo energy needs in some hours but that is more than offset by
Attachment D-2 E-3 June IRP Presentation Page 26 of 37
27Confidential Draft
New Mexico REA Scenarios
Least Cost(ldquoLCrdquo)
Least Cost + REA Resources
(ldquoLC+REArdquo)
Separate System Planning
(ldquoSSPrdquo)
Portfoliooptimization
Least-cost system optimization
Reoptimize Least Cost to add additional renewables amp storage dedicated to NM to satisfy REA requirements
Optimize NM and TX systems independently
without modeling interactions between them
NM zero-carbon generation balancing period
Annual Annual Hourly
NM and TX capacity pooling to ensure reliability
Resource allocationResources allocated
proportionally more RECs allocated to NM
Incremental resources are allocated to New Mexico
Optimization identifies resources specifically for NM and TX jurisdictions
NM allocated new gas capacity
Attachment D-2 E-3 June IRP Presentation Page 27 of 37
28Confidential Draft
Resource Portfolios and Costs by ScenarioSeparate System Planning Scenario
Total System New Mexico
This scenario requires significantly more resources for New Mexico to reach 100 absolute zero carbon and ensure reliability This results in a significant cost increase relative to the Least Cost scenario
Attachment D-2 E-3 June IRP Presentation Page 28 of 37
29Confidential Draft
Resource Portfolios and Costs by ScenarioSeparate System Planning (H2) Scenario
Total System New Mexico
Adding H2 capacity ensures reliability while significantly reducing solar and storage additions This mitigates cost impacts of achieving absolute zero carbon and planning to ensure reliability independently
Attachment D-2 E-3 June IRP Presentation Page 29 of 37
30Confidential Draft
New Mexico Capacity and CostLeast Cost Scenario
Least Cost Cost Impact vs Least Cost Scenario
The Least Cost scenario is the baseline for comparison Least
Cost
Attachment D-2 E-3 June IRP Presentation Page 30 of 37
31Confidential Draft
New Mexico Capacity and CostLeast Cost + REA Resources Scenario
Least Cost + REA Resources Cost Impact vs Least Cost Scenario
Least Cost + REA Resources
Least Cost
Attachment D-2 E-3 June IRP Presentation Page 31 of 37
32Confidential Draft
New Mexico Capacity and CostSeparate System Planning Scenario
Separate System Planning Cost Impact vs Least Cost Scenario
Least Cost + REA Resources
Separate System Planning
Least Cost
Attachment D-2 E-3 June IRP Presentation Page 32 of 37
33Confidential Draft
New Mexico Capacity and CostSeparate System Planning (H2) Scenario
Separate System Planning (H2) Cost Impact vs Least Cost Scenario
Least Cost + REA Resources
Separate System Planning (H2)
Separate System Planning
Least Cost
Attachment D-2 E-3 June IRP Presentation Page 33 of 37
34Confidential Draft
New Mexico Generation MixLeast Cost and Least Cost + REA Scenarios
Least Cost Least Cost + REA Resources
Attachment D-2 E-3 June IRP Presentation Page 34 of 37
35Confidential Draft
New Mexico Generation MixSeparate System Planning Scenarios
Separate System Planning Separate System Planning (H2)
Attachment D-2 E-3 June IRP Presentation Page 35 of 37
36Confidential Draft
Carbon Emissions Across Scenarios
CO2 Emissions in 2021 and 2040 Average Abatement Cost 2025-2040
Note emissions include emissions at company-owned facilities and emissions ascribed to imports2040
Attachment D-2 E-3 June IRP Presentation Page 36 of 37
Thank You
Thank You
Attachment D-2 E-3 June IRP Presentation Page 37 of 37
Attachment D-3 E3 EPE Report Model Results AugustPage 1 of 34
Scenario Resource Type 2021 2024 2025 2027 2031 2035 2040 2045Least-Cost (Reference Case) Nuclear (Palo Verde) 5148 5148 5148 5148 5148 5148 5148 5148
Nuclear (SMR) - - - - - - - - Gas - Steam Turbine 140 34 8 7 1 - - - Gas - Combined Cycle 1767 1373 1037 1148 1187 1075 1321 1513 Gas - Combustion Turbine 1027 1169 854 925 874 767 1251 1657 Biomass - - - - - - - - Geothermal - - - - - - - - Wind - - 354 357 361 316 381 730 Solar 289 952 1450 1467 2016 3050 3469 4199 Battery Storage - 12 (25) (26) (104) (215) (223) (248) Imports 391 336 266 261 296 278 360 440 Demand Response - - - - - - - - Hydrogen - - - - - - - - BTM Solar 37 135 165 225 344 460 601 763 Load 8771 9155 9258 9512 10123 10878 12308 14203 Excess Generation 14 130 416 397 431 636 374 456
Least-Cost Case + REA Resources Nuclear (Palo Verde) 5148 5148 5148 5148 5148 5148 5148 5148 Nuclear (SMR) - - - - - - - - Gas - Steam Turbine 140 34 4 11 1 - - - Gas - Combined Cycle 1767 1373 926 1001 1044 927 966 1101 Gas - Combustion Turbine 1027 1169 784 855 780 495 761 1005 Biomass - - - - - - - - Geothermal - - - - - - - - Wind - - 681 694 699 561 725 995 Solar 289 952 1340 1356 2030 3274 4121 5334 Battery Storage - 12 (29) (30) (105) (236) (277) (369) Imports 391 336 239 251 182 248 262 226 Demand Response - - - - - - - - Hydrogen - - - - - - - - BTM Solar 37 135 165 225 344 460 601 763 Load 8771 9155 9258 9512 10123 10878 12308 14203 Excess Generation 14 130 428 400 449 1144 1071 892
Separate System Planning Nuclear (Palo Verde) 5148 5148 5148 5148 5148 5148 5148 5148 Nuclear (SMR) - - - - - - - - Gas - Steam Turbine 140 34 1 2 - - - - Gas - Combined Cycle 1763 1385 1125 1238 1235 1000 1201 1349 Gas - Combustion Turbine 1048 1180 852 922 920 502 768 1046 Biomass - - - - - - - - Geothermal - - - - - - - - Wind - - 174 175 169 76 23 398 Solar 289 950 1556 1594 2135 3760 4704 5638 Battery Storage - 11 (55) (62) (129) (300) (367) (423) Imports 391 328 291 269 301 232 229 283 Demand Response - - - - - - - - Hydrogen - - - - - - - - BTM Solar 37 135 165 225 344 460 601 763 Load 8771 9155 9258 9512 10123 10878 12308 14203 Excess Generation 14 132 304 265 365 1270 2517 2452
Annual Energy (GWh)
Attachment D-3 E3 EPE Report Model Results AugustPage 2 of 34
Scenario Resource Type 2021 2024 2025 2027 2031 2035 2040 2045Annual Energy (GWh)
Separate System Planning (w H2) Nuclear (Palo Verde) 5148 5148 5148 5148 5148 5148 5148 5148 Nuclear (SMR) - - - - - - - - Gas - Steam Turbine 140 34 1 2 - - - - Gas - Combined Cycle 1763 1385 1101 1210 1223 1104 1199 1348 Gas - Combustion Turbine 1048 1180 843 915 870 762 793 1072 Biomass - - - - - - - - Geothermal - - - - - - - - Wind - - 214 215 207 202 285 678 Solar 289 950 1551 1588 2173 3139 4241 5147 Battery Storage - 11 (54) (61) (130) (221) (311) (365) Imports 391 328 288 270 288 285 278 331 Demand Response - - - - - - - - Hydrogen - - - - - - 74 80 BTM Solar 37 135 165 225 344 460 601 763 Load 8771 9155 9258 9512 10123 10878 12308 14203 Excess Generation 14 132 314 276 474 696 883 967
80 Clean by 2035 Nuclear (Palo Verde) 5148 5148 5148 5148 5148 5148 5148 5148 Nuclear (SMR) - - - - - - - - Gas - Steam Turbine 140 34 8 11 1 - - - Gas - Combined Cycle 1767 1373 1028 1131 1175 1088 1160 1293 Gas - Combustion Turbine 1027 1169 849 922 868 767 1055 1256 Biomass - - - - - - - - Geothermal - - - - - - - - Wind - - 378 381 385 342 650 1041 Solar 289 953 1450 1463 2012 3006 3689 4703 Battery Storage - 12 (24) (26) (103) (207) (238) (289) Imports 391 336 255 256 292 274 241 287 Demand Response - - - - - - - - Hydrogen - - - - - - - - BTM Solar 37 135 165 225 344 460 601 763 Load 8771 9155 9258 9512 10123 10878 12308 14203 Excess Generation 14 130 406 391 436 677 472 735
20 CO2 Red by 2040 Nuclear (Palo Verde) 5148 5148 5148 5148 5148 5148 5148 5148 Nuclear (SMR) - - - - - - - - Gas - Steam Turbine 140 34 8 11 1 - - - Gas - Combined Cycle 1767 1373 1027 1131 1175 1089 1253 1260 Gas - Combustion Turbine 1027 1169 849 922 868 765 1132 1187 Biomass - - - - - - - - Geothermal - - - - - - - - Wind - - 378 381 385 342 457 1095 Solar 289 953 1442 1456 2012 3007 3621 4792 Battery Storage - 12 (24) (26) (103) (207) (236) (297) Imports 391 336 264 264 292 275 332 255 Demand Response - - - - - - - - Hydrogen - - - - - - - - BTM Solar 37 135 165 225 344 460 601 763 Load 8771 9155 9258 9512 10123 10878 12308 14203 Excess Generation 14 129 415 398 436 676 463 752
Attachment D-3 E3 EPE Report Model Results AugustPage 3 of 34
Scenario Resource Type 2021 2024 2025 2027 2031 2035 2040 2045Annual Energy (GWh)
40 CO2 Red by 2040 Nuclear (Palo Verde) 5148 5148 5148 5148 5148 5148 5148 5148 Nuclear (SMR) - - - - - - - - Gas - Steam Turbine 140 34 8 11 1 - - - Gas - Combined Cycle 1767 1373 1027 1131 1175 1089 1060 1028 Gas - Combustion Turbine 1027 1169 849 922 868 767 790 822 Biomass - - - - - - - - Geothermal - - - - - - - - Wind - - 378 381 385 342 783 961 Solar 289 953 1441 1458 2013 3004 3980 5677 Battery Storage - 12 (24) (26) (103) (207) (264) (396) Imports 391 336 264 262 292 276 210 199 Demand Response - - - - - - - - Hydrogen - - - - - - - - BTM Solar 37 135 165 225 344 460 601 763 Load 8771 9155 9258 9512 10123 10878 12308 14203 Excess Generation 14 130 415 396 435 680 811 1196
60 CO2 Red by 2040 Nuclear (Palo Verde) 5148 5148 5148 5148 5148 5148 5148 5148 Nuclear (SMR) - - - - - - - - Gas - Steam Turbine 140 34 7 12 1 - - - Gas - Combined Cycle 1767 1373 1001 1093 1143 1029 780 735 Gas - Combustion Turbine 1027 1169 840 915 852 656 453 483 Biomass - - - - - - - - Geothermal - - - - - - - - Wind - - 444 448 451 388 853 808 Solar 289 953 1419 1436 2000 3174 4624 6588 Battery Storage - 12 (25) (26) (101) (226) (312) (488) Imports 391 336 259 260 286 250 161 166 Demand Response - - - - - - - - Hydrogen - - - - - - - - BTM Solar 37 135 165 225 344 460 601 763 Load 8771 9155 9258 9512 10123 10878 12308 14203 Excess Generation 14 129 411 390 452 766 1514 1850
80 CO2 Red by 2040 Nuclear (Palo Verde) 5148 5148 5148 5148 5148 5148 5148 5148 Nuclear (SMR) - - - - - - - - Gas - Steam Turbine 140 34 4 11 1 - - - Gas - Combined Cycle 1767 1373 914 986 1049 835 531 500 Gas - Combustion Turbine 1027 1169 771 842 725 399 127 142 Biomass - - - - - - - - Geothermal - - - - - - - - Wind - - 722 735 743 584 1310 1417 Solar 289 953 1329 1343 2004 3491 4869 6658 Battery Storage - 12 (31) (30) (102) (245) (342) (499) Imports 391 336 235 251 212 208 63 73 Demand Response - - - - - - - - Hydrogen - - - - - - - - BTM Solar 37 135 165 225 344 460 601 763 Load 8771 9155 9258 9512 10123 10878 12308 14203 Excess Generation 14 130 444 417 491 1350 2580 2939
Attachment D-3 E3 EPE Report Model Results AugustPage 4 of 34
Scenario Resource Type 2021 2024 2025 2027 2031 2035 2040 2045Annual Energy (GWh)
90 CO2 Red by 2040 Nuclear (Palo Verde) 5148 5148 5148 5148 5148 5148 5148 5148 Nuclear (SMR) - - - - - - - - Gas - Steam Turbine 140 34 4 11 2 - - - Gas - Combined Cycle 1767 1373 908 979 1009 778 304 290 Gas - Combustion Turbine 1027 1169 766 836 622 291 29 44 Biomass - - - - - - - - Geothermal - - - - - - - - Wind - - 740 754 763 513 1964 2116 Solar 289 952 1325 1339 2154 3842 4535 6263 Battery Storage - 12 (31) (30) (100) (278) (308) (453) Imports 391 336 232 250 182 125 35 32 Demand Response - - - - - - - - Hydrogen - - - - - - - - BTM Solar 37 135 165 225 344 460 601 763 Load 8771 9155 9258 9512 10123 10878 12308 14203 Excess Generation 14 130 452 424 650 1462 3356 3714
100 CO2 Red by 2040 (w H2) Nuclear (Palo Verde) 5148 5148 5148 5148 5148 5148 5148 5148 Nuclear (SMR) - - - - - - - - Gas - Steam Turbine 140 34 5 7 2 - - - Gas - Combined Cycle 1767 1373 860 928 924 643 - - Gas - Combustion Turbine 1027 1169 715 779 558 188 - - Biomass - - - - - - - - Geothermal - - - - - - - - Wind - - 896 917 922 557 1629 1685 Solar 289 952 1284 1297 2175 4069 4874 6693 Battery Storage - 12 (31) (32) (97) (302) (345) (509) Imports 391 336 215 242 148 114 - - Demand Response - - - - - - - - Hydrogen - - - - - - 400 423 BTM Solar 37 135 165 225 344 460 601 763 Load 8771 9155 9258 9512 10123 10878 12308 14203 Excess Generation 14 130 528 495 798 1795 3187 3597
100 CO2 Red by 2040 Nuclear (Palo Verde) 5148 5148 5148 5148 5148 5148 5148 5148 Nuclear (SMR) - - - - - - - - Gas - Steam Turbine 140 34 7 12 2 - - - Gas - Combined Cycle 1767 1373 1013 1110 924 643 - - Gas - Combustion Turbine 1027 1169 843 917 558 188 - - Biomass - - - - - - - - Geothermal - - - - - - - - Wind - - 416 419 922 557 1992 2629 Solar 289 952 1430 1445 2175 4069 4973 5542 Battery Storage - 12 (25) (26) (97) (302) (406) (572) Imports 391 336 260 261 148 114 - - Demand Response - - - - - - - - Hydrogen - - - - - - - - BTM Solar 37 135 165 225 344 460 601 1455 Load 8771 9155 9258 9512 10123 10878 12308 14203 Excess Generation 14 130 412 393 798 1795 11640 13062
Attachment D-3 E3 EPE Report Model Results AugustPage 5 of 34
Scenario Resource Type 2021 2024 2025 2027 2031 2035 2040 2045Annual Energy (GWh)
High DG Nuclear (Palo Verde) 5148 5148 5148 5148 5148 5148 5148 5148 Nuclear (SMR) - - - - - - - - Gas - Steam Turbine 134 31 9 12 1 - - - Gas - Combined Cycle 1728 1317 1044 1144 1175 1073 1273 1538 Gas - Combustion Turbine 1028 1123 885 923 846 711 1096 1713 Biomass - - - - - - - - Geothermal - - - - - - - - Wind - - 338 336 341 295 352 763 Solar 285 866 1148 1107 1485 2336 2661 2700 Battery Storage - 11 (25) (25) (105) (226) (249) (243) Imports 389 314 273 258 287 265 347 441 Demand Response - - - - - - - - Hydrogen - - - - - - - - BTM Solar 88 350 436 608 945 1276 1680 2144 Load 8771 9155 9258 9512 10123 10878 12308 14203 Excess Generation 18 217 389 432 552 696 602 379
High DSM Nuclear (Palo Verde) 5148 5148 5148 5148 5148 5148 5148 5148 Nuclear (SMR) - - - - - - - - Gas - Steam Turbine 133 30 2 3 0 - - - Gas - Combined Cycle 1744 1303 1197 1315 1357 1105 1320 1460 Gas - Combustion Turbine 1020 1111 977 1001 989 706 1104 1404 Biomass - - - - - - - - Geothermal - - - - - - - - Wind - - - - - - - 471 Solar 288 934 1274 1273 1604 2760 3166 3725 Battery Storage - 10 (25) (23) (80) (203) (216) (234) Imports 390 329 318 286 318 297 377 438 Demand Response - - - - - - - - Hydrogen - - - - - - - - BTM Solar 37 135 165 225 344 460 601 763 Load 8731 8994 9056 9230 9680 10273 11501 13177 Excess Generation 15 148 197 197 215 541 326 371
Low Load Nuclear (Palo Verde) 5148 5148 5148 5148 5148 5148 5148 5148 Nuclear (SMR) - - - - - - - - Gas - Steam Turbine 101 27 2 3 2 - - - Gas - Combined Cycle 1596 1244 1155 1300 1422 1129 1372 1496 Gas - Combustion Turbine 983 1065 942 985 1034 759 1214 1529 Biomass - - - - - - - - Geothermal - - - - - - - - Wind - - - - - - - 523 Solar 282 919 1260 1272 1563 2869 3314 3970 Battery Storage - 8 (26) (24) (69) (209) (222) (246) Imports 381 325 311 284 315 303 385 440 Demand Response - - - - - - - - Hydrogen - - - - - - - - BTM Solar 37 135 165 225 344 460 601 763 Load 8492 8862 8958 9194 9759 10459 11813 13623 Excess Generation 22 163 216 205 224 535 317 399
Attachment D-3 E3 EPE Report Model Results AugustPage 6 of 34
Scenario Resource Type 2021 2024 2025 2027 2031 2035 2040 2045Annual Energy (GWh)
High Load Nuclear (Palo Verde) 5148 5148 5148 5148 5148 5148 5148 5148 Nuclear (SMR) - - - - - - - - Gas - Steam Turbine 195 50 7 3 - - - - Gas - Combined Cycle 1909 1522 1077 1166 1126 1113 1386 1518 Gas - Combustion Turbine 1088 1256 889 937 786 875 1409 1781 Biomass - - - - - - - - Geothermal - - - - - - - - Wind - - 420 424 404 387 450 957 Solar 293 983 1618 1717 2556 3249 3659 4426 Battery Storage - 14 (42) (64) (158) (220) (224) (251) Imports 400 343 275 273 281 286 373 440 Demand Response - - - - - - - - Hydrogen - - - - - - - - BTM Solar 37 135 165 225 344 460 601 763 Load 9050 9448 9558 9830 10488 11297 12803 14784 Excess Generation 10 100 381 278 543 642 387 518
No Lifetime Extensions Nuclear (Palo Verde) 5148 5148 5148 5148 5148 5148 5148 5148 Nuclear (SMR) - - - - - - - - Gas - Steam Turbine 140 34 12 2 - - - - Gas - Combined Cycle 1767 1373 972 1029 1055 1069 1314 1513 Gas - Combustion Turbine 1027 1169 744 693 636 764 1246 1657 Biomass - - - - - - - - Geothermal - - - - - - - - Wind - - 364 369 340 337 408 730 Solar 289 952 1643 1894 2495 3039 3457 4199 Battery Storage - 12 (26) (92) (164) (214) (223) (248) Imports 391 336 235 243 270 276 357 440 Demand Response - - - - - - - - Hydrogen - - - - - - - - BTM Solar 37 135 165 225 344 460 601 763 Load 8771 9155 9258 9512 10123 10878 12308 14203 Excess Generation 14 130 669 413 585 637 371 456
No New Gas Nuclear (Palo Verde) 5148 5148 5148 5148 5148 5148 5148 5148 Nuclear (SMR) - - - - - - - - Gas - Steam Turbine 140 34 7 12 1 - - - Gas - Combined Cycle 1767 1373 1013 1110 1156 829 774 714 Gas - Combustion Turbine 1027 1169 843 917 859 294 269 286 Biomass - - - - - - - - Geothermal - - - - - - - - Wind - - 416 419 423 227 195 209 Solar 289 952 1430 1445 2002 4003 5562 7483 Battery Storage - 12 (25) (26) (102) (320) (460) (623) Imports 391 336 260 261 293 237 219 223 Demand Response - - - - - - - - Hydrogen - - - - - - - - BTM Solar 37 135 165 225 344 460 601 763 Load 8771 9155 9258 9512 10123 10878 12308 14203 Excess Generation 14 130 412 393 449 1709 2222 2760
Attachment D-3 E3 EPE Report Model Results AugustPage 7 of 34
Scenario Resource Type 2021 2024 2025 2027 2031 2035 2040 2045Annual Energy (GWh)
Low Carbon Price Nuclear (Palo Verde) 5148 5148 5148 5148 5148 5148 5148 5148 Nuclear (SMR) - - - - - - - - Gas - Steam Turbine 127 23 4 5 1 - - - Gas - Combined Cycle 1803 1433 1000 1092 1104 988 1204 1335 Gas - Combustion Turbine 1001 1107 776 839 788 598 1076 1338 Biomass - - - - - - - - Geothermal - - - - - - - - Wind - - 562 571 569 479 581 943 Solar 289 958 1390 1406 1988 3174 3609 4556 Battery Storage - 11 (30) (29) (104) (228) (238) (278) Imports 394 345 242 255 285 258 326 397 Demand Response - - - - - - - - Hydrogen - - - - - - - - BTM Solar 37 135 165 225 344 460 601 763 Load 8771 9155 9258 9512 10123 10878 12308 14203 Excess Generation 14 125 403 379 473 835 521 718
Mid Carbon Price Nuclear (Palo Verde) 5148 5148 5148 5148 5148 5148 5148 5148 Nuclear (SMR) - - - - - - - - Gas - Steam Turbine 120 22 3 4 1 - - - Gas - Combined Cycle 1822 1496 923 994 1017 922 1107 1275 Gas - Combustion Turbine 983 1036 596 663 681 475 938 1205 Biomass - - - - - - - - Geothermal - - - - - - - - Wind - - 771 794 801 650 804 1099 Solar 290 961 1474 1493 2020 3264 3720 4732 Battery Storage - 7 (35) (36) (101) (230) (245) (291) Imports 399 354 212 227 211 190 235 273 Demand Response - - - - - - - - Hydrogen - - - - - - - - BTM Solar 37 135 165 225 344 460 601 763 Load 8771 9155 9258 9512 10123 10878 12308 14203 Excess Generation 13 121 615 574 500 912 572 727
High Carbon Price Nuclear (Palo Verde) 5148 5148 5148 5148 5148 5148 5148 5148 Nuclear (SMR) - - - - - - - - Gas - Steam Turbine 119 21 3 3 2 - - - Gas - Combined Cycle 1835 1540 704 778 913 873 962 863 Gas - Combustion Turbine 962 989 447 494 545 394 614 583 Biomass - - - - - - - - Geothermal - - - - - - - - Wind - - 881 916 965 778 930 859 Solar 290 963 1760 1782 2130 3267 4138 6248 Battery Storage - 2 (37) (36) (98) (230) (275) (458) Imports 408 362 187 203 174 188 189 195 Demand Response - - - - - - - - Hydrogen - - - - - - - - BTM Solar 37 135 165 225 344 460 601 763 Load 8771 9155 9258 9512 10123 10878 12308 14203 Excess Generation 13 120 1146 1089 774 1061 1077 1549
Attachment D-3 E3 EPE Report Model Results AugustPage 8 of 34
Scenario Resource Type 2021 2024 2025 2027 2031 2035 2040 2045Annual Energy (GWh)
High Gas Price Nuclear (Palo Verde) 5148 5148 5148 5148 5148 5148 5148 5148 Nuclear (SMR) - - - - - - - - Gas - Steam Turbine 125 31 6 5 1 - - - Gas - Combined Cycle 1787 1400 1015 1115 1125 1015 1242 1350 Gas - Combustion Turbine 1008 1120 803 853 805 627 1127 1365 Biomass - - - - - - - - Geothermal - - - - - - - - Wind - - 444 448 451 387 467 924 Solar 290 956 1419 1435 1998 3161 3603 4486 Battery Storage - 9 (29) (28) (103) (224) (235) (274) Imports 403 360 287 309 355 303 354 440 Demand Response - - - - - - - - Hydrogen - - - - - - - - BTM Solar 37 135 165 225 344 460 601 763 Load 8771 9155 9258 9512 10123 10878 12308 14203 Excess Generation 13 127 411 390 455 783 483 702
Low Renewable and Storage Costs Nuclear (Palo Verde) 5148 5148 5148 5148 5148 5148 5148 5148 Nuclear (SMR) - - - - - - - - Gas - Steam Turbine 140 34 3 6 1 - - - Gas - Combined Cycle 1767 1373 984 1068 1096 1000 1220 1278 Gas - Combustion Turbine 1027 1169 842 925 824 652 1127 1243 Biomass - - - - - - - - Geothermal - - - - - - - - Wind - - 558 564 559 474 578 1026 Solar 289 952 1321 1330 1975 3102 3538 4621 Battery Storage - 12 (29) (29) (102) (221) (232) (288) Imports 391 336 265 275 279 262 328 411 Demand Response - - - - - - - - Hydrogen - - - - - - - - BTM Solar 37 135 165 225 344 460 601 763 Load 8771 9155 9258 9512 10123 10878 12308 14203 Excess Generation 14 130 324 309 486 807 490 896
Attachment D-3 E3 EPE Report Model Results AugustPage 9 of 34
Scenario Resource TypeLeast-Cost (Reference Case) Nuclear (Palo Verde)
Nuclear (SMR)Gas - Steam TurbineGas - Combined CycleGas - Combustion TurbineBiomassGeothermalWindSolarBattery StorageImportsDemand ResponseHydrogenBTM SolarLoadExcess Generation
Least-Cost Case + REA Resources Nuclear (Palo Verde)Nuclear (SMR)Gas - Steam TurbineGas - Combined CycleGas - Combustion TurbineBiomassGeothermalWindSolarBattery StorageImportsDemand ResponseHydrogenBTM SolarLoadExcess Generation
Separate System Planning Nuclear (Palo Verde)Nuclear (SMR)Gas - Steam TurbineGas - Combined CycleGas - Combustion TurbineBiomassGeothermalWindSolarBattery StorageImportsDemand ResponseHydrogenBTM SolarLoadExcess Generation
2021 2024 2025 2027 2031 2035 2040 2045622 622 622 622 622 622 622 622 - - - - - - - - 426 307 307 307 234 - - - 493 493 493 493 493 266 266 266 503 731 731 731 668 870 1059 1216 - - - - - - - - - - - - - - - - - - 102 102 102 102 102 197 115 385 621 621 823 1235 1309 1561 - 50 177 177 488 1029 1129 1277 - - - - - - - - 46 53 56 61 71 81 93 93
- - - - - - - - 18 65 80 108 166 221 289 368
- - - - - - - - - - - - - - - - 622 622 622 622 622 622 622 622 - - - - - - - - 426 307 307 307 234 - - - 493 493 493 493 493 266 266 266 503 731 731 731 668 809 942 1051 - - - - - - - - - - - - - - - - - - 203 203 203 203 232 300 115 385 544 544 795 1414 1693 2037 - 50 176 177 460 1067 1246 1682 - - - - - - - - 46 53 56 61 71 81 93 93
- - - - - - - - 18 65 80 108 166 221 289 368
- - - - - - - - - - - - - - - - 622 622 622 622 622 622 622 622 - - - - - - - - 426 307 307 307 234 - - - 493 493 493 493 493 266 266 266 503 731 731 731 668 755 755 864 - - - - - - - - - - - - - - - - - - 49 49 49 49 49 161 115 385 639 639 859 1701 2450 2712 - 50 280 304 591 1514 2344 2674 - - - - - - - - 46 53 56 61 71 81 93 93
- - - - - - - - 18 65 80 108 166 221 289 368
- - - - - - - - - - - - - - - -
Installed Capacity (MW)
Attachment D-3 E3 EPE Report Model Results AugustPage 10 of 34
Scenario Resource TypeSeparate System Planning (w H2) Nuclear (Palo Verde)
Nuclear (SMR)Gas - Steam TurbineGas - Combined CycleGas - Combustion TurbineBiomassGeothermalWindSolarBattery StorageImportsDemand ResponseHydrogenBTM SolarLoadExcess Generation
80 Clean by 2035 Nuclear (Palo Verde)Nuclear (SMR)Gas - Steam TurbineGas - Combined CycleGas - Combustion TurbineBiomassGeothermalWindSolarBattery StorageImportsDemand ResponseHydrogenBTM SolarLoadExcess Generation
20 CO2 Red by 2040 Nuclear (Palo Verde)Nuclear (SMR)Gas - Steam TurbineGas - Combined CycleGas - Combustion TurbineBiomassGeothermalWindSolarBattery StorageImportsDemand ResponseHydrogenBTM SolarLoadExcess Generation
2021 2024 2025 2027 2031 2035 2040 2045Installed Capacity (MW)
622 622 622 622 622 622 622 622 - - - - - - - - 426 307 307 307 234 - - - 493 493 493 493 493 266 266 266 503 731 731 731 668 755 755 864 - - - - - - - - - - - - - - - - - - 60 60 60 60 107 218 115 385 638 638 905 1312 1724 2031 - 50 278 303 570 1057 1496 1797 - - - - - - - - 46 53 56 61 71 81 93 93
- - - - - 123 206 212 18 65 80 108 166 221 289 368
- - - - - - - - - - - - - - - - 622 622 622 622 622 622 622 622 - - - - - - - - 426 307 307 307 234 - - - 493 493 493 493 493 266 266 266 503 731 731 731 668 910 1022 1149 - - - - - - - - - - - - - - - - - - 109 109 109 109 185 289 115 385 615 615 821 1233 1383 1799 - 50 177 177 486 968 1145 1327 - - - - - - - - 46 53 56 61 71 81 93 93
- - - - - - - - 18 65 80 108 166 221 289 368
- - - - - - - - - - - - - - - - 622 622 622 622 622 622 622 622 - - - - - - - - 426 307 307 307 234 - - - 493 493 493 493 493 266 266 266 503 731 731 731 668 910 1036 1138 - - - - - - - - - - - - - - - - - - 109 109 109 109 125 300 115 385 615 615 821 1233 1383 1837 - 50 177 177 486 968 1145 1359 - - - - - - - - 46 53 56 61 71 81 93 93
- - - - - - - - 18 65 80 108 166 221 289 368
- - - - - - - - - - - - - - - -
Attachment D-3 E3 EPE Report Model Results AugustPage 11 of 34
Scenario Resource Type40 CO2 Red by 2040 Nuclear (Palo Verde)
Nuclear (SMR)Gas - Steam TurbineGas - Combined CycleGas - Combustion TurbineBiomassGeothermalWindSolarBattery StorageImportsDemand ResponseHydrogenBTM SolarLoadExcess Generation
60 CO2 Red by 2040 Nuclear (Palo Verde)Nuclear (SMR)Gas - Steam TurbineGas - Combined CycleGas - Combustion TurbineBiomassGeothermalWindSolarBattery StorageImportsDemand ResponseHydrogenBTM SolarLoadExcess Generation
80 CO2 Red by 2040 Nuclear (Palo Verde)Nuclear (SMR)Gas - Steam TurbineGas - Combined CycleGas - Combustion TurbineBiomassGeothermalWindSolarBattery StorageImportsDemand ResponseHydrogenBTM SolarLoadExcess Generation
2021 2024 2025 2027 2031 2035 2040 2045Installed Capacity (MW)
622 622 622 622 622 622 622 622 - - - - - - - - 426 307 307 307 234 - - - 493 493 493 493 493 266 266 266 503 731 731 731 668 909 973 1022 - - - - - - - - - - - - - - - - - - 109 109 109 109 239 300 115 385 615 615 821 1234 1563 2248 - 50 177 177 486 969 1184 1746 - - - - - - - - 46 53 56 61 71 81 93 93
- - - - - - - - 18 65 80 108 166 221 289 368
- - - - - - - - - - - - - - - - 622 622 622 622 622 622 622 622 - - - - - - - - 426 307 307 307 234 - - - 493 493 493 493 493 266 266 266 503 731 731 731 668 849 892 897 - - - - - - - - - - - - - - - - - - 128 128 128 128 301 302 115 385 599 599 816 1309 1965 2744 - 50 177 177 481 1044 1347 2145 - - - - - - - - 46 53 56 61 71 81 93 93
- - - - - - - - 18 65 80 108 166 221 289 368
- - - - - - - - - - - - - - - - 622 622 622 622 622 622 622 622 - - - - - - - - 426 307 307 307 234 - - - 493 493 493 493 493 266 266 266 503 731 731 731 668 778 778 778 - - - - - - - - - - - - - - - - - - 217 217 217 217 552 585 115 385 538 538 793 1555 2257 3007 - 50 176 177 458 1097 1645 2461 - - - - - - - - 46 53 56 61 71 81 93 93
- - - - - - - - 18 65 80 108 166 221 289 368
- - - - - - - - - - - - - - - -
Attachment D-3 E3 EPE Report Model Results AugustPage 12 of 34
Scenario Resource Type90 CO2 Red by 2040 Nuclear (Palo Verde)
Nuclear (SMR)Gas - Steam TurbineGas - Combined CycleGas - Combustion TurbineBiomassGeothermalWindSolarBattery StorageImportsDemand ResponseHydrogenBTM SolarLoadExcess Generation
100 CO2 Red by 2040 (w H2) Nuclear (Palo Verde)Nuclear (SMR)Gas - Steam TurbineGas - Combined CycleGas - Combustion TurbineBiomassGeothermalWindSolarBattery StorageImportsDemand ResponseHydrogenBTM SolarLoadExcess Generation
100 CO2 Red by 2040 Nuclear (Palo Verde)Nuclear (SMR)Gas - Steam TurbineGas - Combined CycleGas - Combustion TurbineBiomassGeothermalWindSolarBattery StorageImportsDemand ResponseHydrogenBTM SolarLoadExcess Generation
2021 2024 2025 2027 2031 2035 2040 2045Installed Capacity (MW)
622 622 622 622 622 622 622 622 - - - - - - - - 426 307 307 307 234 - - - 493 493 493 493 493 266 266 266 503 731 731 731 668 726 726 726 - - - - - - - - - - - - - - - - - - 224 224 224 224 801 828 115 385 535 535 901 1679 2300 3049 - 50 176 177 452 1284 1777 2595 - - - - - - - - 46 53 56 61 71 81 93 93
- - - - - - - - 18 65 80 108 166 221 289 368
- - - - - - - - - - - - - - - - 622 622 622 622 622 622 622 622 - - - - - - - - 426 307 307 307 234 - - - 493 493 493 493 493 266 - - 503 731 731 731 668 688 - - - - - - - - - - - - - - - - - - - - 282 282 282 282 682 696 115 385 512 512 925 1801 2403 3178 - 50 176 177 445 1385 1955 2797 - - - - - - - - 46 53 56 61 71 81 93 93
- - - - - - 954 954 18 65 80 108 166 221 289 368
- - - - - - - - - - - - - - - - 622 622 622 622 622 622 622 622 - - - - - - - - 426 307 307 307 234 - - - 493 493 493 493 493 266 266 266 503 731 731 731 668 688 668 668 - - - - - - - - - - - - - - - - - - 120 120 282 282 1216 1605 115 385 606 606 925 1801 4851 5217 - 50 177 177 445 1385 6191 7470 - - - - - - - - 46 53 56 61 71 81 93 93
- - - - - - - - 18 65 80 108 166 221 289 701
- - - - - - - - - - - - - - - -
Attachment D-3 E3 EPE Report Model Results AugustPage 13 of 34
Scenario Resource TypeHigh DG Nuclear (Palo Verde)
Nuclear (SMR)Gas - Steam TurbineGas - Combined CycleGas - Combustion TurbineBiomassGeothermalWindSolarBattery StorageImportsDemand ResponseHydrogenBTM SolarLoadExcess Generation
High DSM Nuclear (Palo Verde)Nuclear (SMR)Gas - Steam TurbineGas - Combined CycleGas - Combustion TurbineBiomassGeothermalWindSolarBattery StorageImportsDemand ResponseHydrogenBTM SolarLoadExcess Generation
Low Load Nuclear (Palo Verde)Nuclear (SMR)Gas - Steam TurbineGas - Combined CycleGas - Combustion TurbineBiomassGeothermalWindSolarBattery StorageImportsDemand ResponseHydrogenBTM SolarLoadExcess Generation
2021 2024 2025 2027 2031 2035 2040 2045Installed Capacity (MW)
622 622 622 622 622 622 622 622 - - - - - - - - 426 307 307 307 234 - - - 493 493 493 493 493 266 266 266 503 731 731 731 668 860 1026 1228 - - - - - - - - - - - - - - - - - - 96 96 96 96 96 203 115 385 511 511 684 1010 1107 1018 - 50 176 176 479 1041 1166 1263 - - - - - - - - 46 53 56 61 71 81 93 93
- - - - - - - - 42 169 210 293 455 614 809 1032
- - - - - - - - - - - - - - - - 622 622 622 622 622 622 622 622 - - - - - - - - 426 307 307 307 234 - - - 493 493 493 493 493 266 266 266 503 731 731 731 668 778 942 1058 - - - - - - - - - - - - - - - - - - - - - - - 128 115 385 519 519 638 1149 1212 1386 - 50 184 184 406 1001 1091 1213 - - - - - - - - 49 66 71 82 100 101 103 103
- - - - - - - - 18 65 80 108 166 221 289 368
- - - - - - - - - - - - - - - - 622 622 622 622 622 622 622 622 - - - - - - - - 426 307 307 307 234 - - - 493 493 493 493 493 266 266 266 503 731 731 731 668 724 896 1019 - - - - - - - - - - - - - - - - - - - - - - - 141 115 385 521 521 628 1185 1261 1477 - 50 186 186 355 1019 1121 1262 - - - - - - - - 46 53 56 61 71 81 93 93
- - - - - - - - 18 65 80 108 166 221 289 368
- - - - - - - - - - - - - - - -
Attachment D-3 E3 EPE Report Model Results AugustPage 14 of 34
Scenario Resource TypeHigh Load Nuclear (Palo Verde)
Nuclear (SMR)Gas - Steam TurbineGas - Combined CycleGas - Combustion TurbineBiomassGeothermalWindSolarBattery StorageImportsDemand ResponseHydrogenBTM SolarLoadExcess Generation
No Lifetime Extensions Nuclear (Palo Verde)Nuclear (SMR)Gas - Steam TurbineGas - Combined CycleGas - Combustion TurbineBiomassGeothermalWindSolarBattery StorageImportsDemand ResponseHydrogenBTM SolarLoadExcess Generation
No New Gas Nuclear (Palo Verde)Nuclear (SMR)Gas - Steam TurbineGas - Combined CycleGas - Combustion TurbineBiomassGeothermalWindSolarBattery StorageImportsDemand ResponseHydrogenBTM SolarLoadExcess Generation
2021 2024 2025 2027 2031 2035 2040 2045Installed Capacity (MW)
622 622 622 622 622 622 622 622 - - - - - - - - 426 307 307 307 234 - - - 493 493 493 493 493 266 266 266 503 731 731 731 668 1043 1247 1411 - - - - - - - - - - - - - - - - - - 119 119 119 119 119 260 115 385 662 662 1040 1304 1377 1643 - 50 235 327 708 1042 1142 1292 - - - - - - - - 46 53 56 61 71 81 93 93
- - - - - - - - 18 65 80 108 166 221 289 368
- - - - - - - - - - - - - - - - 622 622 622 622 622 622 622 622 - - - - - - - - 426 234 234 144 144 - - - 493 493 493 266 266 266 266 266 503 731 731 829 766 869 1058 1216 - - - - - - - - - - - - - - - - - - 109 109 109 109 109 197 115 385 767 767 1027 1229 1302 1561 - 50 183 432 756 1027 1128 1277 - - - - - - - - 46 53 56 61 71 81 93 93
- - - - - - - - 18 65 80 108 166 221 289 368
- - - - - - - - - - - - - - - - 622 622 622 622 622 622 622 622 - - - - - - - - 426 307 307 307 234 - - - 493 493 493 493 493 266 266 266 503 731 731 731 668 668 668 668 - - - - - - - - - - - - - - - - - - 120 120 120 120 120 132 115 385 606 606 818 1876 2580 3422 - 50 177 177 483 1585 2342 3200 - - - - - - - - 46 53 56 61 71 81 93 93
- - - - - - - - 18 65 80 108 166 221 289 368
- - - - - - - - - - - - - - - -
Attachment D-3 E3 EPE Report Model Results AugustPage 15 of 34
Scenario Resource TypeLow Carbon Price Nuclear (Palo Verde)
Nuclear (SMR)Gas - Steam TurbineGas - Combined CycleGas - Combustion TurbineBiomassGeothermalWindSolarBattery StorageImportsDemand ResponseHydrogenBTM SolarLoadExcess Generation
Mid Carbon Price Nuclear (Palo Verde)Nuclear (SMR)Gas - Steam TurbineGas - Combined CycleGas - Combustion TurbineBiomassGeothermalWindSolarBattery StorageImportsDemand ResponseHydrogenBTM SolarLoadExcess Generation
High Carbon Price Nuclear (Palo Verde)Nuclear (SMR)Gas - Steam TurbineGas - Combined CycleGas - Combustion TurbineBiomassGeothermalWindSolarBattery StorageImportsDemand ResponseHydrogenBTM SolarLoadExcess Generation
2021 2024 2025 2027 2031 2035 2040 2045Installed Capacity (MW)
622 622 622 622 622 622 622 622 - - - - - - - - 426 307 307 307 234 - - - 493 493 493 493 493 266 266 266 503 731 731 731 668 840 1027 1164 - - - - - - - - - - - - - - - - - - 163 163 163 163 163 269 115 385 573 573 805 1309 1383 1738 - 50 176 176 470 1044 1145 1314 - - - - - - - - 46 53 56 61 71 81 93 93
- - - - - - - - 18 65 80 108 166 221 289 368
- - - - - - - - - - - - - - - - 622 622 622 622 622 622 622 622 - - - - - - - - 426 307 307 307 234 - - - 493 493 493 493 493 266 266 266 503 731 731 731 668 824 1006 1145 - - - - - - - - - - - - - - - - - - 238 238 238 238 238 300 115 385 633 633 791 1310 1400 1808 - 50 176 176 456 1045 1149 1334 - - - - - - - - 46 53 56 61 71 81 93 93
- - - - - - - - 18 65 80 108 166 221 289 368
- - - - - - - - - - - - - - - - 622 622 622 622 622 622 622 622 - - - - - - - - 426 307 307 307 234 - - - 493 493 493 493 493 266 266 266 503 731 731 731 668 817 944 944 - - - - - - - - - - - - - - - - - - 300 300 300 300 300 301 115 385 857 857 886 1310 1666 2536 - 50 176 176 445 1045 1206 2000 - - - - - - - - 46 53 56 61 71 81 93 93
- - - - - - - - 18 65 80 108 166 221 289 368
- - - - - - - - - - - - - - - -
Attachment D-3 E3 EPE Report Model Results AugustPage 16 of 34
Scenario Resource TypeHigh Gas Price Nuclear (Palo Verde)
Nuclear (SMR)Gas - Steam TurbineGas - Combined CycleGas - Combustion TurbineBiomassGeothermalWindSolarBattery StorageImportsDemand ResponseHydrogenBTM SolarLoadExcess Generation
Low Renewable and Storage Costs Nuclear (Palo Verde)Nuclear (SMR)Gas - Steam TurbineGas - Combined CycleGas - Combustion TurbineBiomassGeothermalWindSolarBattery StorageImportsDemand ResponseHydrogenBTM SolarLoadExcess Generation
2021 2024 2025 2027 2031 2035 2040 2045Installed Capacity (MW)
622 622 622 622 622 622 622 622 - - - - - - - - 426 307 307 307 234 - - - 493 493 493 493 493 266 266 266 503 731 731 731 668 848 1036 1170 - - - - - - - - - - - - - - - - - - 128 128 128 128 128 264 115 385 599 599 816 1309 1383 1710 - 50 177 177 481 1044 1145 1309 - - - - - - - - 46 53 56 61 71 81 93 93
- - - - - - - - 18 65 80 108 166 221 289 368
- - - - - - - - - - - - - - - - 622 622 622 622 622 622 622 622 - - - - - - - - 426 307 307 307 234 - - - 493 493 493 493 493 266 266 266 503 731 731 731 668 847 1034 1146 - - - - - - - - - - - - - - - - - - 160 160 160 160 160 300 115 385 525 525 806 1277 1351 1805 - 50 190 190 471 1037 1138 1335 - - - - - - - - 46 53 56 61 71 81 93 93
- - - - - - - - 18 65 80 108 166 221 289 368
- - - - - - - - - - - - - - - -
Attachment D-3 E3 EPE Report Model Results AugustPage 17 of 34
Scenario Resource TypeLeast-Cost (Reference Case) Nuclear (Palo Verde)
Nuclear (SMR)Gas - Steam TurbineGas - Combined CycleGas - Combustion TurbineBiomassGeothermalWindSolarBattery StorageImportsDemand ResponseHydrogenBTM SolarLoadExcess Generation
Least-Cost Case + REA Resources Nuclear (Palo Verde)Nuclear (SMR)Gas - Steam TurbineGas - Combined CycleGas - Combustion TurbineBiomassGeothermalWindSolarBattery StorageImportsDemand ResponseHydrogenBTM SolarLoadExcess Generation
Separate System Planning Nuclear (Palo Verde)Nuclear (SMR)Gas - Steam TurbineGas - Combined CycleGas - Combustion TurbineBiomassGeothermalWindSolarBattery StorageImportsDemand ResponseHydrogenBTM SolarLoadExcess Generation
2021 2024 2025 2027 2031 2035 2040 2045- - - - - - - - - - - - - - - - - - - - - - - - - - - - - - - - - 228 228 228 228 430 619 776 - - - - - - - - - - - - - - - - - - 102 102 102 102 102 197 - 270 506 506 708 1190 1291 1823 - 50 177 177 488 1029 1129 1327 - - - - - - - - 46 53 56 61 71 81 93 93
- - - - - - - - 18 65 80 108 166 221 289 368
- - - - - - - - - - - - - - - - - - - - - - - - - - - - - - - - - - - - - - - - - - - - - - - - - 228 228 228 228 369 502 611 - - - - - - - - - - - - - - - - - - 203 203 203 203 232 300 - 270 429 429 680 1369 1675 2299 - 50 176 177 460 1067 1246 1732 - - - - - - - - 46 53 56 61 71 81 93 93
- - - - - - - - 18 65 80 108 166 221 289 368
- - - - - - - - - - - - - - - - - - - - - - - - - - - - - - - - - - - - - - - - - - - - - - - - - 228 228 228 228 315 315 424 - - - - - - - - - - - - - - - - - - 49 49 49 49 49 161 - 270 524 524 744 1656 2432 2974 - 50 280 304 591 1514 2344 2724 - - - - - - - - 46 53 56 61 71 81 93 93
- - - - - - - - 18 65 80 108 166 221 289 368
- - - - - - - - - - - - - - - -
Cumulative Capacity Additions (MW)
Attachment D-3 E3 EPE Report Model Results AugustPage 18 of 34
Scenario Resource TypeSeparate System Planning (w H2) Nuclear (Palo Verde)
Nuclear (SMR)Gas - Steam TurbineGas - Combined CycleGas - Combustion TurbineBiomassGeothermalWindSolarBattery StorageImportsDemand ResponseHydrogenBTM SolarLoadExcess Generation
80 Clean by 2035 Nuclear (Palo Verde)Nuclear (SMR)Gas - Steam TurbineGas - Combined CycleGas - Combustion TurbineBiomassGeothermalWindSolarBattery StorageImportsDemand ResponseHydrogenBTM SolarLoadExcess Generation
20 CO2 Red by 2040 Nuclear (Palo Verde)Nuclear (SMR)Gas - Steam TurbineGas - Combined CycleGas - Combustion TurbineBiomassGeothermalWindSolarBattery StorageImportsDemand ResponseHydrogenBTM SolarLoadExcess Generation
2021 2024 2025 2027 2031 2035 2040 2045Cumulative Capacity Additions (MW)
- - - - - - - - - - - - - - - - - - - - - - - - - - - - - - - - - 228 228 228 228 315 315 424 - - - - - - - - - - - - - - - - - - 60 60 60 60 107 218 - 270 523 523 790 1267 1706 2293 - 50 278 303 570 1057 1496 1847 - - - - - - - - 46 53 56 61 71 81 93 93
- - - - - 123 206 212 18 65 80 108 166 221 289 368
- - - - - - - - - - - - - - - - - - - - - - - - - - - - - - - - - - - - - - - - - - - - - - - - - 228 228 228 228 470 582 709 - - - - - - - - - - - - - - - - - - 109 109 109 109 185 289 - 270 500 500 706 1188 1365 2061 - 50 177 177 486 968 1145 1377 - - - - - - - - 46 53 56 61 71 81 93 93
- - - - - - - - 18 65 80 108 166 221 289 368
- - - - - - - - - - - - - - - - - - - - - - - - - - - - - - - - - - - - - - - - - - - - - - - - - 228 228 228 228 470 596 698 - - - - - - - - - - - - - - - - - - 109 109 109 109 125 300 - 270 500 500 706 1188 1365 2099 - 50 177 177 486 968 1145 1409 - - - - - - - - 46 53 56 61 71 81 93 93
- - - - - - - - 18 65 80 108 166 221 289 368
- - - - - - - - - - - - - - - -
Attachment D-3 E3 EPE Report Model Results AugustPage 19 of 34
Scenario Resource Type40 CO2 Red by 2040 Nuclear (Palo Verde)
Nuclear (SMR)Gas - Steam TurbineGas - Combined CycleGas - Combustion TurbineBiomassGeothermalWindSolarBattery StorageImportsDemand ResponseHydrogenBTM SolarLoadExcess Generation
60 CO2 Red by 2040 Nuclear (Palo Verde)Nuclear (SMR)Gas - Steam TurbineGas - Combined CycleGas - Combustion TurbineBiomassGeothermalWindSolarBattery StorageImportsDemand ResponseHydrogenBTM SolarLoadExcess Generation
80 CO2 Red by 2040 Nuclear (Palo Verde)Nuclear (SMR)Gas - Steam TurbineGas - Combined CycleGas - Combustion TurbineBiomassGeothermalWindSolarBattery StorageImportsDemand ResponseHydrogenBTM SolarLoadExcess Generation
2021 2024 2025 2027 2031 2035 2040 2045Cumulative Capacity Additions (MW)
- - - - - - - - - - - - - - - - - - - - - - - - - - - - - - - - - 228 228 228 228 469 533 582 - - - - - - - - - - - - - - - - - - 109 109 109 109 239 300 - 270 500 500 706 1189 1545 2510 - 50 177 177 486 969 1184 1796 - - - - - - - - 46 53 56 61 71 81 93 93
- - - - - - - - 18 65 80 108 166 221 289 368
- - - - - - - - - - - - - - - - - - - - - - - - - - - - - - - - - - - - - - - - - - - - - - - - - 228 228 228 228 409 452 457 - - - - - - - - - - - - - - - - - - 128 128 128 128 301 302 - 270 484 484 701 1264 1947 3006 - 50 177 177 481 1044 1347 2195 - - - - - - - - 46 53 56 61 71 81 93 93
- - - - - - - - 18 65 80 108 166 221 289 368
- - - - - - - - - - - - - - - - - - - - - - - - - - - - - - - - - - - - - - - - - - - - - - - - - 228 228 228 228 338 338 338 - - - - - - - - - - - - - - - - - - 217 217 217 217 552 585 - 270 423 423 678 1510 2239 3269 - 50 176 177 458 1097 1645 2511 - - - - - - - - 46 53 56 61 71 81 93 93
- - - - - - - - 18 65 80 108 166 221 289 368
- - - - - - - - - - - - - - - -
Attachment D-3 E3 EPE Report Model Results AugustPage 20 of 34
Scenario Resource Type90 CO2 Red by 2040 Nuclear (Palo Verde)
Nuclear (SMR)Gas - Steam TurbineGas - Combined CycleGas - Combustion TurbineBiomassGeothermalWindSolarBattery StorageImportsDemand ResponseHydrogenBTM SolarLoadExcess Generation
100 CO2 Red by 2040 (w H2) Nuclear (Palo Verde)Nuclear (SMR)Gas - Steam TurbineGas - Combined CycleGas - Combustion TurbineBiomassGeothermalWindSolarBattery StorageImportsDemand ResponseHydrogenBTM SolarLoadExcess Generation
100 CO2 Red by 2040 Nuclear (Palo Verde)Nuclear (SMR)Gas - Steam TurbineGas - Combined CycleGas - Combustion TurbineBiomassGeothermalWindSolarBattery StorageImportsDemand ResponseHydrogenBTM SolarLoadExcess Generation
2021 2024 2025 2027 2031 2035 2040 2045Cumulative Capacity Additions (MW)
- - - - - - - - - - - - - - - - - - - - - - - - - - - - - - - - - 228 228 228 228 286 286 286 - - - - - - - - - - - - - - - - - - 224 224 224 224 801 828 - 270 420 420 786 1634 2282 3311 - 50 176 177 452 1284 1777 2645 - - - - - - - - 46 53 56 61 71 81 93 93
- - - - - - - - 18 65 80 108 166 221 289 368
- - - - - - - - - - - - - - - - - - - - - - - - - - - - - - - - - - - - - - - - - - - - - - - - - 228 228 228 228 248 - - - - - - - - - - - - - - - - - - - - 282 282 282 282 682 696 - 270 397 397 810 1756 2385 3440 - 50 176 177 445 1385 1955 2847 - - - - - - - - 46 53 56 61 71 81 93 93
- - - - - - 248 248 18 65 80 108 166 221 289 368
- - - - - - - - - - - - - - - - - - - - - - - - - - - - - - - - - - - - - - - - - - - - - - - - - 228 228 228 228 248 228 228 - - - - - - - - - - - - - - - - - - 120 120 282 282 1216 1605 - 270 491 491 810 1756 4833 5479 - 50 177 177 445 1385 6191 7520 - - - - - - - - 46 53 56 61 71 81 93 93
- - - - - - - - 18 65 80 108 166 221 289 701
- - - - - - - - - - - - - - - -
Attachment D-3 E3 EPE Report Model Results AugustPage 21 of 34
Scenario Resource TypeHigh DG Nuclear (Palo Verde)
Nuclear (SMR)Gas - Steam TurbineGas - Combined CycleGas - Combustion TurbineBiomassGeothermalWindSolarBattery StorageImportsDemand ResponseHydrogenBTM SolarLoadExcess Generation
High DSM Nuclear (Palo Verde)Nuclear (SMR)Gas - Steam TurbineGas - Combined CycleGas - Combustion TurbineBiomassGeothermalWindSolarBattery StorageImportsDemand ResponseHydrogenBTM SolarLoadExcess Generation
Low Load Nuclear (Palo Verde)Nuclear (SMR)Gas - Steam TurbineGas - Combined CycleGas - Combustion TurbineBiomassGeothermalWindSolarBattery StorageImportsDemand ResponseHydrogenBTM SolarLoadExcess Generation
2021 2024 2025 2027 2031 2035 2040 2045Cumulative Capacity Additions (MW)
- - - - - - - - - - - - - - - - - - - - - - - - - - - - - - - - - 228 228 228 228 420 586 788 - - - - - - - - - - - - - - - - - - 96 96 96 96 96 203 - 270 396 396 569 965 1089 1280 - 50 176 176 479 1041 1166 1313 - - - - - - - - 46 53 56 61 71 81 93 93
- - - - - - - - 42 169 210 293 455 614 809 1032
- - - - - - - - - - - - - - - - - - - - - - - - - - - - - - - - - - - - - - - - - - - - - - - - - 228 228 228 228 338 502 618 - - - - - - - - - - - - - - - - - - - - - - - 128 - 270 404 404 523 1104 1194 1648 - 50 184 184 406 1001 1091 1263 - - - - - - - - 49 66 71 82 100 101 103 103
- - - - - - - - 18 65 80 108 166 221 289 368
- - - - - - - - - - - - - - - - - - - - - - - - - - - - - - - - - - - - - - - - - - - - - - - - - 228 228 228 228 284 456 579 - - - - - - - - - - - - - - - - - - - - - - - 141 - 270 406 406 513 1140 1243 1739 - 50 186 186 355 1019 1121 1312 - - - - - - - - 46 53 56 61 71 81 93 93
- - - - - - - - 18 65 80 108 166 221 289 368
- - - - - - - - - - - - - - - -
Attachment D-3 E3 EPE Report Model Results AugustPage 22 of 34
Scenario Resource TypeHigh Load Nuclear (Palo Verde)
Nuclear (SMR)Gas - Steam TurbineGas - Combined CycleGas - Combustion TurbineBiomassGeothermalWindSolarBattery StorageImportsDemand ResponseHydrogenBTM SolarLoadExcess Generation
No Lifetime Extensions Nuclear (Palo Verde)Nuclear (SMR)Gas - Steam TurbineGas - Combined CycleGas - Combustion TurbineBiomassGeothermalWindSolarBattery StorageImportsDemand ResponseHydrogenBTM SolarLoadExcess Generation
No New Gas Nuclear (Palo Verde)Nuclear (SMR)Gas - Steam TurbineGas - Combined CycleGas - Combustion TurbineBiomassGeothermalWindSolarBattery StorageImportsDemand ResponseHydrogenBTM SolarLoadExcess Generation
2021 2024 2025 2027 2031 2035 2040 2045Cumulative Capacity Additions (MW)
- - - - - - - - - - - - - - - - - - - - - - - - - - - - - - - - - 228 228 228 228 603 807 971 - - - - - - - - - - - - - - - - - - 119 119 119 119 119 260 - 270 547 547 925 1259 1359 1905 - 50 235 327 708 1042 1142 1342 - - - - - - - - 46 53 56 61 71 81 93 93
- - - - - - - - 18 65 80 108 166 221 289 368
- - - - - - - - - - - - - - - - - - - - - - - - - - - - - - - - - - - - - - - - - - - - - - - - - 228 228 326 326 429 618 776 - - - - - - - - - - - - - - - - - - 109 109 109 109 109 197 - 270 652 652 912 1184 1284 1823 - 50 183 432 756 1027 1128 1327 - - - - - - - - 46 53 56 61 71 81 93 93
- - - - - - - - 18 65 80 108 166 221 289 368
- - - - - - - - - - - - - - - - - - - - - - - - - - - - - - - - - - - - - - - - - - - - - - - - - 228 228 228 228 228 228 228 - - - - - - - - - - - - - - - - - - 120 120 120 120 120 132 - 270 491 491 703 1831 2562 3684 - 50 177 177 483 1585 2342 3250 - - - - - - - - 46 53 56 61 71 81 93 93
- - - - - - - - 18 65 80 108 166 221 289 368
- - - - - - - - - - - - - - - -
Attachment D-3 E3 EPE Report Model Results AugustPage 23 of 34
Scenario Resource TypeLow Carbon Price Nuclear (Palo Verde)
Nuclear (SMR)Gas - Steam TurbineGas - Combined CycleGas - Combustion TurbineBiomassGeothermalWindSolarBattery StorageImportsDemand ResponseHydrogenBTM SolarLoadExcess Generation
Mid Carbon Price Nuclear (Palo Verde)Nuclear (SMR)Gas - Steam TurbineGas - Combined CycleGas - Combustion TurbineBiomassGeothermalWindSolarBattery StorageImportsDemand ResponseHydrogenBTM SolarLoadExcess Generation
High Carbon Price Nuclear (Palo Verde)Nuclear (SMR)Gas - Steam TurbineGas - Combined CycleGas - Combustion TurbineBiomassGeothermalWindSolarBattery StorageImportsDemand ResponseHydrogenBTM SolarLoadExcess Generation
2021 2024 2025 2027 2031 2035 2040 2045Cumulative Capacity Additions (MW)
- - - - - - - - - - - - - - - - - - - - - - - - - - - - - - - - - 228 228 228 228 400 587 724 - - - - - - - - - - - - - - - - - - 163 163 163 163 163 269 - 270 458 458 690 1264 1365 2000 - 50 176 176 470 1044 1145 1364 - - - - - - - - 46 53 56 61 71 81 93 93
- - - - - - - - 18 65 80 108 166 221 289 368
- - - - - - - - - - - - - - - - - - - - - - - - - - - - - - - - - - - - - - - - - - - - - - - - - 228 228 228 228 384 566 705 - - - - - - - - - - - - - - - - - - 238 238 238 238 238 300 - 270 518 518 676 1265 1382 2070 - 50 176 176 456 1045 1149 1384 - - - - - - - - 46 53 56 61 71 81 93 93
- - - - - - - - 18 65 80 108 166 221 289 368
- - - - - - - - - - - - - - - - - - - - - - - - - - - - - - - - - - - - - - - - - - - - - - - - - 228 228 228 228 377 504 504 - - - - - - - - - - - - - - - - - - 300 300 300 300 300 301 - 270 742 742 771 1265 1648 2798 - 50 176 176 445 1045 1206 2050 - - - - - - - - 46 53 56 61 71 81 93 93
- - - - - - - - 18 65 80 108 166 221 289 368
- - - - - - - - - - - - - - - -
Attachment D-3 E3 EPE Report Model Results AugustPage 24 of 34
Scenario Resource TypeHigh Gas Price Nuclear (Palo Verde)
Nuclear (SMR)Gas - Steam TurbineGas - Combined CycleGas - Combustion TurbineBiomassGeothermalWindSolarBattery StorageImportsDemand ResponseHydrogenBTM SolarLoadExcess Generation
Low Renewable and Storage Costs Nuclear (Palo Verde)Nuclear (SMR)Gas - Steam TurbineGas - Combined CycleGas - Combustion TurbineBiomassGeothermalWindSolarBattery StorageImportsDemand ResponseHydrogenBTM SolarLoadExcess Generation
2021 2024 2025 2027 2031 2035 2040 2045Cumulative Capacity Additions (MW)
- - - - - - - - - - - - - - - - - - - - - - - - - - - - - - - - - 228 228 228 228 408 596 730 - - - - - - - - - - - - - - - - - - 128 128 128 128 128 264 - 270 484 484 701 1264 1365 1972 - 50 177 177 481 1044 1145 1359 - - - - - - - - 46 53 56 61 71 81 93 93
- - - - - - - - 18 65 80 108 166 221 289 368
- - - - - - - - - - - - - - - - - - - - - - - - - - - - - - - - - - - - - - - - - - - - - - - - - 228 228 228 228 407 594 706 - - - - - - - - - - - - - - - - - - 160 160 160 160 160 300 - 270 410 410 691 1232 1333 2067 - 50 190 190 471 1037 1138 1385 - - - - - - - - 46 53 56 61 71 81 93 93
- - - - - - - - 18 65 80 108 166 221 289 368
- - - - - - - - - - - - - - - -
Attachment D-3 E3 EPE Report Model Results AugustPage 25 of 34
Scenario Resource TypeLeast-Cost (Reference Case) Nuclear (Palo Verde)
Nuclear (SMR)Gas - Steam TurbineGas - Combined CycleGas - Combustion TurbineBiomassGeothermalWindSolarBattery StorageImportsDemand ResponseHydrogenBTM SolarLoadExcess Generation
Least-Cost Case + REA Resources Nuclear (Palo Verde)Nuclear (SMR)Gas - Steam TurbineGas - Combined CycleGas - Combustion TurbineBiomassGeothermalWindSolarBattery StorageImportsDemand ResponseHydrogenBTM SolarLoadExcess Generation
Separate System Planning Nuclear (Palo Verde)Nuclear (SMR)Gas - Steam TurbineGas - Combined CycleGas - Combustion TurbineBiomassGeothermalWindSolarBattery StorageImportsDemand ResponseHydrogenBTM SolarLoadExcess Generation
2021 2024 2025 2027 2031 2035 2040 2045- - - - - - - - - - - - - - - - - (119) (119) (119) (192) (426) (426) (426) - - - - - (227) (227) (227) - - - - (63) (63) (63) (63) - - - - - - - - - - - - - - - - - - - - - - - - - - - - - (70) (97) (377) - - - - - - - (50) - - - - - - - - - - - - - - - - - - - - - - - - - - - - - - - - - - - - - - - - - - - - - - - - - - - - - - - - - - - - - - - - - (119) (119) (119) (192) (426) (426) (426) - - - - - (227) (227) (227) - - - - (63) (63) (63) (63) - - - - - - - - - - - - - - - - - - - - - - - - - - - - - (70) (97) (377) - - - - - - - (50) - - - - - - - - - - - - - - - - - - - - - - - - - - - - - - - - - - - - - - - - - - - - - - - - - - - - - - - - - - - - - - - - - (119) (119) (119) (192) (426) (426) (426) - - - - - (227) (227) (227) - - - - (63) (63) (63) (63) - - - - - - - - - - - - - - - - - - - - - - - - - - - - - (70) (97) (377) - - - - - - - (50) - - - - - - - - - - - - - - - - - - - - - - - - - - - - - - - - - - - - - - - - - - - - - - - -
Cumulative Capacity Retirements (MW)
Attachment D-3 E3 EPE Report Model Results AugustPage 26 of 34
Scenario Resource TypeSeparate System Planning (w H2) Nuclear (Palo Verde)
Nuclear (SMR)Gas - Steam TurbineGas - Combined CycleGas - Combustion TurbineBiomassGeothermalWindSolarBattery StorageImportsDemand ResponseHydrogenBTM SolarLoadExcess Generation
80 Clean by 2035 Nuclear (Palo Verde)Nuclear (SMR)Gas - Steam TurbineGas - Combined CycleGas - Combustion TurbineBiomassGeothermalWindSolarBattery StorageImportsDemand ResponseHydrogenBTM SolarLoadExcess Generation
20 CO2 Red by 2040 Nuclear (Palo Verde)Nuclear (SMR)Gas - Steam TurbineGas - Combined CycleGas - Combustion TurbineBiomassGeothermalWindSolarBattery StorageImportsDemand ResponseHydrogenBTM SolarLoadExcess Generation
2021 2024 2025 2027 2031 2035 2040 2045Cumulative Capacity Retirements (MW)
- - - - - - - - - - - - - - - - - (119) (119) (119) (192) (426) (426) (426) - - - - - (227) (227) (227) - - - - (63) (63) (63) (63) - - - - - - - - - - - - - - - - - - - - - - - - - - - - - (70) (97) (377) - - - - - - - (50) - - - - - - - - - - - - - - - - - - - - - - - - - - - - - - - - - - - - - - - - - - - - - - - - - - - - - - - - - - - - - - - - - (119) (119) (119) (192) (426) (426) (426) - - - - - (227) (227) (227) - - - - (63) (63) (63) (63) - - - - - - - - - - - - - - - - - - - - - - - - - - - - - (70) (97) (377) - - - - - - - (50) - - - - - - - - - - - - - - - - - - - - - - - - - - - - - - - - - - - - - - - - - - - - - - - - - - - - - - - - - - - - - - - - - (119) (119) (119) (192) (426) (426) (426) - - - - - (227) (227) (227) - - - - (63) (63) (63) (63) - - - - - - - - - - - - - - - - - - - - - - - - - - - - - (70) (97) (377) - - - - - - - (50) - - - - - - - - - - - - - - - - - - - - - - - - - - - - - - - - - - - - - - - - - - - - - - - -
Attachment D-3 E3 EPE Report Model Results AugustPage 27 of 34
Scenario Resource Type40 CO2 Red by 2040 Nuclear (Palo Verde)
Nuclear (SMR)Gas - Steam TurbineGas - Combined CycleGas - Combustion TurbineBiomassGeothermalWindSolarBattery StorageImportsDemand ResponseHydrogenBTM SolarLoadExcess Generation
60 CO2 Red by 2040 Nuclear (Palo Verde)Nuclear (SMR)Gas - Steam TurbineGas - Combined CycleGas - Combustion TurbineBiomassGeothermalWindSolarBattery StorageImportsDemand ResponseHydrogenBTM SolarLoadExcess Generation
80 CO2 Red by 2040 Nuclear (Palo Verde)Nuclear (SMR)Gas - Steam TurbineGas - Combined CycleGas - Combustion TurbineBiomassGeothermalWindSolarBattery StorageImportsDemand ResponseHydrogenBTM SolarLoadExcess Generation
2021 2024 2025 2027 2031 2035 2040 2045Cumulative Capacity Retirements (MW)
- - - - - - - - - - - - - - - - - (119) (119) (119) (192) (426) (426) (426) - - - - - (227) (227) (227) - - - - (63) (63) (63) (63) - - - - - - - -- - - - - - - -- - - - - - - -- - - - - (70) (97) (377) - - - - - - - (50) - - - - - - - -- - - - - - - -- - - - - - - -- - - - - - - -- - - - - - - -- - - - - - - -- - - - - - - -- - - - - - - -- (119) (119) (119) (192) (426) (426) (426) - - - - - (227) (227) (227) - - - - (63) (63) (63) (63) - - - - - - - -- - - - - - - -- - - - - - - -- - - - - (70) (97) (377) - - - - - - - (50) - - - - - - - -- - - - - - - -- - - - - - - -- - - - - - - -- - - - - - - -- - - - - - - -- - - - - - - -- - - - - - - -- (119) (119) (119) (192) (426) (426) (426) - - - - - (227) (227) (227) - - - - (63) (63) (63) (63) - - - - - - - -- - - - - - - -- - - - - - - -- - - - - (70) (97) (377) - - - - - - - (50) - - - - - - - -- - - - - - - -- - - - - - - -- - - - - - - -- - - - - - - -- - - - - - - -
Attachment D-3 E3 EPE Report Model Results AugustPage 28 of 34
Scenario Resource Type90 CO2 Red by 2040 Nuclear (Palo Verde)
Nuclear (SMR)Gas - Steam TurbineGas - Combined CycleGas - Combustion TurbineBiomassGeothermalWindSolarBattery StorageImportsDemand ResponseHydrogenBTM SolarLoadExcess Generation
100 CO2 Red by 2040 (w H2) Nuclear (Palo Verde)Nuclear (SMR)Gas - Steam TurbineGas - Combined CycleGas - Combustion TurbineBiomassGeothermalWindSolarBattery StorageImportsDemand ResponseHydrogenBTM SolarLoadExcess Generation
100 CO2 Red by 2040 Nuclear (Palo Verde)Nuclear (SMR)Gas - Steam TurbineGas - Combined CycleGas - Combustion TurbineBiomassGeothermalWindSolarBattery StorageImportsDemand ResponseHydrogenBTM SolarLoadExcess Generation
2021 2024 2025 2027 2031 2035 2040 2045Cumulative Capacity Retirements (MW)
- - - - - - - - - - - - - - - - - (119) (119) (119) (192) (426) (426) (426) - - - - - (227) (227) (227) - - - - (63) (63) (63) (63) - - - - - - - - - - - - - - - - - - - - - - - - - - - - - (70) (97) (377) - - - - - - - (50) - - - - - - - - - - - - - - - - - - - - - - - - - - - - - - - - - - - - - - - - - - - - - - - - - - - - - - - - - - - - - - - - - (119) (119) (119) (192) (426) (426) (426) - - - - - (227) (227) (227) - - - - (63) (63) (63) (63) - - - - - - - - - - - - - - - - - - - - - - - - - - - - - (70) (97) (377) - - - - - - - (50) - - - - - - - - - - - - - - - - - - - - - - - - - - - - - - - - - - - - - - - - - - - - - - - - - - - - - - - - - - - - - - - - - (119) (119) (119) (192) (426) (426) (426) - - - - - (227) (227) (227) - - - - (63) (63) (63) (63) - - - - - - - - - - - - - - - - - - - - - - - - - - - - - (70) (97) (377) - - - - - - - (50) - - - - - - - - - - - - - - - - - - - - - - - - - - - - - - - - - - - - - - - - - - - - - - - -
Attachment D-3 E3 EPE Report Model Results AugustPage 29 of 34
Scenario Resource TypeHigh DG Nuclear (Palo Verde)
Nuclear (SMR)Gas - Steam TurbineGas - Combined CycleGas - Combustion TurbineBiomassGeothermalWindSolarBattery StorageImportsDemand ResponseHydrogenBTM SolarLoadExcess Generation
High DSM Nuclear (Palo Verde)Nuclear (SMR)Gas - Steam TurbineGas - Combined CycleGas - Combustion TurbineBiomassGeothermalWindSolarBattery StorageImportsDemand ResponseHydrogenBTM SolarLoadExcess Generation
Low Load Nuclear (Palo Verde)Nuclear (SMR)Gas - Steam TurbineGas - Combined CycleGas - Combustion TurbineBiomassGeothermalWindSolarBattery StorageImportsDemand ResponseHydrogenBTM SolarLoadExcess Generation
2021 2024 2025 2027 2031 2035 2040 2045Cumulative Capacity Retirements (MW)
- - - - - - - - - - - - - - - - - (119) (119) (119) (192) (426) (426) (426) - - - - - (227) (227) (227) - - - - (63) (63) (63) (63) - - - - - - - - - - - - - - - - - - - - - - - - - - - - - (70) (97) (377) - - - - - - - (50) - - - - - - - - - - - - - - - - - - - - - - - - - - - - - - - - - - - - - - - - - - - - - - - - - - - - - - - - - - - - - - - - - (119) (119) (119) (192) (426) (426) (426) - - - - - (227) (227) (227) - - - - (63) (63) (63) (63) - - - - - - - - - - - - - - - - - - - - - - - - - - - - - (70) (97) (377) - - - - - - - (50) - - - - - - - - - - - - - - - - - - - - - - - - - - - - - - - - - - - - - - - - - - - - - - - - - - - - - - - - - - - - - - - - - (119) (119) (119) (192) (426) (426) (426) - - - - - (227) (227) (227) - - - - (63) (63) (63) (63) - - - - - - - - - - - - - - - - - - - - - - - - - - - - - (70) (97) (377) - - - - - - - (50) - - - - - - - - - - - - - - - - - - - - - - - - - - - - - - - - - - - - - - - - - - - - - - - -
Attachment D-3 E3 EPE Report Model Results AugustPage 30 of 34
Scenario Resource TypeHigh Load Nuclear (Palo Verde)
Nuclear (SMR)Gas - Steam TurbineGas - Combined CycleGas - Combustion TurbineBiomassGeothermalWindSolarBattery StorageImportsDemand ResponseHydrogenBTM SolarLoadExcess Generation
No Lifetime Extensions Nuclear (Palo Verde)Nuclear (SMR)Gas - Steam TurbineGas - Combined CycleGas - Combustion TurbineBiomassGeothermalWindSolarBattery StorageImportsDemand ResponseHydrogenBTM SolarLoadExcess Generation
No New Gas Nuclear (Palo Verde)Nuclear (SMR)Gas - Steam TurbineGas - Combined CycleGas - Combustion TurbineBiomassGeothermalWindSolarBattery StorageImportsDemand ResponseHydrogenBTM SolarLoadExcess Generation
2021 2024 2025 2027 2031 2035 2040 2045Cumulative Capacity Retirements (MW)
- - - - - - - - - - - - - - - - - (119) (119) (119) (192) (426) (426) (426) - - - - - (227) (227) (227) - - - - (63) (63) (63) (63) - - - - - - - - - - - - - - - - - - - - - - - - - - - - - (70) (97) (377) - - - - - - - (50) - - - - - - - - - - - - - - - - - - - - - - - - - - - - - - - - - - - - - - - - - - - - - - - - - - - - - - - - - - - - - - - - - (192) (192) (282) (282) (426) (426) (426) - - - (227) (227) (227) (227) (227) - - - - (63) (63) (63) (63) - - - - - - - - - - - - - - - - - - - - - - - - - - - - - (70) (97) (377) - - - - - - - (50) - - - - - - - - - - - - - - - - - - - - - - - - - - - - - - - - - - - - - - - - - - - - - - - - - - - - - - - - - - - - - - - - - (119) (119) (119) (192) (426) (426) (426) - - - - - (227) (227) (227) - - - - (63) (63) (63) (63) - - - - - - - - - - - - - - - - - - - - - - - - - - - - - (70) (97) (377) - - - - - - - (50) - - - - - - - - - - - - - - - - - - - - - - - - - - - - - - - - - - - - - - - - - - - - - - - -
Attachment D-3 E3 EPE Report Model Results AugustPage 31 of 34
Scenario Resource TypeLow Carbon Price Nuclear (Palo Verde)
Nuclear (SMR)Gas - Steam TurbineGas - Combined CycleGas - Combustion TurbineBiomassGeothermalWindSolarBattery StorageImportsDemand ResponseHydrogenBTM SolarLoadExcess Generation
Mid Carbon Price Nuclear (Palo Verde)Nuclear (SMR)Gas - Steam TurbineGas - Combined CycleGas - Combustion TurbineBiomassGeothermalWindSolarBattery StorageImportsDemand ResponseHydrogenBTM SolarLoadExcess Generation
High Carbon Price Nuclear (Palo Verde)Nuclear (SMR)Gas - Steam TurbineGas - Combined CycleGas - Combustion TurbineBiomassGeothermalWindSolarBattery StorageImportsDemand ResponseHydrogenBTM SolarLoadExcess Generation
2021 2024 2025 2027 2031 2035 2040 2045Cumulative Capacity Retirements (MW)
- - - - - - - - - - - - - - - - - (119) (119) (119) (192) (426) (426) (426) - - - - - (227) (227) (227) - - - - (63) (63) (63) (63) - - - - - - - - - - - - - - - - - - - - - - - - - - - - - (70) (97) (377) - - - - - - - (50) - - - - - - - - - - - - - - - - - - - - - - - - - - - - - - - - - - - - - - - - - - - - - - - - - - - - - - - - - - - - - - - - - (119) (119) (119) (192) (426) (426) (426) - - - - - (227) (227) (227) - - - - (63) (63) (63) (63) - - - - - - - - - - - - - - - - - - - - - - - - - - - - - (70) (97) (377) - - - - - - - (50) - - - - - - - - - - - - - - - - - - - - - - - - - - - - - - - - - - - - - - - - - - - - - - - - - - - - - - - - - - - - - - - - - (119) (119) (119) (192) (426) (426) (426) - - - - - (227) (227) (227) - - - - (63) (63) (63) (63) - - - - - - - - - - - - - - - - - - - - - - - - - - - - - (70) (97) (377) - - - - - - - (50) - - - - - - - - - - - - - - - - - - - - - - - - - - - - - - - - - - - - - - - - - - - - - - - -
Attachment D-3 E3 EPE Report Model Results AugustPage 32 of 34
Scenario Resource TypeHigh Gas Price Nuclear (Palo Verde)
Nuclear (SMR)Gas - Steam TurbineGas - Combined CycleGas - Combustion TurbineBiomassGeothermalWindSolarBattery StorageImportsDemand ResponseHydrogenBTM SolarLoadExcess Generation
Low Renewable and Storage Costs Nuclear (Palo Verde)Nuclear (SMR)Gas - Steam TurbineGas - Combined CycleGas - Combustion TurbineBiomassGeothermalWindSolarBattery StorageImportsDemand ResponseHydrogenBTM SolarLoadExcess Generation
2021 2024 2025 2027 2031 2035 2040 2045Cumulative Capacity Retirements (MW)
- - - - - - - - - - - - - - - - - (119) (119) (119) (192) (426) (426) (426) - - - - - (227) (227) (227) - - - - (63) (63) (63) (63) - - - - - - - - - - - - - - - - - - - - - - - - - - - - - (70) (97) (377) - - - - - - - (50) - - - - - - - - - - - - - - - - - - - - - - - - - - - - - - - - - - - - - - - - - - - - - - - - - - - - - - - - - - - - - - - - - (119) (119) (119) (192) (426) (426) (426) - - - - - (227) (227) (227) - - - - (63) (63) (63) (63) - - - - - - - - - - - - - - - - - - - - - - - - - - - - - (70) (97) (377) - - - - - - - (50) - - - - - - - - - - - - - - - - - - - - - - - - - - - - - - - - - - - - - - - - - - - - - - - -
Attachment D-3 E3 EPE Report Model Results AugustPage 33 of 34
Scenario 2021 2024 2025 2027 2031 2035 2040 2045Least-Cost (Reference Case) 246$ 233$ 245$ 262$ 284$ 340$ 402$ 498$ Least-Cost Case + REA Resources 246$ 233$ 247$ 262$ 285$ 343$ 406$ 506$ Separate System Planning 247$ 233$ 250$ 268$ 293$ 369$ 473$ 571$ Separate System Planning (w H2) 247$ 233$ 251$ 268$ 293$ 348$ 438$ 536$ 80 Clean by 2035 246$ 233$ 245$ 262$ 284$ 342$ 402$ 498$ 20 CO2 Red by 2040 246$ 233$ 245$ 262$ 284$ 342$ 402$ 499$ 40 CO2 Red by 2040 246$ 233$ 245$ 262$ 284$ 342$ 405$ 512$ 60 CO2 Red by 2040 246$ 233$ 246$ 262$ 284$ 341$ 419$ 531$ 80 CO2 Red by 2040 246$ 233$ 247$ 262$ 284$ 347$ 463$ 577$ 90 CO2 Red by 2040 246$ 233$ 247$ 263$ 287$ 357$ 500$ 615$ 100 CO2 Red by 2040 (w H2) 246$ 233$ 249$ 264$ 289$ 367$ 551$ 663$ 100 CO2 Red by 2040 246$ 233$ 245$ 262$ 289$ 367$ 1113$ 1282$ High DG 245$ 231$ 241$ 256$ 277$ 325$ 382$ 470$ High DSM 245$ 230$ 239$ 254$ 271$ 313$ 367$ 450$ Low Load 239$ 227$ 236$ 252$ 269$ 312$ 371$ 460$ High Load 253$ 239$ 255$ 276$ 307$ 374$ 441$ 540$ No Lifetime Extensions 246$ 228$ 243$ 266$ 298$ 344$ 406$ 502$ No New Gas 246$ 233$ 245$ 262$ 284$ 367$ 453$ 570$ Low Carbon Price 291$ 277$ 284$ 301$ 323$ 379$ 444$ 543$ Mid Carbon Price 358$ 341$ 341$ 358$ 381$ 436$ 505$ 611$ High Carbon Price 469$ 449$ 432$ 451$ 475$ 529$ 603$ 718$ High Gas Price 257$ 242$ 251$ 268$ 291$ 347$ 412$ 509$ Low Renewable and Storage Costs 246$ 233$ 240$ 256$ 274$ 321$ 379$ 463$
Annual Revenue Requirement ($MM)
Attachment D-3 E3 EPE Report Model Results AugustPage 34 of 34
Scenario Clean Energy Type 2021 2024 2025 2027 2031 2035 2040 2045Least-Cost (Reference Case) Renewable 4 12 21 21 27 34 36 39
Zero Carbon 62 68 77 75 77 81 77 75Least-Cost Case + REA Resources Renewable 4 12 24 24 30 39 43 49
Zero Carbon 62 68 79 78 80 85 84 84Separate System Planning Renewable 4 12 20 21 26 38 42 46
Zero Carbon 62 68 76 75 76 84 83 82Separate System Planning (w H2) Renewable 4 12 21 21 27 34 41 45
Zero Carbon 62 68 76 75 77 81 82 8180 Clean by 2035 Renewable 4 12 21 22 27 34 39 45
Zero Carbon 62 68 77 76 77 81 80 8020 CO2 Red by 2040 Renewable 4 12 21 22 27 34 37 46
Zero Carbon 62 68 77 76 77 81 78 8140 CO2 Red by 2040 Renewable 4 12 21 22 27 34 43 51
Zero Carbon 62 68 77 76 77 81 84 8660 CO2 Red by 2040 Renewable 4 12 22 22 27 36 48 56
Zero Carbon 62 68 77 76 78 83 89 9180 CO2 Red by 2040 Renewable 4 12 24 24 30 41 54 60
Zero Carbon 62 68 79 78 81 87 94 9590 CO2 Red by 2040 Renewable 4 12 24 24 32 43 56 62
Zero Carbon 62 68 79 78 82 89 97 98100 CO2 Red by 2040 (w H2) Renewable 4 12 25 26 34 45 56 62
Zero Carbon 62 68 81 79 84 92 100 100100 CO2 Red by 2040 Renewable 4 12 22 22 34 45 60 65
Zero Carbon 62 68 77 76 84 92 100 100High DG Renewable 4 13 21 22 27 35 37 39
Zero Carbon 63 70 76 75 77 82 78 74High DSM Renewable 4 12 16 16 20 31 32 37
Zero Carbon 63 69 73 72 73 80 76 75Low Load Renewable 4 12 16 16 19 31 33 38
Zero Carbon 64 70 73 72 72 79 75 75High Load Renewable 4 12 23 24 31 36 36 41
Zero Carbon 61 66 77 76 79 80 76 75No Lifetime Extensions Renewable 4 12 23 26 31 35 36 39
Zero Carbon 62 68 79 80 81 81 77 75No New Gas Renewable 4 12 22 22 27 42 50 57
Zero Carbon 62 68 77 76 77 88 90 92Low Carbon Price Renewable 4 12 23 23 28 37 38 43
Zero Carbon 62 68 78 77 79 83 79 79Mid Carbon Price Renewable 4 12 26 26 31 39 41 45
Zero Carbon 62 68 81 80 81 86 82 81High Carbon Price Renewable 4 12 30 31 34 41 45 54
Zero Carbon 62 68 86 85 84 87 86 89High Gas Price Renewable 4 12 22 22 27 36 37 43
Zero Carbon 62 68 77 76 78 82 78 78Low Renewable and Storage Costs Renewable 4 12 22 22 28 36 38 44
Zero Carbon 62 68 77 76 78 83 79 80
Clean Energy ( of Load)
BEFORE THE NEW MEXICO PUBLIC REGULATION COMMISSION
RULE 1773 NMAC FILING
EL PASO ELECTRIC COMPANY NOTICE OF 2021 INTEGRATED RESOURCE PLAN
2020-2021 PLANNING PROCESS AND PUBLIC ADVISORY PROCESS MEETINGS
DECLARATION OF CURTIS HUTCHESON OF NOTICE TO CUSTOMERS
I Curtis Hutcheson pursuant to Rule 1-011 NMRA state as follows
1 I affirm in writing under penalty of perjury under the laws of the State of New Mexico
that the following statements are true and correct
2 I am over 18 years of age and have personal knowledge of the facts stated herein I am
employed as Supervisor-Regulatory Case Management My business address is 100 N Stanton
Street El Paso Texas 79901
3 My responsibilities include the oversight and preparation of rate and regulatory filings
and compliance with the various regulatory requirements of the jurisdictions in which EPE
operates
4 Pursuant to Rule 17739H(1) NMAC the New Mexico Public Regulation Commission
(ldquoCommissionrdquo) requires EPE to provide notice of EPErsquos 2021 Integrated Resource Planrsquos
2020-2021 Planning Process and Public Advisory Process Meetings in the utilityrsquos billing
inserts
5 EPE directly mailed the required notice to all existing New Mexico customers in a bill
insert between June 4 2020 and July 2 2020 A copy of the bill insert is attached as Exhibit A to
Attachment E-1 Proof of Notice
2
this Affirmation
6 EPE also published the notice in the Las Cruces Sun News on May 31 2020 The affidavit
and tear sheet are attached as Exhibit B to this Affirmation
7 EPE provided notice on June 4 2020 30 days prior to the first scheduled meeting on
July 10 2020 to the commission interveners in its most recent general rate case and
participants in its most recent renewable energy energy efficiency and IRP proceedings The
email of the notice and certificate of service is attached as Exhibit C to this Affirmation
I submit this Declaration based upon my personal knowledge and upon information
and belief in support of EPErsquos 2021 Integrated Resource Planrsquos 2020-2021 Planning Process
and Public Advisory Process Meetings
FURTHER DECLARANT SAYETH NAUGHT
I declare under penalty of perjury that the foregoing is true and correct
Executed on May 13 2021
__s Curtis Hutcheson________
CURTIS HUTCHESON
Attachment E-1 Proof of Notice
BEFORE THE NEW MEXICO PUBLIC REGULATION COMMISSION
RULE 1773 NMAC FILING
EL PASO ELECTRIC COMPANY
NOTICE OF 2021 INTEGRATED RESOURCE PLAN
2020-2021 PUBLIC ADVISORY PROCESS MEETINGS
Notice is hereby given that
El Paso Electric Company (EPE) invites members of the public to participate in the Integrated Resource
Plan (ldquoIRPrdquo) public advisory process through a series of public meetings With public participation EPE
will develop its IRP pursuant to the New Mexico Efficient Use of Energy Act and the New Mexico Public
Regulation Commissions (Commission) IRP Rule 1773 NMAC EPEs IRP is developed to identify cost-
effective demand-side and supply-side electricity resources to serve EPEs customers over the next 20-
year planning period
The IRP will be submitted to the Commission no later than July 2021 Public participation is an important
component of the development and implementation of EPEs integrated resource planning in New
Mexico EPE encourages interested members of the public to attend these public meetings to provide
public input and commentary whether as a residential or business customer or as a representative of a
trade non-profit neighborhood shareholder civic or other group
Given the currently effective limitations on public gatherings in New Mexico and Texas the first scheduled
meeting will be held electronically and by phone conference on July 10 2020 at 200 pm MDT The IRP
process will be explained and additional meeting dates and locations will be set at that time Prior to
each meeting the presentation for that meeting will be posted on EPEs website wwwepeletriccom If
you are interested in attending the meeting or otherwise participating in the process please contact EPE
by emailing NMIRPepelectriccom or calling at (915) 543- 4354
Exhibit A Page 1 of 1Attachment E-1 Proof of Notice
Exhibit B Page 1 of 2Attachment E-1 Proof of Notice
2H SUNDAY MAY 31 2020 LAS CRUCES SUN-NEWS
4B-501 Notice to creditors by publi-cation and notice to creditors bywritten notice (mailing or other de-livery)[For use with Rules 1B-304 1B-306and 1B-401 NMRA]
STATE OF NEW MEXICOIN THE PROBATE COURTDONA ANA COUNTY
No 20-0074
IN THE MATTER OF THEESTATE OF Juliet S WilliamsDECEASED
NOTICE TO CREDITORSNOTICE IS HEREBY GIVEN thatthe undersigned has been appointedpersonal representative of the es-tate of the decedent All personshaving claims against the estate ofthe decedent are required to presenttheir claims within four (4) monthsafter the date of the first publica-tion of any published notice to cred-itors or sixty (60) days after thedate of mailing or other delivery ofthis notice whichever is later orthe claims will be forever barredClaims must be presented either tothe undersigned personal represen-tative at the address below or filedwith the Probate Court of DonaAna 845 N Motel Blvd 1-201 LasCruces NM 88007Dated May 2020s Edwin James Williams Jrsignature of representative
Edwin James Williams JrPrinted Name
17093 White Pine RdStreet address
Beaver dam VA 23015City state and ZIP code
4213196 Sun-News May 31 andJun 7 14 2020
To advertise visit
SELL ITBUY IT
FIND ITcars
garage sales
tickets
jobs
antiques
motorcycles
computers
boats
sports equipment
pets
instruments
jewelry
furniture
tablets
auctions
yard sales
collectibles
appliances
cameras
coins
Place yourclassified ad today
FINDING WORK SHOULDNrsquoT BE WORK
Your job search ends here
Get started by visitingjobsusatodaycom
HVAC TECHNICIAN II
ACO amp CODES-LABORER
ANIMAL CONTROL OFFICER
DASO CADET-UNCERTIFIED
ROADS-EQUIPMENT OPERATOR
ELECTIONS SPECIALIST-TEMPORARY
ROADS-HEAVY EQUIPMENT OPERATOR
DETENTION CENTER OFFICER TRAINEE
DOCUMENT TECHNICIAN-DC DISPOSITIONS
ENVIRONMENTAL CODES ENFORCEMENT OFFICER
WATERWASTEWATER OPERATOR III
Job Application amp Job Announcements available on our Website atwwwdonaanacountyorg
Computer kiosks are available in the Human Resources Department
DONtildeA ANA COUNTYJOB VACANCIES
CAMINO REALREGIONAL UTILITY AUTHORITY
JOB VACANCIES
Demolition Build RoadsLeveling
Business amp Service Directoryto advertise email ServiceDirectorylcsun-newscom
or call 8007645620
Exhibit B Page 2 of 2Attachment E-1 Proof of Notice
From Griego PatriciaTo Burns Nancy Griego Patricia Jeffrey Wechsler Diana Luna Kari Olson Lorraine Talley John F McIntyre
Schichtl James Hutcheson Marvin C Novela Mariah M Parsons Judith M Pleasant Linda G Perea Araceli Gastevenslawgmailcom jvega-brownlas-crucesorg joprovenciolas-crucesorg llarocquelas-crucesorg marcydlas-crucesorg davilalas-crucesorg JAGlas-crucesorg hconnellylas-crucesorg ddollahonlas-crucesorg tomfdonaanacountyorg rockybacchusgmailcomecomaxaclifeisgood2com lellisnmsuedu ghauboldadnmsuedu jdrakemodrallcomnwinterstelznerlawcom kherrmannstelznerlawcom rgallegosstelznerlawcom Nobleccaegmailcomstephaniedzur-Lawcom Lundin Robert gelliotnmaggov Cholla Khoury lawofficejasonmarkscomJsmithwatsonlawlcgmailcom mayortrujillocityofanthonynmorg mlsouleshotmailcombthroneattynewmexicocom Goodin Nelson fredkdonaanacountyorg Rickvotesolarorgtasolomon6gmailcom Dahlharrishotmailcom Jdittmerutilitechnet Jaherzsawvelcomakharrigersawvelcom Borman Bradford PRC Reynolds John PRC Chavez Milo PRC Sidler Jack PRCjohnbogatkostatenmus marctuplerstatenmus gilberttfuentesstatenmus Sisneros Anthony R PRCLeyba-Tercero Elisha PRC Fisk Russell PRC Amer Judith PRC Smith Michael C PRC Martinez-Rael PeggyPRC elizabethramirezstatenmus carolynglickstatenmus Hurst Elizabeth PRCchristopherryanstatenmus philipbsimpsoncomcastnet Kylejsmith124civmailmilrobertagantoncivmailmil hgellerswenergyorg jbrantswenergyorg ctcolumbiaaolcomltougascleanenergyregresearchcom dgegaxnmsuedu Ramonablabersierracluborgsricdonearthlinknet smichelwesternresourcesorg Beadles Cydney PRCpatoconnellwesternresourcesorg aprilelliottwesternresourcesorg dneidcoxnet schaefnogmailcomdavidvw77com bslocumdwmrlawcom jmcnallydwmrlawcom mbarkerdwmrlawcommzidovskymontandcom
Cc EPE_Reg_MgmtSubject Rule 1773 NMAC Filing EPEs Notice of 2020-2021 Public Advisory Process Meetings for 2021 IRP amp COSDate Thursday June 4 2020 105041 AMAttachments 2021 IRP Noticepdf
COS Notice of IRP Processpdf
Good morning Attached is El Paso Electric Companyrsquos Notice of its 2020-2021 Public AdvisoryProcess Meetings for the 2021 Integrated Resource Plan and Certificate of Service that was filed byemail with NMPRC Records today
Patricia ldquoTrishrdquo Griego| El Paso Electric CompanyLegal Assistant300 Galisteo St Suite 206Santa Fe New Mexico 87501T (505) 982-4713 | C (505) 470-4048Patriciagriegoepelectriccom
CONFIDENTIALITY NOTICE The information contained in this electronic mailtransmission is CONFIDENTIAL and it may qualify as material protected pursuantto the Texas Uniform Trade Secrets Act the New Mexico Uniform Trade SecretsAct or other laws If you are not the intended recipient please destroydelete thismessage and any attachments and immediately notify the sender
Exhibit C Page 1 of 1Attachment E-1 Proof of Notice

Attachment B-1 2021 Forecast
Page 1 of 2
Attachment B-1 2021 Forecast
Page 2 of 2
Atta
chm
ent B
-2
2021
Ene
rgy
Fore
cast
by
Juri
sdic
iton
Page
1 o
f 2
Nativ
e Sy
stem
Ene
rgy
2021
2022
2023
2024
2025
2026
2027
2028
2029
2030
Texa
sRe
side
ntial
269
252
0274
858
7280
156
2284
349
6288
974
5294
484
1301
222
7308
429
1315
986
1324
432
1Co
mmercial amp
Ind
ustrial Sm
all
197
388
8199
542
7200
073
7200
223
7200
400
5200
866
8201
424
1201
995
8202
782
4203
746
3Co
mmercial amp
Ind
ustrial La
rge
97205
097
638
498
000
598
299
598
543
698
739
998
894
699
013
099
099
999
159
3Street L
ighting
41523
42056
42506
42961
43420
43880
44323
44748
45182
45638
OPA
117
458
0119
392
2120
482
1121
593
7122
580
0123
538
3124
374
7124
823
3125
523
2126
259
7
Total Te
xas
685
456
1695
637
6702
963
0708
762
7714
840
7722
017
1730
348
5738
736
0747
909
8758
161
3
New
Mex
ico
Reside
ntial
84538
186
170
686
900
987
582
188
307
989
354
290
602
192
040
493
682
395
364
8Co
mmercial amp
Ind
ustrial Sm
all
52893
553
705
853
927
054
119
454
487
955
041
555
693
956
507
257
338
558
004
7Co
mmercial amp
Ind
ustrial La
rge
75359
74520
73908
73388
72906
72438
71976
71517
71059
70602
Street L
ighting
198
1202
0205
2208
3211
7215
0218
4221
8225
3228
7OPA
38232
138
851
038
920
839
051
639
089
539
178
139
325
039
519
039
770
740
120
6
Total Ne
w Mex
ico
183
397
6186
381
4187
344
7188
300
2189
387
5191
032
6193
037
1195
440
1198
122
7200
779
0
Compa
ny U
se13
815
13940
14065
14192
14319
14448
14578
14709
14842
14975
RGEC
69263
70552
71840
73128
74417
75705
76993
78282
79570
80858
Total Na
tive
System
877
161
6890
468
2898
898
2905
794
9913
101
8922
065
0932
542
7943
475
2955
473
7968
523
7 Attachment B-2 2021 Energy Forecast by Jurisdiction
Page 1 of 2
Atta
chm
ent B
-2
2021
Ene
rgy
Fore
cast
by
Juri
sdic
iton
Page
2 o
f 2
Nativ
e Sy
stem
Ene
rgy
Texa
sRe
side
ntial
Commercial amp
Ind
ustrial Sm
all
Commercial amp
Ind
ustrial La
rge
Street L
ighting
OPA To
tal Te
xas
New
Mex
ico
Reside
ntial
Commercial amp
Ind
ustrial Sm
all
Commercial amp
Ind
ustrial La
rge
Street L
ighting
OPA To
tal Ne
w Mex
ico
Compa
ny U
seRG
EC
Total Na
tive
System
2031
2032
2033
2034
2035
2036
2037
2038
2039
2040
333
498
3342
514
8352
517
0363
602
6375
962
4389
587
8404
605
4421
733
9441
440
3464
854
4204
512
9205
422
5206
458
0207
569
3208
712
3209
803
4210
956
8212
148
1213
518
9215
185
799
194
899
209
599
206
099
186
899
153
899
108
999
053
598
989
198
916
798
837
546
133
46630
47109
47569
48017
48461
48888
49300
49698
50084
126
833
5127
422
3128
043
5128
627
9129
128
0129
588
9130
154
2130
722
8131
363
7132
253
7
768
652
9779
232
0790
935
5803
743
5817
758
3832
935
1849
658
7868
523
9890
209
4916
139
8
96992
298
850
0100
911
0103
341
5106
103
0109
184
3112
739
2116
969
2121
992
0128
248
958
968
059
896
060
908
361
944
462
902
063
948
065
148
866
433
367
751
268
996
470
144
69687
69229
68772
68315
67857
67400
66943
66485
66028
232
3236
0239
7243
5247
3251
1254
9258
6262
3265
940
330
540
627
540
956
641
342
841
744
542
112
442
453
442
783
543
117
443
550
0
203
537
5206
578
2209
938
6213
749
4217
828
3222
281
5227
336
2233
138
8239
771
3247
663
9
15110
15246
15383
15522
15662
15803
15945
16088
16233
16379
82147
83435
84723
86012
87300
88589
89877
91165
92454
93742
981
916
1995
678
410
108
847
10276
463
10458
828
10656
557
10875
771
11123
881
11408
494
11748
158 Attachment B-2 2021 Energy
Forecast by JurisdictionPage 2 of 2
Atta
chm
ent B
-3
2021
Dem
and
Fore
cast
by
Juri
sdic
tion
Page
1 o
f 2
Nativ
e Sy
stem
Dem
and
2021
2022
2023
2024
2025
2026
2027
2028
2029
2030
Texa
sRe
side
ntial
653
667
681
689
703
717
735
751
773
795
Commercial amp
Ind
ustrial Sm
all
479
484
486
485
488
489
491
492
496
499
Commercial amp
Ind
ustrial La
rge
236
237
238
238
240
241
241
241
242
243
Street L
ighting
1010
1010
1111
1111
1111
OPA
285
290
293
295
298
301
303
304
307
309
Total Te
xas
166
2168
8170
8171
8174
0175
9178
2179
9183
0185
8
New
Mex
ico
Reside
ntial
201
205
207
208
211
214
217
220
224
229
Commercial amp
Ind
ustrial Sm
all
126
128
128
129
130
132
133
135
137
139
Commercial amp
Ind
ustrial La
rge
1818
1817
1717
1717
1717
Street L
ighting
00
00
11
11
11
OPA
9192
9393
9394
9494
9596
Total Ne
w Mex
ico
436
443
446
448
452
457
462
466
475
482
Compa
ny U
se3
33
33
44
44
4RG
EC19
2020
2021
2122
2223
23
Total Na
tive
System
212
1215
5217
7219
0221
6224
0226
9229
2233
1236
7 Attachment B-3 2021 Demand Forecast by Jurisdiction
Page 1 of 2
Atta
chm
ent B
-3
2021
Dem
and
Fore
cast
by
Juri
sdic
tion
Page
2 o
f 2
Nativ
e Sy
stem
Dem
and
Texa
sRe
side
ntial
Commercial amp
Ind
ustrial Sm
all
Commercial amp
Ind
ustrial La
rge
Street L
ighting
OPA To
tal Te
xas
New
Mex
ico
Reside
ntial
Commercial amp
Ind
ustrial Sm
all
Commercial amp
Ind
ustrial La
rge
Street L
ighting
OPA To
tal Ne
w Mex
ico
Compa
ny U
seRG
EC
Total Na
tive
System
2031
2032
2033
2034
2035
2036
2037
2038
2039
2040
819
841
871
901
936
973
102
0107
2113
4120
650
250
451
051
552
052
453
253
954
855
824
424
424
524
624
724
725
025
225
425
611
1112
1212
1212
1313
1331
231
331
631
932
232
432
833
233
734
3
188
8191
3195
4199
2203
6207
9214
2220
8228
6237
6
233
237
243
250
257
265
276
288
303
321
142
144
147
150
153
155
159
164
168
173
1717
1717
1716
1616
1717
11
11
11
11
11
9797
9910
010
110
210
410
510
710
9
489
496
506
517
528
540
556
574
595
620
44
44
44
44
44
2324
2425
2525
2627
2728
240
4243
6248
8253
8259
3264
8272
8281
3291
3302
8 Attachment B-3 2021 Demand Forecast by Jurisdiction
Page 2 of 2
Attachment B-4 Losses by Transmission and Distribution
Year Secondary Primary Transmission FERC Losses (MW)2021 130 4 4 0 1382022 133 4 4 0 1412023 135 4 4 0 1442024 137 4 4 0 1452025 139 4 4 0 1482026 141 4 4 0 1502027 144 4 5 0 1532028 146 4 5 0 1552029 149 4 5 0 1592030 152 5 5 0 1622031 155 5 5 0 1652032 157 5 5 0 1672033 160 5 5 0 1712034 163 5 5 0 1742035 166 5 5 0 1772036 169 5 5 0 1802037 173 5 5 0 1842038 176 5 6 0 1872039 179 5 6 0 1912040 182 5 6 0 194
Page 1 of 1
Attachment B-5 Typical Days Tables
Page 1 of 10
Attachment B-5 Typical Days Tables
Page 2 of 10
Attachment B-5 Typical Days Tables
Page 3 of 10
Attachment B-5 Typical Days Tables
Page 4 of 10
Attachment B-5 Typical Days Tables
Page 5 of 10
Attachment B-5 Typical Days Tables
Page 6 of 10
Attachment B-5 Typical Days Tables
Page 7 of 10
Attachment B-5 Typical Days Tables
Page 8 of 10
Attachment B-5 Typical Days Tables
Page 9 of 10
Attachment B-5 Typical Days Tables
Page 10 of 10
Page 1 of 7
Attachment C-1 Transmission Facilities TABLE 1 Existing EPE Transmission Lines 115 kV and Above
EL PASO ELECTRIC COMPANY
Existing 115 kV and Above Internal Lines
RATING LENGTH STATE
From To kV Circuit MVA
Normal MVA
Emerg Miles From To AMRAD EMPIRE 345 1 400 400 12510 TX NM CALIENTE AMRAD 345 1 785 785 567 TX NM CALIENTE PICANTE 345 1 788 788 73 TX TX EMPIRE EDDY 345 1 836 836 05 NM NM HIDALGO GREENLEE 345 1 765 765 600 NM AZ LUNA AFTON 345 1 921 987 573 NM NM LUNA DIABLO 345 1 939 939 849 NM NM LUNA HIDALGO 345 1 659 659 505 NM NM MACHO SPRINGS
LUNA 345 1 1031 1390 249 NM NM
MACHO SPRINGS
SPRINGERVILLE 345 1 728 728 2014 NM AZ
NEWMAN ARROYO 345 1 700 700 303 TX NM NEWMAN AFTON 345 1 924 1028 299 TX NM PICANTE NEWMAN 345 1 786 786 162 TX TX WESTMESA ARROYO 345 1 680 680 2018 NM NM MIMBRES TAP AIRPORT 115 1 123 163 27 NM NM
AMRAD HOLLOMAN 115 1 121 121 225 NM NM ANTHONY ARROYO 115 1 114 114 244 NM NM ANTHONY BORDER STEEL 115 1 165 220 52 NM TX ANTHONY SALOPEK 115 1 165 220 173 NM NM ANTHONY NEWMAN 115 1 165 212 123 NM TX ANTHONY NUWAY 115 1 165 220 66 NM TX ASCARATE TROWBRIDGE 115 1 181 181 05 TX TX ASCARATE COPPER 115 1 185 246 14 TX TX ASCARATE JUAREZ 115 1 185 247 24 TX AUSTIN MARLOW 115 1 227 227 12 TX TX BIGGS BLISS
INDUSTRIAL 115 1 185 246 22 TX TX
BLISS INDUSTRIAL
LIBERTY 115 1 185 246 22 TX TX
BUTTERFIELD FT BLISS 115 1 135 180 19 TX TX CALIENTE DIAMOND HEAD 115 1 185 247 61 TX TX CALIENTE MPS 115 1 69 87 85 TX TX CALIENTE MPS 115 2 268 332 31 TX TX CALIENTE MPS 115 3 268 332 31 TX TX CALIENTE VISTA 115 1 166 221 66 TX TX CHAPARRAL ORO GRANDE 115 1 135 165 354 NM NM COPPER PENDALE 115 1 185 246 51 TX TX
Page 2 of 7
EL PASO ELECTRIC COMPANY Existing 115 kV and Above
Internal Lines
RATING LENGTH STATE
From To kV Circuit MVA
Normal MVA
Emerg Miles From To COYOTE RGC_DELL CITY 115 1 23 23 108 TX TX COYOTE MONTWOOD 115 1 185 246 79 TX NM CROMO RIO GRANDE 115 1 135 180 09 TX TX DIABLO RIO GRANDE 115 1 332 441 29 NM TX DIABLO RIO GRANDE 115 2 332 441 29 NM NM DIABLO JUAREZ 115 1 185 247 23 NM DIAMOND HEAD
LANE 115 1 185 247 28 TX TX
DURAZNO ASCARATE 115 1 185 246 33 TX NM DYER SHEARMAN 115 1 135 180 96 TX TX DYER AUSTIN 115 1 185 246 21 TX TX EXECUTIVE RIO GRANDE 115 1 271 359 29 TX TX FT BLISS AUSTIN 115 1 135 180 18 TX TX GLOBAL REACH
VISTA 115 1 329 329 30 TX TX
HATCH JORNADA 115 1 45 45 334 NM NM JORNADA ARROYO 115 1 79 79 49 NM NM LANE WRANGLER 115 1 165 220 10 TX TX LAS CRUCES ARROYO 115 1 165 220 41 NM NM LAS CRUCES SALOPEK 115 1 165 220 50 NM NM LEO EAST DYER 115 1 185 246 38 TX TX LEO EAST MILAGRO 115 1 185 246 44 TX TX LIBERTY GLOBAL REACH 115 1 185 246 26 TX TX MAR LARGO 115 1 29 29 114 NM NM MARLOW TROWBRIDGE 115 1 181 181 11 TX TX MESA AUSTIN 115 1 165 220 61 TX TX MESA RIO GRANDE 115 1 268 268 23 TX NM MILAGRO NEWMAN 115 1 185 246 63 TX TX MONTWOOD CALIENTE 115 1 185 246 50 TX TX MPS COYOTE 115 1 249 387 31 TX TX MPS MONTWOOD 115 1 249 387 70 TX TX NEWMAN CHAPARRAL 115 1 135 180 29 TX NM NEWMAN BUTTERFIELD 115 1 135 280 167 TX TX NEWMAN SHEARMAN 115 1 135 280 73 TX TX NEWMAN PIPELINE 115 1 185 246 98 TX TX NEWMAN PICANTE 115 1 185 246 136 TX TX NUWAY MONTOYA 115 1 165 220 36 TX TX ORO GRANDE AMRAD 115 1 135 165 123 NM NM ORO GRANDE WHITE SANDS 115 1 75 75 228 NM NM PATRIOT NEWMAN 115 1 135 180 15 TX TX PATRIOT CROMO 115 1 135 180 184 TX TX PELICANO HORIZON 115 1 185 246 67 TX TX
Page 3 of 7
EL PASO ELECTRIC COMPANY Existing 115 kV and Above
Internal Lines
RATING LENGTH STATE
From To kV Circuit MVA
Normal MVA
Emerg Miles From To PELICANO MONTWOOD 115 1 185 246 38 TX TX PENDALE LANE 115 1 185 246 15 TX TX PICANTE GLOBAL REACH 115 1 185 246 60 TX TX PICANTE BIGGS 115 1 185 246 23 TX TX PIPELINE BIGGS 115 1 135 180 136 TX TX RIO GRANDE RIPLEY 115 1 165 220 30 NM TX RIPLEY THORN 115 1 135 180 19 TX TX SALOPEK ARROYO 115 1 135 180 107 NM NM SANTA TERESA MONTOYA 115 1 185 246 74 NM TX SANTA TERESA DIABLO 115 1 169 225 89 NM NM SCOTSDALE VISTA 115 1 135 180 52 TX TX SOL LANE 115 1 135 180 21 TX TX SOL VISTA 115 1 185 246 20 TX TX SPARKS HORIZON 115 1 185 246 38 TX TX SUNSET NORTH DURAZNO 115 1 185 246 46 TX TX SUNSET NORTH EXECUTIVE 115 1 271 359 23 TX TX THORN MONTOYA 115 1 135 180 30 TX TX WRANGLER SPARKS 115 1 185 246 40 TX TX
- Internal refers to lines within EPEs Balancing Area including lines connecting EPE to neighboring utilities however not including line segments partially owned by EPE external to EPEs control area
- Some transmission lines were identified to be capacity limited by smaller jumpers connected at the substations The line ratings reflected in the above table are based on-line jumper upgrade assumptions
- The ratings are generally based on conductor thermal capacities but may be derated due to sag limitations or other factors
- RGC_DC is Rio Grande Electric Cooperative Dell City - Emerg is short for Emergency
Page 4 of 7
TABLE 2 Existing 115 kV EPE Substation Transformers
EL PASO ELECTRIC COMPANY
Existing 115 kV Load amp Step-up Substation Transformers
RATING Normal Emergency State
MVA MVA AIRPORT 115239 336 376 NM AMRAD 115249 85 95 NM
ANTHONY T1 115239 336 376 NM ANTHONY T2 115239 560 627 NM ARROYO T2 115239 336 376 NM ARROYO T4 115239 336 376 NM
ASCARATE T4 11569 112 1288 TX ASCARATE T5 11569 112 1288 TX
AUSTIN T1 115138 500 560 TX AUSTIN T2 115138 560 627 TX
BORDER STEEL 115 T1 115138 392 439 TX
BORDER STEEL 115 T2 115138 392 439 TX BUTTERFIELD T1 115138 300 336 TX BUTTERFIELD T2 115138 300 336 TX
CALIENTE T3 115138 336 376 TX CENTRAL TEMP T1 115138 336 376 TX
CHAPARRAL T1 115138 336 376 NM CHAPARRAL T2 115138 336 376 NM
COPPER T1 115138 300 336 TX COPPER GEN T2 138115 840 941 TX
COX T2 11569 560
644 NM COYOTE T1 115138 300 336 TX CROMO T1 115138 300 336 TX CROMO T2 115138 336 376 TX
DIAMOND HEAD T1 115138 336 376 TX DURAZNO T1 115138 336 376 TX
DYER T3 11569 112 1288 TX EMRLD T1 115138 125 140 NM
EXECUTIVE T1 115138 560 627 TX EXECUTIVE T2 115138 560 627 TX
FT BLISS T1 115138 560 627 TX FT BLISS T2 115132 280 314 TX
GLOBAL REACH T1 115138 336 376 TX GLOBAL REACH T2 115138 560 627 TX
Page 5 of 7
EL PASO ELECTRIC COMPANY
Existing 115 kV Load amp Step-up Substation Transformers
RATING Normal Emergency State
MVA MVA HATCH T1 115249 300 336 NM
HORIZON T1 115138 336 376 TX JORNADA T1 115239 336 376 NM JORNADA T2 115239 560 627 NM
LANE T1 11569 100 115 TX LANE T2 115138 300 336 TX
LAS CRUCES T1 115239 672 753 NM LAS CRUCES T2 115239 672 753 NM
LEO EAST T1 115138 336 376 TX LEO EAST T2 115138 336 376 TX
MAR T1 11542 112 125 NM MESA T1 115138 300 336 TX MESA T2 115138 336 376 TX
MILAGRO T1 115138 336 376 TX MILAGRO T2 115138 336 376 TX MILAGRO T3 115138 336 376 TX MONTOYA T1 115249 336 376 TX MONTOYA T2 115239 560 627 TX MONTOYA T3 115239 560 627 TX
MONTWOOD T1 115239 560 627 TX MONTWOOD T3 115239 560 627 TX
MPS T1 138115 1400 1568 TX MPS T2 138115 1400 1568 TX MPS T3 138115 1400 1568 TX MPS T4 138115 1400 1568 TX
NEWMAN G1(T2) 138115 1254 1405 TX NEWMAN G2 (T6) 138115 1254 1405 TX NEWMAN G3 (T8) 138115 1254 1405 TX
NEWMAN 4G1 (T11) 138115 1250 1400 TX NEWMAN 4G2 (T9) 138115 1250 1400 TX NEWMAN 4S1 (T13) 138115 1250 1400 TX NEWMAN 5G1 (T15) 138115 1300 1456 TX NEWMAN 5G2 (T16) 138115 1300 1456 TX NEWMAN 5S1 (T14) 138115 1750 196 TX
NUWAY T1 115239 560 627 TX NUWAY T2 115239 560 627 TX
Page 6 of 7
EL PASO ELECTRIC COMPANY
Existing 115 kV Load amp Step-up Substation Transformers
RATING Normal Emergency State
MVA MVA PATRIOT T1 115138 336 376 TX
PELICANO T1 115239 560 627 TX PELICANO T2 115239 560 627 TX PENDALE T1 115138 336 376 TX PENDALE T2 115138 560 627 TX PICACHO T1 115249 560 627 NM REDEYE T1 115138 140 157 NM
RIO GRANDE T1 11569 112 1288 NM RIO GRANDE T2 11569 112 1288 NM
RIO GRANDE G8 (T7) 175115 1680 1882 NM RIO GRANDE G9 (T17) 138115 1320 1478 NM
RIPLEY T1 115138 336 376 TX RIPLEY T2 115138 560 627 TX
SALOPEK T1 115249 280 314 NM SALOPEK T2 115249 280 314 NM SALOPEK T3 115249 280 314 NM
SANTA TERESA T1 115239 336 376 NM SANTA TERESA T2 115239 336 376 NM
SCOTSDALE T1 11569 112 1288 TX SCOTSDALE T4 115138 560 627 TX SCOTSDALE T5 115138 560 627 TX SHEARMAN T1 115138 300 336 TX
SOL T1 115138 336 376 TX SOL T2 115138 300 336 TX
SPARKS T1 115138 336 376 TX SPARKS T2 115138 560 627 TX SPARKS T3
11569 100 115 TX
SUNSET NORTH T1 115138 336 376 TX SUNSET NORTH T2 115138 336 376 TX SUNSET NORTH T3 11569 112 1288 TX
TALAVERA TEMP T1 115239 165 185 NM THORN T1 115138 336 376 TX THORN T2 115138 336 376 TX
TRIUMPH TEMP T1 115239 336 376 TX VISTA T1 115138 300 336 TX VISTA T2 115138 300 336 TX
Page 7 of 7
EL PASO ELECTRIC COMPANY
Existing 115 kV Load amp Step-up Substation Transformers
RATING Normal Emergency State
MVA MVA WHITE SANDS T1 115138 300 336 NM
WRANGLER T1 115138 500 560 TX
Attachment C-2 Existing Units Operating CharacteristicsCapacity Factor ()Resources 2021 2024 2025 2027 2031 2035 2040 2045Newman 1 2 0 0 0 0 0 0 0Newman 2 1 0 0 0 0 0 0 0Newman 3 10 3 0 1 0 0 0 0Newman 4 14 5 2 3 1 0 0 0Newman 5 64 54 38 41 44 40 41 47Newman 6 0 12 7 8 6 3 4 6Copper 2 0 0 0 0 0 0 0Montana 1 26 29 20 21 20 11 19 23Montana 2 26 28 19 21 21 14 23 24Montana 3 17 17 13 14 12 5 11 16Montana 4 50 42 30 32 28 23 28 28Rio Grande 7 0 0 0 0 0 0 0 0Rio Grande 8 3 1 0 0 0 0 0 0Rio Grande 9 13 5 2 3 3 0 0 2Gas Peaker 0 0 0 0 0 3 3 5Palo Verde 1 94 94 94 94 94 94 94 94Palo Verde 2 94 94 94 94 94 94 94 94Palo Verde 3 94 94 94 94 94 94 94 94
Fuel Cost ($000)Resources 2021 2024 2025 2027 2031 2035 2040 2045Newman 1 431$ -$ -$ -$ -$ -$ -$ -$ Newman 2 273$ -$ -$ -$ -$ -$ -$ -$ Newman 3 2299$ 667$ 55$ 248$ 46$ -$ -$ -$ Newman 4 7893$ 2755$ 1080$ 1435$ 716$ -$ -$ -$ Newman 5 31126$ 24367$ 17006$ 19659$ 22951$ 21785$ 24625$ 28990$ Newman 6 -$ 5465$ 3596$ 4364$ 3762$ 1579$ 2380$ 4155$ Copper 1076$ 70$ -$ -$ -$ -$ -$ -$ Montana 1 4595$ 4852$ 3414$ 3784$ 4030$ 2455$ 4318$ 5534$ Montana 2 5153$ 5102$ 3468$ 4056$ 4447$ 3079$ 5285$ 5678$ Montana 3 3332$ 3087$ 2371$ 2768$ 2638$ 1279$ 2780$ 4139$ Montana 4 9507$ 7298$ 5383$ 5946$ 5665$ 4884$ 6297$ 6488$ Rio Grande 7 93$ -$ -$ -$ -$ -$ -$ -$ Rio Grande 8 1340$ 264$ 49$ 93$ -$ -$ -$ -$ Rio Grande 9 2675$ 987$ 413$ 603$ 706$ 42$ 22$ 429$ Gas Peaker -$ -$ -$ -$ -$ 1081$ 2239$ 5645$ Palo Verde 1 12111$ 12185$ 12222$ 12259$ 12370$ 12500$ 12667$ 12834$ Palo Verde 2 12169$ 12244$ 12281$ 12318$ 12430$ 12561$ 12728$ 12896$ Palo Verde 3 12111$ 12185$ 12222$ 12259$ 12370$ 12500$ 12667$ 12834$
Heat Rate (MMBtuMWh)Newman 1 1228Newman 2 1151Newman 3 1097Newman 4 1012Newman 5 7741Newman 6 10101Copper 19916Montana 1 9373Montana 2 9334Montana 3 9933Montana 4 9339Rio Grande 7 1179Rio Grande 8 11902Rio Grande 9 9881Gas Peaker 10101Palo Verde 1 10Palo Verde 2 10Palo Verde 3 10
Page 1 of 2
Attachment C-2 Existing Units Operating CharacteristicsFixed OampM ($000)Resources 2021 2024 2025 2027 2031 2035 2040 2045Newman 1 1704$ 5737$ 5737$ 5737$ -$ -$ -$ -$ Newman 2 1789$ -$ -$ -$ -$ -$ -$ -$ Newman 3 2221$ 2221$ 2221$ 5231$ 5231$ -$ -$ -$ Newman 4 5014$ 5014$ 5014$ 10769$ 10769$ -$ -$ -$ Newman 5 5563$ 5563$ 5563$ 5563$ 5563$ 5563$ 5563$ 5563$ Newman 6 -$ 2752$ 2752$ 2752$ 2752$ 2752$ 2752$ 2752$ Copper 1167$ 1167$ 1167$ 1167$ -$ -$ -$ -$ Montana 1 1613$ 1613$ 1613$ 1613$ 1613$ 1613$ 1613$ 1613$ Montana 2 1623$ 1623$ 1623$ 1623$ 1623$ 1623$ 1623$ 1623$ Montana 3 1484$ 1484$ 1484$ 1484$ 1484$ 1484$ 1484$ 1484$ Montana 4 1076$ 1076$ 1076$ 1076$ 1076$ 1076$ 1076$ 1076$ Rio Grande 7 1612$ -$ -$ -$ -$ -$ -$ -$ Rio Grande 8 4346$ 4346$ 4346$ 4346$ 4346$ -$ -$ -$ Rio Grande 9 2495$ 2495$ 2495$ 2495$ 2495$ 2495$ 2495$ 2495$ Gas Peaker -$ -$ -$ -$ -$ 1697$ 3312$ 4621$ Palo Verde 1 28313$ 28313$ 28313$ 28313$ 28313$ 28313$ 28313$ 28313$ Palo Verde 2 28313$ 28313$ 28313$ 28313$ 28313$ 28313$ 28313$ 28313$ Palo Verde 3 28313$ 28313$ 28313$ 28313$ 28313$ 28313$ 28313$ 28313$
Variable OampM ($000)Resources 2021 2024 2025 2027 2031 2035 2040 2045Newman 1 466$ -$ -$ -$ -$ -$ -$ -$ Newman 2 415$ -$ -$ -$ -$ -$ -$ -$ Newman 3 2388$ 695$ 57$ 257$ 48$ -$ -$ -$ Newman 4 8305$ 2887$ 1130$ 1497$ 744$ -$ -$ -$ Newman 5 33855$ 26821$ 18189$ 21158$ 24347$ 22746$ 25862$ 30331$ Newman 6 -$ 5964$ 3916$ 4688$ 3914$ 1639$ 2464$ 4299$ Copper 1581$ 282$ -$ -$ -$ -$ -$ -$ Montana 1 5119$ 5348$ 3764$ 4110$ 4219$ 2540$ 4463$ 5714$ Montana 2 5832$ 5707$ 3805$ 4427$ 4663$ 3195$ 5491$ 5881$ Montana 3 3700$ 3494$ 2602$ 3032$ 2777$ 1335$ 2895$ 4307$ Montana 4 10379$ 8028$ 6003$ 6579$ 6106$ 5134$ 6673$ 6808$ Rio Grande 7 161$ -$ -$ -$ -$ -$ -$ -$ Rio Grande 8 1700$ 269$ 50$ 94$ -$ -$ -$ -$ Rio Grande 9 3001$ 1138$ 487$ 689$ 741$ 44$ 23$ 447$ Gas Peaker -$ -$ -$ -$ -$ 1122$ 2319$ 5841$ Palo Verde 1 15537$ 15612$ 15649$ 15686$ 15797$ 15927$ 16094$ 16261$ Palo Verde 2 15613$ 15687$ 15724$ 15762$ 15873$ 16004$ 16172$ 16339$ Palo Verde 3 15537$ 15612$ 15649$ 15686$ 15797$ 15927$ 16094$ 16261$
Market Price
Year
Average Annual Price ($MWh)
2021 2024$ 2022 2043$ 2023 2050$ 2024 2008$ 2025 2020$ 2026 2007$ 2027 1981$ 2028 1998$ 2029 1919$ 2030 1863$ 2031 1927$ 2032 2020$ 2033 2009$ 2034 2021$ 2035 2016$ 2036 2031$ 2037 1998$ 2038 1927$ 2039 1895$ 2040 1836$ 2041 1843$ 2042 1832$ 2043 1825$ 2044 1895$ 2045 2025$
Page 2 of 2
Attachment D-1 E3 EPE Report Model Results June Page 1 of 34
Scenario Resource Type 2021 2024 2025 2027 2031 2035 2040 2045Least-Cost (Reference Case) Nuclear (Palo Verde) 5148 5148 5148 5148 5148 5148 5148 5148
Nuclear (SMR) - - - - - - - - Gas - Steam Turbine 140 34 7 3 - - - - Gas - Combined Cycle 1767 1373 1022 1111 1130 1065 1318 1502 Gas - Combustion Turbine 1027 1169 836 880 773 754 1250 1640 Biomass - - - - - - - - Geothermal - - - - - - - - Wind - - 379 382 375 336 409 720 Solar 289 952 1467 1551 2200 3058 3443 4239 Battery Storage - 12 (26) (48) (129) (217) (220) (250) Imports 391 336 260 259 282 273 358 440 Demand Response - - - - - - - - Hydrogen - - - - - - - - BTM Solar 37 135 165 225 344 460 601 763 Load 8771 9155 9258 9512 10123 10878 12308 14203 Excess Generation 14 130 430 342 496 657 373 475
Least-Cost Case + ETA Resources Nuclear (Palo Verde) 5148 5148 5148 5148 5148 5148 5148 5148 Nuclear (SMR) - - - - - - - - Gas - Steam Turbine 140 34 3 3 - - - - Gas - Combined Cycle 1767 1373 898 963 998 899 1053 1145 Gas - Combustion Turbine 1027 1169 720 761 686 461 790 1043 Biomass - - - - - - - - Geothermal - - - - - - - - Wind - - 670 688 675 555 653 815 Solar 289 953 1464 1530 2211 3351 4068 5345 Battery Storage - 12 (31) (45) (122) (241) (281) (370) Imports 391 336 220 239 184 245 275 314 Demand Response - - - - - - - - Hydrogen - - - - - - - - BTM Solar 37 135 165 225 344 460 601 763 Load 8771 9155 9258 9512 10123 10878 12308 14203 Excess Generation 14 130 564 480 558 1272 1040 940
Separate System Planning Nuclear (Palo Verde) 5148 5148 5148 5148 5148 5148 5148 5148 Nuclear (SMR) - - - - - - - - Gas - Steam Turbine 140 34 1 2 - - - - Gas - Combined Cycle 1766 1388 1031 1122 1141 969 1192 1385 Gas - Combustion Turbine 1040 1177 754 831 807 477 795 1105 Biomass - - - - - - - - Geothermal - - - - - - - - Wind - - 305 306 295 182 165 412 Solar 289 949 1648 1690 2236 3708 4532 5512 Battery Storage - 12 (54) (60) (138) (295) (350) (405) Imports 391 327 259 247 291 229 225 282 Demand Response - - - - - - - - Hydrogen - - - - - - - - BTM Solar 37 135 165 225 344 460 601 763 Load 8771 9155 9258 9512 10123 10878 12308 14203 Excess Generation 14 134 450 407 444 1288 2358 2353
Annual Energy (GWh)
Attachment D-1 E3 EPE Report Model Results June Page 2 of 34
Scenario Resource Type 2021 2024 2025 2027 2031 2035 2040 2045Annual Energy (GWh)
Separate System Planning (w H2) Nuclear (Palo Verde) 5148 5148 5148 5148 5148 5148 5148 5148 Nuclear (SMR) - - - - - - - - Gas - Steam Turbine 140 34 1 2 - - - - Gas - Combined Cycle 1766 1388 979 1049 1090 1035 1153 1384 Gas - Combustion Turbine 1040 1177 728 819 735 688 779 1129 Biomass - - - - - - - - Geothermal - - - - - - - - Wind - - 447 451 433 405 510 657 Solar 289 949 1594 1633 2242 3101 4087 5075 Battery Storage - 12 (56) (60) (136) (218) (297) (352) Imports 391 327 251 245 266 260 261 327 Demand Response - - - - - - - - Hydrogen - - - - - - 65 71 BTM Solar 37 135 165 225 344 460 601 763 Load 8771 9155 9258 9512 10123 10878 12308 14203 Excess Generation 14 133 444 402 574 772 872 919
Low Load Growth Nuclear (Palo Verde) 5148 5148 5148 5148 5148 5148 5148 5148 Nuclear (SMR) - - - - - - - - Gas - Steam Turbine 101 27 2 3 - - - - Gas - Combined Cycle 1596 1244 978 1065 1127 1025 1258 1472 Gas - Combustion Turbine 983 1065 799 875 806 644 1109 1492 Biomass - - - - - - - - Geothermal - - - - - - - - Wind - - 333 336 335 291 350 562 Solar 282 919 1293 1309 1805 2833 3220 3993 Battery Storage - 8 (29) (29) (96) (209) (215) (245) Imports 381 325 269 262 289 268 342 437 Demand Response - - - - - - - - Hydrogen - - - - - - - - BTM Solar 37 135 165 225 344 460 601 763 Load 8492 8862 8958 9194 9759 10459 11813 13623 Excess Generation 22 163 337 318 410 642 359 427
High Load Growth Nuclear (Palo Verde) 5148 5148 5148 5148 5148 5148 5148 5148 Nuclear (SMR) - - - - - - - - Gas - Steam Turbine 195 50 5 3 - - - - Gas - Combined Cycle 1909 1522 1067 1151 1118 1107 1388 1500 Gas - Combustion Turbine 1088 1256 865 914 776 867 1411 1747 Biomass - - - - - - - - Geothermal - - - - - - - - Wind - - 431 436 413 396 463 976 Solar 293 983 1651 1751 2569 3257 3642 4464 Battery Storage - 14 (47) (68) (159) (222) (222) (256) Imports 400 343 272 271 280 284 372 441 Demand Response - - - - - - - - Hydrogen - - - - - - - - BTM Solar 37 135 165 225 344 460 601 763 Load 9050 9447 9558 9830 10488 11297 12803 14783 Excess Generation 10 100 394 290 554 655 385 540
Attachment D-1 E3 EPE Report Model Results June Page 3 of 34
Scenario Resource Type 2021 2024 2025 2027 2031 2035 2040 2045Annual Energy (GWh)
High DG Nuclear (Palo Verde) 5148 5148 5148 5148 5148 5148 5148 5148 Nuclear (SMR) - - - - - - - - Gas - Steam Turbine 134 31 7 3 - - - - Gas - Combined Cycle 1728 1317 1001 1081 1111 1060 1266 1473 Gas - Combustion Turbine 1028 1123 814 825 742 696 1097 1614 Biomass - - - - - - - - Geothermal - - - - - - - - Wind - - 367 372 368 326 391 916 Solar 285 866 1263 1278 1665 2340 2627 2711 Battery Storage - 11 (25) (45) (126) (227) (245) (244) Imports 389 314 247 241 269 260 345 440 Demand Response - - - - - - - - Hydrogen - - - - - - - - BTM Solar 88 350 436 608 945 1276 1680 2144 Load 8771 9155 9258 9512 10123 10878 12308 14203 Excess Generation 18 217 513 492 614 714 600 432
High DSM Nuclear (Palo Verde) 5148 5148 5148 5148 5148 5148 5148 5148 Nuclear (SMR) - - - - - - - - Gas - Steam Turbine 133 30 2 3 0 - - - Gas - Combined Cycle 1744 1303 1041 1126 1198 1029 1234 1463 Gas - Combustion Turbine 1020 1111 869 907 900 610 1026 1407 Biomass - - - - - - - - Geothermal - - - - - - - - Wind - - 244 244 251 207 249 470 Solar 288 934 1332 1337 1621 2752 3114 3719 Battery Storage - 10 (28) (29) (86) (205) (213) (233) Imports 390 329 283 268 304 271 342 439 Demand Response - - - - - - - - Hydrogen - - - - - - - - BTM Solar 37 135 165 225 344 460 601 763 Load 8731 8994 9056 9230 9680 10273 11501 13177 Excess Generation 15 148 318 313 263 643 371 372
No New Gas Nuclear (Palo Verde) 5148 5148 5148 5148 5148 5148 5148 5148 Nuclear (SMR) - - - - - - - - Gas - Steam Turbine 140 34 6 3 - - - - Gas - Combined Cycle 1767 1373 984 1072 1095 716 702 637 Gas - Combustion Turbine 1027 1169 811 849 745 180 216 207 Biomass - - - - - - - - Geothermal - - - - - - - - Wind - - 455 462 452 210 208 210 Solar 289 952 1467 1545 2197 4287 5691 7680 Battery Storage - 12 (27) (47) (127) (348) (472) (649) Imports 391 336 251 255 270 225 213 206 Demand Response - - - - - - - - Hydrogen - - - - - - - - BTM Solar 37 135 165 225 344 460 601 763 Load 8771 9155 9258 9512 10123 10878 12308 14203 Excess Generation 14 130 458 372 536 2237 2586 3219
Attachment D-1 E3 EPE Report Model Results June Page 4 of 34
Scenario Resource Type 2021 2024 2025 2027 2031 2035 2040 2045Annual Energy (GWh)
No Lifetime Extensions Nuclear (Palo Verde) 5148 5148 5148 5148 5148 5148 5148 5148 Nuclear (SMR) - - - - - - - - Gas - Steam Turbine 140 34 2 0 - - - - Gas - Combined Cycle 1767 1373 948 1015 1050 1056 1308 1502 Gas - Combustion Turbine 1027 1169 707 680 634 745 1242 1640 Biomass - - - - - - - - Geothermal - - - - - - - - Wind - - 397 400 370 364 442 722 Solar 289 953 1693 1897 2475 3050 3432 4237 Battery Storage - 12 (38) (94) (164) (216) (219) (250) Imports 391 336 235 241 267 271 354 440 Demand Response - - - - - - - - Hydrogen - - - - - - - - BTM Solar 37 135 165 225 344 460 601 763 Load 8771 9155 9258 9512 10123 10878 12308 14203 Excess Generation 14 129 634 428 592 661 374 475
High Gas Price Nuclear (Palo Verde) 5148 5148 5148 5148 5148 5148 5148 5148 Nuclear (SMR) - - - - - - - - Gas - Steam Turbine 125 31 3 3 - - - - Gas - Combined Cycle 1787 1400 983 1060 1062 999 1234 1347 Gas - Combustion Turbine 1008 1120 764 786 698 607 1121 1361 Biomass - - - - - - - - Geothermal - - - - - - - - Wind - - 486 493 483 422 516 926 Solar 290 956 1465 1542 2190 3165 3570 4490 Battery Storage - 9 (31) (46) (126) (226) (232) (274) Imports 403 360 274 301 325 303 350 440 Demand Response - - - - - - - - Hydrogen - - - - - - - - BTM Solar 37 135 165 225 344 460 601 763 Load 8771 9155 9258 9512 10123 10878 12308 14203 Excess Generation 13 127 470 386 546 811 486 705
Low Carbon Price Nuclear (Palo Verde) 5148 5148 5148 5148 5148 5148 5148 5148 Nuclear (SMR) - - - - - - - - Gas - Steam Turbine 127 23 3 3 - - - - Gas - Combined Cycle 1803 1433 955 1021 1036 971 1189 1333 Gas - Combustion Turbine 1001 1107 711 750 678 571 1063 1333 Biomass - - - - - - - - Geothermal - - - - - - - - Wind - - 609 624 604 523 642 936 Solar 289 958 1476 1548 2179 3178 3576 4573 Battery Storage - 11 (32) (45) (124) (229) (234) (279) Imports 394 345 223 238 258 256 322 395 Demand Response - - - - - - - - Hydrogen - - - - - - - - BTM Solar 37 135 165 225 344 460 601 763 Load 8771 9155 9258 9512 10123 10878 12308 14203 Excess Generation 14 125 512 426 579 876 532 725
Attachment D-1 E3 EPE Report Model Results June Page 5 of 34
Scenario Resource Type 2021 2024 2025 2027 2031 2035 2040 2045Annual Energy (GWh)
Medium Carbon Price Nuclear (Palo Verde) 5148 5148 5148 5148 5148 5148 5148 5148 Nuclear (SMR) - - - - - - - - Gas - Steam Turbine 120 22 3 3 - - - - Gas - Combined Cycle 1822 1496 876 941 974 922 1115 1270 Gas - Combustion Turbine 983 1036 548 590 606 475 950 1199 Biomass - - - - - - - - Geothermal - - - - - - - - Wind - - 754 779 766 646 805 1098 Solar 290 961 1600 1663 2221 3268 3695 4746 Battery Storage - 7 (37) (47) (122) (230) (242) (293) Imports 399 354 200 210 187 190 235 271 Demand Response - - - - - - - - Hydrogen - - - - - - - - BTM Solar 37 135 165 225 344 460 601 763 Load 8771 9155 9258 9512 10123 10878 12308 14203 Excess Generation 13 121 763 676 588 911 560 726
High Carbon Price Nuclear (Palo Verde) 5148 5148 5148 5148 5148 5148 5148 5148 Nuclear (SMR) - - - - - - - - Gas - Steam Turbine 119 21 2 3 0 - - - Gas - Combined Cycle 1835 1540 658 724 862 872 979 832 Gas - Combustion Turbine 962 989 428 458 488 393 630 544 Biomass - - - - - - - - Geothermal - - - - - - - - Wind - - 869 904 927 776 940 832 Solar 290 963 1847 1900 2307 3272 4088 6364 Battery Storage - 2 (40) (46) (115) (230) (271) (474) Imports 408 362 181 195 162 187 193 192 Demand Response - - - - - - - - Hydrogen - - - - - - - - BTM Solar 37 135 165 225 344 460 601 763 Load 8771 9155 9258 9512 10123 10878 12308 14203 Excess Generation 13 120 1270 1182 882 1065 1041 1596
80 Clean by 2035 Nuclear (Palo Verde) 5148 5148 5148 5148 5148 5148 5148 5148 Nuclear (SMR) - - - - - - - - Gas - Steam Turbine 140 34 7 3 - - - - Gas - Combined Cycle 1767 1373 1022 1111 1127 1050 1159 1295 Gas - Combustion Turbine 1027 1169 836 880 766 696 1057 1256 Biomass - - - - - - - - Geothermal - - - - - - - - Wind - - 379 382 375 331 683 1029 Solar 289 952 1466 1551 2212 3155 3653 4715 Battery Storage - 12 (26) (48) (129) (224) (234) (290) Imports 391 336 261 260 278 264 240 286 Demand Response - - - - - - - - Hydrogen - - - - - - - - BTM Solar 37 135 165 225 344 460 601 763 Load 8771 9155 9258 9512 10123 10878 12308 14203 Excess Generation 14 130 431 343 514 770 469 738
Attachment D-1 E3 EPE Report Model Results June Page 6 of 34
Scenario Resource Type 2021 2024 2025 2027 2031 2035 2040 2045Annual Energy (GWh)
20 CO2 Red by 2040 Nuclear (Palo Verde) 5148 5148 5148 5148 5148 5148 5148 5148 Nuclear (SMR) - - - - - - - - Gas - Steam Turbine 140 34 7 3 - - - - Gas - Combined Cycle 1767 1373 1022 1111 1130 1065 1318 1342 Gas - Combustion Turbine 1027 1169 836 880 773 751 1249 1353 Biomass - - - - - - - - Geothermal - - - - - - - - Wind - - 379 382 375 336 409 927 Solar 289 952 1466 1549 2204 3061 3445 4548 Battery Storage - 12 (26) (48) (129) (217) (220) (277) Imports 391 336 261 262 277 274 357 397 Demand Response - - - - - - - - Hydrogen - - - - - - - - BTM Solar 37 135 165 225 344 460 601 763 Load 8771 9155 9258 9512 10123 10878 12308 14203 Excess Generation 14 130 431 345 491 655 371 705
40 CO2 Red by 2040 Nuclear (Palo Verde) 5148 5148 5148 5148 5148 5148 5148 5148 Nuclear (SMR) - - - - - - - - Gas - Steam Turbine 140 34 7 3 - - - - Gas - Combined Cycle 1767 1373 1022 1111 1127 1051 1133 1135 Gas - Combustion Turbine 1027 1169 836 880 766 696 980 985 Biomass - - - - - - - - Geothermal - - - - - - - - Wind - - 379 382 375 331 763 1034 Solar 289 953 1466 1549 2211 3151 3692 5268 Battery Storage - 12 (26) (48) (128) (224) (241) (350) Imports 391 336 261 262 279 265 232 219 Demand Response - - - - - - - - Hydrogen - - - - - - - - BTM Solar 37 135 165 225 344 460 601 763 Load 8771 9155 9258 9512 10123 10878 12308 14203 Excess Generation 14 129 432 345 515 768 533 965
60 CO2 Red by 2040 Nuclear (Palo Verde) 5148 5148 5148 5148 5148 5148 5148 5148 Nuclear (SMR) - - - - - - - - Gas - Steam Turbine 140 34 7 3 - - - - Gas - Combined Cycle 1767 1373 1022 1111 1127 1052 864 852 Gas - Combustion Turbine 1027 1169 836 880 766 698 561 560 Biomass - - - - - - - - Geothermal - - - - - - - - Wind - - 379 382 375 331 927 838 Solar 289 953 1466 1552 2213 3150 4319 6337 Battery Storage - 12 (26) (48) (128) (224) (276) (470) Imports 391 336 261 259 278 263 164 174 Demand Response - - - - - - - - Hydrogen - - - - - - - - BTM Solar 37 135 165 225 344 460 601 763 Load 8771 9155 9258 9512 10123 10878 12308 14203 Excess Generation 14 130 432 342 513 769 1338 1586
Attachment D-1 E3 EPE Report Model Results June Page 7 of 34
Scenario Resource Type 2021 2024 2025 2027 2031 2035 2040 2045Annual Energy (GWh)
80 CO2 Red by 2040 Nuclear (Palo Verde) 5148 5148 5148 5148 5148 5148 5148 5148 Nuclear (SMR) - - - - - - - - Gas - Steam Turbine 140 34 3 3 - - - - Gas - Combined Cycle 1767 1373 910 976 1017 907 577 550 Gas - Combustion Turbine 1027 1169 734 777 696 468 168 183 Biomass - - - - - - - - Geothermal - - - - - - - - Wind - - 638 654 638 532 1260 1231 Solar 289 952 1463 1531 2158 3371 4812 6758 Battery Storage - 12 (30) (45) (123) (239) (338) (517) Imports 391 336 227 241 245 232 80 88 Demand Response - - - - - - - - Hydrogen - - - - - - - - BTM Solar 37 135 165 225 344 460 601 763 Load 8771 9155 9258 9512 10123 10878 12308 14203 Excess Generation 14 130 546 461 605 1183 2430 2751
90 CO2 Red by 2040 Nuclear (Palo Verde) 5148 5148 5148 5148 5148 5148 5148 5148 Nuclear (SMR) - - - - - - - - Gas - Steam Turbine 140 34 3 3 - - - - Gas - Combined Cycle 1767 1373 910 978 1018 808 340 313 Gas - Combustion Turbine 1027 1169 736 776 696 320 41 58 Biomass - - - - - - - - Geothermal - - - - - - - - Wind - - 637 655 639 463 1965 1995 Solar 289 952 1462 1527 2156 3764 4483 6350 Battery Storage - 12 (30) (45) (123) (278) (311) (472) Imports 391 336 226 244 245 193 40 47 Demand Response - - - - - - - - Hydrogen - - - - - - - - BTM Solar 37 135 165 225 344 460 601 763 Load 8771 9155 9258 9512 10123 10878 12308 14203 Excess Generation 14 130 547 465 603 1440 3210 3645
100 CO2 Red by 2040 Nuclear (Palo Verde) 5148 5148 5148 5148 5148 5148 5148 5148 Nuclear (SMR) - - - - - - - - Gas - Steam Turbine 140 34 6 3 - - - - Gas - Combined Cycle 1767 1373 984 1072 1095 716 - - Gas - Combustion Turbine 1027 1169 811 849 745 180 - - Biomass - - - - - - - - Geothermal - - - - - - - - Wind - - 455 462 452 210 969 1406 Solar 289 952 1467 1545 2197 4287 6734 7595 Battery Storage - 12 (27) (47) (127) (348) (1163) (1402) Imports 391 336 251 255 270 225 - - Demand Response - - - - - - - - Hydrogen - - - - - - - - BTM Solar 37 135 165 225 344 460 620 1455 Load 8771 9155 9258 9512 10123 10878 12308 14203 Excess Generation 14 130 458 372 536 2237 10954 12232
Attachment D-1 E3 EPE Report Model Results June Page 8 of 34
Scenario Resource Type 2021 2024 2025 2027 2031 2035 2040 2045Annual Energy (GWh)
100 CO2 Red by 2040 (w H2) Nuclear (Palo Verde) 5148 5148 5148 5148 5148 5148 5148 5148 Nuclear (SMR) - - - - - - - - Gas - Steam Turbine 140 34 3 4 - - - - Gas - Combined Cycle 1767 1373 868 928 983 689 - - Gas - Combustion Turbine 1027 1169 692 732 627 210 - - Biomass - - - - - - - - Geothermal - - - - - - - - Wind - - 743 765 755 469 1700 1650 Solar 289 952 1460 1525 2217 4074 4752 6753 Battery Storage - 12 (31) (46) (122) (300) (336) (515) Imports 391 336 209 230 171 129 - - Demand Response - - - - - - - - Hydrogen - - - - - - 442 404 BTM Solar 37 135 165 225 344 460 601 763 Load 8771 9155 9258 9512 10123 10878 12308 14203 Excess Generation 14 130 616 528 575 1636 3102 3585
Attachment D-1 E3 EPE Report Model Results June Page 9 of 34
Scenario Resource TypeLeast-Cost (Reference Case) Nuclear (Palo Verde)
Nuclear (SMR)Gas - Steam TurbineGas - Combined CycleGas - Combustion TurbineBiomassGeothermalWindSolarBattery StorageImportsDemand ResponseHydrogenBTM SolarLoadExcess Generation
Least-Cost Case + ETA Resources Nuclear (Palo Verde)Nuclear (SMR)Gas - Steam TurbineGas - Combined CycleGas - Combustion TurbineBiomassGeothermalWindSolarBattery StorageImportsDemand ResponseHydrogenBTM SolarLoadExcess Generation
Separate System Planning Nuclear (Palo Verde)Nuclear (SMR)Gas - Steam TurbineGas - Combined CycleGas - Combustion TurbineBiomassGeothermalWindSolarBattery StorageImportsDemand ResponseHydrogenBTM SolarLoadExcess Generation
2021 2024 2025 2027 2031 2035 2040 2045622 622 622 622 622 622 622 622 - - - - - - - - 426 307 307 307 234 - - - 493 493 493 493 493 266 266 266 503 731 731 731 668 952 1111 1318 - - - - - - - - - - - - - - - - - - 109 109 109 109 109 196 115 385 629 629 904 1241 1298 1580 - 50 183 256 582 1032 1116 1284 - - - - - - - - 46 53 56 61 71 81 93 93
- - - - - - - - 18 65 80 108 166 221 289 368
- - - - - - - - - - - - - - - - 622 622 622 622 622 622 622 622 - - - - - - - - 426 307 307 307 234 - - - 493 493 493 493 493 266 266 266 503 731 731 731 668 879 999 1154 - - - - - - - - - - - - - - - - - - 204 204 204 204 204 264 115 385 629 629 887 1482 1684 2050 - 50 183 236 552 1084 1252 1698 - - - - - - - - 46 53 56 61 71 81 93 93
- - - - - - - - 18 65 80 108 166 221 289 368
- - - - - - - - - - - - - - - - 622 622 622 622 622 622 622 622 - - - - - - - - 426 307 307 307 234 - - - 493 493 493 493 493 266 266 266 503 731 731 731 668 835 835 989 - - - - - - - - - - - - - - - - - - 87 87 87 87 87 159 115 385 707 707 905 1667 2322 2639 - 50 271 293 634 1480 2207 2579 - - - - - - - - 46 53 56 61 71 81 93 93
- - - - - - - - 18 65 80 108 166 221 289 368
- - - - - - - - - - - - - - - -
Installed Capacity (MW)
Attachment D-1 E3 EPE Report Model Results June Page 10 of 34
Scenario Resource TypeSeparate System Planning (w H2) Nuclear (Palo Verde)
Nuclear (SMR)Gas - Steam TurbineGas - Combined CycleGas - Combustion TurbineBiomassGeothermalWindSolarBattery StorageImportsDemand ResponseHydrogenBTM SolarLoadExcess Generation
Low Load Growth Nuclear (Palo Verde)Nuclear (SMR)Gas - Steam TurbineGas - Combined CycleGas - Combustion TurbineBiomassGeothermalWindSolarBattery StorageImportsDemand ResponseHydrogenBTM SolarLoadExcess Generation
High Load Growth Nuclear (Palo Verde)Nuclear (SMR)Gas - Steam TurbineGas - Combined CycleGas - Combustion TurbineBiomassGeothermalWindSolarBattery StorageImportsDemand ResponseHydrogenBTM SolarLoadExcess Generation
2021 2024 2025 2027 2031 2035 2040 2045Installed Capacity (MW)
622 622 622 622 622 622 622 622 - - - - - - - - 426 307 307 307 234 - - - 493 493 493 493 493 266 266 266 503 731 731 731 668 825 825 989 - - - - - - - - - - - - - - - - - - 129 129 129 129 172 212 115 385 672 672 936 1290 1645 1990 - 50 269 291 601 1038 1420 1741 - - - - - - - - 46 53 56 61 71 81 93 93
- - - - - 121 195 206 18 65 80 108 166 221 289 368
- - - - - - - - - - - - - - - - 622 622 622 622 622 622 622 622 - - - - - - - - 426 307 307 307 234 - - - 493 493 493 493 493 266 266 266 503 731 731 731 668 847 989 1182 - - - - - - - - - - - - - - - - - - 96 96 96 96 96 153 115 385 541 541 743 1162 1216 1489 - 50 192 193 454 1012 1093 1257 - - - - - - - - 46 53 56 61 71 81 93 93
- - - - - - - - 18 65 80 108 166 221 289 368
- - - - - - - - - - - - - - - - 622 622 622 622 622 622 622 622 - - - - - - - - 426 307 307 307 234 - - - 493 493 493 493 493 266 266 266 503 731 731 731 668 1062 1237 1451 - - - - - - - - - - - - - - - - - - 123 123 123 123 123 266 115 385 677 677 1046 1309 1369 1660 - 50 249 342 716 1048 1136 1307 - - - - - - - - 46 53 56 61 71 81 93 93
- - - - - - - - 18 65 80 108 166 221 289 368
- - - - - - - - - - - - - - - -
Attachment D-1 E3 EPE Report Model Results June Page 11 of 34
Scenario Resource TypeHigh DG Nuclear (Palo Verde)
Nuclear (SMR)Gas - Steam TurbineGas - Combined CycleGas - Combustion TurbineBiomassGeothermalWindSolarBattery StorageImportsDemand ResponseHydrogenBTM SolarLoadExcess Generation
High DSM Nuclear (Palo Verde)Nuclear (SMR)Gas - Steam TurbineGas - Combined CycleGas - Combustion TurbineBiomassGeothermalWindSolarBattery StorageImportsDemand ResponseHydrogenBTM SolarLoadExcess Generation
No New Gas Nuclear (Palo Verde)Nuclear (SMR)Gas - Steam TurbineGas - Combined CycleGas - Combustion TurbineBiomassGeothermalWindSolarBattery StorageImportsDemand ResponseHydrogenBTM SolarLoadExcess Generation
2021 2024 2025 2027 2031 2035 2040 2045Installed Capacity (MW)
622 622 622 622 622 622 622 622 - - - - - - - - 426 307 307 307 234 - - - 493 493 493 493 493 266 266 266 503 731 731 731 668 942 1078 1322 - - - - - - - - - - - - - - - - - - 106 106 106 106 106 249 115 385 587 587 761 1011 1092 1023 - 50 183 252 571 1043 1151 1267 - - - - - - - - 46 53 56 61 71 81 93 93
- - - - - - - - 42 169 210 293 455 614 809 1032
- - - - - - - - - - - - - - - - 622 622 622 622 622 622 622 622 - - - - - - - - 426 307 307 307 234 - - - 493 493 493 493 493 266 266 266 503 731 731 731 668 801 926 1105 - - - - - - - - - - - - - - - - - - 70 70 70 70 70 127 115 385 558 558 641 1146 1189 1384 - 50 187 191 425 1000 1070 1209 - - - - - - - - 49 66 71 82 100 101 103 103
- - - - - - - - 18 65 80 108 166 221 289 368
- - - - - - - - - - - - - - - - 622 622 622 622 622 622 622 622 - - - - - - - - 426 307 307 307 234 - - - 493 493 493 493 493 266 266 266 503 731 731 731 668 668 668 668 - - - - - - - - - - - - - - - - - - 132 132 132 132 132 132 115 385 629 629 908 2129 2734 3644 - 50 183 251 573 1864 2496 3634 - - - - - - - - 46 53 56 61 71 81 93 93
- - - - - - - - 18 65 80 108 166 221 289 368
- - - - - - - - - - - - - - - -
Attachment D-1 E3 EPE Report Model Results June Page 12 of 34
Scenario Resource TypeNo Lifetime Extensions Nuclear (Palo Verde)
Nuclear (SMR)Gas - Steam TurbineGas - Combined CycleGas - Combustion TurbineBiomassGeothermalWindSolarBattery StorageImportsDemand ResponseHydrogenBTM SolarLoadExcess Generation
High Gas Price Nuclear (Palo Verde)Nuclear (SMR)Gas - Steam TurbineGas - Combined CycleGas - Combustion TurbineBiomassGeothermalWindSolarBattery StorageImportsDemand ResponseHydrogenBTM SolarLoadExcess Generation
Low Carbon Price Nuclear (Palo Verde)Nuclear (SMR)Gas - Steam TurbineGas - Combined CycleGas - Combustion TurbineBiomassGeothermalWindSolarBattery StorageImportsDemand ResponseHydrogenBTM SolarLoadExcess Generation
2021 2024 2025 2027 2031 2035 2040 2045Installed Capacity (MW)
622 622 622 622 622 622 622 622 - - - - - - - - 426 234 234 144 144 - - - 493 493 493 266 266 266 266 266 503 731 731 914 851 951 1109 1318 - - - - - - - - - - - - - - - - - - 118 118 118 118 118 196 115 385 769 769 1018 1235 1292 1579 - 50 230 434 743 1031 1115 1284 - - - - - - - - 46 53 56 61 71 81 93 93
- - - - - - - - 18 65 80 108 166 221 289 368
- - - - - - - - - - - - - - - - 622 622 622 622 622 622 622 622 - - - - - - - - 426 307 307 307 234 - - - 493 493 493 493 493 266 266 266 503 731 731 731 668 930 1088 1274 - - - - - - - - - - - - - - - - - - 142 142 142 142 142 264 115 385 629 629 905 1312 1369 1712 - 50 183 249 570 1047 1131 1312 - - - - - - - - 46 53 56 61 71 81 93 93
- - - - - - - - 18 65 80 108 166 221 289 368
- - - - - - - - - - - - - - - - 622 622 622 622 622 622 622 622 - - - - - - - - 426 307 307 307 234 - - - 493 493 493 493 493 266 266 266 503 731 731 731 668 920 1078 1267 - - - - - - - - - - - - - - - - - - 181 181 181 181 181 267 115 385 629 629 894 1312 1369 1747 - 50 183 240 559 1047 1131 1319 - - - - - - - - 46 53 56 61 71 81 93 93
- - - - - - - - 18 65 80 108 166 221 289 368
- - - - - - - - - - - - - - - -
Attachment D-1 E3 EPE Report Model Results June Page 13 of 34
Scenario Resource TypeMedium Carbon Price Nuclear (Palo Verde)
Nuclear (SMR)Gas - Steam TurbineGas - Combined CycleGas - Combustion TurbineBiomassGeothermalWindSolarBattery StorageImportsDemand ResponseHydrogenBTM SolarLoadExcess Generation
High Carbon Price Nuclear (Palo Verde)Nuclear (SMR)Gas - Steam TurbineGas - Combined CycleGas - Combustion TurbineBiomassGeothermalWindSolarBattery StorageImportsDemand ResponseHydrogenBTM SolarLoadExcess Generation
80 Clean by 2035 Nuclear (Palo Verde)Nuclear (SMR)Gas - Steam TurbineGas - Combined CycleGas - Combustion TurbineBiomassGeothermalWindSolarBattery StorageImportsDemand ResponseHydrogenBTM SolarLoadExcess Generation
2021 2024 2025 2027 2031 2035 2040 2045Installed Capacity (MW)
622 622 622 622 622 622 622 622 - - - - - - - - 426 307 307 307 234 - - - 493 493 493 493 493 266 266 266 503 731 731 731 668 909 1060 1248 - - - - - - - - - - - - - - - - - - 236 236 236 236 236 300 115 385 724 724 882 1312 1390 1813 - 50 183 228 547 1047 1136 1343 - - - - - - - - 46 53 56 61 71 81 93 93
- - - - - - - - 18 65 80 108 166 221 289 368
- - - - - - - - - - - - - - - - 622 622 622 622 622 622 622 622 - - - - - - - - 426 307 307 307 234 - - - 493 493 493 493 493 266 266 266 503 731 731 731 668 901 1001 1024 - - - - - - - - - - - - - - - - - - 300 300 300 300 300 301 115 385 927 927 972 1312 1640 2583 - 50 183 211 521 1047 1189 2082 - - - - - - - - 46 53 56 61 71 81 93 93
- - - - - - - - 18 65 80 108 166 221 289 368
- - - - - - - - - - - - - - - - 622 622 622 622 622 622 622 622 - - - - - - - - 426 307 307 307 234 - - - 493 493 493 493 493 266 266 266 503 731 731 731 668 938 1075 1253 - - - - - - - - - - - - - - - - - - 109 109 109 109 194 285 115 385 629 629 915 1312 1369 1805 - 50 183 256 580 1047 1131 1331 - - - - - - - - 46 53 56 61 71 81 93 93
- - - - - - - - 18 65 80 108 166 221 289 368
- - - - - - - - - - - - - - - -
Attachment D-1 E3 EPE Report Model Results June Page 14 of 34
Scenario Resource Type20 CO2 Red by 2040 Nuclear (Palo Verde)
Nuclear (SMR)Gas - Steam TurbineGas - Combined CycleGas - Combustion TurbineBiomassGeothermalWindSolarBattery StorageImportsDemand ResponseHydrogenBTM SolarLoadExcess Generation
40 CO2 Red by 2040 Nuclear (Palo Verde)Nuclear (SMR)Gas - Steam TurbineGas - Combined CycleGas - Combustion TurbineBiomassGeothermalWindSolarBattery StorageImportsDemand ResponseHydrogenBTM SolarLoadExcess Generation
60 CO2 Red by 2040 Nuclear (Palo Verde)Nuclear (SMR)Gas - Steam TurbineGas - Combined CycleGas - Combustion TurbineBiomassGeothermalWindSolarBattery StorageImportsDemand ResponseHydrogenBTM SolarLoadExcess Generation
2021 2024 2025 2027 2031 2035 2040 2045Installed Capacity (MW)
622 622 622 622 622 622 622 622 - - - - - - - - 426 307 307 307 234 - - - 493 493 493 493 493 266 266 266 503 731 731 731 668 952 1111 1270 - - - - - - - - - - - - - - - - - - 109 109 109 109 109 264 115 385 629 629 904 1242 1299 1733 - 50 183 256 582 1032 1116 1316 - - - - - - - - 46 53 56 61 71 81 93 93
- - - - - - - - 18 65 80 108 166 221 289 368
- - - - - - - - - - - - - - - - 622 622 622 622 622 622 622 622 - - - - - - - - 426 307 307 307 234 - - - 493 493 493 493 493 266 266 266 503 731 731 731 668 939 1064 1178 - - - - - - - - - - - - - - - - - - 109 109 109 109 221 300 115 385 629 629 915 1310 1390 2052 - 50 183 256 580 1045 1135 1573 - - - - - - - - 46 53 56 61 71 81 93 93
- - - - - - - - 18 65 80 108 166 221 289 368
- - - - - - - - - - - - - - - - 622 622 622 622 622 622 622 622 - - - - - - - - 426 307 307 307 234 - - - 493 493 493 493 493 266 266 266 503 731 731 731 668 938 987 1029 - - - - - - - - - - - - - - - - - - 109 109 109 109 300 301 115 385 629 629 915 1311 1822 2573 - 50 183 256 580 1046 1194 2062 - - - - - - - - 46 53 56 61 71 81 93 93
- - - - - - - - 18 65 80 108 166 221 289 368
- - - - - - - - - - - - - - - -
Attachment D-1 E3 EPE Report Model Results June Page 15 of 34
Scenario Resource Type80 CO2 Red by 2040 Nuclear (Palo Verde)
Nuclear (SMR)Gas - Steam TurbineGas - Combined CycleGas - Combustion TurbineBiomassGeothermalWindSolarBattery StorageImportsDemand ResponseHydrogenBTM SolarLoadExcess Generation
90 CO2 Red by 2040 Nuclear (Palo Verde)Nuclear (SMR)Gas - Steam TurbineGas - Combined CycleGas - Combustion TurbineBiomassGeothermalWindSolarBattery StorageImportsDemand ResponseHydrogenBTM SolarLoadExcess Generation
100 CO2 Red by 2040 Nuclear (Palo Verde)Nuclear (SMR)Gas - Steam TurbineGas - Combined CycleGas - Combustion TurbineBiomassGeothermalWindSolarBattery StorageImportsDemand ResponseHydrogenBTM SolarLoadExcess Generation
2021 2024 2025 2027 2031 2035 2040 2045Installed Capacity (MW)
622 622 622 622 622 622 622 622 - - - - - - - - 426 307 307 307 234 - - - 493 493 493 493 493 266 266 266 503 731 731 731 668 885 885 885 - - - - - - - - - - - - - - - - - - 192 192 192 192 507 507 115 385 629 629 891 1475 2226 3013 - 50 183 238 556 1080 1416 2455 - - - - - - - - 46 53 56 61 71 81 93 93
- - - - - - - - 18 65 80 108 166 221 289 368
- - - - - - - - - - - - - - - - 622 622 622 622 622 622 622 622 - - - - - - - - 426 307 307 307 234 - - - 493 493 493 493 493 266 266 266 503 731 731 731 668 819 819 819 - - - - - - - - - - - - - - - - - - 192 192 192 192 764 772 115 385 628 628 891 1681 2284 3081 - 50 183 238 556 1276 1601 2627 - - - - - - - - 46 53 56 61 71 81 93 93
- - - - - - - - 18 65 80 108 166 221 289 368
- - - - - - - - - - - - - - - - 622 622 622 622 622 622 622 622 - - - - - - - - 426 307 307 307 234 - - - 493 493 493 493 493 266 266 266 503 731 731 731 668 668 668 668 - - - - - - - - - - - - - - - - - - 132 132 132 132 1228 1605 115 385 629 629 908 2129 4851 5217 - 50 183 251 573 1864 6191 7470 - - - - - - - - 46 53 56 61 71 81 93 93
- - - - - - - - 18 65 80 108 166 221 298 701
- - - - - - - - - - - - - - - -
Attachment D-1 E3 EPE Report Model Results June Page 16 of 34
Scenario Resource Type100 CO2 Red by 2040 (w H2) Nuclear (Palo Verde)
Nuclear (SMR)Gas - Steam TurbineGas - Combined CycleGas - Combustion TurbineBiomassGeothermalWindSolarBattery StorageImportsDemand ResponseHydrogenBTM SolarLoadExcess Generation
2021 2024 2025 2027 2031 2035 2040 2045Installed Capacity (MW)
622 622 622 622 622 622 622 622 - - - - - - - - 426 307 307 307 234 - - - 493 493 493 493 493 266 - - 503 731 731 731 668 774 - - - - - - - - - - - - - - - - - - - - 231 231 231 231 687 687 115 385 628 628 883 1801 2353 3200 - 50 183 233 548 1403 1804 2864 - - - - - - - - 46 53 56 61 71 81 93 93
- - - - - - 1040 1040 18 65 80 108 166 221 289 368
- - - - - - - - - - - - - - - -
Attachment D-1 E3 EPE Report Model Results June Page 17 of 34
Scenario Resource TypeLeast-Cost (Reference Case) Nuclear (Palo Verde)
Nuclear (SMR)Gas - Steam TurbineGas - Combined CycleGas - Combustion TurbineBiomassGeothermalWindSolarBattery StorageImportsDemand ResponseHydrogenBTM SolarLoadExcess Generation
Least-Cost Case + ETA Resources Nuclear (Palo Verde)Nuclear (SMR)Gas - Steam TurbineGas - Combined CycleGas - Combustion TurbineBiomassGeothermalWindSolarBattery StorageImportsDemand ResponseHydrogenBTM SolarLoadExcess Generation
Separate System Planning Nuclear (Palo Verde)Nuclear (SMR)Gas - Steam TurbineGas - Combined CycleGas - Combustion TurbineBiomassGeothermalWindSolarBattery StorageImportsDemand ResponseHydrogenBTM SolarLoadExcess Generation
2021 2024 2025 2027 2031 2035 2040 2045- - - - - - - - - - - - - - - - - - - - - - - - - - - - - - - - - 228 228 228 228 512 671 878 - - - - - - - - - - - - - - - - - - 109 109 109 109 109 196 - 270 514 514 789 1196 1280 1842 - 50 183 256 582 1032 1116 1334 - - - - - - - - 46 53 56 61 71 81 93 93
- - - - - - - - 18 65 80 108 166 221 289 368
- - - - - - - - - - - - - - - - - - - - - - - - - - - - - - - - - - - - - - - - - - - - - - - - - 228 228 228 228 439 559 714 - - - - - - - - - - - - - - - - - - 204 204 204 204 204 264 - 270 514 514 772 1437 1666 2312 - 50 183 236 552 1084 1252 1748 - - - - - - - - 46 53 56 61 71 81 93 93
- - - - - - - - 18 65 80 108 166 221 289 368
- - - - - - - - - - - - - - - - - - - - - - - - - - - - - - - - - - - - - - - - - - - - - - - - - 228 228 228 228 395 395 549 - - - - - - - - - - - - - - - - - - 87 87 87 87 87 159 - 270 592 592 790 1622 2304 2901 - 50 271 293 634 1480 2207 2629 - - - - - - - - 46 53 56 61 71 81 93 93
- - - - - - - - 18 65 80 108 166 221 289 368
- - - - - - - - - - - - - - - -
Cumulative Capacity Additions (MW)
Attachment D-1 E3 EPE Report Model Results June Page 18 of 34
Scenario Resource TypeSeparate System Planning (w H2) Nuclear (Palo Verde)
Nuclear (SMR)Gas - Steam TurbineGas - Combined CycleGas - Combustion TurbineBiomassGeothermalWindSolarBattery StorageImportsDemand ResponseHydrogenBTM SolarLoadExcess Generation
Low Load Growth Nuclear (Palo Verde)Nuclear (SMR)Gas - Steam TurbineGas - Combined CycleGas - Combustion TurbineBiomassGeothermalWindSolarBattery StorageImportsDemand ResponseHydrogenBTM SolarLoadExcess Generation
High Load Growth Nuclear (Palo Verde)Nuclear (SMR)Gas - Steam TurbineGas - Combined CycleGas - Combustion TurbineBiomassGeothermalWindSolarBattery StorageImportsDemand ResponseHydrogenBTM SolarLoadExcess Generation
2021 2024 2025 2027 2031 2035 2040 2045Cumulative Capacity Additions (MW)
- - - - - - - - - - - - - - - - - - - - - - - - - - - - - - - - - 228 228 228 228 385 385 549 - - - - - - - - - - - - - - - - - - 129 129 129 129 172 212 - 270 557 557 821 1245 1627 2252 - 50 269 291 601 1038 1420 1791 - - - - - - - - 46 53 56 61 71 81 93 93
- - - - - 121 195 206 18 65 80 108 166 221 289 368
- - - - - - - - - - - - - - - - - - - - - - - - - - - - - - - - - - - - - - - - - - - - - - - - - 228 228 228 228 407 549 742 - - - - - - - - - - - - - - - - - - 96 96 96 96 96 153 - 270 426 426 628 1117 1198 1751 - 50 192 193 454 1012 1093 1307 - - - - - - - - 46 53 56 61 71 81 93 93
- - - - - - - - 18 65 80 108 166 221 289 368
- - - - - - - - - - - - - - - - - - - - - - - - - - - - - - - - - - - - - - - - - - - - - - - - - 228 228 228 228 622 797 1011 - - - - - - - - - - - - - - - - - - 123 123 123 123 123 266 - 270 562 562 931 1264 1351 1922 - 50 249 342 716 1048 1136 1357 - - - - - - - - 46 53 56 61 71 81 93 93
- - - - - - - - 18 65 80 108 166 221 289 368
- - - - - - - - - - - - - - - -
Attachment D-1 E3 EPE Report Model Results June Page 19 of 34
Scenario Resource TypeHigh DG Nuclear (Palo Verde)
Nuclear (SMR)Gas - Steam TurbineGas - Combined CycleGas - Combustion TurbineBiomassGeothermalWindSolarBattery StorageImportsDemand ResponseHydrogenBTM SolarLoadExcess Generation
High DSM Nuclear (Palo Verde)Nuclear (SMR)Gas - Steam TurbineGas - Combined CycleGas - Combustion TurbineBiomassGeothermalWindSolarBattery StorageImportsDemand ResponseHydrogenBTM SolarLoadExcess Generation
No New Gas Nuclear (Palo Verde)Nuclear (SMR)Gas - Steam TurbineGas - Combined CycleGas - Combustion TurbineBiomassGeothermalWindSolarBattery StorageImportsDemand ResponseHydrogenBTM SolarLoadExcess Generation
2021 2024 2025 2027 2031 2035 2040 2045Cumulative Capacity Additions (MW)
- - - - - - - - - - - - - - - - - - - - - - - - - - - - - - - - - 228 228 228 228 502 638 882 - - - - - - - - - - - - - - - - - - 106 106 106 106 106 249 - 270 472 472 646 966 1074 1285 - 50 183 252 571 1043 1151 1317 - - - - - - - - 46 53 56 61 71 81 93 93
- - - - - - - - 42 169 210 293 455 614 809 1032
- - - - - - - - - - - - - - - - - - - - - - - - - - - - - - - - - - - - - - - - - - - - - - - - - 228 228 228 228 361 486 665 - - - - - - - - - - - - - - - - - - 70 70 70 70 70 127 - 270 443 443 526 1101 1171 1646 - 50 187 191 425 1000 1070 1259 - - - - - - - - 49 66 71 82 100 101 103 103
- - - - - - - - 18 65 80 108 166 221 289 368
- - - - - - - - - - - - - - - - - - - - - - - - - - - - - - - - - - - - - - - - - - - - - - - - - 228 228 228 228 228 228 228 - - - - - - - - - - - - - - - - - - 132 132 132 132 132 132 - 270 514 514 793 2084 2716 3906 - 50 183 251 573 1864 2496 3684 - - - - - - - - 46 53 56 61 71 81 93 93
- - - - - - - - 18 65 80 108 166 221 289 368
- - - - - - - - - - - - - - - -
Attachment D-1 E3 EPE Report Model Results June Page 20 of 34
Scenario Resource TypeNo Lifetime Extensions Nuclear (Palo Verde)
Nuclear (SMR)Gas - Steam TurbineGas - Combined CycleGas - Combustion TurbineBiomassGeothermalWindSolarBattery StorageImportsDemand ResponseHydrogenBTM SolarLoadExcess Generation
High Gas Price Nuclear (Palo Verde)Nuclear (SMR)Gas - Steam TurbineGas - Combined CycleGas - Combustion TurbineBiomassGeothermalWindSolarBattery StorageImportsDemand ResponseHydrogenBTM SolarLoadExcess Generation
Low Carbon Price Nuclear (Palo Verde)Nuclear (SMR)Gas - Steam TurbineGas - Combined CycleGas - Combustion TurbineBiomassGeothermalWindSolarBattery StorageImportsDemand ResponseHydrogenBTM SolarLoadExcess Generation
2021 2024 2025 2027 2031 2035 2040 2045Cumulative Capacity Additions (MW)
- - - - - - - - - - - - - - - - - - - - - - - - - - - - - - - - - 228 228 411 411 511 669 878 - - - - - - - - - - - - - - - - - - 118 118 118 118 118 196 - 270 654 654 903 1190 1274 1841 - 50 230 434 743 1031 1115 1334 - - - - - - - - 46 53 56 61 71 81 93 93
- - - - - - - - 18 65 80 108 166 221 289 368
- - - - - - - - - - - - - - - - - - - - - - - - - - - - - - - - - - - - - - - - - - - - - - - - - 228 228 228 228 490 648 834 - - - - - - - - - - - - - - - - - - 142 142 142 142 142 264 - 270 514 514 790 1267 1351 1974 - 50 183 249 570 1047 1131 1362 - - - - - - - - 46 53 56 61 71 81 93 93
- - - - - - - - 18 65 80 108 166 221 289 368
- - - - - - - - - - - - - - - - - - - - - - - - - - - - - - - - - - - - - - - - - - - - - - - - - 228 228 228 228 480 638 827 - - - - - - - - - - - - - - - - - - 181 181 181 181 181 267 - 270 514 514 779 1267 1351 2009 - 50 183 240 559 1047 1131 1369 - - - - - - - - 46 53 56 61 71 81 93 93
- - - - - - - - 18 65 80 108 166 221 289 368
- - - - - - - - - - - - - - - -
Attachment D-1 E3 EPE Report Model Results June Page 21 of 34
Scenario Resource TypeMedium Carbon Price Nuclear (Palo Verde)
Nuclear (SMR)Gas - Steam TurbineGas - Combined CycleGas - Combustion TurbineBiomassGeothermalWindSolarBattery StorageImportsDemand ResponseHydrogenBTM SolarLoadExcess Generation
High Carbon Price Nuclear (Palo Verde)Nuclear (SMR)Gas - Steam TurbineGas - Combined CycleGas - Combustion TurbineBiomassGeothermalWindSolarBattery StorageImportsDemand ResponseHydrogenBTM SolarLoadExcess Generation
80 Clean by 2035 Nuclear (Palo Verde)Nuclear (SMR)Gas - Steam TurbineGas - Combined CycleGas - Combustion TurbineBiomassGeothermalWindSolarBattery StorageImportsDemand ResponseHydrogenBTM SolarLoadExcess Generation
2021 2024 2025 2027 2031 2035 2040 2045Cumulative Capacity Additions (MW)
- - - - - - - - - - - - - - - - - - - - - - - - - - - - - - - - - 228 228 228 228 469 620 808 - - - - - - - - - - - - - - - - - - 236 236 236 236 236 300 - 270 609 609 767 1267 1372 2075 - 50 183 228 547 1047 1136 1393 - - - - - - - - 46 53 56 61 71 81 93 93
- - - - - - - - 18 65 80 108 166 221 289 368
- - - - - - - - - - - - - - - - - - - - - - - - - - - - - - - - - - - - - - - - - - - - - - - - - 228 228 228 228 461 561 584 - - - - - - - - - - - - - - - - - - 300 300 300 300 300 301 - 270 812 812 857 1267 1622 2845 - 50 183 211 521 1047 1189 2132 - - - - - - - - 46 53 56 61 71 81 93 93
- - - - - - - - 18 65 80 108 166 221 289 368
- - - - - - - - - - - - - - - - - - - - - - - - - - - - - - - - - - - - - - - - - - - - - - - - - 228 228 228 228 498 635 813 - - - - - - - - - - - - - - - - - - 109 109 109 109 194 285 - 270 514 514 800 1267 1351 2067 - 50 183 256 580 1047 1131 1381 - - - - - - - - 46 53 56 61 71 81 93 93
- - - - - - - - 18 65 80 108 166 221 289 368
- - - - - - - - - - - - - - - -
Attachment D-1 E3 EPE Report Model Results June Page 22 of 34
Scenario Resource Type20 CO2 Red by 2040 Nuclear (Palo Verde)
Nuclear (SMR)Gas - Steam TurbineGas - Combined CycleGas - Combustion TurbineBiomassGeothermalWindSolarBattery StorageImportsDemand ResponseHydrogenBTM SolarLoadExcess Generation
40 CO2 Red by 2040 Nuclear (Palo Verde)Nuclear (SMR)Gas - Steam TurbineGas - Combined CycleGas - Combustion TurbineBiomassGeothermalWindSolarBattery StorageImportsDemand ResponseHydrogenBTM SolarLoadExcess Generation
60 CO2 Red by 2040 Nuclear (Palo Verde)Nuclear (SMR)Gas - Steam TurbineGas - Combined CycleGas - Combustion TurbineBiomassGeothermalWindSolarBattery StorageImportsDemand ResponseHydrogenBTM SolarLoadExcess Generation
2021 2024 2025 2027 2031 2035 2040 2045Cumulative Capacity Additions (MW)
- - - - - - - - - - - - - - - - - - - - - - - - - - - - - - - - - 228 228 228 228 512 671 830 - - - - - - - - - - - - - - - - - - 109 109 109 109 109 264 - 270 514 514 789 1197 1281 1995 - 50 183 256 582 1032 1116 1366 - - - - - - - - 46 53 56 61 71 81 93 93
- - - - - - - - 18 65 80 108 166 221 289 368
- - - - - - - - - - - - - - - - - - - - - - - - - - - - - - - - - - - - - - - - - - - - - - - - - 228 228 228 228 499 624 738 - - - - - - - - - - - - - - - - - - 109 109 109 109 221 300 - 270 514 514 800 1265 1372 2314 - 50 183 256 580 1045 1135 1623 - - - - - - - - 46 53 56 61 71 81 93 93
- - - - - - - - 18 65 80 108 166 221 289 368
- - - - - - - - - - - - - - - - - - - - - - - - - - - - - - - - - - - - - - - - - - - - - - - - - 228 228 228 228 498 547 589 - - - - - - - - - - - - - - - - - - 109 109 109 109 300 301 - 270 514 514 800 1266 1804 2835 - 50 183 256 580 1046 1194 2112 - - - - - - - - 46 53 56 61 71 81 93 93
- - - - - - - - 18 65 80 108 166 221 289 368
- - - - - - - - - - - - - - - -
Attachment D-1 E3 EPE Report Model Results June Page 23 of 34
Scenario Resource Type80 CO2 Red by 2040 Nuclear (Palo Verde)
Nuclear (SMR)Gas - Steam TurbineGas - Combined CycleGas - Combustion TurbineBiomassGeothermalWindSolarBattery StorageImportsDemand ResponseHydrogenBTM SolarLoadExcess Generation
90 CO2 Red by 2040 Nuclear (Palo Verde)Nuclear (SMR)Gas - Steam TurbineGas - Combined CycleGas - Combustion TurbineBiomassGeothermalWindSolarBattery StorageImportsDemand ResponseHydrogenBTM SolarLoadExcess Generation
100 CO2 Red by 2040 Nuclear (Palo Verde)Nuclear (SMR)Gas - Steam TurbineGas - Combined CycleGas - Combustion TurbineBiomassGeothermalWindSolarBattery StorageImportsDemand ResponseHydrogenBTM SolarLoadExcess Generation
2021 2024 2025 2027 2031 2035 2040 2045Cumulative Capacity Additions (MW)
- - - - - - - - - - - - - - - - - - - - - - - - - - - - - - - - - 228 228 228 228 445 445 445 - - - - - - - - - - - - - - - - - - 192 192 192 192 507 507 - 270 514 514 776 1430 2208 3275 - 50 183 238 556 1080 1416 2505 - - - - - - - - 46 53 56 61 71 81 93 93
- - - - - - - - 18 65 80 108 166 221 289 368
- - - - - - - - - - - - - - - - - - - - - - - - - - - - - - - - - - - - - - - - - - - - - - - - - 228 228 228 228 379 379 379 - - - - - - - - - - - - - - - - - - 192 192 192 192 764 772 - 270 513 513 776 1636 2266 3343 - 50 183 238 556 1276 1601 2677 - - - - - - - - 46 53 56 61 71 81 93 93
- - - - - - - - 18 65 80 108 166 221 289 368
- - - - - - - - - - - - - - - - - - - - - - - - - - - - - - - - - - - - - - - - - - - - - - - - - 228 228 228 228 228 228 228 - - - - - - - - - - - - - - - - - - 132 132 132 132 1228 1605 - 270 514 514 793 2084 4833 5479 - 50 183 251 573 1864 6191 7470 - - - - - - - - 46 53 56 61 71 81 93 93
- - - - - - - - 18 65 80 108 166 221 298 701
- - - - - - - - - - - - - - - -
Attachment D-1 E3 EPE Report Model Results June Page 24 of 34
Scenario Resource Type100 CO2 Red by 2040 (w H2) Nuclear (Palo Verde)
Nuclear (SMR)Gas - Steam TurbineGas - Combined CycleGas - Combustion TurbineBiomassGeothermalWindSolarBattery StorageImportsDemand ResponseHydrogenBTM SolarLoadExcess Generation
2021 2024 2025 2027 2031 2035 2040 2045Cumulative Capacity Additions (MW)
- - - - - - - - - - - - - - - - - - - - - - - - - - - - - - - - - 228 228 228 228 334 - - - - - - - - - - - - - - - - - - - - 231 231 231 231 687 687 - 270 513 513 768 1756 2335 3462 - 50 183 233 548 1403 1804 2914 - - - - - - - - 46 53 56 61 71 81 93 93
- - - - - - 334 334 18 65 80 108 166 221 289 368
- - - - - - - - - - - - - - - -
Attachment D-1 E3 EPE Report Model Results June Page 25 of 34
Scenario Resource TypeLeast-Cost (Reference Case) Nuclear (Palo Verde)
Nuclear (SMR)Gas - Steam TurbineGas - Combined CycleGas - Combustion TurbineBiomassGeothermalWindSolarBattery StorageImportsDemand ResponseHydrogenBTM SolarLoadExcess Generation
Least-Cost Case + ETA Resources Nuclear (Palo Verde)Nuclear (SMR)Gas - Steam TurbineGas - Combined CycleGas - Combustion TurbineBiomassGeothermalWindSolarBattery StorageImportsDemand ResponseHydrogenBTM SolarLoadExcess Generation
Separate System Planning Nuclear (Palo Verde)Nuclear (SMR)Gas - Steam TurbineGas - Combined CycleGas - Combustion TurbineBiomassGeothermalWindSolarBattery StorageImportsDemand ResponseHydrogenBTM SolarLoadExcess Generation
2021 2024 2025 2027 2031 2035 2040 2045- - - - - - - - - - - - - - - - - (119) (119) (119) (192) (426) (426) (426) - - - - - (227) (227) (227) - - - - (63) (63) (63) (63) - - - - - - - - - - - - - - - - - - - - - - - - - - - - - (70) (97) (377) - - - - - - - (50) - - - - - - - - - - - - - - - - - - - - - - - - - - - - - - - - - - - - - - - - - - - - - - - - - - - - - - - - - - - - - - - - - (119) (119) (119) (192) (426) (426) (426) - - - - - (227) (227) (227) - - - - (63) (63) (63) (63) - - - - - - - - - - - - - - - - - - - - - - - - - - - - - (70) (97) (377) - - - - - - - (50) - - - - - - - - - - - - - - - - - - - - - - - - - - - - - - - - - - - - - - - - - - - - - - - - - - - - - - - - - - - - - - - - - (119) (119) (119) (192) (426) (426) (426) - - - - - (227) (227) (227) - - - - (63) (63) (63) (63) - - - - - - - - - - - - - - - - - - - - - - - - - - - - - (70) (97) (377) - - - - - - - (50) - - - - - - - - - - - - - - - - - - - - - - - - - - - - - - - - - - - - - - - - - - - - - - - -
Cumulative Capacity Retirements (MW)
Attachment D-1 E3 EPE Report Model Results June Page 26 of 34
Scenario Resource TypeSeparate System Planning (w H2) Nuclear (Palo Verde)
Nuclear (SMR)Gas - Steam TurbineGas - Combined CycleGas - Combustion TurbineBiomassGeothermalWindSolarBattery StorageImportsDemand ResponseHydrogenBTM SolarLoadExcess Generation
Low Load Growth Nuclear (Palo Verde)Nuclear (SMR)Gas - Steam TurbineGas - Combined CycleGas - Combustion TurbineBiomassGeothermalWindSolarBattery StorageImportsDemand ResponseHydrogenBTM SolarLoadExcess Generation
High Load Growth Nuclear (Palo Verde)Nuclear (SMR)Gas - Steam TurbineGas - Combined CycleGas - Combustion TurbineBiomassGeothermalWindSolarBattery StorageImportsDemand ResponseHydrogenBTM SolarLoadExcess Generation
2021 2024 2025 2027 2031 2035 2040 2045Cumulative Capacity Retirements (MW)
- - - - - - - - - - - - - - - - - (119) (119) (119) (192) (426) (426) (426) - - - - - (227) (227) (227) - - - - (63) (63) (63) (63) - - - - - - - - - - - - - - - - - - - - - - - - - - - - - (70) (97) (377) - - - - - - - (50) - - - - - - - - - - - - - - - - - - - - - - - - - - - - - - - - - - - - - - - - - - - - - - - - - - - - - - - - - - - - - - - - - (119) (119) (119) (192) (426) (426) (426) - - - - - (227) (227) (227) - - - - (63) (63) (63) (63) - - - - - - - - - - - - - - - - - - - - - - - - - - - - - (70) (97) (377) - - - - - - - (50) - - - - - - - - - - - - - - - - - - - - - - - - - - - - - - - - - - - - - - - - - - - - - - - - - - - - - - - - - - - - - - - - - (119) (119) (119) (192) (426) (426) (426) - - - - - (227) (227) (227) - - - - (63) (63) (63) (63) - - - - - - - - - - - - - - - - - - - - - - - - - - - - - (70) (97) (377) - - - - - - - (50) - - - - - - - - - - - - - - - - - - - - - - - - - - - - - - - - - - - - - - - - - - - - - - - -
Attachment D-1 E3 EPE Report Model Results June Page 27 of 34
Scenario Resource TypeHigh DG Nuclear (Palo Verde)
Nuclear (SMR)Gas - Steam TurbineGas - Combined CycleGas - Combustion TurbineBiomassGeothermalWindSolarBattery StorageImportsDemand ResponseHydrogenBTM SolarLoadExcess Generation
High DSM Nuclear (Palo Verde)Nuclear (SMR)Gas - Steam TurbineGas - Combined CycleGas - Combustion TurbineBiomassGeothermalWindSolarBattery StorageImportsDemand ResponseHydrogenBTM SolarLoadExcess Generation
No New Gas Nuclear (Palo Verde)Nuclear (SMR)Gas - Steam TurbineGas - Combined CycleGas - Combustion TurbineBiomassGeothermalWindSolarBattery StorageImportsDemand ResponseHydrogenBTM SolarLoadExcess Generation
2021 2024 2025 2027 2031 2035 2040 2045Cumulative Capacity Retirements (MW)
- - - - - - - - - - - - - - - - - (119) (119) (119) (192) (426) (426) (426) - - - - - (227) (227) (227) - - - - (63) (63) (63) (63) - - - - - - - - - - - - - - - - - - - - - - - - - - - - - (70) (97) (377) - - - - - - - (50) - - - - - - - - - - - - - - - - - - - - - - - - - - - - - - - - - - - - - - - - - - - - - - - - - - - - - - - - - - - - - - - - - (119) (119) (119) (192) (426) (426) (426) - - - - - (227) (227) (227) - - - - (63) (63) (63) (63) - - - - - - - - - - - - - - - - - - - - - - - - - - - - - (70) (97) (377) - - - - - - - (50) - - - - - - - - - - - - - - - - - - - - - - - - - - - - - - - - - - - - - - - - - - - - - - - - - - - - - - - - - - - - - - - - - (119) (119) (119) (192) (426) (426) (426) - - - - - (227) (227) (227) - - - - (63) (63) (63) (63) - - - - - - - - - - - - - - - - - - - - - - - - - - - - - (70) (97) (377) - - - - - - - (50) - - - - - - - - - - - - - - - - - - - - - - - - - - - - - - - - - - - - - - - - - - - - - - - -
Attachment D-1 E3 EPE Report Model Results June Page 28 of 34
Scenario Resource TypeNo Lifetime Extensions Nuclear (Palo Verde)
Nuclear (SMR)Gas - Steam TurbineGas - Combined CycleGas - Combustion TurbineBiomassGeothermalWindSolarBattery StorageImportsDemand ResponseHydrogenBTM SolarLoadExcess Generation
High Gas Price Nuclear (Palo Verde)Nuclear (SMR)Gas - Steam TurbineGas - Combined CycleGas - Combustion TurbineBiomassGeothermalWindSolarBattery StorageImportsDemand ResponseHydrogenBTM SolarLoadExcess Generation
Low Carbon Price Nuclear (Palo Verde)Nuclear (SMR)Gas - Steam TurbineGas - Combined CycleGas - Combustion TurbineBiomassGeothermalWindSolarBattery StorageImportsDemand ResponseHydrogenBTM SolarLoadExcess Generation
2021 2024 2025 2027 2031 2035 2040 2045Cumulative Capacity Retirements (MW)
- - - - - - - - - - - - - - - - - (192) (192) (282) (282) (426) (426) (426) - - - (227) (227) (227) (227) (227) - - - - (63) (63) (63) (63) - - - - - - - - - - - - - - - - - - - - - - - - - - - - - (70) (97) (377) - - - - - - - (50) - - - - - - - - - - - - - - - - - - - - - - - - - - - - - - - - - - - - - - - - - - - - - - - - - - - - - - - - - - - - - - - - - (119) (119) (119) (192) (426) (426) (426) - - - - - (227) (227) (227) - - - - (63) (63) (63) (63) - - - - - - - - - - - - - - - - - - - - - - - - - - - - - (70) (97) (377) - - - - - - - (50) - - - - - - - - - - - - - - - - - - - - - - - - - - - - - - - - - - - - - - - - - - - - - - - - - - - - - - - - - - - - - - - - - (119) (119) (119) (192) (426) (426) (426) - - - - - (227) (227) (227) - - - - (63) (63) (63) (63) - - - - - - - - - - - - - - - - - - - - - - - - - - - - - (70) (97) (377) - - - - - - - (50) - - - - - - - - - - - - - - - - - - - - - - - - - - - - - - - - - - - - - - - - - - - - - - - -
Attachment D-1 E3 EPE Report Model Results June Page 29 of 34
Scenario Resource TypeMedium Carbon Price Nuclear (Palo Verde)
Nuclear (SMR)Gas - Steam TurbineGas - Combined CycleGas - Combustion TurbineBiomassGeothermalWindSolarBattery StorageImportsDemand ResponseHydrogenBTM SolarLoadExcess Generation
High Carbon Price Nuclear (Palo Verde)Nuclear (SMR)Gas - Steam TurbineGas - Combined CycleGas - Combustion TurbineBiomassGeothermalWindSolarBattery StorageImportsDemand ResponseHydrogenBTM SolarLoadExcess Generation
80 Clean by 2035 Nuclear (Palo Verde)Nuclear (SMR)Gas - Steam TurbineGas - Combined CycleGas - Combustion TurbineBiomassGeothermalWindSolarBattery StorageImportsDemand ResponseHydrogenBTM SolarLoadExcess Generation
2021 2024 2025 2027 2031 2035 2040 2045Cumulative Capacity Retirements (MW)
- - - - - - - - - - - - - - - - - (119) (119) (119) (192) (426) (426) (426) - - - - - (227) (227) (227) - - - - (63) (63) (63) (63) - - - - - - - - - - - - - - - - - - - - - - - - - - - - - (70) (97) (377) - - - - - - - (50) - - - - - - - - - - - - - - - - - - - - - - - - - - - - - - - - - - - - - - - - - - - - - - - - - - - - - - - - - - - - - - - - - (119) (119) (119) (192) (426) (426) (426) - - - - - (227) (227) (227) - - - - (63) (63) (63) (63) - - - - - - - - - - - - - - - - - - - - - - - - - - - - - (70) (97) (377) - - - - - - - (50) - - - - - - - - - - - - - - - - - - - - - - - - - - - - - - - - - - - - - - - - - - - - - - - - - - - - - - - - - - - - - - - - - (119) (119) (119) (192) (426) (426) (426) - - - - - (227) (227) (227) - - - - (63) (63) (63) (63) - - - - - - - - - - - - - - - - - - - - - - - - - - - - - (70) (97) (377) - - - - - - - (50) - - - - - - - - - - - - - - - - - - - - - - - - - - - - - - - - - - - - - - - - - - - - - - - -
Attachment D-1 E3 EPE Report Model Results June Page 30 of 34
Scenario Resource Type20 CO2 Red by 2040 Nuclear (Palo Verde)
Nuclear (SMR)Gas - Steam TurbineGas - Combined CycleGas - Combustion TurbineBiomassGeothermalWindSolarBattery StorageImportsDemand ResponseHydrogenBTM SolarLoadExcess Generation
40 CO2 Red by 2040 Nuclear (Palo Verde)Nuclear (SMR)Gas - Steam TurbineGas - Combined CycleGas - Combustion TurbineBiomassGeothermalWindSolarBattery StorageImportsDemand ResponseHydrogenBTM SolarLoadExcess Generation
60 CO2 Red by 2040 Nuclear (Palo Verde)Nuclear (SMR)Gas - Steam TurbineGas - Combined CycleGas - Combustion TurbineBiomassGeothermalWindSolarBattery StorageImportsDemand ResponseHydrogenBTM SolarLoadExcess Generation
2021 2024 2025 2027 2031 2035 2040 2045Cumulative Capacity Retirements (MW)
- - - - - - - - - - - - - - - - - (119) (119) (119) (192) (426) (426) (426) - - - - - (227) (227) (227) - - - - (63) (63) (63) (63) - - - - - - - - - - - - - - - - - - - - - - - - - - - - - (70) (97) (377) - - - - - - - (50) - - - - - - - - - - - - - - - - - - - - - - - - - - - - - - - - - - - - - - - - - - - - - - - - - - - - - - - - - - - - - - - - - (119) (119) (119) (192) (426) (426) (426) - - - - - (227) (227) (227) - - - - (63) (63) (63) (63) - - - - - - - - - - - - - - - - - - - - - - - - - - - - - (70) (97) (377) - - - - - - - (50) - - - - - - - - - - - - - - - - - - - - - - - - - - - - - - - - - - - - - - - - - - - - - - - - - - - - - - - - - - - - - - - - - (119) (119) (119) (192) (426) (426) (426) - - - - - (227) (227) (227) - - - - (63) (63) (63) (63) - - - - - - - - - - - - - - - - - - - - - - - - - - - - - (70) (97) (377) - - - - - - - (50) - - - - - - - - - - - - - - - - - - - - - - - - - - - - - - - - - - - - - - - - - - - - - - - -
Attachment D-1 E3 EPE Report Model Results June Page 31 of 34
Scenario Resource Type80 CO2 Red by 2040 Nuclear (Palo Verde)
Nuclear (SMR)Gas - Steam TurbineGas - Combined CycleGas - Combustion TurbineBiomassGeothermalWindSolarBattery StorageImportsDemand ResponseHydrogenBTM SolarLoadExcess Generation
90 CO2 Red by 2040 Nuclear (Palo Verde)Nuclear (SMR)Gas - Steam TurbineGas - Combined CycleGas - Combustion TurbineBiomassGeothermalWindSolarBattery StorageImportsDemand ResponseHydrogenBTM SolarLoadExcess Generation
100 CO2 Red by 2040 Nuclear (Palo Verde)Nuclear (SMR)Gas - Steam TurbineGas - Combined CycleGas - Combustion TurbineBiomassGeothermalWindSolarBattery StorageImportsDemand ResponseHydrogenBTM SolarLoadExcess Generation
2021 2024 2025 2027 2031 2035 2040 2045Cumulative Capacity Retirements (MW)
- - - - - - - - - - - - - - - - - (119) (119) (119) (192) (426) (426) (426) - - - - - (227) (227) (227) - - - - (63) (63) (63) (63) - - - - - - - - - - - - - - - - - - - - - - - - - - - - - (70) (97) (377) - - - - - - - (50) - - - - - - - - - - - - - - - - - - - - - - - - - - - - - - - - - - - - - - - - - - - - - - - - - - - - - - - - - - - - - - - - - (119) (119) (119) (192) (426) (426) (426) - - - - - (227) (227) (227) - - - - (63) (63) (63) (63) - - - - - - - - - - - - - - - - - - - - - - - - - - - - - (70) (97) (377) - - - - - - - (50) - - - - - - - - - - - - - - - - - - - - - - - - - - - - - - - - - - - - - - - - - - - - - - - - - - - - - - - - - - - - - - - - - (119) (119) (119) (192) (426) (426) (426) - - - - - (227) (227) (227) - - - - (63) (63) (63) (63) - - - - - - - - - - - - - - - - - - - - - - - - - - - - - (70) (97) (377) - - - - - - - (50) - - - - - - - - - - - - - - - - - - - - - - - - - - - - - - - - - - - - - - - - - - - - - - - -
Attachment D-1 E3 EPE Report Model Results June Page 32 of 34
Scenario Resource Type100 CO2 Red by 2040 (w H2) Nuclear (Palo Verde)
Nuclear (SMR)Gas - Steam TurbineGas - Combined CycleGas - Combustion TurbineBiomassGeothermalWindSolarBattery StorageImportsDemand ResponseHydrogenBTM SolarLoadExcess Generation
2021 2024 2025 2027 2031 2035 2040 2045Cumulative Capacity Retirements (MW)
- - - - - - - - - - - - - - - - - (119) (119) (119) (192) (426) (426) (426) - - - - - (227) (227) (227) - - - - (63) (63) (63) (63) - - - - - - - - - - - - - - - - - - - - - - - - - - - - - (70) (97) (377) - - - - - - - (50) - - - - - - - - - - - - - - - - - - - - - - - - - - - - - - - - - - - - - - - - - - - - - - - -
Attachment D-1 E3 EPE Report Model Results June Page 33 of 34
Scenario 2021 2024 2025 2027 2031 2035 2040 2045Least-Cost (Reference Case) 246$ 233$ 246$ 265$ 290$ 351$ 409$ 512$ Least-Cost Case + ETA Resources 246$ 233$ 249$ 266$ 291$ 356$ 412$ 519$ Separate System Planning 247$ 234$ 252$ 269$ 295$ 376$ 471$ 577$ Separate System Planning (w H2) 247$ 234$ 252$ 269$ 294$ 355$ 438$ 543$ Low Load Growth 239$ 227$ 239$ 255$ 275$ 327$ 380$ 478$ High Load Growth 253$ 239$ 256$ 277$ 307$ 377$ 439$ 546$ High DG 245$ 231$ 243$ 261$ 283$ 336$ 388$ 482$ High DSM 245$ 230$ 241$ 256$ 272$ 317$ 364$ 454$ No New Gas 246$ 233$ 247$ 265$ 290$ 394$ 470$ 601$ No Lifetime Extensions 246$ 228$ 246$ 276$ 307$ 354$ 412$ 515$ High Gas Price 257$ 242$ 252$ 272$ 297$ 358$ 418$ 522$ Low Carbon Price 291$ 277$ 285$ 304$ 329$ 390$ 450$ 556$ Medium Carbon Price 358$ 341$ 342$ 361$ 386$ 447$ 512$ 623$ High Carbon Price 469$ 449$ 433$ 452$ 478$ 539$ 609$ 730$ 80 Clean by 2035 246$ 233$ 246$ 265$ 290$ 352$ 409$ 512$ 20 CO2 Red by 2040 246$ 233$ 246$ 265$ 290$ 351$ 409$ 511$ 40 CO2 Red by 2040 246$ 233$ 246$ 265$ 290$ 352$ 409$ 519$ 60 CO2 Red by 2040 246$ 233$ 246$ 265$ 290$ 352$ 421$ 537$ 80 CO2 Red by 2040 246$ 233$ 248$ 266$ 290$ 356$ 464$ 580$ 90 CO2 Red by 2040 246$ 233$ 248$ 266$ 290$ 366$ 503$ 620$ 100 CO2 Red by 2040 246$ 233$ 247$ 265$ 290$ 394$ 1102$ 1269$ 100 CO2 Red by 2040 (w H2) 246$ 233$ 250$ 267$ 291$ 375$ 561$ 675$
Annual Revenue Requirement ($M)
Attachment D-1 E3 EPE Report Model Results June Page 34 of 34
Scenario Clean Energy Type 2021 2024 2025 2027 2031 2035 2040 2045Least-Cost (Reference Case) Renewable 4 12 22 23 28 35 36 40
Zero Carbon 62 68 77 76 79 81 77 75Least-Cost Case + ETA Resources Renewable 4 12 25 26 32 39 42 48
Zero Carbon 62 68 80 79 82 86 83 83Separate System Planning Renewable 4 12 23 23 28 39 42 46
Zero Carbon 62 68 78 77 78 85 83 81Separate System Planning (w H2) Renewable 4 12 24 24 29 36 41 45
Zero Carbon 62 68 79 78 80 82 83 80Low Load Growth Renewable 4 12 20 20 25 34 35 38
Zero Carbon 64 70 77 76 77 82 77 75High Load Growth Renewable 4 12 23 24 31 36 36 41
Zero Carbon 61 66 77 76 80 80 76 75High DG Renewable 4 13 22 24 29 35 37 40
Zero Carbon 63 70 78 77 79 82 78 76High DSM Renewable 4 12 19 20 23 33 34 37
Zero Carbon 63 69 76 75 75 82 78 75No New Gas Renewable 4 12 22 23 29 44 51 58
Zero Carbon 62 68 78 77 79 90 91 93No Lifetime Extensions Renewable 4 12 24 26 31 35 36 40
Zero Carbon 62 68 80 80 81 81 77 75High Gas Price Renewable 4 12 23 24 29 36 37 43
Zero Carbon 62 68 78 78 80 83 78 78Low Carbon Price Renewable 4 12 24 25 31 37 38 43
Zero Carbon 62 68 80 79 81 84 79 79Medium Carbon Price Renewable 4 12 27 28 33 39 41 46
Zero Carbon 62 68 83 82 83 86 82 81High Carbon Price Renewable 4 12 31 32 35 41 45 54
Zero Carbon 62 68 86 86 85 87 86 8980 Clean by 2035 Renewable 4 12 22 23 29 36 39 45
Zero Carbon 62 68 77 76 79 82 80 8020 CO2 Red by 2040 Renewable 4 12 22 23 29 35 36 43
Zero Carbon 62 68 77 76 79 81 77 7940 CO2 Red by 2040 Renewable 4 12 22 23 29 36 40 49
Zero Carbon 62 68 77 76 79 82 81 8460 CO2 Red by 2040 Renewable 4 12 22 23 29 35 46 54
Zero Carbon 62 68 77 76 79 82 87 8980 CO2 Red by 2040 Renewable 4 12 24 25 31 39 53 59
Zero Carbon 62 68 80 79 81 86 93 9490 CO2 Red by 2040 Renewable 4 12 24 25 31 42 56 62
Zero Carbon 62 68 80 79 81 88 97 97100 CO2 Red by 2040 Renewable 4 12 22 23 29 44 62 67
Zero Carbon 62 68 78 77 79 90 100 100100 CO2 Red by 2040 (w H2) Renewable 4 12 25 26 32 45 56 62
Zero Carbon 62 68 81 80 83 91 100 100
Clean Energy ( of Load)
Portfolio Analysis Results612021
El Paso Electric IRP
Modeling Update
Arne Olson Senior PartnerJack Moore Director
Joe Hooker Senior Managing ConsultantHuai Jiang Senior Consultant
Manu Mogadali Senior ConsultantChen Zhang Consultant
Attachment D-2 E-3 June IRP Presentation Page 1 of 37
2Confidential Draft
Agenda
Assumption updates
Updated Reference Case results
High DSM sensitivity results
New Mexico REA Requirements
New Mexico REA Scenario Results
Attachment D-2 E-3 June IRP Presentation Page 2 of 37
Assumption Updates
Attachment D-2 E-3 June IRP Presentation Page 3 of 37
4Confidential Draft
Unit Lifetime Extensions
E3 modeled unit lifetime extensions for the following units that are currently scheduled to retire prior to 2030
In the modeling unit extensions for Rio Grande 7 and Newman 2 are not selected but the other unit extensions are
Resource Planned Retirement Year
Extension Period
Capital + Fixed OampM
(2021 $kW-yr)Rio Grande 7 2022 5 years $11373Newman 1 2022 5 years $7859Newman 2 2022 5 years $7998Newman 3 2026 5 years $5812Newman 4 2026 5 years $4744
Attachment D-2 E-3 June IRP Presentation Page 4 of 37
5Confidential Draft
Planning Reserve Margin
The modeling assumes a 2-day-in-10-year reliability standard for 2025 as a transition to the more common 1-day-in-10-year reliability standard starting in 2030
Under this PRM all generators count toward the PRM based on their effective load carrying capability (ELCC)
Metric 2025 2030+
Reliability TargetTwo days with outages
every ten years on average (02 LOLE)
One day with outages every ten years on average (01 LOLE)
Target PCAP PRM 101 129
LOLE = Loss-of-Load Expectation PCAP = Perfect Capacity
Attachment D-2 E-3 June IRP Presentation Page 5 of 37
Updated Reference Case
Results
Attachment D-2 E-3 June IRP Presentation Page 6 of 37
7Confidential Draft
Scenarios and Sensitivities
Run Note Presented Previously
Presented Today
Least-Cost (Reference Case) Least-cost optimization used as reference case for all sensitivities
Least-Cost Case + REA Resources Additional resources added to Least-Cost Case for New Mexico REA
Separate System Planning New Mexico system planned separately for purposes of satisfying REA
Low Load Growth 3-4 higher native system load forecast
High Load Growth 3-4 lower native system load forecast
High DG High DG forecast
High DSM More smart thermostats doubling of energy efficiency
No New Gas No new gas after Newman 6
No Lifetime Extensions All plants retire as scheduled
High Gas Price Gas prices 15 higher
Low Carbon Price $8 per metric ton of CO2 in 2010 rising at 25 per year
Medium Carbon Price $20 per metric ton of CO2 in 2010 rising at 25 per year
High Carbon Price $40 per metric ton of CO2 in 2010 rising at 25 per year
80 Clean by 2035 80 zero-carbon energy
20 CO2 Red by 2040 20 reduction in CO2 emissions
40 CO2 Red by 2040 40 reduction in CO2 emissions
60 CO2 Red by 2040 60 reduction in CO2 emissions
80 CO2 Red by 2040 80 reduction in CO2 emissions
90 CO2 Red by 2040 90 reduction in CO2 emissions
100 CO2 Red by 2040 100 reduction in CO2 emissions
100 CO2 Red by 2040 (w H2) 100 reduction in CO2 emissions with hydrogen
Attachment D-2 E-3 June IRP Presentation Page 7 of 37
8Confidential Draft
Reference Case Additions and
Retirements
Total net additions by 2040
Storage ~1100 MW
Solar ~1500 MW
Wind ~100 MW
Gas (45) MW
DR = demand response BTM Solar = behind-the-meter solar
Attachment D-2 E-3 June IRP Presentation Page 8 of 37
9Confidential Draft
Reference Case Total Capacity
Total system capacity increases through 2045
bull Gas capacity declines 2027-2035 and then rises
bull Solar and storage capacity increase significantly
bull Wind and demand response increase more modestly
DR = demand response BTM Solar = behind-the-meter solar
Attachment D-2 E-3 June IRP Presentation Page 9 of 37
10Confidential Draft
Reference Case Annual Generation
BTM Solar = behind-the-meter solar
The amount of zero-carbon generation
increases markedly above current levels
Attachment D-2 E-3 June IRP Presentation Page 10 of 37
11Confidential Draft
Reference Case Effective Capacity
Load growth and resource
retirements together result in a
growing capacity need over time
which is met by a combination of
renewables storage demand
response and gas resources
Effective capacity is the amount of capacity that can be counted towards the PRM
Attachment D-2 E-3 June IRP Presentation Page 11 of 37
High DSM Sensitivity Results
Attachment D-2 E-3 June IRP Presentation Page 12 of 37
13Confidential Draft
High DSM Sensitivity Assumptions
Smart Thermostats Energy Efficiency
Base 50MW by 2040
High 60MW by 2040
Base 65 of native system load in 2040
High 13 of native system load in 2040
An incremental ~800 GWh in 2040 Corresponds to ~90 MW of savings on average throughout the year
Attachment D-2 E-3 June IRP Presentation Page 13 of 37
14Confidential Draft
High DSM Scenario Results
Change in Capacity Generation Mix
Attachment D-2 E-3 June IRP Presentation Page 14 of 37
New Mexico REA Requirements
Attachment D-2 E-3 June IRP Presentation Page 15 of 37
16Confidential Draft
New Mexico Renewable Energy Act
There are key requirements in the statutory language setting renewable energy and zero carbon requirements in New Mexico (emphasis added)
ldquoA public utility shall meet the renewable portfolio standard requirements as provided in this section to include renewable energy in its electric energy supply portfolio as demonstrated by its retirement of renewable energy certificates provided that the associated renewable energy is delivered to the public utility and assigned to the public utilitys New Mexico customershellip
(5) no later than January 1 2040 renewable energy resources shall supply no less than eighty percent of all retail sales of electricity in New Mexico provided that compliance with this standard until December 31 2047 shall not require the public utility to displace zero carbon resources in the utilitys generation portfolio on the effective date of this 2019 act and
(6) no later than January 1 2045 zero carbon resources shall supply one hundred percent of all retail sales of
electricity in New Mexico Reasonable and consistent progress shall be made over time toward this requirementrdquo
The scenarios analyzed consider multiple approaches for REA implementationbull Share of NM load served with renewable energy given that El Paso Electric serves NM load with
greater than 20 non-renewable zero-carbon resources (ie Palo Verde)
bull Annual vs hourly balancing periods for 100 zero-carbon generation
bull Whether combustion resources may be utilized to ensure reliability for NM customers
Attachment D-2 E-3 June IRP Presentation Page 16 of 37
17Confidential Draft
New Mexico REA Requirements in 2040+
The REA requires 80 RPS by 2040 unless doing so would require displacing existing zero-carbon generation
New Mexicorsquos share of Palo Verde 1 and 2 supplies 31 of New Mexicorsquos retail sales in 2040 and 27 in 2045
For purposes of IRP modeling El Paso Electric has directed E3 to require New Mexico zero-carbon generation (renewables + nuclear) to equal or exceed 100 of New Mexico retail sales or load starting in 2040
New Mexico Nuclear Generation amp Load
Nuclear Generation
Retail Sales
Total Load
Attachment D-2 E-3 June IRP Presentation Page 17 of 37
18Confidential Draft
Two Approaches for Modeling Zero-Carbon
Generation Balancing
bull New Mexico-allocated zero-carbon resources must generate enough energy on an annual basis to match the REA NM retail sales target
bull Natural gas resources andor imports can serve New Mexicorsquos energy needs in some hours if that generation is offset by additional zero-carbon generation in other hours
bull Annual balancing allows New Mexico customers to reap the benefits of being served by a larger system
Annual Balancing
bull New Mexico cannot receive power from gas resources or unspecified imports in any hour
bull Zero-carbon generation from New Mexico-allocated resources must serve New Mexico energy demand in all hours of the year
bull This would be a more stringent zero-carbon requirement as it would not allow for balancing between New Mexico and Texas resources
Hourly Balancing
NM-Allocated Resources
NM customers can be served by gas resources
and unspecified imports if offset in other hours
NM-Allocated Resources
Other Resources
NM customers cannot be served by gas resources
or unspecified imports an any hour
Attachment D-2 E-3 June IRP Presentation Page 18 of 37
19Confidential Draft
Two Approaches for Modeling Capacity
Pooling to Ensure Reliability
bull For reliability planning purposes NM and TX loads can be served by NM resources TX resources andor system resources
bull If the NM jurisdiction doesnrsquot have enough resources to satisfy load in an hour then it can rely on TX resources and vice versa
bull NM and TX customers must still pay for enough resources to satisfy their share of system reliability needs
Capacity Pooling Allowed
bull For planning purposes TX and NM must each have enough resources to ensure reliability across a range of potential conditions without relying on the other jurisdiction (ie on a standalone basis)
bull This would be a more stringent planning approach NM would need to plan to have enough resources without falling back on TX gas resources in some hours
Capacity Pooling NOT Allowed
NM-Allocated Resources
TX-Allocated Resources
NM-Allocated Resources
TX-Allocated Resources
All resources together ensure
systemwide reliability across all hours
subject to the reliability standard
For planning purposes each jurisdiction
ensures reliability on its own across all
hours subject to the reliability standard
Attachment D-2 E-3 June IRP Presentation Page 19 of 37
20Confidential Draft
New Mexico REA Scenarios and
Jurisdictional Allocation
E3 modeled a few scenarios with different approaches for how to satisfy the REA requirementsbull Different approaches of the REA requirements have meaningful implications on how
planning is performed for New Mexico customersbull The more stringent approaches of the REA requirements will result in higher system
costs relative to less stringent approaches
bull To ensure equitable treatment of customers across jurisdictions any incremental costs of satisfying the REA requirements would be allocated to New Mexico customers
For each scenario resources and costs are allocated between the New Mexico and Texas jurisdictionsbull The allocation of resources follows directly from a particular approach to modeling
REA compliance If a particular approach requires more resources to be added versus the least-cost case then those resources are allocated to the New Mexico jurisdiction
bull Capacity generation and cost for the New Mexico jurisdiction are presented for each scenario
Attachment D-2 E-3 June IRP Presentation Page 20 of 37
21Confidential Draft
Least Cost(ldquoLCrdquo)
Least Cost + REA Resources
(ldquoLC+REArdquo)
Separate System Planning
(ldquoSSPrdquo)
Portfoliooptimization
Least-cost system optimization
Reoptimize Least Cost to add additional renewables amp storage dedicated to NM to satisfy REA requirements
Optimize NM and TX systems independently
without modeling interactions between them
NM zero-carbon generation balancing period
Annual Annual Hourly
NM and TX capacity pooling to ensure reliability
Resource allocationResources allocated
proportionally more RECs allocated to NM
Incremental resources are allocated to New Mexico
Optimization identifies resources specifically for NM and TX jurisdictions
NM allocated new gas capacity
New Mexico REA Scenarios
More stringent REA interpretation
Attachment D-2 E-3 June IRP Presentation Page 21 of 37
New Mexico REA Scenario
Results
Attachment D-2 E-3 June IRP Presentation Page 22 of 37
23Confidential Draft
Least Cost(ldquoLCrdquo)
Least Cost + ETA Resources
(ldquoLC+ETArdquo)
Separate System Planning
(ldquoSSPrdquo)
Portfoliooptimization
Least-cost system optimization
Reoptimize Least Cost to add additional renewables amp storage dedicated to NM to satisfy ETA requirements
Optimize NM and TX systems independently
without modeling interactions between them
NM zero-carbon generation balancing period
Annual Annual Hourly
NM and TX capacity pooling to ensure reliability
Resource allocationResources allocated
proportionally more RECs allocated to NM
Incremental resources are allocated to New Mexico
Optimization identifies resources specifically for NM and TX jurisdictions
NM allocated new gas capacity
New Mexico REA Scenarios
Attachment D-2 E-3 June IRP Presentation Page 23 of 37
24Confidential Draft
Resource Portfolios and Costs by ScenarioLeast Cost Scenario
Total System New Mexico
This scenario allocates a share of new gas capacity to NM customers This capacity could be converted to run on a higher share of hydrogen fuel in the future More RECs would be allocated to NM customers to satisfy the REA
112 MW of new gas capacity is allocated to New Mexico customers by 2040
This analysis does not assume Palo Verde 3 generation is allocated to New Mexico resulting in a lower zero-carbon generation share than the rest of the system
Attachment D-2 E-3 June IRP Presentation Page 24 of 37
25Confidential Draft
Least Cost(ldquoLCrdquo)
Least Cost + REA Resources
(ldquoLC+REArdquo)
Separate System Planning
(ldquoSSPrdquo)
Portfoliooptimization
Least-cost system optimization
Reoptimize Least Cost to add additional renewables amp storage dedicated to NM to satisfy REA requirements
Optimize NM and TX systems independently
without modeling interactions between them
NM zero-carbon generation balancing period
Annual Annual Hourly
NM and TX capacity pooling to ensure reliability
Resource allocationResources allocated
proportionally more RECs allocated to NM
Incremental resources are allocated to New Mexico
Optimization identifies resources specifically for NM and TX jurisdictions
NM allocated new gas capacity
New Mexico REA Scenarios
Attachment D-2 E-3 June IRP Presentation Page 25 of 37
26Confidential Draft
Resource Portfolios and Costs by ScenarioLeast Cost + REA Scenario
Total System New Mexico
This scenario adds more solar and storage capacity for NM customers to satisfy the RPSREA targets while not allocating any new gas to NM customers This results in a modest cost increase vs Least Cost scenario
Gas generation serves a portion of New Mexico customersrsquo energy needs in some hours but that is more than offset by
Attachment D-2 E-3 June IRP Presentation Page 26 of 37
27Confidential Draft
New Mexico REA Scenarios
Least Cost(ldquoLCrdquo)
Least Cost + REA Resources
(ldquoLC+REArdquo)
Separate System Planning
(ldquoSSPrdquo)
Portfoliooptimization
Least-cost system optimization
Reoptimize Least Cost to add additional renewables amp storage dedicated to NM to satisfy REA requirements
Optimize NM and TX systems independently
without modeling interactions between them
NM zero-carbon generation balancing period
Annual Annual Hourly
NM and TX capacity pooling to ensure reliability
Resource allocationResources allocated
proportionally more RECs allocated to NM
Incremental resources are allocated to New Mexico
Optimization identifies resources specifically for NM and TX jurisdictions
NM allocated new gas capacity
Attachment D-2 E-3 June IRP Presentation Page 27 of 37
28Confidential Draft
Resource Portfolios and Costs by ScenarioSeparate System Planning Scenario
Total System New Mexico
This scenario requires significantly more resources for New Mexico to reach 100 absolute zero carbon and ensure reliability This results in a significant cost increase relative to the Least Cost scenario
Attachment D-2 E-3 June IRP Presentation Page 28 of 37
29Confidential Draft
Resource Portfolios and Costs by ScenarioSeparate System Planning (H2) Scenario
Total System New Mexico
Adding H2 capacity ensures reliability while significantly reducing solar and storage additions This mitigates cost impacts of achieving absolute zero carbon and planning to ensure reliability independently
Attachment D-2 E-3 June IRP Presentation Page 29 of 37
30Confidential Draft
New Mexico Capacity and CostLeast Cost Scenario
Least Cost Cost Impact vs Least Cost Scenario
The Least Cost scenario is the baseline for comparison Least
Cost
Attachment D-2 E-3 June IRP Presentation Page 30 of 37
31Confidential Draft
New Mexico Capacity and CostLeast Cost + REA Resources Scenario
Least Cost + REA Resources Cost Impact vs Least Cost Scenario
Least Cost + REA Resources
Least Cost
Attachment D-2 E-3 June IRP Presentation Page 31 of 37
32Confidential Draft
New Mexico Capacity and CostSeparate System Planning Scenario
Separate System Planning Cost Impact vs Least Cost Scenario
Least Cost + REA Resources
Separate System Planning
Least Cost
Attachment D-2 E-3 June IRP Presentation Page 32 of 37
33Confidential Draft
New Mexico Capacity and CostSeparate System Planning (H2) Scenario
Separate System Planning (H2) Cost Impact vs Least Cost Scenario
Least Cost + REA Resources
Separate System Planning (H2)
Separate System Planning
Least Cost
Attachment D-2 E-3 June IRP Presentation Page 33 of 37
34Confidential Draft
New Mexico Generation MixLeast Cost and Least Cost + REA Scenarios
Least Cost Least Cost + REA Resources
Attachment D-2 E-3 June IRP Presentation Page 34 of 37
35Confidential Draft
New Mexico Generation MixSeparate System Planning Scenarios
Separate System Planning Separate System Planning (H2)
Attachment D-2 E-3 June IRP Presentation Page 35 of 37
36Confidential Draft
Carbon Emissions Across Scenarios
CO2 Emissions in 2021 and 2040 Average Abatement Cost 2025-2040
Note emissions include emissions at company-owned facilities and emissions ascribed to imports2040
Attachment D-2 E-3 June IRP Presentation Page 36 of 37
Thank You
Thank You
Attachment D-2 E-3 June IRP Presentation Page 37 of 37
Attachment D-3 E3 EPE Report Model Results AugustPage 1 of 34
Scenario Resource Type 2021 2024 2025 2027 2031 2035 2040 2045Least-Cost (Reference Case) Nuclear (Palo Verde) 5148 5148 5148 5148 5148 5148 5148 5148
Nuclear (SMR) - - - - - - - - Gas - Steam Turbine 140 34 8 7 1 - - - Gas - Combined Cycle 1767 1373 1037 1148 1187 1075 1321 1513 Gas - Combustion Turbine 1027 1169 854 925 874 767 1251 1657 Biomass - - - - - - - - Geothermal - - - - - - - - Wind - - 354 357 361 316 381 730 Solar 289 952 1450 1467 2016 3050 3469 4199 Battery Storage - 12 (25) (26) (104) (215) (223) (248) Imports 391 336 266 261 296 278 360 440 Demand Response - - - - - - - - Hydrogen - - - - - - - - BTM Solar 37 135 165 225 344 460 601 763 Load 8771 9155 9258 9512 10123 10878 12308 14203 Excess Generation 14 130 416 397 431 636 374 456
Least-Cost Case + REA Resources Nuclear (Palo Verde) 5148 5148 5148 5148 5148 5148 5148 5148 Nuclear (SMR) - - - - - - - - Gas - Steam Turbine 140 34 4 11 1 - - - Gas - Combined Cycle 1767 1373 926 1001 1044 927 966 1101 Gas - Combustion Turbine 1027 1169 784 855 780 495 761 1005 Biomass - - - - - - - - Geothermal - - - - - - - - Wind - - 681 694 699 561 725 995 Solar 289 952 1340 1356 2030 3274 4121 5334 Battery Storage - 12 (29) (30) (105) (236) (277) (369) Imports 391 336 239 251 182 248 262 226 Demand Response - - - - - - - - Hydrogen - - - - - - - - BTM Solar 37 135 165 225 344 460 601 763 Load 8771 9155 9258 9512 10123 10878 12308 14203 Excess Generation 14 130 428 400 449 1144 1071 892
Separate System Planning Nuclear (Palo Verde) 5148 5148 5148 5148 5148 5148 5148 5148 Nuclear (SMR) - - - - - - - - Gas - Steam Turbine 140 34 1 2 - - - - Gas - Combined Cycle 1763 1385 1125 1238 1235 1000 1201 1349 Gas - Combustion Turbine 1048 1180 852 922 920 502 768 1046 Biomass - - - - - - - - Geothermal - - - - - - - - Wind - - 174 175 169 76 23 398 Solar 289 950 1556 1594 2135 3760 4704 5638 Battery Storage - 11 (55) (62) (129) (300) (367) (423) Imports 391 328 291 269 301 232 229 283 Demand Response - - - - - - - - Hydrogen - - - - - - - - BTM Solar 37 135 165 225 344 460 601 763 Load 8771 9155 9258 9512 10123 10878 12308 14203 Excess Generation 14 132 304 265 365 1270 2517 2452
Annual Energy (GWh)
Attachment D-3 E3 EPE Report Model Results AugustPage 2 of 34
Scenario Resource Type 2021 2024 2025 2027 2031 2035 2040 2045Annual Energy (GWh)
Separate System Planning (w H2) Nuclear (Palo Verde) 5148 5148 5148 5148 5148 5148 5148 5148 Nuclear (SMR) - - - - - - - - Gas - Steam Turbine 140 34 1 2 - - - - Gas - Combined Cycle 1763 1385 1101 1210 1223 1104 1199 1348 Gas - Combustion Turbine 1048 1180 843 915 870 762 793 1072 Biomass - - - - - - - - Geothermal - - - - - - - - Wind - - 214 215 207 202 285 678 Solar 289 950 1551 1588 2173 3139 4241 5147 Battery Storage - 11 (54) (61) (130) (221) (311) (365) Imports 391 328 288 270 288 285 278 331 Demand Response - - - - - - - - Hydrogen - - - - - - 74 80 BTM Solar 37 135 165 225 344 460 601 763 Load 8771 9155 9258 9512 10123 10878 12308 14203 Excess Generation 14 132 314 276 474 696 883 967
80 Clean by 2035 Nuclear (Palo Verde) 5148 5148 5148 5148 5148 5148 5148 5148 Nuclear (SMR) - - - - - - - - Gas - Steam Turbine 140 34 8 11 1 - - - Gas - Combined Cycle 1767 1373 1028 1131 1175 1088 1160 1293 Gas - Combustion Turbine 1027 1169 849 922 868 767 1055 1256 Biomass - - - - - - - - Geothermal - - - - - - - - Wind - - 378 381 385 342 650 1041 Solar 289 953 1450 1463 2012 3006 3689 4703 Battery Storage - 12 (24) (26) (103) (207) (238) (289) Imports 391 336 255 256 292 274 241 287 Demand Response - - - - - - - - Hydrogen - - - - - - - - BTM Solar 37 135 165 225 344 460 601 763 Load 8771 9155 9258 9512 10123 10878 12308 14203 Excess Generation 14 130 406 391 436 677 472 735
20 CO2 Red by 2040 Nuclear (Palo Verde) 5148 5148 5148 5148 5148 5148 5148 5148 Nuclear (SMR) - - - - - - - - Gas - Steam Turbine 140 34 8 11 1 - - - Gas - Combined Cycle 1767 1373 1027 1131 1175 1089 1253 1260 Gas - Combustion Turbine 1027 1169 849 922 868 765 1132 1187 Biomass - - - - - - - - Geothermal - - - - - - - - Wind - - 378 381 385 342 457 1095 Solar 289 953 1442 1456 2012 3007 3621 4792 Battery Storage - 12 (24) (26) (103) (207) (236) (297) Imports 391 336 264 264 292 275 332 255 Demand Response - - - - - - - - Hydrogen - - - - - - - - BTM Solar 37 135 165 225 344 460 601 763 Load 8771 9155 9258 9512 10123 10878 12308 14203 Excess Generation 14 129 415 398 436 676 463 752
Attachment D-3 E3 EPE Report Model Results AugustPage 3 of 34
Scenario Resource Type 2021 2024 2025 2027 2031 2035 2040 2045Annual Energy (GWh)
40 CO2 Red by 2040 Nuclear (Palo Verde) 5148 5148 5148 5148 5148 5148 5148 5148 Nuclear (SMR) - - - - - - - - Gas - Steam Turbine 140 34 8 11 1 - - - Gas - Combined Cycle 1767 1373 1027 1131 1175 1089 1060 1028 Gas - Combustion Turbine 1027 1169 849 922 868 767 790 822 Biomass - - - - - - - - Geothermal - - - - - - - - Wind - - 378 381 385 342 783 961 Solar 289 953 1441 1458 2013 3004 3980 5677 Battery Storage - 12 (24) (26) (103) (207) (264) (396) Imports 391 336 264 262 292 276 210 199 Demand Response - - - - - - - - Hydrogen - - - - - - - - BTM Solar 37 135 165 225 344 460 601 763 Load 8771 9155 9258 9512 10123 10878 12308 14203 Excess Generation 14 130 415 396 435 680 811 1196
60 CO2 Red by 2040 Nuclear (Palo Verde) 5148 5148 5148 5148 5148 5148 5148 5148 Nuclear (SMR) - - - - - - - - Gas - Steam Turbine 140 34 7 12 1 - - - Gas - Combined Cycle 1767 1373 1001 1093 1143 1029 780 735 Gas - Combustion Turbine 1027 1169 840 915 852 656 453 483 Biomass - - - - - - - - Geothermal - - - - - - - - Wind - - 444 448 451 388 853 808 Solar 289 953 1419 1436 2000 3174 4624 6588 Battery Storage - 12 (25) (26) (101) (226) (312) (488) Imports 391 336 259 260 286 250 161 166 Demand Response - - - - - - - - Hydrogen - - - - - - - - BTM Solar 37 135 165 225 344 460 601 763 Load 8771 9155 9258 9512 10123 10878 12308 14203 Excess Generation 14 129 411 390 452 766 1514 1850
80 CO2 Red by 2040 Nuclear (Palo Verde) 5148 5148 5148 5148 5148 5148 5148 5148 Nuclear (SMR) - - - - - - - - Gas - Steam Turbine 140 34 4 11 1 - - - Gas - Combined Cycle 1767 1373 914 986 1049 835 531 500 Gas - Combustion Turbine 1027 1169 771 842 725 399 127 142 Biomass - - - - - - - - Geothermal - - - - - - - - Wind - - 722 735 743 584 1310 1417 Solar 289 953 1329 1343 2004 3491 4869 6658 Battery Storage - 12 (31) (30) (102) (245) (342) (499) Imports 391 336 235 251 212 208 63 73 Demand Response - - - - - - - - Hydrogen - - - - - - - - BTM Solar 37 135 165 225 344 460 601 763 Load 8771 9155 9258 9512 10123 10878 12308 14203 Excess Generation 14 130 444 417 491 1350 2580 2939
Attachment D-3 E3 EPE Report Model Results AugustPage 4 of 34
Scenario Resource Type 2021 2024 2025 2027 2031 2035 2040 2045Annual Energy (GWh)
90 CO2 Red by 2040 Nuclear (Palo Verde) 5148 5148 5148 5148 5148 5148 5148 5148 Nuclear (SMR) - - - - - - - - Gas - Steam Turbine 140 34 4 11 2 - - - Gas - Combined Cycle 1767 1373 908 979 1009 778 304 290 Gas - Combustion Turbine 1027 1169 766 836 622 291 29 44 Biomass - - - - - - - - Geothermal - - - - - - - - Wind - - 740 754 763 513 1964 2116 Solar 289 952 1325 1339 2154 3842 4535 6263 Battery Storage - 12 (31) (30) (100) (278) (308) (453) Imports 391 336 232 250 182 125 35 32 Demand Response - - - - - - - - Hydrogen - - - - - - - - BTM Solar 37 135 165 225 344 460 601 763 Load 8771 9155 9258 9512 10123 10878 12308 14203 Excess Generation 14 130 452 424 650 1462 3356 3714
100 CO2 Red by 2040 (w H2) Nuclear (Palo Verde) 5148 5148 5148 5148 5148 5148 5148 5148 Nuclear (SMR) - - - - - - - - Gas - Steam Turbine 140 34 5 7 2 - - - Gas - Combined Cycle 1767 1373 860 928 924 643 - - Gas - Combustion Turbine 1027 1169 715 779 558 188 - - Biomass - - - - - - - - Geothermal - - - - - - - - Wind - - 896 917 922 557 1629 1685 Solar 289 952 1284 1297 2175 4069 4874 6693 Battery Storage - 12 (31) (32) (97) (302) (345) (509) Imports 391 336 215 242 148 114 - - Demand Response - - - - - - - - Hydrogen - - - - - - 400 423 BTM Solar 37 135 165 225 344 460 601 763 Load 8771 9155 9258 9512 10123 10878 12308 14203 Excess Generation 14 130 528 495 798 1795 3187 3597
100 CO2 Red by 2040 Nuclear (Palo Verde) 5148 5148 5148 5148 5148 5148 5148 5148 Nuclear (SMR) - - - - - - - - Gas - Steam Turbine 140 34 7 12 2 - - - Gas - Combined Cycle 1767 1373 1013 1110 924 643 - - Gas - Combustion Turbine 1027 1169 843 917 558 188 - - Biomass - - - - - - - - Geothermal - - - - - - - - Wind - - 416 419 922 557 1992 2629 Solar 289 952 1430 1445 2175 4069 4973 5542 Battery Storage - 12 (25) (26) (97) (302) (406) (572) Imports 391 336 260 261 148 114 - - Demand Response - - - - - - - - Hydrogen - - - - - - - - BTM Solar 37 135 165 225 344 460 601 1455 Load 8771 9155 9258 9512 10123 10878 12308 14203 Excess Generation 14 130 412 393 798 1795 11640 13062
Attachment D-3 E3 EPE Report Model Results AugustPage 5 of 34
Scenario Resource Type 2021 2024 2025 2027 2031 2035 2040 2045Annual Energy (GWh)
High DG Nuclear (Palo Verde) 5148 5148 5148 5148 5148 5148 5148 5148 Nuclear (SMR) - - - - - - - - Gas - Steam Turbine 134 31 9 12 1 - - - Gas - Combined Cycle 1728 1317 1044 1144 1175 1073 1273 1538 Gas - Combustion Turbine 1028 1123 885 923 846 711 1096 1713 Biomass - - - - - - - - Geothermal - - - - - - - - Wind - - 338 336 341 295 352 763 Solar 285 866 1148 1107 1485 2336 2661 2700 Battery Storage - 11 (25) (25) (105) (226) (249) (243) Imports 389 314 273 258 287 265 347 441 Demand Response - - - - - - - - Hydrogen - - - - - - - - BTM Solar 88 350 436 608 945 1276 1680 2144 Load 8771 9155 9258 9512 10123 10878 12308 14203 Excess Generation 18 217 389 432 552 696 602 379
High DSM Nuclear (Palo Verde) 5148 5148 5148 5148 5148 5148 5148 5148 Nuclear (SMR) - - - - - - - - Gas - Steam Turbine 133 30 2 3 0 - - - Gas - Combined Cycle 1744 1303 1197 1315 1357 1105 1320 1460 Gas - Combustion Turbine 1020 1111 977 1001 989 706 1104 1404 Biomass - - - - - - - - Geothermal - - - - - - - - Wind - - - - - - - 471 Solar 288 934 1274 1273 1604 2760 3166 3725 Battery Storage - 10 (25) (23) (80) (203) (216) (234) Imports 390 329 318 286 318 297 377 438 Demand Response - - - - - - - - Hydrogen - - - - - - - - BTM Solar 37 135 165 225 344 460 601 763 Load 8731 8994 9056 9230 9680 10273 11501 13177 Excess Generation 15 148 197 197 215 541 326 371
Low Load Nuclear (Palo Verde) 5148 5148 5148 5148 5148 5148 5148 5148 Nuclear (SMR) - - - - - - - - Gas - Steam Turbine 101 27 2 3 2 - - - Gas - Combined Cycle 1596 1244 1155 1300 1422 1129 1372 1496 Gas - Combustion Turbine 983 1065 942 985 1034 759 1214 1529 Biomass - - - - - - - - Geothermal - - - - - - - - Wind - - - - - - - 523 Solar 282 919 1260 1272 1563 2869 3314 3970 Battery Storage - 8 (26) (24) (69) (209) (222) (246) Imports 381 325 311 284 315 303 385 440 Demand Response - - - - - - - - Hydrogen - - - - - - - - BTM Solar 37 135 165 225 344 460 601 763 Load 8492 8862 8958 9194 9759 10459 11813 13623 Excess Generation 22 163 216 205 224 535 317 399
Attachment D-3 E3 EPE Report Model Results AugustPage 6 of 34
Scenario Resource Type 2021 2024 2025 2027 2031 2035 2040 2045Annual Energy (GWh)
High Load Nuclear (Palo Verde) 5148 5148 5148 5148 5148 5148 5148 5148 Nuclear (SMR) - - - - - - - - Gas - Steam Turbine 195 50 7 3 - - - - Gas - Combined Cycle 1909 1522 1077 1166 1126 1113 1386 1518 Gas - Combustion Turbine 1088 1256 889 937 786 875 1409 1781 Biomass - - - - - - - - Geothermal - - - - - - - - Wind - - 420 424 404 387 450 957 Solar 293 983 1618 1717 2556 3249 3659 4426 Battery Storage - 14 (42) (64) (158) (220) (224) (251) Imports 400 343 275 273 281 286 373 440 Demand Response - - - - - - - - Hydrogen - - - - - - - - BTM Solar 37 135 165 225 344 460 601 763 Load 9050 9448 9558 9830 10488 11297 12803 14784 Excess Generation 10 100 381 278 543 642 387 518
No Lifetime Extensions Nuclear (Palo Verde) 5148 5148 5148 5148 5148 5148 5148 5148 Nuclear (SMR) - - - - - - - - Gas - Steam Turbine 140 34 12 2 - - - - Gas - Combined Cycle 1767 1373 972 1029 1055 1069 1314 1513 Gas - Combustion Turbine 1027 1169 744 693 636 764 1246 1657 Biomass - - - - - - - - Geothermal - - - - - - - - Wind - - 364 369 340 337 408 730 Solar 289 952 1643 1894 2495 3039 3457 4199 Battery Storage - 12 (26) (92) (164) (214) (223) (248) Imports 391 336 235 243 270 276 357 440 Demand Response - - - - - - - - Hydrogen - - - - - - - - BTM Solar 37 135 165 225 344 460 601 763 Load 8771 9155 9258 9512 10123 10878 12308 14203 Excess Generation 14 130 669 413 585 637 371 456
No New Gas Nuclear (Palo Verde) 5148 5148 5148 5148 5148 5148 5148 5148 Nuclear (SMR) - - - - - - - - Gas - Steam Turbine 140 34 7 12 1 - - - Gas - Combined Cycle 1767 1373 1013 1110 1156 829 774 714 Gas - Combustion Turbine 1027 1169 843 917 859 294 269 286 Biomass - - - - - - - - Geothermal - - - - - - - - Wind - - 416 419 423 227 195 209 Solar 289 952 1430 1445 2002 4003 5562 7483 Battery Storage - 12 (25) (26) (102) (320) (460) (623) Imports 391 336 260 261 293 237 219 223 Demand Response - - - - - - - - Hydrogen - - - - - - - - BTM Solar 37 135 165 225 344 460 601 763 Load 8771 9155 9258 9512 10123 10878 12308 14203 Excess Generation 14 130 412 393 449 1709 2222 2760
Attachment D-3 E3 EPE Report Model Results AugustPage 7 of 34
Scenario Resource Type 2021 2024 2025 2027 2031 2035 2040 2045Annual Energy (GWh)
Low Carbon Price Nuclear (Palo Verde) 5148 5148 5148 5148 5148 5148 5148 5148 Nuclear (SMR) - - - - - - - - Gas - Steam Turbine 127 23 4 5 1 - - - Gas - Combined Cycle 1803 1433 1000 1092 1104 988 1204 1335 Gas - Combustion Turbine 1001 1107 776 839 788 598 1076 1338 Biomass - - - - - - - - Geothermal - - - - - - - - Wind - - 562 571 569 479 581 943 Solar 289 958 1390 1406 1988 3174 3609 4556 Battery Storage - 11 (30) (29) (104) (228) (238) (278) Imports 394 345 242 255 285 258 326 397 Demand Response - - - - - - - - Hydrogen - - - - - - - - BTM Solar 37 135 165 225 344 460 601 763 Load 8771 9155 9258 9512 10123 10878 12308 14203 Excess Generation 14 125 403 379 473 835 521 718
Mid Carbon Price Nuclear (Palo Verde) 5148 5148 5148 5148 5148 5148 5148 5148 Nuclear (SMR) - - - - - - - - Gas - Steam Turbine 120 22 3 4 1 - - - Gas - Combined Cycle 1822 1496 923 994 1017 922 1107 1275 Gas - Combustion Turbine 983 1036 596 663 681 475 938 1205 Biomass - - - - - - - - Geothermal - - - - - - - - Wind - - 771 794 801 650 804 1099 Solar 290 961 1474 1493 2020 3264 3720 4732 Battery Storage - 7 (35) (36) (101) (230) (245) (291) Imports 399 354 212 227 211 190 235 273 Demand Response - - - - - - - - Hydrogen - - - - - - - - BTM Solar 37 135 165 225 344 460 601 763 Load 8771 9155 9258 9512 10123 10878 12308 14203 Excess Generation 13 121 615 574 500 912 572 727
High Carbon Price Nuclear (Palo Verde) 5148 5148 5148 5148 5148 5148 5148 5148 Nuclear (SMR) - - - - - - - - Gas - Steam Turbine 119 21 3 3 2 - - - Gas - Combined Cycle 1835 1540 704 778 913 873 962 863 Gas - Combustion Turbine 962 989 447 494 545 394 614 583 Biomass - - - - - - - - Geothermal - - - - - - - - Wind - - 881 916 965 778 930 859 Solar 290 963 1760 1782 2130 3267 4138 6248 Battery Storage - 2 (37) (36) (98) (230) (275) (458) Imports 408 362 187 203 174 188 189 195 Demand Response - - - - - - - - Hydrogen - - - - - - - - BTM Solar 37 135 165 225 344 460 601 763 Load 8771 9155 9258 9512 10123 10878 12308 14203 Excess Generation 13 120 1146 1089 774 1061 1077 1549
Attachment D-3 E3 EPE Report Model Results AugustPage 8 of 34
Scenario Resource Type 2021 2024 2025 2027 2031 2035 2040 2045Annual Energy (GWh)
High Gas Price Nuclear (Palo Verde) 5148 5148 5148 5148 5148 5148 5148 5148 Nuclear (SMR) - - - - - - - - Gas - Steam Turbine 125 31 6 5 1 - - - Gas - Combined Cycle 1787 1400 1015 1115 1125 1015 1242 1350 Gas - Combustion Turbine 1008 1120 803 853 805 627 1127 1365 Biomass - - - - - - - - Geothermal - - - - - - - - Wind - - 444 448 451 387 467 924 Solar 290 956 1419 1435 1998 3161 3603 4486 Battery Storage - 9 (29) (28) (103) (224) (235) (274) Imports 403 360 287 309 355 303 354 440 Demand Response - - - - - - - - Hydrogen - - - - - - - - BTM Solar 37 135 165 225 344 460 601 763 Load 8771 9155 9258 9512 10123 10878 12308 14203 Excess Generation 13 127 411 390 455 783 483 702
Low Renewable and Storage Costs Nuclear (Palo Verde) 5148 5148 5148 5148 5148 5148 5148 5148 Nuclear (SMR) - - - - - - - - Gas - Steam Turbine 140 34 3 6 1 - - - Gas - Combined Cycle 1767 1373 984 1068 1096 1000 1220 1278 Gas - Combustion Turbine 1027 1169 842 925 824 652 1127 1243 Biomass - - - - - - - - Geothermal - - - - - - - - Wind - - 558 564 559 474 578 1026 Solar 289 952 1321 1330 1975 3102 3538 4621 Battery Storage - 12 (29) (29) (102) (221) (232) (288) Imports 391 336 265 275 279 262 328 411 Demand Response - - - - - - - - Hydrogen - - - - - - - - BTM Solar 37 135 165 225 344 460 601 763 Load 8771 9155 9258 9512 10123 10878 12308 14203 Excess Generation 14 130 324 309 486 807 490 896
Attachment D-3 E3 EPE Report Model Results AugustPage 9 of 34
Scenario Resource TypeLeast-Cost (Reference Case) Nuclear (Palo Verde)
Nuclear (SMR)Gas - Steam TurbineGas - Combined CycleGas - Combustion TurbineBiomassGeothermalWindSolarBattery StorageImportsDemand ResponseHydrogenBTM SolarLoadExcess Generation
Least-Cost Case + REA Resources Nuclear (Palo Verde)Nuclear (SMR)Gas - Steam TurbineGas - Combined CycleGas - Combustion TurbineBiomassGeothermalWindSolarBattery StorageImportsDemand ResponseHydrogenBTM SolarLoadExcess Generation
Separate System Planning Nuclear (Palo Verde)Nuclear (SMR)Gas - Steam TurbineGas - Combined CycleGas - Combustion TurbineBiomassGeothermalWindSolarBattery StorageImportsDemand ResponseHydrogenBTM SolarLoadExcess Generation
2021 2024 2025 2027 2031 2035 2040 2045622 622 622 622 622 622 622 622 - - - - - - - - 426 307 307 307 234 - - - 493 493 493 493 493 266 266 266 503 731 731 731 668 870 1059 1216 - - - - - - - - - - - - - - - - - - 102 102 102 102 102 197 115 385 621 621 823 1235 1309 1561 - 50 177 177 488 1029 1129 1277 - - - - - - - - 46 53 56 61 71 81 93 93
- - - - - - - - 18 65 80 108 166 221 289 368
- - - - - - - - - - - - - - - - 622 622 622 622 622 622 622 622 - - - - - - - - 426 307 307 307 234 - - - 493 493 493 493 493 266 266 266 503 731 731 731 668 809 942 1051 - - - - - - - - - - - - - - - - - - 203 203 203 203 232 300 115 385 544 544 795 1414 1693 2037 - 50 176 177 460 1067 1246 1682 - - - - - - - - 46 53 56 61 71 81 93 93
- - - - - - - - 18 65 80 108 166 221 289 368
- - - - - - - - - - - - - - - - 622 622 622 622 622 622 622 622 - - - - - - - - 426 307 307 307 234 - - - 493 493 493 493 493 266 266 266 503 731 731 731 668 755 755 864 - - - - - - - - - - - - - - - - - - 49 49 49 49 49 161 115 385 639 639 859 1701 2450 2712 - 50 280 304 591 1514 2344 2674 - - - - - - - - 46 53 56 61 71 81 93 93
- - - - - - - - 18 65 80 108 166 221 289 368
- - - - - - - - - - - - - - - -
Installed Capacity (MW)
Attachment D-3 E3 EPE Report Model Results AugustPage 10 of 34
Scenario Resource TypeSeparate System Planning (w H2) Nuclear (Palo Verde)
Nuclear (SMR)Gas - Steam TurbineGas - Combined CycleGas - Combustion TurbineBiomassGeothermalWindSolarBattery StorageImportsDemand ResponseHydrogenBTM SolarLoadExcess Generation
80 Clean by 2035 Nuclear (Palo Verde)Nuclear (SMR)Gas - Steam TurbineGas - Combined CycleGas - Combustion TurbineBiomassGeothermalWindSolarBattery StorageImportsDemand ResponseHydrogenBTM SolarLoadExcess Generation
20 CO2 Red by 2040 Nuclear (Palo Verde)Nuclear (SMR)Gas - Steam TurbineGas - Combined CycleGas - Combustion TurbineBiomassGeothermalWindSolarBattery StorageImportsDemand ResponseHydrogenBTM SolarLoadExcess Generation
2021 2024 2025 2027 2031 2035 2040 2045Installed Capacity (MW)
622 622 622 622 622 622 622 622 - - - - - - - - 426 307 307 307 234 - - - 493 493 493 493 493 266 266 266 503 731 731 731 668 755 755 864 - - - - - - - - - - - - - - - - - - 60 60 60 60 107 218 115 385 638 638 905 1312 1724 2031 - 50 278 303 570 1057 1496 1797 - - - - - - - - 46 53 56 61 71 81 93 93
- - - - - 123 206 212 18 65 80 108 166 221 289 368
- - - - - - - - - - - - - - - - 622 622 622 622 622 622 622 622 - - - - - - - - 426 307 307 307 234 - - - 493 493 493 493 493 266 266 266 503 731 731 731 668 910 1022 1149 - - - - - - - - - - - - - - - - - - 109 109 109 109 185 289 115 385 615 615 821 1233 1383 1799 - 50 177 177 486 968 1145 1327 - - - - - - - - 46 53 56 61 71 81 93 93
- - - - - - - - 18 65 80 108 166 221 289 368
- - - - - - - - - - - - - - - - 622 622 622 622 622 622 622 622 - - - - - - - - 426 307 307 307 234 - - - 493 493 493 493 493 266 266 266 503 731 731 731 668 910 1036 1138 - - - - - - - - - - - - - - - - - - 109 109 109 109 125 300 115 385 615 615 821 1233 1383 1837 - 50 177 177 486 968 1145 1359 - - - - - - - - 46 53 56 61 71 81 93 93
- - - - - - - - 18 65 80 108 166 221 289 368
- - - - - - - - - - - - - - - -
Attachment D-3 E3 EPE Report Model Results AugustPage 11 of 34
Scenario Resource Type40 CO2 Red by 2040 Nuclear (Palo Verde)
Nuclear (SMR)Gas - Steam TurbineGas - Combined CycleGas - Combustion TurbineBiomassGeothermalWindSolarBattery StorageImportsDemand ResponseHydrogenBTM SolarLoadExcess Generation
60 CO2 Red by 2040 Nuclear (Palo Verde)Nuclear (SMR)Gas - Steam TurbineGas - Combined CycleGas - Combustion TurbineBiomassGeothermalWindSolarBattery StorageImportsDemand ResponseHydrogenBTM SolarLoadExcess Generation
80 CO2 Red by 2040 Nuclear (Palo Verde)Nuclear (SMR)Gas - Steam TurbineGas - Combined CycleGas - Combustion TurbineBiomassGeothermalWindSolarBattery StorageImportsDemand ResponseHydrogenBTM SolarLoadExcess Generation
2021 2024 2025 2027 2031 2035 2040 2045Installed Capacity (MW)
622 622 622 622 622 622 622 622 - - - - - - - - 426 307 307 307 234 - - - 493 493 493 493 493 266 266 266 503 731 731 731 668 909 973 1022 - - - - - - - - - - - - - - - - - - 109 109 109 109 239 300 115 385 615 615 821 1234 1563 2248 - 50 177 177 486 969 1184 1746 - - - - - - - - 46 53 56 61 71 81 93 93
- - - - - - - - 18 65 80 108 166 221 289 368
- - - - - - - - - - - - - - - - 622 622 622 622 622 622 622 622 - - - - - - - - 426 307 307 307 234 - - - 493 493 493 493 493 266 266 266 503 731 731 731 668 849 892 897 - - - - - - - - - - - - - - - - - - 128 128 128 128 301 302 115 385 599 599 816 1309 1965 2744 - 50 177 177 481 1044 1347 2145 - - - - - - - - 46 53 56 61 71 81 93 93
- - - - - - - - 18 65 80 108 166 221 289 368
- - - - - - - - - - - - - - - - 622 622 622 622 622 622 622 622 - - - - - - - - 426 307 307 307 234 - - - 493 493 493 493 493 266 266 266 503 731 731 731 668 778 778 778 - - - - - - - - - - - - - - - - - - 217 217 217 217 552 585 115 385 538 538 793 1555 2257 3007 - 50 176 177 458 1097 1645 2461 - - - - - - - - 46 53 56 61 71 81 93 93
- - - - - - - - 18 65 80 108 166 221 289 368
- - - - - - - - - - - - - - - -
Attachment D-3 E3 EPE Report Model Results AugustPage 12 of 34
Scenario Resource Type90 CO2 Red by 2040 Nuclear (Palo Verde)
Nuclear (SMR)Gas - Steam TurbineGas - Combined CycleGas - Combustion TurbineBiomassGeothermalWindSolarBattery StorageImportsDemand ResponseHydrogenBTM SolarLoadExcess Generation
100 CO2 Red by 2040 (w H2) Nuclear (Palo Verde)Nuclear (SMR)Gas - Steam TurbineGas - Combined CycleGas - Combustion TurbineBiomassGeothermalWindSolarBattery StorageImportsDemand ResponseHydrogenBTM SolarLoadExcess Generation
100 CO2 Red by 2040 Nuclear (Palo Verde)Nuclear (SMR)Gas - Steam TurbineGas - Combined CycleGas - Combustion TurbineBiomassGeothermalWindSolarBattery StorageImportsDemand ResponseHydrogenBTM SolarLoadExcess Generation
2021 2024 2025 2027 2031 2035 2040 2045Installed Capacity (MW)
622 622 622 622 622 622 622 622 - - - - - - - - 426 307 307 307 234 - - - 493 493 493 493 493 266 266 266 503 731 731 731 668 726 726 726 - - - - - - - - - - - - - - - - - - 224 224 224 224 801 828 115 385 535 535 901 1679 2300 3049 - 50 176 177 452 1284 1777 2595 - - - - - - - - 46 53 56 61 71 81 93 93
- - - - - - - - 18 65 80 108 166 221 289 368
- - - - - - - - - - - - - - - - 622 622 622 622 622 622 622 622 - - - - - - - - 426 307 307 307 234 - - - 493 493 493 493 493 266 - - 503 731 731 731 668 688 - - - - - - - - - - - - - - - - - - - - 282 282 282 282 682 696 115 385 512 512 925 1801 2403 3178 - 50 176 177 445 1385 1955 2797 - - - - - - - - 46 53 56 61 71 81 93 93
- - - - - - 954 954 18 65 80 108 166 221 289 368
- - - - - - - - - - - - - - - - 622 622 622 622 622 622 622 622 - - - - - - - - 426 307 307 307 234 - - - 493 493 493 493 493 266 266 266 503 731 731 731 668 688 668 668 - - - - - - - - - - - - - - - - - - 120 120 282 282 1216 1605 115 385 606 606 925 1801 4851 5217 - 50 177 177 445 1385 6191 7470 - - - - - - - - 46 53 56 61 71 81 93 93
- - - - - - - - 18 65 80 108 166 221 289 701
- - - - - - - - - - - - - - - -
Attachment D-3 E3 EPE Report Model Results AugustPage 13 of 34
Scenario Resource TypeHigh DG Nuclear (Palo Verde)
Nuclear (SMR)Gas - Steam TurbineGas - Combined CycleGas - Combustion TurbineBiomassGeothermalWindSolarBattery StorageImportsDemand ResponseHydrogenBTM SolarLoadExcess Generation
High DSM Nuclear (Palo Verde)Nuclear (SMR)Gas - Steam TurbineGas - Combined CycleGas - Combustion TurbineBiomassGeothermalWindSolarBattery StorageImportsDemand ResponseHydrogenBTM SolarLoadExcess Generation
Low Load Nuclear (Palo Verde)Nuclear (SMR)Gas - Steam TurbineGas - Combined CycleGas - Combustion TurbineBiomassGeothermalWindSolarBattery StorageImportsDemand ResponseHydrogenBTM SolarLoadExcess Generation
2021 2024 2025 2027 2031 2035 2040 2045Installed Capacity (MW)
622 622 622 622 622 622 622 622 - - - - - - - - 426 307 307 307 234 - - - 493 493 493 493 493 266 266 266 503 731 731 731 668 860 1026 1228 - - - - - - - - - - - - - - - - - - 96 96 96 96 96 203 115 385 511 511 684 1010 1107 1018 - 50 176 176 479 1041 1166 1263 - - - - - - - - 46 53 56 61 71 81 93 93
- - - - - - - - 42 169 210 293 455 614 809 1032
- - - - - - - - - - - - - - - - 622 622 622 622 622 622 622 622 - - - - - - - - 426 307 307 307 234 - - - 493 493 493 493 493 266 266 266 503 731 731 731 668 778 942 1058 - - - - - - - - - - - - - - - - - - - - - - - 128 115 385 519 519 638 1149 1212 1386 - 50 184 184 406 1001 1091 1213 - - - - - - - - 49 66 71 82 100 101 103 103
- - - - - - - - 18 65 80 108 166 221 289 368
- - - - - - - - - - - - - - - - 622 622 622 622 622 622 622 622 - - - - - - - - 426 307 307 307 234 - - - 493 493 493 493 493 266 266 266 503 731 731 731 668 724 896 1019 - - - - - - - - - - - - - - - - - - - - - - - 141 115 385 521 521 628 1185 1261 1477 - 50 186 186 355 1019 1121 1262 - - - - - - - - 46 53 56 61 71 81 93 93
- - - - - - - - 18 65 80 108 166 221 289 368
- - - - - - - - - - - - - - - -
Attachment D-3 E3 EPE Report Model Results AugustPage 14 of 34
Scenario Resource TypeHigh Load Nuclear (Palo Verde)
Nuclear (SMR)Gas - Steam TurbineGas - Combined CycleGas - Combustion TurbineBiomassGeothermalWindSolarBattery StorageImportsDemand ResponseHydrogenBTM SolarLoadExcess Generation
No Lifetime Extensions Nuclear (Palo Verde)Nuclear (SMR)Gas - Steam TurbineGas - Combined CycleGas - Combustion TurbineBiomassGeothermalWindSolarBattery StorageImportsDemand ResponseHydrogenBTM SolarLoadExcess Generation
No New Gas Nuclear (Palo Verde)Nuclear (SMR)Gas - Steam TurbineGas - Combined CycleGas - Combustion TurbineBiomassGeothermalWindSolarBattery StorageImportsDemand ResponseHydrogenBTM SolarLoadExcess Generation
2021 2024 2025 2027 2031 2035 2040 2045Installed Capacity (MW)
622 622 622 622 622 622 622 622 - - - - - - - - 426 307 307 307 234 - - - 493 493 493 493 493 266 266 266 503 731 731 731 668 1043 1247 1411 - - - - - - - - - - - - - - - - - - 119 119 119 119 119 260 115 385 662 662 1040 1304 1377 1643 - 50 235 327 708 1042 1142 1292 - - - - - - - - 46 53 56 61 71 81 93 93
- - - - - - - - 18 65 80 108 166 221 289 368
- - - - - - - - - - - - - - - - 622 622 622 622 622 622 622 622 - - - - - - - - 426 234 234 144 144 - - - 493 493 493 266 266 266 266 266 503 731 731 829 766 869 1058 1216 - - - - - - - - - - - - - - - - - - 109 109 109 109 109 197 115 385 767 767 1027 1229 1302 1561 - 50 183 432 756 1027 1128 1277 - - - - - - - - 46 53 56 61 71 81 93 93
- - - - - - - - 18 65 80 108 166 221 289 368
- - - - - - - - - - - - - - - - 622 622 622 622 622 622 622 622 - - - - - - - - 426 307 307 307 234 - - - 493 493 493 493 493 266 266 266 503 731 731 731 668 668 668 668 - - - - - - - - - - - - - - - - - - 120 120 120 120 120 132 115 385 606 606 818 1876 2580 3422 - 50 177 177 483 1585 2342 3200 - - - - - - - - 46 53 56 61 71 81 93 93
- - - - - - - - 18 65 80 108 166 221 289 368
- - - - - - - - - - - - - - - -
Attachment D-3 E3 EPE Report Model Results AugustPage 15 of 34
Scenario Resource TypeLow Carbon Price Nuclear (Palo Verde)
Nuclear (SMR)Gas - Steam TurbineGas - Combined CycleGas - Combustion TurbineBiomassGeothermalWindSolarBattery StorageImportsDemand ResponseHydrogenBTM SolarLoadExcess Generation
Mid Carbon Price Nuclear (Palo Verde)Nuclear (SMR)Gas - Steam TurbineGas - Combined CycleGas - Combustion TurbineBiomassGeothermalWindSolarBattery StorageImportsDemand ResponseHydrogenBTM SolarLoadExcess Generation
High Carbon Price Nuclear (Palo Verde)Nuclear (SMR)Gas - Steam TurbineGas - Combined CycleGas - Combustion TurbineBiomassGeothermalWindSolarBattery StorageImportsDemand ResponseHydrogenBTM SolarLoadExcess Generation
2021 2024 2025 2027 2031 2035 2040 2045Installed Capacity (MW)
622 622 622 622 622 622 622 622 - - - - - - - - 426 307 307 307 234 - - - 493 493 493 493 493 266 266 266 503 731 731 731 668 840 1027 1164 - - - - - - - - - - - - - - - - - - 163 163 163 163 163 269 115 385 573 573 805 1309 1383 1738 - 50 176 176 470 1044 1145 1314 - - - - - - - - 46 53 56 61 71 81 93 93
- - - - - - - - 18 65 80 108 166 221 289 368
- - - - - - - - - - - - - - - - 622 622 622 622 622 622 622 622 - - - - - - - - 426 307 307 307 234 - - - 493 493 493 493 493 266 266 266 503 731 731 731 668 824 1006 1145 - - - - - - - - - - - - - - - - - - 238 238 238 238 238 300 115 385 633 633 791 1310 1400 1808 - 50 176 176 456 1045 1149 1334 - - - - - - - - 46 53 56 61 71 81 93 93
- - - - - - - - 18 65 80 108 166 221 289 368
- - - - - - - - - - - - - - - - 622 622 622 622 622 622 622 622 - - - - - - - - 426 307 307 307 234 - - - 493 493 493 493 493 266 266 266 503 731 731 731 668 817 944 944 - - - - - - - - - - - - - - - - - - 300 300 300 300 300 301 115 385 857 857 886 1310 1666 2536 - 50 176 176 445 1045 1206 2000 - - - - - - - - 46 53 56 61 71 81 93 93
- - - - - - - - 18 65 80 108 166 221 289 368
- - - - - - - - - - - - - - - -
Attachment D-3 E3 EPE Report Model Results AugustPage 16 of 34
Scenario Resource TypeHigh Gas Price Nuclear (Palo Verde)
Nuclear (SMR)Gas - Steam TurbineGas - Combined CycleGas - Combustion TurbineBiomassGeothermalWindSolarBattery StorageImportsDemand ResponseHydrogenBTM SolarLoadExcess Generation
Low Renewable and Storage Costs Nuclear (Palo Verde)Nuclear (SMR)Gas - Steam TurbineGas - Combined CycleGas - Combustion TurbineBiomassGeothermalWindSolarBattery StorageImportsDemand ResponseHydrogenBTM SolarLoadExcess Generation
2021 2024 2025 2027 2031 2035 2040 2045Installed Capacity (MW)
622 622 622 622 622 622 622 622 - - - - - - - - 426 307 307 307 234 - - - 493 493 493 493 493 266 266 266 503 731 731 731 668 848 1036 1170 - - - - - - - - - - - - - - - - - - 128 128 128 128 128 264 115 385 599 599 816 1309 1383 1710 - 50 177 177 481 1044 1145 1309 - - - - - - - - 46 53 56 61 71 81 93 93
- - - - - - - - 18 65 80 108 166 221 289 368
- - - - - - - - - - - - - - - - 622 622 622 622 622 622 622 622 - - - - - - - - 426 307 307 307 234 - - - 493 493 493 493 493 266 266 266 503 731 731 731 668 847 1034 1146 - - - - - - - - - - - - - - - - - - 160 160 160 160 160 300 115 385 525 525 806 1277 1351 1805 - 50 190 190 471 1037 1138 1335 - - - - - - - - 46 53 56 61 71 81 93 93
- - - - - - - - 18 65 80 108 166 221 289 368
- - - - - - - - - - - - - - - -
Attachment D-3 E3 EPE Report Model Results AugustPage 17 of 34
Scenario Resource TypeLeast-Cost (Reference Case) Nuclear (Palo Verde)
Nuclear (SMR)Gas - Steam TurbineGas - Combined CycleGas - Combustion TurbineBiomassGeothermalWindSolarBattery StorageImportsDemand ResponseHydrogenBTM SolarLoadExcess Generation
Least-Cost Case + REA Resources Nuclear (Palo Verde)Nuclear (SMR)Gas - Steam TurbineGas - Combined CycleGas - Combustion TurbineBiomassGeothermalWindSolarBattery StorageImportsDemand ResponseHydrogenBTM SolarLoadExcess Generation
Separate System Planning Nuclear (Palo Verde)Nuclear (SMR)Gas - Steam TurbineGas - Combined CycleGas - Combustion TurbineBiomassGeothermalWindSolarBattery StorageImportsDemand ResponseHydrogenBTM SolarLoadExcess Generation
2021 2024 2025 2027 2031 2035 2040 2045- - - - - - - - - - - - - - - - - - - - - - - - - - - - - - - - - 228 228 228 228 430 619 776 - - - - - - - - - - - - - - - - - - 102 102 102 102 102 197 - 270 506 506 708 1190 1291 1823 - 50 177 177 488 1029 1129 1327 - - - - - - - - 46 53 56 61 71 81 93 93
- - - - - - - - 18 65 80 108 166 221 289 368
- - - - - - - - - - - - - - - - - - - - - - - - - - - - - - - - - - - - - - - - - - - - - - - - - 228 228 228 228 369 502 611 - - - - - - - - - - - - - - - - - - 203 203 203 203 232 300 - 270 429 429 680 1369 1675 2299 - 50 176 177 460 1067 1246 1732 - - - - - - - - 46 53 56 61 71 81 93 93
- - - - - - - - 18 65 80 108 166 221 289 368
- - - - - - - - - - - - - - - - - - - - - - - - - - - - - - - - - - - - - - - - - - - - - - - - - 228 228 228 228 315 315 424 - - - - - - - - - - - - - - - - - - 49 49 49 49 49 161 - 270 524 524 744 1656 2432 2974 - 50 280 304 591 1514 2344 2724 - - - - - - - - 46 53 56 61 71 81 93 93
- - - - - - - - 18 65 80 108 166 221 289 368
- - - - - - - - - - - - - - - -
Cumulative Capacity Additions (MW)
Attachment D-3 E3 EPE Report Model Results AugustPage 18 of 34
Scenario Resource TypeSeparate System Planning (w H2) Nuclear (Palo Verde)
Nuclear (SMR)Gas - Steam TurbineGas - Combined CycleGas - Combustion TurbineBiomassGeothermalWindSolarBattery StorageImportsDemand ResponseHydrogenBTM SolarLoadExcess Generation
80 Clean by 2035 Nuclear (Palo Verde)Nuclear (SMR)Gas - Steam TurbineGas - Combined CycleGas - Combustion TurbineBiomassGeothermalWindSolarBattery StorageImportsDemand ResponseHydrogenBTM SolarLoadExcess Generation
20 CO2 Red by 2040 Nuclear (Palo Verde)Nuclear (SMR)Gas - Steam TurbineGas - Combined CycleGas - Combustion TurbineBiomassGeothermalWindSolarBattery StorageImportsDemand ResponseHydrogenBTM SolarLoadExcess Generation
2021 2024 2025 2027 2031 2035 2040 2045Cumulative Capacity Additions (MW)
- - - - - - - - - - - - - - - - - - - - - - - - - - - - - - - - - 228 228 228 228 315 315 424 - - - - - - - - - - - - - - - - - - 60 60 60 60 107 218 - 270 523 523 790 1267 1706 2293 - 50 278 303 570 1057 1496 1847 - - - - - - - - 46 53 56 61 71 81 93 93
- - - - - 123 206 212 18 65 80 108 166 221 289 368
- - - - - - - - - - - - - - - - - - - - - - - - - - - - - - - - - - - - - - - - - - - - - - - - - 228 228 228 228 470 582 709 - - - - - - - - - - - - - - - - - - 109 109 109 109 185 289 - 270 500 500 706 1188 1365 2061 - 50 177 177 486 968 1145 1377 - - - - - - - - 46 53 56 61 71 81 93 93
- - - - - - - - 18 65 80 108 166 221 289 368
- - - - - - - - - - - - - - - - - - - - - - - - - - - - - - - - - - - - - - - - - - - - - - - - - 228 228 228 228 470 596 698 - - - - - - - - - - - - - - - - - - 109 109 109 109 125 300 - 270 500 500 706 1188 1365 2099 - 50 177 177 486 968 1145 1409 - - - - - - - - 46 53 56 61 71 81 93 93
- - - - - - - - 18 65 80 108 166 221 289 368
- - - - - - - - - - - - - - - -
Attachment D-3 E3 EPE Report Model Results AugustPage 19 of 34
Scenario Resource Type40 CO2 Red by 2040 Nuclear (Palo Verde)
Nuclear (SMR)Gas - Steam TurbineGas - Combined CycleGas - Combustion TurbineBiomassGeothermalWindSolarBattery StorageImportsDemand ResponseHydrogenBTM SolarLoadExcess Generation
60 CO2 Red by 2040 Nuclear (Palo Verde)Nuclear (SMR)Gas - Steam TurbineGas - Combined CycleGas - Combustion TurbineBiomassGeothermalWindSolarBattery StorageImportsDemand ResponseHydrogenBTM SolarLoadExcess Generation
80 CO2 Red by 2040 Nuclear (Palo Verde)Nuclear (SMR)Gas - Steam TurbineGas - Combined CycleGas - Combustion TurbineBiomassGeothermalWindSolarBattery StorageImportsDemand ResponseHydrogenBTM SolarLoadExcess Generation
2021 2024 2025 2027 2031 2035 2040 2045Cumulative Capacity Additions (MW)
- - - - - - - - - - - - - - - - - - - - - - - - - - - - - - - - - 228 228 228 228 469 533 582 - - - - - - - - - - - - - - - - - - 109 109 109 109 239 300 - 270 500 500 706 1189 1545 2510 - 50 177 177 486 969 1184 1796 - - - - - - - - 46 53 56 61 71 81 93 93
- - - - - - - - 18 65 80 108 166 221 289 368
- - - - - - - - - - - - - - - - - - - - - - - - - - - - - - - - - - - - - - - - - - - - - - - - - 228 228 228 228 409 452 457 - - - - - - - - - - - - - - - - - - 128 128 128 128 301 302 - 270 484 484 701 1264 1947 3006 - 50 177 177 481 1044 1347 2195 - - - - - - - - 46 53 56 61 71 81 93 93
- - - - - - - - 18 65 80 108 166 221 289 368
- - - - - - - - - - - - - - - - - - - - - - - - - - - - - - - - - - - - - - - - - - - - - - - - - 228 228 228 228 338 338 338 - - - - - - - - - - - - - - - - - - 217 217 217 217 552 585 - 270 423 423 678 1510 2239 3269 - 50 176 177 458 1097 1645 2511 - - - - - - - - 46 53 56 61 71 81 93 93
- - - - - - - - 18 65 80 108 166 221 289 368
- - - - - - - - - - - - - - - -
Attachment D-3 E3 EPE Report Model Results AugustPage 20 of 34
Scenario Resource Type90 CO2 Red by 2040 Nuclear (Palo Verde)
Nuclear (SMR)Gas - Steam TurbineGas - Combined CycleGas - Combustion TurbineBiomassGeothermalWindSolarBattery StorageImportsDemand ResponseHydrogenBTM SolarLoadExcess Generation
100 CO2 Red by 2040 (w H2) Nuclear (Palo Verde)Nuclear (SMR)Gas - Steam TurbineGas - Combined CycleGas - Combustion TurbineBiomassGeothermalWindSolarBattery StorageImportsDemand ResponseHydrogenBTM SolarLoadExcess Generation
100 CO2 Red by 2040 Nuclear (Palo Verde)Nuclear (SMR)Gas - Steam TurbineGas - Combined CycleGas - Combustion TurbineBiomassGeothermalWindSolarBattery StorageImportsDemand ResponseHydrogenBTM SolarLoadExcess Generation
2021 2024 2025 2027 2031 2035 2040 2045Cumulative Capacity Additions (MW)
- - - - - - - - - - - - - - - - - - - - - - - - - - - - - - - - - 228 228 228 228 286 286 286 - - - - - - - - - - - - - - - - - - 224 224 224 224 801 828 - 270 420 420 786 1634 2282 3311 - 50 176 177 452 1284 1777 2645 - - - - - - - - 46 53 56 61 71 81 93 93
- - - - - - - - 18 65 80 108 166 221 289 368
- - - - - - - - - - - - - - - - - - - - - - - - - - - - - - - - - - - - - - - - - - - - - - - - - 228 228 228 228 248 - - - - - - - - - - - - - - - - - - - - 282 282 282 282 682 696 - 270 397 397 810 1756 2385 3440 - 50 176 177 445 1385 1955 2847 - - - - - - - - 46 53 56 61 71 81 93 93
- - - - - - 248 248 18 65 80 108 166 221 289 368
- - - - - - - - - - - - - - - - - - - - - - - - - - - - - - - - - - - - - - - - - - - - - - - - - 228 228 228 228 248 228 228 - - - - - - - - - - - - - - - - - - 120 120 282 282 1216 1605 - 270 491 491 810 1756 4833 5479 - 50 177 177 445 1385 6191 7520 - - - - - - - - 46 53 56 61 71 81 93 93
- - - - - - - - 18 65 80 108 166 221 289 701
- - - - - - - - - - - - - - - -
Attachment D-3 E3 EPE Report Model Results AugustPage 21 of 34
Scenario Resource TypeHigh DG Nuclear (Palo Verde)
Nuclear (SMR)Gas - Steam TurbineGas - Combined CycleGas - Combustion TurbineBiomassGeothermalWindSolarBattery StorageImportsDemand ResponseHydrogenBTM SolarLoadExcess Generation
High DSM Nuclear (Palo Verde)Nuclear (SMR)Gas - Steam TurbineGas - Combined CycleGas - Combustion TurbineBiomassGeothermalWindSolarBattery StorageImportsDemand ResponseHydrogenBTM SolarLoadExcess Generation
Low Load Nuclear (Palo Verde)Nuclear (SMR)Gas - Steam TurbineGas - Combined CycleGas - Combustion TurbineBiomassGeothermalWindSolarBattery StorageImportsDemand ResponseHydrogenBTM SolarLoadExcess Generation
2021 2024 2025 2027 2031 2035 2040 2045Cumulative Capacity Additions (MW)
- - - - - - - - - - - - - - - - - - - - - - - - - - - - - - - - - 228 228 228 228 420 586 788 - - - - - - - - - - - - - - - - - - 96 96 96 96 96 203 - 270 396 396 569 965 1089 1280 - 50 176 176 479 1041 1166 1313 - - - - - - - - 46 53 56 61 71 81 93 93
- - - - - - - - 42 169 210 293 455 614 809 1032
- - - - - - - - - - - - - - - - - - - - - - - - - - - - - - - - - - - - - - - - - - - - - - - - - 228 228 228 228 338 502 618 - - - - - - - - - - - - - - - - - - - - - - - 128 - 270 404 404 523 1104 1194 1648 - 50 184 184 406 1001 1091 1263 - - - - - - - - 49 66 71 82 100 101 103 103
- - - - - - - - 18 65 80 108 166 221 289 368
- - - - - - - - - - - - - - - - - - - - - - - - - - - - - - - - - - - - - - - - - - - - - - - - - 228 228 228 228 284 456 579 - - - - - - - - - - - - - - - - - - - - - - - 141 - 270 406 406 513 1140 1243 1739 - 50 186 186 355 1019 1121 1312 - - - - - - - - 46 53 56 61 71 81 93 93
- - - - - - - - 18 65 80 108 166 221 289 368
- - - - - - - - - - - - - - - -
Attachment D-3 E3 EPE Report Model Results AugustPage 22 of 34
Scenario Resource TypeHigh Load Nuclear (Palo Verde)
Nuclear (SMR)Gas - Steam TurbineGas - Combined CycleGas - Combustion TurbineBiomassGeothermalWindSolarBattery StorageImportsDemand ResponseHydrogenBTM SolarLoadExcess Generation
No Lifetime Extensions Nuclear (Palo Verde)Nuclear (SMR)Gas - Steam TurbineGas - Combined CycleGas - Combustion TurbineBiomassGeothermalWindSolarBattery StorageImportsDemand ResponseHydrogenBTM SolarLoadExcess Generation
No New Gas Nuclear (Palo Verde)Nuclear (SMR)Gas - Steam TurbineGas - Combined CycleGas - Combustion TurbineBiomassGeothermalWindSolarBattery StorageImportsDemand ResponseHydrogenBTM SolarLoadExcess Generation
2021 2024 2025 2027 2031 2035 2040 2045Cumulative Capacity Additions (MW)
- - - - - - - - - - - - - - - - - - - - - - - - - - - - - - - - - 228 228 228 228 603 807 971 - - - - - - - - - - - - - - - - - - 119 119 119 119 119 260 - 270 547 547 925 1259 1359 1905 - 50 235 327 708 1042 1142 1342 - - - - - - - - 46 53 56 61 71 81 93 93
- - - - - - - - 18 65 80 108 166 221 289 368
- - - - - - - - - - - - - - - - - - - - - - - - - - - - - - - - - - - - - - - - - - - - - - - - - 228 228 326 326 429 618 776 - - - - - - - - - - - - - - - - - - 109 109 109 109 109 197 - 270 652 652 912 1184 1284 1823 - 50 183 432 756 1027 1128 1327 - - - - - - - - 46 53 56 61 71 81 93 93
- - - - - - - - 18 65 80 108 166 221 289 368
- - - - - - - - - - - - - - - - - - - - - - - - - - - - - - - - - - - - - - - - - - - - - - - - - 228 228 228 228 228 228 228 - - - - - - - - - - - - - - - - - - 120 120 120 120 120 132 - 270 491 491 703 1831 2562 3684 - 50 177 177 483 1585 2342 3250 - - - - - - - - 46 53 56 61 71 81 93 93
- - - - - - - - 18 65 80 108 166 221 289 368
- - - - - - - - - - - - - - - -
Attachment D-3 E3 EPE Report Model Results AugustPage 23 of 34
Scenario Resource TypeLow Carbon Price Nuclear (Palo Verde)
Nuclear (SMR)Gas - Steam TurbineGas - Combined CycleGas - Combustion TurbineBiomassGeothermalWindSolarBattery StorageImportsDemand ResponseHydrogenBTM SolarLoadExcess Generation
Mid Carbon Price Nuclear (Palo Verde)Nuclear (SMR)Gas - Steam TurbineGas - Combined CycleGas - Combustion TurbineBiomassGeothermalWindSolarBattery StorageImportsDemand ResponseHydrogenBTM SolarLoadExcess Generation
High Carbon Price Nuclear (Palo Verde)Nuclear (SMR)Gas - Steam TurbineGas - Combined CycleGas - Combustion TurbineBiomassGeothermalWindSolarBattery StorageImportsDemand ResponseHydrogenBTM SolarLoadExcess Generation
2021 2024 2025 2027 2031 2035 2040 2045Cumulative Capacity Additions (MW)
- - - - - - - - - - - - - - - - - - - - - - - - - - - - - - - - - 228 228 228 228 400 587 724 - - - - - - - - - - - - - - - - - - 163 163 163 163 163 269 - 270 458 458 690 1264 1365 2000 - 50 176 176 470 1044 1145 1364 - - - - - - - - 46 53 56 61 71 81 93 93
- - - - - - - - 18 65 80 108 166 221 289 368
- - - - - - - - - - - - - - - - - - - - - - - - - - - - - - - - - - - - - - - - - - - - - - - - - 228 228 228 228 384 566 705 - - - - - - - - - - - - - - - - - - 238 238 238 238 238 300 - 270 518 518 676 1265 1382 2070 - 50 176 176 456 1045 1149 1384 - - - - - - - - 46 53 56 61 71 81 93 93
- - - - - - - - 18 65 80 108 166 221 289 368
- - - - - - - - - - - - - - - - - - - - - - - - - - - - - - - - - - - - - - - - - - - - - - - - - 228 228 228 228 377 504 504 - - - - - - - - - - - - - - - - - - 300 300 300 300 300 301 - 270 742 742 771 1265 1648 2798 - 50 176 176 445 1045 1206 2050 - - - - - - - - 46 53 56 61 71 81 93 93
- - - - - - - - 18 65 80 108 166 221 289 368
- - - - - - - - - - - - - - - -
Attachment D-3 E3 EPE Report Model Results AugustPage 24 of 34
Scenario Resource TypeHigh Gas Price Nuclear (Palo Verde)
Nuclear (SMR)Gas - Steam TurbineGas - Combined CycleGas - Combustion TurbineBiomassGeothermalWindSolarBattery StorageImportsDemand ResponseHydrogenBTM SolarLoadExcess Generation
Low Renewable and Storage Costs Nuclear (Palo Verde)Nuclear (SMR)Gas - Steam TurbineGas - Combined CycleGas - Combustion TurbineBiomassGeothermalWindSolarBattery StorageImportsDemand ResponseHydrogenBTM SolarLoadExcess Generation
2021 2024 2025 2027 2031 2035 2040 2045Cumulative Capacity Additions (MW)
- - - - - - - - - - - - - - - - - - - - - - - - - - - - - - - - - 228 228 228 228 408 596 730 - - - - - - - - - - - - - - - - - - 128 128 128 128 128 264 - 270 484 484 701 1264 1365 1972 - 50 177 177 481 1044 1145 1359 - - - - - - - - 46 53 56 61 71 81 93 93
- - - - - - - - 18 65 80 108 166 221 289 368
- - - - - - - - - - - - - - - - - - - - - - - - - - - - - - - - - - - - - - - - - - - - - - - - - 228 228 228 228 407 594 706 - - - - - - - - - - - - - - - - - - 160 160 160 160 160 300 - 270 410 410 691 1232 1333 2067 - 50 190 190 471 1037 1138 1385 - - - - - - - - 46 53 56 61 71 81 93 93
- - - - - - - - 18 65 80 108 166 221 289 368
- - - - - - - - - - - - - - - -
Attachment D-3 E3 EPE Report Model Results AugustPage 25 of 34
Scenario Resource TypeLeast-Cost (Reference Case) Nuclear (Palo Verde)
Nuclear (SMR)Gas - Steam TurbineGas - Combined CycleGas - Combustion TurbineBiomassGeothermalWindSolarBattery StorageImportsDemand ResponseHydrogenBTM SolarLoadExcess Generation
Least-Cost Case + REA Resources Nuclear (Palo Verde)Nuclear (SMR)Gas - Steam TurbineGas - Combined CycleGas - Combustion TurbineBiomassGeothermalWindSolarBattery StorageImportsDemand ResponseHydrogenBTM SolarLoadExcess Generation
Separate System Planning Nuclear (Palo Verde)Nuclear (SMR)Gas - Steam TurbineGas - Combined CycleGas - Combustion TurbineBiomassGeothermalWindSolarBattery StorageImportsDemand ResponseHydrogenBTM SolarLoadExcess Generation
2021 2024 2025 2027 2031 2035 2040 2045- - - - - - - - - - - - - - - - - (119) (119) (119) (192) (426) (426) (426) - - - - - (227) (227) (227) - - - - (63) (63) (63) (63) - - - - - - - - - - - - - - - - - - - - - - - - - - - - - (70) (97) (377) - - - - - - - (50) - - - - - - - - - - - - - - - - - - - - - - - - - - - - - - - - - - - - - - - - - - - - - - - - - - - - - - - - - - - - - - - - - (119) (119) (119) (192) (426) (426) (426) - - - - - (227) (227) (227) - - - - (63) (63) (63) (63) - - - - - - - - - - - - - - - - - - - - - - - - - - - - - (70) (97) (377) - - - - - - - (50) - - - - - - - - - - - - - - - - - - - - - - - - - - - - - - - - - - - - - - - - - - - - - - - - - - - - - - - - - - - - - - - - - (119) (119) (119) (192) (426) (426) (426) - - - - - (227) (227) (227) - - - - (63) (63) (63) (63) - - - - - - - - - - - - - - - - - - - - - - - - - - - - - (70) (97) (377) - - - - - - - (50) - - - - - - - - - - - - - - - - - - - - - - - - - - - - - - - - - - - - - - - - - - - - - - - -
Cumulative Capacity Retirements (MW)
Attachment D-3 E3 EPE Report Model Results AugustPage 26 of 34
Scenario Resource TypeSeparate System Planning (w H2) Nuclear (Palo Verde)
Nuclear (SMR)Gas - Steam TurbineGas - Combined CycleGas - Combustion TurbineBiomassGeothermalWindSolarBattery StorageImportsDemand ResponseHydrogenBTM SolarLoadExcess Generation
80 Clean by 2035 Nuclear (Palo Verde)Nuclear (SMR)Gas - Steam TurbineGas - Combined CycleGas - Combustion TurbineBiomassGeothermalWindSolarBattery StorageImportsDemand ResponseHydrogenBTM SolarLoadExcess Generation
20 CO2 Red by 2040 Nuclear (Palo Verde)Nuclear (SMR)Gas - Steam TurbineGas - Combined CycleGas - Combustion TurbineBiomassGeothermalWindSolarBattery StorageImportsDemand ResponseHydrogenBTM SolarLoadExcess Generation
2021 2024 2025 2027 2031 2035 2040 2045Cumulative Capacity Retirements (MW)
- - - - - - - - - - - - - - - - - (119) (119) (119) (192) (426) (426) (426) - - - - - (227) (227) (227) - - - - (63) (63) (63) (63) - - - - - - - - - - - - - - - - - - - - - - - - - - - - - (70) (97) (377) - - - - - - - (50) - - - - - - - - - - - - - - - - - - - - - - - - - - - - - - - - - - - - - - - - - - - - - - - - - - - - - - - - - - - - - - - - - (119) (119) (119) (192) (426) (426) (426) - - - - - (227) (227) (227) - - - - (63) (63) (63) (63) - - - - - - - - - - - - - - - - - - - - - - - - - - - - - (70) (97) (377) - - - - - - - (50) - - - - - - - - - - - - - - - - - - - - - - - - - - - - - - - - - - - - - - - - - - - - - - - - - - - - - - - - - - - - - - - - - (119) (119) (119) (192) (426) (426) (426) - - - - - (227) (227) (227) - - - - (63) (63) (63) (63) - - - - - - - - - - - - - - - - - - - - - - - - - - - - - (70) (97) (377) - - - - - - - (50) - - - - - - - - - - - - - - - - - - - - - - - - - - - - - - - - - - - - - - - - - - - - - - - -
Attachment D-3 E3 EPE Report Model Results AugustPage 27 of 34
Scenario Resource Type40 CO2 Red by 2040 Nuclear (Palo Verde)
Nuclear (SMR)Gas - Steam TurbineGas - Combined CycleGas - Combustion TurbineBiomassGeothermalWindSolarBattery StorageImportsDemand ResponseHydrogenBTM SolarLoadExcess Generation
60 CO2 Red by 2040 Nuclear (Palo Verde)Nuclear (SMR)Gas - Steam TurbineGas - Combined CycleGas - Combustion TurbineBiomassGeothermalWindSolarBattery StorageImportsDemand ResponseHydrogenBTM SolarLoadExcess Generation
80 CO2 Red by 2040 Nuclear (Palo Verde)Nuclear (SMR)Gas - Steam TurbineGas - Combined CycleGas - Combustion TurbineBiomassGeothermalWindSolarBattery StorageImportsDemand ResponseHydrogenBTM SolarLoadExcess Generation
2021 2024 2025 2027 2031 2035 2040 2045Cumulative Capacity Retirements (MW)
- - - - - - - - - - - - - - - - - (119) (119) (119) (192) (426) (426) (426) - - - - - (227) (227) (227) - - - - (63) (63) (63) (63) - - - - - - - -- - - - - - - -- - - - - - - -- - - - - (70) (97) (377) - - - - - - - (50) - - - - - - - -- - - - - - - -- - - - - - - -- - - - - - - -- - - - - - - -- - - - - - - -- - - - - - - -- - - - - - - -- (119) (119) (119) (192) (426) (426) (426) - - - - - (227) (227) (227) - - - - (63) (63) (63) (63) - - - - - - - -- - - - - - - -- - - - - - - -- - - - - (70) (97) (377) - - - - - - - (50) - - - - - - - -- - - - - - - -- - - - - - - -- - - - - - - -- - - - - - - -- - - - - - - -- - - - - - - -- - - - - - - -- (119) (119) (119) (192) (426) (426) (426) - - - - - (227) (227) (227) - - - - (63) (63) (63) (63) - - - - - - - -- - - - - - - -- - - - - - - -- - - - - (70) (97) (377) - - - - - - - (50) - - - - - - - -- - - - - - - -- - - - - - - -- - - - - - - -- - - - - - - -- - - - - - - -
Attachment D-3 E3 EPE Report Model Results AugustPage 28 of 34
Scenario Resource Type90 CO2 Red by 2040 Nuclear (Palo Verde)
Nuclear (SMR)Gas - Steam TurbineGas - Combined CycleGas - Combustion TurbineBiomassGeothermalWindSolarBattery StorageImportsDemand ResponseHydrogenBTM SolarLoadExcess Generation
100 CO2 Red by 2040 (w H2) Nuclear (Palo Verde)Nuclear (SMR)Gas - Steam TurbineGas - Combined CycleGas - Combustion TurbineBiomassGeothermalWindSolarBattery StorageImportsDemand ResponseHydrogenBTM SolarLoadExcess Generation
100 CO2 Red by 2040 Nuclear (Palo Verde)Nuclear (SMR)Gas - Steam TurbineGas - Combined CycleGas - Combustion TurbineBiomassGeothermalWindSolarBattery StorageImportsDemand ResponseHydrogenBTM SolarLoadExcess Generation
2021 2024 2025 2027 2031 2035 2040 2045Cumulative Capacity Retirements (MW)
- - - - - - - - - - - - - - - - - (119) (119) (119) (192) (426) (426) (426) - - - - - (227) (227) (227) - - - - (63) (63) (63) (63) - - - - - - - - - - - - - - - - - - - - - - - - - - - - - (70) (97) (377) - - - - - - - (50) - - - - - - - - - - - - - - - - - - - - - - - - - - - - - - - - - - - - - - - - - - - - - - - - - - - - - - - - - - - - - - - - - (119) (119) (119) (192) (426) (426) (426) - - - - - (227) (227) (227) - - - - (63) (63) (63) (63) - - - - - - - - - - - - - - - - - - - - - - - - - - - - - (70) (97) (377) - - - - - - - (50) - - - - - - - - - - - - - - - - - - - - - - - - - - - - - - - - - - - - - - - - - - - - - - - - - - - - - - - - - - - - - - - - - (119) (119) (119) (192) (426) (426) (426) - - - - - (227) (227) (227) - - - - (63) (63) (63) (63) - - - - - - - - - - - - - - - - - - - - - - - - - - - - - (70) (97) (377) - - - - - - - (50) - - - - - - - - - - - - - - - - - - - - - - - - - - - - - - - - - - - - - - - - - - - - - - - -
Attachment D-3 E3 EPE Report Model Results AugustPage 29 of 34
Scenario Resource TypeHigh DG Nuclear (Palo Verde)
Nuclear (SMR)Gas - Steam TurbineGas - Combined CycleGas - Combustion TurbineBiomassGeothermalWindSolarBattery StorageImportsDemand ResponseHydrogenBTM SolarLoadExcess Generation
High DSM Nuclear (Palo Verde)Nuclear (SMR)Gas - Steam TurbineGas - Combined CycleGas - Combustion TurbineBiomassGeothermalWindSolarBattery StorageImportsDemand ResponseHydrogenBTM SolarLoadExcess Generation
Low Load Nuclear (Palo Verde)Nuclear (SMR)Gas - Steam TurbineGas - Combined CycleGas - Combustion TurbineBiomassGeothermalWindSolarBattery StorageImportsDemand ResponseHydrogenBTM SolarLoadExcess Generation
2021 2024 2025 2027 2031 2035 2040 2045Cumulative Capacity Retirements (MW)
- - - - - - - - - - - - - - - - - (119) (119) (119) (192) (426) (426) (426) - - - - - (227) (227) (227) - - - - (63) (63) (63) (63) - - - - - - - - - - - - - - - - - - - - - - - - - - - - - (70) (97) (377) - - - - - - - (50) - - - - - - - - - - - - - - - - - - - - - - - - - - - - - - - - - - - - - - - - - - - - - - - - - - - - - - - - - - - - - - - - - (119) (119) (119) (192) (426) (426) (426) - - - - - (227) (227) (227) - - - - (63) (63) (63) (63) - - - - - - - - - - - - - - - - - - - - - - - - - - - - - (70) (97) (377) - - - - - - - (50) - - - - - - - - - - - - - - - - - - - - - - - - - - - - - - - - - - - - - - - - - - - - - - - - - - - - - - - - - - - - - - - - - (119) (119) (119) (192) (426) (426) (426) - - - - - (227) (227) (227) - - - - (63) (63) (63) (63) - - - - - - - - - - - - - - - - - - - - - - - - - - - - - (70) (97) (377) - - - - - - - (50) - - - - - - - - - - - - - - - - - - - - - - - - - - - - - - - - - - - - - - - - - - - - - - - -
Attachment D-3 E3 EPE Report Model Results AugustPage 30 of 34
Scenario Resource TypeHigh Load Nuclear (Palo Verde)
Nuclear (SMR)Gas - Steam TurbineGas - Combined CycleGas - Combustion TurbineBiomassGeothermalWindSolarBattery StorageImportsDemand ResponseHydrogenBTM SolarLoadExcess Generation
No Lifetime Extensions Nuclear (Palo Verde)Nuclear (SMR)Gas - Steam TurbineGas - Combined CycleGas - Combustion TurbineBiomassGeothermalWindSolarBattery StorageImportsDemand ResponseHydrogenBTM SolarLoadExcess Generation
No New Gas Nuclear (Palo Verde)Nuclear (SMR)Gas - Steam TurbineGas - Combined CycleGas - Combustion TurbineBiomassGeothermalWindSolarBattery StorageImportsDemand ResponseHydrogenBTM SolarLoadExcess Generation
2021 2024 2025 2027 2031 2035 2040 2045Cumulative Capacity Retirements (MW)
- - - - - - - - - - - - - - - - - (119) (119) (119) (192) (426) (426) (426) - - - - - (227) (227) (227) - - - - (63) (63) (63) (63) - - - - - - - - - - - - - - - - - - - - - - - - - - - - - (70) (97) (377) - - - - - - - (50) - - - - - - - - - - - - - - - - - - - - - - - - - - - - - - - - - - - - - - - - - - - - - - - - - - - - - - - - - - - - - - - - - (192) (192) (282) (282) (426) (426) (426) - - - (227) (227) (227) (227) (227) - - - - (63) (63) (63) (63) - - - - - - - - - - - - - - - - - - - - - - - - - - - - - (70) (97) (377) - - - - - - - (50) - - - - - - - - - - - - - - - - - - - - - - - - - - - - - - - - - - - - - - - - - - - - - - - - - - - - - - - - - - - - - - - - - (119) (119) (119) (192) (426) (426) (426) - - - - - (227) (227) (227) - - - - (63) (63) (63) (63) - - - - - - - - - - - - - - - - - - - - - - - - - - - - - (70) (97) (377) - - - - - - - (50) - - - - - - - - - - - - - - - - - - - - - - - - - - - - - - - - - - - - - - - - - - - - - - - -
Attachment D-3 E3 EPE Report Model Results AugustPage 31 of 34
Scenario Resource TypeLow Carbon Price Nuclear (Palo Verde)
Nuclear (SMR)Gas - Steam TurbineGas - Combined CycleGas - Combustion TurbineBiomassGeothermalWindSolarBattery StorageImportsDemand ResponseHydrogenBTM SolarLoadExcess Generation
Mid Carbon Price Nuclear (Palo Verde)Nuclear (SMR)Gas - Steam TurbineGas - Combined CycleGas - Combustion TurbineBiomassGeothermalWindSolarBattery StorageImportsDemand ResponseHydrogenBTM SolarLoadExcess Generation
High Carbon Price Nuclear (Palo Verde)Nuclear (SMR)Gas - Steam TurbineGas - Combined CycleGas - Combustion TurbineBiomassGeothermalWindSolarBattery StorageImportsDemand ResponseHydrogenBTM SolarLoadExcess Generation
2021 2024 2025 2027 2031 2035 2040 2045Cumulative Capacity Retirements (MW)
- - - - - - - - - - - - - - - - - (119) (119) (119) (192) (426) (426) (426) - - - - - (227) (227) (227) - - - - (63) (63) (63) (63) - - - - - - - - - - - - - - - - - - - - - - - - - - - - - (70) (97) (377) - - - - - - - (50) - - - - - - - - - - - - - - - - - - - - - - - - - - - - - - - - - - - - - - - - - - - - - - - - - - - - - - - - - - - - - - - - - (119) (119) (119) (192) (426) (426) (426) - - - - - (227) (227) (227) - - - - (63) (63) (63) (63) - - - - - - - - - - - - - - - - - - - - - - - - - - - - - (70) (97) (377) - - - - - - - (50) - - - - - - - - - - - - - - - - - - - - - - - - - - - - - - - - - - - - - - - - - - - - - - - - - - - - - - - - - - - - - - - - - (119) (119) (119) (192) (426) (426) (426) - - - - - (227) (227) (227) - - - - (63) (63) (63) (63) - - - - - - - - - - - - - - - - - - - - - - - - - - - - - (70) (97) (377) - - - - - - - (50) - - - - - - - - - - - - - - - - - - - - - - - - - - - - - - - - - - - - - - - - - - - - - - - -
Attachment D-3 E3 EPE Report Model Results AugustPage 32 of 34
Scenario Resource TypeHigh Gas Price Nuclear (Palo Verde)
Nuclear (SMR)Gas - Steam TurbineGas - Combined CycleGas - Combustion TurbineBiomassGeothermalWindSolarBattery StorageImportsDemand ResponseHydrogenBTM SolarLoadExcess Generation
Low Renewable and Storage Costs Nuclear (Palo Verde)Nuclear (SMR)Gas - Steam TurbineGas - Combined CycleGas - Combustion TurbineBiomassGeothermalWindSolarBattery StorageImportsDemand ResponseHydrogenBTM SolarLoadExcess Generation
2021 2024 2025 2027 2031 2035 2040 2045Cumulative Capacity Retirements (MW)
- - - - - - - - - - - - - - - - - (119) (119) (119) (192) (426) (426) (426) - - - - - (227) (227) (227) - - - - (63) (63) (63) (63) - - - - - - - - - - - - - - - - - - - - - - - - - - - - - (70) (97) (377) - - - - - - - (50) - - - - - - - - - - - - - - - - - - - - - - - - - - - - - - - - - - - - - - - - - - - - - - - - - - - - - - - - - - - - - - - - - (119) (119) (119) (192) (426) (426) (426) - - - - - (227) (227) (227) - - - - (63) (63) (63) (63) - - - - - - - - - - - - - - - - - - - - - - - - - - - - - (70) (97) (377) - - - - - - - (50) - - - - - - - - - - - - - - - - - - - - - - - - - - - - - - - - - - - - - - - - - - - - - - - -
Attachment D-3 E3 EPE Report Model Results AugustPage 33 of 34
Scenario 2021 2024 2025 2027 2031 2035 2040 2045Least-Cost (Reference Case) 246$ 233$ 245$ 262$ 284$ 340$ 402$ 498$ Least-Cost Case + REA Resources 246$ 233$ 247$ 262$ 285$ 343$ 406$ 506$ Separate System Planning 247$ 233$ 250$ 268$ 293$ 369$ 473$ 571$ Separate System Planning (w H2) 247$ 233$ 251$ 268$ 293$ 348$ 438$ 536$ 80 Clean by 2035 246$ 233$ 245$ 262$ 284$ 342$ 402$ 498$ 20 CO2 Red by 2040 246$ 233$ 245$ 262$ 284$ 342$ 402$ 499$ 40 CO2 Red by 2040 246$ 233$ 245$ 262$ 284$ 342$ 405$ 512$ 60 CO2 Red by 2040 246$ 233$ 246$ 262$ 284$ 341$ 419$ 531$ 80 CO2 Red by 2040 246$ 233$ 247$ 262$ 284$ 347$ 463$ 577$ 90 CO2 Red by 2040 246$ 233$ 247$ 263$ 287$ 357$ 500$ 615$ 100 CO2 Red by 2040 (w H2) 246$ 233$ 249$ 264$ 289$ 367$ 551$ 663$ 100 CO2 Red by 2040 246$ 233$ 245$ 262$ 289$ 367$ 1113$ 1282$ High DG 245$ 231$ 241$ 256$ 277$ 325$ 382$ 470$ High DSM 245$ 230$ 239$ 254$ 271$ 313$ 367$ 450$ Low Load 239$ 227$ 236$ 252$ 269$ 312$ 371$ 460$ High Load 253$ 239$ 255$ 276$ 307$ 374$ 441$ 540$ No Lifetime Extensions 246$ 228$ 243$ 266$ 298$ 344$ 406$ 502$ No New Gas 246$ 233$ 245$ 262$ 284$ 367$ 453$ 570$ Low Carbon Price 291$ 277$ 284$ 301$ 323$ 379$ 444$ 543$ Mid Carbon Price 358$ 341$ 341$ 358$ 381$ 436$ 505$ 611$ High Carbon Price 469$ 449$ 432$ 451$ 475$ 529$ 603$ 718$ High Gas Price 257$ 242$ 251$ 268$ 291$ 347$ 412$ 509$ Low Renewable and Storage Costs 246$ 233$ 240$ 256$ 274$ 321$ 379$ 463$
Annual Revenue Requirement ($MM)
Attachment D-3 E3 EPE Report Model Results AugustPage 34 of 34
Scenario Clean Energy Type 2021 2024 2025 2027 2031 2035 2040 2045Least-Cost (Reference Case) Renewable 4 12 21 21 27 34 36 39
Zero Carbon 62 68 77 75 77 81 77 75Least-Cost Case + REA Resources Renewable 4 12 24 24 30 39 43 49
Zero Carbon 62 68 79 78 80 85 84 84Separate System Planning Renewable 4 12 20 21 26 38 42 46
Zero Carbon 62 68 76 75 76 84 83 82Separate System Planning (w H2) Renewable 4 12 21 21 27 34 41 45
Zero Carbon 62 68 76 75 77 81 82 8180 Clean by 2035 Renewable 4 12 21 22 27 34 39 45
Zero Carbon 62 68 77 76 77 81 80 8020 CO2 Red by 2040 Renewable 4 12 21 22 27 34 37 46
Zero Carbon 62 68 77 76 77 81 78 8140 CO2 Red by 2040 Renewable 4 12 21 22 27 34 43 51
Zero Carbon 62 68 77 76 77 81 84 8660 CO2 Red by 2040 Renewable 4 12 22 22 27 36 48 56
Zero Carbon 62 68 77 76 78 83 89 9180 CO2 Red by 2040 Renewable 4 12 24 24 30 41 54 60
Zero Carbon 62 68 79 78 81 87 94 9590 CO2 Red by 2040 Renewable 4 12 24 24 32 43 56 62
Zero Carbon 62 68 79 78 82 89 97 98100 CO2 Red by 2040 (w H2) Renewable 4 12 25 26 34 45 56 62
Zero Carbon 62 68 81 79 84 92 100 100100 CO2 Red by 2040 Renewable 4 12 22 22 34 45 60 65
Zero Carbon 62 68 77 76 84 92 100 100High DG Renewable 4 13 21 22 27 35 37 39
Zero Carbon 63 70 76 75 77 82 78 74High DSM Renewable 4 12 16 16 20 31 32 37
Zero Carbon 63 69 73 72 73 80 76 75Low Load Renewable 4 12 16 16 19 31 33 38
Zero Carbon 64 70 73 72 72 79 75 75High Load Renewable 4 12 23 24 31 36 36 41
Zero Carbon 61 66 77 76 79 80 76 75No Lifetime Extensions Renewable 4 12 23 26 31 35 36 39
Zero Carbon 62 68 79 80 81 81 77 75No New Gas Renewable 4 12 22 22 27 42 50 57
Zero Carbon 62 68 77 76 77 88 90 92Low Carbon Price Renewable 4 12 23 23 28 37 38 43
Zero Carbon 62 68 78 77 79 83 79 79Mid Carbon Price Renewable 4 12 26 26 31 39 41 45
Zero Carbon 62 68 81 80 81 86 82 81High Carbon Price Renewable 4 12 30 31 34 41 45 54
Zero Carbon 62 68 86 85 84 87 86 89High Gas Price Renewable 4 12 22 22 27 36 37 43
Zero Carbon 62 68 77 76 78 82 78 78Low Renewable and Storage Costs Renewable 4 12 22 22 28 36 38 44
Zero Carbon 62 68 77 76 78 83 79 80
Clean Energy ( of Load)
BEFORE THE NEW MEXICO PUBLIC REGULATION COMMISSION
RULE 1773 NMAC FILING
EL PASO ELECTRIC COMPANY NOTICE OF 2021 INTEGRATED RESOURCE PLAN
2020-2021 PLANNING PROCESS AND PUBLIC ADVISORY PROCESS MEETINGS
DECLARATION OF CURTIS HUTCHESON OF NOTICE TO CUSTOMERS
I Curtis Hutcheson pursuant to Rule 1-011 NMRA state as follows
1 I affirm in writing under penalty of perjury under the laws of the State of New Mexico
that the following statements are true and correct
2 I am over 18 years of age and have personal knowledge of the facts stated herein I am
employed as Supervisor-Regulatory Case Management My business address is 100 N Stanton
Street El Paso Texas 79901
3 My responsibilities include the oversight and preparation of rate and regulatory filings
and compliance with the various regulatory requirements of the jurisdictions in which EPE
operates
4 Pursuant to Rule 17739H(1) NMAC the New Mexico Public Regulation Commission
(ldquoCommissionrdquo) requires EPE to provide notice of EPErsquos 2021 Integrated Resource Planrsquos
2020-2021 Planning Process and Public Advisory Process Meetings in the utilityrsquos billing
inserts
5 EPE directly mailed the required notice to all existing New Mexico customers in a bill
insert between June 4 2020 and July 2 2020 A copy of the bill insert is attached as Exhibit A to
Attachment E-1 Proof of Notice
2
this Affirmation
6 EPE also published the notice in the Las Cruces Sun News on May 31 2020 The affidavit
and tear sheet are attached as Exhibit B to this Affirmation
7 EPE provided notice on June 4 2020 30 days prior to the first scheduled meeting on
July 10 2020 to the commission interveners in its most recent general rate case and
participants in its most recent renewable energy energy efficiency and IRP proceedings The
email of the notice and certificate of service is attached as Exhibit C to this Affirmation
I submit this Declaration based upon my personal knowledge and upon information
and belief in support of EPErsquos 2021 Integrated Resource Planrsquos 2020-2021 Planning Process
and Public Advisory Process Meetings
FURTHER DECLARANT SAYETH NAUGHT
I declare under penalty of perjury that the foregoing is true and correct
Executed on May 13 2021
__s Curtis Hutcheson________
CURTIS HUTCHESON
Attachment E-1 Proof of Notice
BEFORE THE NEW MEXICO PUBLIC REGULATION COMMISSION
RULE 1773 NMAC FILING
EL PASO ELECTRIC COMPANY
NOTICE OF 2021 INTEGRATED RESOURCE PLAN
2020-2021 PUBLIC ADVISORY PROCESS MEETINGS
Notice is hereby given that
El Paso Electric Company (EPE) invites members of the public to participate in the Integrated Resource
Plan (ldquoIRPrdquo) public advisory process through a series of public meetings With public participation EPE
will develop its IRP pursuant to the New Mexico Efficient Use of Energy Act and the New Mexico Public
Regulation Commissions (Commission) IRP Rule 1773 NMAC EPEs IRP is developed to identify cost-
effective demand-side and supply-side electricity resources to serve EPEs customers over the next 20-
year planning period
The IRP will be submitted to the Commission no later than July 2021 Public participation is an important
component of the development and implementation of EPEs integrated resource planning in New
Mexico EPE encourages interested members of the public to attend these public meetings to provide
public input and commentary whether as a residential or business customer or as a representative of a
trade non-profit neighborhood shareholder civic or other group
Given the currently effective limitations on public gatherings in New Mexico and Texas the first scheduled
meeting will be held electronically and by phone conference on July 10 2020 at 200 pm MDT The IRP
process will be explained and additional meeting dates and locations will be set at that time Prior to
each meeting the presentation for that meeting will be posted on EPEs website wwwepeletriccom If
you are interested in attending the meeting or otherwise participating in the process please contact EPE
by emailing NMIRPepelectriccom or calling at (915) 543- 4354
Exhibit A Page 1 of 1Attachment E-1 Proof of Notice
Exhibit B Page 1 of 2Attachment E-1 Proof of Notice
2H SUNDAY MAY 31 2020 LAS CRUCES SUN-NEWS
4B-501 Notice to creditors by publi-cation and notice to creditors bywritten notice (mailing or other de-livery)[For use with Rules 1B-304 1B-306and 1B-401 NMRA]
STATE OF NEW MEXICOIN THE PROBATE COURTDONA ANA COUNTY
No 20-0074
IN THE MATTER OF THEESTATE OF Juliet S WilliamsDECEASED
NOTICE TO CREDITORSNOTICE IS HEREBY GIVEN thatthe undersigned has been appointedpersonal representative of the es-tate of the decedent All personshaving claims against the estate ofthe decedent are required to presenttheir claims within four (4) monthsafter the date of the first publica-tion of any published notice to cred-itors or sixty (60) days after thedate of mailing or other delivery ofthis notice whichever is later orthe claims will be forever barredClaims must be presented either tothe undersigned personal represen-tative at the address below or filedwith the Probate Court of DonaAna 845 N Motel Blvd 1-201 LasCruces NM 88007Dated May 2020s Edwin James Williams Jrsignature of representative
Edwin James Williams JrPrinted Name
17093 White Pine RdStreet address
Beaver dam VA 23015City state and ZIP code
4213196 Sun-News May 31 andJun 7 14 2020
To advertise visit
SELL ITBUY IT
FIND ITcars
garage sales
tickets
jobs
antiques
motorcycles
computers
boats
sports equipment
pets
instruments
jewelry
furniture
tablets
auctions
yard sales
collectibles
appliances
cameras
coins
Place yourclassified ad today
FINDING WORK SHOULDNrsquoT BE WORK
Your job search ends here
Get started by visitingjobsusatodaycom
HVAC TECHNICIAN II
ACO amp CODES-LABORER
ANIMAL CONTROL OFFICER
DASO CADET-UNCERTIFIED
ROADS-EQUIPMENT OPERATOR
ELECTIONS SPECIALIST-TEMPORARY
ROADS-HEAVY EQUIPMENT OPERATOR
DETENTION CENTER OFFICER TRAINEE
DOCUMENT TECHNICIAN-DC DISPOSITIONS
ENVIRONMENTAL CODES ENFORCEMENT OFFICER
WATERWASTEWATER OPERATOR III
Job Application amp Job Announcements available on our Website atwwwdonaanacountyorg
Computer kiosks are available in the Human Resources Department
DONtildeA ANA COUNTYJOB VACANCIES
CAMINO REALREGIONAL UTILITY AUTHORITY
JOB VACANCIES
Demolition Build RoadsLeveling
Business amp Service Directoryto advertise email ServiceDirectorylcsun-newscom
or call 8007645620
Exhibit B Page 2 of 2Attachment E-1 Proof of Notice
From Griego PatriciaTo Burns Nancy Griego Patricia Jeffrey Wechsler Diana Luna Kari Olson Lorraine Talley John F McIntyre
Schichtl James Hutcheson Marvin C Novela Mariah M Parsons Judith M Pleasant Linda G Perea Araceli Gastevenslawgmailcom jvega-brownlas-crucesorg joprovenciolas-crucesorg llarocquelas-crucesorg marcydlas-crucesorg davilalas-crucesorg JAGlas-crucesorg hconnellylas-crucesorg ddollahonlas-crucesorg tomfdonaanacountyorg rockybacchusgmailcomecomaxaclifeisgood2com lellisnmsuedu ghauboldadnmsuedu jdrakemodrallcomnwinterstelznerlawcom kherrmannstelznerlawcom rgallegosstelznerlawcom Nobleccaegmailcomstephaniedzur-Lawcom Lundin Robert gelliotnmaggov Cholla Khoury lawofficejasonmarkscomJsmithwatsonlawlcgmailcom mayortrujillocityofanthonynmorg mlsouleshotmailcombthroneattynewmexicocom Goodin Nelson fredkdonaanacountyorg Rickvotesolarorgtasolomon6gmailcom Dahlharrishotmailcom Jdittmerutilitechnet Jaherzsawvelcomakharrigersawvelcom Borman Bradford PRC Reynolds John PRC Chavez Milo PRC Sidler Jack PRCjohnbogatkostatenmus marctuplerstatenmus gilberttfuentesstatenmus Sisneros Anthony R PRCLeyba-Tercero Elisha PRC Fisk Russell PRC Amer Judith PRC Smith Michael C PRC Martinez-Rael PeggyPRC elizabethramirezstatenmus carolynglickstatenmus Hurst Elizabeth PRCchristopherryanstatenmus philipbsimpsoncomcastnet Kylejsmith124civmailmilrobertagantoncivmailmil hgellerswenergyorg jbrantswenergyorg ctcolumbiaaolcomltougascleanenergyregresearchcom dgegaxnmsuedu Ramonablabersierracluborgsricdonearthlinknet smichelwesternresourcesorg Beadles Cydney PRCpatoconnellwesternresourcesorg aprilelliottwesternresourcesorg dneidcoxnet schaefnogmailcomdavidvw77com bslocumdwmrlawcom jmcnallydwmrlawcom mbarkerdwmrlawcommzidovskymontandcom
Cc EPE_Reg_MgmtSubject Rule 1773 NMAC Filing EPEs Notice of 2020-2021 Public Advisory Process Meetings for 2021 IRP amp COSDate Thursday June 4 2020 105041 AMAttachments 2021 IRP Noticepdf
COS Notice of IRP Processpdf
Good morning Attached is El Paso Electric Companyrsquos Notice of its 2020-2021 Public AdvisoryProcess Meetings for the 2021 Integrated Resource Plan and Certificate of Service that was filed byemail with NMPRC Records today
Patricia ldquoTrishrdquo Griego| El Paso Electric CompanyLegal Assistant300 Galisteo St Suite 206Santa Fe New Mexico 87501T (505) 982-4713 | C (505) 470-4048Patriciagriegoepelectriccom
CONFIDENTIALITY NOTICE The information contained in this electronic mailtransmission is CONFIDENTIAL and it may qualify as material protected pursuantto the Texas Uniform Trade Secrets Act the New Mexico Uniform Trade SecretsAct or other laws If you are not the intended recipient please destroydelete thismessage and any attachments and immediately notify the sender
Exhibit C Page 1 of 1Attachment E-1 Proof of Notice

Attachment B-1 2021 Forecast
Page 2 of 2
Atta
chm
ent B
-2
2021
Ene
rgy
Fore
cast
by
Juri
sdic
iton
Page
1 o
f 2
Nativ
e Sy
stem
Ene
rgy
2021
2022
2023
2024
2025
2026
2027
2028
2029
2030
Texa
sRe
side
ntial
269
252
0274
858
7280
156
2284
349
6288
974
5294
484
1301
222
7308
429
1315
986
1324
432
1Co
mmercial amp
Ind
ustrial Sm
all
197
388
8199
542
7200
073
7200
223
7200
400
5200
866
8201
424
1201
995
8202
782
4203
746
3Co
mmercial amp
Ind
ustrial La
rge
97205
097
638
498
000
598
299
598
543
698
739
998
894
699
013
099
099
999
159
3Street L
ighting
41523
42056
42506
42961
43420
43880
44323
44748
45182
45638
OPA
117
458
0119
392
2120
482
1121
593
7122
580
0123
538
3124
374
7124
823
3125
523
2126
259
7
Total Te
xas
685
456
1695
637
6702
963
0708
762
7714
840
7722
017
1730
348
5738
736
0747
909
8758
161
3
New
Mex
ico
Reside
ntial
84538
186
170
686
900
987
582
188
307
989
354
290
602
192
040
493
682
395
364
8Co
mmercial amp
Ind
ustrial Sm
all
52893
553
705
853
927
054
119
454
487
955
041
555
693
956
507
257
338
558
004
7Co
mmercial amp
Ind
ustrial La
rge
75359
74520
73908
73388
72906
72438
71976
71517
71059
70602
Street L
ighting
198
1202
0205
2208
3211
7215
0218
4221
8225
3228
7OPA
38232
138
851
038
920
839
051
639
089
539
178
139
325
039
519
039
770
740
120
6
Total Ne
w Mex
ico
183
397
6186
381
4187
344
7188
300
2189
387
5191
032
6193
037
1195
440
1198
122
7200
779
0
Compa
ny U
se13
815
13940
14065
14192
14319
14448
14578
14709
14842
14975
RGEC
69263
70552
71840
73128
74417
75705
76993
78282
79570
80858
Total Na
tive
System
877
161
6890
468
2898
898
2905
794
9913
101
8922
065
0932
542
7943
475
2955
473
7968
523
7 Attachment B-2 2021 Energy Forecast by Jurisdiction
Page 1 of 2
Atta
chm
ent B
-2
2021
Ene
rgy
Fore
cast
by
Juri
sdic
iton
Page
2 o
f 2
Nativ
e Sy
stem
Ene
rgy
Texa
sRe
side
ntial
Commercial amp
Ind
ustrial Sm
all
Commercial amp
Ind
ustrial La
rge
Street L
ighting
OPA To
tal Te
xas
New
Mex
ico
Reside
ntial
Commercial amp
Ind
ustrial Sm
all
Commercial amp
Ind
ustrial La
rge
Street L
ighting
OPA To
tal Ne
w Mex
ico
Compa
ny U
seRG
EC
Total Na
tive
System
2031
2032
2033
2034
2035
2036
2037
2038
2039
2040
333
498
3342
514
8352
517
0363
602
6375
962
4389
587
8404
605
4421
733
9441
440
3464
854
4204
512
9205
422
5206
458
0207
569
3208
712
3209
803
4210
956
8212
148
1213
518
9215
185
799
194
899
209
599
206
099
186
899
153
899
108
999
053
598
989
198
916
798
837
546
133
46630
47109
47569
48017
48461
48888
49300
49698
50084
126
833
5127
422
3128
043
5128
627
9129
128
0129
588
9130
154
2130
722
8131
363
7132
253
7
768
652
9779
232
0790
935
5803
743
5817
758
3832
935
1849
658
7868
523
9890
209
4916
139
8
96992
298
850
0100
911
0103
341
5106
103
0109
184
3112
739
2116
969
2121
992
0128
248
958
968
059
896
060
908
361
944
462
902
063
948
065
148
866
433
367
751
268
996
470
144
69687
69229
68772
68315
67857
67400
66943
66485
66028
232
3236
0239
7243
5247
3251
1254
9258
6262
3265
940
330
540
627
540
956
641
342
841
744
542
112
442
453
442
783
543
117
443
550
0
203
537
5206
578
2209
938
6213
749
4217
828
3222
281
5227
336
2233
138
8239
771
3247
663
9
15110
15246
15383
15522
15662
15803
15945
16088
16233
16379
82147
83435
84723
86012
87300
88589
89877
91165
92454
93742
981
916
1995
678
410
108
847
10276
463
10458
828
10656
557
10875
771
11123
881
11408
494
11748
158 Attachment B-2 2021 Energy
Forecast by JurisdictionPage 2 of 2
Atta
chm
ent B
-3
2021
Dem
and
Fore
cast
by
Juri
sdic
tion
Page
1 o
f 2
Nativ
e Sy
stem
Dem
and
2021
2022
2023
2024
2025
2026
2027
2028
2029
2030
Texa
sRe
side
ntial
653
667
681
689
703
717
735
751
773
795
Commercial amp
Ind
ustrial Sm
all
479
484
486
485
488
489
491
492
496
499
Commercial amp
Ind
ustrial La
rge
236
237
238
238
240
241
241
241
242
243
Street L
ighting
1010
1010
1111
1111
1111
OPA
285
290
293
295
298
301
303
304
307
309
Total Te
xas
166
2168
8170
8171
8174
0175
9178
2179
9183
0185
8
New
Mex
ico
Reside
ntial
201
205
207
208
211
214
217
220
224
229
Commercial amp
Ind
ustrial Sm
all
126
128
128
129
130
132
133
135
137
139
Commercial amp
Ind
ustrial La
rge
1818
1817
1717
1717
1717
Street L
ighting
00
00
11
11
11
OPA
9192
9393
9394
9494
9596
Total Ne
w Mex
ico
436
443
446
448
452
457
462
466
475
482
Compa
ny U
se3
33
33
44
44
4RG
EC19
2020
2021
2122
2223
23
Total Na
tive
System
212
1215
5217
7219
0221
6224
0226
9229
2233
1236
7 Attachment B-3 2021 Demand Forecast by Jurisdiction
Page 1 of 2
Atta
chm
ent B
-3
2021
Dem
and
Fore
cast
by
Juri
sdic
tion
Page
2 o
f 2
Nativ
e Sy
stem
Dem
and
Texa
sRe
side
ntial
Commercial amp
Ind
ustrial Sm
all
Commercial amp
Ind
ustrial La
rge
Street L
ighting
OPA To
tal Te
xas
New
Mex
ico
Reside
ntial
Commercial amp
Ind
ustrial Sm
all
Commercial amp
Ind
ustrial La
rge
Street L
ighting
OPA To
tal Ne
w Mex
ico
Compa
ny U
seRG
EC
Total Na
tive
System
2031
2032
2033
2034
2035
2036
2037
2038
2039
2040
819
841
871
901
936
973
102
0107
2113
4120
650
250
451
051
552
052
453
253
954
855
824
424
424
524
624
724
725
025
225
425
611
1112
1212
1212
1313
1331
231
331
631
932
232
432
833
233
734
3
188
8191
3195
4199
2203
6207
9214
2220
8228
6237
6
233
237
243
250
257
265
276
288
303
321
142
144
147
150
153
155
159
164
168
173
1717
1717
1716
1616
1717
11
11
11
11
11
9797
9910
010
110
210
410
510
710
9
489
496
506
517
528
540
556
574
595
620
44
44
44
44
44
2324
2425
2525
2627
2728
240
4243
6248
8253
8259
3264
8272
8281
3291
3302
8 Attachment B-3 2021 Demand Forecast by Jurisdiction
Page 2 of 2
Attachment B-4 Losses by Transmission and Distribution
Year Secondary Primary Transmission FERC Losses (MW)2021 130 4 4 0 1382022 133 4 4 0 1412023 135 4 4 0 1442024 137 4 4 0 1452025 139 4 4 0 1482026 141 4 4 0 1502027 144 4 5 0 1532028 146 4 5 0 1552029 149 4 5 0 1592030 152 5 5 0 1622031 155 5 5 0 1652032 157 5 5 0 1672033 160 5 5 0 1712034 163 5 5 0 1742035 166 5 5 0 1772036 169 5 5 0 1802037 173 5 5 0 1842038 176 5 6 0 1872039 179 5 6 0 1912040 182 5 6 0 194
Page 1 of 1
Attachment B-5 Typical Days Tables
Page 1 of 10
Attachment B-5 Typical Days Tables
Page 2 of 10
Attachment B-5 Typical Days Tables
Page 3 of 10
Attachment B-5 Typical Days Tables
Page 4 of 10
Attachment B-5 Typical Days Tables
Page 5 of 10
Attachment B-5 Typical Days Tables
Page 6 of 10
Attachment B-5 Typical Days Tables
Page 7 of 10
Attachment B-5 Typical Days Tables
Page 8 of 10
Attachment B-5 Typical Days Tables
Page 9 of 10
Attachment B-5 Typical Days Tables
Page 10 of 10
Page 1 of 7
Attachment C-1 Transmission Facilities TABLE 1 Existing EPE Transmission Lines 115 kV and Above
EL PASO ELECTRIC COMPANY
Existing 115 kV and Above Internal Lines
RATING LENGTH STATE
From To kV Circuit MVA
Normal MVA
Emerg Miles From To AMRAD EMPIRE 345 1 400 400 12510 TX NM CALIENTE AMRAD 345 1 785 785 567 TX NM CALIENTE PICANTE 345 1 788 788 73 TX TX EMPIRE EDDY 345 1 836 836 05 NM NM HIDALGO GREENLEE 345 1 765 765 600 NM AZ LUNA AFTON 345 1 921 987 573 NM NM LUNA DIABLO 345 1 939 939 849 NM NM LUNA HIDALGO 345 1 659 659 505 NM NM MACHO SPRINGS
LUNA 345 1 1031 1390 249 NM NM
MACHO SPRINGS
SPRINGERVILLE 345 1 728 728 2014 NM AZ
NEWMAN ARROYO 345 1 700 700 303 TX NM NEWMAN AFTON 345 1 924 1028 299 TX NM PICANTE NEWMAN 345 1 786 786 162 TX TX WESTMESA ARROYO 345 1 680 680 2018 NM NM MIMBRES TAP AIRPORT 115 1 123 163 27 NM NM
AMRAD HOLLOMAN 115 1 121 121 225 NM NM ANTHONY ARROYO 115 1 114 114 244 NM NM ANTHONY BORDER STEEL 115 1 165 220 52 NM TX ANTHONY SALOPEK 115 1 165 220 173 NM NM ANTHONY NEWMAN 115 1 165 212 123 NM TX ANTHONY NUWAY 115 1 165 220 66 NM TX ASCARATE TROWBRIDGE 115 1 181 181 05 TX TX ASCARATE COPPER 115 1 185 246 14 TX TX ASCARATE JUAREZ 115 1 185 247 24 TX AUSTIN MARLOW 115 1 227 227 12 TX TX BIGGS BLISS
INDUSTRIAL 115 1 185 246 22 TX TX
BLISS INDUSTRIAL
LIBERTY 115 1 185 246 22 TX TX
BUTTERFIELD FT BLISS 115 1 135 180 19 TX TX CALIENTE DIAMOND HEAD 115 1 185 247 61 TX TX CALIENTE MPS 115 1 69 87 85 TX TX CALIENTE MPS 115 2 268 332 31 TX TX CALIENTE MPS 115 3 268 332 31 TX TX CALIENTE VISTA 115 1 166 221 66 TX TX CHAPARRAL ORO GRANDE 115 1 135 165 354 NM NM COPPER PENDALE 115 1 185 246 51 TX TX
Page 2 of 7
EL PASO ELECTRIC COMPANY Existing 115 kV and Above
Internal Lines
RATING LENGTH STATE
From To kV Circuit MVA
Normal MVA
Emerg Miles From To COYOTE RGC_DELL CITY 115 1 23 23 108 TX TX COYOTE MONTWOOD 115 1 185 246 79 TX NM CROMO RIO GRANDE 115 1 135 180 09 TX TX DIABLO RIO GRANDE 115 1 332 441 29 NM TX DIABLO RIO GRANDE 115 2 332 441 29 NM NM DIABLO JUAREZ 115 1 185 247 23 NM DIAMOND HEAD
LANE 115 1 185 247 28 TX TX
DURAZNO ASCARATE 115 1 185 246 33 TX NM DYER SHEARMAN 115 1 135 180 96 TX TX DYER AUSTIN 115 1 185 246 21 TX TX EXECUTIVE RIO GRANDE 115 1 271 359 29 TX TX FT BLISS AUSTIN 115 1 135 180 18 TX TX GLOBAL REACH
VISTA 115 1 329 329 30 TX TX
HATCH JORNADA 115 1 45 45 334 NM NM JORNADA ARROYO 115 1 79 79 49 NM NM LANE WRANGLER 115 1 165 220 10 TX TX LAS CRUCES ARROYO 115 1 165 220 41 NM NM LAS CRUCES SALOPEK 115 1 165 220 50 NM NM LEO EAST DYER 115 1 185 246 38 TX TX LEO EAST MILAGRO 115 1 185 246 44 TX TX LIBERTY GLOBAL REACH 115 1 185 246 26 TX TX MAR LARGO 115 1 29 29 114 NM NM MARLOW TROWBRIDGE 115 1 181 181 11 TX TX MESA AUSTIN 115 1 165 220 61 TX TX MESA RIO GRANDE 115 1 268 268 23 TX NM MILAGRO NEWMAN 115 1 185 246 63 TX TX MONTWOOD CALIENTE 115 1 185 246 50 TX TX MPS COYOTE 115 1 249 387 31 TX TX MPS MONTWOOD 115 1 249 387 70 TX TX NEWMAN CHAPARRAL 115 1 135 180 29 TX NM NEWMAN BUTTERFIELD 115 1 135 280 167 TX TX NEWMAN SHEARMAN 115 1 135 280 73 TX TX NEWMAN PIPELINE 115 1 185 246 98 TX TX NEWMAN PICANTE 115 1 185 246 136 TX TX NUWAY MONTOYA 115 1 165 220 36 TX TX ORO GRANDE AMRAD 115 1 135 165 123 NM NM ORO GRANDE WHITE SANDS 115 1 75 75 228 NM NM PATRIOT NEWMAN 115 1 135 180 15 TX TX PATRIOT CROMO 115 1 135 180 184 TX TX PELICANO HORIZON 115 1 185 246 67 TX TX
Page 3 of 7
EL PASO ELECTRIC COMPANY Existing 115 kV and Above
Internal Lines
RATING LENGTH STATE
From To kV Circuit MVA
Normal MVA
Emerg Miles From To PELICANO MONTWOOD 115 1 185 246 38 TX TX PENDALE LANE 115 1 185 246 15 TX TX PICANTE GLOBAL REACH 115 1 185 246 60 TX TX PICANTE BIGGS 115 1 185 246 23 TX TX PIPELINE BIGGS 115 1 135 180 136 TX TX RIO GRANDE RIPLEY 115 1 165 220 30 NM TX RIPLEY THORN 115 1 135 180 19 TX TX SALOPEK ARROYO 115 1 135 180 107 NM NM SANTA TERESA MONTOYA 115 1 185 246 74 NM TX SANTA TERESA DIABLO 115 1 169 225 89 NM NM SCOTSDALE VISTA 115 1 135 180 52 TX TX SOL LANE 115 1 135 180 21 TX TX SOL VISTA 115 1 185 246 20 TX TX SPARKS HORIZON 115 1 185 246 38 TX TX SUNSET NORTH DURAZNO 115 1 185 246 46 TX TX SUNSET NORTH EXECUTIVE 115 1 271 359 23 TX TX THORN MONTOYA 115 1 135 180 30 TX TX WRANGLER SPARKS 115 1 185 246 40 TX TX
- Internal refers to lines within EPEs Balancing Area including lines connecting EPE to neighboring utilities however not including line segments partially owned by EPE external to EPEs control area
- Some transmission lines were identified to be capacity limited by smaller jumpers connected at the substations The line ratings reflected in the above table are based on-line jumper upgrade assumptions
- The ratings are generally based on conductor thermal capacities but may be derated due to sag limitations or other factors
- RGC_DC is Rio Grande Electric Cooperative Dell City - Emerg is short for Emergency
Page 4 of 7
TABLE 2 Existing 115 kV EPE Substation Transformers
EL PASO ELECTRIC COMPANY
Existing 115 kV Load amp Step-up Substation Transformers
RATING Normal Emergency State
MVA MVA AIRPORT 115239 336 376 NM AMRAD 115249 85 95 NM
ANTHONY T1 115239 336 376 NM ANTHONY T2 115239 560 627 NM ARROYO T2 115239 336 376 NM ARROYO T4 115239 336 376 NM
ASCARATE T4 11569 112 1288 TX ASCARATE T5 11569 112 1288 TX
AUSTIN T1 115138 500 560 TX AUSTIN T2 115138 560 627 TX
BORDER STEEL 115 T1 115138 392 439 TX
BORDER STEEL 115 T2 115138 392 439 TX BUTTERFIELD T1 115138 300 336 TX BUTTERFIELD T2 115138 300 336 TX
CALIENTE T3 115138 336 376 TX CENTRAL TEMP T1 115138 336 376 TX
CHAPARRAL T1 115138 336 376 NM CHAPARRAL T2 115138 336 376 NM
COPPER T1 115138 300 336 TX COPPER GEN T2 138115 840 941 TX
COX T2 11569 560
644 NM COYOTE T1 115138 300 336 TX CROMO T1 115138 300 336 TX CROMO T2 115138 336 376 TX
DIAMOND HEAD T1 115138 336 376 TX DURAZNO T1 115138 336 376 TX
DYER T3 11569 112 1288 TX EMRLD T1 115138 125 140 NM
EXECUTIVE T1 115138 560 627 TX EXECUTIVE T2 115138 560 627 TX
FT BLISS T1 115138 560 627 TX FT BLISS T2 115132 280 314 TX
GLOBAL REACH T1 115138 336 376 TX GLOBAL REACH T2 115138 560 627 TX
Page 5 of 7
EL PASO ELECTRIC COMPANY
Existing 115 kV Load amp Step-up Substation Transformers
RATING Normal Emergency State
MVA MVA HATCH T1 115249 300 336 NM
HORIZON T1 115138 336 376 TX JORNADA T1 115239 336 376 NM JORNADA T2 115239 560 627 NM
LANE T1 11569 100 115 TX LANE T2 115138 300 336 TX
LAS CRUCES T1 115239 672 753 NM LAS CRUCES T2 115239 672 753 NM
LEO EAST T1 115138 336 376 TX LEO EAST T2 115138 336 376 TX
MAR T1 11542 112 125 NM MESA T1 115138 300 336 TX MESA T2 115138 336 376 TX
MILAGRO T1 115138 336 376 TX MILAGRO T2 115138 336 376 TX MILAGRO T3 115138 336 376 TX MONTOYA T1 115249 336 376 TX MONTOYA T2 115239 560 627 TX MONTOYA T3 115239 560 627 TX
MONTWOOD T1 115239 560 627 TX MONTWOOD T3 115239 560 627 TX
MPS T1 138115 1400 1568 TX MPS T2 138115 1400 1568 TX MPS T3 138115 1400 1568 TX MPS T4 138115 1400 1568 TX
NEWMAN G1(T2) 138115 1254 1405 TX NEWMAN G2 (T6) 138115 1254 1405 TX NEWMAN G3 (T8) 138115 1254 1405 TX
NEWMAN 4G1 (T11) 138115 1250 1400 TX NEWMAN 4G2 (T9) 138115 1250 1400 TX NEWMAN 4S1 (T13) 138115 1250 1400 TX NEWMAN 5G1 (T15) 138115 1300 1456 TX NEWMAN 5G2 (T16) 138115 1300 1456 TX NEWMAN 5S1 (T14) 138115 1750 196 TX
NUWAY T1 115239 560 627 TX NUWAY T2 115239 560 627 TX
Page 6 of 7
EL PASO ELECTRIC COMPANY
Existing 115 kV Load amp Step-up Substation Transformers
RATING Normal Emergency State
MVA MVA PATRIOT T1 115138 336 376 TX
PELICANO T1 115239 560 627 TX PELICANO T2 115239 560 627 TX PENDALE T1 115138 336 376 TX PENDALE T2 115138 560 627 TX PICACHO T1 115249 560 627 NM REDEYE T1 115138 140 157 NM
RIO GRANDE T1 11569 112 1288 NM RIO GRANDE T2 11569 112 1288 NM
RIO GRANDE G8 (T7) 175115 1680 1882 NM RIO GRANDE G9 (T17) 138115 1320 1478 NM
RIPLEY T1 115138 336 376 TX RIPLEY T2 115138 560 627 TX
SALOPEK T1 115249 280 314 NM SALOPEK T2 115249 280 314 NM SALOPEK T3 115249 280 314 NM
SANTA TERESA T1 115239 336 376 NM SANTA TERESA T2 115239 336 376 NM
SCOTSDALE T1 11569 112 1288 TX SCOTSDALE T4 115138 560 627 TX SCOTSDALE T5 115138 560 627 TX SHEARMAN T1 115138 300 336 TX
SOL T1 115138 336 376 TX SOL T2 115138 300 336 TX
SPARKS T1 115138 336 376 TX SPARKS T2 115138 560 627 TX SPARKS T3
11569 100 115 TX
SUNSET NORTH T1 115138 336 376 TX SUNSET NORTH T2 115138 336 376 TX SUNSET NORTH T3 11569 112 1288 TX
TALAVERA TEMP T1 115239 165 185 NM THORN T1 115138 336 376 TX THORN T2 115138 336 376 TX
TRIUMPH TEMP T1 115239 336 376 TX VISTA T1 115138 300 336 TX VISTA T2 115138 300 336 TX
Page 7 of 7
EL PASO ELECTRIC COMPANY
Existing 115 kV Load amp Step-up Substation Transformers
RATING Normal Emergency State
MVA MVA WHITE SANDS T1 115138 300 336 NM
WRANGLER T1 115138 500 560 TX
Attachment C-2 Existing Units Operating CharacteristicsCapacity Factor ()Resources 2021 2024 2025 2027 2031 2035 2040 2045Newman 1 2 0 0 0 0 0 0 0Newman 2 1 0 0 0 0 0 0 0Newman 3 10 3 0 1 0 0 0 0Newman 4 14 5 2 3 1 0 0 0Newman 5 64 54 38 41 44 40 41 47Newman 6 0 12 7 8 6 3 4 6Copper 2 0 0 0 0 0 0 0Montana 1 26 29 20 21 20 11 19 23Montana 2 26 28 19 21 21 14 23 24Montana 3 17 17 13 14 12 5 11 16Montana 4 50 42 30 32 28 23 28 28Rio Grande 7 0 0 0 0 0 0 0 0Rio Grande 8 3 1 0 0 0 0 0 0Rio Grande 9 13 5 2 3 3 0 0 2Gas Peaker 0 0 0 0 0 3 3 5Palo Verde 1 94 94 94 94 94 94 94 94Palo Verde 2 94 94 94 94 94 94 94 94Palo Verde 3 94 94 94 94 94 94 94 94
Fuel Cost ($000)Resources 2021 2024 2025 2027 2031 2035 2040 2045Newman 1 431$ -$ -$ -$ -$ -$ -$ -$ Newman 2 273$ -$ -$ -$ -$ -$ -$ -$ Newman 3 2299$ 667$ 55$ 248$ 46$ -$ -$ -$ Newman 4 7893$ 2755$ 1080$ 1435$ 716$ -$ -$ -$ Newman 5 31126$ 24367$ 17006$ 19659$ 22951$ 21785$ 24625$ 28990$ Newman 6 -$ 5465$ 3596$ 4364$ 3762$ 1579$ 2380$ 4155$ Copper 1076$ 70$ -$ -$ -$ -$ -$ -$ Montana 1 4595$ 4852$ 3414$ 3784$ 4030$ 2455$ 4318$ 5534$ Montana 2 5153$ 5102$ 3468$ 4056$ 4447$ 3079$ 5285$ 5678$ Montana 3 3332$ 3087$ 2371$ 2768$ 2638$ 1279$ 2780$ 4139$ Montana 4 9507$ 7298$ 5383$ 5946$ 5665$ 4884$ 6297$ 6488$ Rio Grande 7 93$ -$ -$ -$ -$ -$ -$ -$ Rio Grande 8 1340$ 264$ 49$ 93$ -$ -$ -$ -$ Rio Grande 9 2675$ 987$ 413$ 603$ 706$ 42$ 22$ 429$ Gas Peaker -$ -$ -$ -$ -$ 1081$ 2239$ 5645$ Palo Verde 1 12111$ 12185$ 12222$ 12259$ 12370$ 12500$ 12667$ 12834$ Palo Verde 2 12169$ 12244$ 12281$ 12318$ 12430$ 12561$ 12728$ 12896$ Palo Verde 3 12111$ 12185$ 12222$ 12259$ 12370$ 12500$ 12667$ 12834$
Heat Rate (MMBtuMWh)Newman 1 1228Newman 2 1151Newman 3 1097Newman 4 1012Newman 5 7741Newman 6 10101Copper 19916Montana 1 9373Montana 2 9334Montana 3 9933Montana 4 9339Rio Grande 7 1179Rio Grande 8 11902Rio Grande 9 9881Gas Peaker 10101Palo Verde 1 10Palo Verde 2 10Palo Verde 3 10
Page 1 of 2
Attachment C-2 Existing Units Operating CharacteristicsFixed OampM ($000)Resources 2021 2024 2025 2027 2031 2035 2040 2045Newman 1 1704$ 5737$ 5737$ 5737$ -$ -$ -$ -$ Newman 2 1789$ -$ -$ -$ -$ -$ -$ -$ Newman 3 2221$ 2221$ 2221$ 5231$ 5231$ -$ -$ -$ Newman 4 5014$ 5014$ 5014$ 10769$ 10769$ -$ -$ -$ Newman 5 5563$ 5563$ 5563$ 5563$ 5563$ 5563$ 5563$ 5563$ Newman 6 -$ 2752$ 2752$ 2752$ 2752$ 2752$ 2752$ 2752$ Copper 1167$ 1167$ 1167$ 1167$ -$ -$ -$ -$ Montana 1 1613$ 1613$ 1613$ 1613$ 1613$ 1613$ 1613$ 1613$ Montana 2 1623$ 1623$ 1623$ 1623$ 1623$ 1623$ 1623$ 1623$ Montana 3 1484$ 1484$ 1484$ 1484$ 1484$ 1484$ 1484$ 1484$ Montana 4 1076$ 1076$ 1076$ 1076$ 1076$ 1076$ 1076$ 1076$ Rio Grande 7 1612$ -$ -$ -$ -$ -$ -$ -$ Rio Grande 8 4346$ 4346$ 4346$ 4346$ 4346$ -$ -$ -$ Rio Grande 9 2495$ 2495$ 2495$ 2495$ 2495$ 2495$ 2495$ 2495$ Gas Peaker -$ -$ -$ -$ -$ 1697$ 3312$ 4621$ Palo Verde 1 28313$ 28313$ 28313$ 28313$ 28313$ 28313$ 28313$ 28313$ Palo Verde 2 28313$ 28313$ 28313$ 28313$ 28313$ 28313$ 28313$ 28313$ Palo Verde 3 28313$ 28313$ 28313$ 28313$ 28313$ 28313$ 28313$ 28313$
Variable OampM ($000)Resources 2021 2024 2025 2027 2031 2035 2040 2045Newman 1 466$ -$ -$ -$ -$ -$ -$ -$ Newman 2 415$ -$ -$ -$ -$ -$ -$ -$ Newman 3 2388$ 695$ 57$ 257$ 48$ -$ -$ -$ Newman 4 8305$ 2887$ 1130$ 1497$ 744$ -$ -$ -$ Newman 5 33855$ 26821$ 18189$ 21158$ 24347$ 22746$ 25862$ 30331$ Newman 6 -$ 5964$ 3916$ 4688$ 3914$ 1639$ 2464$ 4299$ Copper 1581$ 282$ -$ -$ -$ -$ -$ -$ Montana 1 5119$ 5348$ 3764$ 4110$ 4219$ 2540$ 4463$ 5714$ Montana 2 5832$ 5707$ 3805$ 4427$ 4663$ 3195$ 5491$ 5881$ Montana 3 3700$ 3494$ 2602$ 3032$ 2777$ 1335$ 2895$ 4307$ Montana 4 10379$ 8028$ 6003$ 6579$ 6106$ 5134$ 6673$ 6808$ Rio Grande 7 161$ -$ -$ -$ -$ -$ -$ -$ Rio Grande 8 1700$ 269$ 50$ 94$ -$ -$ -$ -$ Rio Grande 9 3001$ 1138$ 487$ 689$ 741$ 44$ 23$ 447$ Gas Peaker -$ -$ -$ -$ -$ 1122$ 2319$ 5841$ Palo Verde 1 15537$ 15612$ 15649$ 15686$ 15797$ 15927$ 16094$ 16261$ Palo Verde 2 15613$ 15687$ 15724$ 15762$ 15873$ 16004$ 16172$ 16339$ Palo Verde 3 15537$ 15612$ 15649$ 15686$ 15797$ 15927$ 16094$ 16261$
Market Price
Year
Average Annual Price ($MWh)
2021 2024$ 2022 2043$ 2023 2050$ 2024 2008$ 2025 2020$ 2026 2007$ 2027 1981$ 2028 1998$ 2029 1919$ 2030 1863$ 2031 1927$ 2032 2020$ 2033 2009$ 2034 2021$ 2035 2016$ 2036 2031$ 2037 1998$ 2038 1927$ 2039 1895$ 2040 1836$ 2041 1843$ 2042 1832$ 2043 1825$ 2044 1895$ 2045 2025$
Page 2 of 2
Attachment D-1 E3 EPE Report Model Results June Page 1 of 34
Scenario Resource Type 2021 2024 2025 2027 2031 2035 2040 2045Least-Cost (Reference Case) Nuclear (Palo Verde) 5148 5148 5148 5148 5148 5148 5148 5148
Nuclear (SMR) - - - - - - - - Gas - Steam Turbine 140 34 7 3 - - - - Gas - Combined Cycle 1767 1373 1022 1111 1130 1065 1318 1502 Gas - Combustion Turbine 1027 1169 836 880 773 754 1250 1640 Biomass - - - - - - - - Geothermal - - - - - - - - Wind - - 379 382 375 336 409 720 Solar 289 952 1467 1551 2200 3058 3443 4239 Battery Storage - 12 (26) (48) (129) (217) (220) (250) Imports 391 336 260 259 282 273 358 440 Demand Response - - - - - - - - Hydrogen - - - - - - - - BTM Solar 37 135 165 225 344 460 601 763 Load 8771 9155 9258 9512 10123 10878 12308 14203 Excess Generation 14 130 430 342 496 657 373 475
Least-Cost Case + ETA Resources Nuclear (Palo Verde) 5148 5148 5148 5148 5148 5148 5148 5148 Nuclear (SMR) - - - - - - - - Gas - Steam Turbine 140 34 3 3 - - - - Gas - Combined Cycle 1767 1373 898 963 998 899 1053 1145 Gas - Combustion Turbine 1027 1169 720 761 686 461 790 1043 Biomass - - - - - - - - Geothermal - - - - - - - - Wind - - 670 688 675 555 653 815 Solar 289 953 1464 1530 2211 3351 4068 5345 Battery Storage - 12 (31) (45) (122) (241) (281) (370) Imports 391 336 220 239 184 245 275 314 Demand Response - - - - - - - - Hydrogen - - - - - - - - BTM Solar 37 135 165 225 344 460 601 763 Load 8771 9155 9258 9512 10123 10878 12308 14203 Excess Generation 14 130 564 480 558 1272 1040 940
Separate System Planning Nuclear (Palo Verde) 5148 5148 5148 5148 5148 5148 5148 5148 Nuclear (SMR) - - - - - - - - Gas - Steam Turbine 140 34 1 2 - - - - Gas - Combined Cycle 1766 1388 1031 1122 1141 969 1192 1385 Gas - Combustion Turbine 1040 1177 754 831 807 477 795 1105 Biomass - - - - - - - - Geothermal - - - - - - - - Wind - - 305 306 295 182 165 412 Solar 289 949 1648 1690 2236 3708 4532 5512 Battery Storage - 12 (54) (60) (138) (295) (350) (405) Imports 391 327 259 247 291 229 225 282 Demand Response - - - - - - - - Hydrogen - - - - - - - - BTM Solar 37 135 165 225 344 460 601 763 Load 8771 9155 9258 9512 10123 10878 12308 14203 Excess Generation 14 134 450 407 444 1288 2358 2353
Annual Energy (GWh)
Attachment D-1 E3 EPE Report Model Results June Page 2 of 34
Scenario Resource Type 2021 2024 2025 2027 2031 2035 2040 2045Annual Energy (GWh)
Separate System Planning (w H2) Nuclear (Palo Verde) 5148 5148 5148 5148 5148 5148 5148 5148 Nuclear (SMR) - - - - - - - - Gas - Steam Turbine 140 34 1 2 - - - - Gas - Combined Cycle 1766 1388 979 1049 1090 1035 1153 1384 Gas - Combustion Turbine 1040 1177 728 819 735 688 779 1129 Biomass - - - - - - - - Geothermal - - - - - - - - Wind - - 447 451 433 405 510 657 Solar 289 949 1594 1633 2242 3101 4087 5075 Battery Storage - 12 (56) (60) (136) (218) (297) (352) Imports 391 327 251 245 266 260 261 327 Demand Response - - - - - - - - Hydrogen - - - - - - 65 71 BTM Solar 37 135 165 225 344 460 601 763 Load 8771 9155 9258 9512 10123 10878 12308 14203 Excess Generation 14 133 444 402 574 772 872 919
Low Load Growth Nuclear (Palo Verde) 5148 5148 5148 5148 5148 5148 5148 5148 Nuclear (SMR) - - - - - - - - Gas - Steam Turbine 101 27 2 3 - - - - Gas - Combined Cycle 1596 1244 978 1065 1127 1025 1258 1472 Gas - Combustion Turbine 983 1065 799 875 806 644 1109 1492 Biomass - - - - - - - - Geothermal - - - - - - - - Wind - - 333 336 335 291 350 562 Solar 282 919 1293 1309 1805 2833 3220 3993 Battery Storage - 8 (29) (29) (96) (209) (215) (245) Imports 381 325 269 262 289 268 342 437 Demand Response - - - - - - - - Hydrogen - - - - - - - - BTM Solar 37 135 165 225 344 460 601 763 Load 8492 8862 8958 9194 9759 10459 11813 13623 Excess Generation 22 163 337 318 410 642 359 427
High Load Growth Nuclear (Palo Verde) 5148 5148 5148 5148 5148 5148 5148 5148 Nuclear (SMR) - - - - - - - - Gas - Steam Turbine 195 50 5 3 - - - - Gas - Combined Cycle 1909 1522 1067 1151 1118 1107 1388 1500 Gas - Combustion Turbine 1088 1256 865 914 776 867 1411 1747 Biomass - - - - - - - - Geothermal - - - - - - - - Wind - - 431 436 413 396 463 976 Solar 293 983 1651 1751 2569 3257 3642 4464 Battery Storage - 14 (47) (68) (159) (222) (222) (256) Imports 400 343 272 271 280 284 372 441 Demand Response - - - - - - - - Hydrogen - - - - - - - - BTM Solar 37 135 165 225 344 460 601 763 Load 9050 9447 9558 9830 10488 11297 12803 14783 Excess Generation 10 100 394 290 554 655 385 540
Attachment D-1 E3 EPE Report Model Results June Page 3 of 34
Scenario Resource Type 2021 2024 2025 2027 2031 2035 2040 2045Annual Energy (GWh)
High DG Nuclear (Palo Verde) 5148 5148 5148 5148 5148 5148 5148 5148 Nuclear (SMR) - - - - - - - - Gas - Steam Turbine 134 31 7 3 - - - - Gas - Combined Cycle 1728 1317 1001 1081 1111 1060 1266 1473 Gas - Combustion Turbine 1028 1123 814 825 742 696 1097 1614 Biomass - - - - - - - - Geothermal - - - - - - - - Wind - - 367 372 368 326 391 916 Solar 285 866 1263 1278 1665 2340 2627 2711 Battery Storage - 11 (25) (45) (126) (227) (245) (244) Imports 389 314 247 241 269 260 345 440 Demand Response - - - - - - - - Hydrogen - - - - - - - - BTM Solar 88 350 436 608 945 1276 1680 2144 Load 8771 9155 9258 9512 10123 10878 12308 14203 Excess Generation 18 217 513 492 614 714 600 432
High DSM Nuclear (Palo Verde) 5148 5148 5148 5148 5148 5148 5148 5148 Nuclear (SMR) - - - - - - - - Gas - Steam Turbine 133 30 2 3 0 - - - Gas - Combined Cycle 1744 1303 1041 1126 1198 1029 1234 1463 Gas - Combustion Turbine 1020 1111 869 907 900 610 1026 1407 Biomass - - - - - - - - Geothermal - - - - - - - - Wind - - 244 244 251 207 249 470 Solar 288 934 1332 1337 1621 2752 3114 3719 Battery Storage - 10 (28) (29) (86) (205) (213) (233) Imports 390 329 283 268 304 271 342 439 Demand Response - - - - - - - - Hydrogen - - - - - - - - BTM Solar 37 135 165 225 344 460 601 763 Load 8731 8994 9056 9230 9680 10273 11501 13177 Excess Generation 15 148 318 313 263 643 371 372
No New Gas Nuclear (Palo Verde) 5148 5148 5148 5148 5148 5148 5148 5148 Nuclear (SMR) - - - - - - - - Gas - Steam Turbine 140 34 6 3 - - - - Gas - Combined Cycle 1767 1373 984 1072 1095 716 702 637 Gas - Combustion Turbine 1027 1169 811 849 745 180 216 207 Biomass - - - - - - - - Geothermal - - - - - - - - Wind - - 455 462 452 210 208 210 Solar 289 952 1467 1545 2197 4287 5691 7680 Battery Storage - 12 (27) (47) (127) (348) (472) (649) Imports 391 336 251 255 270 225 213 206 Demand Response - - - - - - - - Hydrogen - - - - - - - - BTM Solar 37 135 165 225 344 460 601 763 Load 8771 9155 9258 9512 10123 10878 12308 14203 Excess Generation 14 130 458 372 536 2237 2586 3219
Attachment D-1 E3 EPE Report Model Results June Page 4 of 34
Scenario Resource Type 2021 2024 2025 2027 2031 2035 2040 2045Annual Energy (GWh)
No Lifetime Extensions Nuclear (Palo Verde) 5148 5148 5148 5148 5148 5148 5148 5148 Nuclear (SMR) - - - - - - - - Gas - Steam Turbine 140 34 2 0 - - - - Gas - Combined Cycle 1767 1373 948 1015 1050 1056 1308 1502 Gas - Combustion Turbine 1027 1169 707 680 634 745 1242 1640 Biomass - - - - - - - - Geothermal - - - - - - - - Wind - - 397 400 370 364 442 722 Solar 289 953 1693 1897 2475 3050 3432 4237 Battery Storage - 12 (38) (94) (164) (216) (219) (250) Imports 391 336 235 241 267 271 354 440 Demand Response - - - - - - - - Hydrogen - - - - - - - - BTM Solar 37 135 165 225 344 460 601 763 Load 8771 9155 9258 9512 10123 10878 12308 14203 Excess Generation 14 129 634 428 592 661 374 475
High Gas Price Nuclear (Palo Verde) 5148 5148 5148 5148 5148 5148 5148 5148 Nuclear (SMR) - - - - - - - - Gas - Steam Turbine 125 31 3 3 - - - - Gas - Combined Cycle 1787 1400 983 1060 1062 999 1234 1347 Gas - Combustion Turbine 1008 1120 764 786 698 607 1121 1361 Biomass - - - - - - - - Geothermal - - - - - - - - Wind - - 486 493 483 422 516 926 Solar 290 956 1465 1542 2190 3165 3570 4490 Battery Storage - 9 (31) (46) (126) (226) (232) (274) Imports 403 360 274 301 325 303 350 440 Demand Response - - - - - - - - Hydrogen - - - - - - - - BTM Solar 37 135 165 225 344 460 601 763 Load 8771 9155 9258 9512 10123 10878 12308 14203 Excess Generation 13 127 470 386 546 811 486 705
Low Carbon Price Nuclear (Palo Verde) 5148 5148 5148 5148 5148 5148 5148 5148 Nuclear (SMR) - - - - - - - - Gas - Steam Turbine 127 23 3 3 - - - - Gas - Combined Cycle 1803 1433 955 1021 1036 971 1189 1333 Gas - Combustion Turbine 1001 1107 711 750 678 571 1063 1333 Biomass - - - - - - - - Geothermal - - - - - - - - Wind - - 609 624 604 523 642 936 Solar 289 958 1476 1548 2179 3178 3576 4573 Battery Storage - 11 (32) (45) (124) (229) (234) (279) Imports 394 345 223 238 258 256 322 395 Demand Response - - - - - - - - Hydrogen - - - - - - - - BTM Solar 37 135 165 225 344 460 601 763 Load 8771 9155 9258 9512 10123 10878 12308 14203 Excess Generation 14 125 512 426 579 876 532 725
Attachment D-1 E3 EPE Report Model Results June Page 5 of 34
Scenario Resource Type 2021 2024 2025 2027 2031 2035 2040 2045Annual Energy (GWh)
Medium Carbon Price Nuclear (Palo Verde) 5148 5148 5148 5148 5148 5148 5148 5148 Nuclear (SMR) - - - - - - - - Gas - Steam Turbine 120 22 3 3 - - - - Gas - Combined Cycle 1822 1496 876 941 974 922 1115 1270 Gas - Combustion Turbine 983 1036 548 590 606 475 950 1199 Biomass - - - - - - - - Geothermal - - - - - - - - Wind - - 754 779 766 646 805 1098 Solar 290 961 1600 1663 2221 3268 3695 4746 Battery Storage - 7 (37) (47) (122) (230) (242) (293) Imports 399 354 200 210 187 190 235 271 Demand Response - - - - - - - - Hydrogen - - - - - - - - BTM Solar 37 135 165 225 344 460 601 763 Load 8771 9155 9258 9512 10123 10878 12308 14203 Excess Generation 13 121 763 676 588 911 560 726
High Carbon Price Nuclear (Palo Verde) 5148 5148 5148 5148 5148 5148 5148 5148 Nuclear (SMR) - - - - - - - - Gas - Steam Turbine 119 21 2 3 0 - - - Gas - Combined Cycle 1835 1540 658 724 862 872 979 832 Gas - Combustion Turbine 962 989 428 458 488 393 630 544 Biomass - - - - - - - - Geothermal - - - - - - - - Wind - - 869 904 927 776 940 832 Solar 290 963 1847 1900 2307 3272 4088 6364 Battery Storage - 2 (40) (46) (115) (230) (271) (474) Imports 408 362 181 195 162 187 193 192 Demand Response - - - - - - - - Hydrogen - - - - - - - - BTM Solar 37 135 165 225 344 460 601 763 Load 8771 9155 9258 9512 10123 10878 12308 14203 Excess Generation 13 120 1270 1182 882 1065 1041 1596
80 Clean by 2035 Nuclear (Palo Verde) 5148 5148 5148 5148 5148 5148 5148 5148 Nuclear (SMR) - - - - - - - - Gas - Steam Turbine 140 34 7 3 - - - - Gas - Combined Cycle 1767 1373 1022 1111 1127 1050 1159 1295 Gas - Combustion Turbine 1027 1169 836 880 766 696 1057 1256 Biomass - - - - - - - - Geothermal - - - - - - - - Wind - - 379 382 375 331 683 1029 Solar 289 952 1466 1551 2212 3155 3653 4715 Battery Storage - 12 (26) (48) (129) (224) (234) (290) Imports 391 336 261 260 278 264 240 286 Demand Response - - - - - - - - Hydrogen - - - - - - - - BTM Solar 37 135 165 225 344 460 601 763 Load 8771 9155 9258 9512 10123 10878 12308 14203 Excess Generation 14 130 431 343 514 770 469 738
Attachment D-1 E3 EPE Report Model Results June Page 6 of 34
Scenario Resource Type 2021 2024 2025 2027 2031 2035 2040 2045Annual Energy (GWh)
20 CO2 Red by 2040 Nuclear (Palo Verde) 5148 5148 5148 5148 5148 5148 5148 5148 Nuclear (SMR) - - - - - - - - Gas - Steam Turbine 140 34 7 3 - - - - Gas - Combined Cycle 1767 1373 1022 1111 1130 1065 1318 1342 Gas - Combustion Turbine 1027 1169 836 880 773 751 1249 1353 Biomass - - - - - - - - Geothermal - - - - - - - - Wind - - 379 382 375 336 409 927 Solar 289 952 1466 1549 2204 3061 3445 4548 Battery Storage - 12 (26) (48) (129) (217) (220) (277) Imports 391 336 261 262 277 274 357 397 Demand Response - - - - - - - - Hydrogen - - - - - - - - BTM Solar 37 135 165 225 344 460 601 763 Load 8771 9155 9258 9512 10123 10878 12308 14203 Excess Generation 14 130 431 345 491 655 371 705
40 CO2 Red by 2040 Nuclear (Palo Verde) 5148 5148 5148 5148 5148 5148 5148 5148 Nuclear (SMR) - - - - - - - - Gas - Steam Turbine 140 34 7 3 - - - - Gas - Combined Cycle 1767 1373 1022 1111 1127 1051 1133 1135 Gas - Combustion Turbine 1027 1169 836 880 766 696 980 985 Biomass - - - - - - - - Geothermal - - - - - - - - Wind - - 379 382 375 331 763 1034 Solar 289 953 1466 1549 2211 3151 3692 5268 Battery Storage - 12 (26) (48) (128) (224) (241) (350) Imports 391 336 261 262 279 265 232 219 Demand Response - - - - - - - - Hydrogen - - - - - - - - BTM Solar 37 135 165 225 344 460 601 763 Load 8771 9155 9258 9512 10123 10878 12308 14203 Excess Generation 14 129 432 345 515 768 533 965
60 CO2 Red by 2040 Nuclear (Palo Verde) 5148 5148 5148 5148 5148 5148 5148 5148 Nuclear (SMR) - - - - - - - - Gas - Steam Turbine 140 34 7 3 - - - - Gas - Combined Cycle 1767 1373 1022 1111 1127 1052 864 852 Gas - Combustion Turbine 1027 1169 836 880 766 698 561 560 Biomass - - - - - - - - Geothermal - - - - - - - - Wind - - 379 382 375 331 927 838 Solar 289 953 1466 1552 2213 3150 4319 6337 Battery Storage - 12 (26) (48) (128) (224) (276) (470) Imports 391 336 261 259 278 263 164 174 Demand Response - - - - - - - - Hydrogen - - - - - - - - BTM Solar 37 135 165 225 344 460 601 763 Load 8771 9155 9258 9512 10123 10878 12308 14203 Excess Generation 14 130 432 342 513 769 1338 1586
Attachment D-1 E3 EPE Report Model Results June Page 7 of 34
Scenario Resource Type 2021 2024 2025 2027 2031 2035 2040 2045Annual Energy (GWh)
80 CO2 Red by 2040 Nuclear (Palo Verde) 5148 5148 5148 5148 5148 5148 5148 5148 Nuclear (SMR) - - - - - - - - Gas - Steam Turbine 140 34 3 3 - - - - Gas - Combined Cycle 1767 1373 910 976 1017 907 577 550 Gas - Combustion Turbine 1027 1169 734 777 696 468 168 183 Biomass - - - - - - - - Geothermal - - - - - - - - Wind - - 638 654 638 532 1260 1231 Solar 289 952 1463 1531 2158 3371 4812 6758 Battery Storage - 12 (30) (45) (123) (239) (338) (517) Imports 391 336 227 241 245 232 80 88 Demand Response - - - - - - - - Hydrogen - - - - - - - - BTM Solar 37 135 165 225 344 460 601 763 Load 8771 9155 9258 9512 10123 10878 12308 14203 Excess Generation 14 130 546 461 605 1183 2430 2751
90 CO2 Red by 2040 Nuclear (Palo Verde) 5148 5148 5148 5148 5148 5148 5148 5148 Nuclear (SMR) - - - - - - - - Gas - Steam Turbine 140 34 3 3 - - - - Gas - Combined Cycle 1767 1373 910 978 1018 808 340 313 Gas - Combustion Turbine 1027 1169 736 776 696 320 41 58 Biomass - - - - - - - - Geothermal - - - - - - - - Wind - - 637 655 639 463 1965 1995 Solar 289 952 1462 1527 2156 3764 4483 6350 Battery Storage - 12 (30) (45) (123) (278) (311) (472) Imports 391 336 226 244 245 193 40 47 Demand Response - - - - - - - - Hydrogen - - - - - - - - BTM Solar 37 135 165 225 344 460 601 763 Load 8771 9155 9258 9512 10123 10878 12308 14203 Excess Generation 14 130 547 465 603 1440 3210 3645
100 CO2 Red by 2040 Nuclear (Palo Verde) 5148 5148 5148 5148 5148 5148 5148 5148 Nuclear (SMR) - - - - - - - - Gas - Steam Turbine 140 34 6 3 - - - - Gas - Combined Cycle 1767 1373 984 1072 1095 716 - - Gas - Combustion Turbine 1027 1169 811 849 745 180 - - Biomass - - - - - - - - Geothermal - - - - - - - - Wind - - 455 462 452 210 969 1406 Solar 289 952 1467 1545 2197 4287 6734 7595 Battery Storage - 12 (27) (47) (127) (348) (1163) (1402) Imports 391 336 251 255 270 225 - - Demand Response - - - - - - - - Hydrogen - - - - - - - - BTM Solar 37 135 165 225 344 460 620 1455 Load 8771 9155 9258 9512 10123 10878 12308 14203 Excess Generation 14 130 458 372 536 2237 10954 12232
Attachment D-1 E3 EPE Report Model Results June Page 8 of 34
Scenario Resource Type 2021 2024 2025 2027 2031 2035 2040 2045Annual Energy (GWh)
100 CO2 Red by 2040 (w H2) Nuclear (Palo Verde) 5148 5148 5148 5148 5148 5148 5148 5148 Nuclear (SMR) - - - - - - - - Gas - Steam Turbine 140 34 3 4 - - - - Gas - Combined Cycle 1767 1373 868 928 983 689 - - Gas - Combustion Turbine 1027 1169 692 732 627 210 - - Biomass - - - - - - - - Geothermal - - - - - - - - Wind - - 743 765 755 469 1700 1650 Solar 289 952 1460 1525 2217 4074 4752 6753 Battery Storage - 12 (31) (46) (122) (300) (336) (515) Imports 391 336 209 230 171 129 - - Demand Response - - - - - - - - Hydrogen - - - - - - 442 404 BTM Solar 37 135 165 225 344 460 601 763 Load 8771 9155 9258 9512 10123 10878 12308 14203 Excess Generation 14 130 616 528 575 1636 3102 3585
Attachment D-1 E3 EPE Report Model Results June Page 9 of 34
Scenario Resource TypeLeast-Cost (Reference Case) Nuclear (Palo Verde)
Nuclear (SMR)Gas - Steam TurbineGas - Combined CycleGas - Combustion TurbineBiomassGeothermalWindSolarBattery StorageImportsDemand ResponseHydrogenBTM SolarLoadExcess Generation
Least-Cost Case + ETA Resources Nuclear (Palo Verde)Nuclear (SMR)Gas - Steam TurbineGas - Combined CycleGas - Combustion TurbineBiomassGeothermalWindSolarBattery StorageImportsDemand ResponseHydrogenBTM SolarLoadExcess Generation
Separate System Planning Nuclear (Palo Verde)Nuclear (SMR)Gas - Steam TurbineGas - Combined CycleGas - Combustion TurbineBiomassGeothermalWindSolarBattery StorageImportsDemand ResponseHydrogenBTM SolarLoadExcess Generation
2021 2024 2025 2027 2031 2035 2040 2045622 622 622 622 622 622 622 622 - - - - - - - - 426 307 307 307 234 - - - 493 493 493 493 493 266 266 266 503 731 731 731 668 952 1111 1318 - - - - - - - - - - - - - - - - - - 109 109 109 109 109 196 115 385 629 629 904 1241 1298 1580 - 50 183 256 582 1032 1116 1284 - - - - - - - - 46 53 56 61 71 81 93 93
- - - - - - - - 18 65 80 108 166 221 289 368
- - - - - - - - - - - - - - - - 622 622 622 622 622 622 622 622 - - - - - - - - 426 307 307 307 234 - - - 493 493 493 493 493 266 266 266 503 731 731 731 668 879 999 1154 - - - - - - - - - - - - - - - - - - 204 204 204 204 204 264 115 385 629 629 887 1482 1684 2050 - 50 183 236 552 1084 1252 1698 - - - - - - - - 46 53 56 61 71 81 93 93
- - - - - - - - 18 65 80 108 166 221 289 368
- - - - - - - - - - - - - - - - 622 622 622 622 622 622 622 622 - - - - - - - - 426 307 307 307 234 - - - 493 493 493 493 493 266 266 266 503 731 731 731 668 835 835 989 - - - - - - - - - - - - - - - - - - 87 87 87 87 87 159 115 385 707 707 905 1667 2322 2639 - 50 271 293 634 1480 2207 2579 - - - - - - - - 46 53 56 61 71 81 93 93
- - - - - - - - 18 65 80 108 166 221 289 368
- - - - - - - - - - - - - - - -
Installed Capacity (MW)
Attachment D-1 E3 EPE Report Model Results June Page 10 of 34
Scenario Resource TypeSeparate System Planning (w H2) Nuclear (Palo Verde)
Nuclear (SMR)Gas - Steam TurbineGas - Combined CycleGas - Combustion TurbineBiomassGeothermalWindSolarBattery StorageImportsDemand ResponseHydrogenBTM SolarLoadExcess Generation
Low Load Growth Nuclear (Palo Verde)Nuclear (SMR)Gas - Steam TurbineGas - Combined CycleGas - Combustion TurbineBiomassGeothermalWindSolarBattery StorageImportsDemand ResponseHydrogenBTM SolarLoadExcess Generation
High Load Growth Nuclear (Palo Verde)Nuclear (SMR)Gas - Steam TurbineGas - Combined CycleGas - Combustion TurbineBiomassGeothermalWindSolarBattery StorageImportsDemand ResponseHydrogenBTM SolarLoadExcess Generation
2021 2024 2025 2027 2031 2035 2040 2045Installed Capacity (MW)
622 622 622 622 622 622 622 622 - - - - - - - - 426 307 307 307 234 - - - 493 493 493 493 493 266 266 266 503 731 731 731 668 825 825 989 - - - - - - - - - - - - - - - - - - 129 129 129 129 172 212 115 385 672 672 936 1290 1645 1990 - 50 269 291 601 1038 1420 1741 - - - - - - - - 46 53 56 61 71 81 93 93
- - - - - 121 195 206 18 65 80 108 166 221 289 368
- - - - - - - - - - - - - - - - 622 622 622 622 622 622 622 622 - - - - - - - - 426 307 307 307 234 - - - 493 493 493 493 493 266 266 266 503 731 731 731 668 847 989 1182 - - - - - - - - - - - - - - - - - - 96 96 96 96 96 153 115 385 541 541 743 1162 1216 1489 - 50 192 193 454 1012 1093 1257 - - - - - - - - 46 53 56 61 71 81 93 93
- - - - - - - - 18 65 80 108 166 221 289 368
- - - - - - - - - - - - - - - - 622 622 622 622 622 622 622 622 - - - - - - - - 426 307 307 307 234 - - - 493 493 493 493 493 266 266 266 503 731 731 731 668 1062 1237 1451 - - - - - - - - - - - - - - - - - - 123 123 123 123 123 266 115 385 677 677 1046 1309 1369 1660 - 50 249 342 716 1048 1136 1307 - - - - - - - - 46 53 56 61 71 81 93 93
- - - - - - - - 18 65 80 108 166 221 289 368
- - - - - - - - - - - - - - - -
Attachment D-1 E3 EPE Report Model Results June Page 11 of 34
Scenario Resource TypeHigh DG Nuclear (Palo Verde)
Nuclear (SMR)Gas - Steam TurbineGas - Combined CycleGas - Combustion TurbineBiomassGeothermalWindSolarBattery StorageImportsDemand ResponseHydrogenBTM SolarLoadExcess Generation
High DSM Nuclear (Palo Verde)Nuclear (SMR)Gas - Steam TurbineGas - Combined CycleGas - Combustion TurbineBiomassGeothermalWindSolarBattery StorageImportsDemand ResponseHydrogenBTM SolarLoadExcess Generation
No New Gas Nuclear (Palo Verde)Nuclear (SMR)Gas - Steam TurbineGas - Combined CycleGas - Combustion TurbineBiomassGeothermalWindSolarBattery StorageImportsDemand ResponseHydrogenBTM SolarLoadExcess Generation
2021 2024 2025 2027 2031 2035 2040 2045Installed Capacity (MW)
622 622 622 622 622 622 622 622 - - - - - - - - 426 307 307 307 234 - - - 493 493 493 493 493 266 266 266 503 731 731 731 668 942 1078 1322 - - - - - - - - - - - - - - - - - - 106 106 106 106 106 249 115 385 587 587 761 1011 1092 1023 - 50 183 252 571 1043 1151 1267 - - - - - - - - 46 53 56 61 71 81 93 93
- - - - - - - - 42 169 210 293 455 614 809 1032
- - - - - - - - - - - - - - - - 622 622 622 622 622 622 622 622 - - - - - - - - 426 307 307 307 234 - - - 493 493 493 493 493 266 266 266 503 731 731 731 668 801 926 1105 - - - - - - - - - - - - - - - - - - 70 70 70 70 70 127 115 385 558 558 641 1146 1189 1384 - 50 187 191 425 1000 1070 1209 - - - - - - - - 49 66 71 82 100 101 103 103
- - - - - - - - 18 65 80 108 166 221 289 368
- - - - - - - - - - - - - - - - 622 622 622 622 622 622 622 622 - - - - - - - - 426 307 307 307 234 - - - 493 493 493 493 493 266 266 266 503 731 731 731 668 668 668 668 - - - - - - - - - - - - - - - - - - 132 132 132 132 132 132 115 385 629 629 908 2129 2734 3644 - 50 183 251 573 1864 2496 3634 - - - - - - - - 46 53 56 61 71 81 93 93
- - - - - - - - 18 65 80 108 166 221 289 368
- - - - - - - - - - - - - - - -
Attachment D-1 E3 EPE Report Model Results June Page 12 of 34
Scenario Resource TypeNo Lifetime Extensions Nuclear (Palo Verde)
Nuclear (SMR)Gas - Steam TurbineGas - Combined CycleGas - Combustion TurbineBiomassGeothermalWindSolarBattery StorageImportsDemand ResponseHydrogenBTM SolarLoadExcess Generation
High Gas Price Nuclear (Palo Verde)Nuclear (SMR)Gas - Steam TurbineGas - Combined CycleGas - Combustion TurbineBiomassGeothermalWindSolarBattery StorageImportsDemand ResponseHydrogenBTM SolarLoadExcess Generation
Low Carbon Price Nuclear (Palo Verde)Nuclear (SMR)Gas - Steam TurbineGas - Combined CycleGas - Combustion TurbineBiomassGeothermalWindSolarBattery StorageImportsDemand ResponseHydrogenBTM SolarLoadExcess Generation
2021 2024 2025 2027 2031 2035 2040 2045Installed Capacity (MW)
622 622 622 622 622 622 622 622 - - - - - - - - 426 234 234 144 144 - - - 493 493 493 266 266 266 266 266 503 731 731 914 851 951 1109 1318 - - - - - - - - - - - - - - - - - - 118 118 118 118 118 196 115 385 769 769 1018 1235 1292 1579 - 50 230 434 743 1031 1115 1284 - - - - - - - - 46 53 56 61 71 81 93 93
- - - - - - - - 18 65 80 108 166 221 289 368
- - - - - - - - - - - - - - - - 622 622 622 622 622 622 622 622 - - - - - - - - 426 307 307 307 234 - - - 493 493 493 493 493 266 266 266 503 731 731 731 668 930 1088 1274 - - - - - - - - - - - - - - - - - - 142 142 142 142 142 264 115 385 629 629 905 1312 1369 1712 - 50 183 249 570 1047 1131 1312 - - - - - - - - 46 53 56 61 71 81 93 93
- - - - - - - - 18 65 80 108 166 221 289 368
- - - - - - - - - - - - - - - - 622 622 622 622 622 622 622 622 - - - - - - - - 426 307 307 307 234 - - - 493 493 493 493 493 266 266 266 503 731 731 731 668 920 1078 1267 - - - - - - - - - - - - - - - - - - 181 181 181 181 181 267 115 385 629 629 894 1312 1369 1747 - 50 183 240 559 1047 1131 1319 - - - - - - - - 46 53 56 61 71 81 93 93
- - - - - - - - 18 65 80 108 166 221 289 368
- - - - - - - - - - - - - - - -
Attachment D-1 E3 EPE Report Model Results June Page 13 of 34
Scenario Resource TypeMedium Carbon Price Nuclear (Palo Verde)
Nuclear (SMR)Gas - Steam TurbineGas - Combined CycleGas - Combustion TurbineBiomassGeothermalWindSolarBattery StorageImportsDemand ResponseHydrogenBTM SolarLoadExcess Generation
High Carbon Price Nuclear (Palo Verde)Nuclear (SMR)Gas - Steam TurbineGas - Combined CycleGas - Combustion TurbineBiomassGeothermalWindSolarBattery StorageImportsDemand ResponseHydrogenBTM SolarLoadExcess Generation
80 Clean by 2035 Nuclear (Palo Verde)Nuclear (SMR)Gas - Steam TurbineGas - Combined CycleGas - Combustion TurbineBiomassGeothermalWindSolarBattery StorageImportsDemand ResponseHydrogenBTM SolarLoadExcess Generation
2021 2024 2025 2027 2031 2035 2040 2045Installed Capacity (MW)
622 622 622 622 622 622 622 622 - - - - - - - - 426 307 307 307 234 - - - 493 493 493 493 493 266 266 266 503 731 731 731 668 909 1060 1248 - - - - - - - - - - - - - - - - - - 236 236 236 236 236 300 115 385 724 724 882 1312 1390 1813 - 50 183 228 547 1047 1136 1343 - - - - - - - - 46 53 56 61 71 81 93 93
- - - - - - - - 18 65 80 108 166 221 289 368
- - - - - - - - - - - - - - - - 622 622 622 622 622 622 622 622 - - - - - - - - 426 307 307 307 234 - - - 493 493 493 493 493 266 266 266 503 731 731 731 668 901 1001 1024 - - - - - - - - - - - - - - - - - - 300 300 300 300 300 301 115 385 927 927 972 1312 1640 2583 - 50 183 211 521 1047 1189 2082 - - - - - - - - 46 53 56 61 71 81 93 93
- - - - - - - - 18 65 80 108 166 221 289 368
- - - - - - - - - - - - - - - - 622 622 622 622 622 622 622 622 - - - - - - - - 426 307 307 307 234 - - - 493 493 493 493 493 266 266 266 503 731 731 731 668 938 1075 1253 - - - - - - - - - - - - - - - - - - 109 109 109 109 194 285 115 385 629 629 915 1312 1369 1805 - 50 183 256 580 1047 1131 1331 - - - - - - - - 46 53 56 61 71 81 93 93
- - - - - - - - 18 65 80 108 166 221 289 368
- - - - - - - - - - - - - - - -
Attachment D-1 E3 EPE Report Model Results June Page 14 of 34
Scenario Resource Type20 CO2 Red by 2040 Nuclear (Palo Verde)
Nuclear (SMR)Gas - Steam TurbineGas - Combined CycleGas - Combustion TurbineBiomassGeothermalWindSolarBattery StorageImportsDemand ResponseHydrogenBTM SolarLoadExcess Generation
40 CO2 Red by 2040 Nuclear (Palo Verde)Nuclear (SMR)Gas - Steam TurbineGas - Combined CycleGas - Combustion TurbineBiomassGeothermalWindSolarBattery StorageImportsDemand ResponseHydrogenBTM SolarLoadExcess Generation
60 CO2 Red by 2040 Nuclear (Palo Verde)Nuclear (SMR)Gas - Steam TurbineGas - Combined CycleGas - Combustion TurbineBiomassGeothermalWindSolarBattery StorageImportsDemand ResponseHydrogenBTM SolarLoadExcess Generation
2021 2024 2025 2027 2031 2035 2040 2045Installed Capacity (MW)
622 622 622 622 622 622 622 622 - - - - - - - - 426 307 307 307 234 - - - 493 493 493 493 493 266 266 266 503 731 731 731 668 952 1111 1270 - - - - - - - - - - - - - - - - - - 109 109 109 109 109 264 115 385 629 629 904 1242 1299 1733 - 50 183 256 582 1032 1116 1316 - - - - - - - - 46 53 56 61 71 81 93 93
- - - - - - - - 18 65 80 108 166 221 289 368
- - - - - - - - - - - - - - - - 622 622 622 622 622 622 622 622 - - - - - - - - 426 307 307 307 234 - - - 493 493 493 493 493 266 266 266 503 731 731 731 668 939 1064 1178 - - - - - - - - - - - - - - - - - - 109 109 109 109 221 300 115 385 629 629 915 1310 1390 2052 - 50 183 256 580 1045 1135 1573 - - - - - - - - 46 53 56 61 71 81 93 93
- - - - - - - - 18 65 80 108 166 221 289 368
- - - - - - - - - - - - - - - - 622 622 622 622 622 622 622 622 - - - - - - - - 426 307 307 307 234 - - - 493 493 493 493 493 266 266 266 503 731 731 731 668 938 987 1029 - - - - - - - - - - - - - - - - - - 109 109 109 109 300 301 115 385 629 629 915 1311 1822 2573 - 50 183 256 580 1046 1194 2062 - - - - - - - - 46 53 56 61 71 81 93 93
- - - - - - - - 18 65 80 108 166 221 289 368
- - - - - - - - - - - - - - - -
Attachment D-1 E3 EPE Report Model Results June Page 15 of 34
Scenario Resource Type80 CO2 Red by 2040 Nuclear (Palo Verde)
Nuclear (SMR)Gas - Steam TurbineGas - Combined CycleGas - Combustion TurbineBiomassGeothermalWindSolarBattery StorageImportsDemand ResponseHydrogenBTM SolarLoadExcess Generation
90 CO2 Red by 2040 Nuclear (Palo Verde)Nuclear (SMR)Gas - Steam TurbineGas - Combined CycleGas - Combustion TurbineBiomassGeothermalWindSolarBattery StorageImportsDemand ResponseHydrogenBTM SolarLoadExcess Generation
100 CO2 Red by 2040 Nuclear (Palo Verde)Nuclear (SMR)Gas - Steam TurbineGas - Combined CycleGas - Combustion TurbineBiomassGeothermalWindSolarBattery StorageImportsDemand ResponseHydrogenBTM SolarLoadExcess Generation
2021 2024 2025 2027 2031 2035 2040 2045Installed Capacity (MW)
622 622 622 622 622 622 622 622 - - - - - - - - 426 307 307 307 234 - - - 493 493 493 493 493 266 266 266 503 731 731 731 668 885 885 885 - - - - - - - - - - - - - - - - - - 192 192 192 192 507 507 115 385 629 629 891 1475 2226 3013 - 50 183 238 556 1080 1416 2455 - - - - - - - - 46 53 56 61 71 81 93 93
- - - - - - - - 18 65 80 108 166 221 289 368
- - - - - - - - - - - - - - - - 622 622 622 622 622 622 622 622 - - - - - - - - 426 307 307 307 234 - - - 493 493 493 493 493 266 266 266 503 731 731 731 668 819 819 819 - - - - - - - - - - - - - - - - - - 192 192 192 192 764 772 115 385 628 628 891 1681 2284 3081 - 50 183 238 556 1276 1601 2627 - - - - - - - - 46 53 56 61 71 81 93 93
- - - - - - - - 18 65 80 108 166 221 289 368
- - - - - - - - - - - - - - - - 622 622 622 622 622 622 622 622 - - - - - - - - 426 307 307 307 234 - - - 493 493 493 493 493 266 266 266 503 731 731 731 668 668 668 668 - - - - - - - - - - - - - - - - - - 132 132 132 132 1228 1605 115 385 629 629 908 2129 4851 5217 - 50 183 251 573 1864 6191 7470 - - - - - - - - 46 53 56 61 71 81 93 93
- - - - - - - - 18 65 80 108 166 221 298 701
- - - - - - - - - - - - - - - -
Attachment D-1 E3 EPE Report Model Results June Page 16 of 34
Scenario Resource Type100 CO2 Red by 2040 (w H2) Nuclear (Palo Verde)
Nuclear (SMR)Gas - Steam TurbineGas - Combined CycleGas - Combustion TurbineBiomassGeothermalWindSolarBattery StorageImportsDemand ResponseHydrogenBTM SolarLoadExcess Generation
2021 2024 2025 2027 2031 2035 2040 2045Installed Capacity (MW)
622 622 622 622 622 622 622 622 - - - - - - - - 426 307 307 307 234 - - - 493 493 493 493 493 266 - - 503 731 731 731 668 774 - - - - - - - - - - - - - - - - - - - - 231 231 231 231 687 687 115 385 628 628 883 1801 2353 3200 - 50 183 233 548 1403 1804 2864 - - - - - - - - 46 53 56 61 71 81 93 93
- - - - - - 1040 1040 18 65 80 108 166 221 289 368
- - - - - - - - - - - - - - - -
Attachment D-1 E3 EPE Report Model Results June Page 17 of 34
Scenario Resource TypeLeast-Cost (Reference Case) Nuclear (Palo Verde)
Nuclear (SMR)Gas - Steam TurbineGas - Combined CycleGas - Combustion TurbineBiomassGeothermalWindSolarBattery StorageImportsDemand ResponseHydrogenBTM SolarLoadExcess Generation
Least-Cost Case + ETA Resources Nuclear (Palo Verde)Nuclear (SMR)Gas - Steam TurbineGas - Combined CycleGas - Combustion TurbineBiomassGeothermalWindSolarBattery StorageImportsDemand ResponseHydrogenBTM SolarLoadExcess Generation
Separate System Planning Nuclear (Palo Verde)Nuclear (SMR)Gas - Steam TurbineGas - Combined CycleGas - Combustion TurbineBiomassGeothermalWindSolarBattery StorageImportsDemand ResponseHydrogenBTM SolarLoadExcess Generation
2021 2024 2025 2027 2031 2035 2040 2045- - - - - - - - - - - - - - - - - - - - - - - - - - - - - - - - - 228 228 228 228 512 671 878 - - - - - - - - - - - - - - - - - - 109 109 109 109 109 196 - 270 514 514 789 1196 1280 1842 - 50 183 256 582 1032 1116 1334 - - - - - - - - 46 53 56 61 71 81 93 93
- - - - - - - - 18 65 80 108 166 221 289 368
- - - - - - - - - - - - - - - - - - - - - - - - - - - - - - - - - - - - - - - - - - - - - - - - - 228 228 228 228 439 559 714 - - - - - - - - - - - - - - - - - - 204 204 204 204 204 264 - 270 514 514 772 1437 1666 2312 - 50 183 236 552 1084 1252 1748 - - - - - - - - 46 53 56 61 71 81 93 93
- - - - - - - - 18 65 80 108 166 221 289 368
- - - - - - - - - - - - - - - - - - - - - - - - - - - - - - - - - - - - - - - - - - - - - - - - - 228 228 228 228 395 395 549 - - - - - - - - - - - - - - - - - - 87 87 87 87 87 159 - 270 592 592 790 1622 2304 2901 - 50 271 293 634 1480 2207 2629 - - - - - - - - 46 53 56 61 71 81 93 93
- - - - - - - - 18 65 80 108 166 221 289 368
- - - - - - - - - - - - - - - -
Cumulative Capacity Additions (MW)
Attachment D-1 E3 EPE Report Model Results June Page 18 of 34
Scenario Resource TypeSeparate System Planning (w H2) Nuclear (Palo Verde)
Nuclear (SMR)Gas - Steam TurbineGas - Combined CycleGas - Combustion TurbineBiomassGeothermalWindSolarBattery StorageImportsDemand ResponseHydrogenBTM SolarLoadExcess Generation
Low Load Growth Nuclear (Palo Verde)Nuclear (SMR)Gas - Steam TurbineGas - Combined CycleGas - Combustion TurbineBiomassGeothermalWindSolarBattery StorageImportsDemand ResponseHydrogenBTM SolarLoadExcess Generation
High Load Growth Nuclear (Palo Verde)Nuclear (SMR)Gas - Steam TurbineGas - Combined CycleGas - Combustion TurbineBiomassGeothermalWindSolarBattery StorageImportsDemand ResponseHydrogenBTM SolarLoadExcess Generation
2021 2024 2025 2027 2031 2035 2040 2045Cumulative Capacity Additions (MW)
- - - - - - - - - - - - - - - - - - - - - - - - - - - - - - - - - 228 228 228 228 385 385 549 - - - - - - - - - - - - - - - - - - 129 129 129 129 172 212 - 270 557 557 821 1245 1627 2252 - 50 269 291 601 1038 1420 1791 - - - - - - - - 46 53 56 61 71 81 93 93
- - - - - 121 195 206 18 65 80 108 166 221 289 368
- - - - - - - - - - - - - - - - - - - - - - - - - - - - - - - - - - - - - - - - - - - - - - - - - 228 228 228 228 407 549 742 - - - - - - - - - - - - - - - - - - 96 96 96 96 96 153 - 270 426 426 628 1117 1198 1751 - 50 192 193 454 1012 1093 1307 - - - - - - - - 46 53 56 61 71 81 93 93
- - - - - - - - 18 65 80 108 166 221 289 368
- - - - - - - - - - - - - - - - - - - - - - - - - - - - - - - - - - - - - - - - - - - - - - - - - 228 228 228 228 622 797 1011 - - - - - - - - - - - - - - - - - - 123 123 123 123 123 266 - 270 562 562 931 1264 1351 1922 - 50 249 342 716 1048 1136 1357 - - - - - - - - 46 53 56 61 71 81 93 93
- - - - - - - - 18 65 80 108 166 221 289 368
- - - - - - - - - - - - - - - -
Attachment D-1 E3 EPE Report Model Results June Page 19 of 34
Scenario Resource TypeHigh DG Nuclear (Palo Verde)
Nuclear (SMR)Gas - Steam TurbineGas - Combined CycleGas - Combustion TurbineBiomassGeothermalWindSolarBattery StorageImportsDemand ResponseHydrogenBTM SolarLoadExcess Generation
High DSM Nuclear (Palo Verde)Nuclear (SMR)Gas - Steam TurbineGas - Combined CycleGas - Combustion TurbineBiomassGeothermalWindSolarBattery StorageImportsDemand ResponseHydrogenBTM SolarLoadExcess Generation
No New Gas Nuclear (Palo Verde)Nuclear (SMR)Gas - Steam TurbineGas - Combined CycleGas - Combustion TurbineBiomassGeothermalWindSolarBattery StorageImportsDemand ResponseHydrogenBTM SolarLoadExcess Generation
2021 2024 2025 2027 2031 2035 2040 2045Cumulative Capacity Additions (MW)
- - - - - - - - - - - - - - - - - - - - - - - - - - - - - - - - - 228 228 228 228 502 638 882 - - - - - - - - - - - - - - - - - - 106 106 106 106 106 249 - 270 472 472 646 966 1074 1285 - 50 183 252 571 1043 1151 1317 - - - - - - - - 46 53 56 61 71 81 93 93
- - - - - - - - 42 169 210 293 455 614 809 1032
- - - - - - - - - - - - - - - - - - - - - - - - - - - - - - - - - - - - - - - - - - - - - - - - - 228 228 228 228 361 486 665 - - - - - - - - - - - - - - - - - - 70 70 70 70 70 127 - 270 443 443 526 1101 1171 1646 - 50 187 191 425 1000 1070 1259 - - - - - - - - 49 66 71 82 100 101 103 103
- - - - - - - - 18 65 80 108 166 221 289 368
- - - - - - - - - - - - - - - - - - - - - - - - - - - - - - - - - - - - - - - - - - - - - - - - - 228 228 228 228 228 228 228 - - - - - - - - - - - - - - - - - - 132 132 132 132 132 132 - 270 514 514 793 2084 2716 3906 - 50 183 251 573 1864 2496 3684 - - - - - - - - 46 53 56 61 71 81 93 93
- - - - - - - - 18 65 80 108 166 221 289 368
- - - - - - - - - - - - - - - -
Attachment D-1 E3 EPE Report Model Results June Page 20 of 34
Scenario Resource TypeNo Lifetime Extensions Nuclear (Palo Verde)
Nuclear (SMR)Gas - Steam TurbineGas - Combined CycleGas - Combustion TurbineBiomassGeothermalWindSolarBattery StorageImportsDemand ResponseHydrogenBTM SolarLoadExcess Generation
High Gas Price Nuclear (Palo Verde)Nuclear (SMR)Gas - Steam TurbineGas - Combined CycleGas - Combustion TurbineBiomassGeothermalWindSolarBattery StorageImportsDemand ResponseHydrogenBTM SolarLoadExcess Generation
Low Carbon Price Nuclear (Palo Verde)Nuclear (SMR)Gas - Steam TurbineGas - Combined CycleGas - Combustion TurbineBiomassGeothermalWindSolarBattery StorageImportsDemand ResponseHydrogenBTM SolarLoadExcess Generation
2021 2024 2025 2027 2031 2035 2040 2045Cumulative Capacity Additions (MW)
- - - - - - - - - - - - - - - - - - - - - - - - - - - - - - - - - 228 228 411 411 511 669 878 - - - - - - - - - - - - - - - - - - 118 118 118 118 118 196 - 270 654 654 903 1190 1274 1841 - 50 230 434 743 1031 1115 1334 - - - - - - - - 46 53 56 61 71 81 93 93
- - - - - - - - 18 65 80 108 166 221 289 368
- - - - - - - - - - - - - - - - - - - - - - - - - - - - - - - - - - - - - - - - - - - - - - - - - 228 228 228 228 490 648 834 - - - - - - - - - - - - - - - - - - 142 142 142 142 142 264 - 270 514 514 790 1267 1351 1974 - 50 183 249 570 1047 1131 1362 - - - - - - - - 46 53 56 61 71 81 93 93
- - - - - - - - 18 65 80 108 166 221 289 368
- - - - - - - - - - - - - - - - - - - - - - - - - - - - - - - - - - - - - - - - - - - - - - - - - 228 228 228 228 480 638 827 - - - - - - - - - - - - - - - - - - 181 181 181 181 181 267 - 270 514 514 779 1267 1351 2009 - 50 183 240 559 1047 1131 1369 - - - - - - - - 46 53 56 61 71 81 93 93
- - - - - - - - 18 65 80 108 166 221 289 368
- - - - - - - - - - - - - - - -
Attachment D-1 E3 EPE Report Model Results June Page 21 of 34
Scenario Resource TypeMedium Carbon Price Nuclear (Palo Verde)
Nuclear (SMR)Gas - Steam TurbineGas - Combined CycleGas - Combustion TurbineBiomassGeothermalWindSolarBattery StorageImportsDemand ResponseHydrogenBTM SolarLoadExcess Generation
High Carbon Price Nuclear (Palo Verde)Nuclear (SMR)Gas - Steam TurbineGas - Combined CycleGas - Combustion TurbineBiomassGeothermalWindSolarBattery StorageImportsDemand ResponseHydrogenBTM SolarLoadExcess Generation
80 Clean by 2035 Nuclear (Palo Verde)Nuclear (SMR)Gas - Steam TurbineGas - Combined CycleGas - Combustion TurbineBiomassGeothermalWindSolarBattery StorageImportsDemand ResponseHydrogenBTM SolarLoadExcess Generation
2021 2024 2025 2027 2031 2035 2040 2045Cumulative Capacity Additions (MW)
- - - - - - - - - - - - - - - - - - - - - - - - - - - - - - - - - 228 228 228 228 469 620 808 - - - - - - - - - - - - - - - - - - 236 236 236 236 236 300 - 270 609 609 767 1267 1372 2075 - 50 183 228 547 1047 1136 1393 - - - - - - - - 46 53 56 61 71 81 93 93
- - - - - - - - 18 65 80 108 166 221 289 368
- - - - - - - - - - - - - - - - - - - - - - - - - - - - - - - - - - - - - - - - - - - - - - - - - 228 228 228 228 461 561 584 - - - - - - - - - - - - - - - - - - 300 300 300 300 300 301 - 270 812 812 857 1267 1622 2845 - 50 183 211 521 1047 1189 2132 - - - - - - - - 46 53 56 61 71 81 93 93
- - - - - - - - 18 65 80 108 166 221 289 368
- - - - - - - - - - - - - - - - - - - - - - - - - - - - - - - - - - - - - - - - - - - - - - - - - 228 228 228 228 498 635 813 - - - - - - - - - - - - - - - - - - 109 109 109 109 194 285 - 270 514 514 800 1267 1351 2067 - 50 183 256 580 1047 1131 1381 - - - - - - - - 46 53 56 61 71 81 93 93
- - - - - - - - 18 65 80 108 166 221 289 368
- - - - - - - - - - - - - - - -
Attachment D-1 E3 EPE Report Model Results June Page 22 of 34
Scenario Resource Type20 CO2 Red by 2040 Nuclear (Palo Verde)
Nuclear (SMR)Gas - Steam TurbineGas - Combined CycleGas - Combustion TurbineBiomassGeothermalWindSolarBattery StorageImportsDemand ResponseHydrogenBTM SolarLoadExcess Generation
40 CO2 Red by 2040 Nuclear (Palo Verde)Nuclear (SMR)Gas - Steam TurbineGas - Combined CycleGas - Combustion TurbineBiomassGeothermalWindSolarBattery StorageImportsDemand ResponseHydrogenBTM SolarLoadExcess Generation
60 CO2 Red by 2040 Nuclear (Palo Verde)Nuclear (SMR)Gas - Steam TurbineGas - Combined CycleGas - Combustion TurbineBiomassGeothermalWindSolarBattery StorageImportsDemand ResponseHydrogenBTM SolarLoadExcess Generation
2021 2024 2025 2027 2031 2035 2040 2045Cumulative Capacity Additions (MW)
- - - - - - - - - - - - - - - - - - - - - - - - - - - - - - - - - 228 228 228 228 512 671 830 - - - - - - - - - - - - - - - - - - 109 109 109 109 109 264 - 270 514 514 789 1197 1281 1995 - 50 183 256 582 1032 1116 1366 - - - - - - - - 46 53 56 61 71 81 93 93
- - - - - - - - 18 65 80 108 166 221 289 368
- - - - - - - - - - - - - - - - - - - - - - - - - - - - - - - - - - - - - - - - - - - - - - - - - 228 228 228 228 499 624 738 - - - - - - - - - - - - - - - - - - 109 109 109 109 221 300 - 270 514 514 800 1265 1372 2314 - 50 183 256 580 1045 1135 1623 - - - - - - - - 46 53 56 61 71 81 93 93
- - - - - - - - 18 65 80 108 166 221 289 368
- - - - - - - - - - - - - - - - - - - - - - - - - - - - - - - - - - - - - - - - - - - - - - - - - 228 228 228 228 498 547 589 - - - - - - - - - - - - - - - - - - 109 109 109 109 300 301 - 270 514 514 800 1266 1804 2835 - 50 183 256 580 1046 1194 2112 - - - - - - - - 46 53 56 61 71 81 93 93
- - - - - - - - 18 65 80 108 166 221 289 368
- - - - - - - - - - - - - - - -
Attachment D-1 E3 EPE Report Model Results June Page 23 of 34
Scenario Resource Type80 CO2 Red by 2040 Nuclear (Palo Verde)
Nuclear (SMR)Gas - Steam TurbineGas - Combined CycleGas - Combustion TurbineBiomassGeothermalWindSolarBattery StorageImportsDemand ResponseHydrogenBTM SolarLoadExcess Generation
90 CO2 Red by 2040 Nuclear (Palo Verde)Nuclear (SMR)Gas - Steam TurbineGas - Combined CycleGas - Combustion TurbineBiomassGeothermalWindSolarBattery StorageImportsDemand ResponseHydrogenBTM SolarLoadExcess Generation
100 CO2 Red by 2040 Nuclear (Palo Verde)Nuclear (SMR)Gas - Steam TurbineGas - Combined CycleGas - Combustion TurbineBiomassGeothermalWindSolarBattery StorageImportsDemand ResponseHydrogenBTM SolarLoadExcess Generation
2021 2024 2025 2027 2031 2035 2040 2045Cumulative Capacity Additions (MW)
- - - - - - - - - - - - - - - - - - - - - - - - - - - - - - - - - 228 228 228 228 445 445 445 - - - - - - - - - - - - - - - - - - 192 192 192 192 507 507 - 270 514 514 776 1430 2208 3275 - 50 183 238 556 1080 1416 2505 - - - - - - - - 46 53 56 61 71 81 93 93
- - - - - - - - 18 65 80 108 166 221 289 368
- - - - - - - - - - - - - - - - - - - - - - - - - - - - - - - - - - - - - - - - - - - - - - - - - 228 228 228 228 379 379 379 - - - - - - - - - - - - - - - - - - 192 192 192 192 764 772 - 270 513 513 776 1636 2266 3343 - 50 183 238 556 1276 1601 2677 - - - - - - - - 46 53 56 61 71 81 93 93
- - - - - - - - 18 65 80 108 166 221 289 368
- - - - - - - - - - - - - - - - - - - - - - - - - - - - - - - - - - - - - - - - - - - - - - - - - 228 228 228 228 228 228 228 - - - - - - - - - - - - - - - - - - 132 132 132 132 1228 1605 - 270 514 514 793 2084 4833 5479 - 50 183 251 573 1864 6191 7470 - - - - - - - - 46 53 56 61 71 81 93 93
- - - - - - - - 18 65 80 108 166 221 298 701
- - - - - - - - - - - - - - - -
Attachment D-1 E3 EPE Report Model Results June Page 24 of 34
Scenario Resource Type100 CO2 Red by 2040 (w H2) Nuclear (Palo Verde)
Nuclear (SMR)Gas - Steam TurbineGas - Combined CycleGas - Combustion TurbineBiomassGeothermalWindSolarBattery StorageImportsDemand ResponseHydrogenBTM SolarLoadExcess Generation
2021 2024 2025 2027 2031 2035 2040 2045Cumulative Capacity Additions (MW)
- - - - - - - - - - - - - - - - - - - - - - - - - - - - - - - - - 228 228 228 228 334 - - - - - - - - - - - - - - - - - - - - 231 231 231 231 687 687 - 270 513 513 768 1756 2335 3462 - 50 183 233 548 1403 1804 2914 - - - - - - - - 46 53 56 61 71 81 93 93
- - - - - - 334 334 18 65 80 108 166 221 289 368
- - - - - - - - - - - - - - - -
Attachment D-1 E3 EPE Report Model Results June Page 25 of 34
Scenario Resource TypeLeast-Cost (Reference Case) Nuclear (Palo Verde)
Nuclear (SMR)Gas - Steam TurbineGas - Combined CycleGas - Combustion TurbineBiomassGeothermalWindSolarBattery StorageImportsDemand ResponseHydrogenBTM SolarLoadExcess Generation
Least-Cost Case + ETA Resources Nuclear (Palo Verde)Nuclear (SMR)Gas - Steam TurbineGas - Combined CycleGas - Combustion TurbineBiomassGeothermalWindSolarBattery StorageImportsDemand ResponseHydrogenBTM SolarLoadExcess Generation
Separate System Planning Nuclear (Palo Verde)Nuclear (SMR)Gas - Steam TurbineGas - Combined CycleGas - Combustion TurbineBiomassGeothermalWindSolarBattery StorageImportsDemand ResponseHydrogenBTM SolarLoadExcess Generation
2021 2024 2025 2027 2031 2035 2040 2045- - - - - - - - - - - - - - - - - (119) (119) (119) (192) (426) (426) (426) - - - - - (227) (227) (227) - - - - (63) (63) (63) (63) - - - - - - - - - - - - - - - - - - - - - - - - - - - - - (70) (97) (377) - - - - - - - (50) - - - - - - - - - - - - - - - - - - - - - - - - - - - - - - - - - - - - - - - - - - - - - - - - - - - - - - - - - - - - - - - - - (119) (119) (119) (192) (426) (426) (426) - - - - - (227) (227) (227) - - - - (63) (63) (63) (63) - - - - - - - - - - - - - - - - - - - - - - - - - - - - - (70) (97) (377) - - - - - - - (50) - - - - - - - - - - - - - - - - - - - - - - - - - - - - - - - - - - - - - - - - - - - - - - - - - - - - - - - - - - - - - - - - - (119) (119) (119) (192) (426) (426) (426) - - - - - (227) (227) (227) - - - - (63) (63) (63) (63) - - - - - - - - - - - - - - - - - - - - - - - - - - - - - (70) (97) (377) - - - - - - - (50) - - - - - - - - - - - - - - - - - - - - - - - - - - - - - - - - - - - - - - - - - - - - - - - -
Cumulative Capacity Retirements (MW)
Attachment D-1 E3 EPE Report Model Results June Page 26 of 34
Scenario Resource TypeSeparate System Planning (w H2) Nuclear (Palo Verde)
Nuclear (SMR)Gas - Steam TurbineGas - Combined CycleGas - Combustion TurbineBiomassGeothermalWindSolarBattery StorageImportsDemand ResponseHydrogenBTM SolarLoadExcess Generation
Low Load Growth Nuclear (Palo Verde)Nuclear (SMR)Gas - Steam TurbineGas - Combined CycleGas - Combustion TurbineBiomassGeothermalWindSolarBattery StorageImportsDemand ResponseHydrogenBTM SolarLoadExcess Generation
High Load Growth Nuclear (Palo Verde)Nuclear (SMR)Gas - Steam TurbineGas - Combined CycleGas - Combustion TurbineBiomassGeothermalWindSolarBattery StorageImportsDemand ResponseHydrogenBTM SolarLoadExcess Generation
2021 2024 2025 2027 2031 2035 2040 2045Cumulative Capacity Retirements (MW)
- - - - - - - - - - - - - - - - - (119) (119) (119) (192) (426) (426) (426) - - - - - (227) (227) (227) - - - - (63) (63) (63) (63) - - - - - - - - - - - - - - - - - - - - - - - - - - - - - (70) (97) (377) - - - - - - - (50) - - - - - - - - - - - - - - - - - - - - - - - - - - - - - - - - - - - - - - - - - - - - - - - - - - - - - - - - - - - - - - - - - (119) (119) (119) (192) (426) (426) (426) - - - - - (227) (227) (227) - - - - (63) (63) (63) (63) - - - - - - - - - - - - - - - - - - - - - - - - - - - - - (70) (97) (377) - - - - - - - (50) - - - - - - - - - - - - - - - - - - - - - - - - - - - - - - - - - - - - - - - - - - - - - - - - - - - - - - - - - - - - - - - - - (119) (119) (119) (192) (426) (426) (426) - - - - - (227) (227) (227) - - - - (63) (63) (63) (63) - - - - - - - - - - - - - - - - - - - - - - - - - - - - - (70) (97) (377) - - - - - - - (50) - - - - - - - - - - - - - - - - - - - - - - - - - - - - - - - - - - - - - - - - - - - - - - - -
Attachment D-1 E3 EPE Report Model Results June Page 27 of 34
Scenario Resource TypeHigh DG Nuclear (Palo Verde)
Nuclear (SMR)Gas - Steam TurbineGas - Combined CycleGas - Combustion TurbineBiomassGeothermalWindSolarBattery StorageImportsDemand ResponseHydrogenBTM SolarLoadExcess Generation
High DSM Nuclear (Palo Verde)Nuclear (SMR)Gas - Steam TurbineGas - Combined CycleGas - Combustion TurbineBiomassGeothermalWindSolarBattery StorageImportsDemand ResponseHydrogenBTM SolarLoadExcess Generation
No New Gas Nuclear (Palo Verde)Nuclear (SMR)Gas - Steam TurbineGas - Combined CycleGas - Combustion TurbineBiomassGeothermalWindSolarBattery StorageImportsDemand ResponseHydrogenBTM SolarLoadExcess Generation
2021 2024 2025 2027 2031 2035 2040 2045Cumulative Capacity Retirements (MW)
- - - - - - - - - - - - - - - - - (119) (119) (119) (192) (426) (426) (426) - - - - - (227) (227) (227) - - - - (63) (63) (63) (63) - - - - - - - - - - - - - - - - - - - - - - - - - - - - - (70) (97) (377) - - - - - - - (50) - - - - - - - - - - - - - - - - - - - - - - - - - - - - - - - - - - - - - - - - - - - - - - - - - - - - - - - - - - - - - - - - - (119) (119) (119) (192) (426) (426) (426) - - - - - (227) (227) (227) - - - - (63) (63) (63) (63) - - - - - - - - - - - - - - - - - - - - - - - - - - - - - (70) (97) (377) - - - - - - - (50) - - - - - - - - - - - - - - - - - - - - - - - - - - - - - - - - - - - - - - - - - - - - - - - - - - - - - - - - - - - - - - - - - (119) (119) (119) (192) (426) (426) (426) - - - - - (227) (227) (227) - - - - (63) (63) (63) (63) - - - - - - - - - - - - - - - - - - - - - - - - - - - - - (70) (97) (377) - - - - - - - (50) - - - - - - - - - - - - - - - - - - - - - - - - - - - - - - - - - - - - - - - - - - - - - - - -
Attachment D-1 E3 EPE Report Model Results June Page 28 of 34
Scenario Resource TypeNo Lifetime Extensions Nuclear (Palo Verde)
Nuclear (SMR)Gas - Steam TurbineGas - Combined CycleGas - Combustion TurbineBiomassGeothermalWindSolarBattery StorageImportsDemand ResponseHydrogenBTM SolarLoadExcess Generation
High Gas Price Nuclear (Palo Verde)Nuclear (SMR)Gas - Steam TurbineGas - Combined CycleGas - Combustion TurbineBiomassGeothermalWindSolarBattery StorageImportsDemand ResponseHydrogenBTM SolarLoadExcess Generation
Low Carbon Price Nuclear (Palo Verde)Nuclear (SMR)Gas - Steam TurbineGas - Combined CycleGas - Combustion TurbineBiomassGeothermalWindSolarBattery StorageImportsDemand ResponseHydrogenBTM SolarLoadExcess Generation
2021 2024 2025 2027 2031 2035 2040 2045Cumulative Capacity Retirements (MW)
- - - - - - - - - - - - - - - - - (192) (192) (282) (282) (426) (426) (426) - - - (227) (227) (227) (227) (227) - - - - (63) (63) (63) (63) - - - - - - - - - - - - - - - - - - - - - - - - - - - - - (70) (97) (377) - - - - - - - (50) - - - - - - - - - - - - - - - - - - - - - - - - - - - - - - - - - - - - - - - - - - - - - - - - - - - - - - - - - - - - - - - - - (119) (119) (119) (192) (426) (426) (426) - - - - - (227) (227) (227) - - - - (63) (63) (63) (63) - - - - - - - - - - - - - - - - - - - - - - - - - - - - - (70) (97) (377) - - - - - - - (50) - - - - - - - - - - - - - - - - - - - - - - - - - - - - - - - - - - - - - - - - - - - - - - - - - - - - - - - - - - - - - - - - - (119) (119) (119) (192) (426) (426) (426) - - - - - (227) (227) (227) - - - - (63) (63) (63) (63) - - - - - - - - - - - - - - - - - - - - - - - - - - - - - (70) (97) (377) - - - - - - - (50) - - - - - - - - - - - - - - - - - - - - - - - - - - - - - - - - - - - - - - - - - - - - - - - -
Attachment D-1 E3 EPE Report Model Results June Page 29 of 34
Scenario Resource TypeMedium Carbon Price Nuclear (Palo Verde)
Nuclear (SMR)Gas - Steam TurbineGas - Combined CycleGas - Combustion TurbineBiomassGeothermalWindSolarBattery StorageImportsDemand ResponseHydrogenBTM SolarLoadExcess Generation
High Carbon Price Nuclear (Palo Verde)Nuclear (SMR)Gas - Steam TurbineGas - Combined CycleGas - Combustion TurbineBiomassGeothermalWindSolarBattery StorageImportsDemand ResponseHydrogenBTM SolarLoadExcess Generation
80 Clean by 2035 Nuclear (Palo Verde)Nuclear (SMR)Gas - Steam TurbineGas - Combined CycleGas - Combustion TurbineBiomassGeothermalWindSolarBattery StorageImportsDemand ResponseHydrogenBTM SolarLoadExcess Generation
2021 2024 2025 2027 2031 2035 2040 2045Cumulative Capacity Retirements (MW)
- - - - - - - - - - - - - - - - - (119) (119) (119) (192) (426) (426) (426) - - - - - (227) (227) (227) - - - - (63) (63) (63) (63) - - - - - - - - - - - - - - - - - - - - - - - - - - - - - (70) (97) (377) - - - - - - - (50) - - - - - - - - - - - - - - - - - - - - - - - - - - - - - - - - - - - - - - - - - - - - - - - - - - - - - - - - - - - - - - - - - (119) (119) (119) (192) (426) (426) (426) - - - - - (227) (227) (227) - - - - (63) (63) (63) (63) - - - - - - - - - - - - - - - - - - - - - - - - - - - - - (70) (97) (377) - - - - - - - (50) - - - - - - - - - - - - - - - - - - - - - - - - - - - - - - - - - - - - - - - - - - - - - - - - - - - - - - - - - - - - - - - - - (119) (119) (119) (192) (426) (426) (426) - - - - - (227) (227) (227) - - - - (63) (63) (63) (63) - - - - - - - - - - - - - - - - - - - - - - - - - - - - - (70) (97) (377) - - - - - - - (50) - - - - - - - - - - - - - - - - - - - - - - - - - - - - - - - - - - - - - - - - - - - - - - - -
Attachment D-1 E3 EPE Report Model Results June Page 30 of 34
Scenario Resource Type20 CO2 Red by 2040 Nuclear (Palo Verde)
Nuclear (SMR)Gas - Steam TurbineGas - Combined CycleGas - Combustion TurbineBiomassGeothermalWindSolarBattery StorageImportsDemand ResponseHydrogenBTM SolarLoadExcess Generation
40 CO2 Red by 2040 Nuclear (Palo Verde)Nuclear (SMR)Gas - Steam TurbineGas - Combined CycleGas - Combustion TurbineBiomassGeothermalWindSolarBattery StorageImportsDemand ResponseHydrogenBTM SolarLoadExcess Generation
60 CO2 Red by 2040 Nuclear (Palo Verde)Nuclear (SMR)Gas - Steam TurbineGas - Combined CycleGas - Combustion TurbineBiomassGeothermalWindSolarBattery StorageImportsDemand ResponseHydrogenBTM SolarLoadExcess Generation
2021 2024 2025 2027 2031 2035 2040 2045Cumulative Capacity Retirements (MW)
- - - - - - - - - - - - - - - - - (119) (119) (119) (192) (426) (426) (426) - - - - - (227) (227) (227) - - - - (63) (63) (63) (63) - - - - - - - - - - - - - - - - - - - - - - - - - - - - - (70) (97) (377) - - - - - - - (50) - - - - - - - - - - - - - - - - - - - - - - - - - - - - - - - - - - - - - - - - - - - - - - - - - - - - - - - - - - - - - - - - - (119) (119) (119) (192) (426) (426) (426) - - - - - (227) (227) (227) - - - - (63) (63) (63) (63) - - - - - - - - - - - - - - - - - - - - - - - - - - - - - (70) (97) (377) - - - - - - - (50) - - - - - - - - - - - - - - - - - - - - - - - - - - - - - - - - - - - - - - - - - - - - - - - - - - - - - - - - - - - - - - - - - (119) (119) (119) (192) (426) (426) (426) - - - - - (227) (227) (227) - - - - (63) (63) (63) (63) - - - - - - - - - - - - - - - - - - - - - - - - - - - - - (70) (97) (377) - - - - - - - (50) - - - - - - - - - - - - - - - - - - - - - - - - - - - - - - - - - - - - - - - - - - - - - - - -
Attachment D-1 E3 EPE Report Model Results June Page 31 of 34
Scenario Resource Type80 CO2 Red by 2040 Nuclear (Palo Verde)
Nuclear (SMR)Gas - Steam TurbineGas - Combined CycleGas - Combustion TurbineBiomassGeothermalWindSolarBattery StorageImportsDemand ResponseHydrogenBTM SolarLoadExcess Generation
90 CO2 Red by 2040 Nuclear (Palo Verde)Nuclear (SMR)Gas - Steam TurbineGas - Combined CycleGas - Combustion TurbineBiomassGeothermalWindSolarBattery StorageImportsDemand ResponseHydrogenBTM SolarLoadExcess Generation
100 CO2 Red by 2040 Nuclear (Palo Verde)Nuclear (SMR)Gas - Steam TurbineGas - Combined CycleGas - Combustion TurbineBiomassGeothermalWindSolarBattery StorageImportsDemand ResponseHydrogenBTM SolarLoadExcess Generation
2021 2024 2025 2027 2031 2035 2040 2045Cumulative Capacity Retirements (MW)
- - - - - - - - - - - - - - - - - (119) (119) (119) (192) (426) (426) (426) - - - - - (227) (227) (227) - - - - (63) (63) (63) (63) - - - - - - - - - - - - - - - - - - - - - - - - - - - - - (70) (97) (377) - - - - - - - (50) - - - - - - - - - - - - - - - - - - - - - - - - - - - - - - - - - - - - - - - - - - - - - - - - - - - - - - - - - - - - - - - - - (119) (119) (119) (192) (426) (426) (426) - - - - - (227) (227) (227) - - - - (63) (63) (63) (63) - - - - - - - - - - - - - - - - - - - - - - - - - - - - - (70) (97) (377) - - - - - - - (50) - - - - - - - - - - - - - - - - - - - - - - - - - - - - - - - - - - - - - - - - - - - - - - - - - - - - - - - - - - - - - - - - - (119) (119) (119) (192) (426) (426) (426) - - - - - (227) (227) (227) - - - - (63) (63) (63) (63) - - - - - - - - - - - - - - - - - - - - - - - - - - - - - (70) (97) (377) - - - - - - - (50) - - - - - - - - - - - - - - - - - - - - - - - - - - - - - - - - - - - - - - - - - - - - - - - -
Attachment D-1 E3 EPE Report Model Results June Page 32 of 34
Scenario Resource Type100 CO2 Red by 2040 (w H2) Nuclear (Palo Verde)
Nuclear (SMR)Gas - Steam TurbineGas - Combined CycleGas - Combustion TurbineBiomassGeothermalWindSolarBattery StorageImportsDemand ResponseHydrogenBTM SolarLoadExcess Generation
2021 2024 2025 2027 2031 2035 2040 2045Cumulative Capacity Retirements (MW)
- - - - - - - - - - - - - - - - - (119) (119) (119) (192) (426) (426) (426) - - - - - (227) (227) (227) - - - - (63) (63) (63) (63) - - - - - - - - - - - - - - - - - - - - - - - - - - - - - (70) (97) (377) - - - - - - - (50) - - - - - - - - - - - - - - - - - - - - - - - - - - - - - - - - - - - - - - - - - - - - - - - -
Attachment D-1 E3 EPE Report Model Results June Page 33 of 34
Scenario 2021 2024 2025 2027 2031 2035 2040 2045Least-Cost (Reference Case) 246$ 233$ 246$ 265$ 290$ 351$ 409$ 512$ Least-Cost Case + ETA Resources 246$ 233$ 249$ 266$ 291$ 356$ 412$ 519$ Separate System Planning 247$ 234$ 252$ 269$ 295$ 376$ 471$ 577$ Separate System Planning (w H2) 247$ 234$ 252$ 269$ 294$ 355$ 438$ 543$ Low Load Growth 239$ 227$ 239$ 255$ 275$ 327$ 380$ 478$ High Load Growth 253$ 239$ 256$ 277$ 307$ 377$ 439$ 546$ High DG 245$ 231$ 243$ 261$ 283$ 336$ 388$ 482$ High DSM 245$ 230$ 241$ 256$ 272$ 317$ 364$ 454$ No New Gas 246$ 233$ 247$ 265$ 290$ 394$ 470$ 601$ No Lifetime Extensions 246$ 228$ 246$ 276$ 307$ 354$ 412$ 515$ High Gas Price 257$ 242$ 252$ 272$ 297$ 358$ 418$ 522$ Low Carbon Price 291$ 277$ 285$ 304$ 329$ 390$ 450$ 556$ Medium Carbon Price 358$ 341$ 342$ 361$ 386$ 447$ 512$ 623$ High Carbon Price 469$ 449$ 433$ 452$ 478$ 539$ 609$ 730$ 80 Clean by 2035 246$ 233$ 246$ 265$ 290$ 352$ 409$ 512$ 20 CO2 Red by 2040 246$ 233$ 246$ 265$ 290$ 351$ 409$ 511$ 40 CO2 Red by 2040 246$ 233$ 246$ 265$ 290$ 352$ 409$ 519$ 60 CO2 Red by 2040 246$ 233$ 246$ 265$ 290$ 352$ 421$ 537$ 80 CO2 Red by 2040 246$ 233$ 248$ 266$ 290$ 356$ 464$ 580$ 90 CO2 Red by 2040 246$ 233$ 248$ 266$ 290$ 366$ 503$ 620$ 100 CO2 Red by 2040 246$ 233$ 247$ 265$ 290$ 394$ 1102$ 1269$ 100 CO2 Red by 2040 (w H2) 246$ 233$ 250$ 267$ 291$ 375$ 561$ 675$
Annual Revenue Requirement ($M)
Attachment D-1 E3 EPE Report Model Results June Page 34 of 34
Scenario Clean Energy Type 2021 2024 2025 2027 2031 2035 2040 2045Least-Cost (Reference Case) Renewable 4 12 22 23 28 35 36 40
Zero Carbon 62 68 77 76 79 81 77 75Least-Cost Case + ETA Resources Renewable 4 12 25 26 32 39 42 48
Zero Carbon 62 68 80 79 82 86 83 83Separate System Planning Renewable 4 12 23 23 28 39 42 46
Zero Carbon 62 68 78 77 78 85 83 81Separate System Planning (w H2) Renewable 4 12 24 24 29 36 41 45
Zero Carbon 62 68 79 78 80 82 83 80Low Load Growth Renewable 4 12 20 20 25 34 35 38
Zero Carbon 64 70 77 76 77 82 77 75High Load Growth Renewable 4 12 23 24 31 36 36 41
Zero Carbon 61 66 77 76 80 80 76 75High DG Renewable 4 13 22 24 29 35 37 40
Zero Carbon 63 70 78 77 79 82 78 76High DSM Renewable 4 12 19 20 23 33 34 37
Zero Carbon 63 69 76 75 75 82 78 75No New Gas Renewable 4 12 22 23 29 44 51 58
Zero Carbon 62 68 78 77 79 90 91 93No Lifetime Extensions Renewable 4 12 24 26 31 35 36 40
Zero Carbon 62 68 80 80 81 81 77 75High Gas Price Renewable 4 12 23 24 29 36 37 43
Zero Carbon 62 68 78 78 80 83 78 78Low Carbon Price Renewable 4 12 24 25 31 37 38 43
Zero Carbon 62 68 80 79 81 84 79 79Medium Carbon Price Renewable 4 12 27 28 33 39 41 46
Zero Carbon 62 68 83 82 83 86 82 81High Carbon Price Renewable 4 12 31 32 35 41 45 54
Zero Carbon 62 68 86 86 85 87 86 8980 Clean by 2035 Renewable 4 12 22 23 29 36 39 45
Zero Carbon 62 68 77 76 79 82 80 8020 CO2 Red by 2040 Renewable 4 12 22 23 29 35 36 43
Zero Carbon 62 68 77 76 79 81 77 7940 CO2 Red by 2040 Renewable 4 12 22 23 29 36 40 49
Zero Carbon 62 68 77 76 79 82 81 8460 CO2 Red by 2040 Renewable 4 12 22 23 29 35 46 54
Zero Carbon 62 68 77 76 79 82 87 8980 CO2 Red by 2040 Renewable 4 12 24 25 31 39 53 59
Zero Carbon 62 68 80 79 81 86 93 9490 CO2 Red by 2040 Renewable 4 12 24 25 31 42 56 62
Zero Carbon 62 68 80 79 81 88 97 97100 CO2 Red by 2040 Renewable 4 12 22 23 29 44 62 67
Zero Carbon 62 68 78 77 79 90 100 100100 CO2 Red by 2040 (w H2) Renewable 4 12 25 26 32 45 56 62
Zero Carbon 62 68 81 80 83 91 100 100
Clean Energy ( of Load)
Portfolio Analysis Results612021
El Paso Electric IRP
Modeling Update
Arne Olson Senior PartnerJack Moore Director
Joe Hooker Senior Managing ConsultantHuai Jiang Senior Consultant
Manu Mogadali Senior ConsultantChen Zhang Consultant
Attachment D-2 E-3 June IRP Presentation Page 1 of 37
2Confidential Draft
Agenda
Assumption updates
Updated Reference Case results
High DSM sensitivity results
New Mexico REA Requirements
New Mexico REA Scenario Results
Attachment D-2 E-3 June IRP Presentation Page 2 of 37
Assumption Updates
Attachment D-2 E-3 June IRP Presentation Page 3 of 37
4Confidential Draft
Unit Lifetime Extensions
E3 modeled unit lifetime extensions for the following units that are currently scheduled to retire prior to 2030
In the modeling unit extensions for Rio Grande 7 and Newman 2 are not selected but the other unit extensions are
Resource Planned Retirement Year
Extension Period
Capital + Fixed OampM
(2021 $kW-yr)Rio Grande 7 2022 5 years $11373Newman 1 2022 5 years $7859Newman 2 2022 5 years $7998Newman 3 2026 5 years $5812Newman 4 2026 5 years $4744
Attachment D-2 E-3 June IRP Presentation Page 4 of 37
5Confidential Draft
Planning Reserve Margin
The modeling assumes a 2-day-in-10-year reliability standard for 2025 as a transition to the more common 1-day-in-10-year reliability standard starting in 2030
Under this PRM all generators count toward the PRM based on their effective load carrying capability (ELCC)
Metric 2025 2030+
Reliability TargetTwo days with outages
every ten years on average (02 LOLE)
One day with outages every ten years on average (01 LOLE)
Target PCAP PRM 101 129
LOLE = Loss-of-Load Expectation PCAP = Perfect Capacity
Attachment D-2 E-3 June IRP Presentation Page 5 of 37
Updated Reference Case
Results
Attachment D-2 E-3 June IRP Presentation Page 6 of 37
7Confidential Draft
Scenarios and Sensitivities
Run Note Presented Previously
Presented Today
Least-Cost (Reference Case) Least-cost optimization used as reference case for all sensitivities
Least-Cost Case + REA Resources Additional resources added to Least-Cost Case for New Mexico REA
Separate System Planning New Mexico system planned separately for purposes of satisfying REA
Low Load Growth 3-4 higher native system load forecast
High Load Growth 3-4 lower native system load forecast
High DG High DG forecast
High DSM More smart thermostats doubling of energy efficiency
No New Gas No new gas after Newman 6
No Lifetime Extensions All plants retire as scheduled
High Gas Price Gas prices 15 higher
Low Carbon Price $8 per metric ton of CO2 in 2010 rising at 25 per year
Medium Carbon Price $20 per metric ton of CO2 in 2010 rising at 25 per year
High Carbon Price $40 per metric ton of CO2 in 2010 rising at 25 per year
80 Clean by 2035 80 zero-carbon energy
20 CO2 Red by 2040 20 reduction in CO2 emissions
40 CO2 Red by 2040 40 reduction in CO2 emissions
60 CO2 Red by 2040 60 reduction in CO2 emissions
80 CO2 Red by 2040 80 reduction in CO2 emissions
90 CO2 Red by 2040 90 reduction in CO2 emissions
100 CO2 Red by 2040 100 reduction in CO2 emissions
100 CO2 Red by 2040 (w H2) 100 reduction in CO2 emissions with hydrogen
Attachment D-2 E-3 June IRP Presentation Page 7 of 37
8Confidential Draft
Reference Case Additions and
Retirements
Total net additions by 2040
Storage ~1100 MW
Solar ~1500 MW
Wind ~100 MW
Gas (45) MW
DR = demand response BTM Solar = behind-the-meter solar
Attachment D-2 E-3 June IRP Presentation Page 8 of 37
9Confidential Draft
Reference Case Total Capacity
Total system capacity increases through 2045
bull Gas capacity declines 2027-2035 and then rises
bull Solar and storage capacity increase significantly
bull Wind and demand response increase more modestly
DR = demand response BTM Solar = behind-the-meter solar
Attachment D-2 E-3 June IRP Presentation Page 9 of 37
10Confidential Draft
Reference Case Annual Generation
BTM Solar = behind-the-meter solar
The amount of zero-carbon generation
increases markedly above current levels
Attachment D-2 E-3 June IRP Presentation Page 10 of 37
11Confidential Draft
Reference Case Effective Capacity
Load growth and resource
retirements together result in a
growing capacity need over time
which is met by a combination of
renewables storage demand
response and gas resources
Effective capacity is the amount of capacity that can be counted towards the PRM
Attachment D-2 E-3 June IRP Presentation Page 11 of 37
High DSM Sensitivity Results
Attachment D-2 E-3 June IRP Presentation Page 12 of 37
13Confidential Draft
High DSM Sensitivity Assumptions
Smart Thermostats Energy Efficiency
Base 50MW by 2040
High 60MW by 2040
Base 65 of native system load in 2040
High 13 of native system load in 2040
An incremental ~800 GWh in 2040 Corresponds to ~90 MW of savings on average throughout the year
Attachment D-2 E-3 June IRP Presentation Page 13 of 37
14Confidential Draft
High DSM Scenario Results
Change in Capacity Generation Mix
Attachment D-2 E-3 June IRP Presentation Page 14 of 37
New Mexico REA Requirements
Attachment D-2 E-3 June IRP Presentation Page 15 of 37
16Confidential Draft
New Mexico Renewable Energy Act
There are key requirements in the statutory language setting renewable energy and zero carbon requirements in New Mexico (emphasis added)
ldquoA public utility shall meet the renewable portfolio standard requirements as provided in this section to include renewable energy in its electric energy supply portfolio as demonstrated by its retirement of renewable energy certificates provided that the associated renewable energy is delivered to the public utility and assigned to the public utilitys New Mexico customershellip
(5) no later than January 1 2040 renewable energy resources shall supply no less than eighty percent of all retail sales of electricity in New Mexico provided that compliance with this standard until December 31 2047 shall not require the public utility to displace zero carbon resources in the utilitys generation portfolio on the effective date of this 2019 act and
(6) no later than January 1 2045 zero carbon resources shall supply one hundred percent of all retail sales of
electricity in New Mexico Reasonable and consistent progress shall be made over time toward this requirementrdquo
The scenarios analyzed consider multiple approaches for REA implementationbull Share of NM load served with renewable energy given that El Paso Electric serves NM load with
greater than 20 non-renewable zero-carbon resources (ie Palo Verde)
bull Annual vs hourly balancing periods for 100 zero-carbon generation
bull Whether combustion resources may be utilized to ensure reliability for NM customers
Attachment D-2 E-3 June IRP Presentation Page 16 of 37
17Confidential Draft
New Mexico REA Requirements in 2040+
The REA requires 80 RPS by 2040 unless doing so would require displacing existing zero-carbon generation
New Mexicorsquos share of Palo Verde 1 and 2 supplies 31 of New Mexicorsquos retail sales in 2040 and 27 in 2045
For purposes of IRP modeling El Paso Electric has directed E3 to require New Mexico zero-carbon generation (renewables + nuclear) to equal or exceed 100 of New Mexico retail sales or load starting in 2040
New Mexico Nuclear Generation amp Load
Nuclear Generation
Retail Sales
Total Load
Attachment D-2 E-3 June IRP Presentation Page 17 of 37
18Confidential Draft
Two Approaches for Modeling Zero-Carbon
Generation Balancing
bull New Mexico-allocated zero-carbon resources must generate enough energy on an annual basis to match the REA NM retail sales target
bull Natural gas resources andor imports can serve New Mexicorsquos energy needs in some hours if that generation is offset by additional zero-carbon generation in other hours
bull Annual balancing allows New Mexico customers to reap the benefits of being served by a larger system
Annual Balancing
bull New Mexico cannot receive power from gas resources or unspecified imports in any hour
bull Zero-carbon generation from New Mexico-allocated resources must serve New Mexico energy demand in all hours of the year
bull This would be a more stringent zero-carbon requirement as it would not allow for balancing between New Mexico and Texas resources
Hourly Balancing
NM-Allocated Resources
NM customers can be served by gas resources
and unspecified imports if offset in other hours
NM-Allocated Resources
Other Resources
NM customers cannot be served by gas resources
or unspecified imports an any hour
Attachment D-2 E-3 June IRP Presentation Page 18 of 37
19Confidential Draft
Two Approaches for Modeling Capacity
Pooling to Ensure Reliability
bull For reliability planning purposes NM and TX loads can be served by NM resources TX resources andor system resources
bull If the NM jurisdiction doesnrsquot have enough resources to satisfy load in an hour then it can rely on TX resources and vice versa
bull NM and TX customers must still pay for enough resources to satisfy their share of system reliability needs
Capacity Pooling Allowed
bull For planning purposes TX and NM must each have enough resources to ensure reliability across a range of potential conditions without relying on the other jurisdiction (ie on a standalone basis)
bull This would be a more stringent planning approach NM would need to plan to have enough resources without falling back on TX gas resources in some hours
Capacity Pooling NOT Allowed
NM-Allocated Resources
TX-Allocated Resources
NM-Allocated Resources
TX-Allocated Resources
All resources together ensure
systemwide reliability across all hours
subject to the reliability standard
For planning purposes each jurisdiction
ensures reliability on its own across all
hours subject to the reliability standard
Attachment D-2 E-3 June IRP Presentation Page 19 of 37
20Confidential Draft
New Mexico REA Scenarios and
Jurisdictional Allocation
E3 modeled a few scenarios with different approaches for how to satisfy the REA requirementsbull Different approaches of the REA requirements have meaningful implications on how
planning is performed for New Mexico customersbull The more stringent approaches of the REA requirements will result in higher system
costs relative to less stringent approaches
bull To ensure equitable treatment of customers across jurisdictions any incremental costs of satisfying the REA requirements would be allocated to New Mexico customers
For each scenario resources and costs are allocated between the New Mexico and Texas jurisdictionsbull The allocation of resources follows directly from a particular approach to modeling
REA compliance If a particular approach requires more resources to be added versus the least-cost case then those resources are allocated to the New Mexico jurisdiction
bull Capacity generation and cost for the New Mexico jurisdiction are presented for each scenario
Attachment D-2 E-3 June IRP Presentation Page 20 of 37
21Confidential Draft
Least Cost(ldquoLCrdquo)
Least Cost + REA Resources
(ldquoLC+REArdquo)
Separate System Planning
(ldquoSSPrdquo)
Portfoliooptimization
Least-cost system optimization
Reoptimize Least Cost to add additional renewables amp storage dedicated to NM to satisfy REA requirements
Optimize NM and TX systems independently
without modeling interactions between them
NM zero-carbon generation balancing period
Annual Annual Hourly
NM and TX capacity pooling to ensure reliability
Resource allocationResources allocated
proportionally more RECs allocated to NM
Incremental resources are allocated to New Mexico
Optimization identifies resources specifically for NM and TX jurisdictions
NM allocated new gas capacity
New Mexico REA Scenarios
More stringent REA interpretation
Attachment D-2 E-3 June IRP Presentation Page 21 of 37
New Mexico REA Scenario
Results
Attachment D-2 E-3 June IRP Presentation Page 22 of 37
23Confidential Draft
Least Cost(ldquoLCrdquo)
Least Cost + ETA Resources
(ldquoLC+ETArdquo)
Separate System Planning
(ldquoSSPrdquo)
Portfoliooptimization
Least-cost system optimization
Reoptimize Least Cost to add additional renewables amp storage dedicated to NM to satisfy ETA requirements
Optimize NM and TX systems independently
without modeling interactions between them
NM zero-carbon generation balancing period
Annual Annual Hourly
NM and TX capacity pooling to ensure reliability
Resource allocationResources allocated
proportionally more RECs allocated to NM
Incremental resources are allocated to New Mexico
Optimization identifies resources specifically for NM and TX jurisdictions
NM allocated new gas capacity
New Mexico REA Scenarios
Attachment D-2 E-3 June IRP Presentation Page 23 of 37
24Confidential Draft
Resource Portfolios and Costs by ScenarioLeast Cost Scenario
Total System New Mexico
This scenario allocates a share of new gas capacity to NM customers This capacity could be converted to run on a higher share of hydrogen fuel in the future More RECs would be allocated to NM customers to satisfy the REA
112 MW of new gas capacity is allocated to New Mexico customers by 2040
This analysis does not assume Palo Verde 3 generation is allocated to New Mexico resulting in a lower zero-carbon generation share than the rest of the system
Attachment D-2 E-3 June IRP Presentation Page 24 of 37
25Confidential Draft
Least Cost(ldquoLCrdquo)
Least Cost + REA Resources
(ldquoLC+REArdquo)
Separate System Planning
(ldquoSSPrdquo)
Portfoliooptimization
Least-cost system optimization
Reoptimize Least Cost to add additional renewables amp storage dedicated to NM to satisfy REA requirements
Optimize NM and TX systems independently
without modeling interactions between them
NM zero-carbon generation balancing period
Annual Annual Hourly
NM and TX capacity pooling to ensure reliability
Resource allocationResources allocated
proportionally more RECs allocated to NM
Incremental resources are allocated to New Mexico
Optimization identifies resources specifically for NM and TX jurisdictions
NM allocated new gas capacity
New Mexico REA Scenarios
Attachment D-2 E-3 June IRP Presentation Page 25 of 37
26Confidential Draft
Resource Portfolios and Costs by ScenarioLeast Cost + REA Scenario
Total System New Mexico
This scenario adds more solar and storage capacity for NM customers to satisfy the RPSREA targets while not allocating any new gas to NM customers This results in a modest cost increase vs Least Cost scenario
Gas generation serves a portion of New Mexico customersrsquo energy needs in some hours but that is more than offset by
Attachment D-2 E-3 June IRP Presentation Page 26 of 37
27Confidential Draft
New Mexico REA Scenarios
Least Cost(ldquoLCrdquo)
Least Cost + REA Resources
(ldquoLC+REArdquo)
Separate System Planning
(ldquoSSPrdquo)
Portfoliooptimization
Least-cost system optimization
Reoptimize Least Cost to add additional renewables amp storage dedicated to NM to satisfy REA requirements
Optimize NM and TX systems independently
without modeling interactions between them
NM zero-carbon generation balancing period
Annual Annual Hourly
NM and TX capacity pooling to ensure reliability
Resource allocationResources allocated
proportionally more RECs allocated to NM
Incremental resources are allocated to New Mexico
Optimization identifies resources specifically for NM and TX jurisdictions
NM allocated new gas capacity
Attachment D-2 E-3 June IRP Presentation Page 27 of 37
28Confidential Draft
Resource Portfolios and Costs by ScenarioSeparate System Planning Scenario
Total System New Mexico
This scenario requires significantly more resources for New Mexico to reach 100 absolute zero carbon and ensure reliability This results in a significant cost increase relative to the Least Cost scenario
Attachment D-2 E-3 June IRP Presentation Page 28 of 37
29Confidential Draft
Resource Portfolios and Costs by ScenarioSeparate System Planning (H2) Scenario
Total System New Mexico
Adding H2 capacity ensures reliability while significantly reducing solar and storage additions This mitigates cost impacts of achieving absolute zero carbon and planning to ensure reliability independently
Attachment D-2 E-3 June IRP Presentation Page 29 of 37
30Confidential Draft
New Mexico Capacity and CostLeast Cost Scenario
Least Cost Cost Impact vs Least Cost Scenario
The Least Cost scenario is the baseline for comparison Least
Cost
Attachment D-2 E-3 June IRP Presentation Page 30 of 37
31Confidential Draft
New Mexico Capacity and CostLeast Cost + REA Resources Scenario
Least Cost + REA Resources Cost Impact vs Least Cost Scenario
Least Cost + REA Resources
Least Cost
Attachment D-2 E-3 June IRP Presentation Page 31 of 37
32Confidential Draft
New Mexico Capacity and CostSeparate System Planning Scenario
Separate System Planning Cost Impact vs Least Cost Scenario
Least Cost + REA Resources
Separate System Planning
Least Cost
Attachment D-2 E-3 June IRP Presentation Page 32 of 37
33Confidential Draft
New Mexico Capacity and CostSeparate System Planning (H2) Scenario
Separate System Planning (H2) Cost Impact vs Least Cost Scenario
Least Cost + REA Resources
Separate System Planning (H2)
Separate System Planning
Least Cost
Attachment D-2 E-3 June IRP Presentation Page 33 of 37
34Confidential Draft
New Mexico Generation MixLeast Cost and Least Cost + REA Scenarios
Least Cost Least Cost + REA Resources
Attachment D-2 E-3 June IRP Presentation Page 34 of 37
35Confidential Draft
New Mexico Generation MixSeparate System Planning Scenarios
Separate System Planning Separate System Planning (H2)
Attachment D-2 E-3 June IRP Presentation Page 35 of 37
36Confidential Draft
Carbon Emissions Across Scenarios
CO2 Emissions in 2021 and 2040 Average Abatement Cost 2025-2040
Note emissions include emissions at company-owned facilities and emissions ascribed to imports2040
Attachment D-2 E-3 June IRP Presentation Page 36 of 37
Thank You
Thank You
Attachment D-2 E-3 June IRP Presentation Page 37 of 37
Attachment D-3 E3 EPE Report Model Results AugustPage 1 of 34
Scenario Resource Type 2021 2024 2025 2027 2031 2035 2040 2045Least-Cost (Reference Case) Nuclear (Palo Verde) 5148 5148 5148 5148 5148 5148 5148 5148
Nuclear (SMR) - - - - - - - - Gas - Steam Turbine 140 34 8 7 1 - - - Gas - Combined Cycle 1767 1373 1037 1148 1187 1075 1321 1513 Gas - Combustion Turbine 1027 1169 854 925 874 767 1251 1657 Biomass - - - - - - - - Geothermal - - - - - - - - Wind - - 354 357 361 316 381 730 Solar 289 952 1450 1467 2016 3050 3469 4199 Battery Storage - 12 (25) (26) (104) (215) (223) (248) Imports 391 336 266 261 296 278 360 440 Demand Response - - - - - - - - Hydrogen - - - - - - - - BTM Solar 37 135 165 225 344 460 601 763 Load 8771 9155 9258 9512 10123 10878 12308 14203 Excess Generation 14 130 416 397 431 636 374 456
Least-Cost Case + REA Resources Nuclear (Palo Verde) 5148 5148 5148 5148 5148 5148 5148 5148 Nuclear (SMR) - - - - - - - - Gas - Steam Turbine 140 34 4 11 1 - - - Gas - Combined Cycle 1767 1373 926 1001 1044 927 966 1101 Gas - Combustion Turbine 1027 1169 784 855 780 495 761 1005 Biomass - - - - - - - - Geothermal - - - - - - - - Wind - - 681 694 699 561 725 995 Solar 289 952 1340 1356 2030 3274 4121 5334 Battery Storage - 12 (29) (30) (105) (236) (277) (369) Imports 391 336 239 251 182 248 262 226 Demand Response - - - - - - - - Hydrogen - - - - - - - - BTM Solar 37 135 165 225 344 460 601 763 Load 8771 9155 9258 9512 10123 10878 12308 14203 Excess Generation 14 130 428 400 449 1144 1071 892
Separate System Planning Nuclear (Palo Verde) 5148 5148 5148 5148 5148 5148 5148 5148 Nuclear (SMR) - - - - - - - - Gas - Steam Turbine 140 34 1 2 - - - - Gas - Combined Cycle 1763 1385 1125 1238 1235 1000 1201 1349 Gas - Combustion Turbine 1048 1180 852 922 920 502 768 1046 Biomass - - - - - - - - Geothermal - - - - - - - - Wind - - 174 175 169 76 23 398 Solar 289 950 1556 1594 2135 3760 4704 5638 Battery Storage - 11 (55) (62) (129) (300) (367) (423) Imports 391 328 291 269 301 232 229 283 Demand Response - - - - - - - - Hydrogen - - - - - - - - BTM Solar 37 135 165 225 344 460 601 763 Load 8771 9155 9258 9512 10123 10878 12308 14203 Excess Generation 14 132 304 265 365 1270 2517 2452
Annual Energy (GWh)
Attachment D-3 E3 EPE Report Model Results AugustPage 2 of 34
Scenario Resource Type 2021 2024 2025 2027 2031 2035 2040 2045Annual Energy (GWh)
Separate System Planning (w H2) Nuclear (Palo Verde) 5148 5148 5148 5148 5148 5148 5148 5148 Nuclear (SMR) - - - - - - - - Gas - Steam Turbine 140 34 1 2 - - - - Gas - Combined Cycle 1763 1385 1101 1210 1223 1104 1199 1348 Gas - Combustion Turbine 1048 1180 843 915 870 762 793 1072 Biomass - - - - - - - - Geothermal - - - - - - - - Wind - - 214 215 207 202 285 678 Solar 289 950 1551 1588 2173 3139 4241 5147 Battery Storage - 11 (54) (61) (130) (221) (311) (365) Imports 391 328 288 270 288 285 278 331 Demand Response - - - - - - - - Hydrogen - - - - - - 74 80 BTM Solar 37 135 165 225 344 460 601 763 Load 8771 9155 9258 9512 10123 10878 12308 14203 Excess Generation 14 132 314 276 474 696 883 967
80 Clean by 2035 Nuclear (Palo Verde) 5148 5148 5148 5148 5148 5148 5148 5148 Nuclear (SMR) - - - - - - - - Gas - Steam Turbine 140 34 8 11 1 - - - Gas - Combined Cycle 1767 1373 1028 1131 1175 1088 1160 1293 Gas - Combustion Turbine 1027 1169 849 922 868 767 1055 1256 Biomass - - - - - - - - Geothermal - - - - - - - - Wind - - 378 381 385 342 650 1041 Solar 289 953 1450 1463 2012 3006 3689 4703 Battery Storage - 12 (24) (26) (103) (207) (238) (289) Imports 391 336 255 256 292 274 241 287 Demand Response - - - - - - - - Hydrogen - - - - - - - - BTM Solar 37 135 165 225 344 460 601 763 Load 8771 9155 9258 9512 10123 10878 12308 14203 Excess Generation 14 130 406 391 436 677 472 735
20 CO2 Red by 2040 Nuclear (Palo Verde) 5148 5148 5148 5148 5148 5148 5148 5148 Nuclear (SMR) - - - - - - - - Gas - Steam Turbine 140 34 8 11 1 - - - Gas - Combined Cycle 1767 1373 1027 1131 1175 1089 1253 1260 Gas - Combustion Turbine 1027 1169 849 922 868 765 1132 1187 Biomass - - - - - - - - Geothermal - - - - - - - - Wind - - 378 381 385 342 457 1095 Solar 289 953 1442 1456 2012 3007 3621 4792 Battery Storage - 12 (24) (26) (103) (207) (236) (297) Imports 391 336 264 264 292 275 332 255 Demand Response - - - - - - - - Hydrogen - - - - - - - - BTM Solar 37 135 165 225 344 460 601 763 Load 8771 9155 9258 9512 10123 10878 12308 14203 Excess Generation 14 129 415 398 436 676 463 752
Attachment D-3 E3 EPE Report Model Results AugustPage 3 of 34
Scenario Resource Type 2021 2024 2025 2027 2031 2035 2040 2045Annual Energy (GWh)
40 CO2 Red by 2040 Nuclear (Palo Verde) 5148 5148 5148 5148 5148 5148 5148 5148 Nuclear (SMR) - - - - - - - - Gas - Steam Turbine 140 34 8 11 1 - - - Gas - Combined Cycle 1767 1373 1027 1131 1175 1089 1060 1028 Gas - Combustion Turbine 1027 1169 849 922 868 767 790 822 Biomass - - - - - - - - Geothermal - - - - - - - - Wind - - 378 381 385 342 783 961 Solar 289 953 1441 1458 2013 3004 3980 5677 Battery Storage - 12 (24) (26) (103) (207) (264) (396) Imports 391 336 264 262 292 276 210 199 Demand Response - - - - - - - - Hydrogen - - - - - - - - BTM Solar 37 135 165 225 344 460 601 763 Load 8771 9155 9258 9512 10123 10878 12308 14203 Excess Generation 14 130 415 396 435 680 811 1196
60 CO2 Red by 2040 Nuclear (Palo Verde) 5148 5148 5148 5148 5148 5148 5148 5148 Nuclear (SMR) - - - - - - - - Gas - Steam Turbine 140 34 7 12 1 - - - Gas - Combined Cycle 1767 1373 1001 1093 1143 1029 780 735 Gas - Combustion Turbine 1027 1169 840 915 852 656 453 483 Biomass - - - - - - - - Geothermal - - - - - - - - Wind - - 444 448 451 388 853 808 Solar 289 953 1419 1436 2000 3174 4624 6588 Battery Storage - 12 (25) (26) (101) (226) (312) (488) Imports 391 336 259 260 286 250 161 166 Demand Response - - - - - - - - Hydrogen - - - - - - - - BTM Solar 37 135 165 225 344 460 601 763 Load 8771 9155 9258 9512 10123 10878 12308 14203 Excess Generation 14 129 411 390 452 766 1514 1850
80 CO2 Red by 2040 Nuclear (Palo Verde) 5148 5148 5148 5148 5148 5148 5148 5148 Nuclear (SMR) - - - - - - - - Gas - Steam Turbine 140 34 4 11 1 - - - Gas - Combined Cycle 1767 1373 914 986 1049 835 531 500 Gas - Combustion Turbine 1027 1169 771 842 725 399 127 142 Biomass - - - - - - - - Geothermal - - - - - - - - Wind - - 722 735 743 584 1310 1417 Solar 289 953 1329 1343 2004 3491 4869 6658 Battery Storage - 12 (31) (30) (102) (245) (342) (499) Imports 391 336 235 251 212 208 63 73 Demand Response - - - - - - - - Hydrogen - - - - - - - - BTM Solar 37 135 165 225 344 460 601 763 Load 8771 9155 9258 9512 10123 10878 12308 14203 Excess Generation 14 130 444 417 491 1350 2580 2939
Attachment D-3 E3 EPE Report Model Results AugustPage 4 of 34
Scenario Resource Type 2021 2024 2025 2027 2031 2035 2040 2045Annual Energy (GWh)
90 CO2 Red by 2040 Nuclear (Palo Verde) 5148 5148 5148 5148 5148 5148 5148 5148 Nuclear (SMR) - - - - - - - - Gas - Steam Turbine 140 34 4 11 2 - - - Gas - Combined Cycle 1767 1373 908 979 1009 778 304 290 Gas - Combustion Turbine 1027 1169 766 836 622 291 29 44 Biomass - - - - - - - - Geothermal - - - - - - - - Wind - - 740 754 763 513 1964 2116 Solar 289 952 1325 1339 2154 3842 4535 6263 Battery Storage - 12 (31) (30) (100) (278) (308) (453) Imports 391 336 232 250 182 125 35 32 Demand Response - - - - - - - - Hydrogen - - - - - - - - BTM Solar 37 135 165 225 344 460 601 763 Load 8771 9155 9258 9512 10123 10878 12308 14203 Excess Generation 14 130 452 424 650 1462 3356 3714
100 CO2 Red by 2040 (w H2) Nuclear (Palo Verde) 5148 5148 5148 5148 5148 5148 5148 5148 Nuclear (SMR) - - - - - - - - Gas - Steam Turbine 140 34 5 7 2 - - - Gas - Combined Cycle 1767 1373 860 928 924 643 - - Gas - Combustion Turbine 1027 1169 715 779 558 188 - - Biomass - - - - - - - - Geothermal - - - - - - - - Wind - - 896 917 922 557 1629 1685 Solar 289 952 1284 1297 2175 4069 4874 6693 Battery Storage - 12 (31) (32) (97) (302) (345) (509) Imports 391 336 215 242 148 114 - - Demand Response - - - - - - - - Hydrogen - - - - - - 400 423 BTM Solar 37 135 165 225 344 460 601 763 Load 8771 9155 9258 9512 10123 10878 12308 14203 Excess Generation 14 130 528 495 798 1795 3187 3597
100 CO2 Red by 2040 Nuclear (Palo Verde) 5148 5148 5148 5148 5148 5148 5148 5148 Nuclear (SMR) - - - - - - - - Gas - Steam Turbine 140 34 7 12 2 - - - Gas - Combined Cycle 1767 1373 1013 1110 924 643 - - Gas - Combustion Turbine 1027 1169 843 917 558 188 - - Biomass - - - - - - - - Geothermal - - - - - - - - Wind - - 416 419 922 557 1992 2629 Solar 289 952 1430 1445 2175 4069 4973 5542 Battery Storage - 12 (25) (26) (97) (302) (406) (572) Imports 391 336 260 261 148 114 - - Demand Response - - - - - - - - Hydrogen - - - - - - - - BTM Solar 37 135 165 225 344 460 601 1455 Load 8771 9155 9258 9512 10123 10878 12308 14203 Excess Generation 14 130 412 393 798 1795 11640 13062
Attachment D-3 E3 EPE Report Model Results AugustPage 5 of 34
Scenario Resource Type 2021 2024 2025 2027 2031 2035 2040 2045Annual Energy (GWh)
High DG Nuclear (Palo Verde) 5148 5148 5148 5148 5148 5148 5148 5148 Nuclear (SMR) - - - - - - - - Gas - Steam Turbine 134 31 9 12 1 - - - Gas - Combined Cycle 1728 1317 1044 1144 1175 1073 1273 1538 Gas - Combustion Turbine 1028 1123 885 923 846 711 1096 1713 Biomass - - - - - - - - Geothermal - - - - - - - - Wind - - 338 336 341 295 352 763 Solar 285 866 1148 1107 1485 2336 2661 2700 Battery Storage - 11 (25) (25) (105) (226) (249) (243) Imports 389 314 273 258 287 265 347 441 Demand Response - - - - - - - - Hydrogen - - - - - - - - BTM Solar 88 350 436 608 945 1276 1680 2144 Load 8771 9155 9258 9512 10123 10878 12308 14203 Excess Generation 18 217 389 432 552 696 602 379
High DSM Nuclear (Palo Verde) 5148 5148 5148 5148 5148 5148 5148 5148 Nuclear (SMR) - - - - - - - - Gas - Steam Turbine 133 30 2 3 0 - - - Gas - Combined Cycle 1744 1303 1197 1315 1357 1105 1320 1460 Gas - Combustion Turbine 1020 1111 977 1001 989 706 1104 1404 Biomass - - - - - - - - Geothermal - - - - - - - - Wind - - - - - - - 471 Solar 288 934 1274 1273 1604 2760 3166 3725 Battery Storage - 10 (25) (23) (80) (203) (216) (234) Imports 390 329 318 286 318 297 377 438 Demand Response - - - - - - - - Hydrogen - - - - - - - - BTM Solar 37 135 165 225 344 460 601 763 Load 8731 8994 9056 9230 9680 10273 11501 13177 Excess Generation 15 148 197 197 215 541 326 371
Low Load Nuclear (Palo Verde) 5148 5148 5148 5148 5148 5148 5148 5148 Nuclear (SMR) - - - - - - - - Gas - Steam Turbine 101 27 2 3 2 - - - Gas - Combined Cycle 1596 1244 1155 1300 1422 1129 1372 1496 Gas - Combustion Turbine 983 1065 942 985 1034 759 1214 1529 Biomass - - - - - - - - Geothermal - - - - - - - - Wind - - - - - - - 523 Solar 282 919 1260 1272 1563 2869 3314 3970 Battery Storage - 8 (26) (24) (69) (209) (222) (246) Imports 381 325 311 284 315 303 385 440 Demand Response - - - - - - - - Hydrogen - - - - - - - - BTM Solar 37 135 165 225 344 460 601 763 Load 8492 8862 8958 9194 9759 10459 11813 13623 Excess Generation 22 163 216 205 224 535 317 399
Attachment D-3 E3 EPE Report Model Results AugustPage 6 of 34
Scenario Resource Type 2021 2024 2025 2027 2031 2035 2040 2045Annual Energy (GWh)
High Load Nuclear (Palo Verde) 5148 5148 5148 5148 5148 5148 5148 5148 Nuclear (SMR) - - - - - - - - Gas - Steam Turbine 195 50 7 3 - - - - Gas - Combined Cycle 1909 1522 1077 1166 1126 1113 1386 1518 Gas - Combustion Turbine 1088 1256 889 937 786 875 1409 1781 Biomass - - - - - - - - Geothermal - - - - - - - - Wind - - 420 424 404 387 450 957 Solar 293 983 1618 1717 2556 3249 3659 4426 Battery Storage - 14 (42) (64) (158) (220) (224) (251) Imports 400 343 275 273 281 286 373 440 Demand Response - - - - - - - - Hydrogen - - - - - - - - BTM Solar 37 135 165 225 344 460 601 763 Load 9050 9448 9558 9830 10488 11297 12803 14784 Excess Generation 10 100 381 278 543 642 387 518
No Lifetime Extensions Nuclear (Palo Verde) 5148 5148 5148 5148 5148 5148 5148 5148 Nuclear (SMR) - - - - - - - - Gas - Steam Turbine 140 34 12 2 - - - - Gas - Combined Cycle 1767 1373 972 1029 1055 1069 1314 1513 Gas - Combustion Turbine 1027 1169 744 693 636 764 1246 1657 Biomass - - - - - - - - Geothermal - - - - - - - - Wind - - 364 369 340 337 408 730 Solar 289 952 1643 1894 2495 3039 3457 4199 Battery Storage - 12 (26) (92) (164) (214) (223) (248) Imports 391 336 235 243 270 276 357 440 Demand Response - - - - - - - - Hydrogen - - - - - - - - BTM Solar 37 135 165 225 344 460 601 763 Load 8771 9155 9258 9512 10123 10878 12308 14203 Excess Generation 14 130 669 413 585 637 371 456
No New Gas Nuclear (Palo Verde) 5148 5148 5148 5148 5148 5148 5148 5148 Nuclear (SMR) - - - - - - - - Gas - Steam Turbine 140 34 7 12 1 - - - Gas - Combined Cycle 1767 1373 1013 1110 1156 829 774 714 Gas - Combustion Turbine 1027 1169 843 917 859 294 269 286 Biomass - - - - - - - - Geothermal - - - - - - - - Wind - - 416 419 423 227 195 209 Solar 289 952 1430 1445 2002 4003 5562 7483 Battery Storage - 12 (25) (26) (102) (320) (460) (623) Imports 391 336 260 261 293 237 219 223 Demand Response - - - - - - - - Hydrogen - - - - - - - - BTM Solar 37 135 165 225 344 460 601 763 Load 8771 9155 9258 9512 10123 10878 12308 14203 Excess Generation 14 130 412 393 449 1709 2222 2760
Attachment D-3 E3 EPE Report Model Results AugustPage 7 of 34
Scenario Resource Type 2021 2024 2025 2027 2031 2035 2040 2045Annual Energy (GWh)
Low Carbon Price Nuclear (Palo Verde) 5148 5148 5148 5148 5148 5148 5148 5148 Nuclear (SMR) - - - - - - - - Gas - Steam Turbine 127 23 4 5 1 - - - Gas - Combined Cycle 1803 1433 1000 1092 1104 988 1204 1335 Gas - Combustion Turbine 1001 1107 776 839 788 598 1076 1338 Biomass - - - - - - - - Geothermal - - - - - - - - Wind - - 562 571 569 479 581 943 Solar 289 958 1390 1406 1988 3174 3609 4556 Battery Storage - 11 (30) (29) (104) (228) (238) (278) Imports 394 345 242 255 285 258 326 397 Demand Response - - - - - - - - Hydrogen - - - - - - - - BTM Solar 37 135 165 225 344 460 601 763 Load 8771 9155 9258 9512 10123 10878 12308 14203 Excess Generation 14 125 403 379 473 835 521 718
Mid Carbon Price Nuclear (Palo Verde) 5148 5148 5148 5148 5148 5148 5148 5148 Nuclear (SMR) - - - - - - - - Gas - Steam Turbine 120 22 3 4 1 - - - Gas - Combined Cycle 1822 1496 923 994 1017 922 1107 1275 Gas - Combustion Turbine 983 1036 596 663 681 475 938 1205 Biomass - - - - - - - - Geothermal - - - - - - - - Wind - - 771 794 801 650 804 1099 Solar 290 961 1474 1493 2020 3264 3720 4732 Battery Storage - 7 (35) (36) (101) (230) (245) (291) Imports 399 354 212 227 211 190 235 273 Demand Response - - - - - - - - Hydrogen - - - - - - - - BTM Solar 37 135 165 225 344 460 601 763 Load 8771 9155 9258 9512 10123 10878 12308 14203 Excess Generation 13 121 615 574 500 912 572 727
High Carbon Price Nuclear (Palo Verde) 5148 5148 5148 5148 5148 5148 5148 5148 Nuclear (SMR) - - - - - - - - Gas - Steam Turbine 119 21 3 3 2 - - - Gas - Combined Cycle 1835 1540 704 778 913 873 962 863 Gas - Combustion Turbine 962 989 447 494 545 394 614 583 Biomass - - - - - - - - Geothermal - - - - - - - - Wind - - 881 916 965 778 930 859 Solar 290 963 1760 1782 2130 3267 4138 6248 Battery Storage - 2 (37) (36) (98) (230) (275) (458) Imports 408 362 187 203 174 188 189 195 Demand Response - - - - - - - - Hydrogen - - - - - - - - BTM Solar 37 135 165 225 344 460 601 763 Load 8771 9155 9258 9512 10123 10878 12308 14203 Excess Generation 13 120 1146 1089 774 1061 1077 1549
Attachment D-3 E3 EPE Report Model Results AugustPage 8 of 34
Scenario Resource Type 2021 2024 2025 2027 2031 2035 2040 2045Annual Energy (GWh)
High Gas Price Nuclear (Palo Verde) 5148 5148 5148 5148 5148 5148 5148 5148 Nuclear (SMR) - - - - - - - - Gas - Steam Turbine 125 31 6 5 1 - - - Gas - Combined Cycle 1787 1400 1015 1115 1125 1015 1242 1350 Gas - Combustion Turbine 1008 1120 803 853 805 627 1127 1365 Biomass - - - - - - - - Geothermal - - - - - - - - Wind - - 444 448 451 387 467 924 Solar 290 956 1419 1435 1998 3161 3603 4486 Battery Storage - 9 (29) (28) (103) (224) (235) (274) Imports 403 360 287 309 355 303 354 440 Demand Response - - - - - - - - Hydrogen - - - - - - - - BTM Solar 37 135 165 225 344 460 601 763 Load 8771 9155 9258 9512 10123 10878 12308 14203 Excess Generation 13 127 411 390 455 783 483 702
Low Renewable and Storage Costs Nuclear (Palo Verde) 5148 5148 5148 5148 5148 5148 5148 5148 Nuclear (SMR) - - - - - - - - Gas - Steam Turbine 140 34 3 6 1 - - - Gas - Combined Cycle 1767 1373 984 1068 1096 1000 1220 1278 Gas - Combustion Turbine 1027 1169 842 925 824 652 1127 1243 Biomass - - - - - - - - Geothermal - - - - - - - - Wind - - 558 564 559 474 578 1026 Solar 289 952 1321 1330 1975 3102 3538 4621 Battery Storage - 12 (29) (29) (102) (221) (232) (288) Imports 391 336 265 275 279 262 328 411 Demand Response - - - - - - - - Hydrogen - - - - - - - - BTM Solar 37 135 165 225 344 460 601 763 Load 8771 9155 9258 9512 10123 10878 12308 14203 Excess Generation 14 130 324 309 486 807 490 896
Attachment D-3 E3 EPE Report Model Results AugustPage 9 of 34
Scenario Resource TypeLeast-Cost (Reference Case) Nuclear (Palo Verde)
Nuclear (SMR)Gas - Steam TurbineGas - Combined CycleGas - Combustion TurbineBiomassGeothermalWindSolarBattery StorageImportsDemand ResponseHydrogenBTM SolarLoadExcess Generation
Least-Cost Case + REA Resources Nuclear (Palo Verde)Nuclear (SMR)Gas - Steam TurbineGas - Combined CycleGas - Combustion TurbineBiomassGeothermalWindSolarBattery StorageImportsDemand ResponseHydrogenBTM SolarLoadExcess Generation
Separate System Planning Nuclear (Palo Verde)Nuclear (SMR)Gas - Steam TurbineGas - Combined CycleGas - Combustion TurbineBiomassGeothermalWindSolarBattery StorageImportsDemand ResponseHydrogenBTM SolarLoadExcess Generation
2021 2024 2025 2027 2031 2035 2040 2045622 622 622 622 622 622 622 622 - - - - - - - - 426 307 307 307 234 - - - 493 493 493 493 493 266 266 266 503 731 731 731 668 870 1059 1216 - - - - - - - - - - - - - - - - - - 102 102 102 102 102 197 115 385 621 621 823 1235 1309 1561 - 50 177 177 488 1029 1129 1277 - - - - - - - - 46 53 56 61 71 81 93 93
- - - - - - - - 18 65 80 108 166 221 289 368
- - - - - - - - - - - - - - - - 622 622 622 622 622 622 622 622 - - - - - - - - 426 307 307 307 234 - - - 493 493 493 493 493 266 266 266 503 731 731 731 668 809 942 1051 - - - - - - - - - - - - - - - - - - 203 203 203 203 232 300 115 385 544 544 795 1414 1693 2037 - 50 176 177 460 1067 1246 1682 - - - - - - - - 46 53 56 61 71 81 93 93
- - - - - - - - 18 65 80 108 166 221 289 368
- - - - - - - - - - - - - - - - 622 622 622 622 622 622 622 622 - - - - - - - - 426 307 307 307 234 - - - 493 493 493 493 493 266 266 266 503 731 731 731 668 755 755 864 - - - - - - - - - - - - - - - - - - 49 49 49 49 49 161 115 385 639 639 859 1701 2450 2712 - 50 280 304 591 1514 2344 2674 - - - - - - - - 46 53 56 61 71 81 93 93
- - - - - - - - 18 65 80 108 166 221 289 368
- - - - - - - - - - - - - - - -
Installed Capacity (MW)
Attachment D-3 E3 EPE Report Model Results AugustPage 10 of 34
Scenario Resource TypeSeparate System Planning (w H2) Nuclear (Palo Verde)
Nuclear (SMR)Gas - Steam TurbineGas - Combined CycleGas - Combustion TurbineBiomassGeothermalWindSolarBattery StorageImportsDemand ResponseHydrogenBTM SolarLoadExcess Generation
80 Clean by 2035 Nuclear (Palo Verde)Nuclear (SMR)Gas - Steam TurbineGas - Combined CycleGas - Combustion TurbineBiomassGeothermalWindSolarBattery StorageImportsDemand ResponseHydrogenBTM SolarLoadExcess Generation
20 CO2 Red by 2040 Nuclear (Palo Verde)Nuclear (SMR)Gas - Steam TurbineGas - Combined CycleGas - Combustion TurbineBiomassGeothermalWindSolarBattery StorageImportsDemand ResponseHydrogenBTM SolarLoadExcess Generation
2021 2024 2025 2027 2031 2035 2040 2045Installed Capacity (MW)
622 622 622 622 622 622 622 622 - - - - - - - - 426 307 307 307 234 - - - 493 493 493 493 493 266 266 266 503 731 731 731 668 755 755 864 - - - - - - - - - - - - - - - - - - 60 60 60 60 107 218 115 385 638 638 905 1312 1724 2031 - 50 278 303 570 1057 1496 1797 - - - - - - - - 46 53 56 61 71 81 93 93
- - - - - 123 206 212 18 65 80 108 166 221 289 368
- - - - - - - - - - - - - - - - 622 622 622 622 622 622 622 622 - - - - - - - - 426 307 307 307 234 - - - 493 493 493 493 493 266 266 266 503 731 731 731 668 910 1022 1149 - - - - - - - - - - - - - - - - - - 109 109 109 109 185 289 115 385 615 615 821 1233 1383 1799 - 50 177 177 486 968 1145 1327 - - - - - - - - 46 53 56 61 71 81 93 93
- - - - - - - - 18 65 80 108 166 221 289 368
- - - - - - - - - - - - - - - - 622 622 622 622 622 622 622 622 - - - - - - - - 426 307 307 307 234 - - - 493 493 493 493 493 266 266 266 503 731 731 731 668 910 1036 1138 - - - - - - - - - - - - - - - - - - 109 109 109 109 125 300 115 385 615 615 821 1233 1383 1837 - 50 177 177 486 968 1145 1359 - - - - - - - - 46 53 56 61 71 81 93 93
- - - - - - - - 18 65 80 108 166 221 289 368
- - - - - - - - - - - - - - - -
Attachment D-3 E3 EPE Report Model Results AugustPage 11 of 34
Scenario Resource Type40 CO2 Red by 2040 Nuclear (Palo Verde)
Nuclear (SMR)Gas - Steam TurbineGas - Combined CycleGas - Combustion TurbineBiomassGeothermalWindSolarBattery StorageImportsDemand ResponseHydrogenBTM SolarLoadExcess Generation
60 CO2 Red by 2040 Nuclear (Palo Verde)Nuclear (SMR)Gas - Steam TurbineGas - Combined CycleGas - Combustion TurbineBiomassGeothermalWindSolarBattery StorageImportsDemand ResponseHydrogenBTM SolarLoadExcess Generation
80 CO2 Red by 2040 Nuclear (Palo Verde)Nuclear (SMR)Gas - Steam TurbineGas - Combined CycleGas - Combustion TurbineBiomassGeothermalWindSolarBattery StorageImportsDemand ResponseHydrogenBTM SolarLoadExcess Generation
2021 2024 2025 2027 2031 2035 2040 2045Installed Capacity (MW)
622 622 622 622 622 622 622 622 - - - - - - - - 426 307 307 307 234 - - - 493 493 493 493 493 266 266 266 503 731 731 731 668 909 973 1022 - - - - - - - - - - - - - - - - - - 109 109 109 109 239 300 115 385 615 615 821 1234 1563 2248 - 50 177 177 486 969 1184 1746 - - - - - - - - 46 53 56 61 71 81 93 93
- - - - - - - - 18 65 80 108 166 221 289 368
- - - - - - - - - - - - - - - - 622 622 622 622 622 622 622 622 - - - - - - - - 426 307 307 307 234 - - - 493 493 493 493 493 266 266 266 503 731 731 731 668 849 892 897 - - - - - - - - - - - - - - - - - - 128 128 128 128 301 302 115 385 599 599 816 1309 1965 2744 - 50 177 177 481 1044 1347 2145 - - - - - - - - 46 53 56 61 71 81 93 93
- - - - - - - - 18 65 80 108 166 221 289 368
- - - - - - - - - - - - - - - - 622 622 622 622 622 622 622 622 - - - - - - - - 426 307 307 307 234 - - - 493 493 493 493 493 266 266 266 503 731 731 731 668 778 778 778 - - - - - - - - - - - - - - - - - - 217 217 217 217 552 585 115 385 538 538 793 1555 2257 3007 - 50 176 177 458 1097 1645 2461 - - - - - - - - 46 53 56 61 71 81 93 93
- - - - - - - - 18 65 80 108 166 221 289 368
- - - - - - - - - - - - - - - -
Attachment D-3 E3 EPE Report Model Results AugustPage 12 of 34
Scenario Resource Type90 CO2 Red by 2040 Nuclear (Palo Verde)
Nuclear (SMR)Gas - Steam TurbineGas - Combined CycleGas - Combustion TurbineBiomassGeothermalWindSolarBattery StorageImportsDemand ResponseHydrogenBTM SolarLoadExcess Generation
100 CO2 Red by 2040 (w H2) Nuclear (Palo Verde)Nuclear (SMR)Gas - Steam TurbineGas - Combined CycleGas - Combustion TurbineBiomassGeothermalWindSolarBattery StorageImportsDemand ResponseHydrogenBTM SolarLoadExcess Generation
100 CO2 Red by 2040 Nuclear (Palo Verde)Nuclear (SMR)Gas - Steam TurbineGas - Combined CycleGas - Combustion TurbineBiomassGeothermalWindSolarBattery StorageImportsDemand ResponseHydrogenBTM SolarLoadExcess Generation
2021 2024 2025 2027 2031 2035 2040 2045Installed Capacity (MW)
622 622 622 622 622 622 622 622 - - - - - - - - 426 307 307 307 234 - - - 493 493 493 493 493 266 266 266 503 731 731 731 668 726 726 726 - - - - - - - - - - - - - - - - - - 224 224 224 224 801 828 115 385 535 535 901 1679 2300 3049 - 50 176 177 452 1284 1777 2595 - - - - - - - - 46 53 56 61 71 81 93 93
- - - - - - - - 18 65 80 108 166 221 289 368
- - - - - - - - - - - - - - - - 622 622 622 622 622 622 622 622 - - - - - - - - 426 307 307 307 234 - - - 493 493 493 493 493 266 - - 503 731 731 731 668 688 - - - - - - - - - - - - - - - - - - - - 282 282 282 282 682 696 115 385 512 512 925 1801 2403 3178 - 50 176 177 445 1385 1955 2797 - - - - - - - - 46 53 56 61 71 81 93 93
- - - - - - 954 954 18 65 80 108 166 221 289 368
- - - - - - - - - - - - - - - - 622 622 622 622 622 622 622 622 - - - - - - - - 426 307 307 307 234 - - - 493 493 493 493 493 266 266 266 503 731 731 731 668 688 668 668 - - - - - - - - - - - - - - - - - - 120 120 282 282 1216 1605 115 385 606 606 925 1801 4851 5217 - 50 177 177 445 1385 6191 7470 - - - - - - - - 46 53 56 61 71 81 93 93
- - - - - - - - 18 65 80 108 166 221 289 701
- - - - - - - - - - - - - - - -
Attachment D-3 E3 EPE Report Model Results AugustPage 13 of 34
Scenario Resource TypeHigh DG Nuclear (Palo Verde)
Nuclear (SMR)Gas - Steam TurbineGas - Combined CycleGas - Combustion TurbineBiomassGeothermalWindSolarBattery StorageImportsDemand ResponseHydrogenBTM SolarLoadExcess Generation
High DSM Nuclear (Palo Verde)Nuclear (SMR)Gas - Steam TurbineGas - Combined CycleGas - Combustion TurbineBiomassGeothermalWindSolarBattery StorageImportsDemand ResponseHydrogenBTM SolarLoadExcess Generation
Low Load Nuclear (Palo Verde)Nuclear (SMR)Gas - Steam TurbineGas - Combined CycleGas - Combustion TurbineBiomassGeothermalWindSolarBattery StorageImportsDemand ResponseHydrogenBTM SolarLoadExcess Generation
2021 2024 2025 2027 2031 2035 2040 2045Installed Capacity (MW)
622 622 622 622 622 622 622 622 - - - - - - - - 426 307 307 307 234 - - - 493 493 493 493 493 266 266 266 503 731 731 731 668 860 1026 1228 - - - - - - - - - - - - - - - - - - 96 96 96 96 96 203 115 385 511 511 684 1010 1107 1018 - 50 176 176 479 1041 1166 1263 - - - - - - - - 46 53 56 61 71 81 93 93
- - - - - - - - 42 169 210 293 455 614 809 1032
- - - - - - - - - - - - - - - - 622 622 622 622 622 622 622 622 - - - - - - - - 426 307 307 307 234 - - - 493 493 493 493 493 266 266 266 503 731 731 731 668 778 942 1058 - - - - - - - - - - - - - - - - - - - - - - - 128 115 385 519 519 638 1149 1212 1386 - 50 184 184 406 1001 1091 1213 - - - - - - - - 49 66 71 82 100 101 103 103
- - - - - - - - 18 65 80 108 166 221 289 368
- - - - - - - - - - - - - - - - 622 622 622 622 622 622 622 622 - - - - - - - - 426 307 307 307 234 - - - 493 493 493 493 493 266 266 266 503 731 731 731 668 724 896 1019 - - - - - - - - - - - - - - - - - - - - - - - 141 115 385 521 521 628 1185 1261 1477 - 50 186 186 355 1019 1121 1262 - - - - - - - - 46 53 56 61 71 81 93 93
- - - - - - - - 18 65 80 108 166 221 289 368
- - - - - - - - - - - - - - - -
Attachment D-3 E3 EPE Report Model Results AugustPage 14 of 34
Scenario Resource TypeHigh Load Nuclear (Palo Verde)
Nuclear (SMR)Gas - Steam TurbineGas - Combined CycleGas - Combustion TurbineBiomassGeothermalWindSolarBattery StorageImportsDemand ResponseHydrogenBTM SolarLoadExcess Generation
No Lifetime Extensions Nuclear (Palo Verde)Nuclear (SMR)Gas - Steam TurbineGas - Combined CycleGas - Combustion TurbineBiomassGeothermalWindSolarBattery StorageImportsDemand ResponseHydrogenBTM SolarLoadExcess Generation
No New Gas Nuclear (Palo Verde)Nuclear (SMR)Gas - Steam TurbineGas - Combined CycleGas - Combustion TurbineBiomassGeothermalWindSolarBattery StorageImportsDemand ResponseHydrogenBTM SolarLoadExcess Generation
2021 2024 2025 2027 2031 2035 2040 2045Installed Capacity (MW)
622 622 622 622 622 622 622 622 - - - - - - - - 426 307 307 307 234 - - - 493 493 493 493 493 266 266 266 503 731 731 731 668 1043 1247 1411 - - - - - - - - - - - - - - - - - - 119 119 119 119 119 260 115 385 662 662 1040 1304 1377 1643 - 50 235 327 708 1042 1142 1292 - - - - - - - - 46 53 56 61 71 81 93 93
- - - - - - - - 18 65 80 108 166 221 289 368
- - - - - - - - - - - - - - - - 622 622 622 622 622 622 622 622 - - - - - - - - 426 234 234 144 144 - - - 493 493 493 266 266 266 266 266 503 731 731 829 766 869 1058 1216 - - - - - - - - - - - - - - - - - - 109 109 109 109 109 197 115 385 767 767 1027 1229 1302 1561 - 50 183 432 756 1027 1128 1277 - - - - - - - - 46 53 56 61 71 81 93 93
- - - - - - - - 18 65 80 108 166 221 289 368
- - - - - - - - - - - - - - - - 622 622 622 622 622 622 622 622 - - - - - - - - 426 307 307 307 234 - - - 493 493 493 493 493 266 266 266 503 731 731 731 668 668 668 668 - - - - - - - - - - - - - - - - - - 120 120 120 120 120 132 115 385 606 606 818 1876 2580 3422 - 50 177 177 483 1585 2342 3200 - - - - - - - - 46 53 56 61 71 81 93 93
- - - - - - - - 18 65 80 108 166 221 289 368
- - - - - - - - - - - - - - - -
Attachment D-3 E3 EPE Report Model Results AugustPage 15 of 34
Scenario Resource TypeLow Carbon Price Nuclear (Palo Verde)
Nuclear (SMR)Gas - Steam TurbineGas - Combined CycleGas - Combustion TurbineBiomassGeothermalWindSolarBattery StorageImportsDemand ResponseHydrogenBTM SolarLoadExcess Generation
Mid Carbon Price Nuclear (Palo Verde)Nuclear (SMR)Gas - Steam TurbineGas - Combined CycleGas - Combustion TurbineBiomassGeothermalWindSolarBattery StorageImportsDemand ResponseHydrogenBTM SolarLoadExcess Generation
High Carbon Price Nuclear (Palo Verde)Nuclear (SMR)Gas - Steam TurbineGas - Combined CycleGas - Combustion TurbineBiomassGeothermalWindSolarBattery StorageImportsDemand ResponseHydrogenBTM SolarLoadExcess Generation
2021 2024 2025 2027 2031 2035 2040 2045Installed Capacity (MW)
622 622 622 622 622 622 622 622 - - - - - - - - 426 307 307 307 234 - - - 493 493 493 493 493 266 266 266 503 731 731 731 668 840 1027 1164 - - - - - - - - - - - - - - - - - - 163 163 163 163 163 269 115 385 573 573 805 1309 1383 1738 - 50 176 176 470 1044 1145 1314 - - - - - - - - 46 53 56 61 71 81 93 93
- - - - - - - - 18 65 80 108 166 221 289 368
- - - - - - - - - - - - - - - - 622 622 622 622 622 622 622 622 - - - - - - - - 426 307 307 307 234 - - - 493 493 493 493 493 266 266 266 503 731 731 731 668 824 1006 1145 - - - - - - - - - - - - - - - - - - 238 238 238 238 238 300 115 385 633 633 791 1310 1400 1808 - 50 176 176 456 1045 1149 1334 - - - - - - - - 46 53 56 61 71 81 93 93
- - - - - - - - 18 65 80 108 166 221 289 368
- - - - - - - - - - - - - - - - 622 622 622 622 622 622 622 622 - - - - - - - - 426 307 307 307 234 - - - 493 493 493 493 493 266 266 266 503 731 731 731 668 817 944 944 - - - - - - - - - - - - - - - - - - 300 300 300 300 300 301 115 385 857 857 886 1310 1666 2536 - 50 176 176 445 1045 1206 2000 - - - - - - - - 46 53 56 61 71 81 93 93
- - - - - - - - 18 65 80 108 166 221 289 368
- - - - - - - - - - - - - - - -
Attachment D-3 E3 EPE Report Model Results AugustPage 16 of 34
Scenario Resource TypeHigh Gas Price Nuclear (Palo Verde)
Nuclear (SMR)Gas - Steam TurbineGas - Combined CycleGas - Combustion TurbineBiomassGeothermalWindSolarBattery StorageImportsDemand ResponseHydrogenBTM SolarLoadExcess Generation
Low Renewable and Storage Costs Nuclear (Palo Verde)Nuclear (SMR)Gas - Steam TurbineGas - Combined CycleGas - Combustion TurbineBiomassGeothermalWindSolarBattery StorageImportsDemand ResponseHydrogenBTM SolarLoadExcess Generation
2021 2024 2025 2027 2031 2035 2040 2045Installed Capacity (MW)
622 622 622 622 622 622 622 622 - - - - - - - - 426 307 307 307 234 - - - 493 493 493 493 493 266 266 266 503 731 731 731 668 848 1036 1170 - - - - - - - - - - - - - - - - - - 128 128 128 128 128 264 115 385 599 599 816 1309 1383 1710 - 50 177 177 481 1044 1145 1309 - - - - - - - - 46 53 56 61 71 81 93 93
- - - - - - - - 18 65 80 108 166 221 289 368
- - - - - - - - - - - - - - - - 622 622 622 622 622 622 622 622 - - - - - - - - 426 307 307 307 234 - - - 493 493 493 493 493 266 266 266 503 731 731 731 668 847 1034 1146 - - - - - - - - - - - - - - - - - - 160 160 160 160 160 300 115 385 525 525 806 1277 1351 1805 - 50 190 190 471 1037 1138 1335 - - - - - - - - 46 53 56 61 71 81 93 93
- - - - - - - - 18 65 80 108 166 221 289 368
- - - - - - - - - - - - - - - -
Attachment D-3 E3 EPE Report Model Results AugustPage 17 of 34
Scenario Resource TypeLeast-Cost (Reference Case) Nuclear (Palo Verde)
Nuclear (SMR)Gas - Steam TurbineGas - Combined CycleGas - Combustion TurbineBiomassGeothermalWindSolarBattery StorageImportsDemand ResponseHydrogenBTM SolarLoadExcess Generation
Least-Cost Case + REA Resources Nuclear (Palo Verde)Nuclear (SMR)Gas - Steam TurbineGas - Combined CycleGas - Combustion TurbineBiomassGeothermalWindSolarBattery StorageImportsDemand ResponseHydrogenBTM SolarLoadExcess Generation
Separate System Planning Nuclear (Palo Verde)Nuclear (SMR)Gas - Steam TurbineGas - Combined CycleGas - Combustion TurbineBiomassGeothermalWindSolarBattery StorageImportsDemand ResponseHydrogenBTM SolarLoadExcess Generation
2021 2024 2025 2027 2031 2035 2040 2045- - - - - - - - - - - - - - - - - - - - - - - - - - - - - - - - - 228 228 228 228 430 619 776 - - - - - - - - - - - - - - - - - - 102 102 102 102 102 197 - 270 506 506 708 1190 1291 1823 - 50 177 177 488 1029 1129 1327 - - - - - - - - 46 53 56 61 71 81 93 93
- - - - - - - - 18 65 80 108 166 221 289 368
- - - - - - - - - - - - - - - - - - - - - - - - - - - - - - - - - - - - - - - - - - - - - - - - - 228 228 228 228 369 502 611 - - - - - - - - - - - - - - - - - - 203 203 203 203 232 300 - 270 429 429 680 1369 1675 2299 - 50 176 177 460 1067 1246 1732 - - - - - - - - 46 53 56 61 71 81 93 93
- - - - - - - - 18 65 80 108 166 221 289 368
- - - - - - - - - - - - - - - - - - - - - - - - - - - - - - - - - - - - - - - - - - - - - - - - - 228 228 228 228 315 315 424 - - - - - - - - - - - - - - - - - - 49 49 49 49 49 161 - 270 524 524 744 1656 2432 2974 - 50 280 304 591 1514 2344 2724 - - - - - - - - 46 53 56 61 71 81 93 93
- - - - - - - - 18 65 80 108 166 221 289 368
- - - - - - - - - - - - - - - -
Cumulative Capacity Additions (MW)
Attachment D-3 E3 EPE Report Model Results AugustPage 18 of 34
Scenario Resource TypeSeparate System Planning (w H2) Nuclear (Palo Verde)
Nuclear (SMR)Gas - Steam TurbineGas - Combined CycleGas - Combustion TurbineBiomassGeothermalWindSolarBattery StorageImportsDemand ResponseHydrogenBTM SolarLoadExcess Generation
80 Clean by 2035 Nuclear (Palo Verde)Nuclear (SMR)Gas - Steam TurbineGas - Combined CycleGas - Combustion TurbineBiomassGeothermalWindSolarBattery StorageImportsDemand ResponseHydrogenBTM SolarLoadExcess Generation
20 CO2 Red by 2040 Nuclear (Palo Verde)Nuclear (SMR)Gas - Steam TurbineGas - Combined CycleGas - Combustion TurbineBiomassGeothermalWindSolarBattery StorageImportsDemand ResponseHydrogenBTM SolarLoadExcess Generation
2021 2024 2025 2027 2031 2035 2040 2045Cumulative Capacity Additions (MW)
- - - - - - - - - - - - - - - - - - - - - - - - - - - - - - - - - 228 228 228 228 315 315 424 - - - - - - - - - - - - - - - - - - 60 60 60 60 107 218 - 270 523 523 790 1267 1706 2293 - 50 278 303 570 1057 1496 1847 - - - - - - - - 46 53 56 61 71 81 93 93
- - - - - 123 206 212 18 65 80 108 166 221 289 368
- - - - - - - - - - - - - - - - - - - - - - - - - - - - - - - - - - - - - - - - - - - - - - - - - 228 228 228 228 470 582 709 - - - - - - - - - - - - - - - - - - 109 109 109 109 185 289 - 270 500 500 706 1188 1365 2061 - 50 177 177 486 968 1145 1377 - - - - - - - - 46 53 56 61 71 81 93 93
- - - - - - - - 18 65 80 108 166 221 289 368
- - - - - - - - - - - - - - - - - - - - - - - - - - - - - - - - - - - - - - - - - - - - - - - - - 228 228 228 228 470 596 698 - - - - - - - - - - - - - - - - - - 109 109 109 109 125 300 - 270 500 500 706 1188 1365 2099 - 50 177 177 486 968 1145 1409 - - - - - - - - 46 53 56 61 71 81 93 93
- - - - - - - - 18 65 80 108 166 221 289 368
- - - - - - - - - - - - - - - -
Attachment D-3 E3 EPE Report Model Results AugustPage 19 of 34
Scenario Resource Type40 CO2 Red by 2040 Nuclear (Palo Verde)
Nuclear (SMR)Gas - Steam TurbineGas - Combined CycleGas - Combustion TurbineBiomassGeothermalWindSolarBattery StorageImportsDemand ResponseHydrogenBTM SolarLoadExcess Generation
60 CO2 Red by 2040 Nuclear (Palo Verde)Nuclear (SMR)Gas - Steam TurbineGas - Combined CycleGas - Combustion TurbineBiomassGeothermalWindSolarBattery StorageImportsDemand ResponseHydrogenBTM SolarLoadExcess Generation
80 CO2 Red by 2040 Nuclear (Palo Verde)Nuclear (SMR)Gas - Steam TurbineGas - Combined CycleGas - Combustion TurbineBiomassGeothermalWindSolarBattery StorageImportsDemand ResponseHydrogenBTM SolarLoadExcess Generation
2021 2024 2025 2027 2031 2035 2040 2045Cumulative Capacity Additions (MW)
- - - - - - - - - - - - - - - - - - - - - - - - - - - - - - - - - 228 228 228 228 469 533 582 - - - - - - - - - - - - - - - - - - 109 109 109 109 239 300 - 270 500 500 706 1189 1545 2510 - 50 177 177 486 969 1184 1796 - - - - - - - - 46 53 56 61 71 81 93 93
- - - - - - - - 18 65 80 108 166 221 289 368
- - - - - - - - - - - - - - - - - - - - - - - - - - - - - - - - - - - - - - - - - - - - - - - - - 228 228 228 228 409 452 457 - - - - - - - - - - - - - - - - - - 128 128 128 128 301 302 - 270 484 484 701 1264 1947 3006 - 50 177 177 481 1044 1347 2195 - - - - - - - - 46 53 56 61 71 81 93 93
- - - - - - - - 18 65 80 108 166 221 289 368
- - - - - - - - - - - - - - - - - - - - - - - - - - - - - - - - - - - - - - - - - - - - - - - - - 228 228 228 228 338 338 338 - - - - - - - - - - - - - - - - - - 217 217 217 217 552 585 - 270 423 423 678 1510 2239 3269 - 50 176 177 458 1097 1645 2511 - - - - - - - - 46 53 56 61 71 81 93 93
- - - - - - - - 18 65 80 108 166 221 289 368
- - - - - - - - - - - - - - - -
Attachment D-3 E3 EPE Report Model Results AugustPage 20 of 34
Scenario Resource Type90 CO2 Red by 2040 Nuclear (Palo Verde)
Nuclear (SMR)Gas - Steam TurbineGas - Combined CycleGas - Combustion TurbineBiomassGeothermalWindSolarBattery StorageImportsDemand ResponseHydrogenBTM SolarLoadExcess Generation
100 CO2 Red by 2040 (w H2) Nuclear (Palo Verde)Nuclear (SMR)Gas - Steam TurbineGas - Combined CycleGas - Combustion TurbineBiomassGeothermalWindSolarBattery StorageImportsDemand ResponseHydrogenBTM SolarLoadExcess Generation
100 CO2 Red by 2040 Nuclear (Palo Verde)Nuclear (SMR)Gas - Steam TurbineGas - Combined CycleGas - Combustion TurbineBiomassGeothermalWindSolarBattery StorageImportsDemand ResponseHydrogenBTM SolarLoadExcess Generation
2021 2024 2025 2027 2031 2035 2040 2045Cumulative Capacity Additions (MW)
- - - - - - - - - - - - - - - - - - - - - - - - - - - - - - - - - 228 228 228 228 286 286 286 - - - - - - - - - - - - - - - - - - 224 224 224 224 801 828 - 270 420 420 786 1634 2282 3311 - 50 176 177 452 1284 1777 2645 - - - - - - - - 46 53 56 61 71 81 93 93
- - - - - - - - 18 65 80 108 166 221 289 368
- - - - - - - - - - - - - - - - - - - - - - - - - - - - - - - - - - - - - - - - - - - - - - - - - 228 228 228 228 248 - - - - - - - - - - - - - - - - - - - - 282 282 282 282 682 696 - 270 397 397 810 1756 2385 3440 - 50 176 177 445 1385 1955 2847 - - - - - - - - 46 53 56 61 71 81 93 93
- - - - - - 248 248 18 65 80 108 166 221 289 368
- - - - - - - - - - - - - - - - - - - - - - - - - - - - - - - - - - - - - - - - - - - - - - - - - 228 228 228 228 248 228 228 - - - - - - - - - - - - - - - - - - 120 120 282 282 1216 1605 - 270 491 491 810 1756 4833 5479 - 50 177 177 445 1385 6191 7520 - - - - - - - - 46 53 56 61 71 81 93 93
- - - - - - - - 18 65 80 108 166 221 289 701
- - - - - - - - - - - - - - - -
Attachment D-3 E3 EPE Report Model Results AugustPage 21 of 34
Scenario Resource TypeHigh DG Nuclear (Palo Verde)
Nuclear (SMR)Gas - Steam TurbineGas - Combined CycleGas - Combustion TurbineBiomassGeothermalWindSolarBattery StorageImportsDemand ResponseHydrogenBTM SolarLoadExcess Generation
High DSM Nuclear (Palo Verde)Nuclear (SMR)Gas - Steam TurbineGas - Combined CycleGas - Combustion TurbineBiomassGeothermalWindSolarBattery StorageImportsDemand ResponseHydrogenBTM SolarLoadExcess Generation
Low Load Nuclear (Palo Verde)Nuclear (SMR)Gas - Steam TurbineGas - Combined CycleGas - Combustion TurbineBiomassGeothermalWindSolarBattery StorageImportsDemand ResponseHydrogenBTM SolarLoadExcess Generation
2021 2024 2025 2027 2031 2035 2040 2045Cumulative Capacity Additions (MW)
- - - - - - - - - - - - - - - - - - - - - - - - - - - - - - - - - 228 228 228 228 420 586 788 - - - - - - - - - - - - - - - - - - 96 96 96 96 96 203 - 270 396 396 569 965 1089 1280 - 50 176 176 479 1041 1166 1313 - - - - - - - - 46 53 56 61 71 81 93 93
- - - - - - - - 42 169 210 293 455 614 809 1032
- - - - - - - - - - - - - - - - - - - - - - - - - - - - - - - - - - - - - - - - - - - - - - - - - 228 228 228 228 338 502 618 - - - - - - - - - - - - - - - - - - - - - - - 128 - 270 404 404 523 1104 1194 1648 - 50 184 184 406 1001 1091 1263 - - - - - - - - 49 66 71 82 100 101 103 103
- - - - - - - - 18 65 80 108 166 221 289 368
- - - - - - - - - - - - - - - - - - - - - - - - - - - - - - - - - - - - - - - - - - - - - - - - - 228 228 228 228 284 456 579 - - - - - - - - - - - - - - - - - - - - - - - 141 - 270 406 406 513 1140 1243 1739 - 50 186 186 355 1019 1121 1312 - - - - - - - - 46 53 56 61 71 81 93 93
- - - - - - - - 18 65 80 108 166 221 289 368
- - - - - - - - - - - - - - - -
Attachment D-3 E3 EPE Report Model Results AugustPage 22 of 34
Scenario Resource TypeHigh Load Nuclear (Palo Verde)
Nuclear (SMR)Gas - Steam TurbineGas - Combined CycleGas - Combustion TurbineBiomassGeothermalWindSolarBattery StorageImportsDemand ResponseHydrogenBTM SolarLoadExcess Generation
No Lifetime Extensions Nuclear (Palo Verde)Nuclear (SMR)Gas - Steam TurbineGas - Combined CycleGas - Combustion TurbineBiomassGeothermalWindSolarBattery StorageImportsDemand ResponseHydrogenBTM SolarLoadExcess Generation
No New Gas Nuclear (Palo Verde)Nuclear (SMR)Gas - Steam TurbineGas - Combined CycleGas - Combustion TurbineBiomassGeothermalWindSolarBattery StorageImportsDemand ResponseHydrogenBTM SolarLoadExcess Generation
2021 2024 2025 2027 2031 2035 2040 2045Cumulative Capacity Additions (MW)
- - - - - - - - - - - - - - - - - - - - - - - - - - - - - - - - - 228 228 228 228 603 807 971 - - - - - - - - - - - - - - - - - - 119 119 119 119 119 260 - 270 547 547 925 1259 1359 1905 - 50 235 327 708 1042 1142 1342 - - - - - - - - 46 53 56 61 71 81 93 93
- - - - - - - - 18 65 80 108 166 221 289 368
- - - - - - - - - - - - - - - - - - - - - - - - - - - - - - - - - - - - - - - - - - - - - - - - - 228 228 326 326 429 618 776 - - - - - - - - - - - - - - - - - - 109 109 109 109 109 197 - 270 652 652 912 1184 1284 1823 - 50 183 432 756 1027 1128 1327 - - - - - - - - 46 53 56 61 71 81 93 93
- - - - - - - - 18 65 80 108 166 221 289 368
- - - - - - - - - - - - - - - - - - - - - - - - - - - - - - - - - - - - - - - - - - - - - - - - - 228 228 228 228 228 228 228 - - - - - - - - - - - - - - - - - - 120 120 120 120 120 132 - 270 491 491 703 1831 2562 3684 - 50 177 177 483 1585 2342 3250 - - - - - - - - 46 53 56 61 71 81 93 93
- - - - - - - - 18 65 80 108 166 221 289 368
- - - - - - - - - - - - - - - -
Attachment D-3 E3 EPE Report Model Results AugustPage 23 of 34
Scenario Resource TypeLow Carbon Price Nuclear (Palo Verde)
Nuclear (SMR)Gas - Steam TurbineGas - Combined CycleGas - Combustion TurbineBiomassGeothermalWindSolarBattery StorageImportsDemand ResponseHydrogenBTM SolarLoadExcess Generation
Mid Carbon Price Nuclear (Palo Verde)Nuclear (SMR)Gas - Steam TurbineGas - Combined CycleGas - Combustion TurbineBiomassGeothermalWindSolarBattery StorageImportsDemand ResponseHydrogenBTM SolarLoadExcess Generation
High Carbon Price Nuclear (Palo Verde)Nuclear (SMR)Gas - Steam TurbineGas - Combined CycleGas - Combustion TurbineBiomassGeothermalWindSolarBattery StorageImportsDemand ResponseHydrogenBTM SolarLoadExcess Generation
2021 2024 2025 2027 2031 2035 2040 2045Cumulative Capacity Additions (MW)
- - - - - - - - - - - - - - - - - - - - - - - - - - - - - - - - - 228 228 228 228 400 587 724 - - - - - - - - - - - - - - - - - - 163 163 163 163 163 269 - 270 458 458 690 1264 1365 2000 - 50 176 176 470 1044 1145 1364 - - - - - - - - 46 53 56 61 71 81 93 93
- - - - - - - - 18 65 80 108 166 221 289 368
- - - - - - - - - - - - - - - - - - - - - - - - - - - - - - - - - - - - - - - - - - - - - - - - - 228 228 228 228 384 566 705 - - - - - - - - - - - - - - - - - - 238 238 238 238 238 300 - 270 518 518 676 1265 1382 2070 - 50 176 176 456 1045 1149 1384 - - - - - - - - 46 53 56 61 71 81 93 93
- - - - - - - - 18 65 80 108 166 221 289 368
- - - - - - - - - - - - - - - - - - - - - - - - - - - - - - - - - - - - - - - - - - - - - - - - - 228 228 228 228 377 504 504 - - - - - - - - - - - - - - - - - - 300 300 300 300 300 301 - 270 742 742 771 1265 1648 2798 - 50 176 176 445 1045 1206 2050 - - - - - - - - 46 53 56 61 71 81 93 93
- - - - - - - - 18 65 80 108 166 221 289 368
- - - - - - - - - - - - - - - -
Attachment D-3 E3 EPE Report Model Results AugustPage 24 of 34
Scenario Resource TypeHigh Gas Price Nuclear (Palo Verde)
Nuclear (SMR)Gas - Steam TurbineGas - Combined CycleGas - Combustion TurbineBiomassGeothermalWindSolarBattery StorageImportsDemand ResponseHydrogenBTM SolarLoadExcess Generation
Low Renewable and Storage Costs Nuclear (Palo Verde)Nuclear (SMR)Gas - Steam TurbineGas - Combined CycleGas - Combustion TurbineBiomassGeothermalWindSolarBattery StorageImportsDemand ResponseHydrogenBTM SolarLoadExcess Generation
2021 2024 2025 2027 2031 2035 2040 2045Cumulative Capacity Additions (MW)
- - - - - - - - - - - - - - - - - - - - - - - - - - - - - - - - - 228 228 228 228 408 596 730 - - - - - - - - - - - - - - - - - - 128 128 128 128 128 264 - 270 484 484 701 1264 1365 1972 - 50 177 177 481 1044 1145 1359 - - - - - - - - 46 53 56 61 71 81 93 93
- - - - - - - - 18 65 80 108 166 221 289 368
- - - - - - - - - - - - - - - - - - - - - - - - - - - - - - - - - - - - - - - - - - - - - - - - - 228 228 228 228 407 594 706 - - - - - - - - - - - - - - - - - - 160 160 160 160 160 300 - 270 410 410 691 1232 1333 2067 - 50 190 190 471 1037 1138 1385 - - - - - - - - 46 53 56 61 71 81 93 93
- - - - - - - - 18 65 80 108 166 221 289 368
- - - - - - - - - - - - - - - -
Attachment D-3 E3 EPE Report Model Results AugustPage 25 of 34
Scenario Resource TypeLeast-Cost (Reference Case) Nuclear (Palo Verde)
Nuclear (SMR)Gas - Steam TurbineGas - Combined CycleGas - Combustion TurbineBiomassGeothermalWindSolarBattery StorageImportsDemand ResponseHydrogenBTM SolarLoadExcess Generation
Least-Cost Case + REA Resources Nuclear (Palo Verde)Nuclear (SMR)Gas - Steam TurbineGas - Combined CycleGas - Combustion TurbineBiomassGeothermalWindSolarBattery StorageImportsDemand ResponseHydrogenBTM SolarLoadExcess Generation
Separate System Planning Nuclear (Palo Verde)Nuclear (SMR)Gas - Steam TurbineGas - Combined CycleGas - Combustion TurbineBiomassGeothermalWindSolarBattery StorageImportsDemand ResponseHydrogenBTM SolarLoadExcess Generation
2021 2024 2025 2027 2031 2035 2040 2045- - - - - - - - - - - - - - - - - (119) (119) (119) (192) (426) (426) (426) - - - - - (227) (227) (227) - - - - (63) (63) (63) (63) - - - - - - - - - - - - - - - - - - - - - - - - - - - - - (70) (97) (377) - - - - - - - (50) - - - - - - - - - - - - - - - - - - - - - - - - - - - - - - - - - - - - - - - - - - - - - - - - - - - - - - - - - - - - - - - - - (119) (119) (119) (192) (426) (426) (426) - - - - - (227) (227) (227) - - - - (63) (63) (63) (63) - - - - - - - - - - - - - - - - - - - - - - - - - - - - - (70) (97) (377) - - - - - - - (50) - - - - - - - - - - - - - - - - - - - - - - - - - - - - - - - - - - - - - - - - - - - - - - - - - - - - - - - - - - - - - - - - - (119) (119) (119) (192) (426) (426) (426) - - - - - (227) (227) (227) - - - - (63) (63) (63) (63) - - - - - - - - - - - - - - - - - - - - - - - - - - - - - (70) (97) (377) - - - - - - - (50) - - - - - - - - - - - - - - - - - - - - - - - - - - - - - - - - - - - - - - - - - - - - - - - -
Cumulative Capacity Retirements (MW)
Attachment D-3 E3 EPE Report Model Results AugustPage 26 of 34
Scenario Resource TypeSeparate System Planning (w H2) Nuclear (Palo Verde)
Nuclear (SMR)Gas - Steam TurbineGas - Combined CycleGas - Combustion TurbineBiomassGeothermalWindSolarBattery StorageImportsDemand ResponseHydrogenBTM SolarLoadExcess Generation
80 Clean by 2035 Nuclear (Palo Verde)Nuclear (SMR)Gas - Steam TurbineGas - Combined CycleGas - Combustion TurbineBiomassGeothermalWindSolarBattery StorageImportsDemand ResponseHydrogenBTM SolarLoadExcess Generation
20 CO2 Red by 2040 Nuclear (Palo Verde)Nuclear (SMR)Gas - Steam TurbineGas - Combined CycleGas - Combustion TurbineBiomassGeothermalWindSolarBattery StorageImportsDemand ResponseHydrogenBTM SolarLoadExcess Generation
2021 2024 2025 2027 2031 2035 2040 2045Cumulative Capacity Retirements (MW)
- - - - - - - - - - - - - - - - - (119) (119) (119) (192) (426) (426) (426) - - - - - (227) (227) (227) - - - - (63) (63) (63) (63) - - - - - - - - - - - - - - - - - - - - - - - - - - - - - (70) (97) (377) - - - - - - - (50) - - - - - - - - - - - - - - - - - - - - - - - - - - - - - - - - - - - - - - - - - - - - - - - - - - - - - - - - - - - - - - - - - (119) (119) (119) (192) (426) (426) (426) - - - - - (227) (227) (227) - - - - (63) (63) (63) (63) - - - - - - - - - - - - - - - - - - - - - - - - - - - - - (70) (97) (377) - - - - - - - (50) - - - - - - - - - - - - - - - - - - - - - - - - - - - - - - - - - - - - - - - - - - - - - - - - - - - - - - - - - - - - - - - - - (119) (119) (119) (192) (426) (426) (426) - - - - - (227) (227) (227) - - - - (63) (63) (63) (63) - - - - - - - - - - - - - - - - - - - - - - - - - - - - - (70) (97) (377) - - - - - - - (50) - - - - - - - - - - - - - - - - - - - - - - - - - - - - - - - - - - - - - - - - - - - - - - - -
Attachment D-3 E3 EPE Report Model Results AugustPage 27 of 34
Scenario Resource Type40 CO2 Red by 2040 Nuclear (Palo Verde)
Nuclear (SMR)Gas - Steam TurbineGas - Combined CycleGas - Combustion TurbineBiomassGeothermalWindSolarBattery StorageImportsDemand ResponseHydrogenBTM SolarLoadExcess Generation
60 CO2 Red by 2040 Nuclear (Palo Verde)Nuclear (SMR)Gas - Steam TurbineGas - Combined CycleGas - Combustion TurbineBiomassGeothermalWindSolarBattery StorageImportsDemand ResponseHydrogenBTM SolarLoadExcess Generation
80 CO2 Red by 2040 Nuclear (Palo Verde)Nuclear (SMR)Gas - Steam TurbineGas - Combined CycleGas - Combustion TurbineBiomassGeothermalWindSolarBattery StorageImportsDemand ResponseHydrogenBTM SolarLoadExcess Generation
2021 2024 2025 2027 2031 2035 2040 2045Cumulative Capacity Retirements (MW)
- - - - - - - - - - - - - - - - - (119) (119) (119) (192) (426) (426) (426) - - - - - (227) (227) (227) - - - - (63) (63) (63) (63) - - - - - - - -- - - - - - - -- - - - - - - -- - - - - (70) (97) (377) - - - - - - - (50) - - - - - - - -- - - - - - - -- - - - - - - -- - - - - - - -- - - - - - - -- - - - - - - -- - - - - - - -- - - - - - - -- (119) (119) (119) (192) (426) (426) (426) - - - - - (227) (227) (227) - - - - (63) (63) (63) (63) - - - - - - - -- - - - - - - -- - - - - - - -- - - - - (70) (97) (377) - - - - - - - (50) - - - - - - - -- - - - - - - -- - - - - - - -- - - - - - - -- - - - - - - -- - - - - - - -- - - - - - - -- - - - - - - -- (119) (119) (119) (192) (426) (426) (426) - - - - - (227) (227) (227) - - - - (63) (63) (63) (63) - - - - - - - -- - - - - - - -- - - - - - - -- - - - - (70) (97) (377) - - - - - - - (50) - - - - - - - -- - - - - - - -- - - - - - - -- - - - - - - -- - - - - - - -- - - - - - - -
Attachment D-3 E3 EPE Report Model Results AugustPage 28 of 34
Scenario Resource Type90 CO2 Red by 2040 Nuclear (Palo Verde)
Nuclear (SMR)Gas - Steam TurbineGas - Combined CycleGas - Combustion TurbineBiomassGeothermalWindSolarBattery StorageImportsDemand ResponseHydrogenBTM SolarLoadExcess Generation
100 CO2 Red by 2040 (w H2) Nuclear (Palo Verde)Nuclear (SMR)Gas - Steam TurbineGas - Combined CycleGas - Combustion TurbineBiomassGeothermalWindSolarBattery StorageImportsDemand ResponseHydrogenBTM SolarLoadExcess Generation
100 CO2 Red by 2040 Nuclear (Palo Verde)Nuclear (SMR)Gas - Steam TurbineGas - Combined CycleGas - Combustion TurbineBiomassGeothermalWindSolarBattery StorageImportsDemand ResponseHydrogenBTM SolarLoadExcess Generation
2021 2024 2025 2027 2031 2035 2040 2045Cumulative Capacity Retirements (MW)
- - - - - - - - - - - - - - - - - (119) (119) (119) (192) (426) (426) (426) - - - - - (227) (227) (227) - - - - (63) (63) (63) (63) - - - - - - - - - - - - - - - - - - - - - - - - - - - - - (70) (97) (377) - - - - - - - (50) - - - - - - - - - - - - - - - - - - - - - - - - - - - - - - - - - - - - - - - - - - - - - - - - - - - - - - - - - - - - - - - - - (119) (119) (119) (192) (426) (426) (426) - - - - - (227) (227) (227) - - - - (63) (63) (63) (63) - - - - - - - - - - - - - - - - - - - - - - - - - - - - - (70) (97) (377) - - - - - - - (50) - - - - - - - - - - - - - - - - - - - - - - - - - - - - - - - - - - - - - - - - - - - - - - - - - - - - - - - - - - - - - - - - - (119) (119) (119) (192) (426) (426) (426) - - - - - (227) (227) (227) - - - - (63) (63) (63) (63) - - - - - - - - - - - - - - - - - - - - - - - - - - - - - (70) (97) (377) - - - - - - - (50) - - - - - - - - - - - - - - - - - - - - - - - - - - - - - - - - - - - - - - - - - - - - - - - -
Attachment D-3 E3 EPE Report Model Results AugustPage 29 of 34
Scenario Resource TypeHigh DG Nuclear (Palo Verde)
Nuclear (SMR)Gas - Steam TurbineGas - Combined CycleGas - Combustion TurbineBiomassGeothermalWindSolarBattery StorageImportsDemand ResponseHydrogenBTM SolarLoadExcess Generation
High DSM Nuclear (Palo Verde)Nuclear (SMR)Gas - Steam TurbineGas - Combined CycleGas - Combustion TurbineBiomassGeothermalWindSolarBattery StorageImportsDemand ResponseHydrogenBTM SolarLoadExcess Generation
Low Load Nuclear (Palo Verde)Nuclear (SMR)Gas - Steam TurbineGas - Combined CycleGas - Combustion TurbineBiomassGeothermalWindSolarBattery StorageImportsDemand ResponseHydrogenBTM SolarLoadExcess Generation
2021 2024 2025 2027 2031 2035 2040 2045Cumulative Capacity Retirements (MW)
- - - - - - - - - - - - - - - - - (119) (119) (119) (192) (426) (426) (426) - - - - - (227) (227) (227) - - - - (63) (63) (63) (63) - - - - - - - - - - - - - - - - - - - - - - - - - - - - - (70) (97) (377) - - - - - - - (50) - - - - - - - - - - - - - - - - - - - - - - - - - - - - - - - - - - - - - - - - - - - - - - - - - - - - - - - - - - - - - - - - - (119) (119) (119) (192) (426) (426) (426) - - - - - (227) (227) (227) - - - - (63) (63) (63) (63) - - - - - - - - - - - - - - - - - - - - - - - - - - - - - (70) (97) (377) - - - - - - - (50) - - - - - - - - - - - - - - - - - - - - - - - - - - - - - - - - - - - - - - - - - - - - - - - - - - - - - - - - - - - - - - - - - (119) (119) (119) (192) (426) (426) (426) - - - - - (227) (227) (227) - - - - (63) (63) (63) (63) - - - - - - - - - - - - - - - - - - - - - - - - - - - - - (70) (97) (377) - - - - - - - (50) - - - - - - - - - - - - - - - - - - - - - - - - - - - - - - - - - - - - - - - - - - - - - - - -
Attachment D-3 E3 EPE Report Model Results AugustPage 30 of 34
Scenario Resource TypeHigh Load Nuclear (Palo Verde)
Nuclear (SMR)Gas - Steam TurbineGas - Combined CycleGas - Combustion TurbineBiomassGeothermalWindSolarBattery StorageImportsDemand ResponseHydrogenBTM SolarLoadExcess Generation
No Lifetime Extensions Nuclear (Palo Verde)Nuclear (SMR)Gas - Steam TurbineGas - Combined CycleGas - Combustion TurbineBiomassGeothermalWindSolarBattery StorageImportsDemand ResponseHydrogenBTM SolarLoadExcess Generation
No New Gas Nuclear (Palo Verde)Nuclear (SMR)Gas - Steam TurbineGas - Combined CycleGas - Combustion TurbineBiomassGeothermalWindSolarBattery StorageImportsDemand ResponseHydrogenBTM SolarLoadExcess Generation
2021 2024 2025 2027 2031 2035 2040 2045Cumulative Capacity Retirements (MW)
- - - - - - - - - - - - - - - - - (119) (119) (119) (192) (426) (426) (426) - - - - - (227) (227) (227) - - - - (63) (63) (63) (63) - - - - - - - - - - - - - - - - - - - - - - - - - - - - - (70) (97) (377) - - - - - - - (50) - - - - - - - - - - - - - - - - - - - - - - - - - - - - - - - - - - - - - - - - - - - - - - - - - - - - - - - - - - - - - - - - - (192) (192) (282) (282) (426) (426) (426) - - - (227) (227) (227) (227) (227) - - - - (63) (63) (63) (63) - - - - - - - - - - - - - - - - - - - - - - - - - - - - - (70) (97) (377) - - - - - - - (50) - - - - - - - - - - - - - - - - - - - - - - - - - - - - - - - - - - - - - - - - - - - - - - - - - - - - - - - - - - - - - - - - - (119) (119) (119) (192) (426) (426) (426) - - - - - (227) (227) (227) - - - - (63) (63) (63) (63) - - - - - - - - - - - - - - - - - - - - - - - - - - - - - (70) (97) (377) - - - - - - - (50) - - - - - - - - - - - - - - - - - - - - - - - - - - - - - - - - - - - - - - - - - - - - - - - -
Attachment D-3 E3 EPE Report Model Results AugustPage 31 of 34
Scenario Resource TypeLow Carbon Price Nuclear (Palo Verde)
Nuclear (SMR)Gas - Steam TurbineGas - Combined CycleGas - Combustion TurbineBiomassGeothermalWindSolarBattery StorageImportsDemand ResponseHydrogenBTM SolarLoadExcess Generation
Mid Carbon Price Nuclear (Palo Verde)Nuclear (SMR)Gas - Steam TurbineGas - Combined CycleGas - Combustion TurbineBiomassGeothermalWindSolarBattery StorageImportsDemand ResponseHydrogenBTM SolarLoadExcess Generation
High Carbon Price Nuclear (Palo Verde)Nuclear (SMR)Gas - Steam TurbineGas - Combined CycleGas - Combustion TurbineBiomassGeothermalWindSolarBattery StorageImportsDemand ResponseHydrogenBTM SolarLoadExcess Generation
2021 2024 2025 2027 2031 2035 2040 2045Cumulative Capacity Retirements (MW)
- - - - - - - - - - - - - - - - - (119) (119) (119) (192) (426) (426) (426) - - - - - (227) (227) (227) - - - - (63) (63) (63) (63) - - - - - - - - - - - - - - - - - - - - - - - - - - - - - (70) (97) (377) - - - - - - - (50) - - - - - - - - - - - - - - - - - - - - - - - - - - - - - - - - - - - - - - - - - - - - - - - - - - - - - - - - - - - - - - - - - (119) (119) (119) (192) (426) (426) (426) - - - - - (227) (227) (227) - - - - (63) (63) (63) (63) - - - - - - - - - - - - - - - - - - - - - - - - - - - - - (70) (97) (377) - - - - - - - (50) - - - - - - - - - - - - - - - - - - - - - - - - - - - - - - - - - - - - - - - - - - - - - - - - - - - - - - - - - - - - - - - - - (119) (119) (119) (192) (426) (426) (426) - - - - - (227) (227) (227) - - - - (63) (63) (63) (63) - - - - - - - - - - - - - - - - - - - - - - - - - - - - - (70) (97) (377) - - - - - - - (50) - - - - - - - - - - - - - - - - - - - - - - - - - - - - - - - - - - - - - - - - - - - - - - - -
Attachment D-3 E3 EPE Report Model Results AugustPage 32 of 34
Scenario Resource TypeHigh Gas Price Nuclear (Palo Verde)
Nuclear (SMR)Gas - Steam TurbineGas - Combined CycleGas - Combustion TurbineBiomassGeothermalWindSolarBattery StorageImportsDemand ResponseHydrogenBTM SolarLoadExcess Generation
Low Renewable and Storage Costs Nuclear (Palo Verde)Nuclear (SMR)Gas - Steam TurbineGas - Combined CycleGas - Combustion TurbineBiomassGeothermalWindSolarBattery StorageImportsDemand ResponseHydrogenBTM SolarLoadExcess Generation
2021 2024 2025 2027 2031 2035 2040 2045Cumulative Capacity Retirements (MW)
- - - - - - - - - - - - - - - - - (119) (119) (119) (192) (426) (426) (426) - - - - - (227) (227) (227) - - - - (63) (63) (63) (63) - - - - - - - - - - - - - - - - - - - - - - - - - - - - - (70) (97) (377) - - - - - - - (50) - - - - - - - - - - - - - - - - - - - - - - - - - - - - - - - - - - - - - - - - - - - - - - - - - - - - - - - - - - - - - - - - - (119) (119) (119) (192) (426) (426) (426) - - - - - (227) (227) (227) - - - - (63) (63) (63) (63) - - - - - - - - - - - - - - - - - - - - - - - - - - - - - (70) (97) (377) - - - - - - - (50) - - - - - - - - - - - - - - - - - - - - - - - - - - - - - - - - - - - - - - - - - - - - - - - -
Attachment D-3 E3 EPE Report Model Results AugustPage 33 of 34
Scenario 2021 2024 2025 2027 2031 2035 2040 2045Least-Cost (Reference Case) 246$ 233$ 245$ 262$ 284$ 340$ 402$ 498$ Least-Cost Case + REA Resources 246$ 233$ 247$ 262$ 285$ 343$ 406$ 506$ Separate System Planning 247$ 233$ 250$ 268$ 293$ 369$ 473$ 571$ Separate System Planning (w H2) 247$ 233$ 251$ 268$ 293$ 348$ 438$ 536$ 80 Clean by 2035 246$ 233$ 245$ 262$ 284$ 342$ 402$ 498$ 20 CO2 Red by 2040 246$ 233$ 245$ 262$ 284$ 342$ 402$ 499$ 40 CO2 Red by 2040 246$ 233$ 245$ 262$ 284$ 342$ 405$ 512$ 60 CO2 Red by 2040 246$ 233$ 246$ 262$ 284$ 341$ 419$ 531$ 80 CO2 Red by 2040 246$ 233$ 247$ 262$ 284$ 347$ 463$ 577$ 90 CO2 Red by 2040 246$ 233$ 247$ 263$ 287$ 357$ 500$ 615$ 100 CO2 Red by 2040 (w H2) 246$ 233$ 249$ 264$ 289$ 367$ 551$ 663$ 100 CO2 Red by 2040 246$ 233$ 245$ 262$ 289$ 367$ 1113$ 1282$ High DG 245$ 231$ 241$ 256$ 277$ 325$ 382$ 470$ High DSM 245$ 230$ 239$ 254$ 271$ 313$ 367$ 450$ Low Load 239$ 227$ 236$ 252$ 269$ 312$ 371$ 460$ High Load 253$ 239$ 255$ 276$ 307$ 374$ 441$ 540$ No Lifetime Extensions 246$ 228$ 243$ 266$ 298$ 344$ 406$ 502$ No New Gas 246$ 233$ 245$ 262$ 284$ 367$ 453$ 570$ Low Carbon Price 291$ 277$ 284$ 301$ 323$ 379$ 444$ 543$ Mid Carbon Price 358$ 341$ 341$ 358$ 381$ 436$ 505$ 611$ High Carbon Price 469$ 449$ 432$ 451$ 475$ 529$ 603$ 718$ High Gas Price 257$ 242$ 251$ 268$ 291$ 347$ 412$ 509$ Low Renewable and Storage Costs 246$ 233$ 240$ 256$ 274$ 321$ 379$ 463$
Annual Revenue Requirement ($MM)
Attachment D-3 E3 EPE Report Model Results AugustPage 34 of 34
Scenario Clean Energy Type 2021 2024 2025 2027 2031 2035 2040 2045Least-Cost (Reference Case) Renewable 4 12 21 21 27 34 36 39
Zero Carbon 62 68 77 75 77 81 77 75Least-Cost Case + REA Resources Renewable 4 12 24 24 30 39 43 49
Zero Carbon 62 68 79 78 80 85 84 84Separate System Planning Renewable 4 12 20 21 26 38 42 46
Zero Carbon 62 68 76 75 76 84 83 82Separate System Planning (w H2) Renewable 4 12 21 21 27 34 41 45
Zero Carbon 62 68 76 75 77 81 82 8180 Clean by 2035 Renewable 4 12 21 22 27 34 39 45
Zero Carbon 62 68 77 76 77 81 80 8020 CO2 Red by 2040 Renewable 4 12 21 22 27 34 37 46
Zero Carbon 62 68 77 76 77 81 78 8140 CO2 Red by 2040 Renewable 4 12 21 22 27 34 43 51
Zero Carbon 62 68 77 76 77 81 84 8660 CO2 Red by 2040 Renewable 4 12 22 22 27 36 48 56
Zero Carbon 62 68 77 76 78 83 89 9180 CO2 Red by 2040 Renewable 4 12 24 24 30 41 54 60
Zero Carbon 62 68 79 78 81 87 94 9590 CO2 Red by 2040 Renewable 4 12 24 24 32 43 56 62
Zero Carbon 62 68 79 78 82 89 97 98100 CO2 Red by 2040 (w H2) Renewable 4 12 25 26 34 45 56 62
Zero Carbon 62 68 81 79 84 92 100 100100 CO2 Red by 2040 Renewable 4 12 22 22 34 45 60 65
Zero Carbon 62 68 77 76 84 92 100 100High DG Renewable 4 13 21 22 27 35 37 39
Zero Carbon 63 70 76 75 77 82 78 74High DSM Renewable 4 12 16 16 20 31 32 37
Zero Carbon 63 69 73 72 73 80 76 75Low Load Renewable 4 12 16 16 19 31 33 38
Zero Carbon 64 70 73 72 72 79 75 75High Load Renewable 4 12 23 24 31 36 36 41
Zero Carbon 61 66 77 76 79 80 76 75No Lifetime Extensions Renewable 4 12 23 26 31 35 36 39
Zero Carbon 62 68 79 80 81 81 77 75No New Gas Renewable 4 12 22 22 27 42 50 57
Zero Carbon 62 68 77 76 77 88 90 92Low Carbon Price Renewable 4 12 23 23 28 37 38 43
Zero Carbon 62 68 78 77 79 83 79 79Mid Carbon Price Renewable 4 12 26 26 31 39 41 45
Zero Carbon 62 68 81 80 81 86 82 81High Carbon Price Renewable 4 12 30 31 34 41 45 54
Zero Carbon 62 68 86 85 84 87 86 89High Gas Price Renewable 4 12 22 22 27 36 37 43
Zero Carbon 62 68 77 76 78 82 78 78Low Renewable and Storage Costs Renewable 4 12 22 22 28 36 38 44
Zero Carbon 62 68 77 76 78 83 79 80
Clean Energy ( of Load)
BEFORE THE NEW MEXICO PUBLIC REGULATION COMMISSION
RULE 1773 NMAC FILING
EL PASO ELECTRIC COMPANY NOTICE OF 2021 INTEGRATED RESOURCE PLAN
2020-2021 PLANNING PROCESS AND PUBLIC ADVISORY PROCESS MEETINGS
DECLARATION OF CURTIS HUTCHESON OF NOTICE TO CUSTOMERS
I Curtis Hutcheson pursuant to Rule 1-011 NMRA state as follows
1 I affirm in writing under penalty of perjury under the laws of the State of New Mexico
that the following statements are true and correct
2 I am over 18 years of age and have personal knowledge of the facts stated herein I am
employed as Supervisor-Regulatory Case Management My business address is 100 N Stanton
Street El Paso Texas 79901
3 My responsibilities include the oversight and preparation of rate and regulatory filings
and compliance with the various regulatory requirements of the jurisdictions in which EPE
operates
4 Pursuant to Rule 17739H(1) NMAC the New Mexico Public Regulation Commission
(ldquoCommissionrdquo) requires EPE to provide notice of EPErsquos 2021 Integrated Resource Planrsquos
2020-2021 Planning Process and Public Advisory Process Meetings in the utilityrsquos billing
inserts
5 EPE directly mailed the required notice to all existing New Mexico customers in a bill
insert between June 4 2020 and July 2 2020 A copy of the bill insert is attached as Exhibit A to
Attachment E-1 Proof of Notice
2
this Affirmation
6 EPE also published the notice in the Las Cruces Sun News on May 31 2020 The affidavit
and tear sheet are attached as Exhibit B to this Affirmation
7 EPE provided notice on June 4 2020 30 days prior to the first scheduled meeting on
July 10 2020 to the commission interveners in its most recent general rate case and
participants in its most recent renewable energy energy efficiency and IRP proceedings The
email of the notice and certificate of service is attached as Exhibit C to this Affirmation
I submit this Declaration based upon my personal knowledge and upon information
and belief in support of EPErsquos 2021 Integrated Resource Planrsquos 2020-2021 Planning Process
and Public Advisory Process Meetings
FURTHER DECLARANT SAYETH NAUGHT
I declare under penalty of perjury that the foregoing is true and correct
Executed on May 13 2021
__s Curtis Hutcheson________
CURTIS HUTCHESON
Attachment E-1 Proof of Notice
BEFORE THE NEW MEXICO PUBLIC REGULATION COMMISSION
RULE 1773 NMAC FILING
EL PASO ELECTRIC COMPANY
NOTICE OF 2021 INTEGRATED RESOURCE PLAN
2020-2021 PUBLIC ADVISORY PROCESS MEETINGS
Notice is hereby given that
El Paso Electric Company (EPE) invites members of the public to participate in the Integrated Resource
Plan (ldquoIRPrdquo) public advisory process through a series of public meetings With public participation EPE
will develop its IRP pursuant to the New Mexico Efficient Use of Energy Act and the New Mexico Public
Regulation Commissions (Commission) IRP Rule 1773 NMAC EPEs IRP is developed to identify cost-
effective demand-side and supply-side electricity resources to serve EPEs customers over the next 20-
year planning period
The IRP will be submitted to the Commission no later than July 2021 Public participation is an important
component of the development and implementation of EPEs integrated resource planning in New
Mexico EPE encourages interested members of the public to attend these public meetings to provide
public input and commentary whether as a residential or business customer or as a representative of a
trade non-profit neighborhood shareholder civic or other group
Given the currently effective limitations on public gatherings in New Mexico and Texas the first scheduled
meeting will be held electronically and by phone conference on July 10 2020 at 200 pm MDT The IRP
process will be explained and additional meeting dates and locations will be set at that time Prior to
each meeting the presentation for that meeting will be posted on EPEs website wwwepeletriccom If
you are interested in attending the meeting or otherwise participating in the process please contact EPE
by emailing NMIRPepelectriccom or calling at (915) 543- 4354
Exhibit A Page 1 of 1Attachment E-1 Proof of Notice
Exhibit B Page 1 of 2Attachment E-1 Proof of Notice
2H SUNDAY MAY 31 2020 LAS CRUCES SUN-NEWS
4B-501 Notice to creditors by publi-cation and notice to creditors bywritten notice (mailing or other de-livery)[For use with Rules 1B-304 1B-306and 1B-401 NMRA]
STATE OF NEW MEXICOIN THE PROBATE COURTDONA ANA COUNTY
No 20-0074
IN THE MATTER OF THEESTATE OF Juliet S WilliamsDECEASED
NOTICE TO CREDITORSNOTICE IS HEREBY GIVEN thatthe undersigned has been appointedpersonal representative of the es-tate of the decedent All personshaving claims against the estate ofthe decedent are required to presenttheir claims within four (4) monthsafter the date of the first publica-tion of any published notice to cred-itors or sixty (60) days after thedate of mailing or other delivery ofthis notice whichever is later orthe claims will be forever barredClaims must be presented either tothe undersigned personal represen-tative at the address below or filedwith the Probate Court of DonaAna 845 N Motel Blvd 1-201 LasCruces NM 88007Dated May 2020s Edwin James Williams Jrsignature of representative
Edwin James Williams JrPrinted Name
17093 White Pine RdStreet address
Beaver dam VA 23015City state and ZIP code
4213196 Sun-News May 31 andJun 7 14 2020
To advertise visit
SELL ITBUY IT
FIND ITcars
garage sales
tickets
jobs
antiques
motorcycles
computers
boats
sports equipment
pets
instruments
jewelry
furniture
tablets
auctions
yard sales
collectibles
appliances
cameras
coins
Place yourclassified ad today
FINDING WORK SHOULDNrsquoT BE WORK
Your job search ends here
Get started by visitingjobsusatodaycom
HVAC TECHNICIAN II
ACO amp CODES-LABORER
ANIMAL CONTROL OFFICER
DASO CADET-UNCERTIFIED
ROADS-EQUIPMENT OPERATOR
ELECTIONS SPECIALIST-TEMPORARY
ROADS-HEAVY EQUIPMENT OPERATOR
DETENTION CENTER OFFICER TRAINEE
DOCUMENT TECHNICIAN-DC DISPOSITIONS
ENVIRONMENTAL CODES ENFORCEMENT OFFICER
WATERWASTEWATER OPERATOR III
Job Application amp Job Announcements available on our Website atwwwdonaanacountyorg
Computer kiosks are available in the Human Resources Department
DONtildeA ANA COUNTYJOB VACANCIES
CAMINO REALREGIONAL UTILITY AUTHORITY
JOB VACANCIES
Demolition Build RoadsLeveling
Business amp Service Directoryto advertise email ServiceDirectorylcsun-newscom
or call 8007645620
Exhibit B Page 2 of 2Attachment E-1 Proof of Notice
From Griego PatriciaTo Burns Nancy Griego Patricia Jeffrey Wechsler Diana Luna Kari Olson Lorraine Talley John F McIntyre
Schichtl James Hutcheson Marvin C Novela Mariah M Parsons Judith M Pleasant Linda G Perea Araceli Gastevenslawgmailcom jvega-brownlas-crucesorg joprovenciolas-crucesorg llarocquelas-crucesorg marcydlas-crucesorg davilalas-crucesorg JAGlas-crucesorg hconnellylas-crucesorg ddollahonlas-crucesorg tomfdonaanacountyorg rockybacchusgmailcomecomaxaclifeisgood2com lellisnmsuedu ghauboldadnmsuedu jdrakemodrallcomnwinterstelznerlawcom kherrmannstelznerlawcom rgallegosstelznerlawcom Nobleccaegmailcomstephaniedzur-Lawcom Lundin Robert gelliotnmaggov Cholla Khoury lawofficejasonmarkscomJsmithwatsonlawlcgmailcom mayortrujillocityofanthonynmorg mlsouleshotmailcombthroneattynewmexicocom Goodin Nelson fredkdonaanacountyorg Rickvotesolarorgtasolomon6gmailcom Dahlharrishotmailcom Jdittmerutilitechnet Jaherzsawvelcomakharrigersawvelcom Borman Bradford PRC Reynolds John PRC Chavez Milo PRC Sidler Jack PRCjohnbogatkostatenmus marctuplerstatenmus gilberttfuentesstatenmus Sisneros Anthony R PRCLeyba-Tercero Elisha PRC Fisk Russell PRC Amer Judith PRC Smith Michael C PRC Martinez-Rael PeggyPRC elizabethramirezstatenmus carolynglickstatenmus Hurst Elizabeth PRCchristopherryanstatenmus philipbsimpsoncomcastnet Kylejsmith124civmailmilrobertagantoncivmailmil hgellerswenergyorg jbrantswenergyorg ctcolumbiaaolcomltougascleanenergyregresearchcom dgegaxnmsuedu Ramonablabersierracluborgsricdonearthlinknet smichelwesternresourcesorg Beadles Cydney PRCpatoconnellwesternresourcesorg aprilelliottwesternresourcesorg dneidcoxnet schaefnogmailcomdavidvw77com bslocumdwmrlawcom jmcnallydwmrlawcom mbarkerdwmrlawcommzidovskymontandcom
Cc EPE_Reg_MgmtSubject Rule 1773 NMAC Filing EPEs Notice of 2020-2021 Public Advisory Process Meetings for 2021 IRP amp COSDate Thursday June 4 2020 105041 AMAttachments 2021 IRP Noticepdf
COS Notice of IRP Processpdf
Good morning Attached is El Paso Electric Companyrsquos Notice of its 2020-2021 Public AdvisoryProcess Meetings for the 2021 Integrated Resource Plan and Certificate of Service that was filed byemail with NMPRC Records today
Patricia ldquoTrishrdquo Griego| El Paso Electric CompanyLegal Assistant300 Galisteo St Suite 206Santa Fe New Mexico 87501T (505) 982-4713 | C (505) 470-4048Patriciagriegoepelectriccom
CONFIDENTIALITY NOTICE The information contained in this electronic mailtransmission is CONFIDENTIAL and it may qualify as material protected pursuantto the Texas Uniform Trade Secrets Act the New Mexico Uniform Trade SecretsAct or other laws If you are not the intended recipient please destroydelete thismessage and any attachments and immediately notify the sender
Exhibit C Page 1 of 1Attachment E-1 Proof of Notice

Atta
chm
ent B
-2
2021
Ene
rgy
Fore
cast
by
Juri
sdic
iton
Page
1 o
f 2
Nativ
e Sy
stem
Ene
rgy
2021
2022
2023
2024
2025
2026
2027
2028
2029
2030
Texa
sRe
side
ntial
269
252
0274
858
7280
156
2284
349
6288
974
5294
484
1301
222
7308
429
1315
986
1324
432
1Co
mmercial amp
Ind
ustrial Sm
all
197
388
8199
542
7200
073
7200
223
7200
400
5200
866
8201
424
1201
995
8202
782
4203
746
3Co
mmercial amp
Ind
ustrial La
rge
97205
097
638
498
000
598
299
598
543
698
739
998
894
699
013
099
099
999
159
3Street L
ighting
41523
42056
42506
42961
43420
43880
44323
44748
45182
45638
OPA
117
458
0119
392
2120
482
1121
593
7122
580
0123
538
3124
374
7124
823
3125
523
2126
259
7
Total Te
xas
685
456
1695
637
6702
963
0708
762
7714
840
7722
017
1730
348
5738
736
0747
909
8758
161
3
New
Mex
ico
Reside
ntial
84538
186
170
686
900
987
582
188
307
989
354
290
602
192
040
493
682
395
364
8Co
mmercial amp
Ind
ustrial Sm
all
52893
553
705
853
927
054
119
454
487
955
041
555
693
956
507
257
338
558
004
7Co
mmercial amp
Ind
ustrial La
rge
75359
74520
73908
73388
72906
72438
71976
71517
71059
70602
Street L
ighting
198
1202
0205
2208
3211
7215
0218
4221
8225
3228
7OPA
38232
138
851
038
920
839
051
639
089
539
178
139
325
039
519
039
770
740
120
6
Total Ne
w Mex
ico
183
397
6186
381
4187
344
7188
300
2189
387
5191
032
6193
037
1195
440
1198
122
7200
779
0
Compa
ny U
se13
815
13940
14065
14192
14319
14448
14578
14709
14842
14975
RGEC
69263
70552
71840
73128
74417
75705
76993
78282
79570
80858
Total Na
tive
System
877
161
6890
468
2898
898
2905
794
9913
101
8922
065
0932
542
7943
475
2955
473
7968
523
7 Attachment B-2 2021 Energy Forecast by Jurisdiction
Page 1 of 2
Atta
chm
ent B
-2
2021
Ene
rgy
Fore
cast
by
Juri
sdic
iton
Page
2 o
f 2
Nativ
e Sy
stem
Ene
rgy
Texa
sRe
side
ntial
Commercial amp
Ind
ustrial Sm
all
Commercial amp
Ind
ustrial La
rge
Street L
ighting
OPA To
tal Te
xas
New
Mex
ico
Reside
ntial
Commercial amp
Ind
ustrial Sm
all
Commercial amp
Ind
ustrial La
rge
Street L
ighting
OPA To
tal Ne
w Mex
ico
Compa
ny U
seRG
EC
Total Na
tive
System
2031
2032
2033
2034
2035
2036
2037
2038
2039
2040
333
498
3342
514
8352
517
0363
602
6375
962
4389
587
8404
605
4421
733
9441
440
3464
854
4204
512
9205
422
5206
458
0207
569
3208
712
3209
803
4210
956
8212
148
1213
518
9215
185
799
194
899
209
599
206
099
186
899
153
899
108
999
053
598
989
198
916
798
837
546
133
46630
47109
47569
48017
48461
48888
49300
49698
50084
126
833
5127
422
3128
043
5128
627
9129
128
0129
588
9130
154
2130
722
8131
363
7132
253
7
768
652
9779
232
0790
935
5803
743
5817
758
3832
935
1849
658
7868
523
9890
209
4916
139
8
96992
298
850
0100
911
0103
341
5106
103
0109
184
3112
739
2116
969
2121
992
0128
248
958
968
059
896
060
908
361
944
462
902
063
948
065
148
866
433
367
751
268
996
470
144
69687
69229
68772
68315
67857
67400
66943
66485
66028
232
3236
0239
7243
5247
3251
1254
9258
6262
3265
940
330
540
627
540
956
641
342
841
744
542
112
442
453
442
783
543
117
443
550
0
203
537
5206
578
2209
938
6213
749
4217
828
3222
281
5227
336
2233
138
8239
771
3247
663
9
15110
15246
15383
15522
15662
15803
15945
16088
16233
16379
82147
83435
84723
86012
87300
88589
89877
91165
92454
93742
981
916
1995
678
410
108
847
10276
463
10458
828
10656
557
10875
771
11123
881
11408
494
11748
158 Attachment B-2 2021 Energy
Forecast by JurisdictionPage 2 of 2
Atta
chm
ent B
-3
2021
Dem
and
Fore
cast
by
Juri
sdic
tion
Page
1 o
f 2
Nativ
e Sy
stem
Dem
and
2021
2022
2023
2024
2025
2026
2027
2028
2029
2030
Texa
sRe
side
ntial
653
667
681
689
703
717
735
751
773
795
Commercial amp
Ind
ustrial Sm
all
479
484
486
485
488
489
491
492
496
499
Commercial amp
Ind
ustrial La
rge
236
237
238
238
240
241
241
241
242
243
Street L
ighting
1010
1010
1111
1111
1111
OPA
285
290
293
295
298
301
303
304
307
309
Total Te
xas
166
2168
8170
8171
8174
0175
9178
2179
9183
0185
8
New
Mex
ico
Reside
ntial
201
205
207
208
211
214
217
220
224
229
Commercial amp
Ind
ustrial Sm
all
126
128
128
129
130
132
133
135
137
139
Commercial amp
Ind
ustrial La
rge
1818
1817
1717
1717
1717
Street L
ighting
00
00
11
11
11
OPA
9192
9393
9394
9494
9596
Total Ne
w Mex
ico
436
443
446
448
452
457
462
466
475
482
Compa
ny U
se3
33
33
44
44
4RG
EC19
2020
2021
2122
2223
23
Total Na
tive
System
212
1215
5217
7219
0221
6224
0226
9229
2233
1236
7 Attachment B-3 2021 Demand Forecast by Jurisdiction
Page 1 of 2
Atta
chm
ent B
-3
2021
Dem
and
Fore
cast
by
Juri
sdic
tion
Page
2 o
f 2
Nativ
e Sy
stem
Dem
and
Texa
sRe
side
ntial
Commercial amp
Ind
ustrial Sm
all
Commercial amp
Ind
ustrial La
rge
Street L
ighting
OPA To
tal Te
xas
New
Mex
ico
Reside
ntial
Commercial amp
Ind
ustrial Sm
all
Commercial amp
Ind
ustrial La
rge
Street L
ighting
OPA To
tal Ne
w Mex
ico
Compa
ny U
seRG
EC
Total Na
tive
System
2031
2032
2033
2034
2035
2036
2037
2038
2039
2040
819
841
871
901
936
973
102
0107
2113
4120
650
250
451
051
552
052
453
253
954
855
824
424
424
524
624
724
725
025
225
425
611
1112
1212
1212
1313
1331
231
331
631
932
232
432
833
233
734
3
188
8191
3195
4199
2203
6207
9214
2220
8228
6237
6
233
237
243
250
257
265
276
288
303
321
142
144
147
150
153
155
159
164
168
173
1717
1717
1716
1616
1717
11
11
11
11
11
9797
9910
010
110
210
410
510
710
9
489
496
506
517
528
540
556
574
595
620
44
44
44
44
44
2324
2425
2525
2627
2728
240
4243
6248
8253
8259
3264
8272
8281
3291
3302
8 Attachment B-3 2021 Demand Forecast by Jurisdiction
Page 2 of 2
Attachment B-4 Losses by Transmission and Distribution
Year Secondary Primary Transmission FERC Losses (MW)2021 130 4 4 0 1382022 133 4 4 0 1412023 135 4 4 0 1442024 137 4 4 0 1452025 139 4 4 0 1482026 141 4 4 0 1502027 144 4 5 0 1532028 146 4 5 0 1552029 149 4 5 0 1592030 152 5 5 0 1622031 155 5 5 0 1652032 157 5 5 0 1672033 160 5 5 0 1712034 163 5 5 0 1742035 166 5 5 0 1772036 169 5 5 0 1802037 173 5 5 0 1842038 176 5 6 0 1872039 179 5 6 0 1912040 182 5 6 0 194
Page 1 of 1
Attachment B-5 Typical Days Tables
Page 1 of 10
Attachment B-5 Typical Days Tables
Page 2 of 10
Attachment B-5 Typical Days Tables
Page 3 of 10
Attachment B-5 Typical Days Tables
Page 4 of 10
Attachment B-5 Typical Days Tables
Page 5 of 10
Attachment B-5 Typical Days Tables
Page 6 of 10
Attachment B-5 Typical Days Tables
Page 7 of 10
Attachment B-5 Typical Days Tables
Page 8 of 10
Attachment B-5 Typical Days Tables
Page 9 of 10
Attachment B-5 Typical Days Tables
Page 10 of 10
Page 1 of 7
Attachment C-1 Transmission Facilities TABLE 1 Existing EPE Transmission Lines 115 kV and Above
EL PASO ELECTRIC COMPANY
Existing 115 kV and Above Internal Lines
RATING LENGTH STATE
From To kV Circuit MVA
Normal MVA
Emerg Miles From To AMRAD EMPIRE 345 1 400 400 12510 TX NM CALIENTE AMRAD 345 1 785 785 567 TX NM CALIENTE PICANTE 345 1 788 788 73 TX TX EMPIRE EDDY 345 1 836 836 05 NM NM HIDALGO GREENLEE 345 1 765 765 600 NM AZ LUNA AFTON 345 1 921 987 573 NM NM LUNA DIABLO 345 1 939 939 849 NM NM LUNA HIDALGO 345 1 659 659 505 NM NM MACHO SPRINGS
LUNA 345 1 1031 1390 249 NM NM
MACHO SPRINGS
SPRINGERVILLE 345 1 728 728 2014 NM AZ
NEWMAN ARROYO 345 1 700 700 303 TX NM NEWMAN AFTON 345 1 924 1028 299 TX NM PICANTE NEWMAN 345 1 786 786 162 TX TX WESTMESA ARROYO 345 1 680 680 2018 NM NM MIMBRES TAP AIRPORT 115 1 123 163 27 NM NM
AMRAD HOLLOMAN 115 1 121 121 225 NM NM ANTHONY ARROYO 115 1 114 114 244 NM NM ANTHONY BORDER STEEL 115 1 165 220 52 NM TX ANTHONY SALOPEK 115 1 165 220 173 NM NM ANTHONY NEWMAN 115 1 165 212 123 NM TX ANTHONY NUWAY 115 1 165 220 66 NM TX ASCARATE TROWBRIDGE 115 1 181 181 05 TX TX ASCARATE COPPER 115 1 185 246 14 TX TX ASCARATE JUAREZ 115 1 185 247 24 TX AUSTIN MARLOW 115 1 227 227 12 TX TX BIGGS BLISS
INDUSTRIAL 115 1 185 246 22 TX TX
BLISS INDUSTRIAL
LIBERTY 115 1 185 246 22 TX TX
BUTTERFIELD FT BLISS 115 1 135 180 19 TX TX CALIENTE DIAMOND HEAD 115 1 185 247 61 TX TX CALIENTE MPS 115 1 69 87 85 TX TX CALIENTE MPS 115 2 268 332 31 TX TX CALIENTE MPS 115 3 268 332 31 TX TX CALIENTE VISTA 115 1 166 221 66 TX TX CHAPARRAL ORO GRANDE 115 1 135 165 354 NM NM COPPER PENDALE 115 1 185 246 51 TX TX
Page 2 of 7
EL PASO ELECTRIC COMPANY Existing 115 kV and Above
Internal Lines
RATING LENGTH STATE
From To kV Circuit MVA
Normal MVA
Emerg Miles From To COYOTE RGC_DELL CITY 115 1 23 23 108 TX TX COYOTE MONTWOOD 115 1 185 246 79 TX NM CROMO RIO GRANDE 115 1 135 180 09 TX TX DIABLO RIO GRANDE 115 1 332 441 29 NM TX DIABLO RIO GRANDE 115 2 332 441 29 NM NM DIABLO JUAREZ 115 1 185 247 23 NM DIAMOND HEAD
LANE 115 1 185 247 28 TX TX
DURAZNO ASCARATE 115 1 185 246 33 TX NM DYER SHEARMAN 115 1 135 180 96 TX TX DYER AUSTIN 115 1 185 246 21 TX TX EXECUTIVE RIO GRANDE 115 1 271 359 29 TX TX FT BLISS AUSTIN 115 1 135 180 18 TX TX GLOBAL REACH
VISTA 115 1 329 329 30 TX TX
HATCH JORNADA 115 1 45 45 334 NM NM JORNADA ARROYO 115 1 79 79 49 NM NM LANE WRANGLER 115 1 165 220 10 TX TX LAS CRUCES ARROYO 115 1 165 220 41 NM NM LAS CRUCES SALOPEK 115 1 165 220 50 NM NM LEO EAST DYER 115 1 185 246 38 TX TX LEO EAST MILAGRO 115 1 185 246 44 TX TX LIBERTY GLOBAL REACH 115 1 185 246 26 TX TX MAR LARGO 115 1 29 29 114 NM NM MARLOW TROWBRIDGE 115 1 181 181 11 TX TX MESA AUSTIN 115 1 165 220 61 TX TX MESA RIO GRANDE 115 1 268 268 23 TX NM MILAGRO NEWMAN 115 1 185 246 63 TX TX MONTWOOD CALIENTE 115 1 185 246 50 TX TX MPS COYOTE 115 1 249 387 31 TX TX MPS MONTWOOD 115 1 249 387 70 TX TX NEWMAN CHAPARRAL 115 1 135 180 29 TX NM NEWMAN BUTTERFIELD 115 1 135 280 167 TX TX NEWMAN SHEARMAN 115 1 135 280 73 TX TX NEWMAN PIPELINE 115 1 185 246 98 TX TX NEWMAN PICANTE 115 1 185 246 136 TX TX NUWAY MONTOYA 115 1 165 220 36 TX TX ORO GRANDE AMRAD 115 1 135 165 123 NM NM ORO GRANDE WHITE SANDS 115 1 75 75 228 NM NM PATRIOT NEWMAN 115 1 135 180 15 TX TX PATRIOT CROMO 115 1 135 180 184 TX TX PELICANO HORIZON 115 1 185 246 67 TX TX
Page 3 of 7
EL PASO ELECTRIC COMPANY Existing 115 kV and Above
Internal Lines
RATING LENGTH STATE
From To kV Circuit MVA
Normal MVA
Emerg Miles From To PELICANO MONTWOOD 115 1 185 246 38 TX TX PENDALE LANE 115 1 185 246 15 TX TX PICANTE GLOBAL REACH 115 1 185 246 60 TX TX PICANTE BIGGS 115 1 185 246 23 TX TX PIPELINE BIGGS 115 1 135 180 136 TX TX RIO GRANDE RIPLEY 115 1 165 220 30 NM TX RIPLEY THORN 115 1 135 180 19 TX TX SALOPEK ARROYO 115 1 135 180 107 NM NM SANTA TERESA MONTOYA 115 1 185 246 74 NM TX SANTA TERESA DIABLO 115 1 169 225 89 NM NM SCOTSDALE VISTA 115 1 135 180 52 TX TX SOL LANE 115 1 135 180 21 TX TX SOL VISTA 115 1 185 246 20 TX TX SPARKS HORIZON 115 1 185 246 38 TX TX SUNSET NORTH DURAZNO 115 1 185 246 46 TX TX SUNSET NORTH EXECUTIVE 115 1 271 359 23 TX TX THORN MONTOYA 115 1 135 180 30 TX TX WRANGLER SPARKS 115 1 185 246 40 TX TX
- Internal refers to lines within EPEs Balancing Area including lines connecting EPE to neighboring utilities however not including line segments partially owned by EPE external to EPEs control area
- Some transmission lines were identified to be capacity limited by smaller jumpers connected at the substations The line ratings reflected in the above table are based on-line jumper upgrade assumptions
- The ratings are generally based on conductor thermal capacities but may be derated due to sag limitations or other factors
- RGC_DC is Rio Grande Electric Cooperative Dell City - Emerg is short for Emergency
Page 4 of 7
TABLE 2 Existing 115 kV EPE Substation Transformers
EL PASO ELECTRIC COMPANY
Existing 115 kV Load amp Step-up Substation Transformers
RATING Normal Emergency State
MVA MVA AIRPORT 115239 336 376 NM AMRAD 115249 85 95 NM
ANTHONY T1 115239 336 376 NM ANTHONY T2 115239 560 627 NM ARROYO T2 115239 336 376 NM ARROYO T4 115239 336 376 NM
ASCARATE T4 11569 112 1288 TX ASCARATE T5 11569 112 1288 TX
AUSTIN T1 115138 500 560 TX AUSTIN T2 115138 560 627 TX
BORDER STEEL 115 T1 115138 392 439 TX
BORDER STEEL 115 T2 115138 392 439 TX BUTTERFIELD T1 115138 300 336 TX BUTTERFIELD T2 115138 300 336 TX
CALIENTE T3 115138 336 376 TX CENTRAL TEMP T1 115138 336 376 TX
CHAPARRAL T1 115138 336 376 NM CHAPARRAL T2 115138 336 376 NM
COPPER T1 115138 300 336 TX COPPER GEN T2 138115 840 941 TX
COX T2 11569 560
644 NM COYOTE T1 115138 300 336 TX CROMO T1 115138 300 336 TX CROMO T2 115138 336 376 TX
DIAMOND HEAD T1 115138 336 376 TX DURAZNO T1 115138 336 376 TX
DYER T3 11569 112 1288 TX EMRLD T1 115138 125 140 NM
EXECUTIVE T1 115138 560 627 TX EXECUTIVE T2 115138 560 627 TX
FT BLISS T1 115138 560 627 TX FT BLISS T2 115132 280 314 TX
GLOBAL REACH T1 115138 336 376 TX GLOBAL REACH T2 115138 560 627 TX
Page 5 of 7
EL PASO ELECTRIC COMPANY
Existing 115 kV Load amp Step-up Substation Transformers
RATING Normal Emergency State
MVA MVA HATCH T1 115249 300 336 NM
HORIZON T1 115138 336 376 TX JORNADA T1 115239 336 376 NM JORNADA T2 115239 560 627 NM
LANE T1 11569 100 115 TX LANE T2 115138 300 336 TX
LAS CRUCES T1 115239 672 753 NM LAS CRUCES T2 115239 672 753 NM
LEO EAST T1 115138 336 376 TX LEO EAST T2 115138 336 376 TX
MAR T1 11542 112 125 NM MESA T1 115138 300 336 TX MESA T2 115138 336 376 TX
MILAGRO T1 115138 336 376 TX MILAGRO T2 115138 336 376 TX MILAGRO T3 115138 336 376 TX MONTOYA T1 115249 336 376 TX MONTOYA T2 115239 560 627 TX MONTOYA T3 115239 560 627 TX
MONTWOOD T1 115239 560 627 TX MONTWOOD T3 115239 560 627 TX
MPS T1 138115 1400 1568 TX MPS T2 138115 1400 1568 TX MPS T3 138115 1400 1568 TX MPS T4 138115 1400 1568 TX
NEWMAN G1(T2) 138115 1254 1405 TX NEWMAN G2 (T6) 138115 1254 1405 TX NEWMAN G3 (T8) 138115 1254 1405 TX
NEWMAN 4G1 (T11) 138115 1250 1400 TX NEWMAN 4G2 (T9) 138115 1250 1400 TX NEWMAN 4S1 (T13) 138115 1250 1400 TX NEWMAN 5G1 (T15) 138115 1300 1456 TX NEWMAN 5G2 (T16) 138115 1300 1456 TX NEWMAN 5S1 (T14) 138115 1750 196 TX
NUWAY T1 115239 560 627 TX NUWAY T2 115239 560 627 TX
Page 6 of 7
EL PASO ELECTRIC COMPANY
Existing 115 kV Load amp Step-up Substation Transformers
RATING Normal Emergency State
MVA MVA PATRIOT T1 115138 336 376 TX
PELICANO T1 115239 560 627 TX PELICANO T2 115239 560 627 TX PENDALE T1 115138 336 376 TX PENDALE T2 115138 560 627 TX PICACHO T1 115249 560 627 NM REDEYE T1 115138 140 157 NM
RIO GRANDE T1 11569 112 1288 NM RIO GRANDE T2 11569 112 1288 NM
RIO GRANDE G8 (T7) 175115 1680 1882 NM RIO GRANDE G9 (T17) 138115 1320 1478 NM
RIPLEY T1 115138 336 376 TX RIPLEY T2 115138 560 627 TX
SALOPEK T1 115249 280 314 NM SALOPEK T2 115249 280 314 NM SALOPEK T3 115249 280 314 NM
SANTA TERESA T1 115239 336 376 NM SANTA TERESA T2 115239 336 376 NM
SCOTSDALE T1 11569 112 1288 TX SCOTSDALE T4 115138 560 627 TX SCOTSDALE T5 115138 560 627 TX SHEARMAN T1 115138 300 336 TX
SOL T1 115138 336 376 TX SOL T2 115138 300 336 TX
SPARKS T1 115138 336 376 TX SPARKS T2 115138 560 627 TX SPARKS T3
11569 100 115 TX
SUNSET NORTH T1 115138 336 376 TX SUNSET NORTH T2 115138 336 376 TX SUNSET NORTH T3 11569 112 1288 TX
TALAVERA TEMP T1 115239 165 185 NM THORN T1 115138 336 376 TX THORN T2 115138 336 376 TX
TRIUMPH TEMP T1 115239 336 376 TX VISTA T1 115138 300 336 TX VISTA T2 115138 300 336 TX
Page 7 of 7
EL PASO ELECTRIC COMPANY
Existing 115 kV Load amp Step-up Substation Transformers
RATING Normal Emergency State
MVA MVA WHITE SANDS T1 115138 300 336 NM
WRANGLER T1 115138 500 560 TX
Attachment C-2 Existing Units Operating CharacteristicsCapacity Factor ()Resources 2021 2024 2025 2027 2031 2035 2040 2045Newman 1 2 0 0 0 0 0 0 0Newman 2 1 0 0 0 0 0 0 0Newman 3 10 3 0 1 0 0 0 0Newman 4 14 5 2 3 1 0 0 0Newman 5 64 54 38 41 44 40 41 47Newman 6 0 12 7 8 6 3 4 6Copper 2 0 0 0 0 0 0 0Montana 1 26 29 20 21 20 11 19 23Montana 2 26 28 19 21 21 14 23 24Montana 3 17 17 13 14 12 5 11 16Montana 4 50 42 30 32 28 23 28 28Rio Grande 7 0 0 0 0 0 0 0 0Rio Grande 8 3 1 0 0 0 0 0 0Rio Grande 9 13 5 2 3 3 0 0 2Gas Peaker 0 0 0 0 0 3 3 5Palo Verde 1 94 94 94 94 94 94 94 94Palo Verde 2 94 94 94 94 94 94 94 94Palo Verde 3 94 94 94 94 94 94 94 94
Fuel Cost ($000)Resources 2021 2024 2025 2027 2031 2035 2040 2045Newman 1 431$ -$ -$ -$ -$ -$ -$ -$ Newman 2 273$ -$ -$ -$ -$ -$ -$ -$ Newman 3 2299$ 667$ 55$ 248$ 46$ -$ -$ -$ Newman 4 7893$ 2755$ 1080$ 1435$ 716$ -$ -$ -$ Newman 5 31126$ 24367$ 17006$ 19659$ 22951$ 21785$ 24625$ 28990$ Newman 6 -$ 5465$ 3596$ 4364$ 3762$ 1579$ 2380$ 4155$ Copper 1076$ 70$ -$ -$ -$ -$ -$ -$ Montana 1 4595$ 4852$ 3414$ 3784$ 4030$ 2455$ 4318$ 5534$ Montana 2 5153$ 5102$ 3468$ 4056$ 4447$ 3079$ 5285$ 5678$ Montana 3 3332$ 3087$ 2371$ 2768$ 2638$ 1279$ 2780$ 4139$ Montana 4 9507$ 7298$ 5383$ 5946$ 5665$ 4884$ 6297$ 6488$ Rio Grande 7 93$ -$ -$ -$ -$ -$ -$ -$ Rio Grande 8 1340$ 264$ 49$ 93$ -$ -$ -$ -$ Rio Grande 9 2675$ 987$ 413$ 603$ 706$ 42$ 22$ 429$ Gas Peaker -$ -$ -$ -$ -$ 1081$ 2239$ 5645$ Palo Verde 1 12111$ 12185$ 12222$ 12259$ 12370$ 12500$ 12667$ 12834$ Palo Verde 2 12169$ 12244$ 12281$ 12318$ 12430$ 12561$ 12728$ 12896$ Palo Verde 3 12111$ 12185$ 12222$ 12259$ 12370$ 12500$ 12667$ 12834$
Heat Rate (MMBtuMWh)Newman 1 1228Newman 2 1151Newman 3 1097Newman 4 1012Newman 5 7741Newman 6 10101Copper 19916Montana 1 9373Montana 2 9334Montana 3 9933Montana 4 9339Rio Grande 7 1179Rio Grande 8 11902Rio Grande 9 9881Gas Peaker 10101Palo Verde 1 10Palo Verde 2 10Palo Verde 3 10
Page 1 of 2
Attachment C-2 Existing Units Operating CharacteristicsFixed OampM ($000)Resources 2021 2024 2025 2027 2031 2035 2040 2045Newman 1 1704$ 5737$ 5737$ 5737$ -$ -$ -$ -$ Newman 2 1789$ -$ -$ -$ -$ -$ -$ -$ Newman 3 2221$ 2221$ 2221$ 5231$ 5231$ -$ -$ -$ Newman 4 5014$ 5014$ 5014$ 10769$ 10769$ -$ -$ -$ Newman 5 5563$ 5563$ 5563$ 5563$ 5563$ 5563$ 5563$ 5563$ Newman 6 -$ 2752$ 2752$ 2752$ 2752$ 2752$ 2752$ 2752$ Copper 1167$ 1167$ 1167$ 1167$ -$ -$ -$ -$ Montana 1 1613$ 1613$ 1613$ 1613$ 1613$ 1613$ 1613$ 1613$ Montana 2 1623$ 1623$ 1623$ 1623$ 1623$ 1623$ 1623$ 1623$ Montana 3 1484$ 1484$ 1484$ 1484$ 1484$ 1484$ 1484$ 1484$ Montana 4 1076$ 1076$ 1076$ 1076$ 1076$ 1076$ 1076$ 1076$ Rio Grande 7 1612$ -$ -$ -$ -$ -$ -$ -$ Rio Grande 8 4346$ 4346$ 4346$ 4346$ 4346$ -$ -$ -$ Rio Grande 9 2495$ 2495$ 2495$ 2495$ 2495$ 2495$ 2495$ 2495$ Gas Peaker -$ -$ -$ -$ -$ 1697$ 3312$ 4621$ Palo Verde 1 28313$ 28313$ 28313$ 28313$ 28313$ 28313$ 28313$ 28313$ Palo Verde 2 28313$ 28313$ 28313$ 28313$ 28313$ 28313$ 28313$ 28313$ Palo Verde 3 28313$ 28313$ 28313$ 28313$ 28313$ 28313$ 28313$ 28313$
Variable OampM ($000)Resources 2021 2024 2025 2027 2031 2035 2040 2045Newman 1 466$ -$ -$ -$ -$ -$ -$ -$ Newman 2 415$ -$ -$ -$ -$ -$ -$ -$ Newman 3 2388$ 695$ 57$ 257$ 48$ -$ -$ -$ Newman 4 8305$ 2887$ 1130$ 1497$ 744$ -$ -$ -$ Newman 5 33855$ 26821$ 18189$ 21158$ 24347$ 22746$ 25862$ 30331$ Newman 6 -$ 5964$ 3916$ 4688$ 3914$ 1639$ 2464$ 4299$ Copper 1581$ 282$ -$ -$ -$ -$ -$ -$ Montana 1 5119$ 5348$ 3764$ 4110$ 4219$ 2540$ 4463$ 5714$ Montana 2 5832$ 5707$ 3805$ 4427$ 4663$ 3195$ 5491$ 5881$ Montana 3 3700$ 3494$ 2602$ 3032$ 2777$ 1335$ 2895$ 4307$ Montana 4 10379$ 8028$ 6003$ 6579$ 6106$ 5134$ 6673$ 6808$ Rio Grande 7 161$ -$ -$ -$ -$ -$ -$ -$ Rio Grande 8 1700$ 269$ 50$ 94$ -$ -$ -$ -$ Rio Grande 9 3001$ 1138$ 487$ 689$ 741$ 44$ 23$ 447$ Gas Peaker -$ -$ -$ -$ -$ 1122$ 2319$ 5841$ Palo Verde 1 15537$ 15612$ 15649$ 15686$ 15797$ 15927$ 16094$ 16261$ Palo Verde 2 15613$ 15687$ 15724$ 15762$ 15873$ 16004$ 16172$ 16339$ Palo Verde 3 15537$ 15612$ 15649$ 15686$ 15797$ 15927$ 16094$ 16261$
Market Price
Year
Average Annual Price ($MWh)
2021 2024$ 2022 2043$ 2023 2050$ 2024 2008$ 2025 2020$ 2026 2007$ 2027 1981$ 2028 1998$ 2029 1919$ 2030 1863$ 2031 1927$ 2032 2020$ 2033 2009$ 2034 2021$ 2035 2016$ 2036 2031$ 2037 1998$ 2038 1927$ 2039 1895$ 2040 1836$ 2041 1843$ 2042 1832$ 2043 1825$ 2044 1895$ 2045 2025$
Page 2 of 2
Attachment D-1 E3 EPE Report Model Results June Page 1 of 34
Scenario Resource Type 2021 2024 2025 2027 2031 2035 2040 2045Least-Cost (Reference Case) Nuclear (Palo Verde) 5148 5148 5148 5148 5148 5148 5148 5148
Nuclear (SMR) - - - - - - - - Gas - Steam Turbine 140 34 7 3 - - - - Gas - Combined Cycle 1767 1373 1022 1111 1130 1065 1318 1502 Gas - Combustion Turbine 1027 1169 836 880 773 754 1250 1640 Biomass - - - - - - - - Geothermal - - - - - - - - Wind - - 379 382 375 336 409 720 Solar 289 952 1467 1551 2200 3058 3443 4239 Battery Storage - 12 (26) (48) (129) (217) (220) (250) Imports 391 336 260 259 282 273 358 440 Demand Response - - - - - - - - Hydrogen - - - - - - - - BTM Solar 37 135 165 225 344 460 601 763 Load 8771 9155 9258 9512 10123 10878 12308 14203 Excess Generation 14 130 430 342 496 657 373 475
Least-Cost Case + ETA Resources Nuclear (Palo Verde) 5148 5148 5148 5148 5148 5148 5148 5148 Nuclear (SMR) - - - - - - - - Gas - Steam Turbine 140 34 3 3 - - - - Gas - Combined Cycle 1767 1373 898 963 998 899 1053 1145 Gas - Combustion Turbine 1027 1169 720 761 686 461 790 1043 Biomass - - - - - - - - Geothermal - - - - - - - - Wind - - 670 688 675 555 653 815 Solar 289 953 1464 1530 2211 3351 4068 5345 Battery Storage - 12 (31) (45) (122) (241) (281) (370) Imports 391 336 220 239 184 245 275 314 Demand Response - - - - - - - - Hydrogen - - - - - - - - BTM Solar 37 135 165 225 344 460 601 763 Load 8771 9155 9258 9512 10123 10878 12308 14203 Excess Generation 14 130 564 480 558 1272 1040 940
Separate System Planning Nuclear (Palo Verde) 5148 5148 5148 5148 5148 5148 5148 5148 Nuclear (SMR) - - - - - - - - Gas - Steam Turbine 140 34 1 2 - - - - Gas - Combined Cycle 1766 1388 1031 1122 1141 969 1192 1385 Gas - Combustion Turbine 1040 1177 754 831 807 477 795 1105 Biomass - - - - - - - - Geothermal - - - - - - - - Wind - - 305 306 295 182 165 412 Solar 289 949 1648 1690 2236 3708 4532 5512 Battery Storage - 12 (54) (60) (138) (295) (350) (405) Imports 391 327 259 247 291 229 225 282 Demand Response - - - - - - - - Hydrogen - - - - - - - - BTM Solar 37 135 165 225 344 460 601 763 Load 8771 9155 9258 9512 10123 10878 12308 14203 Excess Generation 14 134 450 407 444 1288 2358 2353
Annual Energy (GWh)
Attachment D-1 E3 EPE Report Model Results June Page 2 of 34
Scenario Resource Type 2021 2024 2025 2027 2031 2035 2040 2045Annual Energy (GWh)
Separate System Planning (w H2) Nuclear (Palo Verde) 5148 5148 5148 5148 5148 5148 5148 5148 Nuclear (SMR) - - - - - - - - Gas - Steam Turbine 140 34 1 2 - - - - Gas - Combined Cycle 1766 1388 979 1049 1090 1035 1153 1384 Gas - Combustion Turbine 1040 1177 728 819 735 688 779 1129 Biomass - - - - - - - - Geothermal - - - - - - - - Wind - - 447 451 433 405 510 657 Solar 289 949 1594 1633 2242 3101 4087 5075 Battery Storage - 12 (56) (60) (136) (218) (297) (352) Imports 391 327 251 245 266 260 261 327 Demand Response - - - - - - - - Hydrogen - - - - - - 65 71 BTM Solar 37 135 165 225 344 460 601 763 Load 8771 9155 9258 9512 10123 10878 12308 14203 Excess Generation 14 133 444 402 574 772 872 919
Low Load Growth Nuclear (Palo Verde) 5148 5148 5148 5148 5148 5148 5148 5148 Nuclear (SMR) - - - - - - - - Gas - Steam Turbine 101 27 2 3 - - - - Gas - Combined Cycle 1596 1244 978 1065 1127 1025 1258 1472 Gas - Combustion Turbine 983 1065 799 875 806 644 1109 1492 Biomass - - - - - - - - Geothermal - - - - - - - - Wind - - 333 336 335 291 350 562 Solar 282 919 1293 1309 1805 2833 3220 3993 Battery Storage - 8 (29) (29) (96) (209) (215) (245) Imports 381 325 269 262 289 268 342 437 Demand Response - - - - - - - - Hydrogen - - - - - - - - BTM Solar 37 135 165 225 344 460 601 763 Load 8492 8862 8958 9194 9759 10459 11813 13623 Excess Generation 22 163 337 318 410 642 359 427
High Load Growth Nuclear (Palo Verde) 5148 5148 5148 5148 5148 5148 5148 5148 Nuclear (SMR) - - - - - - - - Gas - Steam Turbine 195 50 5 3 - - - - Gas - Combined Cycle 1909 1522 1067 1151 1118 1107 1388 1500 Gas - Combustion Turbine 1088 1256 865 914 776 867 1411 1747 Biomass - - - - - - - - Geothermal - - - - - - - - Wind - - 431 436 413 396 463 976 Solar 293 983 1651 1751 2569 3257 3642 4464 Battery Storage - 14 (47) (68) (159) (222) (222) (256) Imports 400 343 272 271 280 284 372 441 Demand Response - - - - - - - - Hydrogen - - - - - - - - BTM Solar 37 135 165 225 344 460 601 763 Load 9050 9447 9558 9830 10488 11297 12803 14783 Excess Generation 10 100 394 290 554 655 385 540
Attachment D-1 E3 EPE Report Model Results June Page 3 of 34
Scenario Resource Type 2021 2024 2025 2027 2031 2035 2040 2045Annual Energy (GWh)
High DG Nuclear (Palo Verde) 5148 5148 5148 5148 5148 5148 5148 5148 Nuclear (SMR) - - - - - - - - Gas - Steam Turbine 134 31 7 3 - - - - Gas - Combined Cycle 1728 1317 1001 1081 1111 1060 1266 1473 Gas - Combustion Turbine 1028 1123 814 825 742 696 1097 1614 Biomass - - - - - - - - Geothermal - - - - - - - - Wind - - 367 372 368 326 391 916 Solar 285 866 1263 1278 1665 2340 2627 2711 Battery Storage - 11 (25) (45) (126) (227) (245) (244) Imports 389 314 247 241 269 260 345 440 Demand Response - - - - - - - - Hydrogen - - - - - - - - BTM Solar 88 350 436 608 945 1276 1680 2144 Load 8771 9155 9258 9512 10123 10878 12308 14203 Excess Generation 18 217 513 492 614 714 600 432
High DSM Nuclear (Palo Verde) 5148 5148 5148 5148 5148 5148 5148 5148 Nuclear (SMR) - - - - - - - - Gas - Steam Turbine 133 30 2 3 0 - - - Gas - Combined Cycle 1744 1303 1041 1126 1198 1029 1234 1463 Gas - Combustion Turbine 1020 1111 869 907 900 610 1026 1407 Biomass - - - - - - - - Geothermal - - - - - - - - Wind - - 244 244 251 207 249 470 Solar 288 934 1332 1337 1621 2752 3114 3719 Battery Storage - 10 (28) (29) (86) (205) (213) (233) Imports 390 329 283 268 304 271 342 439 Demand Response - - - - - - - - Hydrogen - - - - - - - - BTM Solar 37 135 165 225 344 460 601 763 Load 8731 8994 9056 9230 9680 10273 11501 13177 Excess Generation 15 148 318 313 263 643 371 372
No New Gas Nuclear (Palo Verde) 5148 5148 5148 5148 5148 5148 5148 5148 Nuclear (SMR) - - - - - - - - Gas - Steam Turbine 140 34 6 3 - - - - Gas - Combined Cycle 1767 1373 984 1072 1095 716 702 637 Gas - Combustion Turbine 1027 1169 811 849 745 180 216 207 Biomass - - - - - - - - Geothermal - - - - - - - - Wind - - 455 462 452 210 208 210 Solar 289 952 1467 1545 2197 4287 5691 7680 Battery Storage - 12 (27) (47) (127) (348) (472) (649) Imports 391 336 251 255 270 225 213 206 Demand Response - - - - - - - - Hydrogen - - - - - - - - BTM Solar 37 135 165 225 344 460 601 763 Load 8771 9155 9258 9512 10123 10878 12308 14203 Excess Generation 14 130 458 372 536 2237 2586 3219
Attachment D-1 E3 EPE Report Model Results June Page 4 of 34
Scenario Resource Type 2021 2024 2025 2027 2031 2035 2040 2045Annual Energy (GWh)
No Lifetime Extensions Nuclear (Palo Verde) 5148 5148 5148 5148 5148 5148 5148 5148 Nuclear (SMR) - - - - - - - - Gas - Steam Turbine 140 34 2 0 - - - - Gas - Combined Cycle 1767 1373 948 1015 1050 1056 1308 1502 Gas - Combustion Turbine 1027 1169 707 680 634 745 1242 1640 Biomass - - - - - - - - Geothermal - - - - - - - - Wind - - 397 400 370 364 442 722 Solar 289 953 1693 1897 2475 3050 3432 4237 Battery Storage - 12 (38) (94) (164) (216) (219) (250) Imports 391 336 235 241 267 271 354 440 Demand Response - - - - - - - - Hydrogen - - - - - - - - BTM Solar 37 135 165 225 344 460 601 763 Load 8771 9155 9258 9512 10123 10878 12308 14203 Excess Generation 14 129 634 428 592 661 374 475
High Gas Price Nuclear (Palo Verde) 5148 5148 5148 5148 5148 5148 5148 5148 Nuclear (SMR) - - - - - - - - Gas - Steam Turbine 125 31 3 3 - - - - Gas - Combined Cycle 1787 1400 983 1060 1062 999 1234 1347 Gas - Combustion Turbine 1008 1120 764 786 698 607 1121 1361 Biomass - - - - - - - - Geothermal - - - - - - - - Wind - - 486 493 483 422 516 926 Solar 290 956 1465 1542 2190 3165 3570 4490 Battery Storage - 9 (31) (46) (126) (226) (232) (274) Imports 403 360 274 301 325 303 350 440 Demand Response - - - - - - - - Hydrogen - - - - - - - - BTM Solar 37 135 165 225 344 460 601 763 Load 8771 9155 9258 9512 10123 10878 12308 14203 Excess Generation 13 127 470 386 546 811 486 705
Low Carbon Price Nuclear (Palo Verde) 5148 5148 5148 5148 5148 5148 5148 5148 Nuclear (SMR) - - - - - - - - Gas - Steam Turbine 127 23 3 3 - - - - Gas - Combined Cycle 1803 1433 955 1021 1036 971 1189 1333 Gas - Combustion Turbine 1001 1107 711 750 678 571 1063 1333 Biomass - - - - - - - - Geothermal - - - - - - - - Wind - - 609 624 604 523 642 936 Solar 289 958 1476 1548 2179 3178 3576 4573 Battery Storage - 11 (32) (45) (124) (229) (234) (279) Imports 394 345 223 238 258 256 322 395 Demand Response - - - - - - - - Hydrogen - - - - - - - - BTM Solar 37 135 165 225 344 460 601 763 Load 8771 9155 9258 9512 10123 10878 12308 14203 Excess Generation 14 125 512 426 579 876 532 725
Attachment D-1 E3 EPE Report Model Results June Page 5 of 34
Scenario Resource Type 2021 2024 2025 2027 2031 2035 2040 2045Annual Energy (GWh)
Medium Carbon Price Nuclear (Palo Verde) 5148 5148 5148 5148 5148 5148 5148 5148 Nuclear (SMR) - - - - - - - - Gas - Steam Turbine 120 22 3 3 - - - - Gas - Combined Cycle 1822 1496 876 941 974 922 1115 1270 Gas - Combustion Turbine 983 1036 548 590 606 475 950 1199 Biomass - - - - - - - - Geothermal - - - - - - - - Wind - - 754 779 766 646 805 1098 Solar 290 961 1600 1663 2221 3268 3695 4746 Battery Storage - 7 (37) (47) (122) (230) (242) (293) Imports 399 354 200 210 187 190 235 271 Demand Response - - - - - - - - Hydrogen - - - - - - - - BTM Solar 37 135 165 225 344 460 601 763 Load 8771 9155 9258 9512 10123 10878 12308 14203 Excess Generation 13 121 763 676 588 911 560 726
High Carbon Price Nuclear (Palo Verde) 5148 5148 5148 5148 5148 5148 5148 5148 Nuclear (SMR) - - - - - - - - Gas - Steam Turbine 119 21 2 3 0 - - - Gas - Combined Cycle 1835 1540 658 724 862 872 979 832 Gas - Combustion Turbine 962 989 428 458 488 393 630 544 Biomass - - - - - - - - Geothermal - - - - - - - - Wind - - 869 904 927 776 940 832 Solar 290 963 1847 1900 2307 3272 4088 6364 Battery Storage - 2 (40) (46) (115) (230) (271) (474) Imports 408 362 181 195 162 187 193 192 Demand Response - - - - - - - - Hydrogen - - - - - - - - BTM Solar 37 135 165 225 344 460 601 763 Load 8771 9155 9258 9512 10123 10878 12308 14203 Excess Generation 13 120 1270 1182 882 1065 1041 1596
80 Clean by 2035 Nuclear (Palo Verde) 5148 5148 5148 5148 5148 5148 5148 5148 Nuclear (SMR) - - - - - - - - Gas - Steam Turbine 140 34 7 3 - - - - Gas - Combined Cycle 1767 1373 1022 1111 1127 1050 1159 1295 Gas - Combustion Turbine 1027 1169 836 880 766 696 1057 1256 Biomass - - - - - - - - Geothermal - - - - - - - - Wind - - 379 382 375 331 683 1029 Solar 289 952 1466 1551 2212 3155 3653 4715 Battery Storage - 12 (26) (48) (129) (224) (234) (290) Imports 391 336 261 260 278 264 240 286 Demand Response - - - - - - - - Hydrogen - - - - - - - - BTM Solar 37 135 165 225 344 460 601 763 Load 8771 9155 9258 9512 10123 10878 12308 14203 Excess Generation 14 130 431 343 514 770 469 738
Attachment D-1 E3 EPE Report Model Results June Page 6 of 34
Scenario Resource Type 2021 2024 2025 2027 2031 2035 2040 2045Annual Energy (GWh)
20 CO2 Red by 2040 Nuclear (Palo Verde) 5148 5148 5148 5148 5148 5148 5148 5148 Nuclear (SMR) - - - - - - - - Gas - Steam Turbine 140 34 7 3 - - - - Gas - Combined Cycle 1767 1373 1022 1111 1130 1065 1318 1342 Gas - Combustion Turbine 1027 1169 836 880 773 751 1249 1353 Biomass - - - - - - - - Geothermal - - - - - - - - Wind - - 379 382 375 336 409 927 Solar 289 952 1466 1549 2204 3061 3445 4548 Battery Storage - 12 (26) (48) (129) (217) (220) (277) Imports 391 336 261 262 277 274 357 397 Demand Response - - - - - - - - Hydrogen - - - - - - - - BTM Solar 37 135 165 225 344 460 601 763 Load 8771 9155 9258 9512 10123 10878 12308 14203 Excess Generation 14 130 431 345 491 655 371 705
40 CO2 Red by 2040 Nuclear (Palo Verde) 5148 5148 5148 5148 5148 5148 5148 5148 Nuclear (SMR) - - - - - - - - Gas - Steam Turbine 140 34 7 3 - - - - Gas - Combined Cycle 1767 1373 1022 1111 1127 1051 1133 1135 Gas - Combustion Turbine 1027 1169 836 880 766 696 980 985 Biomass - - - - - - - - Geothermal - - - - - - - - Wind - - 379 382 375 331 763 1034 Solar 289 953 1466 1549 2211 3151 3692 5268 Battery Storage - 12 (26) (48) (128) (224) (241) (350) Imports 391 336 261 262 279 265 232 219 Demand Response - - - - - - - - Hydrogen - - - - - - - - BTM Solar 37 135 165 225 344 460 601 763 Load 8771 9155 9258 9512 10123 10878 12308 14203 Excess Generation 14 129 432 345 515 768 533 965
60 CO2 Red by 2040 Nuclear (Palo Verde) 5148 5148 5148 5148 5148 5148 5148 5148 Nuclear (SMR) - - - - - - - - Gas - Steam Turbine 140 34 7 3 - - - - Gas - Combined Cycle 1767 1373 1022 1111 1127 1052 864 852 Gas - Combustion Turbine 1027 1169 836 880 766 698 561 560 Biomass - - - - - - - - Geothermal - - - - - - - - Wind - - 379 382 375 331 927 838 Solar 289 953 1466 1552 2213 3150 4319 6337 Battery Storage - 12 (26) (48) (128) (224) (276) (470) Imports 391 336 261 259 278 263 164 174 Demand Response - - - - - - - - Hydrogen - - - - - - - - BTM Solar 37 135 165 225 344 460 601 763 Load 8771 9155 9258 9512 10123 10878 12308 14203 Excess Generation 14 130 432 342 513 769 1338 1586
Attachment D-1 E3 EPE Report Model Results June Page 7 of 34
Scenario Resource Type 2021 2024 2025 2027 2031 2035 2040 2045Annual Energy (GWh)
80 CO2 Red by 2040 Nuclear (Palo Verde) 5148 5148 5148 5148 5148 5148 5148 5148 Nuclear (SMR) - - - - - - - - Gas - Steam Turbine 140 34 3 3 - - - - Gas - Combined Cycle 1767 1373 910 976 1017 907 577 550 Gas - Combustion Turbine 1027 1169 734 777 696 468 168 183 Biomass - - - - - - - - Geothermal - - - - - - - - Wind - - 638 654 638 532 1260 1231 Solar 289 952 1463 1531 2158 3371 4812 6758 Battery Storage - 12 (30) (45) (123) (239) (338) (517) Imports 391 336 227 241 245 232 80 88 Demand Response - - - - - - - - Hydrogen - - - - - - - - BTM Solar 37 135 165 225 344 460 601 763 Load 8771 9155 9258 9512 10123 10878 12308 14203 Excess Generation 14 130 546 461 605 1183 2430 2751
90 CO2 Red by 2040 Nuclear (Palo Verde) 5148 5148 5148 5148 5148 5148 5148 5148 Nuclear (SMR) - - - - - - - - Gas - Steam Turbine 140 34 3 3 - - - - Gas - Combined Cycle 1767 1373 910 978 1018 808 340 313 Gas - Combustion Turbine 1027 1169 736 776 696 320 41 58 Biomass - - - - - - - - Geothermal - - - - - - - - Wind - - 637 655 639 463 1965 1995 Solar 289 952 1462 1527 2156 3764 4483 6350 Battery Storage - 12 (30) (45) (123) (278) (311) (472) Imports 391 336 226 244 245 193 40 47 Demand Response - - - - - - - - Hydrogen - - - - - - - - BTM Solar 37 135 165 225 344 460 601 763 Load 8771 9155 9258 9512 10123 10878 12308 14203 Excess Generation 14 130 547 465 603 1440 3210 3645
100 CO2 Red by 2040 Nuclear (Palo Verde) 5148 5148 5148 5148 5148 5148 5148 5148 Nuclear (SMR) - - - - - - - - Gas - Steam Turbine 140 34 6 3 - - - - Gas - Combined Cycle 1767 1373 984 1072 1095 716 - - Gas - Combustion Turbine 1027 1169 811 849 745 180 - - Biomass - - - - - - - - Geothermal - - - - - - - - Wind - - 455 462 452 210 969 1406 Solar 289 952 1467 1545 2197 4287 6734 7595 Battery Storage - 12 (27) (47) (127) (348) (1163) (1402) Imports 391 336 251 255 270 225 - - Demand Response - - - - - - - - Hydrogen - - - - - - - - BTM Solar 37 135 165 225 344 460 620 1455 Load 8771 9155 9258 9512 10123 10878 12308 14203 Excess Generation 14 130 458 372 536 2237 10954 12232
Attachment D-1 E3 EPE Report Model Results June Page 8 of 34
Scenario Resource Type 2021 2024 2025 2027 2031 2035 2040 2045Annual Energy (GWh)
100 CO2 Red by 2040 (w H2) Nuclear (Palo Verde) 5148 5148 5148 5148 5148 5148 5148 5148 Nuclear (SMR) - - - - - - - - Gas - Steam Turbine 140 34 3 4 - - - - Gas - Combined Cycle 1767 1373 868 928 983 689 - - Gas - Combustion Turbine 1027 1169 692 732 627 210 - - Biomass - - - - - - - - Geothermal - - - - - - - - Wind - - 743 765 755 469 1700 1650 Solar 289 952 1460 1525 2217 4074 4752 6753 Battery Storage - 12 (31) (46) (122) (300) (336) (515) Imports 391 336 209 230 171 129 - - Demand Response - - - - - - - - Hydrogen - - - - - - 442 404 BTM Solar 37 135 165 225 344 460 601 763 Load 8771 9155 9258 9512 10123 10878 12308 14203 Excess Generation 14 130 616 528 575 1636 3102 3585
Attachment D-1 E3 EPE Report Model Results June Page 9 of 34
Scenario Resource TypeLeast-Cost (Reference Case) Nuclear (Palo Verde)
Nuclear (SMR)Gas - Steam TurbineGas - Combined CycleGas - Combustion TurbineBiomassGeothermalWindSolarBattery StorageImportsDemand ResponseHydrogenBTM SolarLoadExcess Generation
Least-Cost Case + ETA Resources Nuclear (Palo Verde)Nuclear (SMR)Gas - Steam TurbineGas - Combined CycleGas - Combustion TurbineBiomassGeothermalWindSolarBattery StorageImportsDemand ResponseHydrogenBTM SolarLoadExcess Generation
Separate System Planning Nuclear (Palo Verde)Nuclear (SMR)Gas - Steam TurbineGas - Combined CycleGas - Combustion TurbineBiomassGeothermalWindSolarBattery StorageImportsDemand ResponseHydrogenBTM SolarLoadExcess Generation
2021 2024 2025 2027 2031 2035 2040 2045622 622 622 622 622 622 622 622 - - - - - - - - 426 307 307 307 234 - - - 493 493 493 493 493 266 266 266 503 731 731 731 668 952 1111 1318 - - - - - - - - - - - - - - - - - - 109 109 109 109 109 196 115 385 629 629 904 1241 1298 1580 - 50 183 256 582 1032 1116 1284 - - - - - - - - 46 53 56 61 71 81 93 93
- - - - - - - - 18 65 80 108 166 221 289 368
- - - - - - - - - - - - - - - - 622 622 622 622 622 622 622 622 - - - - - - - - 426 307 307 307 234 - - - 493 493 493 493 493 266 266 266 503 731 731 731 668 879 999 1154 - - - - - - - - - - - - - - - - - - 204 204 204 204 204 264 115 385 629 629 887 1482 1684 2050 - 50 183 236 552 1084 1252 1698 - - - - - - - - 46 53 56 61 71 81 93 93
- - - - - - - - 18 65 80 108 166 221 289 368
- - - - - - - - - - - - - - - - 622 622 622 622 622 622 622 622 - - - - - - - - 426 307 307 307 234 - - - 493 493 493 493 493 266 266 266 503 731 731 731 668 835 835 989 - - - - - - - - - - - - - - - - - - 87 87 87 87 87 159 115 385 707 707 905 1667 2322 2639 - 50 271 293 634 1480 2207 2579 - - - - - - - - 46 53 56 61 71 81 93 93
- - - - - - - - 18 65 80 108 166 221 289 368
- - - - - - - - - - - - - - - -
Installed Capacity (MW)
Attachment D-1 E3 EPE Report Model Results June Page 10 of 34
Scenario Resource TypeSeparate System Planning (w H2) Nuclear (Palo Verde)
Nuclear (SMR)Gas - Steam TurbineGas - Combined CycleGas - Combustion TurbineBiomassGeothermalWindSolarBattery StorageImportsDemand ResponseHydrogenBTM SolarLoadExcess Generation
Low Load Growth Nuclear (Palo Verde)Nuclear (SMR)Gas - Steam TurbineGas - Combined CycleGas - Combustion TurbineBiomassGeothermalWindSolarBattery StorageImportsDemand ResponseHydrogenBTM SolarLoadExcess Generation
High Load Growth Nuclear (Palo Verde)Nuclear (SMR)Gas - Steam TurbineGas - Combined CycleGas - Combustion TurbineBiomassGeothermalWindSolarBattery StorageImportsDemand ResponseHydrogenBTM SolarLoadExcess Generation
2021 2024 2025 2027 2031 2035 2040 2045Installed Capacity (MW)
622 622 622 622 622 622 622 622 - - - - - - - - 426 307 307 307 234 - - - 493 493 493 493 493 266 266 266 503 731 731 731 668 825 825 989 - - - - - - - - - - - - - - - - - - 129 129 129 129 172 212 115 385 672 672 936 1290 1645 1990 - 50 269 291 601 1038 1420 1741 - - - - - - - - 46 53 56 61 71 81 93 93
- - - - - 121 195 206 18 65 80 108 166 221 289 368
- - - - - - - - - - - - - - - - 622 622 622 622 622 622 622 622 - - - - - - - - 426 307 307 307 234 - - - 493 493 493 493 493 266 266 266 503 731 731 731 668 847 989 1182 - - - - - - - - - - - - - - - - - - 96 96 96 96 96 153 115 385 541 541 743 1162 1216 1489 - 50 192 193 454 1012 1093 1257 - - - - - - - - 46 53 56 61 71 81 93 93
- - - - - - - - 18 65 80 108 166 221 289 368
- - - - - - - - - - - - - - - - 622 622 622 622 622 622 622 622 - - - - - - - - 426 307 307 307 234 - - - 493 493 493 493 493 266 266 266 503 731 731 731 668 1062 1237 1451 - - - - - - - - - - - - - - - - - - 123 123 123 123 123 266 115 385 677 677 1046 1309 1369 1660 - 50 249 342 716 1048 1136 1307 - - - - - - - - 46 53 56 61 71 81 93 93
- - - - - - - - 18 65 80 108 166 221 289 368
- - - - - - - - - - - - - - - -
Attachment D-1 E3 EPE Report Model Results June Page 11 of 34
Scenario Resource TypeHigh DG Nuclear (Palo Verde)
Nuclear (SMR)Gas - Steam TurbineGas - Combined CycleGas - Combustion TurbineBiomassGeothermalWindSolarBattery StorageImportsDemand ResponseHydrogenBTM SolarLoadExcess Generation
High DSM Nuclear (Palo Verde)Nuclear (SMR)Gas - Steam TurbineGas - Combined CycleGas - Combustion TurbineBiomassGeothermalWindSolarBattery StorageImportsDemand ResponseHydrogenBTM SolarLoadExcess Generation
No New Gas Nuclear (Palo Verde)Nuclear (SMR)Gas - Steam TurbineGas - Combined CycleGas - Combustion TurbineBiomassGeothermalWindSolarBattery StorageImportsDemand ResponseHydrogenBTM SolarLoadExcess Generation
2021 2024 2025 2027 2031 2035 2040 2045Installed Capacity (MW)
622 622 622 622 622 622 622 622 - - - - - - - - 426 307 307 307 234 - - - 493 493 493 493 493 266 266 266 503 731 731 731 668 942 1078 1322 - - - - - - - - - - - - - - - - - - 106 106 106 106 106 249 115 385 587 587 761 1011 1092 1023 - 50 183 252 571 1043 1151 1267 - - - - - - - - 46 53 56 61 71 81 93 93
- - - - - - - - 42 169 210 293 455 614 809 1032
- - - - - - - - - - - - - - - - 622 622 622 622 622 622 622 622 - - - - - - - - 426 307 307 307 234 - - - 493 493 493 493 493 266 266 266 503 731 731 731 668 801 926 1105 - - - - - - - - - - - - - - - - - - 70 70 70 70 70 127 115 385 558 558 641 1146 1189 1384 - 50 187 191 425 1000 1070 1209 - - - - - - - - 49 66 71 82 100 101 103 103
- - - - - - - - 18 65 80 108 166 221 289 368
- - - - - - - - - - - - - - - - 622 622 622 622 622 622 622 622 - - - - - - - - 426 307 307 307 234 - - - 493 493 493 493 493 266 266 266 503 731 731 731 668 668 668 668 - - - - - - - - - - - - - - - - - - 132 132 132 132 132 132 115 385 629 629 908 2129 2734 3644 - 50 183 251 573 1864 2496 3634 - - - - - - - - 46 53 56 61 71 81 93 93
- - - - - - - - 18 65 80 108 166 221 289 368
- - - - - - - - - - - - - - - -
Attachment D-1 E3 EPE Report Model Results June Page 12 of 34
Scenario Resource TypeNo Lifetime Extensions Nuclear (Palo Verde)
Nuclear (SMR)Gas - Steam TurbineGas - Combined CycleGas - Combustion TurbineBiomassGeothermalWindSolarBattery StorageImportsDemand ResponseHydrogenBTM SolarLoadExcess Generation
High Gas Price Nuclear (Palo Verde)Nuclear (SMR)Gas - Steam TurbineGas - Combined CycleGas - Combustion TurbineBiomassGeothermalWindSolarBattery StorageImportsDemand ResponseHydrogenBTM SolarLoadExcess Generation
Low Carbon Price Nuclear (Palo Verde)Nuclear (SMR)Gas - Steam TurbineGas - Combined CycleGas - Combustion TurbineBiomassGeothermalWindSolarBattery StorageImportsDemand ResponseHydrogenBTM SolarLoadExcess Generation
2021 2024 2025 2027 2031 2035 2040 2045Installed Capacity (MW)
622 622 622 622 622 622 622 622 - - - - - - - - 426 234 234 144 144 - - - 493 493 493 266 266 266 266 266 503 731 731 914 851 951 1109 1318 - - - - - - - - - - - - - - - - - - 118 118 118 118 118 196 115 385 769 769 1018 1235 1292 1579 - 50 230 434 743 1031 1115 1284 - - - - - - - - 46 53 56 61 71 81 93 93
- - - - - - - - 18 65 80 108 166 221 289 368
- - - - - - - - - - - - - - - - 622 622 622 622 622 622 622 622 - - - - - - - - 426 307 307 307 234 - - - 493 493 493 493 493 266 266 266 503 731 731 731 668 930 1088 1274 - - - - - - - - - - - - - - - - - - 142 142 142 142 142 264 115 385 629 629 905 1312 1369 1712 - 50 183 249 570 1047 1131 1312 - - - - - - - - 46 53 56 61 71 81 93 93
- - - - - - - - 18 65 80 108 166 221 289 368
- - - - - - - - - - - - - - - - 622 622 622 622 622 622 622 622 - - - - - - - - 426 307 307 307 234 - - - 493 493 493 493 493 266 266 266 503 731 731 731 668 920 1078 1267 - - - - - - - - - - - - - - - - - - 181 181 181 181 181 267 115 385 629 629 894 1312 1369 1747 - 50 183 240 559 1047 1131 1319 - - - - - - - - 46 53 56 61 71 81 93 93
- - - - - - - - 18 65 80 108 166 221 289 368
- - - - - - - - - - - - - - - -
Attachment D-1 E3 EPE Report Model Results June Page 13 of 34
Scenario Resource TypeMedium Carbon Price Nuclear (Palo Verde)
Nuclear (SMR)Gas - Steam TurbineGas - Combined CycleGas - Combustion TurbineBiomassGeothermalWindSolarBattery StorageImportsDemand ResponseHydrogenBTM SolarLoadExcess Generation
High Carbon Price Nuclear (Palo Verde)Nuclear (SMR)Gas - Steam TurbineGas - Combined CycleGas - Combustion TurbineBiomassGeothermalWindSolarBattery StorageImportsDemand ResponseHydrogenBTM SolarLoadExcess Generation
80 Clean by 2035 Nuclear (Palo Verde)Nuclear (SMR)Gas - Steam TurbineGas - Combined CycleGas - Combustion TurbineBiomassGeothermalWindSolarBattery StorageImportsDemand ResponseHydrogenBTM SolarLoadExcess Generation
2021 2024 2025 2027 2031 2035 2040 2045Installed Capacity (MW)
622 622 622 622 622 622 622 622 - - - - - - - - 426 307 307 307 234 - - - 493 493 493 493 493 266 266 266 503 731 731 731 668 909 1060 1248 - - - - - - - - - - - - - - - - - - 236 236 236 236 236 300 115 385 724 724 882 1312 1390 1813 - 50 183 228 547 1047 1136 1343 - - - - - - - - 46 53 56 61 71 81 93 93
- - - - - - - - 18 65 80 108 166 221 289 368
- - - - - - - - - - - - - - - - 622 622 622 622 622 622 622 622 - - - - - - - - 426 307 307 307 234 - - - 493 493 493 493 493 266 266 266 503 731 731 731 668 901 1001 1024 - - - - - - - - - - - - - - - - - - 300 300 300 300 300 301 115 385 927 927 972 1312 1640 2583 - 50 183 211 521 1047 1189 2082 - - - - - - - - 46 53 56 61 71 81 93 93
- - - - - - - - 18 65 80 108 166 221 289 368
- - - - - - - - - - - - - - - - 622 622 622 622 622 622 622 622 - - - - - - - - 426 307 307 307 234 - - - 493 493 493 493 493 266 266 266 503 731 731 731 668 938 1075 1253 - - - - - - - - - - - - - - - - - - 109 109 109 109 194 285 115 385 629 629 915 1312 1369 1805 - 50 183 256 580 1047 1131 1331 - - - - - - - - 46 53 56 61 71 81 93 93
- - - - - - - - 18 65 80 108 166 221 289 368
- - - - - - - - - - - - - - - -
Attachment D-1 E3 EPE Report Model Results June Page 14 of 34
Scenario Resource Type20 CO2 Red by 2040 Nuclear (Palo Verde)
Nuclear (SMR)Gas - Steam TurbineGas - Combined CycleGas - Combustion TurbineBiomassGeothermalWindSolarBattery StorageImportsDemand ResponseHydrogenBTM SolarLoadExcess Generation
40 CO2 Red by 2040 Nuclear (Palo Verde)Nuclear (SMR)Gas - Steam TurbineGas - Combined CycleGas - Combustion TurbineBiomassGeothermalWindSolarBattery StorageImportsDemand ResponseHydrogenBTM SolarLoadExcess Generation
60 CO2 Red by 2040 Nuclear (Palo Verde)Nuclear (SMR)Gas - Steam TurbineGas - Combined CycleGas - Combustion TurbineBiomassGeothermalWindSolarBattery StorageImportsDemand ResponseHydrogenBTM SolarLoadExcess Generation
2021 2024 2025 2027 2031 2035 2040 2045Installed Capacity (MW)
622 622 622 622 622 622 622 622 - - - - - - - - 426 307 307 307 234 - - - 493 493 493 493 493 266 266 266 503 731 731 731 668 952 1111 1270 - - - - - - - - - - - - - - - - - - 109 109 109 109 109 264 115 385 629 629 904 1242 1299 1733 - 50 183 256 582 1032 1116 1316 - - - - - - - - 46 53 56 61 71 81 93 93
- - - - - - - - 18 65 80 108 166 221 289 368
- - - - - - - - - - - - - - - - 622 622 622 622 622 622 622 622 - - - - - - - - 426 307 307 307 234 - - - 493 493 493 493 493 266 266 266 503 731 731 731 668 939 1064 1178 - - - - - - - - - - - - - - - - - - 109 109 109 109 221 300 115 385 629 629 915 1310 1390 2052 - 50 183 256 580 1045 1135 1573 - - - - - - - - 46 53 56 61 71 81 93 93
- - - - - - - - 18 65 80 108 166 221 289 368
- - - - - - - - - - - - - - - - 622 622 622 622 622 622 622 622 - - - - - - - - 426 307 307 307 234 - - - 493 493 493 493 493 266 266 266 503 731 731 731 668 938 987 1029 - - - - - - - - - - - - - - - - - - 109 109 109 109 300 301 115 385 629 629 915 1311 1822 2573 - 50 183 256 580 1046 1194 2062 - - - - - - - - 46 53 56 61 71 81 93 93
- - - - - - - - 18 65 80 108 166 221 289 368
- - - - - - - - - - - - - - - -
Attachment D-1 E3 EPE Report Model Results June Page 15 of 34
Scenario Resource Type80 CO2 Red by 2040 Nuclear (Palo Verde)
Nuclear (SMR)Gas - Steam TurbineGas - Combined CycleGas - Combustion TurbineBiomassGeothermalWindSolarBattery StorageImportsDemand ResponseHydrogenBTM SolarLoadExcess Generation
90 CO2 Red by 2040 Nuclear (Palo Verde)Nuclear (SMR)Gas - Steam TurbineGas - Combined CycleGas - Combustion TurbineBiomassGeothermalWindSolarBattery StorageImportsDemand ResponseHydrogenBTM SolarLoadExcess Generation
100 CO2 Red by 2040 Nuclear (Palo Verde)Nuclear (SMR)Gas - Steam TurbineGas - Combined CycleGas - Combustion TurbineBiomassGeothermalWindSolarBattery StorageImportsDemand ResponseHydrogenBTM SolarLoadExcess Generation
2021 2024 2025 2027 2031 2035 2040 2045Installed Capacity (MW)
622 622 622 622 622 622 622 622 - - - - - - - - 426 307 307 307 234 - - - 493 493 493 493 493 266 266 266 503 731 731 731 668 885 885 885 - - - - - - - - - - - - - - - - - - 192 192 192 192 507 507 115 385 629 629 891 1475 2226 3013 - 50 183 238 556 1080 1416 2455 - - - - - - - - 46 53 56 61 71 81 93 93
- - - - - - - - 18 65 80 108 166 221 289 368
- - - - - - - - - - - - - - - - 622 622 622 622 622 622 622 622 - - - - - - - - 426 307 307 307 234 - - - 493 493 493 493 493 266 266 266 503 731 731 731 668 819 819 819 - - - - - - - - - - - - - - - - - - 192 192 192 192 764 772 115 385 628 628 891 1681 2284 3081 - 50 183 238 556 1276 1601 2627 - - - - - - - - 46 53 56 61 71 81 93 93
- - - - - - - - 18 65 80 108 166 221 289 368
- - - - - - - - - - - - - - - - 622 622 622 622 622 622 622 622 - - - - - - - - 426 307 307 307 234 - - - 493 493 493 493 493 266 266 266 503 731 731 731 668 668 668 668 - - - - - - - - - - - - - - - - - - 132 132 132 132 1228 1605 115 385 629 629 908 2129 4851 5217 - 50 183 251 573 1864 6191 7470 - - - - - - - - 46 53 56 61 71 81 93 93
- - - - - - - - 18 65 80 108 166 221 298 701
- - - - - - - - - - - - - - - -
Attachment D-1 E3 EPE Report Model Results June Page 16 of 34
Scenario Resource Type100 CO2 Red by 2040 (w H2) Nuclear (Palo Verde)
Nuclear (SMR)Gas - Steam TurbineGas - Combined CycleGas - Combustion TurbineBiomassGeothermalWindSolarBattery StorageImportsDemand ResponseHydrogenBTM SolarLoadExcess Generation
2021 2024 2025 2027 2031 2035 2040 2045Installed Capacity (MW)
622 622 622 622 622 622 622 622 - - - - - - - - 426 307 307 307 234 - - - 493 493 493 493 493 266 - - 503 731 731 731 668 774 - - - - - - - - - - - - - - - - - - - - 231 231 231 231 687 687 115 385 628 628 883 1801 2353 3200 - 50 183 233 548 1403 1804 2864 - - - - - - - - 46 53 56 61 71 81 93 93
- - - - - - 1040 1040 18 65 80 108 166 221 289 368
- - - - - - - - - - - - - - - -
Attachment D-1 E3 EPE Report Model Results June Page 17 of 34
Scenario Resource TypeLeast-Cost (Reference Case) Nuclear (Palo Verde)
Nuclear (SMR)Gas - Steam TurbineGas - Combined CycleGas - Combustion TurbineBiomassGeothermalWindSolarBattery StorageImportsDemand ResponseHydrogenBTM SolarLoadExcess Generation
Least-Cost Case + ETA Resources Nuclear (Palo Verde)Nuclear (SMR)Gas - Steam TurbineGas - Combined CycleGas - Combustion TurbineBiomassGeothermalWindSolarBattery StorageImportsDemand ResponseHydrogenBTM SolarLoadExcess Generation
Separate System Planning Nuclear (Palo Verde)Nuclear (SMR)Gas - Steam TurbineGas - Combined CycleGas - Combustion TurbineBiomassGeothermalWindSolarBattery StorageImportsDemand ResponseHydrogenBTM SolarLoadExcess Generation
2021 2024 2025 2027 2031 2035 2040 2045- - - - - - - - - - - - - - - - - - - - - - - - - - - - - - - - - 228 228 228 228 512 671 878 - - - - - - - - - - - - - - - - - - 109 109 109 109 109 196 - 270 514 514 789 1196 1280 1842 - 50 183 256 582 1032 1116 1334 - - - - - - - - 46 53 56 61 71 81 93 93
- - - - - - - - 18 65 80 108 166 221 289 368
- - - - - - - - - - - - - - - - - - - - - - - - - - - - - - - - - - - - - - - - - - - - - - - - - 228 228 228 228 439 559 714 - - - - - - - - - - - - - - - - - - 204 204 204 204 204 264 - 270 514 514 772 1437 1666 2312 - 50 183 236 552 1084 1252 1748 - - - - - - - - 46 53 56 61 71 81 93 93
- - - - - - - - 18 65 80 108 166 221 289 368
- - - - - - - - - - - - - - - - - - - - - - - - - - - - - - - - - - - - - - - - - - - - - - - - - 228 228 228 228 395 395 549 - - - - - - - - - - - - - - - - - - 87 87 87 87 87 159 - 270 592 592 790 1622 2304 2901 - 50 271 293 634 1480 2207 2629 - - - - - - - - 46 53 56 61 71 81 93 93
- - - - - - - - 18 65 80 108 166 221 289 368
- - - - - - - - - - - - - - - -
Cumulative Capacity Additions (MW)
Attachment D-1 E3 EPE Report Model Results June Page 18 of 34
Scenario Resource TypeSeparate System Planning (w H2) Nuclear (Palo Verde)
Nuclear (SMR)Gas - Steam TurbineGas - Combined CycleGas - Combustion TurbineBiomassGeothermalWindSolarBattery StorageImportsDemand ResponseHydrogenBTM SolarLoadExcess Generation
Low Load Growth Nuclear (Palo Verde)Nuclear (SMR)Gas - Steam TurbineGas - Combined CycleGas - Combustion TurbineBiomassGeothermalWindSolarBattery StorageImportsDemand ResponseHydrogenBTM SolarLoadExcess Generation
High Load Growth Nuclear (Palo Verde)Nuclear (SMR)Gas - Steam TurbineGas - Combined CycleGas - Combustion TurbineBiomassGeothermalWindSolarBattery StorageImportsDemand ResponseHydrogenBTM SolarLoadExcess Generation
2021 2024 2025 2027 2031 2035 2040 2045Cumulative Capacity Additions (MW)
- - - - - - - - - - - - - - - - - - - - - - - - - - - - - - - - - 228 228 228 228 385 385 549 - - - - - - - - - - - - - - - - - - 129 129 129 129 172 212 - 270 557 557 821 1245 1627 2252 - 50 269 291 601 1038 1420 1791 - - - - - - - - 46 53 56 61 71 81 93 93
- - - - - 121 195 206 18 65 80 108 166 221 289 368
- - - - - - - - - - - - - - - - - - - - - - - - - - - - - - - - - - - - - - - - - - - - - - - - - 228 228 228 228 407 549 742 - - - - - - - - - - - - - - - - - - 96 96 96 96 96 153 - 270 426 426 628 1117 1198 1751 - 50 192 193 454 1012 1093 1307 - - - - - - - - 46 53 56 61 71 81 93 93
- - - - - - - - 18 65 80 108 166 221 289 368
- - - - - - - - - - - - - - - - - - - - - - - - - - - - - - - - - - - - - - - - - - - - - - - - - 228 228 228 228 622 797 1011 - - - - - - - - - - - - - - - - - - 123 123 123 123 123 266 - 270 562 562 931 1264 1351 1922 - 50 249 342 716 1048 1136 1357 - - - - - - - - 46 53 56 61 71 81 93 93
- - - - - - - - 18 65 80 108 166 221 289 368
- - - - - - - - - - - - - - - -
Attachment D-1 E3 EPE Report Model Results June Page 19 of 34
Scenario Resource TypeHigh DG Nuclear (Palo Verde)
Nuclear (SMR)Gas - Steam TurbineGas - Combined CycleGas - Combustion TurbineBiomassGeothermalWindSolarBattery StorageImportsDemand ResponseHydrogenBTM SolarLoadExcess Generation
High DSM Nuclear (Palo Verde)Nuclear (SMR)Gas - Steam TurbineGas - Combined CycleGas - Combustion TurbineBiomassGeothermalWindSolarBattery StorageImportsDemand ResponseHydrogenBTM SolarLoadExcess Generation
No New Gas Nuclear (Palo Verde)Nuclear (SMR)Gas - Steam TurbineGas - Combined CycleGas - Combustion TurbineBiomassGeothermalWindSolarBattery StorageImportsDemand ResponseHydrogenBTM SolarLoadExcess Generation
2021 2024 2025 2027 2031 2035 2040 2045Cumulative Capacity Additions (MW)
- - - - - - - - - - - - - - - - - - - - - - - - - - - - - - - - - 228 228 228 228 502 638 882 - - - - - - - - - - - - - - - - - - 106 106 106 106 106 249 - 270 472 472 646 966 1074 1285 - 50 183 252 571 1043 1151 1317 - - - - - - - - 46 53 56 61 71 81 93 93
- - - - - - - - 42 169 210 293 455 614 809 1032
- - - - - - - - - - - - - - - - - - - - - - - - - - - - - - - - - - - - - - - - - - - - - - - - - 228 228 228 228 361 486 665 - - - - - - - - - - - - - - - - - - 70 70 70 70 70 127 - 270 443 443 526 1101 1171 1646 - 50 187 191 425 1000 1070 1259 - - - - - - - - 49 66 71 82 100 101 103 103
- - - - - - - - 18 65 80 108 166 221 289 368
- - - - - - - - - - - - - - - - - - - - - - - - - - - - - - - - - - - - - - - - - - - - - - - - - 228 228 228 228 228 228 228 - - - - - - - - - - - - - - - - - - 132 132 132 132 132 132 - 270 514 514 793 2084 2716 3906 - 50 183 251 573 1864 2496 3684 - - - - - - - - 46 53 56 61 71 81 93 93
- - - - - - - - 18 65 80 108 166 221 289 368
- - - - - - - - - - - - - - - -
Attachment D-1 E3 EPE Report Model Results June Page 20 of 34
Scenario Resource TypeNo Lifetime Extensions Nuclear (Palo Verde)
Nuclear (SMR)Gas - Steam TurbineGas - Combined CycleGas - Combustion TurbineBiomassGeothermalWindSolarBattery StorageImportsDemand ResponseHydrogenBTM SolarLoadExcess Generation
High Gas Price Nuclear (Palo Verde)Nuclear (SMR)Gas - Steam TurbineGas - Combined CycleGas - Combustion TurbineBiomassGeothermalWindSolarBattery StorageImportsDemand ResponseHydrogenBTM SolarLoadExcess Generation
Low Carbon Price Nuclear (Palo Verde)Nuclear (SMR)Gas - Steam TurbineGas - Combined CycleGas - Combustion TurbineBiomassGeothermalWindSolarBattery StorageImportsDemand ResponseHydrogenBTM SolarLoadExcess Generation
2021 2024 2025 2027 2031 2035 2040 2045Cumulative Capacity Additions (MW)
- - - - - - - - - - - - - - - - - - - - - - - - - - - - - - - - - 228 228 411 411 511 669 878 - - - - - - - - - - - - - - - - - - 118 118 118 118 118 196 - 270 654 654 903 1190 1274 1841 - 50 230 434 743 1031 1115 1334 - - - - - - - - 46 53 56 61 71 81 93 93
- - - - - - - - 18 65 80 108 166 221 289 368
- - - - - - - - - - - - - - - - - - - - - - - - - - - - - - - - - - - - - - - - - - - - - - - - - 228 228 228 228 490 648 834 - - - - - - - - - - - - - - - - - - 142 142 142 142 142 264 - 270 514 514 790 1267 1351 1974 - 50 183 249 570 1047 1131 1362 - - - - - - - - 46 53 56 61 71 81 93 93
- - - - - - - - 18 65 80 108 166 221 289 368
- - - - - - - - - - - - - - - - - - - - - - - - - - - - - - - - - - - - - - - - - - - - - - - - - 228 228 228 228 480 638 827 - - - - - - - - - - - - - - - - - - 181 181 181 181 181 267 - 270 514 514 779 1267 1351 2009 - 50 183 240 559 1047 1131 1369 - - - - - - - - 46 53 56 61 71 81 93 93
- - - - - - - - 18 65 80 108 166 221 289 368
- - - - - - - - - - - - - - - -
Attachment D-1 E3 EPE Report Model Results June Page 21 of 34
Scenario Resource TypeMedium Carbon Price Nuclear (Palo Verde)
Nuclear (SMR)Gas - Steam TurbineGas - Combined CycleGas - Combustion TurbineBiomassGeothermalWindSolarBattery StorageImportsDemand ResponseHydrogenBTM SolarLoadExcess Generation
High Carbon Price Nuclear (Palo Verde)Nuclear (SMR)Gas - Steam TurbineGas - Combined CycleGas - Combustion TurbineBiomassGeothermalWindSolarBattery StorageImportsDemand ResponseHydrogenBTM SolarLoadExcess Generation
80 Clean by 2035 Nuclear (Palo Verde)Nuclear (SMR)Gas - Steam TurbineGas - Combined CycleGas - Combustion TurbineBiomassGeothermalWindSolarBattery StorageImportsDemand ResponseHydrogenBTM SolarLoadExcess Generation
2021 2024 2025 2027 2031 2035 2040 2045Cumulative Capacity Additions (MW)
- - - - - - - - - - - - - - - - - - - - - - - - - - - - - - - - - 228 228 228 228 469 620 808 - - - - - - - - - - - - - - - - - - 236 236 236 236 236 300 - 270 609 609 767 1267 1372 2075 - 50 183 228 547 1047 1136 1393 - - - - - - - - 46 53 56 61 71 81 93 93
- - - - - - - - 18 65 80 108 166 221 289 368
- - - - - - - - - - - - - - - - - - - - - - - - - - - - - - - - - - - - - - - - - - - - - - - - - 228 228 228 228 461 561 584 - - - - - - - - - - - - - - - - - - 300 300 300 300 300 301 - 270 812 812 857 1267 1622 2845 - 50 183 211 521 1047 1189 2132 - - - - - - - - 46 53 56 61 71 81 93 93
- - - - - - - - 18 65 80 108 166 221 289 368
- - - - - - - - - - - - - - - - - - - - - - - - - - - - - - - - - - - - - - - - - - - - - - - - - 228 228 228 228 498 635 813 - - - - - - - - - - - - - - - - - - 109 109 109 109 194 285 - 270 514 514 800 1267 1351 2067 - 50 183 256 580 1047 1131 1381 - - - - - - - - 46 53 56 61 71 81 93 93
- - - - - - - - 18 65 80 108 166 221 289 368
- - - - - - - - - - - - - - - -
Attachment D-1 E3 EPE Report Model Results June Page 22 of 34
Scenario Resource Type20 CO2 Red by 2040 Nuclear (Palo Verde)
Nuclear (SMR)Gas - Steam TurbineGas - Combined CycleGas - Combustion TurbineBiomassGeothermalWindSolarBattery StorageImportsDemand ResponseHydrogenBTM SolarLoadExcess Generation
40 CO2 Red by 2040 Nuclear (Palo Verde)Nuclear (SMR)Gas - Steam TurbineGas - Combined CycleGas - Combustion TurbineBiomassGeothermalWindSolarBattery StorageImportsDemand ResponseHydrogenBTM SolarLoadExcess Generation
60 CO2 Red by 2040 Nuclear (Palo Verde)Nuclear (SMR)Gas - Steam TurbineGas - Combined CycleGas - Combustion TurbineBiomassGeothermalWindSolarBattery StorageImportsDemand ResponseHydrogenBTM SolarLoadExcess Generation
2021 2024 2025 2027 2031 2035 2040 2045Cumulative Capacity Additions (MW)
- - - - - - - - - - - - - - - - - - - - - - - - - - - - - - - - - 228 228 228 228 512 671 830 - - - - - - - - - - - - - - - - - - 109 109 109 109 109 264 - 270 514 514 789 1197 1281 1995 - 50 183 256 582 1032 1116 1366 - - - - - - - - 46 53 56 61 71 81 93 93
- - - - - - - - 18 65 80 108 166 221 289 368
- - - - - - - - - - - - - - - - - - - - - - - - - - - - - - - - - - - - - - - - - - - - - - - - - 228 228 228 228 499 624 738 - - - - - - - - - - - - - - - - - - 109 109 109 109 221 300 - 270 514 514 800 1265 1372 2314 - 50 183 256 580 1045 1135 1623 - - - - - - - - 46 53 56 61 71 81 93 93
- - - - - - - - 18 65 80 108 166 221 289 368
- - - - - - - - - - - - - - - - - - - - - - - - - - - - - - - - - - - - - - - - - - - - - - - - - 228 228 228 228 498 547 589 - - - - - - - - - - - - - - - - - - 109 109 109 109 300 301 - 270 514 514 800 1266 1804 2835 - 50 183 256 580 1046 1194 2112 - - - - - - - - 46 53 56 61 71 81 93 93
- - - - - - - - 18 65 80 108 166 221 289 368
- - - - - - - - - - - - - - - -
Attachment D-1 E3 EPE Report Model Results June Page 23 of 34
Scenario Resource Type80 CO2 Red by 2040 Nuclear (Palo Verde)
Nuclear (SMR)Gas - Steam TurbineGas - Combined CycleGas - Combustion TurbineBiomassGeothermalWindSolarBattery StorageImportsDemand ResponseHydrogenBTM SolarLoadExcess Generation
90 CO2 Red by 2040 Nuclear (Palo Verde)Nuclear (SMR)Gas - Steam TurbineGas - Combined CycleGas - Combustion TurbineBiomassGeothermalWindSolarBattery StorageImportsDemand ResponseHydrogenBTM SolarLoadExcess Generation
100 CO2 Red by 2040 Nuclear (Palo Verde)Nuclear (SMR)Gas - Steam TurbineGas - Combined CycleGas - Combustion TurbineBiomassGeothermalWindSolarBattery StorageImportsDemand ResponseHydrogenBTM SolarLoadExcess Generation
2021 2024 2025 2027 2031 2035 2040 2045Cumulative Capacity Additions (MW)
- - - - - - - - - - - - - - - - - - - - - - - - - - - - - - - - - 228 228 228 228 445 445 445 - - - - - - - - - - - - - - - - - - 192 192 192 192 507 507 - 270 514 514 776 1430 2208 3275 - 50 183 238 556 1080 1416 2505 - - - - - - - - 46 53 56 61 71 81 93 93
- - - - - - - - 18 65 80 108 166 221 289 368
- - - - - - - - - - - - - - - - - - - - - - - - - - - - - - - - - - - - - - - - - - - - - - - - - 228 228 228 228 379 379 379 - - - - - - - - - - - - - - - - - - 192 192 192 192 764 772 - 270 513 513 776 1636 2266 3343 - 50 183 238 556 1276 1601 2677 - - - - - - - - 46 53 56 61 71 81 93 93
- - - - - - - - 18 65 80 108 166 221 289 368
- - - - - - - - - - - - - - - - - - - - - - - - - - - - - - - - - - - - - - - - - - - - - - - - - 228 228 228 228 228 228 228 - - - - - - - - - - - - - - - - - - 132 132 132 132 1228 1605 - 270 514 514 793 2084 4833 5479 - 50 183 251 573 1864 6191 7470 - - - - - - - - 46 53 56 61 71 81 93 93
- - - - - - - - 18 65 80 108 166 221 298 701
- - - - - - - - - - - - - - - -
Attachment D-1 E3 EPE Report Model Results June Page 24 of 34
Scenario Resource Type100 CO2 Red by 2040 (w H2) Nuclear (Palo Verde)
Nuclear (SMR)Gas - Steam TurbineGas - Combined CycleGas - Combustion TurbineBiomassGeothermalWindSolarBattery StorageImportsDemand ResponseHydrogenBTM SolarLoadExcess Generation
2021 2024 2025 2027 2031 2035 2040 2045Cumulative Capacity Additions (MW)
- - - - - - - - - - - - - - - - - - - - - - - - - - - - - - - - - 228 228 228 228 334 - - - - - - - - - - - - - - - - - - - - 231 231 231 231 687 687 - 270 513 513 768 1756 2335 3462 - 50 183 233 548 1403 1804 2914 - - - - - - - - 46 53 56 61 71 81 93 93
- - - - - - 334 334 18 65 80 108 166 221 289 368
- - - - - - - - - - - - - - - -
Attachment D-1 E3 EPE Report Model Results June Page 25 of 34
Scenario Resource TypeLeast-Cost (Reference Case) Nuclear (Palo Verde)
Nuclear (SMR)Gas - Steam TurbineGas - Combined CycleGas - Combustion TurbineBiomassGeothermalWindSolarBattery StorageImportsDemand ResponseHydrogenBTM SolarLoadExcess Generation
Least-Cost Case + ETA Resources Nuclear (Palo Verde)Nuclear (SMR)Gas - Steam TurbineGas - Combined CycleGas - Combustion TurbineBiomassGeothermalWindSolarBattery StorageImportsDemand ResponseHydrogenBTM SolarLoadExcess Generation
Separate System Planning Nuclear (Palo Verde)Nuclear (SMR)Gas - Steam TurbineGas - Combined CycleGas - Combustion TurbineBiomassGeothermalWindSolarBattery StorageImportsDemand ResponseHydrogenBTM SolarLoadExcess Generation
2021 2024 2025 2027 2031 2035 2040 2045- - - - - - - - - - - - - - - - - (119) (119) (119) (192) (426) (426) (426) - - - - - (227) (227) (227) - - - - (63) (63) (63) (63) - - - - - - - - - - - - - - - - - - - - - - - - - - - - - (70) (97) (377) - - - - - - - (50) - - - - - - - - - - - - - - - - - - - - - - - - - - - - - - - - - - - - - - - - - - - - - - - - - - - - - - - - - - - - - - - - - (119) (119) (119) (192) (426) (426) (426) - - - - - (227) (227) (227) - - - - (63) (63) (63) (63) - - - - - - - - - - - - - - - - - - - - - - - - - - - - - (70) (97) (377) - - - - - - - (50) - - - - - - - - - - - - - - - - - - - - - - - - - - - - - - - - - - - - - - - - - - - - - - - - - - - - - - - - - - - - - - - - - (119) (119) (119) (192) (426) (426) (426) - - - - - (227) (227) (227) - - - - (63) (63) (63) (63) - - - - - - - - - - - - - - - - - - - - - - - - - - - - - (70) (97) (377) - - - - - - - (50) - - - - - - - - - - - - - - - - - - - - - - - - - - - - - - - - - - - - - - - - - - - - - - - -
Cumulative Capacity Retirements (MW)
Attachment D-1 E3 EPE Report Model Results June Page 26 of 34
Scenario Resource TypeSeparate System Planning (w H2) Nuclear (Palo Verde)
Nuclear (SMR)Gas - Steam TurbineGas - Combined CycleGas - Combustion TurbineBiomassGeothermalWindSolarBattery StorageImportsDemand ResponseHydrogenBTM SolarLoadExcess Generation
Low Load Growth Nuclear (Palo Verde)Nuclear (SMR)Gas - Steam TurbineGas - Combined CycleGas - Combustion TurbineBiomassGeothermalWindSolarBattery StorageImportsDemand ResponseHydrogenBTM SolarLoadExcess Generation
High Load Growth Nuclear (Palo Verde)Nuclear (SMR)Gas - Steam TurbineGas - Combined CycleGas - Combustion TurbineBiomassGeothermalWindSolarBattery StorageImportsDemand ResponseHydrogenBTM SolarLoadExcess Generation
2021 2024 2025 2027 2031 2035 2040 2045Cumulative Capacity Retirements (MW)
- - - - - - - - - - - - - - - - - (119) (119) (119) (192) (426) (426) (426) - - - - - (227) (227) (227) - - - - (63) (63) (63) (63) - - - - - - - - - - - - - - - - - - - - - - - - - - - - - (70) (97) (377) - - - - - - - (50) - - - - - - - - - - - - - - - - - - - - - - - - - - - - - - - - - - - - - - - - - - - - - - - - - - - - - - - - - - - - - - - - - (119) (119) (119) (192) (426) (426) (426) - - - - - (227) (227) (227) - - - - (63) (63) (63) (63) - - - - - - - - - - - - - - - - - - - - - - - - - - - - - (70) (97) (377) - - - - - - - (50) - - - - - - - - - - - - - - - - - - - - - - - - - - - - - - - - - - - - - - - - - - - - - - - - - - - - - - - - - - - - - - - - - (119) (119) (119) (192) (426) (426) (426) - - - - - (227) (227) (227) - - - - (63) (63) (63) (63) - - - - - - - - - - - - - - - - - - - - - - - - - - - - - (70) (97) (377) - - - - - - - (50) - - - - - - - - - - - - - - - - - - - - - - - - - - - - - - - - - - - - - - - - - - - - - - - -
Attachment D-1 E3 EPE Report Model Results June Page 27 of 34
Scenario Resource TypeHigh DG Nuclear (Palo Verde)
Nuclear (SMR)Gas - Steam TurbineGas - Combined CycleGas - Combustion TurbineBiomassGeothermalWindSolarBattery StorageImportsDemand ResponseHydrogenBTM SolarLoadExcess Generation
High DSM Nuclear (Palo Verde)Nuclear (SMR)Gas - Steam TurbineGas - Combined CycleGas - Combustion TurbineBiomassGeothermalWindSolarBattery StorageImportsDemand ResponseHydrogenBTM SolarLoadExcess Generation
No New Gas Nuclear (Palo Verde)Nuclear (SMR)Gas - Steam TurbineGas - Combined CycleGas - Combustion TurbineBiomassGeothermalWindSolarBattery StorageImportsDemand ResponseHydrogenBTM SolarLoadExcess Generation
2021 2024 2025 2027 2031 2035 2040 2045Cumulative Capacity Retirements (MW)
- - - - - - - - - - - - - - - - - (119) (119) (119) (192) (426) (426) (426) - - - - - (227) (227) (227) - - - - (63) (63) (63) (63) - - - - - - - - - - - - - - - - - - - - - - - - - - - - - (70) (97) (377) - - - - - - - (50) - - - - - - - - - - - - - - - - - - - - - - - - - - - - - - - - - - - - - - - - - - - - - - - - - - - - - - - - - - - - - - - - - (119) (119) (119) (192) (426) (426) (426) - - - - - (227) (227) (227) - - - - (63) (63) (63) (63) - - - - - - - - - - - - - - - - - - - - - - - - - - - - - (70) (97) (377) - - - - - - - (50) - - - - - - - - - - - - - - - - - - - - - - - - - - - - - - - - - - - - - - - - - - - - - - - - - - - - - - - - - - - - - - - - - (119) (119) (119) (192) (426) (426) (426) - - - - - (227) (227) (227) - - - - (63) (63) (63) (63) - - - - - - - - - - - - - - - - - - - - - - - - - - - - - (70) (97) (377) - - - - - - - (50) - - - - - - - - - - - - - - - - - - - - - - - - - - - - - - - - - - - - - - - - - - - - - - - -
Attachment D-1 E3 EPE Report Model Results June Page 28 of 34
Scenario Resource TypeNo Lifetime Extensions Nuclear (Palo Verde)
Nuclear (SMR)Gas - Steam TurbineGas - Combined CycleGas - Combustion TurbineBiomassGeothermalWindSolarBattery StorageImportsDemand ResponseHydrogenBTM SolarLoadExcess Generation
High Gas Price Nuclear (Palo Verde)Nuclear (SMR)Gas - Steam TurbineGas - Combined CycleGas - Combustion TurbineBiomassGeothermalWindSolarBattery StorageImportsDemand ResponseHydrogenBTM SolarLoadExcess Generation
Low Carbon Price Nuclear (Palo Verde)Nuclear (SMR)Gas - Steam TurbineGas - Combined CycleGas - Combustion TurbineBiomassGeothermalWindSolarBattery StorageImportsDemand ResponseHydrogenBTM SolarLoadExcess Generation
2021 2024 2025 2027 2031 2035 2040 2045Cumulative Capacity Retirements (MW)
- - - - - - - - - - - - - - - - - (192) (192) (282) (282) (426) (426) (426) - - - (227) (227) (227) (227) (227) - - - - (63) (63) (63) (63) - - - - - - - - - - - - - - - - - - - - - - - - - - - - - (70) (97) (377) - - - - - - - (50) - - - - - - - - - - - - - - - - - - - - - - - - - - - - - - - - - - - - - - - - - - - - - - - - - - - - - - - - - - - - - - - - - (119) (119) (119) (192) (426) (426) (426) - - - - - (227) (227) (227) - - - - (63) (63) (63) (63) - - - - - - - - - - - - - - - - - - - - - - - - - - - - - (70) (97) (377) - - - - - - - (50) - - - - - - - - - - - - - - - - - - - - - - - - - - - - - - - - - - - - - - - - - - - - - - - - - - - - - - - - - - - - - - - - - (119) (119) (119) (192) (426) (426) (426) - - - - - (227) (227) (227) - - - - (63) (63) (63) (63) - - - - - - - - - - - - - - - - - - - - - - - - - - - - - (70) (97) (377) - - - - - - - (50) - - - - - - - - - - - - - - - - - - - - - - - - - - - - - - - - - - - - - - - - - - - - - - - -
Attachment D-1 E3 EPE Report Model Results June Page 29 of 34
Scenario Resource TypeMedium Carbon Price Nuclear (Palo Verde)
Nuclear (SMR)Gas - Steam TurbineGas - Combined CycleGas - Combustion TurbineBiomassGeothermalWindSolarBattery StorageImportsDemand ResponseHydrogenBTM SolarLoadExcess Generation
High Carbon Price Nuclear (Palo Verde)Nuclear (SMR)Gas - Steam TurbineGas - Combined CycleGas - Combustion TurbineBiomassGeothermalWindSolarBattery StorageImportsDemand ResponseHydrogenBTM SolarLoadExcess Generation
80 Clean by 2035 Nuclear (Palo Verde)Nuclear (SMR)Gas - Steam TurbineGas - Combined CycleGas - Combustion TurbineBiomassGeothermalWindSolarBattery StorageImportsDemand ResponseHydrogenBTM SolarLoadExcess Generation
2021 2024 2025 2027 2031 2035 2040 2045Cumulative Capacity Retirements (MW)
- - - - - - - - - - - - - - - - - (119) (119) (119) (192) (426) (426) (426) - - - - - (227) (227) (227) - - - - (63) (63) (63) (63) - - - - - - - - - - - - - - - - - - - - - - - - - - - - - (70) (97) (377) - - - - - - - (50) - - - - - - - - - - - - - - - - - - - - - - - - - - - - - - - - - - - - - - - - - - - - - - - - - - - - - - - - - - - - - - - - - (119) (119) (119) (192) (426) (426) (426) - - - - - (227) (227) (227) - - - - (63) (63) (63) (63) - - - - - - - - - - - - - - - - - - - - - - - - - - - - - (70) (97) (377) - - - - - - - (50) - - - - - - - - - - - - - - - - - - - - - - - - - - - - - - - - - - - - - - - - - - - - - - - - - - - - - - - - - - - - - - - - - (119) (119) (119) (192) (426) (426) (426) - - - - - (227) (227) (227) - - - - (63) (63) (63) (63) - - - - - - - - - - - - - - - - - - - - - - - - - - - - - (70) (97) (377) - - - - - - - (50) - - - - - - - - - - - - - - - - - - - - - - - - - - - - - - - - - - - - - - - - - - - - - - - -
Attachment D-1 E3 EPE Report Model Results June Page 30 of 34
Scenario Resource Type20 CO2 Red by 2040 Nuclear (Palo Verde)
Nuclear (SMR)Gas - Steam TurbineGas - Combined CycleGas - Combustion TurbineBiomassGeothermalWindSolarBattery StorageImportsDemand ResponseHydrogenBTM SolarLoadExcess Generation
40 CO2 Red by 2040 Nuclear (Palo Verde)Nuclear (SMR)Gas - Steam TurbineGas - Combined CycleGas - Combustion TurbineBiomassGeothermalWindSolarBattery StorageImportsDemand ResponseHydrogenBTM SolarLoadExcess Generation
60 CO2 Red by 2040 Nuclear (Palo Verde)Nuclear (SMR)Gas - Steam TurbineGas - Combined CycleGas - Combustion TurbineBiomassGeothermalWindSolarBattery StorageImportsDemand ResponseHydrogenBTM SolarLoadExcess Generation
2021 2024 2025 2027 2031 2035 2040 2045Cumulative Capacity Retirements (MW)
- - - - - - - - - - - - - - - - - (119) (119) (119) (192) (426) (426) (426) - - - - - (227) (227) (227) - - - - (63) (63) (63) (63) - - - - - - - - - - - - - - - - - - - - - - - - - - - - - (70) (97) (377) - - - - - - - (50) - - - - - - - - - - - - - - - - - - - - - - - - - - - - - - - - - - - - - - - - - - - - - - - - - - - - - - - - - - - - - - - - - (119) (119) (119) (192) (426) (426) (426) - - - - - (227) (227) (227) - - - - (63) (63) (63) (63) - - - - - - - - - - - - - - - - - - - - - - - - - - - - - (70) (97) (377) - - - - - - - (50) - - - - - - - - - - - - - - - - - - - - - - - - - - - - - - - - - - - - - - - - - - - - - - - - - - - - - - - - - - - - - - - - - (119) (119) (119) (192) (426) (426) (426) - - - - - (227) (227) (227) - - - - (63) (63) (63) (63) - - - - - - - - - - - - - - - - - - - - - - - - - - - - - (70) (97) (377) - - - - - - - (50) - - - - - - - - - - - - - - - - - - - - - - - - - - - - - - - - - - - - - - - - - - - - - - - -
Attachment D-1 E3 EPE Report Model Results June Page 31 of 34
Scenario Resource Type80 CO2 Red by 2040 Nuclear (Palo Verde)
Nuclear (SMR)Gas - Steam TurbineGas - Combined CycleGas - Combustion TurbineBiomassGeothermalWindSolarBattery StorageImportsDemand ResponseHydrogenBTM SolarLoadExcess Generation
90 CO2 Red by 2040 Nuclear (Palo Verde)Nuclear (SMR)Gas - Steam TurbineGas - Combined CycleGas - Combustion TurbineBiomassGeothermalWindSolarBattery StorageImportsDemand ResponseHydrogenBTM SolarLoadExcess Generation
100 CO2 Red by 2040 Nuclear (Palo Verde)Nuclear (SMR)Gas - Steam TurbineGas - Combined CycleGas - Combustion TurbineBiomassGeothermalWindSolarBattery StorageImportsDemand ResponseHydrogenBTM SolarLoadExcess Generation
2021 2024 2025 2027 2031 2035 2040 2045Cumulative Capacity Retirements (MW)
- - - - - - - - - - - - - - - - - (119) (119) (119) (192) (426) (426) (426) - - - - - (227) (227) (227) - - - - (63) (63) (63) (63) - - - - - - - - - - - - - - - - - - - - - - - - - - - - - (70) (97) (377) - - - - - - - (50) - - - - - - - - - - - - - - - - - - - - - - - - - - - - - - - - - - - - - - - - - - - - - - - - - - - - - - - - - - - - - - - - - (119) (119) (119) (192) (426) (426) (426) - - - - - (227) (227) (227) - - - - (63) (63) (63) (63) - - - - - - - - - - - - - - - - - - - - - - - - - - - - - (70) (97) (377) - - - - - - - (50) - - - - - - - - - - - - - - - - - - - - - - - - - - - - - - - - - - - - - - - - - - - - - - - - - - - - - - - - - - - - - - - - - (119) (119) (119) (192) (426) (426) (426) - - - - - (227) (227) (227) - - - - (63) (63) (63) (63) - - - - - - - - - - - - - - - - - - - - - - - - - - - - - (70) (97) (377) - - - - - - - (50) - - - - - - - - - - - - - - - - - - - - - - - - - - - - - - - - - - - - - - - - - - - - - - - -
Attachment D-1 E3 EPE Report Model Results June Page 32 of 34
Scenario Resource Type100 CO2 Red by 2040 (w H2) Nuclear (Palo Verde)
Nuclear (SMR)Gas - Steam TurbineGas - Combined CycleGas - Combustion TurbineBiomassGeothermalWindSolarBattery StorageImportsDemand ResponseHydrogenBTM SolarLoadExcess Generation
2021 2024 2025 2027 2031 2035 2040 2045Cumulative Capacity Retirements (MW)
- - - - - - - - - - - - - - - - - (119) (119) (119) (192) (426) (426) (426) - - - - - (227) (227) (227) - - - - (63) (63) (63) (63) - - - - - - - - - - - - - - - - - - - - - - - - - - - - - (70) (97) (377) - - - - - - - (50) - - - - - - - - - - - - - - - - - - - - - - - - - - - - - - - - - - - - - - - - - - - - - - - -
Attachment D-1 E3 EPE Report Model Results June Page 33 of 34
Scenario 2021 2024 2025 2027 2031 2035 2040 2045Least-Cost (Reference Case) 246$ 233$ 246$ 265$ 290$ 351$ 409$ 512$ Least-Cost Case + ETA Resources 246$ 233$ 249$ 266$ 291$ 356$ 412$ 519$ Separate System Planning 247$ 234$ 252$ 269$ 295$ 376$ 471$ 577$ Separate System Planning (w H2) 247$ 234$ 252$ 269$ 294$ 355$ 438$ 543$ Low Load Growth 239$ 227$ 239$ 255$ 275$ 327$ 380$ 478$ High Load Growth 253$ 239$ 256$ 277$ 307$ 377$ 439$ 546$ High DG 245$ 231$ 243$ 261$ 283$ 336$ 388$ 482$ High DSM 245$ 230$ 241$ 256$ 272$ 317$ 364$ 454$ No New Gas 246$ 233$ 247$ 265$ 290$ 394$ 470$ 601$ No Lifetime Extensions 246$ 228$ 246$ 276$ 307$ 354$ 412$ 515$ High Gas Price 257$ 242$ 252$ 272$ 297$ 358$ 418$ 522$ Low Carbon Price 291$ 277$ 285$ 304$ 329$ 390$ 450$ 556$ Medium Carbon Price 358$ 341$ 342$ 361$ 386$ 447$ 512$ 623$ High Carbon Price 469$ 449$ 433$ 452$ 478$ 539$ 609$ 730$ 80 Clean by 2035 246$ 233$ 246$ 265$ 290$ 352$ 409$ 512$ 20 CO2 Red by 2040 246$ 233$ 246$ 265$ 290$ 351$ 409$ 511$ 40 CO2 Red by 2040 246$ 233$ 246$ 265$ 290$ 352$ 409$ 519$ 60 CO2 Red by 2040 246$ 233$ 246$ 265$ 290$ 352$ 421$ 537$ 80 CO2 Red by 2040 246$ 233$ 248$ 266$ 290$ 356$ 464$ 580$ 90 CO2 Red by 2040 246$ 233$ 248$ 266$ 290$ 366$ 503$ 620$ 100 CO2 Red by 2040 246$ 233$ 247$ 265$ 290$ 394$ 1102$ 1269$ 100 CO2 Red by 2040 (w H2) 246$ 233$ 250$ 267$ 291$ 375$ 561$ 675$
Annual Revenue Requirement ($M)
Attachment D-1 E3 EPE Report Model Results June Page 34 of 34
Scenario Clean Energy Type 2021 2024 2025 2027 2031 2035 2040 2045Least-Cost (Reference Case) Renewable 4 12 22 23 28 35 36 40
Zero Carbon 62 68 77 76 79 81 77 75Least-Cost Case + ETA Resources Renewable 4 12 25 26 32 39 42 48
Zero Carbon 62 68 80 79 82 86 83 83Separate System Planning Renewable 4 12 23 23 28 39 42 46
Zero Carbon 62 68 78 77 78 85 83 81Separate System Planning (w H2) Renewable 4 12 24 24 29 36 41 45
Zero Carbon 62 68 79 78 80 82 83 80Low Load Growth Renewable 4 12 20 20 25 34 35 38
Zero Carbon 64 70 77 76 77 82 77 75High Load Growth Renewable 4 12 23 24 31 36 36 41
Zero Carbon 61 66 77 76 80 80 76 75High DG Renewable 4 13 22 24 29 35 37 40
Zero Carbon 63 70 78 77 79 82 78 76High DSM Renewable 4 12 19 20 23 33 34 37
Zero Carbon 63 69 76 75 75 82 78 75No New Gas Renewable 4 12 22 23 29 44 51 58
Zero Carbon 62 68 78 77 79 90 91 93No Lifetime Extensions Renewable 4 12 24 26 31 35 36 40
Zero Carbon 62 68 80 80 81 81 77 75High Gas Price Renewable 4 12 23 24 29 36 37 43
Zero Carbon 62 68 78 78 80 83 78 78Low Carbon Price Renewable 4 12 24 25 31 37 38 43
Zero Carbon 62 68 80 79 81 84 79 79Medium Carbon Price Renewable 4 12 27 28 33 39 41 46
Zero Carbon 62 68 83 82 83 86 82 81High Carbon Price Renewable 4 12 31 32 35 41 45 54
Zero Carbon 62 68 86 86 85 87 86 8980 Clean by 2035 Renewable 4 12 22 23 29 36 39 45
Zero Carbon 62 68 77 76 79 82 80 8020 CO2 Red by 2040 Renewable 4 12 22 23 29 35 36 43
Zero Carbon 62 68 77 76 79 81 77 7940 CO2 Red by 2040 Renewable 4 12 22 23 29 36 40 49
Zero Carbon 62 68 77 76 79 82 81 8460 CO2 Red by 2040 Renewable 4 12 22 23 29 35 46 54
Zero Carbon 62 68 77 76 79 82 87 8980 CO2 Red by 2040 Renewable 4 12 24 25 31 39 53 59
Zero Carbon 62 68 80 79 81 86 93 9490 CO2 Red by 2040 Renewable 4 12 24 25 31 42 56 62
Zero Carbon 62 68 80 79 81 88 97 97100 CO2 Red by 2040 Renewable 4 12 22 23 29 44 62 67
Zero Carbon 62 68 78 77 79 90 100 100100 CO2 Red by 2040 (w H2) Renewable 4 12 25 26 32 45 56 62
Zero Carbon 62 68 81 80 83 91 100 100
Clean Energy ( of Load)
Portfolio Analysis Results612021
El Paso Electric IRP
Modeling Update
Arne Olson Senior PartnerJack Moore Director
Joe Hooker Senior Managing ConsultantHuai Jiang Senior Consultant
Manu Mogadali Senior ConsultantChen Zhang Consultant
Attachment D-2 E-3 June IRP Presentation Page 1 of 37
2Confidential Draft
Agenda
Assumption updates
Updated Reference Case results
High DSM sensitivity results
New Mexico REA Requirements
New Mexico REA Scenario Results
Attachment D-2 E-3 June IRP Presentation Page 2 of 37
Assumption Updates
Attachment D-2 E-3 June IRP Presentation Page 3 of 37
4Confidential Draft
Unit Lifetime Extensions
E3 modeled unit lifetime extensions for the following units that are currently scheduled to retire prior to 2030
In the modeling unit extensions for Rio Grande 7 and Newman 2 are not selected but the other unit extensions are
Resource Planned Retirement Year
Extension Period
Capital + Fixed OampM
(2021 $kW-yr)Rio Grande 7 2022 5 years $11373Newman 1 2022 5 years $7859Newman 2 2022 5 years $7998Newman 3 2026 5 years $5812Newman 4 2026 5 years $4744
Attachment D-2 E-3 June IRP Presentation Page 4 of 37
5Confidential Draft
Planning Reserve Margin
The modeling assumes a 2-day-in-10-year reliability standard for 2025 as a transition to the more common 1-day-in-10-year reliability standard starting in 2030
Under this PRM all generators count toward the PRM based on their effective load carrying capability (ELCC)
Metric 2025 2030+
Reliability TargetTwo days with outages
every ten years on average (02 LOLE)
One day with outages every ten years on average (01 LOLE)
Target PCAP PRM 101 129
LOLE = Loss-of-Load Expectation PCAP = Perfect Capacity
Attachment D-2 E-3 June IRP Presentation Page 5 of 37
Updated Reference Case
Results
Attachment D-2 E-3 June IRP Presentation Page 6 of 37
7Confidential Draft
Scenarios and Sensitivities
Run Note Presented Previously
Presented Today
Least-Cost (Reference Case) Least-cost optimization used as reference case for all sensitivities
Least-Cost Case + REA Resources Additional resources added to Least-Cost Case for New Mexico REA
Separate System Planning New Mexico system planned separately for purposes of satisfying REA
Low Load Growth 3-4 higher native system load forecast
High Load Growth 3-4 lower native system load forecast
High DG High DG forecast
High DSM More smart thermostats doubling of energy efficiency
No New Gas No new gas after Newman 6
No Lifetime Extensions All plants retire as scheduled
High Gas Price Gas prices 15 higher
Low Carbon Price $8 per metric ton of CO2 in 2010 rising at 25 per year
Medium Carbon Price $20 per metric ton of CO2 in 2010 rising at 25 per year
High Carbon Price $40 per metric ton of CO2 in 2010 rising at 25 per year
80 Clean by 2035 80 zero-carbon energy
20 CO2 Red by 2040 20 reduction in CO2 emissions
40 CO2 Red by 2040 40 reduction in CO2 emissions
60 CO2 Red by 2040 60 reduction in CO2 emissions
80 CO2 Red by 2040 80 reduction in CO2 emissions
90 CO2 Red by 2040 90 reduction in CO2 emissions
100 CO2 Red by 2040 100 reduction in CO2 emissions
100 CO2 Red by 2040 (w H2) 100 reduction in CO2 emissions with hydrogen
Attachment D-2 E-3 June IRP Presentation Page 7 of 37
8Confidential Draft
Reference Case Additions and
Retirements
Total net additions by 2040
Storage ~1100 MW
Solar ~1500 MW
Wind ~100 MW
Gas (45) MW
DR = demand response BTM Solar = behind-the-meter solar
Attachment D-2 E-3 June IRP Presentation Page 8 of 37
9Confidential Draft
Reference Case Total Capacity
Total system capacity increases through 2045
bull Gas capacity declines 2027-2035 and then rises
bull Solar and storage capacity increase significantly
bull Wind and demand response increase more modestly
DR = demand response BTM Solar = behind-the-meter solar
Attachment D-2 E-3 June IRP Presentation Page 9 of 37
10Confidential Draft
Reference Case Annual Generation
BTM Solar = behind-the-meter solar
The amount of zero-carbon generation
increases markedly above current levels
Attachment D-2 E-3 June IRP Presentation Page 10 of 37
11Confidential Draft
Reference Case Effective Capacity
Load growth and resource
retirements together result in a
growing capacity need over time
which is met by a combination of
renewables storage demand
response and gas resources
Effective capacity is the amount of capacity that can be counted towards the PRM
Attachment D-2 E-3 June IRP Presentation Page 11 of 37
High DSM Sensitivity Results
Attachment D-2 E-3 June IRP Presentation Page 12 of 37
13Confidential Draft
High DSM Sensitivity Assumptions
Smart Thermostats Energy Efficiency
Base 50MW by 2040
High 60MW by 2040
Base 65 of native system load in 2040
High 13 of native system load in 2040
An incremental ~800 GWh in 2040 Corresponds to ~90 MW of savings on average throughout the year
Attachment D-2 E-3 June IRP Presentation Page 13 of 37
14Confidential Draft
High DSM Scenario Results
Change in Capacity Generation Mix
Attachment D-2 E-3 June IRP Presentation Page 14 of 37
New Mexico REA Requirements
Attachment D-2 E-3 June IRP Presentation Page 15 of 37
16Confidential Draft
New Mexico Renewable Energy Act
There are key requirements in the statutory language setting renewable energy and zero carbon requirements in New Mexico (emphasis added)
ldquoA public utility shall meet the renewable portfolio standard requirements as provided in this section to include renewable energy in its electric energy supply portfolio as demonstrated by its retirement of renewable energy certificates provided that the associated renewable energy is delivered to the public utility and assigned to the public utilitys New Mexico customershellip
(5) no later than January 1 2040 renewable energy resources shall supply no less than eighty percent of all retail sales of electricity in New Mexico provided that compliance with this standard until December 31 2047 shall not require the public utility to displace zero carbon resources in the utilitys generation portfolio on the effective date of this 2019 act and
(6) no later than January 1 2045 zero carbon resources shall supply one hundred percent of all retail sales of
electricity in New Mexico Reasonable and consistent progress shall be made over time toward this requirementrdquo
The scenarios analyzed consider multiple approaches for REA implementationbull Share of NM load served with renewable energy given that El Paso Electric serves NM load with
greater than 20 non-renewable zero-carbon resources (ie Palo Verde)
bull Annual vs hourly balancing periods for 100 zero-carbon generation
bull Whether combustion resources may be utilized to ensure reliability for NM customers
Attachment D-2 E-3 June IRP Presentation Page 16 of 37
17Confidential Draft
New Mexico REA Requirements in 2040+
The REA requires 80 RPS by 2040 unless doing so would require displacing existing zero-carbon generation
New Mexicorsquos share of Palo Verde 1 and 2 supplies 31 of New Mexicorsquos retail sales in 2040 and 27 in 2045
For purposes of IRP modeling El Paso Electric has directed E3 to require New Mexico zero-carbon generation (renewables + nuclear) to equal or exceed 100 of New Mexico retail sales or load starting in 2040
New Mexico Nuclear Generation amp Load
Nuclear Generation
Retail Sales
Total Load
Attachment D-2 E-3 June IRP Presentation Page 17 of 37
18Confidential Draft
Two Approaches for Modeling Zero-Carbon
Generation Balancing
bull New Mexico-allocated zero-carbon resources must generate enough energy on an annual basis to match the REA NM retail sales target
bull Natural gas resources andor imports can serve New Mexicorsquos energy needs in some hours if that generation is offset by additional zero-carbon generation in other hours
bull Annual balancing allows New Mexico customers to reap the benefits of being served by a larger system
Annual Balancing
bull New Mexico cannot receive power from gas resources or unspecified imports in any hour
bull Zero-carbon generation from New Mexico-allocated resources must serve New Mexico energy demand in all hours of the year
bull This would be a more stringent zero-carbon requirement as it would not allow for balancing between New Mexico and Texas resources
Hourly Balancing
NM-Allocated Resources
NM customers can be served by gas resources
and unspecified imports if offset in other hours
NM-Allocated Resources
Other Resources
NM customers cannot be served by gas resources
or unspecified imports an any hour
Attachment D-2 E-3 June IRP Presentation Page 18 of 37
19Confidential Draft
Two Approaches for Modeling Capacity
Pooling to Ensure Reliability
bull For reliability planning purposes NM and TX loads can be served by NM resources TX resources andor system resources
bull If the NM jurisdiction doesnrsquot have enough resources to satisfy load in an hour then it can rely on TX resources and vice versa
bull NM and TX customers must still pay for enough resources to satisfy their share of system reliability needs
Capacity Pooling Allowed
bull For planning purposes TX and NM must each have enough resources to ensure reliability across a range of potential conditions without relying on the other jurisdiction (ie on a standalone basis)
bull This would be a more stringent planning approach NM would need to plan to have enough resources without falling back on TX gas resources in some hours
Capacity Pooling NOT Allowed
NM-Allocated Resources
TX-Allocated Resources
NM-Allocated Resources
TX-Allocated Resources
All resources together ensure
systemwide reliability across all hours
subject to the reliability standard
For planning purposes each jurisdiction
ensures reliability on its own across all
hours subject to the reliability standard
Attachment D-2 E-3 June IRP Presentation Page 19 of 37
20Confidential Draft
New Mexico REA Scenarios and
Jurisdictional Allocation
E3 modeled a few scenarios with different approaches for how to satisfy the REA requirementsbull Different approaches of the REA requirements have meaningful implications on how
planning is performed for New Mexico customersbull The more stringent approaches of the REA requirements will result in higher system
costs relative to less stringent approaches
bull To ensure equitable treatment of customers across jurisdictions any incremental costs of satisfying the REA requirements would be allocated to New Mexico customers
For each scenario resources and costs are allocated between the New Mexico and Texas jurisdictionsbull The allocation of resources follows directly from a particular approach to modeling
REA compliance If a particular approach requires more resources to be added versus the least-cost case then those resources are allocated to the New Mexico jurisdiction
bull Capacity generation and cost for the New Mexico jurisdiction are presented for each scenario
Attachment D-2 E-3 June IRP Presentation Page 20 of 37
21Confidential Draft
Least Cost(ldquoLCrdquo)
Least Cost + REA Resources
(ldquoLC+REArdquo)
Separate System Planning
(ldquoSSPrdquo)
Portfoliooptimization
Least-cost system optimization
Reoptimize Least Cost to add additional renewables amp storage dedicated to NM to satisfy REA requirements
Optimize NM and TX systems independently
without modeling interactions between them
NM zero-carbon generation balancing period
Annual Annual Hourly
NM and TX capacity pooling to ensure reliability
Resource allocationResources allocated
proportionally more RECs allocated to NM
Incremental resources are allocated to New Mexico
Optimization identifies resources specifically for NM and TX jurisdictions
NM allocated new gas capacity
New Mexico REA Scenarios
More stringent REA interpretation
Attachment D-2 E-3 June IRP Presentation Page 21 of 37
New Mexico REA Scenario
Results
Attachment D-2 E-3 June IRP Presentation Page 22 of 37
23Confidential Draft
Least Cost(ldquoLCrdquo)
Least Cost + ETA Resources
(ldquoLC+ETArdquo)
Separate System Planning
(ldquoSSPrdquo)
Portfoliooptimization
Least-cost system optimization
Reoptimize Least Cost to add additional renewables amp storage dedicated to NM to satisfy ETA requirements
Optimize NM and TX systems independently
without modeling interactions between them
NM zero-carbon generation balancing period
Annual Annual Hourly
NM and TX capacity pooling to ensure reliability
Resource allocationResources allocated
proportionally more RECs allocated to NM
Incremental resources are allocated to New Mexico
Optimization identifies resources specifically for NM and TX jurisdictions
NM allocated new gas capacity
New Mexico REA Scenarios
Attachment D-2 E-3 June IRP Presentation Page 23 of 37
24Confidential Draft
Resource Portfolios and Costs by ScenarioLeast Cost Scenario
Total System New Mexico
This scenario allocates a share of new gas capacity to NM customers This capacity could be converted to run on a higher share of hydrogen fuel in the future More RECs would be allocated to NM customers to satisfy the REA
112 MW of new gas capacity is allocated to New Mexico customers by 2040
This analysis does not assume Palo Verde 3 generation is allocated to New Mexico resulting in a lower zero-carbon generation share than the rest of the system
Attachment D-2 E-3 June IRP Presentation Page 24 of 37
25Confidential Draft
Least Cost(ldquoLCrdquo)
Least Cost + REA Resources
(ldquoLC+REArdquo)
Separate System Planning
(ldquoSSPrdquo)
Portfoliooptimization
Least-cost system optimization
Reoptimize Least Cost to add additional renewables amp storage dedicated to NM to satisfy REA requirements
Optimize NM and TX systems independently
without modeling interactions between them
NM zero-carbon generation balancing period
Annual Annual Hourly
NM and TX capacity pooling to ensure reliability
Resource allocationResources allocated
proportionally more RECs allocated to NM
Incremental resources are allocated to New Mexico
Optimization identifies resources specifically for NM and TX jurisdictions
NM allocated new gas capacity
New Mexico REA Scenarios
Attachment D-2 E-3 June IRP Presentation Page 25 of 37
26Confidential Draft
Resource Portfolios and Costs by ScenarioLeast Cost + REA Scenario
Total System New Mexico
This scenario adds more solar and storage capacity for NM customers to satisfy the RPSREA targets while not allocating any new gas to NM customers This results in a modest cost increase vs Least Cost scenario
Gas generation serves a portion of New Mexico customersrsquo energy needs in some hours but that is more than offset by
Attachment D-2 E-3 June IRP Presentation Page 26 of 37
27Confidential Draft
New Mexico REA Scenarios
Least Cost(ldquoLCrdquo)
Least Cost + REA Resources
(ldquoLC+REArdquo)
Separate System Planning
(ldquoSSPrdquo)
Portfoliooptimization
Least-cost system optimization
Reoptimize Least Cost to add additional renewables amp storage dedicated to NM to satisfy REA requirements
Optimize NM and TX systems independently
without modeling interactions between them
NM zero-carbon generation balancing period
Annual Annual Hourly
NM and TX capacity pooling to ensure reliability
Resource allocationResources allocated
proportionally more RECs allocated to NM
Incremental resources are allocated to New Mexico
Optimization identifies resources specifically for NM and TX jurisdictions
NM allocated new gas capacity
Attachment D-2 E-3 June IRP Presentation Page 27 of 37
28Confidential Draft
Resource Portfolios and Costs by ScenarioSeparate System Planning Scenario
Total System New Mexico
This scenario requires significantly more resources for New Mexico to reach 100 absolute zero carbon and ensure reliability This results in a significant cost increase relative to the Least Cost scenario
Attachment D-2 E-3 June IRP Presentation Page 28 of 37
29Confidential Draft
Resource Portfolios and Costs by ScenarioSeparate System Planning (H2) Scenario
Total System New Mexico
Adding H2 capacity ensures reliability while significantly reducing solar and storage additions This mitigates cost impacts of achieving absolute zero carbon and planning to ensure reliability independently
Attachment D-2 E-3 June IRP Presentation Page 29 of 37
30Confidential Draft
New Mexico Capacity and CostLeast Cost Scenario
Least Cost Cost Impact vs Least Cost Scenario
The Least Cost scenario is the baseline for comparison Least
Cost
Attachment D-2 E-3 June IRP Presentation Page 30 of 37
31Confidential Draft
New Mexico Capacity and CostLeast Cost + REA Resources Scenario
Least Cost + REA Resources Cost Impact vs Least Cost Scenario
Least Cost + REA Resources
Least Cost
Attachment D-2 E-3 June IRP Presentation Page 31 of 37
32Confidential Draft
New Mexico Capacity and CostSeparate System Planning Scenario
Separate System Planning Cost Impact vs Least Cost Scenario
Least Cost + REA Resources
Separate System Planning
Least Cost
Attachment D-2 E-3 June IRP Presentation Page 32 of 37
33Confidential Draft
New Mexico Capacity and CostSeparate System Planning (H2) Scenario
Separate System Planning (H2) Cost Impact vs Least Cost Scenario
Least Cost + REA Resources
Separate System Planning (H2)
Separate System Planning
Least Cost
Attachment D-2 E-3 June IRP Presentation Page 33 of 37
34Confidential Draft
New Mexico Generation MixLeast Cost and Least Cost + REA Scenarios
Least Cost Least Cost + REA Resources
Attachment D-2 E-3 June IRP Presentation Page 34 of 37
35Confidential Draft
New Mexico Generation MixSeparate System Planning Scenarios
Separate System Planning Separate System Planning (H2)
Attachment D-2 E-3 June IRP Presentation Page 35 of 37
36Confidential Draft
Carbon Emissions Across Scenarios
CO2 Emissions in 2021 and 2040 Average Abatement Cost 2025-2040
Note emissions include emissions at company-owned facilities and emissions ascribed to imports2040
Attachment D-2 E-3 June IRP Presentation Page 36 of 37
Thank You
Thank You
Attachment D-2 E-3 June IRP Presentation Page 37 of 37
Attachment D-3 E3 EPE Report Model Results AugustPage 1 of 34
Scenario Resource Type 2021 2024 2025 2027 2031 2035 2040 2045Least-Cost (Reference Case) Nuclear (Palo Verde) 5148 5148 5148 5148 5148 5148 5148 5148
Nuclear (SMR) - - - - - - - - Gas - Steam Turbine 140 34 8 7 1 - - - Gas - Combined Cycle 1767 1373 1037 1148 1187 1075 1321 1513 Gas - Combustion Turbine 1027 1169 854 925 874 767 1251 1657 Biomass - - - - - - - - Geothermal - - - - - - - - Wind - - 354 357 361 316 381 730 Solar 289 952 1450 1467 2016 3050 3469 4199 Battery Storage - 12 (25) (26) (104) (215) (223) (248) Imports 391 336 266 261 296 278 360 440 Demand Response - - - - - - - - Hydrogen - - - - - - - - BTM Solar 37 135 165 225 344 460 601 763 Load 8771 9155 9258 9512 10123 10878 12308 14203 Excess Generation 14 130 416 397 431 636 374 456
Least-Cost Case + REA Resources Nuclear (Palo Verde) 5148 5148 5148 5148 5148 5148 5148 5148 Nuclear (SMR) - - - - - - - - Gas - Steam Turbine 140 34 4 11 1 - - - Gas - Combined Cycle 1767 1373 926 1001 1044 927 966 1101 Gas - Combustion Turbine 1027 1169 784 855 780 495 761 1005 Biomass - - - - - - - - Geothermal - - - - - - - - Wind - - 681 694 699 561 725 995 Solar 289 952 1340 1356 2030 3274 4121 5334 Battery Storage - 12 (29) (30) (105) (236) (277) (369) Imports 391 336 239 251 182 248 262 226 Demand Response - - - - - - - - Hydrogen - - - - - - - - BTM Solar 37 135 165 225 344 460 601 763 Load 8771 9155 9258 9512 10123 10878 12308 14203 Excess Generation 14 130 428 400 449 1144 1071 892
Separate System Planning Nuclear (Palo Verde) 5148 5148 5148 5148 5148 5148 5148 5148 Nuclear (SMR) - - - - - - - - Gas - Steam Turbine 140 34 1 2 - - - - Gas - Combined Cycle 1763 1385 1125 1238 1235 1000 1201 1349 Gas - Combustion Turbine 1048 1180 852 922 920 502 768 1046 Biomass - - - - - - - - Geothermal - - - - - - - - Wind - - 174 175 169 76 23 398 Solar 289 950 1556 1594 2135 3760 4704 5638 Battery Storage - 11 (55) (62) (129) (300) (367) (423) Imports 391 328 291 269 301 232 229 283 Demand Response - - - - - - - - Hydrogen - - - - - - - - BTM Solar 37 135 165 225 344 460 601 763 Load 8771 9155 9258 9512 10123 10878 12308 14203 Excess Generation 14 132 304 265 365 1270 2517 2452
Annual Energy (GWh)
Attachment D-3 E3 EPE Report Model Results AugustPage 2 of 34
Scenario Resource Type 2021 2024 2025 2027 2031 2035 2040 2045Annual Energy (GWh)
Separate System Planning (w H2) Nuclear (Palo Verde) 5148 5148 5148 5148 5148 5148 5148 5148 Nuclear (SMR) - - - - - - - - Gas - Steam Turbine 140 34 1 2 - - - - Gas - Combined Cycle 1763 1385 1101 1210 1223 1104 1199 1348 Gas - Combustion Turbine 1048 1180 843 915 870 762 793 1072 Biomass - - - - - - - - Geothermal - - - - - - - - Wind - - 214 215 207 202 285 678 Solar 289 950 1551 1588 2173 3139 4241 5147 Battery Storage - 11 (54) (61) (130) (221) (311) (365) Imports 391 328 288 270 288 285 278 331 Demand Response - - - - - - - - Hydrogen - - - - - - 74 80 BTM Solar 37 135 165 225 344 460 601 763 Load 8771 9155 9258 9512 10123 10878 12308 14203 Excess Generation 14 132 314 276 474 696 883 967
80 Clean by 2035 Nuclear (Palo Verde) 5148 5148 5148 5148 5148 5148 5148 5148 Nuclear (SMR) - - - - - - - - Gas - Steam Turbine 140 34 8 11 1 - - - Gas - Combined Cycle 1767 1373 1028 1131 1175 1088 1160 1293 Gas - Combustion Turbine 1027 1169 849 922 868 767 1055 1256 Biomass - - - - - - - - Geothermal - - - - - - - - Wind - - 378 381 385 342 650 1041 Solar 289 953 1450 1463 2012 3006 3689 4703 Battery Storage - 12 (24) (26) (103) (207) (238) (289) Imports 391 336 255 256 292 274 241 287 Demand Response - - - - - - - - Hydrogen - - - - - - - - BTM Solar 37 135 165 225 344 460 601 763 Load 8771 9155 9258 9512 10123 10878 12308 14203 Excess Generation 14 130 406 391 436 677 472 735
20 CO2 Red by 2040 Nuclear (Palo Verde) 5148 5148 5148 5148 5148 5148 5148 5148 Nuclear (SMR) - - - - - - - - Gas - Steam Turbine 140 34 8 11 1 - - - Gas - Combined Cycle 1767 1373 1027 1131 1175 1089 1253 1260 Gas - Combustion Turbine 1027 1169 849 922 868 765 1132 1187 Biomass - - - - - - - - Geothermal - - - - - - - - Wind - - 378 381 385 342 457 1095 Solar 289 953 1442 1456 2012 3007 3621 4792 Battery Storage - 12 (24) (26) (103) (207) (236) (297) Imports 391 336 264 264 292 275 332 255 Demand Response - - - - - - - - Hydrogen - - - - - - - - BTM Solar 37 135 165 225 344 460 601 763 Load 8771 9155 9258 9512 10123 10878 12308 14203 Excess Generation 14 129 415 398 436 676 463 752
Attachment D-3 E3 EPE Report Model Results AugustPage 3 of 34
Scenario Resource Type 2021 2024 2025 2027 2031 2035 2040 2045Annual Energy (GWh)
40 CO2 Red by 2040 Nuclear (Palo Verde) 5148 5148 5148 5148 5148 5148 5148 5148 Nuclear (SMR) - - - - - - - - Gas - Steam Turbine 140 34 8 11 1 - - - Gas - Combined Cycle 1767 1373 1027 1131 1175 1089 1060 1028 Gas - Combustion Turbine 1027 1169 849 922 868 767 790 822 Biomass - - - - - - - - Geothermal - - - - - - - - Wind - - 378 381 385 342 783 961 Solar 289 953 1441 1458 2013 3004 3980 5677 Battery Storage - 12 (24) (26) (103) (207) (264) (396) Imports 391 336 264 262 292 276 210 199 Demand Response - - - - - - - - Hydrogen - - - - - - - - BTM Solar 37 135 165 225 344 460 601 763 Load 8771 9155 9258 9512 10123 10878 12308 14203 Excess Generation 14 130 415 396 435 680 811 1196
60 CO2 Red by 2040 Nuclear (Palo Verde) 5148 5148 5148 5148 5148 5148 5148 5148 Nuclear (SMR) - - - - - - - - Gas - Steam Turbine 140 34 7 12 1 - - - Gas - Combined Cycle 1767 1373 1001 1093 1143 1029 780 735 Gas - Combustion Turbine 1027 1169 840 915 852 656 453 483 Biomass - - - - - - - - Geothermal - - - - - - - - Wind - - 444 448 451 388 853 808 Solar 289 953 1419 1436 2000 3174 4624 6588 Battery Storage - 12 (25) (26) (101) (226) (312) (488) Imports 391 336 259 260 286 250 161 166 Demand Response - - - - - - - - Hydrogen - - - - - - - - BTM Solar 37 135 165 225 344 460 601 763 Load 8771 9155 9258 9512 10123 10878 12308 14203 Excess Generation 14 129 411 390 452 766 1514 1850
80 CO2 Red by 2040 Nuclear (Palo Verde) 5148 5148 5148 5148 5148 5148 5148 5148 Nuclear (SMR) - - - - - - - - Gas - Steam Turbine 140 34 4 11 1 - - - Gas - Combined Cycle 1767 1373 914 986 1049 835 531 500 Gas - Combustion Turbine 1027 1169 771 842 725 399 127 142 Biomass - - - - - - - - Geothermal - - - - - - - - Wind - - 722 735 743 584 1310 1417 Solar 289 953 1329 1343 2004 3491 4869 6658 Battery Storage - 12 (31) (30) (102) (245) (342) (499) Imports 391 336 235 251 212 208 63 73 Demand Response - - - - - - - - Hydrogen - - - - - - - - BTM Solar 37 135 165 225 344 460 601 763 Load 8771 9155 9258 9512 10123 10878 12308 14203 Excess Generation 14 130 444 417 491 1350 2580 2939
Attachment D-3 E3 EPE Report Model Results AugustPage 4 of 34
Scenario Resource Type 2021 2024 2025 2027 2031 2035 2040 2045Annual Energy (GWh)
90 CO2 Red by 2040 Nuclear (Palo Verde) 5148 5148 5148 5148 5148 5148 5148 5148 Nuclear (SMR) - - - - - - - - Gas - Steam Turbine 140 34 4 11 2 - - - Gas - Combined Cycle 1767 1373 908 979 1009 778 304 290 Gas - Combustion Turbine 1027 1169 766 836 622 291 29 44 Biomass - - - - - - - - Geothermal - - - - - - - - Wind - - 740 754 763 513 1964 2116 Solar 289 952 1325 1339 2154 3842 4535 6263 Battery Storage - 12 (31) (30) (100) (278) (308) (453) Imports 391 336 232 250 182 125 35 32 Demand Response - - - - - - - - Hydrogen - - - - - - - - BTM Solar 37 135 165 225 344 460 601 763 Load 8771 9155 9258 9512 10123 10878 12308 14203 Excess Generation 14 130 452 424 650 1462 3356 3714
100 CO2 Red by 2040 (w H2) Nuclear (Palo Verde) 5148 5148 5148 5148 5148 5148 5148 5148 Nuclear (SMR) - - - - - - - - Gas - Steam Turbine 140 34 5 7 2 - - - Gas - Combined Cycle 1767 1373 860 928 924 643 - - Gas - Combustion Turbine 1027 1169 715 779 558 188 - - Biomass - - - - - - - - Geothermal - - - - - - - - Wind - - 896 917 922 557 1629 1685 Solar 289 952 1284 1297 2175 4069 4874 6693 Battery Storage - 12 (31) (32) (97) (302) (345) (509) Imports 391 336 215 242 148 114 - - Demand Response - - - - - - - - Hydrogen - - - - - - 400 423 BTM Solar 37 135 165 225 344 460 601 763 Load 8771 9155 9258 9512 10123 10878 12308 14203 Excess Generation 14 130 528 495 798 1795 3187 3597
100 CO2 Red by 2040 Nuclear (Palo Verde) 5148 5148 5148 5148 5148 5148 5148 5148 Nuclear (SMR) - - - - - - - - Gas - Steam Turbine 140 34 7 12 2 - - - Gas - Combined Cycle 1767 1373 1013 1110 924 643 - - Gas - Combustion Turbine 1027 1169 843 917 558 188 - - Biomass - - - - - - - - Geothermal - - - - - - - - Wind - - 416 419 922 557 1992 2629 Solar 289 952 1430 1445 2175 4069 4973 5542 Battery Storage - 12 (25) (26) (97) (302) (406) (572) Imports 391 336 260 261 148 114 - - Demand Response - - - - - - - - Hydrogen - - - - - - - - BTM Solar 37 135 165 225 344 460 601 1455 Load 8771 9155 9258 9512 10123 10878 12308 14203 Excess Generation 14 130 412 393 798 1795 11640 13062
Attachment D-3 E3 EPE Report Model Results AugustPage 5 of 34
Scenario Resource Type 2021 2024 2025 2027 2031 2035 2040 2045Annual Energy (GWh)
High DG Nuclear (Palo Verde) 5148 5148 5148 5148 5148 5148 5148 5148 Nuclear (SMR) - - - - - - - - Gas - Steam Turbine 134 31 9 12 1 - - - Gas - Combined Cycle 1728 1317 1044 1144 1175 1073 1273 1538 Gas - Combustion Turbine 1028 1123 885 923 846 711 1096 1713 Biomass - - - - - - - - Geothermal - - - - - - - - Wind - - 338 336 341 295 352 763 Solar 285 866 1148 1107 1485 2336 2661 2700 Battery Storage - 11 (25) (25) (105) (226) (249) (243) Imports 389 314 273 258 287 265 347 441 Demand Response - - - - - - - - Hydrogen - - - - - - - - BTM Solar 88 350 436 608 945 1276 1680 2144 Load 8771 9155 9258 9512 10123 10878 12308 14203 Excess Generation 18 217 389 432 552 696 602 379
High DSM Nuclear (Palo Verde) 5148 5148 5148 5148 5148 5148 5148 5148 Nuclear (SMR) - - - - - - - - Gas - Steam Turbine 133 30 2 3 0 - - - Gas - Combined Cycle 1744 1303 1197 1315 1357 1105 1320 1460 Gas - Combustion Turbine 1020 1111 977 1001 989 706 1104 1404 Biomass - - - - - - - - Geothermal - - - - - - - - Wind - - - - - - - 471 Solar 288 934 1274 1273 1604 2760 3166 3725 Battery Storage - 10 (25) (23) (80) (203) (216) (234) Imports 390 329 318 286 318 297 377 438 Demand Response - - - - - - - - Hydrogen - - - - - - - - BTM Solar 37 135 165 225 344 460 601 763 Load 8731 8994 9056 9230 9680 10273 11501 13177 Excess Generation 15 148 197 197 215 541 326 371
Low Load Nuclear (Palo Verde) 5148 5148 5148 5148 5148 5148 5148 5148 Nuclear (SMR) - - - - - - - - Gas - Steam Turbine 101 27 2 3 2 - - - Gas - Combined Cycle 1596 1244 1155 1300 1422 1129 1372 1496 Gas - Combustion Turbine 983 1065 942 985 1034 759 1214 1529 Biomass - - - - - - - - Geothermal - - - - - - - - Wind - - - - - - - 523 Solar 282 919 1260 1272 1563 2869 3314 3970 Battery Storage - 8 (26) (24) (69) (209) (222) (246) Imports 381 325 311 284 315 303 385 440 Demand Response - - - - - - - - Hydrogen - - - - - - - - BTM Solar 37 135 165 225 344 460 601 763 Load 8492 8862 8958 9194 9759 10459 11813 13623 Excess Generation 22 163 216 205 224 535 317 399
Attachment D-3 E3 EPE Report Model Results AugustPage 6 of 34
Scenario Resource Type 2021 2024 2025 2027 2031 2035 2040 2045Annual Energy (GWh)
High Load Nuclear (Palo Verde) 5148 5148 5148 5148 5148 5148 5148 5148 Nuclear (SMR) - - - - - - - - Gas - Steam Turbine 195 50 7 3 - - - - Gas - Combined Cycle 1909 1522 1077 1166 1126 1113 1386 1518 Gas - Combustion Turbine 1088 1256 889 937 786 875 1409 1781 Biomass - - - - - - - - Geothermal - - - - - - - - Wind - - 420 424 404 387 450 957 Solar 293 983 1618 1717 2556 3249 3659 4426 Battery Storage - 14 (42) (64) (158) (220) (224) (251) Imports 400 343 275 273 281 286 373 440 Demand Response - - - - - - - - Hydrogen - - - - - - - - BTM Solar 37 135 165 225 344 460 601 763 Load 9050 9448 9558 9830 10488 11297 12803 14784 Excess Generation 10 100 381 278 543 642 387 518
No Lifetime Extensions Nuclear (Palo Verde) 5148 5148 5148 5148 5148 5148 5148 5148 Nuclear (SMR) - - - - - - - - Gas - Steam Turbine 140 34 12 2 - - - - Gas - Combined Cycle 1767 1373 972 1029 1055 1069 1314 1513 Gas - Combustion Turbine 1027 1169 744 693 636 764 1246 1657 Biomass - - - - - - - - Geothermal - - - - - - - - Wind - - 364 369 340 337 408 730 Solar 289 952 1643 1894 2495 3039 3457 4199 Battery Storage - 12 (26) (92) (164) (214) (223) (248) Imports 391 336 235 243 270 276 357 440 Demand Response - - - - - - - - Hydrogen - - - - - - - - BTM Solar 37 135 165 225 344 460 601 763 Load 8771 9155 9258 9512 10123 10878 12308 14203 Excess Generation 14 130 669 413 585 637 371 456
No New Gas Nuclear (Palo Verde) 5148 5148 5148 5148 5148 5148 5148 5148 Nuclear (SMR) - - - - - - - - Gas - Steam Turbine 140 34 7 12 1 - - - Gas - Combined Cycle 1767 1373 1013 1110 1156 829 774 714 Gas - Combustion Turbine 1027 1169 843 917 859 294 269 286 Biomass - - - - - - - - Geothermal - - - - - - - - Wind - - 416 419 423 227 195 209 Solar 289 952 1430 1445 2002 4003 5562 7483 Battery Storage - 12 (25) (26) (102) (320) (460) (623) Imports 391 336 260 261 293 237 219 223 Demand Response - - - - - - - - Hydrogen - - - - - - - - BTM Solar 37 135 165 225 344 460 601 763 Load 8771 9155 9258 9512 10123 10878 12308 14203 Excess Generation 14 130 412 393 449 1709 2222 2760
Attachment D-3 E3 EPE Report Model Results AugustPage 7 of 34
Scenario Resource Type 2021 2024 2025 2027 2031 2035 2040 2045Annual Energy (GWh)
Low Carbon Price Nuclear (Palo Verde) 5148 5148 5148 5148 5148 5148 5148 5148 Nuclear (SMR) - - - - - - - - Gas - Steam Turbine 127 23 4 5 1 - - - Gas - Combined Cycle 1803 1433 1000 1092 1104 988 1204 1335 Gas - Combustion Turbine 1001 1107 776 839 788 598 1076 1338 Biomass - - - - - - - - Geothermal - - - - - - - - Wind - - 562 571 569 479 581 943 Solar 289 958 1390 1406 1988 3174 3609 4556 Battery Storage - 11 (30) (29) (104) (228) (238) (278) Imports 394 345 242 255 285 258 326 397 Demand Response - - - - - - - - Hydrogen - - - - - - - - BTM Solar 37 135 165 225 344 460 601 763 Load 8771 9155 9258 9512 10123 10878 12308 14203 Excess Generation 14 125 403 379 473 835 521 718
Mid Carbon Price Nuclear (Palo Verde) 5148 5148 5148 5148 5148 5148 5148 5148 Nuclear (SMR) - - - - - - - - Gas - Steam Turbine 120 22 3 4 1 - - - Gas - Combined Cycle 1822 1496 923 994 1017 922 1107 1275 Gas - Combustion Turbine 983 1036 596 663 681 475 938 1205 Biomass - - - - - - - - Geothermal - - - - - - - - Wind - - 771 794 801 650 804 1099 Solar 290 961 1474 1493 2020 3264 3720 4732 Battery Storage - 7 (35) (36) (101) (230) (245) (291) Imports 399 354 212 227 211 190 235 273 Demand Response - - - - - - - - Hydrogen - - - - - - - - BTM Solar 37 135 165 225 344 460 601 763 Load 8771 9155 9258 9512 10123 10878 12308 14203 Excess Generation 13 121 615 574 500 912 572 727
High Carbon Price Nuclear (Palo Verde) 5148 5148 5148 5148 5148 5148 5148 5148 Nuclear (SMR) - - - - - - - - Gas - Steam Turbine 119 21 3 3 2 - - - Gas - Combined Cycle 1835 1540 704 778 913 873 962 863 Gas - Combustion Turbine 962 989 447 494 545 394 614 583 Biomass - - - - - - - - Geothermal - - - - - - - - Wind - - 881 916 965 778 930 859 Solar 290 963 1760 1782 2130 3267 4138 6248 Battery Storage - 2 (37) (36) (98) (230) (275) (458) Imports 408 362 187 203 174 188 189 195 Demand Response - - - - - - - - Hydrogen - - - - - - - - BTM Solar 37 135 165 225 344 460 601 763 Load 8771 9155 9258 9512 10123 10878 12308 14203 Excess Generation 13 120 1146 1089 774 1061 1077 1549
Attachment D-3 E3 EPE Report Model Results AugustPage 8 of 34
Scenario Resource Type 2021 2024 2025 2027 2031 2035 2040 2045Annual Energy (GWh)
High Gas Price Nuclear (Palo Verde) 5148 5148 5148 5148 5148 5148 5148 5148 Nuclear (SMR) - - - - - - - - Gas - Steam Turbine 125 31 6 5 1 - - - Gas - Combined Cycle 1787 1400 1015 1115 1125 1015 1242 1350 Gas - Combustion Turbine 1008 1120 803 853 805 627 1127 1365 Biomass - - - - - - - - Geothermal - - - - - - - - Wind - - 444 448 451 387 467 924 Solar 290 956 1419 1435 1998 3161 3603 4486 Battery Storage - 9 (29) (28) (103) (224) (235) (274) Imports 403 360 287 309 355 303 354 440 Demand Response - - - - - - - - Hydrogen - - - - - - - - BTM Solar 37 135 165 225 344 460 601 763 Load 8771 9155 9258 9512 10123 10878 12308 14203 Excess Generation 13 127 411 390 455 783 483 702
Low Renewable and Storage Costs Nuclear (Palo Verde) 5148 5148 5148 5148 5148 5148 5148 5148 Nuclear (SMR) - - - - - - - - Gas - Steam Turbine 140 34 3 6 1 - - - Gas - Combined Cycle 1767 1373 984 1068 1096 1000 1220 1278 Gas - Combustion Turbine 1027 1169 842 925 824 652 1127 1243 Biomass - - - - - - - - Geothermal - - - - - - - - Wind - - 558 564 559 474 578 1026 Solar 289 952 1321 1330 1975 3102 3538 4621 Battery Storage - 12 (29) (29) (102) (221) (232) (288) Imports 391 336 265 275 279 262 328 411 Demand Response - - - - - - - - Hydrogen - - - - - - - - BTM Solar 37 135 165 225 344 460 601 763 Load 8771 9155 9258 9512 10123 10878 12308 14203 Excess Generation 14 130 324 309 486 807 490 896
Attachment D-3 E3 EPE Report Model Results AugustPage 9 of 34
Scenario Resource TypeLeast-Cost (Reference Case) Nuclear (Palo Verde)
Nuclear (SMR)Gas - Steam TurbineGas - Combined CycleGas - Combustion TurbineBiomassGeothermalWindSolarBattery StorageImportsDemand ResponseHydrogenBTM SolarLoadExcess Generation
Least-Cost Case + REA Resources Nuclear (Palo Verde)Nuclear (SMR)Gas - Steam TurbineGas - Combined CycleGas - Combustion TurbineBiomassGeothermalWindSolarBattery StorageImportsDemand ResponseHydrogenBTM SolarLoadExcess Generation
Separate System Planning Nuclear (Palo Verde)Nuclear (SMR)Gas - Steam TurbineGas - Combined CycleGas - Combustion TurbineBiomassGeothermalWindSolarBattery StorageImportsDemand ResponseHydrogenBTM SolarLoadExcess Generation
2021 2024 2025 2027 2031 2035 2040 2045622 622 622 622 622 622 622 622 - - - - - - - - 426 307 307 307 234 - - - 493 493 493 493 493 266 266 266 503 731 731 731 668 870 1059 1216 - - - - - - - - - - - - - - - - - - 102 102 102 102 102 197 115 385 621 621 823 1235 1309 1561 - 50 177 177 488 1029 1129 1277 - - - - - - - - 46 53 56 61 71 81 93 93
- - - - - - - - 18 65 80 108 166 221 289 368
- - - - - - - - - - - - - - - - 622 622 622 622 622 622 622 622 - - - - - - - - 426 307 307 307 234 - - - 493 493 493 493 493 266 266 266 503 731 731 731 668 809 942 1051 - - - - - - - - - - - - - - - - - - 203 203 203 203 232 300 115 385 544 544 795 1414 1693 2037 - 50 176 177 460 1067 1246 1682 - - - - - - - - 46 53 56 61 71 81 93 93
- - - - - - - - 18 65 80 108 166 221 289 368
- - - - - - - - - - - - - - - - 622 622 622 622 622 622 622 622 - - - - - - - - 426 307 307 307 234 - - - 493 493 493 493 493 266 266 266 503 731 731 731 668 755 755 864 - - - - - - - - - - - - - - - - - - 49 49 49 49 49 161 115 385 639 639 859 1701 2450 2712 - 50 280 304 591 1514 2344 2674 - - - - - - - - 46 53 56 61 71 81 93 93
- - - - - - - - 18 65 80 108 166 221 289 368
- - - - - - - - - - - - - - - -
Installed Capacity (MW)
Attachment D-3 E3 EPE Report Model Results AugustPage 10 of 34
Scenario Resource TypeSeparate System Planning (w H2) Nuclear (Palo Verde)
Nuclear (SMR)Gas - Steam TurbineGas - Combined CycleGas - Combustion TurbineBiomassGeothermalWindSolarBattery StorageImportsDemand ResponseHydrogenBTM SolarLoadExcess Generation
80 Clean by 2035 Nuclear (Palo Verde)Nuclear (SMR)Gas - Steam TurbineGas - Combined CycleGas - Combustion TurbineBiomassGeothermalWindSolarBattery StorageImportsDemand ResponseHydrogenBTM SolarLoadExcess Generation
20 CO2 Red by 2040 Nuclear (Palo Verde)Nuclear (SMR)Gas - Steam TurbineGas - Combined CycleGas - Combustion TurbineBiomassGeothermalWindSolarBattery StorageImportsDemand ResponseHydrogenBTM SolarLoadExcess Generation
2021 2024 2025 2027 2031 2035 2040 2045Installed Capacity (MW)
622 622 622 622 622 622 622 622 - - - - - - - - 426 307 307 307 234 - - - 493 493 493 493 493 266 266 266 503 731 731 731 668 755 755 864 - - - - - - - - - - - - - - - - - - 60 60 60 60 107 218 115 385 638 638 905 1312 1724 2031 - 50 278 303 570 1057 1496 1797 - - - - - - - - 46 53 56 61 71 81 93 93
- - - - - 123 206 212 18 65 80 108 166 221 289 368
- - - - - - - - - - - - - - - - 622 622 622 622 622 622 622 622 - - - - - - - - 426 307 307 307 234 - - - 493 493 493 493 493 266 266 266 503 731 731 731 668 910 1022 1149 - - - - - - - - - - - - - - - - - - 109 109 109 109 185 289 115 385 615 615 821 1233 1383 1799 - 50 177 177 486 968 1145 1327 - - - - - - - - 46 53 56 61 71 81 93 93
- - - - - - - - 18 65 80 108 166 221 289 368
- - - - - - - - - - - - - - - - 622 622 622 622 622 622 622 622 - - - - - - - - 426 307 307 307 234 - - - 493 493 493 493 493 266 266 266 503 731 731 731 668 910 1036 1138 - - - - - - - - - - - - - - - - - - 109 109 109 109 125 300 115 385 615 615 821 1233 1383 1837 - 50 177 177 486 968 1145 1359 - - - - - - - - 46 53 56 61 71 81 93 93
- - - - - - - - 18 65 80 108 166 221 289 368
- - - - - - - - - - - - - - - -
Attachment D-3 E3 EPE Report Model Results AugustPage 11 of 34
Scenario Resource Type40 CO2 Red by 2040 Nuclear (Palo Verde)
Nuclear (SMR)Gas - Steam TurbineGas - Combined CycleGas - Combustion TurbineBiomassGeothermalWindSolarBattery StorageImportsDemand ResponseHydrogenBTM SolarLoadExcess Generation
60 CO2 Red by 2040 Nuclear (Palo Verde)Nuclear (SMR)Gas - Steam TurbineGas - Combined CycleGas - Combustion TurbineBiomassGeothermalWindSolarBattery StorageImportsDemand ResponseHydrogenBTM SolarLoadExcess Generation
80 CO2 Red by 2040 Nuclear (Palo Verde)Nuclear (SMR)Gas - Steam TurbineGas - Combined CycleGas - Combustion TurbineBiomassGeothermalWindSolarBattery StorageImportsDemand ResponseHydrogenBTM SolarLoadExcess Generation
2021 2024 2025 2027 2031 2035 2040 2045Installed Capacity (MW)
622 622 622 622 622 622 622 622 - - - - - - - - 426 307 307 307 234 - - - 493 493 493 493 493 266 266 266 503 731 731 731 668 909 973 1022 - - - - - - - - - - - - - - - - - - 109 109 109 109 239 300 115 385 615 615 821 1234 1563 2248 - 50 177 177 486 969 1184 1746 - - - - - - - - 46 53 56 61 71 81 93 93
- - - - - - - - 18 65 80 108 166 221 289 368
- - - - - - - - - - - - - - - - 622 622 622 622 622 622 622 622 - - - - - - - - 426 307 307 307 234 - - - 493 493 493 493 493 266 266 266 503 731 731 731 668 849 892 897 - - - - - - - - - - - - - - - - - - 128 128 128 128 301 302 115 385 599 599 816 1309 1965 2744 - 50 177 177 481 1044 1347 2145 - - - - - - - - 46 53 56 61 71 81 93 93
- - - - - - - - 18 65 80 108 166 221 289 368
- - - - - - - - - - - - - - - - 622 622 622 622 622 622 622 622 - - - - - - - - 426 307 307 307 234 - - - 493 493 493 493 493 266 266 266 503 731 731 731 668 778 778 778 - - - - - - - - - - - - - - - - - - 217 217 217 217 552 585 115 385 538 538 793 1555 2257 3007 - 50 176 177 458 1097 1645 2461 - - - - - - - - 46 53 56 61 71 81 93 93
- - - - - - - - 18 65 80 108 166 221 289 368
- - - - - - - - - - - - - - - -
Attachment D-3 E3 EPE Report Model Results AugustPage 12 of 34
Scenario Resource Type90 CO2 Red by 2040 Nuclear (Palo Verde)
Nuclear (SMR)Gas - Steam TurbineGas - Combined CycleGas - Combustion TurbineBiomassGeothermalWindSolarBattery StorageImportsDemand ResponseHydrogenBTM SolarLoadExcess Generation
100 CO2 Red by 2040 (w H2) Nuclear (Palo Verde)Nuclear (SMR)Gas - Steam TurbineGas - Combined CycleGas - Combustion TurbineBiomassGeothermalWindSolarBattery StorageImportsDemand ResponseHydrogenBTM SolarLoadExcess Generation
100 CO2 Red by 2040 Nuclear (Palo Verde)Nuclear (SMR)Gas - Steam TurbineGas - Combined CycleGas - Combustion TurbineBiomassGeothermalWindSolarBattery StorageImportsDemand ResponseHydrogenBTM SolarLoadExcess Generation
2021 2024 2025 2027 2031 2035 2040 2045Installed Capacity (MW)
622 622 622 622 622 622 622 622 - - - - - - - - 426 307 307 307 234 - - - 493 493 493 493 493 266 266 266 503 731 731 731 668 726 726 726 - - - - - - - - - - - - - - - - - - 224 224 224 224 801 828 115 385 535 535 901 1679 2300 3049 - 50 176 177 452 1284 1777 2595 - - - - - - - - 46 53 56 61 71 81 93 93
- - - - - - - - 18 65 80 108 166 221 289 368
- - - - - - - - - - - - - - - - 622 622 622 622 622 622 622 622 - - - - - - - - 426 307 307 307 234 - - - 493 493 493 493 493 266 - - 503 731 731 731 668 688 - - - - - - - - - - - - - - - - - - - - 282 282 282 282 682 696 115 385 512 512 925 1801 2403 3178 - 50 176 177 445 1385 1955 2797 - - - - - - - - 46 53 56 61 71 81 93 93
- - - - - - 954 954 18 65 80 108 166 221 289 368
- - - - - - - - - - - - - - - - 622 622 622 622 622 622 622 622 - - - - - - - - 426 307 307 307 234 - - - 493 493 493 493 493 266 266 266 503 731 731 731 668 688 668 668 - - - - - - - - - - - - - - - - - - 120 120 282 282 1216 1605 115 385 606 606 925 1801 4851 5217 - 50 177 177 445 1385 6191 7470 - - - - - - - - 46 53 56 61 71 81 93 93
- - - - - - - - 18 65 80 108 166 221 289 701
- - - - - - - - - - - - - - - -
Attachment D-3 E3 EPE Report Model Results AugustPage 13 of 34
Scenario Resource TypeHigh DG Nuclear (Palo Verde)
Nuclear (SMR)Gas - Steam TurbineGas - Combined CycleGas - Combustion TurbineBiomassGeothermalWindSolarBattery StorageImportsDemand ResponseHydrogenBTM SolarLoadExcess Generation
High DSM Nuclear (Palo Verde)Nuclear (SMR)Gas - Steam TurbineGas - Combined CycleGas - Combustion TurbineBiomassGeothermalWindSolarBattery StorageImportsDemand ResponseHydrogenBTM SolarLoadExcess Generation
Low Load Nuclear (Palo Verde)Nuclear (SMR)Gas - Steam TurbineGas - Combined CycleGas - Combustion TurbineBiomassGeothermalWindSolarBattery StorageImportsDemand ResponseHydrogenBTM SolarLoadExcess Generation
2021 2024 2025 2027 2031 2035 2040 2045Installed Capacity (MW)
622 622 622 622 622 622 622 622 - - - - - - - - 426 307 307 307 234 - - - 493 493 493 493 493 266 266 266 503 731 731 731 668 860 1026 1228 - - - - - - - - - - - - - - - - - - 96 96 96 96 96 203 115 385 511 511 684 1010 1107 1018 - 50 176 176 479 1041 1166 1263 - - - - - - - - 46 53 56 61 71 81 93 93
- - - - - - - - 42 169 210 293 455 614 809 1032
- - - - - - - - - - - - - - - - 622 622 622 622 622 622 622 622 - - - - - - - - 426 307 307 307 234 - - - 493 493 493 493 493 266 266 266 503 731 731 731 668 778 942 1058 - - - - - - - - - - - - - - - - - - - - - - - 128 115 385 519 519 638 1149 1212 1386 - 50 184 184 406 1001 1091 1213 - - - - - - - - 49 66 71 82 100 101 103 103
- - - - - - - - 18 65 80 108 166 221 289 368
- - - - - - - - - - - - - - - - 622 622 622 622 622 622 622 622 - - - - - - - - 426 307 307 307 234 - - - 493 493 493 493 493 266 266 266 503 731 731 731 668 724 896 1019 - - - - - - - - - - - - - - - - - - - - - - - 141 115 385 521 521 628 1185 1261 1477 - 50 186 186 355 1019 1121 1262 - - - - - - - - 46 53 56 61 71 81 93 93
- - - - - - - - 18 65 80 108 166 221 289 368
- - - - - - - - - - - - - - - -
Attachment D-3 E3 EPE Report Model Results AugustPage 14 of 34
Scenario Resource TypeHigh Load Nuclear (Palo Verde)
Nuclear (SMR)Gas - Steam TurbineGas - Combined CycleGas - Combustion TurbineBiomassGeothermalWindSolarBattery StorageImportsDemand ResponseHydrogenBTM SolarLoadExcess Generation
No Lifetime Extensions Nuclear (Palo Verde)Nuclear (SMR)Gas - Steam TurbineGas - Combined CycleGas - Combustion TurbineBiomassGeothermalWindSolarBattery StorageImportsDemand ResponseHydrogenBTM SolarLoadExcess Generation
No New Gas Nuclear (Palo Verde)Nuclear (SMR)Gas - Steam TurbineGas - Combined CycleGas - Combustion TurbineBiomassGeothermalWindSolarBattery StorageImportsDemand ResponseHydrogenBTM SolarLoadExcess Generation
2021 2024 2025 2027 2031 2035 2040 2045Installed Capacity (MW)
622 622 622 622 622 622 622 622 - - - - - - - - 426 307 307 307 234 - - - 493 493 493 493 493 266 266 266 503 731 731 731 668 1043 1247 1411 - - - - - - - - - - - - - - - - - - 119 119 119 119 119 260 115 385 662 662 1040 1304 1377 1643 - 50 235 327 708 1042 1142 1292 - - - - - - - - 46 53 56 61 71 81 93 93
- - - - - - - - 18 65 80 108 166 221 289 368
- - - - - - - - - - - - - - - - 622 622 622 622 622 622 622 622 - - - - - - - - 426 234 234 144 144 - - - 493 493 493 266 266 266 266 266 503 731 731 829 766 869 1058 1216 - - - - - - - - - - - - - - - - - - 109 109 109 109 109 197 115 385 767 767 1027 1229 1302 1561 - 50 183 432 756 1027 1128 1277 - - - - - - - - 46 53 56 61 71 81 93 93
- - - - - - - - 18 65 80 108 166 221 289 368
- - - - - - - - - - - - - - - - 622 622 622 622 622 622 622 622 - - - - - - - - 426 307 307 307 234 - - - 493 493 493 493 493 266 266 266 503 731 731 731 668 668 668 668 - - - - - - - - - - - - - - - - - - 120 120 120 120 120 132 115 385 606 606 818 1876 2580 3422 - 50 177 177 483 1585 2342 3200 - - - - - - - - 46 53 56 61 71 81 93 93
- - - - - - - - 18 65 80 108 166 221 289 368
- - - - - - - - - - - - - - - -
Attachment D-3 E3 EPE Report Model Results AugustPage 15 of 34
Scenario Resource TypeLow Carbon Price Nuclear (Palo Verde)
Nuclear (SMR)Gas - Steam TurbineGas - Combined CycleGas - Combustion TurbineBiomassGeothermalWindSolarBattery StorageImportsDemand ResponseHydrogenBTM SolarLoadExcess Generation
Mid Carbon Price Nuclear (Palo Verde)Nuclear (SMR)Gas - Steam TurbineGas - Combined CycleGas - Combustion TurbineBiomassGeothermalWindSolarBattery StorageImportsDemand ResponseHydrogenBTM SolarLoadExcess Generation
High Carbon Price Nuclear (Palo Verde)Nuclear (SMR)Gas - Steam TurbineGas - Combined CycleGas - Combustion TurbineBiomassGeothermalWindSolarBattery StorageImportsDemand ResponseHydrogenBTM SolarLoadExcess Generation
2021 2024 2025 2027 2031 2035 2040 2045Installed Capacity (MW)
622 622 622 622 622 622 622 622 - - - - - - - - 426 307 307 307 234 - - - 493 493 493 493 493 266 266 266 503 731 731 731 668 840 1027 1164 - - - - - - - - - - - - - - - - - - 163 163 163 163 163 269 115 385 573 573 805 1309 1383 1738 - 50 176 176 470 1044 1145 1314 - - - - - - - - 46 53 56 61 71 81 93 93
- - - - - - - - 18 65 80 108 166 221 289 368
- - - - - - - - - - - - - - - - 622 622 622 622 622 622 622 622 - - - - - - - - 426 307 307 307 234 - - - 493 493 493 493 493 266 266 266 503 731 731 731 668 824 1006 1145 - - - - - - - - - - - - - - - - - - 238 238 238 238 238 300 115 385 633 633 791 1310 1400 1808 - 50 176 176 456 1045 1149 1334 - - - - - - - - 46 53 56 61 71 81 93 93
- - - - - - - - 18 65 80 108 166 221 289 368
- - - - - - - - - - - - - - - - 622 622 622 622 622 622 622 622 - - - - - - - - 426 307 307 307 234 - - - 493 493 493 493 493 266 266 266 503 731 731 731 668 817 944 944 - - - - - - - - - - - - - - - - - - 300 300 300 300 300 301 115 385 857 857 886 1310 1666 2536 - 50 176 176 445 1045 1206 2000 - - - - - - - - 46 53 56 61 71 81 93 93
- - - - - - - - 18 65 80 108 166 221 289 368
- - - - - - - - - - - - - - - -
Attachment D-3 E3 EPE Report Model Results AugustPage 16 of 34
Scenario Resource TypeHigh Gas Price Nuclear (Palo Verde)
Nuclear (SMR)Gas - Steam TurbineGas - Combined CycleGas - Combustion TurbineBiomassGeothermalWindSolarBattery StorageImportsDemand ResponseHydrogenBTM SolarLoadExcess Generation
Low Renewable and Storage Costs Nuclear (Palo Verde)Nuclear (SMR)Gas - Steam TurbineGas - Combined CycleGas - Combustion TurbineBiomassGeothermalWindSolarBattery StorageImportsDemand ResponseHydrogenBTM SolarLoadExcess Generation
2021 2024 2025 2027 2031 2035 2040 2045Installed Capacity (MW)
622 622 622 622 622 622 622 622 - - - - - - - - 426 307 307 307 234 - - - 493 493 493 493 493 266 266 266 503 731 731 731 668 848 1036 1170 - - - - - - - - - - - - - - - - - - 128 128 128 128 128 264 115 385 599 599 816 1309 1383 1710 - 50 177 177 481 1044 1145 1309 - - - - - - - - 46 53 56 61 71 81 93 93
- - - - - - - - 18 65 80 108 166 221 289 368
- - - - - - - - - - - - - - - - 622 622 622 622 622 622 622 622 - - - - - - - - 426 307 307 307 234 - - - 493 493 493 493 493 266 266 266 503 731 731 731 668 847 1034 1146 - - - - - - - - - - - - - - - - - - 160 160 160 160 160 300 115 385 525 525 806 1277 1351 1805 - 50 190 190 471 1037 1138 1335 - - - - - - - - 46 53 56 61 71 81 93 93
- - - - - - - - 18 65 80 108 166 221 289 368
- - - - - - - - - - - - - - - -
Attachment D-3 E3 EPE Report Model Results AugustPage 17 of 34
Scenario Resource TypeLeast-Cost (Reference Case) Nuclear (Palo Verde)
Nuclear (SMR)Gas - Steam TurbineGas - Combined CycleGas - Combustion TurbineBiomassGeothermalWindSolarBattery StorageImportsDemand ResponseHydrogenBTM SolarLoadExcess Generation
Least-Cost Case + REA Resources Nuclear (Palo Verde)Nuclear (SMR)Gas - Steam TurbineGas - Combined CycleGas - Combustion TurbineBiomassGeothermalWindSolarBattery StorageImportsDemand ResponseHydrogenBTM SolarLoadExcess Generation
Separate System Planning Nuclear (Palo Verde)Nuclear (SMR)Gas - Steam TurbineGas - Combined CycleGas - Combustion TurbineBiomassGeothermalWindSolarBattery StorageImportsDemand ResponseHydrogenBTM SolarLoadExcess Generation
2021 2024 2025 2027 2031 2035 2040 2045- - - - - - - - - - - - - - - - - - - - - - - - - - - - - - - - - 228 228 228 228 430 619 776 - - - - - - - - - - - - - - - - - - 102 102 102 102 102 197 - 270 506 506 708 1190 1291 1823 - 50 177 177 488 1029 1129 1327 - - - - - - - - 46 53 56 61 71 81 93 93
- - - - - - - - 18 65 80 108 166 221 289 368
- - - - - - - - - - - - - - - - - - - - - - - - - - - - - - - - - - - - - - - - - - - - - - - - - 228 228 228 228 369 502 611 - - - - - - - - - - - - - - - - - - 203 203 203 203 232 300 - 270 429 429 680 1369 1675 2299 - 50 176 177 460 1067 1246 1732 - - - - - - - - 46 53 56 61 71 81 93 93
- - - - - - - - 18 65 80 108 166 221 289 368
- - - - - - - - - - - - - - - - - - - - - - - - - - - - - - - - - - - - - - - - - - - - - - - - - 228 228 228 228 315 315 424 - - - - - - - - - - - - - - - - - - 49 49 49 49 49 161 - 270 524 524 744 1656 2432 2974 - 50 280 304 591 1514 2344 2724 - - - - - - - - 46 53 56 61 71 81 93 93
- - - - - - - - 18 65 80 108 166 221 289 368
- - - - - - - - - - - - - - - -
Cumulative Capacity Additions (MW)
Attachment D-3 E3 EPE Report Model Results AugustPage 18 of 34
Scenario Resource TypeSeparate System Planning (w H2) Nuclear (Palo Verde)
Nuclear (SMR)Gas - Steam TurbineGas - Combined CycleGas - Combustion TurbineBiomassGeothermalWindSolarBattery StorageImportsDemand ResponseHydrogenBTM SolarLoadExcess Generation
80 Clean by 2035 Nuclear (Palo Verde)Nuclear (SMR)Gas - Steam TurbineGas - Combined CycleGas - Combustion TurbineBiomassGeothermalWindSolarBattery StorageImportsDemand ResponseHydrogenBTM SolarLoadExcess Generation
20 CO2 Red by 2040 Nuclear (Palo Verde)Nuclear (SMR)Gas - Steam TurbineGas - Combined CycleGas - Combustion TurbineBiomassGeothermalWindSolarBattery StorageImportsDemand ResponseHydrogenBTM SolarLoadExcess Generation
2021 2024 2025 2027 2031 2035 2040 2045Cumulative Capacity Additions (MW)
- - - - - - - - - - - - - - - - - - - - - - - - - - - - - - - - - 228 228 228 228 315 315 424 - - - - - - - - - - - - - - - - - - 60 60 60 60 107 218 - 270 523 523 790 1267 1706 2293 - 50 278 303 570 1057 1496 1847 - - - - - - - - 46 53 56 61 71 81 93 93
- - - - - 123 206 212 18 65 80 108 166 221 289 368
- - - - - - - - - - - - - - - - - - - - - - - - - - - - - - - - - - - - - - - - - - - - - - - - - 228 228 228 228 470 582 709 - - - - - - - - - - - - - - - - - - 109 109 109 109 185 289 - 270 500 500 706 1188 1365 2061 - 50 177 177 486 968 1145 1377 - - - - - - - - 46 53 56 61 71 81 93 93
- - - - - - - - 18 65 80 108 166 221 289 368
- - - - - - - - - - - - - - - - - - - - - - - - - - - - - - - - - - - - - - - - - - - - - - - - - 228 228 228 228 470 596 698 - - - - - - - - - - - - - - - - - - 109 109 109 109 125 300 - 270 500 500 706 1188 1365 2099 - 50 177 177 486 968 1145 1409 - - - - - - - - 46 53 56 61 71 81 93 93
- - - - - - - - 18 65 80 108 166 221 289 368
- - - - - - - - - - - - - - - -
Attachment D-3 E3 EPE Report Model Results AugustPage 19 of 34
Scenario Resource Type40 CO2 Red by 2040 Nuclear (Palo Verde)
Nuclear (SMR)Gas - Steam TurbineGas - Combined CycleGas - Combustion TurbineBiomassGeothermalWindSolarBattery StorageImportsDemand ResponseHydrogenBTM SolarLoadExcess Generation
60 CO2 Red by 2040 Nuclear (Palo Verde)Nuclear (SMR)Gas - Steam TurbineGas - Combined CycleGas - Combustion TurbineBiomassGeothermalWindSolarBattery StorageImportsDemand ResponseHydrogenBTM SolarLoadExcess Generation
80 CO2 Red by 2040 Nuclear (Palo Verde)Nuclear (SMR)Gas - Steam TurbineGas - Combined CycleGas - Combustion TurbineBiomassGeothermalWindSolarBattery StorageImportsDemand ResponseHydrogenBTM SolarLoadExcess Generation
2021 2024 2025 2027 2031 2035 2040 2045Cumulative Capacity Additions (MW)
- - - - - - - - - - - - - - - - - - - - - - - - - - - - - - - - - 228 228 228 228 469 533 582 - - - - - - - - - - - - - - - - - - 109 109 109 109 239 300 - 270 500 500 706 1189 1545 2510 - 50 177 177 486 969 1184 1796 - - - - - - - - 46 53 56 61 71 81 93 93
- - - - - - - - 18 65 80 108 166 221 289 368
- - - - - - - - - - - - - - - - - - - - - - - - - - - - - - - - - - - - - - - - - - - - - - - - - 228 228 228 228 409 452 457 - - - - - - - - - - - - - - - - - - 128 128 128 128 301 302 - 270 484 484 701 1264 1947 3006 - 50 177 177 481 1044 1347 2195 - - - - - - - - 46 53 56 61 71 81 93 93
- - - - - - - - 18 65 80 108 166 221 289 368
- - - - - - - - - - - - - - - - - - - - - - - - - - - - - - - - - - - - - - - - - - - - - - - - - 228 228 228 228 338 338 338 - - - - - - - - - - - - - - - - - - 217 217 217 217 552 585 - 270 423 423 678 1510 2239 3269 - 50 176 177 458 1097 1645 2511 - - - - - - - - 46 53 56 61 71 81 93 93
- - - - - - - - 18 65 80 108 166 221 289 368
- - - - - - - - - - - - - - - -
Attachment D-3 E3 EPE Report Model Results AugustPage 20 of 34
Scenario Resource Type90 CO2 Red by 2040 Nuclear (Palo Verde)
Nuclear (SMR)Gas - Steam TurbineGas - Combined CycleGas - Combustion TurbineBiomassGeothermalWindSolarBattery StorageImportsDemand ResponseHydrogenBTM SolarLoadExcess Generation
100 CO2 Red by 2040 (w H2) Nuclear (Palo Verde)Nuclear (SMR)Gas - Steam TurbineGas - Combined CycleGas - Combustion TurbineBiomassGeothermalWindSolarBattery StorageImportsDemand ResponseHydrogenBTM SolarLoadExcess Generation
100 CO2 Red by 2040 Nuclear (Palo Verde)Nuclear (SMR)Gas - Steam TurbineGas - Combined CycleGas - Combustion TurbineBiomassGeothermalWindSolarBattery StorageImportsDemand ResponseHydrogenBTM SolarLoadExcess Generation
2021 2024 2025 2027 2031 2035 2040 2045Cumulative Capacity Additions (MW)
- - - - - - - - - - - - - - - - - - - - - - - - - - - - - - - - - 228 228 228 228 286 286 286 - - - - - - - - - - - - - - - - - - 224 224 224 224 801 828 - 270 420 420 786 1634 2282 3311 - 50 176 177 452 1284 1777 2645 - - - - - - - - 46 53 56 61 71 81 93 93
- - - - - - - - 18 65 80 108 166 221 289 368
- - - - - - - - - - - - - - - - - - - - - - - - - - - - - - - - - - - - - - - - - - - - - - - - - 228 228 228 228 248 - - - - - - - - - - - - - - - - - - - - 282 282 282 282 682 696 - 270 397 397 810 1756 2385 3440 - 50 176 177 445 1385 1955 2847 - - - - - - - - 46 53 56 61 71 81 93 93
- - - - - - 248 248 18 65 80 108 166 221 289 368
- - - - - - - - - - - - - - - - - - - - - - - - - - - - - - - - - - - - - - - - - - - - - - - - - 228 228 228 228 248 228 228 - - - - - - - - - - - - - - - - - - 120 120 282 282 1216 1605 - 270 491 491 810 1756 4833 5479 - 50 177 177 445 1385 6191 7520 - - - - - - - - 46 53 56 61 71 81 93 93
- - - - - - - - 18 65 80 108 166 221 289 701
- - - - - - - - - - - - - - - -
Attachment D-3 E3 EPE Report Model Results AugustPage 21 of 34
Scenario Resource TypeHigh DG Nuclear (Palo Verde)
Nuclear (SMR)Gas - Steam TurbineGas - Combined CycleGas - Combustion TurbineBiomassGeothermalWindSolarBattery StorageImportsDemand ResponseHydrogenBTM SolarLoadExcess Generation
High DSM Nuclear (Palo Verde)Nuclear (SMR)Gas - Steam TurbineGas - Combined CycleGas - Combustion TurbineBiomassGeothermalWindSolarBattery StorageImportsDemand ResponseHydrogenBTM SolarLoadExcess Generation
Low Load Nuclear (Palo Verde)Nuclear (SMR)Gas - Steam TurbineGas - Combined CycleGas - Combustion TurbineBiomassGeothermalWindSolarBattery StorageImportsDemand ResponseHydrogenBTM SolarLoadExcess Generation
2021 2024 2025 2027 2031 2035 2040 2045Cumulative Capacity Additions (MW)
- - - - - - - - - - - - - - - - - - - - - - - - - - - - - - - - - 228 228 228 228 420 586 788 - - - - - - - - - - - - - - - - - - 96 96 96 96 96 203 - 270 396 396 569 965 1089 1280 - 50 176 176 479 1041 1166 1313 - - - - - - - - 46 53 56 61 71 81 93 93
- - - - - - - - 42 169 210 293 455 614 809 1032
- - - - - - - - - - - - - - - - - - - - - - - - - - - - - - - - - - - - - - - - - - - - - - - - - 228 228 228 228 338 502 618 - - - - - - - - - - - - - - - - - - - - - - - 128 - 270 404 404 523 1104 1194 1648 - 50 184 184 406 1001 1091 1263 - - - - - - - - 49 66 71 82 100 101 103 103
- - - - - - - - 18 65 80 108 166 221 289 368
- - - - - - - - - - - - - - - - - - - - - - - - - - - - - - - - - - - - - - - - - - - - - - - - - 228 228 228 228 284 456 579 - - - - - - - - - - - - - - - - - - - - - - - 141 - 270 406 406 513 1140 1243 1739 - 50 186 186 355 1019 1121 1312 - - - - - - - - 46 53 56 61 71 81 93 93
- - - - - - - - 18 65 80 108 166 221 289 368
- - - - - - - - - - - - - - - -
Attachment D-3 E3 EPE Report Model Results AugustPage 22 of 34
Scenario Resource TypeHigh Load Nuclear (Palo Verde)
Nuclear (SMR)Gas - Steam TurbineGas - Combined CycleGas - Combustion TurbineBiomassGeothermalWindSolarBattery StorageImportsDemand ResponseHydrogenBTM SolarLoadExcess Generation
No Lifetime Extensions Nuclear (Palo Verde)Nuclear (SMR)Gas - Steam TurbineGas - Combined CycleGas - Combustion TurbineBiomassGeothermalWindSolarBattery StorageImportsDemand ResponseHydrogenBTM SolarLoadExcess Generation
No New Gas Nuclear (Palo Verde)Nuclear (SMR)Gas - Steam TurbineGas - Combined CycleGas - Combustion TurbineBiomassGeothermalWindSolarBattery StorageImportsDemand ResponseHydrogenBTM SolarLoadExcess Generation
2021 2024 2025 2027 2031 2035 2040 2045Cumulative Capacity Additions (MW)
- - - - - - - - - - - - - - - - - - - - - - - - - - - - - - - - - 228 228 228 228 603 807 971 - - - - - - - - - - - - - - - - - - 119 119 119 119 119 260 - 270 547 547 925 1259 1359 1905 - 50 235 327 708 1042 1142 1342 - - - - - - - - 46 53 56 61 71 81 93 93
- - - - - - - - 18 65 80 108 166 221 289 368
- - - - - - - - - - - - - - - - - - - - - - - - - - - - - - - - - - - - - - - - - - - - - - - - - 228 228 326 326 429 618 776 - - - - - - - - - - - - - - - - - - 109 109 109 109 109 197 - 270 652 652 912 1184 1284 1823 - 50 183 432 756 1027 1128 1327 - - - - - - - - 46 53 56 61 71 81 93 93
- - - - - - - - 18 65 80 108 166 221 289 368
- - - - - - - - - - - - - - - - - - - - - - - - - - - - - - - - - - - - - - - - - - - - - - - - - 228 228 228 228 228 228 228 - - - - - - - - - - - - - - - - - - 120 120 120 120 120 132 - 270 491 491 703 1831 2562 3684 - 50 177 177 483 1585 2342 3250 - - - - - - - - 46 53 56 61 71 81 93 93
- - - - - - - - 18 65 80 108 166 221 289 368
- - - - - - - - - - - - - - - -
Attachment D-3 E3 EPE Report Model Results AugustPage 23 of 34
Scenario Resource TypeLow Carbon Price Nuclear (Palo Verde)
Nuclear (SMR)Gas - Steam TurbineGas - Combined CycleGas - Combustion TurbineBiomassGeothermalWindSolarBattery StorageImportsDemand ResponseHydrogenBTM SolarLoadExcess Generation
Mid Carbon Price Nuclear (Palo Verde)Nuclear (SMR)Gas - Steam TurbineGas - Combined CycleGas - Combustion TurbineBiomassGeothermalWindSolarBattery StorageImportsDemand ResponseHydrogenBTM SolarLoadExcess Generation
High Carbon Price Nuclear (Palo Verde)Nuclear (SMR)Gas - Steam TurbineGas - Combined CycleGas - Combustion TurbineBiomassGeothermalWindSolarBattery StorageImportsDemand ResponseHydrogenBTM SolarLoadExcess Generation
2021 2024 2025 2027 2031 2035 2040 2045Cumulative Capacity Additions (MW)
- - - - - - - - - - - - - - - - - - - - - - - - - - - - - - - - - 228 228 228 228 400 587 724 - - - - - - - - - - - - - - - - - - 163 163 163 163 163 269 - 270 458 458 690 1264 1365 2000 - 50 176 176 470 1044 1145 1364 - - - - - - - - 46 53 56 61 71 81 93 93
- - - - - - - - 18 65 80 108 166 221 289 368
- - - - - - - - - - - - - - - - - - - - - - - - - - - - - - - - - - - - - - - - - - - - - - - - - 228 228 228 228 384 566 705 - - - - - - - - - - - - - - - - - - 238 238 238 238 238 300 - 270 518 518 676 1265 1382 2070 - 50 176 176 456 1045 1149 1384 - - - - - - - - 46 53 56 61 71 81 93 93
- - - - - - - - 18 65 80 108 166 221 289 368
- - - - - - - - - - - - - - - - - - - - - - - - - - - - - - - - - - - - - - - - - - - - - - - - - 228 228 228 228 377 504 504 - - - - - - - - - - - - - - - - - - 300 300 300 300 300 301 - 270 742 742 771 1265 1648 2798 - 50 176 176 445 1045 1206 2050 - - - - - - - - 46 53 56 61 71 81 93 93
- - - - - - - - 18 65 80 108 166 221 289 368
- - - - - - - - - - - - - - - -
Attachment D-3 E3 EPE Report Model Results AugustPage 24 of 34
Scenario Resource TypeHigh Gas Price Nuclear (Palo Verde)
Nuclear (SMR)Gas - Steam TurbineGas - Combined CycleGas - Combustion TurbineBiomassGeothermalWindSolarBattery StorageImportsDemand ResponseHydrogenBTM SolarLoadExcess Generation
Low Renewable and Storage Costs Nuclear (Palo Verde)Nuclear (SMR)Gas - Steam TurbineGas - Combined CycleGas - Combustion TurbineBiomassGeothermalWindSolarBattery StorageImportsDemand ResponseHydrogenBTM SolarLoadExcess Generation
2021 2024 2025 2027 2031 2035 2040 2045Cumulative Capacity Additions (MW)
- - - - - - - - - - - - - - - - - - - - - - - - - - - - - - - - - 228 228 228 228 408 596 730 - - - - - - - - - - - - - - - - - - 128 128 128 128 128 264 - 270 484 484 701 1264 1365 1972 - 50 177 177 481 1044 1145 1359 - - - - - - - - 46 53 56 61 71 81 93 93
- - - - - - - - 18 65 80 108 166 221 289 368
- - - - - - - - - - - - - - - - - - - - - - - - - - - - - - - - - - - - - - - - - - - - - - - - - 228 228 228 228 407 594 706 - - - - - - - - - - - - - - - - - - 160 160 160 160 160 300 - 270 410 410 691 1232 1333 2067 - 50 190 190 471 1037 1138 1385 - - - - - - - - 46 53 56 61 71 81 93 93
- - - - - - - - 18 65 80 108 166 221 289 368
- - - - - - - - - - - - - - - -
Attachment D-3 E3 EPE Report Model Results AugustPage 25 of 34
Scenario Resource TypeLeast-Cost (Reference Case) Nuclear (Palo Verde)
Nuclear (SMR)Gas - Steam TurbineGas - Combined CycleGas - Combustion TurbineBiomassGeothermalWindSolarBattery StorageImportsDemand ResponseHydrogenBTM SolarLoadExcess Generation
Least-Cost Case + REA Resources Nuclear (Palo Verde)Nuclear (SMR)Gas - Steam TurbineGas - Combined CycleGas - Combustion TurbineBiomassGeothermalWindSolarBattery StorageImportsDemand ResponseHydrogenBTM SolarLoadExcess Generation
Separate System Planning Nuclear (Palo Verde)Nuclear (SMR)Gas - Steam TurbineGas - Combined CycleGas - Combustion TurbineBiomassGeothermalWindSolarBattery StorageImportsDemand ResponseHydrogenBTM SolarLoadExcess Generation
2021 2024 2025 2027 2031 2035 2040 2045- - - - - - - - - - - - - - - - - (119) (119) (119) (192) (426) (426) (426) - - - - - (227) (227) (227) - - - - (63) (63) (63) (63) - - - - - - - - - - - - - - - - - - - - - - - - - - - - - (70) (97) (377) - - - - - - - (50) - - - - - - - - - - - - - - - - - - - - - - - - - - - - - - - - - - - - - - - - - - - - - - - - - - - - - - - - - - - - - - - - - (119) (119) (119) (192) (426) (426) (426) - - - - - (227) (227) (227) - - - - (63) (63) (63) (63) - - - - - - - - - - - - - - - - - - - - - - - - - - - - - (70) (97) (377) - - - - - - - (50) - - - - - - - - - - - - - - - - - - - - - - - - - - - - - - - - - - - - - - - - - - - - - - - - - - - - - - - - - - - - - - - - - (119) (119) (119) (192) (426) (426) (426) - - - - - (227) (227) (227) - - - - (63) (63) (63) (63) - - - - - - - - - - - - - - - - - - - - - - - - - - - - - (70) (97) (377) - - - - - - - (50) - - - - - - - - - - - - - - - - - - - - - - - - - - - - - - - - - - - - - - - - - - - - - - - -
Cumulative Capacity Retirements (MW)
Attachment D-3 E3 EPE Report Model Results AugustPage 26 of 34
Scenario Resource TypeSeparate System Planning (w H2) Nuclear (Palo Verde)
Nuclear (SMR)Gas - Steam TurbineGas - Combined CycleGas - Combustion TurbineBiomassGeothermalWindSolarBattery StorageImportsDemand ResponseHydrogenBTM SolarLoadExcess Generation
80 Clean by 2035 Nuclear (Palo Verde)Nuclear (SMR)Gas - Steam TurbineGas - Combined CycleGas - Combustion TurbineBiomassGeothermalWindSolarBattery StorageImportsDemand ResponseHydrogenBTM SolarLoadExcess Generation
20 CO2 Red by 2040 Nuclear (Palo Verde)Nuclear (SMR)Gas - Steam TurbineGas - Combined CycleGas - Combustion TurbineBiomassGeothermalWindSolarBattery StorageImportsDemand ResponseHydrogenBTM SolarLoadExcess Generation
2021 2024 2025 2027 2031 2035 2040 2045Cumulative Capacity Retirements (MW)
- - - - - - - - - - - - - - - - - (119) (119) (119) (192) (426) (426) (426) - - - - - (227) (227) (227) - - - - (63) (63) (63) (63) - - - - - - - - - - - - - - - - - - - - - - - - - - - - - (70) (97) (377) - - - - - - - (50) - - - - - - - - - - - - - - - - - - - - - - - - - - - - - - - - - - - - - - - - - - - - - - - - - - - - - - - - - - - - - - - - - (119) (119) (119) (192) (426) (426) (426) - - - - - (227) (227) (227) - - - - (63) (63) (63) (63) - - - - - - - - - - - - - - - - - - - - - - - - - - - - - (70) (97) (377) - - - - - - - (50) - - - - - - - - - - - - - - - - - - - - - - - - - - - - - - - - - - - - - - - - - - - - - - - - - - - - - - - - - - - - - - - - - (119) (119) (119) (192) (426) (426) (426) - - - - - (227) (227) (227) - - - - (63) (63) (63) (63) - - - - - - - - - - - - - - - - - - - - - - - - - - - - - (70) (97) (377) - - - - - - - (50) - - - - - - - - - - - - - - - - - - - - - - - - - - - - - - - - - - - - - - - - - - - - - - - -
Attachment D-3 E3 EPE Report Model Results AugustPage 27 of 34
Scenario Resource Type40 CO2 Red by 2040 Nuclear (Palo Verde)
Nuclear (SMR)Gas - Steam TurbineGas - Combined CycleGas - Combustion TurbineBiomassGeothermalWindSolarBattery StorageImportsDemand ResponseHydrogenBTM SolarLoadExcess Generation
60 CO2 Red by 2040 Nuclear (Palo Verde)Nuclear (SMR)Gas - Steam TurbineGas - Combined CycleGas - Combustion TurbineBiomassGeothermalWindSolarBattery StorageImportsDemand ResponseHydrogenBTM SolarLoadExcess Generation
80 CO2 Red by 2040 Nuclear (Palo Verde)Nuclear (SMR)Gas - Steam TurbineGas - Combined CycleGas - Combustion TurbineBiomassGeothermalWindSolarBattery StorageImportsDemand ResponseHydrogenBTM SolarLoadExcess Generation
2021 2024 2025 2027 2031 2035 2040 2045Cumulative Capacity Retirements (MW)
- - - - - - - - - - - - - - - - - (119) (119) (119) (192) (426) (426) (426) - - - - - (227) (227) (227) - - - - (63) (63) (63) (63) - - - - - - - -- - - - - - - -- - - - - - - -- - - - - (70) (97) (377) - - - - - - - (50) - - - - - - - -- - - - - - - -- - - - - - - -- - - - - - - -- - - - - - - -- - - - - - - -- - - - - - - -- - - - - - - -- (119) (119) (119) (192) (426) (426) (426) - - - - - (227) (227) (227) - - - - (63) (63) (63) (63) - - - - - - - -- - - - - - - -- - - - - - - -- - - - - (70) (97) (377) - - - - - - - (50) - - - - - - - -- - - - - - - -- - - - - - - -- - - - - - - -- - - - - - - -- - - - - - - -- - - - - - - -- - - - - - - -- (119) (119) (119) (192) (426) (426) (426) - - - - - (227) (227) (227) - - - - (63) (63) (63) (63) - - - - - - - -- - - - - - - -- - - - - - - -- - - - - (70) (97) (377) - - - - - - - (50) - - - - - - - -- - - - - - - -- - - - - - - -- - - - - - - -- - - - - - - -- - - - - - - -
Attachment D-3 E3 EPE Report Model Results AugustPage 28 of 34
Scenario Resource Type90 CO2 Red by 2040 Nuclear (Palo Verde)
Nuclear (SMR)Gas - Steam TurbineGas - Combined CycleGas - Combustion TurbineBiomassGeothermalWindSolarBattery StorageImportsDemand ResponseHydrogenBTM SolarLoadExcess Generation
100 CO2 Red by 2040 (w H2) Nuclear (Palo Verde)Nuclear (SMR)Gas - Steam TurbineGas - Combined CycleGas - Combustion TurbineBiomassGeothermalWindSolarBattery StorageImportsDemand ResponseHydrogenBTM SolarLoadExcess Generation
100 CO2 Red by 2040 Nuclear (Palo Verde)Nuclear (SMR)Gas - Steam TurbineGas - Combined CycleGas - Combustion TurbineBiomassGeothermalWindSolarBattery StorageImportsDemand ResponseHydrogenBTM SolarLoadExcess Generation
2021 2024 2025 2027 2031 2035 2040 2045Cumulative Capacity Retirements (MW)
- - - - - - - - - - - - - - - - - (119) (119) (119) (192) (426) (426) (426) - - - - - (227) (227) (227) - - - - (63) (63) (63) (63) - - - - - - - - - - - - - - - - - - - - - - - - - - - - - (70) (97) (377) - - - - - - - (50) - - - - - - - - - - - - - - - - - - - - - - - - - - - - - - - - - - - - - - - - - - - - - - - - - - - - - - - - - - - - - - - - - (119) (119) (119) (192) (426) (426) (426) - - - - - (227) (227) (227) - - - - (63) (63) (63) (63) - - - - - - - - - - - - - - - - - - - - - - - - - - - - - (70) (97) (377) - - - - - - - (50) - - - - - - - - - - - - - - - - - - - - - - - - - - - - - - - - - - - - - - - - - - - - - - - - - - - - - - - - - - - - - - - - - (119) (119) (119) (192) (426) (426) (426) - - - - - (227) (227) (227) - - - - (63) (63) (63) (63) - - - - - - - - - - - - - - - - - - - - - - - - - - - - - (70) (97) (377) - - - - - - - (50) - - - - - - - - - - - - - - - - - - - - - - - - - - - - - - - - - - - - - - - - - - - - - - - -
Attachment D-3 E3 EPE Report Model Results AugustPage 29 of 34
Scenario Resource TypeHigh DG Nuclear (Palo Verde)
Nuclear (SMR)Gas - Steam TurbineGas - Combined CycleGas - Combustion TurbineBiomassGeothermalWindSolarBattery StorageImportsDemand ResponseHydrogenBTM SolarLoadExcess Generation
High DSM Nuclear (Palo Verde)Nuclear (SMR)Gas - Steam TurbineGas - Combined CycleGas - Combustion TurbineBiomassGeothermalWindSolarBattery StorageImportsDemand ResponseHydrogenBTM SolarLoadExcess Generation
Low Load Nuclear (Palo Verde)Nuclear (SMR)Gas - Steam TurbineGas - Combined CycleGas - Combustion TurbineBiomassGeothermalWindSolarBattery StorageImportsDemand ResponseHydrogenBTM SolarLoadExcess Generation
2021 2024 2025 2027 2031 2035 2040 2045Cumulative Capacity Retirements (MW)
- - - - - - - - - - - - - - - - - (119) (119) (119) (192) (426) (426) (426) - - - - - (227) (227) (227) - - - - (63) (63) (63) (63) - - - - - - - - - - - - - - - - - - - - - - - - - - - - - (70) (97) (377) - - - - - - - (50) - - - - - - - - - - - - - - - - - - - - - - - - - - - - - - - - - - - - - - - - - - - - - - - - - - - - - - - - - - - - - - - - - (119) (119) (119) (192) (426) (426) (426) - - - - - (227) (227) (227) - - - - (63) (63) (63) (63) - - - - - - - - - - - - - - - - - - - - - - - - - - - - - (70) (97) (377) - - - - - - - (50) - - - - - - - - - - - - - - - - - - - - - - - - - - - - - - - - - - - - - - - - - - - - - - - - - - - - - - - - - - - - - - - - - (119) (119) (119) (192) (426) (426) (426) - - - - - (227) (227) (227) - - - - (63) (63) (63) (63) - - - - - - - - - - - - - - - - - - - - - - - - - - - - - (70) (97) (377) - - - - - - - (50) - - - - - - - - - - - - - - - - - - - - - - - - - - - - - - - - - - - - - - - - - - - - - - - -
Attachment D-3 E3 EPE Report Model Results AugustPage 30 of 34
Scenario Resource TypeHigh Load Nuclear (Palo Verde)
Nuclear (SMR)Gas - Steam TurbineGas - Combined CycleGas - Combustion TurbineBiomassGeothermalWindSolarBattery StorageImportsDemand ResponseHydrogenBTM SolarLoadExcess Generation
No Lifetime Extensions Nuclear (Palo Verde)Nuclear (SMR)Gas - Steam TurbineGas - Combined CycleGas - Combustion TurbineBiomassGeothermalWindSolarBattery StorageImportsDemand ResponseHydrogenBTM SolarLoadExcess Generation
No New Gas Nuclear (Palo Verde)Nuclear (SMR)Gas - Steam TurbineGas - Combined CycleGas - Combustion TurbineBiomassGeothermalWindSolarBattery StorageImportsDemand ResponseHydrogenBTM SolarLoadExcess Generation
2021 2024 2025 2027 2031 2035 2040 2045Cumulative Capacity Retirements (MW)
- - - - - - - - - - - - - - - - - (119) (119) (119) (192) (426) (426) (426) - - - - - (227) (227) (227) - - - - (63) (63) (63) (63) - - - - - - - - - - - - - - - - - - - - - - - - - - - - - (70) (97) (377) - - - - - - - (50) - - - - - - - - - - - - - - - - - - - - - - - - - - - - - - - - - - - - - - - - - - - - - - - - - - - - - - - - - - - - - - - - - (192) (192) (282) (282) (426) (426) (426) - - - (227) (227) (227) (227) (227) - - - - (63) (63) (63) (63) - - - - - - - - - - - - - - - - - - - - - - - - - - - - - (70) (97) (377) - - - - - - - (50) - - - - - - - - - - - - - - - - - - - - - - - - - - - - - - - - - - - - - - - - - - - - - - - - - - - - - - - - - - - - - - - - - (119) (119) (119) (192) (426) (426) (426) - - - - - (227) (227) (227) - - - - (63) (63) (63) (63) - - - - - - - - - - - - - - - - - - - - - - - - - - - - - (70) (97) (377) - - - - - - - (50) - - - - - - - - - - - - - - - - - - - - - - - - - - - - - - - - - - - - - - - - - - - - - - - -
Attachment D-3 E3 EPE Report Model Results AugustPage 31 of 34
Scenario Resource TypeLow Carbon Price Nuclear (Palo Verde)
Nuclear (SMR)Gas - Steam TurbineGas - Combined CycleGas - Combustion TurbineBiomassGeothermalWindSolarBattery StorageImportsDemand ResponseHydrogenBTM SolarLoadExcess Generation
Mid Carbon Price Nuclear (Palo Verde)Nuclear (SMR)Gas - Steam TurbineGas - Combined CycleGas - Combustion TurbineBiomassGeothermalWindSolarBattery StorageImportsDemand ResponseHydrogenBTM SolarLoadExcess Generation
High Carbon Price Nuclear (Palo Verde)Nuclear (SMR)Gas - Steam TurbineGas - Combined CycleGas - Combustion TurbineBiomassGeothermalWindSolarBattery StorageImportsDemand ResponseHydrogenBTM SolarLoadExcess Generation
2021 2024 2025 2027 2031 2035 2040 2045Cumulative Capacity Retirements (MW)
- - - - - - - - - - - - - - - - - (119) (119) (119) (192) (426) (426) (426) - - - - - (227) (227) (227) - - - - (63) (63) (63) (63) - - - - - - - - - - - - - - - - - - - - - - - - - - - - - (70) (97) (377) - - - - - - - (50) - - - - - - - - - - - - - - - - - - - - - - - - - - - - - - - - - - - - - - - - - - - - - - - - - - - - - - - - - - - - - - - - - (119) (119) (119) (192) (426) (426) (426) - - - - - (227) (227) (227) - - - - (63) (63) (63) (63) - - - - - - - - - - - - - - - - - - - - - - - - - - - - - (70) (97) (377) - - - - - - - (50) - - - - - - - - - - - - - - - - - - - - - - - - - - - - - - - - - - - - - - - - - - - - - - - - - - - - - - - - - - - - - - - - - (119) (119) (119) (192) (426) (426) (426) - - - - - (227) (227) (227) - - - - (63) (63) (63) (63) - - - - - - - - - - - - - - - - - - - - - - - - - - - - - (70) (97) (377) - - - - - - - (50) - - - - - - - - - - - - - - - - - - - - - - - - - - - - - - - - - - - - - - - - - - - - - - - -
Attachment D-3 E3 EPE Report Model Results AugustPage 32 of 34
Scenario Resource TypeHigh Gas Price Nuclear (Palo Verde)
Nuclear (SMR)Gas - Steam TurbineGas - Combined CycleGas - Combustion TurbineBiomassGeothermalWindSolarBattery StorageImportsDemand ResponseHydrogenBTM SolarLoadExcess Generation
Low Renewable and Storage Costs Nuclear (Palo Verde)Nuclear (SMR)Gas - Steam TurbineGas - Combined CycleGas - Combustion TurbineBiomassGeothermalWindSolarBattery StorageImportsDemand ResponseHydrogenBTM SolarLoadExcess Generation
2021 2024 2025 2027 2031 2035 2040 2045Cumulative Capacity Retirements (MW)
- - - - - - - - - - - - - - - - - (119) (119) (119) (192) (426) (426) (426) - - - - - (227) (227) (227) - - - - (63) (63) (63) (63) - - - - - - - - - - - - - - - - - - - - - - - - - - - - - (70) (97) (377) - - - - - - - (50) - - - - - - - - - - - - - - - - - - - - - - - - - - - - - - - - - - - - - - - - - - - - - - - - - - - - - - - - - - - - - - - - - (119) (119) (119) (192) (426) (426) (426) - - - - - (227) (227) (227) - - - - (63) (63) (63) (63) - - - - - - - - - - - - - - - - - - - - - - - - - - - - - (70) (97) (377) - - - - - - - (50) - - - - - - - - - - - - - - - - - - - - - - - - - - - - - - - - - - - - - - - - - - - - - - - -
Attachment D-3 E3 EPE Report Model Results AugustPage 33 of 34
Scenario 2021 2024 2025 2027 2031 2035 2040 2045Least-Cost (Reference Case) 246$ 233$ 245$ 262$ 284$ 340$ 402$ 498$ Least-Cost Case + REA Resources 246$ 233$ 247$ 262$ 285$ 343$ 406$ 506$ Separate System Planning 247$ 233$ 250$ 268$ 293$ 369$ 473$ 571$ Separate System Planning (w H2) 247$ 233$ 251$ 268$ 293$ 348$ 438$ 536$ 80 Clean by 2035 246$ 233$ 245$ 262$ 284$ 342$ 402$ 498$ 20 CO2 Red by 2040 246$ 233$ 245$ 262$ 284$ 342$ 402$ 499$ 40 CO2 Red by 2040 246$ 233$ 245$ 262$ 284$ 342$ 405$ 512$ 60 CO2 Red by 2040 246$ 233$ 246$ 262$ 284$ 341$ 419$ 531$ 80 CO2 Red by 2040 246$ 233$ 247$ 262$ 284$ 347$ 463$ 577$ 90 CO2 Red by 2040 246$ 233$ 247$ 263$ 287$ 357$ 500$ 615$ 100 CO2 Red by 2040 (w H2) 246$ 233$ 249$ 264$ 289$ 367$ 551$ 663$ 100 CO2 Red by 2040 246$ 233$ 245$ 262$ 289$ 367$ 1113$ 1282$ High DG 245$ 231$ 241$ 256$ 277$ 325$ 382$ 470$ High DSM 245$ 230$ 239$ 254$ 271$ 313$ 367$ 450$ Low Load 239$ 227$ 236$ 252$ 269$ 312$ 371$ 460$ High Load 253$ 239$ 255$ 276$ 307$ 374$ 441$ 540$ No Lifetime Extensions 246$ 228$ 243$ 266$ 298$ 344$ 406$ 502$ No New Gas 246$ 233$ 245$ 262$ 284$ 367$ 453$ 570$ Low Carbon Price 291$ 277$ 284$ 301$ 323$ 379$ 444$ 543$ Mid Carbon Price 358$ 341$ 341$ 358$ 381$ 436$ 505$ 611$ High Carbon Price 469$ 449$ 432$ 451$ 475$ 529$ 603$ 718$ High Gas Price 257$ 242$ 251$ 268$ 291$ 347$ 412$ 509$ Low Renewable and Storage Costs 246$ 233$ 240$ 256$ 274$ 321$ 379$ 463$
Annual Revenue Requirement ($MM)
Attachment D-3 E3 EPE Report Model Results AugustPage 34 of 34
Scenario Clean Energy Type 2021 2024 2025 2027 2031 2035 2040 2045Least-Cost (Reference Case) Renewable 4 12 21 21 27 34 36 39
Zero Carbon 62 68 77 75 77 81 77 75Least-Cost Case + REA Resources Renewable 4 12 24 24 30 39 43 49
Zero Carbon 62 68 79 78 80 85 84 84Separate System Planning Renewable 4 12 20 21 26 38 42 46
Zero Carbon 62 68 76 75 76 84 83 82Separate System Planning (w H2) Renewable 4 12 21 21 27 34 41 45
Zero Carbon 62 68 76 75 77 81 82 8180 Clean by 2035 Renewable 4 12 21 22 27 34 39 45
Zero Carbon 62 68 77 76 77 81 80 8020 CO2 Red by 2040 Renewable 4 12 21 22 27 34 37 46
Zero Carbon 62 68 77 76 77 81 78 8140 CO2 Red by 2040 Renewable 4 12 21 22 27 34 43 51
Zero Carbon 62 68 77 76 77 81 84 8660 CO2 Red by 2040 Renewable 4 12 22 22 27 36 48 56
Zero Carbon 62 68 77 76 78 83 89 9180 CO2 Red by 2040 Renewable 4 12 24 24 30 41 54 60
Zero Carbon 62 68 79 78 81 87 94 9590 CO2 Red by 2040 Renewable 4 12 24 24 32 43 56 62
Zero Carbon 62 68 79 78 82 89 97 98100 CO2 Red by 2040 (w H2) Renewable 4 12 25 26 34 45 56 62
Zero Carbon 62 68 81 79 84 92 100 100100 CO2 Red by 2040 Renewable 4 12 22 22 34 45 60 65
Zero Carbon 62 68 77 76 84 92 100 100High DG Renewable 4 13 21 22 27 35 37 39
Zero Carbon 63 70 76 75 77 82 78 74High DSM Renewable 4 12 16 16 20 31 32 37
Zero Carbon 63 69 73 72 73 80 76 75Low Load Renewable 4 12 16 16 19 31 33 38
Zero Carbon 64 70 73 72 72 79 75 75High Load Renewable 4 12 23 24 31 36 36 41
Zero Carbon 61 66 77 76 79 80 76 75No Lifetime Extensions Renewable 4 12 23 26 31 35 36 39
Zero Carbon 62 68 79 80 81 81 77 75No New Gas Renewable 4 12 22 22 27 42 50 57
Zero Carbon 62 68 77 76 77 88 90 92Low Carbon Price Renewable 4 12 23 23 28 37 38 43
Zero Carbon 62 68 78 77 79 83 79 79Mid Carbon Price Renewable 4 12 26 26 31 39 41 45
Zero Carbon 62 68 81 80 81 86 82 81High Carbon Price Renewable 4 12 30 31 34 41 45 54
Zero Carbon 62 68 86 85 84 87 86 89High Gas Price Renewable 4 12 22 22 27 36 37 43
Zero Carbon 62 68 77 76 78 82 78 78Low Renewable and Storage Costs Renewable 4 12 22 22 28 36 38 44
Zero Carbon 62 68 77 76 78 83 79 80
Clean Energy ( of Load)
BEFORE THE NEW MEXICO PUBLIC REGULATION COMMISSION
RULE 1773 NMAC FILING
EL PASO ELECTRIC COMPANY NOTICE OF 2021 INTEGRATED RESOURCE PLAN
2020-2021 PLANNING PROCESS AND PUBLIC ADVISORY PROCESS MEETINGS
DECLARATION OF CURTIS HUTCHESON OF NOTICE TO CUSTOMERS
I Curtis Hutcheson pursuant to Rule 1-011 NMRA state as follows
1 I affirm in writing under penalty of perjury under the laws of the State of New Mexico
that the following statements are true and correct
2 I am over 18 years of age and have personal knowledge of the facts stated herein I am
employed as Supervisor-Regulatory Case Management My business address is 100 N Stanton
Street El Paso Texas 79901
3 My responsibilities include the oversight and preparation of rate and regulatory filings
and compliance with the various regulatory requirements of the jurisdictions in which EPE
operates
4 Pursuant to Rule 17739H(1) NMAC the New Mexico Public Regulation Commission
(ldquoCommissionrdquo) requires EPE to provide notice of EPErsquos 2021 Integrated Resource Planrsquos
2020-2021 Planning Process and Public Advisory Process Meetings in the utilityrsquos billing
inserts
5 EPE directly mailed the required notice to all existing New Mexico customers in a bill
insert between June 4 2020 and July 2 2020 A copy of the bill insert is attached as Exhibit A to
Attachment E-1 Proof of Notice
2
this Affirmation
6 EPE also published the notice in the Las Cruces Sun News on May 31 2020 The affidavit
and tear sheet are attached as Exhibit B to this Affirmation
7 EPE provided notice on June 4 2020 30 days prior to the first scheduled meeting on
July 10 2020 to the commission interveners in its most recent general rate case and
participants in its most recent renewable energy energy efficiency and IRP proceedings The
email of the notice and certificate of service is attached as Exhibit C to this Affirmation
I submit this Declaration based upon my personal knowledge and upon information
and belief in support of EPErsquos 2021 Integrated Resource Planrsquos 2020-2021 Planning Process
and Public Advisory Process Meetings
FURTHER DECLARANT SAYETH NAUGHT
I declare under penalty of perjury that the foregoing is true and correct
Executed on May 13 2021
__s Curtis Hutcheson________
CURTIS HUTCHESON
Attachment E-1 Proof of Notice
BEFORE THE NEW MEXICO PUBLIC REGULATION COMMISSION
RULE 1773 NMAC FILING
EL PASO ELECTRIC COMPANY
NOTICE OF 2021 INTEGRATED RESOURCE PLAN
2020-2021 PUBLIC ADVISORY PROCESS MEETINGS
Notice is hereby given that
El Paso Electric Company (EPE) invites members of the public to participate in the Integrated Resource
Plan (ldquoIRPrdquo) public advisory process through a series of public meetings With public participation EPE
will develop its IRP pursuant to the New Mexico Efficient Use of Energy Act and the New Mexico Public
Regulation Commissions (Commission) IRP Rule 1773 NMAC EPEs IRP is developed to identify cost-
effective demand-side and supply-side electricity resources to serve EPEs customers over the next 20-
year planning period
The IRP will be submitted to the Commission no later than July 2021 Public participation is an important
component of the development and implementation of EPEs integrated resource planning in New
Mexico EPE encourages interested members of the public to attend these public meetings to provide
public input and commentary whether as a residential or business customer or as a representative of a
trade non-profit neighborhood shareholder civic or other group
Given the currently effective limitations on public gatherings in New Mexico and Texas the first scheduled
meeting will be held electronically and by phone conference on July 10 2020 at 200 pm MDT The IRP
process will be explained and additional meeting dates and locations will be set at that time Prior to
each meeting the presentation for that meeting will be posted on EPEs website wwwepeletriccom If
you are interested in attending the meeting or otherwise participating in the process please contact EPE
by emailing NMIRPepelectriccom or calling at (915) 543- 4354
Exhibit A Page 1 of 1Attachment E-1 Proof of Notice
Exhibit B Page 1 of 2Attachment E-1 Proof of Notice
2H SUNDAY MAY 31 2020 LAS CRUCES SUN-NEWS
4B-501 Notice to creditors by publi-cation and notice to creditors bywritten notice (mailing or other de-livery)[For use with Rules 1B-304 1B-306and 1B-401 NMRA]
STATE OF NEW MEXICOIN THE PROBATE COURTDONA ANA COUNTY
No 20-0074
IN THE MATTER OF THEESTATE OF Juliet S WilliamsDECEASED
NOTICE TO CREDITORSNOTICE IS HEREBY GIVEN thatthe undersigned has been appointedpersonal representative of the es-tate of the decedent All personshaving claims against the estate ofthe decedent are required to presenttheir claims within four (4) monthsafter the date of the first publica-tion of any published notice to cred-itors or sixty (60) days after thedate of mailing or other delivery ofthis notice whichever is later orthe claims will be forever barredClaims must be presented either tothe undersigned personal represen-tative at the address below or filedwith the Probate Court of DonaAna 845 N Motel Blvd 1-201 LasCruces NM 88007Dated May 2020s Edwin James Williams Jrsignature of representative
Edwin James Williams JrPrinted Name
17093 White Pine RdStreet address
Beaver dam VA 23015City state and ZIP code
4213196 Sun-News May 31 andJun 7 14 2020
To advertise visit
SELL ITBUY IT
FIND ITcars
garage sales
tickets
jobs
antiques
motorcycles
computers
boats
sports equipment
pets
instruments
jewelry
furniture
tablets
auctions
yard sales
collectibles
appliances
cameras
coins
Place yourclassified ad today
FINDING WORK SHOULDNrsquoT BE WORK
Your job search ends here
Get started by visitingjobsusatodaycom
HVAC TECHNICIAN II
ACO amp CODES-LABORER
ANIMAL CONTROL OFFICER
DASO CADET-UNCERTIFIED
ROADS-EQUIPMENT OPERATOR
ELECTIONS SPECIALIST-TEMPORARY
ROADS-HEAVY EQUIPMENT OPERATOR
DETENTION CENTER OFFICER TRAINEE
DOCUMENT TECHNICIAN-DC DISPOSITIONS
ENVIRONMENTAL CODES ENFORCEMENT OFFICER
WATERWASTEWATER OPERATOR III
Job Application amp Job Announcements available on our Website atwwwdonaanacountyorg
Computer kiosks are available in the Human Resources Department
DONtildeA ANA COUNTYJOB VACANCIES
CAMINO REALREGIONAL UTILITY AUTHORITY
JOB VACANCIES
Demolition Build RoadsLeveling
Business amp Service Directoryto advertise email ServiceDirectorylcsun-newscom
or call 8007645620
Exhibit B Page 2 of 2Attachment E-1 Proof of Notice
From Griego PatriciaTo Burns Nancy Griego Patricia Jeffrey Wechsler Diana Luna Kari Olson Lorraine Talley John F McIntyre
Schichtl James Hutcheson Marvin C Novela Mariah M Parsons Judith M Pleasant Linda G Perea Araceli Gastevenslawgmailcom jvega-brownlas-crucesorg joprovenciolas-crucesorg llarocquelas-crucesorg marcydlas-crucesorg davilalas-crucesorg JAGlas-crucesorg hconnellylas-crucesorg ddollahonlas-crucesorg tomfdonaanacountyorg rockybacchusgmailcomecomaxaclifeisgood2com lellisnmsuedu ghauboldadnmsuedu jdrakemodrallcomnwinterstelznerlawcom kherrmannstelznerlawcom rgallegosstelznerlawcom Nobleccaegmailcomstephaniedzur-Lawcom Lundin Robert gelliotnmaggov Cholla Khoury lawofficejasonmarkscomJsmithwatsonlawlcgmailcom mayortrujillocityofanthonynmorg mlsouleshotmailcombthroneattynewmexicocom Goodin Nelson fredkdonaanacountyorg Rickvotesolarorgtasolomon6gmailcom Dahlharrishotmailcom Jdittmerutilitechnet Jaherzsawvelcomakharrigersawvelcom Borman Bradford PRC Reynolds John PRC Chavez Milo PRC Sidler Jack PRCjohnbogatkostatenmus marctuplerstatenmus gilberttfuentesstatenmus Sisneros Anthony R PRCLeyba-Tercero Elisha PRC Fisk Russell PRC Amer Judith PRC Smith Michael C PRC Martinez-Rael PeggyPRC elizabethramirezstatenmus carolynglickstatenmus Hurst Elizabeth PRCchristopherryanstatenmus philipbsimpsoncomcastnet Kylejsmith124civmailmilrobertagantoncivmailmil hgellerswenergyorg jbrantswenergyorg ctcolumbiaaolcomltougascleanenergyregresearchcom dgegaxnmsuedu Ramonablabersierracluborgsricdonearthlinknet smichelwesternresourcesorg Beadles Cydney PRCpatoconnellwesternresourcesorg aprilelliottwesternresourcesorg dneidcoxnet schaefnogmailcomdavidvw77com bslocumdwmrlawcom jmcnallydwmrlawcom mbarkerdwmrlawcommzidovskymontandcom
Cc EPE_Reg_MgmtSubject Rule 1773 NMAC Filing EPEs Notice of 2020-2021 Public Advisory Process Meetings for 2021 IRP amp COSDate Thursday June 4 2020 105041 AMAttachments 2021 IRP Noticepdf
COS Notice of IRP Processpdf
Good morning Attached is El Paso Electric Companyrsquos Notice of its 2020-2021 Public AdvisoryProcess Meetings for the 2021 Integrated Resource Plan and Certificate of Service that was filed byemail with NMPRC Records today
Patricia ldquoTrishrdquo Griego| El Paso Electric CompanyLegal Assistant300 Galisteo St Suite 206Santa Fe New Mexico 87501T (505) 982-4713 | C (505) 470-4048Patriciagriegoepelectriccom
CONFIDENTIALITY NOTICE The information contained in this electronic mailtransmission is CONFIDENTIAL and it may qualify as material protected pursuantto the Texas Uniform Trade Secrets Act the New Mexico Uniform Trade SecretsAct or other laws If you are not the intended recipient please destroydelete thismessage and any attachments and immediately notify the sender
Exhibit C Page 1 of 1Attachment E-1 Proof of Notice

Atta
chm
ent B
-2
2021
Ene
rgy
Fore
cast
by
Juri
sdic
iton
Page
2 o
f 2
Nativ
e Sy
stem
Ene
rgy
Texa
sRe
side
ntial
Commercial amp
Ind
ustrial Sm
all
Commercial amp
Ind
ustrial La
rge
Street L
ighting
OPA To
tal Te
xas
New
Mex
ico
Reside
ntial
Commercial amp
Ind
ustrial Sm
all
Commercial amp
Ind
ustrial La
rge
Street L
ighting
OPA To
tal Ne
w Mex
ico
Compa
ny U
seRG
EC
Total Na
tive
System
2031
2032
2033
2034
2035
2036
2037
2038
2039
2040
333
498
3342
514
8352
517
0363
602
6375
962
4389
587
8404
605
4421
733
9441
440
3464
854
4204
512
9205
422
5206
458
0207
569
3208
712
3209
803
4210
956
8212
148
1213
518
9215
185
799
194
899
209
599
206
099
186
899
153
899
108
999
053
598
989
198
916
798
837
546
133
46630
47109
47569
48017
48461
48888
49300
49698
50084
126
833
5127
422
3128
043
5128
627
9129
128
0129
588
9130
154
2130
722
8131
363
7132
253
7
768
652
9779
232
0790
935
5803
743
5817
758
3832
935
1849
658
7868
523
9890
209
4916
139
8
96992
298
850
0100
911
0103
341
5106
103
0109
184
3112
739
2116
969
2121
992
0128
248
958
968
059
896
060
908
361
944
462
902
063
948
065
148
866
433
367
751
268
996
470
144
69687
69229
68772
68315
67857
67400
66943
66485
66028
232
3236
0239
7243
5247
3251
1254
9258
6262
3265
940
330
540
627
540
956
641
342
841
744
542
112
442
453
442
783
543
117
443
550
0
203
537
5206
578
2209
938
6213
749
4217
828
3222
281
5227
336
2233
138
8239
771
3247
663
9
15110
15246
15383
15522
15662
15803
15945
16088
16233
16379
82147
83435
84723
86012
87300
88589
89877
91165
92454
93742
981
916
1995
678
410
108
847
10276
463
10458
828
10656
557
10875
771
11123
881
11408
494
11748
158 Attachment B-2 2021 Energy
Forecast by JurisdictionPage 2 of 2
Atta
chm
ent B
-3
2021
Dem
and
Fore
cast
by
Juri
sdic
tion
Page
1 o
f 2
Nativ
e Sy
stem
Dem
and
2021
2022
2023
2024
2025
2026
2027
2028
2029
2030
Texa
sRe
side
ntial
653
667
681
689
703
717
735
751
773
795
Commercial amp
Ind
ustrial Sm
all
479
484
486
485
488
489
491
492
496
499
Commercial amp
Ind
ustrial La
rge
236
237
238
238
240
241
241
241
242
243
Street L
ighting
1010
1010
1111
1111
1111
OPA
285
290
293
295
298
301
303
304
307
309
Total Te
xas
166
2168
8170
8171
8174
0175
9178
2179
9183
0185
8
New
Mex
ico
Reside
ntial
201
205
207
208
211
214
217
220
224
229
Commercial amp
Ind
ustrial Sm
all
126
128
128
129
130
132
133
135
137
139
Commercial amp
Ind
ustrial La
rge
1818
1817
1717
1717
1717
Street L
ighting
00
00
11
11
11
OPA
9192
9393
9394
9494
9596
Total Ne
w Mex
ico
436
443
446
448
452
457
462
466
475
482
Compa
ny U
se3
33
33
44
44
4RG
EC19
2020
2021
2122
2223
23
Total Na
tive
System
212
1215
5217
7219
0221
6224
0226
9229
2233
1236
7 Attachment B-3 2021 Demand Forecast by Jurisdiction
Page 1 of 2
Atta
chm
ent B
-3
2021
Dem
and
Fore
cast
by
Juri
sdic
tion
Page
2 o
f 2
Nativ
e Sy
stem
Dem
and
Texa
sRe
side
ntial
Commercial amp
Ind
ustrial Sm
all
Commercial amp
Ind
ustrial La
rge
Street L
ighting
OPA To
tal Te
xas
New
Mex
ico
Reside
ntial
Commercial amp
Ind
ustrial Sm
all
Commercial amp
Ind
ustrial La
rge
Street L
ighting
OPA To
tal Ne
w Mex
ico
Compa
ny U
seRG
EC
Total Na
tive
System
2031
2032
2033
2034
2035
2036
2037
2038
2039
2040
819
841
871
901
936
973
102
0107
2113
4120
650
250
451
051
552
052
453
253
954
855
824
424
424
524
624
724
725
025
225
425
611
1112
1212
1212
1313
1331
231
331
631
932
232
432
833
233
734
3
188
8191
3195
4199
2203
6207
9214
2220
8228
6237
6
233
237
243
250
257
265
276
288
303
321
142
144
147
150
153
155
159
164
168
173
1717
1717
1716
1616
1717
11
11
11
11
11
9797
9910
010
110
210
410
510
710
9
489
496
506
517
528
540
556
574
595
620
44
44
44
44
44
2324
2425
2525
2627
2728
240
4243
6248
8253
8259
3264
8272
8281
3291
3302
8 Attachment B-3 2021 Demand Forecast by Jurisdiction
Page 2 of 2
Attachment B-4 Losses by Transmission and Distribution
Year Secondary Primary Transmission FERC Losses (MW)2021 130 4 4 0 1382022 133 4 4 0 1412023 135 4 4 0 1442024 137 4 4 0 1452025 139 4 4 0 1482026 141 4 4 0 1502027 144 4 5 0 1532028 146 4 5 0 1552029 149 4 5 0 1592030 152 5 5 0 1622031 155 5 5 0 1652032 157 5 5 0 1672033 160 5 5 0 1712034 163 5 5 0 1742035 166 5 5 0 1772036 169 5 5 0 1802037 173 5 5 0 1842038 176 5 6 0 1872039 179 5 6 0 1912040 182 5 6 0 194
Page 1 of 1
Attachment B-5 Typical Days Tables
Page 1 of 10
Attachment B-5 Typical Days Tables
Page 2 of 10
Attachment B-5 Typical Days Tables
Page 3 of 10
Attachment B-5 Typical Days Tables
Page 4 of 10
Attachment B-5 Typical Days Tables
Page 5 of 10
Attachment B-5 Typical Days Tables
Page 6 of 10
Attachment B-5 Typical Days Tables
Page 7 of 10
Attachment B-5 Typical Days Tables
Page 8 of 10
Attachment B-5 Typical Days Tables
Page 9 of 10
Attachment B-5 Typical Days Tables
Page 10 of 10
Page 1 of 7
Attachment C-1 Transmission Facilities TABLE 1 Existing EPE Transmission Lines 115 kV and Above
EL PASO ELECTRIC COMPANY
Existing 115 kV and Above Internal Lines
RATING LENGTH STATE
From To kV Circuit MVA
Normal MVA
Emerg Miles From To AMRAD EMPIRE 345 1 400 400 12510 TX NM CALIENTE AMRAD 345 1 785 785 567 TX NM CALIENTE PICANTE 345 1 788 788 73 TX TX EMPIRE EDDY 345 1 836 836 05 NM NM HIDALGO GREENLEE 345 1 765 765 600 NM AZ LUNA AFTON 345 1 921 987 573 NM NM LUNA DIABLO 345 1 939 939 849 NM NM LUNA HIDALGO 345 1 659 659 505 NM NM MACHO SPRINGS
LUNA 345 1 1031 1390 249 NM NM
MACHO SPRINGS
SPRINGERVILLE 345 1 728 728 2014 NM AZ
NEWMAN ARROYO 345 1 700 700 303 TX NM NEWMAN AFTON 345 1 924 1028 299 TX NM PICANTE NEWMAN 345 1 786 786 162 TX TX WESTMESA ARROYO 345 1 680 680 2018 NM NM MIMBRES TAP AIRPORT 115 1 123 163 27 NM NM
AMRAD HOLLOMAN 115 1 121 121 225 NM NM ANTHONY ARROYO 115 1 114 114 244 NM NM ANTHONY BORDER STEEL 115 1 165 220 52 NM TX ANTHONY SALOPEK 115 1 165 220 173 NM NM ANTHONY NEWMAN 115 1 165 212 123 NM TX ANTHONY NUWAY 115 1 165 220 66 NM TX ASCARATE TROWBRIDGE 115 1 181 181 05 TX TX ASCARATE COPPER 115 1 185 246 14 TX TX ASCARATE JUAREZ 115 1 185 247 24 TX AUSTIN MARLOW 115 1 227 227 12 TX TX BIGGS BLISS
INDUSTRIAL 115 1 185 246 22 TX TX
BLISS INDUSTRIAL
LIBERTY 115 1 185 246 22 TX TX
BUTTERFIELD FT BLISS 115 1 135 180 19 TX TX CALIENTE DIAMOND HEAD 115 1 185 247 61 TX TX CALIENTE MPS 115 1 69 87 85 TX TX CALIENTE MPS 115 2 268 332 31 TX TX CALIENTE MPS 115 3 268 332 31 TX TX CALIENTE VISTA 115 1 166 221 66 TX TX CHAPARRAL ORO GRANDE 115 1 135 165 354 NM NM COPPER PENDALE 115 1 185 246 51 TX TX
Page 2 of 7
EL PASO ELECTRIC COMPANY Existing 115 kV and Above
Internal Lines
RATING LENGTH STATE
From To kV Circuit MVA
Normal MVA
Emerg Miles From To COYOTE RGC_DELL CITY 115 1 23 23 108 TX TX COYOTE MONTWOOD 115 1 185 246 79 TX NM CROMO RIO GRANDE 115 1 135 180 09 TX TX DIABLO RIO GRANDE 115 1 332 441 29 NM TX DIABLO RIO GRANDE 115 2 332 441 29 NM NM DIABLO JUAREZ 115 1 185 247 23 NM DIAMOND HEAD
LANE 115 1 185 247 28 TX TX
DURAZNO ASCARATE 115 1 185 246 33 TX NM DYER SHEARMAN 115 1 135 180 96 TX TX DYER AUSTIN 115 1 185 246 21 TX TX EXECUTIVE RIO GRANDE 115 1 271 359 29 TX TX FT BLISS AUSTIN 115 1 135 180 18 TX TX GLOBAL REACH
VISTA 115 1 329 329 30 TX TX
HATCH JORNADA 115 1 45 45 334 NM NM JORNADA ARROYO 115 1 79 79 49 NM NM LANE WRANGLER 115 1 165 220 10 TX TX LAS CRUCES ARROYO 115 1 165 220 41 NM NM LAS CRUCES SALOPEK 115 1 165 220 50 NM NM LEO EAST DYER 115 1 185 246 38 TX TX LEO EAST MILAGRO 115 1 185 246 44 TX TX LIBERTY GLOBAL REACH 115 1 185 246 26 TX TX MAR LARGO 115 1 29 29 114 NM NM MARLOW TROWBRIDGE 115 1 181 181 11 TX TX MESA AUSTIN 115 1 165 220 61 TX TX MESA RIO GRANDE 115 1 268 268 23 TX NM MILAGRO NEWMAN 115 1 185 246 63 TX TX MONTWOOD CALIENTE 115 1 185 246 50 TX TX MPS COYOTE 115 1 249 387 31 TX TX MPS MONTWOOD 115 1 249 387 70 TX TX NEWMAN CHAPARRAL 115 1 135 180 29 TX NM NEWMAN BUTTERFIELD 115 1 135 280 167 TX TX NEWMAN SHEARMAN 115 1 135 280 73 TX TX NEWMAN PIPELINE 115 1 185 246 98 TX TX NEWMAN PICANTE 115 1 185 246 136 TX TX NUWAY MONTOYA 115 1 165 220 36 TX TX ORO GRANDE AMRAD 115 1 135 165 123 NM NM ORO GRANDE WHITE SANDS 115 1 75 75 228 NM NM PATRIOT NEWMAN 115 1 135 180 15 TX TX PATRIOT CROMO 115 1 135 180 184 TX TX PELICANO HORIZON 115 1 185 246 67 TX TX
Page 3 of 7
EL PASO ELECTRIC COMPANY Existing 115 kV and Above
Internal Lines
RATING LENGTH STATE
From To kV Circuit MVA
Normal MVA
Emerg Miles From To PELICANO MONTWOOD 115 1 185 246 38 TX TX PENDALE LANE 115 1 185 246 15 TX TX PICANTE GLOBAL REACH 115 1 185 246 60 TX TX PICANTE BIGGS 115 1 185 246 23 TX TX PIPELINE BIGGS 115 1 135 180 136 TX TX RIO GRANDE RIPLEY 115 1 165 220 30 NM TX RIPLEY THORN 115 1 135 180 19 TX TX SALOPEK ARROYO 115 1 135 180 107 NM NM SANTA TERESA MONTOYA 115 1 185 246 74 NM TX SANTA TERESA DIABLO 115 1 169 225 89 NM NM SCOTSDALE VISTA 115 1 135 180 52 TX TX SOL LANE 115 1 135 180 21 TX TX SOL VISTA 115 1 185 246 20 TX TX SPARKS HORIZON 115 1 185 246 38 TX TX SUNSET NORTH DURAZNO 115 1 185 246 46 TX TX SUNSET NORTH EXECUTIVE 115 1 271 359 23 TX TX THORN MONTOYA 115 1 135 180 30 TX TX WRANGLER SPARKS 115 1 185 246 40 TX TX
- Internal refers to lines within EPEs Balancing Area including lines connecting EPE to neighboring utilities however not including line segments partially owned by EPE external to EPEs control area
- Some transmission lines were identified to be capacity limited by smaller jumpers connected at the substations The line ratings reflected in the above table are based on-line jumper upgrade assumptions
- The ratings are generally based on conductor thermal capacities but may be derated due to sag limitations or other factors
- RGC_DC is Rio Grande Electric Cooperative Dell City - Emerg is short for Emergency
Page 4 of 7
TABLE 2 Existing 115 kV EPE Substation Transformers
EL PASO ELECTRIC COMPANY
Existing 115 kV Load amp Step-up Substation Transformers
RATING Normal Emergency State
MVA MVA AIRPORT 115239 336 376 NM AMRAD 115249 85 95 NM
ANTHONY T1 115239 336 376 NM ANTHONY T2 115239 560 627 NM ARROYO T2 115239 336 376 NM ARROYO T4 115239 336 376 NM
ASCARATE T4 11569 112 1288 TX ASCARATE T5 11569 112 1288 TX
AUSTIN T1 115138 500 560 TX AUSTIN T2 115138 560 627 TX
BORDER STEEL 115 T1 115138 392 439 TX
BORDER STEEL 115 T2 115138 392 439 TX BUTTERFIELD T1 115138 300 336 TX BUTTERFIELD T2 115138 300 336 TX
CALIENTE T3 115138 336 376 TX CENTRAL TEMP T1 115138 336 376 TX
CHAPARRAL T1 115138 336 376 NM CHAPARRAL T2 115138 336 376 NM
COPPER T1 115138 300 336 TX COPPER GEN T2 138115 840 941 TX
COX T2 11569 560
644 NM COYOTE T1 115138 300 336 TX CROMO T1 115138 300 336 TX CROMO T2 115138 336 376 TX
DIAMOND HEAD T1 115138 336 376 TX DURAZNO T1 115138 336 376 TX
DYER T3 11569 112 1288 TX EMRLD T1 115138 125 140 NM
EXECUTIVE T1 115138 560 627 TX EXECUTIVE T2 115138 560 627 TX
FT BLISS T1 115138 560 627 TX FT BLISS T2 115132 280 314 TX
GLOBAL REACH T1 115138 336 376 TX GLOBAL REACH T2 115138 560 627 TX
Page 5 of 7
EL PASO ELECTRIC COMPANY
Existing 115 kV Load amp Step-up Substation Transformers
RATING Normal Emergency State
MVA MVA HATCH T1 115249 300 336 NM
HORIZON T1 115138 336 376 TX JORNADA T1 115239 336 376 NM JORNADA T2 115239 560 627 NM
LANE T1 11569 100 115 TX LANE T2 115138 300 336 TX
LAS CRUCES T1 115239 672 753 NM LAS CRUCES T2 115239 672 753 NM
LEO EAST T1 115138 336 376 TX LEO EAST T2 115138 336 376 TX
MAR T1 11542 112 125 NM MESA T1 115138 300 336 TX MESA T2 115138 336 376 TX
MILAGRO T1 115138 336 376 TX MILAGRO T2 115138 336 376 TX MILAGRO T3 115138 336 376 TX MONTOYA T1 115249 336 376 TX MONTOYA T2 115239 560 627 TX MONTOYA T3 115239 560 627 TX
MONTWOOD T1 115239 560 627 TX MONTWOOD T3 115239 560 627 TX
MPS T1 138115 1400 1568 TX MPS T2 138115 1400 1568 TX MPS T3 138115 1400 1568 TX MPS T4 138115 1400 1568 TX
NEWMAN G1(T2) 138115 1254 1405 TX NEWMAN G2 (T6) 138115 1254 1405 TX NEWMAN G3 (T8) 138115 1254 1405 TX
NEWMAN 4G1 (T11) 138115 1250 1400 TX NEWMAN 4G2 (T9) 138115 1250 1400 TX NEWMAN 4S1 (T13) 138115 1250 1400 TX NEWMAN 5G1 (T15) 138115 1300 1456 TX NEWMAN 5G2 (T16) 138115 1300 1456 TX NEWMAN 5S1 (T14) 138115 1750 196 TX
NUWAY T1 115239 560 627 TX NUWAY T2 115239 560 627 TX
Page 6 of 7
EL PASO ELECTRIC COMPANY
Existing 115 kV Load amp Step-up Substation Transformers
RATING Normal Emergency State
MVA MVA PATRIOT T1 115138 336 376 TX
PELICANO T1 115239 560 627 TX PELICANO T2 115239 560 627 TX PENDALE T1 115138 336 376 TX PENDALE T2 115138 560 627 TX PICACHO T1 115249 560 627 NM REDEYE T1 115138 140 157 NM
RIO GRANDE T1 11569 112 1288 NM RIO GRANDE T2 11569 112 1288 NM
RIO GRANDE G8 (T7) 175115 1680 1882 NM RIO GRANDE G9 (T17) 138115 1320 1478 NM
RIPLEY T1 115138 336 376 TX RIPLEY T2 115138 560 627 TX
SALOPEK T1 115249 280 314 NM SALOPEK T2 115249 280 314 NM SALOPEK T3 115249 280 314 NM
SANTA TERESA T1 115239 336 376 NM SANTA TERESA T2 115239 336 376 NM
SCOTSDALE T1 11569 112 1288 TX SCOTSDALE T4 115138 560 627 TX SCOTSDALE T5 115138 560 627 TX SHEARMAN T1 115138 300 336 TX
SOL T1 115138 336 376 TX SOL T2 115138 300 336 TX
SPARKS T1 115138 336 376 TX SPARKS T2 115138 560 627 TX SPARKS T3
11569 100 115 TX
SUNSET NORTH T1 115138 336 376 TX SUNSET NORTH T2 115138 336 376 TX SUNSET NORTH T3 11569 112 1288 TX
TALAVERA TEMP T1 115239 165 185 NM THORN T1 115138 336 376 TX THORN T2 115138 336 376 TX
TRIUMPH TEMP T1 115239 336 376 TX VISTA T1 115138 300 336 TX VISTA T2 115138 300 336 TX
Page 7 of 7
EL PASO ELECTRIC COMPANY
Existing 115 kV Load amp Step-up Substation Transformers
RATING Normal Emergency State
MVA MVA WHITE SANDS T1 115138 300 336 NM
WRANGLER T1 115138 500 560 TX
Attachment C-2 Existing Units Operating CharacteristicsCapacity Factor ()Resources 2021 2024 2025 2027 2031 2035 2040 2045Newman 1 2 0 0 0 0 0 0 0Newman 2 1 0 0 0 0 0 0 0Newman 3 10 3 0 1 0 0 0 0Newman 4 14 5 2 3 1 0 0 0Newman 5 64 54 38 41 44 40 41 47Newman 6 0 12 7 8 6 3 4 6Copper 2 0 0 0 0 0 0 0Montana 1 26 29 20 21 20 11 19 23Montana 2 26 28 19 21 21 14 23 24Montana 3 17 17 13 14 12 5 11 16Montana 4 50 42 30 32 28 23 28 28Rio Grande 7 0 0 0 0 0 0 0 0Rio Grande 8 3 1 0 0 0 0 0 0Rio Grande 9 13 5 2 3 3 0 0 2Gas Peaker 0 0 0 0 0 3 3 5Palo Verde 1 94 94 94 94 94 94 94 94Palo Verde 2 94 94 94 94 94 94 94 94Palo Verde 3 94 94 94 94 94 94 94 94
Fuel Cost ($000)Resources 2021 2024 2025 2027 2031 2035 2040 2045Newman 1 431$ -$ -$ -$ -$ -$ -$ -$ Newman 2 273$ -$ -$ -$ -$ -$ -$ -$ Newman 3 2299$ 667$ 55$ 248$ 46$ -$ -$ -$ Newman 4 7893$ 2755$ 1080$ 1435$ 716$ -$ -$ -$ Newman 5 31126$ 24367$ 17006$ 19659$ 22951$ 21785$ 24625$ 28990$ Newman 6 -$ 5465$ 3596$ 4364$ 3762$ 1579$ 2380$ 4155$ Copper 1076$ 70$ -$ -$ -$ -$ -$ -$ Montana 1 4595$ 4852$ 3414$ 3784$ 4030$ 2455$ 4318$ 5534$ Montana 2 5153$ 5102$ 3468$ 4056$ 4447$ 3079$ 5285$ 5678$ Montana 3 3332$ 3087$ 2371$ 2768$ 2638$ 1279$ 2780$ 4139$ Montana 4 9507$ 7298$ 5383$ 5946$ 5665$ 4884$ 6297$ 6488$ Rio Grande 7 93$ -$ -$ -$ -$ -$ -$ -$ Rio Grande 8 1340$ 264$ 49$ 93$ -$ -$ -$ -$ Rio Grande 9 2675$ 987$ 413$ 603$ 706$ 42$ 22$ 429$ Gas Peaker -$ -$ -$ -$ -$ 1081$ 2239$ 5645$ Palo Verde 1 12111$ 12185$ 12222$ 12259$ 12370$ 12500$ 12667$ 12834$ Palo Verde 2 12169$ 12244$ 12281$ 12318$ 12430$ 12561$ 12728$ 12896$ Palo Verde 3 12111$ 12185$ 12222$ 12259$ 12370$ 12500$ 12667$ 12834$
Heat Rate (MMBtuMWh)Newman 1 1228Newman 2 1151Newman 3 1097Newman 4 1012Newman 5 7741Newman 6 10101Copper 19916Montana 1 9373Montana 2 9334Montana 3 9933Montana 4 9339Rio Grande 7 1179Rio Grande 8 11902Rio Grande 9 9881Gas Peaker 10101Palo Verde 1 10Palo Verde 2 10Palo Verde 3 10
Page 1 of 2
Attachment C-2 Existing Units Operating CharacteristicsFixed OampM ($000)Resources 2021 2024 2025 2027 2031 2035 2040 2045Newman 1 1704$ 5737$ 5737$ 5737$ -$ -$ -$ -$ Newman 2 1789$ -$ -$ -$ -$ -$ -$ -$ Newman 3 2221$ 2221$ 2221$ 5231$ 5231$ -$ -$ -$ Newman 4 5014$ 5014$ 5014$ 10769$ 10769$ -$ -$ -$ Newman 5 5563$ 5563$ 5563$ 5563$ 5563$ 5563$ 5563$ 5563$ Newman 6 -$ 2752$ 2752$ 2752$ 2752$ 2752$ 2752$ 2752$ Copper 1167$ 1167$ 1167$ 1167$ -$ -$ -$ -$ Montana 1 1613$ 1613$ 1613$ 1613$ 1613$ 1613$ 1613$ 1613$ Montana 2 1623$ 1623$ 1623$ 1623$ 1623$ 1623$ 1623$ 1623$ Montana 3 1484$ 1484$ 1484$ 1484$ 1484$ 1484$ 1484$ 1484$ Montana 4 1076$ 1076$ 1076$ 1076$ 1076$ 1076$ 1076$ 1076$ Rio Grande 7 1612$ -$ -$ -$ -$ -$ -$ -$ Rio Grande 8 4346$ 4346$ 4346$ 4346$ 4346$ -$ -$ -$ Rio Grande 9 2495$ 2495$ 2495$ 2495$ 2495$ 2495$ 2495$ 2495$ Gas Peaker -$ -$ -$ -$ -$ 1697$ 3312$ 4621$ Palo Verde 1 28313$ 28313$ 28313$ 28313$ 28313$ 28313$ 28313$ 28313$ Palo Verde 2 28313$ 28313$ 28313$ 28313$ 28313$ 28313$ 28313$ 28313$ Palo Verde 3 28313$ 28313$ 28313$ 28313$ 28313$ 28313$ 28313$ 28313$
Variable OampM ($000)Resources 2021 2024 2025 2027 2031 2035 2040 2045Newman 1 466$ -$ -$ -$ -$ -$ -$ -$ Newman 2 415$ -$ -$ -$ -$ -$ -$ -$ Newman 3 2388$ 695$ 57$ 257$ 48$ -$ -$ -$ Newman 4 8305$ 2887$ 1130$ 1497$ 744$ -$ -$ -$ Newman 5 33855$ 26821$ 18189$ 21158$ 24347$ 22746$ 25862$ 30331$ Newman 6 -$ 5964$ 3916$ 4688$ 3914$ 1639$ 2464$ 4299$ Copper 1581$ 282$ -$ -$ -$ -$ -$ -$ Montana 1 5119$ 5348$ 3764$ 4110$ 4219$ 2540$ 4463$ 5714$ Montana 2 5832$ 5707$ 3805$ 4427$ 4663$ 3195$ 5491$ 5881$ Montana 3 3700$ 3494$ 2602$ 3032$ 2777$ 1335$ 2895$ 4307$ Montana 4 10379$ 8028$ 6003$ 6579$ 6106$ 5134$ 6673$ 6808$ Rio Grande 7 161$ -$ -$ -$ -$ -$ -$ -$ Rio Grande 8 1700$ 269$ 50$ 94$ -$ -$ -$ -$ Rio Grande 9 3001$ 1138$ 487$ 689$ 741$ 44$ 23$ 447$ Gas Peaker -$ -$ -$ -$ -$ 1122$ 2319$ 5841$ Palo Verde 1 15537$ 15612$ 15649$ 15686$ 15797$ 15927$ 16094$ 16261$ Palo Verde 2 15613$ 15687$ 15724$ 15762$ 15873$ 16004$ 16172$ 16339$ Palo Verde 3 15537$ 15612$ 15649$ 15686$ 15797$ 15927$ 16094$ 16261$
Market Price
Year
Average Annual Price ($MWh)
2021 2024$ 2022 2043$ 2023 2050$ 2024 2008$ 2025 2020$ 2026 2007$ 2027 1981$ 2028 1998$ 2029 1919$ 2030 1863$ 2031 1927$ 2032 2020$ 2033 2009$ 2034 2021$ 2035 2016$ 2036 2031$ 2037 1998$ 2038 1927$ 2039 1895$ 2040 1836$ 2041 1843$ 2042 1832$ 2043 1825$ 2044 1895$ 2045 2025$
Page 2 of 2
Attachment D-1 E3 EPE Report Model Results June Page 1 of 34
Scenario Resource Type 2021 2024 2025 2027 2031 2035 2040 2045Least-Cost (Reference Case) Nuclear (Palo Verde) 5148 5148 5148 5148 5148 5148 5148 5148
Nuclear (SMR) - - - - - - - - Gas - Steam Turbine 140 34 7 3 - - - - Gas - Combined Cycle 1767 1373 1022 1111 1130 1065 1318 1502 Gas - Combustion Turbine 1027 1169 836 880 773 754 1250 1640 Biomass - - - - - - - - Geothermal - - - - - - - - Wind - - 379 382 375 336 409 720 Solar 289 952 1467 1551 2200 3058 3443 4239 Battery Storage - 12 (26) (48) (129) (217) (220) (250) Imports 391 336 260 259 282 273 358 440 Demand Response - - - - - - - - Hydrogen - - - - - - - - BTM Solar 37 135 165 225 344 460 601 763 Load 8771 9155 9258 9512 10123 10878 12308 14203 Excess Generation 14 130 430 342 496 657 373 475
Least-Cost Case + ETA Resources Nuclear (Palo Verde) 5148 5148 5148 5148 5148 5148 5148 5148 Nuclear (SMR) - - - - - - - - Gas - Steam Turbine 140 34 3 3 - - - - Gas - Combined Cycle 1767 1373 898 963 998 899 1053 1145 Gas - Combustion Turbine 1027 1169 720 761 686 461 790 1043 Biomass - - - - - - - - Geothermal - - - - - - - - Wind - - 670 688 675 555 653 815 Solar 289 953 1464 1530 2211 3351 4068 5345 Battery Storage - 12 (31) (45) (122) (241) (281) (370) Imports 391 336 220 239 184 245 275 314 Demand Response - - - - - - - - Hydrogen - - - - - - - - BTM Solar 37 135 165 225 344 460 601 763 Load 8771 9155 9258 9512 10123 10878 12308 14203 Excess Generation 14 130 564 480 558 1272 1040 940
Separate System Planning Nuclear (Palo Verde) 5148 5148 5148 5148 5148 5148 5148 5148 Nuclear (SMR) - - - - - - - - Gas - Steam Turbine 140 34 1 2 - - - - Gas - Combined Cycle 1766 1388 1031 1122 1141 969 1192 1385 Gas - Combustion Turbine 1040 1177 754 831 807 477 795 1105 Biomass - - - - - - - - Geothermal - - - - - - - - Wind - - 305 306 295 182 165 412 Solar 289 949 1648 1690 2236 3708 4532 5512 Battery Storage - 12 (54) (60) (138) (295) (350) (405) Imports 391 327 259 247 291 229 225 282 Demand Response - - - - - - - - Hydrogen - - - - - - - - BTM Solar 37 135 165 225 344 460 601 763 Load 8771 9155 9258 9512 10123 10878 12308 14203 Excess Generation 14 134 450 407 444 1288 2358 2353
Annual Energy (GWh)
Attachment D-1 E3 EPE Report Model Results June Page 2 of 34
Scenario Resource Type 2021 2024 2025 2027 2031 2035 2040 2045Annual Energy (GWh)
Separate System Planning (w H2) Nuclear (Palo Verde) 5148 5148 5148 5148 5148 5148 5148 5148 Nuclear (SMR) - - - - - - - - Gas - Steam Turbine 140 34 1 2 - - - - Gas - Combined Cycle 1766 1388 979 1049 1090 1035 1153 1384 Gas - Combustion Turbine 1040 1177 728 819 735 688 779 1129 Biomass - - - - - - - - Geothermal - - - - - - - - Wind - - 447 451 433 405 510 657 Solar 289 949 1594 1633 2242 3101 4087 5075 Battery Storage - 12 (56) (60) (136) (218) (297) (352) Imports 391 327 251 245 266 260 261 327 Demand Response - - - - - - - - Hydrogen - - - - - - 65 71 BTM Solar 37 135 165 225 344 460 601 763 Load 8771 9155 9258 9512 10123 10878 12308 14203 Excess Generation 14 133 444 402 574 772 872 919
Low Load Growth Nuclear (Palo Verde) 5148 5148 5148 5148 5148 5148 5148 5148 Nuclear (SMR) - - - - - - - - Gas - Steam Turbine 101 27 2 3 - - - - Gas - Combined Cycle 1596 1244 978 1065 1127 1025 1258 1472 Gas - Combustion Turbine 983 1065 799 875 806 644 1109 1492 Biomass - - - - - - - - Geothermal - - - - - - - - Wind - - 333 336 335 291 350 562 Solar 282 919 1293 1309 1805 2833 3220 3993 Battery Storage - 8 (29) (29) (96) (209) (215) (245) Imports 381 325 269 262 289 268 342 437 Demand Response - - - - - - - - Hydrogen - - - - - - - - BTM Solar 37 135 165 225 344 460 601 763 Load 8492 8862 8958 9194 9759 10459 11813 13623 Excess Generation 22 163 337 318 410 642 359 427
High Load Growth Nuclear (Palo Verde) 5148 5148 5148 5148 5148 5148 5148 5148 Nuclear (SMR) - - - - - - - - Gas - Steam Turbine 195 50 5 3 - - - - Gas - Combined Cycle 1909 1522 1067 1151 1118 1107 1388 1500 Gas - Combustion Turbine 1088 1256 865 914 776 867 1411 1747 Biomass - - - - - - - - Geothermal - - - - - - - - Wind - - 431 436 413 396 463 976 Solar 293 983 1651 1751 2569 3257 3642 4464 Battery Storage - 14 (47) (68) (159) (222) (222) (256) Imports 400 343 272 271 280 284 372 441 Demand Response - - - - - - - - Hydrogen - - - - - - - - BTM Solar 37 135 165 225 344 460 601 763 Load 9050 9447 9558 9830 10488 11297 12803 14783 Excess Generation 10 100 394 290 554 655 385 540
Attachment D-1 E3 EPE Report Model Results June Page 3 of 34
Scenario Resource Type 2021 2024 2025 2027 2031 2035 2040 2045Annual Energy (GWh)
High DG Nuclear (Palo Verde) 5148 5148 5148 5148 5148 5148 5148 5148 Nuclear (SMR) - - - - - - - - Gas - Steam Turbine 134 31 7 3 - - - - Gas - Combined Cycle 1728 1317 1001 1081 1111 1060 1266 1473 Gas - Combustion Turbine 1028 1123 814 825 742 696 1097 1614 Biomass - - - - - - - - Geothermal - - - - - - - - Wind - - 367 372 368 326 391 916 Solar 285 866 1263 1278 1665 2340 2627 2711 Battery Storage - 11 (25) (45) (126) (227) (245) (244) Imports 389 314 247 241 269 260 345 440 Demand Response - - - - - - - - Hydrogen - - - - - - - - BTM Solar 88 350 436 608 945 1276 1680 2144 Load 8771 9155 9258 9512 10123 10878 12308 14203 Excess Generation 18 217 513 492 614 714 600 432
High DSM Nuclear (Palo Verde) 5148 5148 5148 5148 5148 5148 5148 5148 Nuclear (SMR) - - - - - - - - Gas - Steam Turbine 133 30 2 3 0 - - - Gas - Combined Cycle 1744 1303 1041 1126 1198 1029 1234 1463 Gas - Combustion Turbine 1020 1111 869 907 900 610 1026 1407 Biomass - - - - - - - - Geothermal - - - - - - - - Wind - - 244 244 251 207 249 470 Solar 288 934 1332 1337 1621 2752 3114 3719 Battery Storage - 10 (28) (29) (86) (205) (213) (233) Imports 390 329 283 268 304 271 342 439 Demand Response - - - - - - - - Hydrogen - - - - - - - - BTM Solar 37 135 165 225 344 460 601 763 Load 8731 8994 9056 9230 9680 10273 11501 13177 Excess Generation 15 148 318 313 263 643 371 372
No New Gas Nuclear (Palo Verde) 5148 5148 5148 5148 5148 5148 5148 5148 Nuclear (SMR) - - - - - - - - Gas - Steam Turbine 140 34 6 3 - - - - Gas - Combined Cycle 1767 1373 984 1072 1095 716 702 637 Gas - Combustion Turbine 1027 1169 811 849 745 180 216 207 Biomass - - - - - - - - Geothermal - - - - - - - - Wind - - 455 462 452 210 208 210 Solar 289 952 1467 1545 2197 4287 5691 7680 Battery Storage - 12 (27) (47) (127) (348) (472) (649) Imports 391 336 251 255 270 225 213 206 Demand Response - - - - - - - - Hydrogen - - - - - - - - BTM Solar 37 135 165 225 344 460 601 763 Load 8771 9155 9258 9512 10123 10878 12308 14203 Excess Generation 14 130 458 372 536 2237 2586 3219
Attachment D-1 E3 EPE Report Model Results June Page 4 of 34
Scenario Resource Type 2021 2024 2025 2027 2031 2035 2040 2045Annual Energy (GWh)
No Lifetime Extensions Nuclear (Palo Verde) 5148 5148 5148 5148 5148 5148 5148 5148 Nuclear (SMR) - - - - - - - - Gas - Steam Turbine 140 34 2 0 - - - - Gas - Combined Cycle 1767 1373 948 1015 1050 1056 1308 1502 Gas - Combustion Turbine 1027 1169 707 680 634 745 1242 1640 Biomass - - - - - - - - Geothermal - - - - - - - - Wind - - 397 400 370 364 442 722 Solar 289 953 1693 1897 2475 3050 3432 4237 Battery Storage - 12 (38) (94) (164) (216) (219) (250) Imports 391 336 235 241 267 271 354 440 Demand Response - - - - - - - - Hydrogen - - - - - - - - BTM Solar 37 135 165 225 344 460 601 763 Load 8771 9155 9258 9512 10123 10878 12308 14203 Excess Generation 14 129 634 428 592 661 374 475
High Gas Price Nuclear (Palo Verde) 5148 5148 5148 5148 5148 5148 5148 5148 Nuclear (SMR) - - - - - - - - Gas - Steam Turbine 125 31 3 3 - - - - Gas - Combined Cycle 1787 1400 983 1060 1062 999 1234 1347 Gas - Combustion Turbine 1008 1120 764 786 698 607 1121 1361 Biomass - - - - - - - - Geothermal - - - - - - - - Wind - - 486 493 483 422 516 926 Solar 290 956 1465 1542 2190 3165 3570 4490 Battery Storage - 9 (31) (46) (126) (226) (232) (274) Imports 403 360 274 301 325 303 350 440 Demand Response - - - - - - - - Hydrogen - - - - - - - - BTM Solar 37 135 165 225 344 460 601 763 Load 8771 9155 9258 9512 10123 10878 12308 14203 Excess Generation 13 127 470 386 546 811 486 705
Low Carbon Price Nuclear (Palo Verde) 5148 5148 5148 5148 5148 5148 5148 5148 Nuclear (SMR) - - - - - - - - Gas - Steam Turbine 127 23 3 3 - - - - Gas - Combined Cycle 1803 1433 955 1021 1036 971 1189 1333 Gas - Combustion Turbine 1001 1107 711 750 678 571 1063 1333 Biomass - - - - - - - - Geothermal - - - - - - - - Wind - - 609 624 604 523 642 936 Solar 289 958 1476 1548 2179 3178 3576 4573 Battery Storage - 11 (32) (45) (124) (229) (234) (279) Imports 394 345 223 238 258 256 322 395 Demand Response - - - - - - - - Hydrogen - - - - - - - - BTM Solar 37 135 165 225 344 460 601 763 Load 8771 9155 9258 9512 10123 10878 12308 14203 Excess Generation 14 125 512 426 579 876 532 725
Attachment D-1 E3 EPE Report Model Results June Page 5 of 34
Scenario Resource Type 2021 2024 2025 2027 2031 2035 2040 2045Annual Energy (GWh)
Medium Carbon Price Nuclear (Palo Verde) 5148 5148 5148 5148 5148 5148 5148 5148 Nuclear (SMR) - - - - - - - - Gas - Steam Turbine 120 22 3 3 - - - - Gas - Combined Cycle 1822 1496 876 941 974 922 1115 1270 Gas - Combustion Turbine 983 1036 548 590 606 475 950 1199 Biomass - - - - - - - - Geothermal - - - - - - - - Wind - - 754 779 766 646 805 1098 Solar 290 961 1600 1663 2221 3268 3695 4746 Battery Storage - 7 (37) (47) (122) (230) (242) (293) Imports 399 354 200 210 187 190 235 271 Demand Response - - - - - - - - Hydrogen - - - - - - - - BTM Solar 37 135 165 225 344 460 601 763 Load 8771 9155 9258 9512 10123 10878 12308 14203 Excess Generation 13 121 763 676 588 911 560 726
High Carbon Price Nuclear (Palo Verde) 5148 5148 5148 5148 5148 5148 5148 5148 Nuclear (SMR) - - - - - - - - Gas - Steam Turbine 119 21 2 3 0 - - - Gas - Combined Cycle 1835 1540 658 724 862 872 979 832 Gas - Combustion Turbine 962 989 428 458 488 393 630 544 Biomass - - - - - - - - Geothermal - - - - - - - - Wind - - 869 904 927 776 940 832 Solar 290 963 1847 1900 2307 3272 4088 6364 Battery Storage - 2 (40) (46) (115) (230) (271) (474) Imports 408 362 181 195 162 187 193 192 Demand Response - - - - - - - - Hydrogen - - - - - - - - BTM Solar 37 135 165 225 344 460 601 763 Load 8771 9155 9258 9512 10123 10878 12308 14203 Excess Generation 13 120 1270 1182 882 1065 1041 1596
80 Clean by 2035 Nuclear (Palo Verde) 5148 5148 5148 5148 5148 5148 5148 5148 Nuclear (SMR) - - - - - - - - Gas - Steam Turbine 140 34 7 3 - - - - Gas - Combined Cycle 1767 1373 1022 1111 1127 1050 1159 1295 Gas - Combustion Turbine 1027 1169 836 880 766 696 1057 1256 Biomass - - - - - - - - Geothermal - - - - - - - - Wind - - 379 382 375 331 683 1029 Solar 289 952 1466 1551 2212 3155 3653 4715 Battery Storage - 12 (26) (48) (129) (224) (234) (290) Imports 391 336 261 260 278 264 240 286 Demand Response - - - - - - - - Hydrogen - - - - - - - - BTM Solar 37 135 165 225 344 460 601 763 Load 8771 9155 9258 9512 10123 10878 12308 14203 Excess Generation 14 130 431 343 514 770 469 738
Attachment D-1 E3 EPE Report Model Results June Page 6 of 34
Scenario Resource Type 2021 2024 2025 2027 2031 2035 2040 2045Annual Energy (GWh)
20 CO2 Red by 2040 Nuclear (Palo Verde) 5148 5148 5148 5148 5148 5148 5148 5148 Nuclear (SMR) - - - - - - - - Gas - Steam Turbine 140 34 7 3 - - - - Gas - Combined Cycle 1767 1373 1022 1111 1130 1065 1318 1342 Gas - Combustion Turbine 1027 1169 836 880 773 751 1249 1353 Biomass - - - - - - - - Geothermal - - - - - - - - Wind - - 379 382 375 336 409 927 Solar 289 952 1466 1549 2204 3061 3445 4548 Battery Storage - 12 (26) (48) (129) (217) (220) (277) Imports 391 336 261 262 277 274 357 397 Demand Response - - - - - - - - Hydrogen - - - - - - - - BTM Solar 37 135 165 225 344 460 601 763 Load 8771 9155 9258 9512 10123 10878 12308 14203 Excess Generation 14 130 431 345 491 655 371 705
40 CO2 Red by 2040 Nuclear (Palo Verde) 5148 5148 5148 5148 5148 5148 5148 5148 Nuclear (SMR) - - - - - - - - Gas - Steam Turbine 140 34 7 3 - - - - Gas - Combined Cycle 1767 1373 1022 1111 1127 1051 1133 1135 Gas - Combustion Turbine 1027 1169 836 880 766 696 980 985 Biomass - - - - - - - - Geothermal - - - - - - - - Wind - - 379 382 375 331 763 1034 Solar 289 953 1466 1549 2211 3151 3692 5268 Battery Storage - 12 (26) (48) (128) (224) (241) (350) Imports 391 336 261 262 279 265 232 219 Demand Response - - - - - - - - Hydrogen - - - - - - - - BTM Solar 37 135 165 225 344 460 601 763 Load 8771 9155 9258 9512 10123 10878 12308 14203 Excess Generation 14 129 432 345 515 768 533 965
60 CO2 Red by 2040 Nuclear (Palo Verde) 5148 5148 5148 5148 5148 5148 5148 5148 Nuclear (SMR) - - - - - - - - Gas - Steam Turbine 140 34 7 3 - - - - Gas - Combined Cycle 1767 1373 1022 1111 1127 1052 864 852 Gas - Combustion Turbine 1027 1169 836 880 766 698 561 560 Biomass - - - - - - - - Geothermal - - - - - - - - Wind - - 379 382 375 331 927 838 Solar 289 953 1466 1552 2213 3150 4319 6337 Battery Storage - 12 (26) (48) (128) (224) (276) (470) Imports 391 336 261 259 278 263 164 174 Demand Response - - - - - - - - Hydrogen - - - - - - - - BTM Solar 37 135 165 225 344 460 601 763 Load 8771 9155 9258 9512 10123 10878 12308 14203 Excess Generation 14 130 432 342 513 769 1338 1586
Attachment D-1 E3 EPE Report Model Results June Page 7 of 34
Scenario Resource Type 2021 2024 2025 2027 2031 2035 2040 2045Annual Energy (GWh)
80 CO2 Red by 2040 Nuclear (Palo Verde) 5148 5148 5148 5148 5148 5148 5148 5148 Nuclear (SMR) - - - - - - - - Gas - Steam Turbine 140 34 3 3 - - - - Gas - Combined Cycle 1767 1373 910 976 1017 907 577 550 Gas - Combustion Turbine 1027 1169 734 777 696 468 168 183 Biomass - - - - - - - - Geothermal - - - - - - - - Wind - - 638 654 638 532 1260 1231 Solar 289 952 1463 1531 2158 3371 4812 6758 Battery Storage - 12 (30) (45) (123) (239) (338) (517) Imports 391 336 227 241 245 232 80 88 Demand Response - - - - - - - - Hydrogen - - - - - - - - BTM Solar 37 135 165 225 344 460 601 763 Load 8771 9155 9258 9512 10123 10878 12308 14203 Excess Generation 14 130 546 461 605 1183 2430 2751
90 CO2 Red by 2040 Nuclear (Palo Verde) 5148 5148 5148 5148 5148 5148 5148 5148 Nuclear (SMR) - - - - - - - - Gas - Steam Turbine 140 34 3 3 - - - - Gas - Combined Cycle 1767 1373 910 978 1018 808 340 313 Gas - Combustion Turbine 1027 1169 736 776 696 320 41 58 Biomass - - - - - - - - Geothermal - - - - - - - - Wind - - 637 655 639 463 1965 1995 Solar 289 952 1462 1527 2156 3764 4483 6350 Battery Storage - 12 (30) (45) (123) (278) (311) (472) Imports 391 336 226 244 245 193 40 47 Demand Response - - - - - - - - Hydrogen - - - - - - - - BTM Solar 37 135 165 225 344 460 601 763 Load 8771 9155 9258 9512 10123 10878 12308 14203 Excess Generation 14 130 547 465 603 1440 3210 3645
100 CO2 Red by 2040 Nuclear (Palo Verde) 5148 5148 5148 5148 5148 5148 5148 5148 Nuclear (SMR) - - - - - - - - Gas - Steam Turbine 140 34 6 3 - - - - Gas - Combined Cycle 1767 1373 984 1072 1095 716 - - Gas - Combustion Turbine 1027 1169 811 849 745 180 - - Biomass - - - - - - - - Geothermal - - - - - - - - Wind - - 455 462 452 210 969 1406 Solar 289 952 1467 1545 2197 4287 6734 7595 Battery Storage - 12 (27) (47) (127) (348) (1163) (1402) Imports 391 336 251 255 270 225 - - Demand Response - - - - - - - - Hydrogen - - - - - - - - BTM Solar 37 135 165 225 344 460 620 1455 Load 8771 9155 9258 9512 10123 10878 12308 14203 Excess Generation 14 130 458 372 536 2237 10954 12232
Attachment D-1 E3 EPE Report Model Results June Page 8 of 34
Scenario Resource Type 2021 2024 2025 2027 2031 2035 2040 2045Annual Energy (GWh)
100 CO2 Red by 2040 (w H2) Nuclear (Palo Verde) 5148 5148 5148 5148 5148 5148 5148 5148 Nuclear (SMR) - - - - - - - - Gas - Steam Turbine 140 34 3 4 - - - - Gas - Combined Cycle 1767 1373 868 928 983 689 - - Gas - Combustion Turbine 1027 1169 692 732 627 210 - - Biomass - - - - - - - - Geothermal - - - - - - - - Wind - - 743 765 755 469 1700 1650 Solar 289 952 1460 1525 2217 4074 4752 6753 Battery Storage - 12 (31) (46) (122) (300) (336) (515) Imports 391 336 209 230 171 129 - - Demand Response - - - - - - - - Hydrogen - - - - - - 442 404 BTM Solar 37 135 165 225 344 460 601 763 Load 8771 9155 9258 9512 10123 10878 12308 14203 Excess Generation 14 130 616 528 575 1636 3102 3585
Attachment D-1 E3 EPE Report Model Results June Page 9 of 34
Scenario Resource TypeLeast-Cost (Reference Case) Nuclear (Palo Verde)
Nuclear (SMR)Gas - Steam TurbineGas - Combined CycleGas - Combustion TurbineBiomassGeothermalWindSolarBattery StorageImportsDemand ResponseHydrogenBTM SolarLoadExcess Generation
Least-Cost Case + ETA Resources Nuclear (Palo Verde)Nuclear (SMR)Gas - Steam TurbineGas - Combined CycleGas - Combustion TurbineBiomassGeothermalWindSolarBattery StorageImportsDemand ResponseHydrogenBTM SolarLoadExcess Generation
Separate System Planning Nuclear (Palo Verde)Nuclear (SMR)Gas - Steam TurbineGas - Combined CycleGas - Combustion TurbineBiomassGeothermalWindSolarBattery StorageImportsDemand ResponseHydrogenBTM SolarLoadExcess Generation
2021 2024 2025 2027 2031 2035 2040 2045622 622 622 622 622 622 622 622 - - - - - - - - 426 307 307 307 234 - - - 493 493 493 493 493 266 266 266 503 731 731 731 668 952 1111 1318 - - - - - - - - - - - - - - - - - - 109 109 109 109 109 196 115 385 629 629 904 1241 1298 1580 - 50 183 256 582 1032 1116 1284 - - - - - - - - 46 53 56 61 71 81 93 93
- - - - - - - - 18 65 80 108 166 221 289 368
- - - - - - - - - - - - - - - - 622 622 622 622 622 622 622 622 - - - - - - - - 426 307 307 307 234 - - - 493 493 493 493 493 266 266 266 503 731 731 731 668 879 999 1154 - - - - - - - - - - - - - - - - - - 204 204 204 204 204 264 115 385 629 629 887 1482 1684 2050 - 50 183 236 552 1084 1252 1698 - - - - - - - - 46 53 56 61 71 81 93 93
- - - - - - - - 18 65 80 108 166 221 289 368
- - - - - - - - - - - - - - - - 622 622 622 622 622 622 622 622 - - - - - - - - 426 307 307 307 234 - - - 493 493 493 493 493 266 266 266 503 731 731 731 668 835 835 989 - - - - - - - - - - - - - - - - - - 87 87 87 87 87 159 115 385 707 707 905 1667 2322 2639 - 50 271 293 634 1480 2207 2579 - - - - - - - - 46 53 56 61 71 81 93 93
- - - - - - - - 18 65 80 108 166 221 289 368
- - - - - - - - - - - - - - - -
Installed Capacity (MW)
Attachment D-1 E3 EPE Report Model Results June Page 10 of 34
Scenario Resource TypeSeparate System Planning (w H2) Nuclear (Palo Verde)
Nuclear (SMR)Gas - Steam TurbineGas - Combined CycleGas - Combustion TurbineBiomassGeothermalWindSolarBattery StorageImportsDemand ResponseHydrogenBTM SolarLoadExcess Generation
Low Load Growth Nuclear (Palo Verde)Nuclear (SMR)Gas - Steam TurbineGas - Combined CycleGas - Combustion TurbineBiomassGeothermalWindSolarBattery StorageImportsDemand ResponseHydrogenBTM SolarLoadExcess Generation
High Load Growth Nuclear (Palo Verde)Nuclear (SMR)Gas - Steam TurbineGas - Combined CycleGas - Combustion TurbineBiomassGeothermalWindSolarBattery StorageImportsDemand ResponseHydrogenBTM SolarLoadExcess Generation
2021 2024 2025 2027 2031 2035 2040 2045Installed Capacity (MW)
622 622 622 622 622 622 622 622 - - - - - - - - 426 307 307 307 234 - - - 493 493 493 493 493 266 266 266 503 731 731 731 668 825 825 989 - - - - - - - - - - - - - - - - - - 129 129 129 129 172 212 115 385 672 672 936 1290 1645 1990 - 50 269 291 601 1038 1420 1741 - - - - - - - - 46 53 56 61 71 81 93 93
- - - - - 121 195 206 18 65 80 108 166 221 289 368
- - - - - - - - - - - - - - - - 622 622 622 622 622 622 622 622 - - - - - - - - 426 307 307 307 234 - - - 493 493 493 493 493 266 266 266 503 731 731 731 668 847 989 1182 - - - - - - - - - - - - - - - - - - 96 96 96 96 96 153 115 385 541 541 743 1162 1216 1489 - 50 192 193 454 1012 1093 1257 - - - - - - - - 46 53 56 61 71 81 93 93
- - - - - - - - 18 65 80 108 166 221 289 368
- - - - - - - - - - - - - - - - 622 622 622 622 622 622 622 622 - - - - - - - - 426 307 307 307 234 - - - 493 493 493 493 493 266 266 266 503 731 731 731 668 1062 1237 1451 - - - - - - - - - - - - - - - - - - 123 123 123 123 123 266 115 385 677 677 1046 1309 1369 1660 - 50 249 342 716 1048 1136 1307 - - - - - - - - 46 53 56 61 71 81 93 93
- - - - - - - - 18 65 80 108 166 221 289 368
- - - - - - - - - - - - - - - -
Attachment D-1 E3 EPE Report Model Results June Page 11 of 34
Scenario Resource TypeHigh DG Nuclear (Palo Verde)
Nuclear (SMR)Gas - Steam TurbineGas - Combined CycleGas - Combustion TurbineBiomassGeothermalWindSolarBattery StorageImportsDemand ResponseHydrogenBTM SolarLoadExcess Generation
High DSM Nuclear (Palo Verde)Nuclear (SMR)Gas - Steam TurbineGas - Combined CycleGas - Combustion TurbineBiomassGeothermalWindSolarBattery StorageImportsDemand ResponseHydrogenBTM SolarLoadExcess Generation
No New Gas Nuclear (Palo Verde)Nuclear (SMR)Gas - Steam TurbineGas - Combined CycleGas - Combustion TurbineBiomassGeothermalWindSolarBattery StorageImportsDemand ResponseHydrogenBTM SolarLoadExcess Generation
2021 2024 2025 2027 2031 2035 2040 2045Installed Capacity (MW)
622 622 622 622 622 622 622 622 - - - - - - - - 426 307 307 307 234 - - - 493 493 493 493 493 266 266 266 503 731 731 731 668 942 1078 1322 - - - - - - - - - - - - - - - - - - 106 106 106 106 106 249 115 385 587 587 761 1011 1092 1023 - 50 183 252 571 1043 1151 1267 - - - - - - - - 46 53 56 61 71 81 93 93
- - - - - - - - 42 169 210 293 455 614 809 1032
- - - - - - - - - - - - - - - - 622 622 622 622 622 622 622 622 - - - - - - - - 426 307 307 307 234 - - - 493 493 493 493 493 266 266 266 503 731 731 731 668 801 926 1105 - - - - - - - - - - - - - - - - - - 70 70 70 70 70 127 115 385 558 558 641 1146 1189 1384 - 50 187 191 425 1000 1070 1209 - - - - - - - - 49 66 71 82 100 101 103 103
- - - - - - - - 18 65 80 108 166 221 289 368
- - - - - - - - - - - - - - - - 622 622 622 622 622 622 622 622 - - - - - - - - 426 307 307 307 234 - - - 493 493 493 493 493 266 266 266 503 731 731 731 668 668 668 668 - - - - - - - - - - - - - - - - - - 132 132 132 132 132 132 115 385 629 629 908 2129 2734 3644 - 50 183 251 573 1864 2496 3634 - - - - - - - - 46 53 56 61 71 81 93 93
- - - - - - - - 18 65 80 108 166 221 289 368
- - - - - - - - - - - - - - - -
Attachment D-1 E3 EPE Report Model Results June Page 12 of 34
Scenario Resource TypeNo Lifetime Extensions Nuclear (Palo Verde)
Nuclear (SMR)Gas - Steam TurbineGas - Combined CycleGas - Combustion TurbineBiomassGeothermalWindSolarBattery StorageImportsDemand ResponseHydrogenBTM SolarLoadExcess Generation
High Gas Price Nuclear (Palo Verde)Nuclear (SMR)Gas - Steam TurbineGas - Combined CycleGas - Combustion TurbineBiomassGeothermalWindSolarBattery StorageImportsDemand ResponseHydrogenBTM SolarLoadExcess Generation
Low Carbon Price Nuclear (Palo Verde)Nuclear (SMR)Gas - Steam TurbineGas - Combined CycleGas - Combustion TurbineBiomassGeothermalWindSolarBattery StorageImportsDemand ResponseHydrogenBTM SolarLoadExcess Generation
2021 2024 2025 2027 2031 2035 2040 2045Installed Capacity (MW)
622 622 622 622 622 622 622 622 - - - - - - - - 426 234 234 144 144 - - - 493 493 493 266 266 266 266 266 503 731 731 914 851 951 1109 1318 - - - - - - - - - - - - - - - - - - 118 118 118 118 118 196 115 385 769 769 1018 1235 1292 1579 - 50 230 434 743 1031 1115 1284 - - - - - - - - 46 53 56 61 71 81 93 93
- - - - - - - - 18 65 80 108 166 221 289 368
- - - - - - - - - - - - - - - - 622 622 622 622 622 622 622 622 - - - - - - - - 426 307 307 307 234 - - - 493 493 493 493 493 266 266 266 503 731 731 731 668 930 1088 1274 - - - - - - - - - - - - - - - - - - 142 142 142 142 142 264 115 385 629 629 905 1312 1369 1712 - 50 183 249 570 1047 1131 1312 - - - - - - - - 46 53 56 61 71 81 93 93
- - - - - - - - 18 65 80 108 166 221 289 368
- - - - - - - - - - - - - - - - 622 622 622 622 622 622 622 622 - - - - - - - - 426 307 307 307 234 - - - 493 493 493 493 493 266 266 266 503 731 731 731 668 920 1078 1267 - - - - - - - - - - - - - - - - - - 181 181 181 181 181 267 115 385 629 629 894 1312 1369 1747 - 50 183 240 559 1047 1131 1319 - - - - - - - - 46 53 56 61 71 81 93 93
- - - - - - - - 18 65 80 108 166 221 289 368
- - - - - - - - - - - - - - - -
Attachment D-1 E3 EPE Report Model Results June Page 13 of 34
Scenario Resource TypeMedium Carbon Price Nuclear (Palo Verde)
Nuclear (SMR)Gas - Steam TurbineGas - Combined CycleGas - Combustion TurbineBiomassGeothermalWindSolarBattery StorageImportsDemand ResponseHydrogenBTM SolarLoadExcess Generation
High Carbon Price Nuclear (Palo Verde)Nuclear (SMR)Gas - Steam TurbineGas - Combined CycleGas - Combustion TurbineBiomassGeothermalWindSolarBattery StorageImportsDemand ResponseHydrogenBTM SolarLoadExcess Generation
80 Clean by 2035 Nuclear (Palo Verde)Nuclear (SMR)Gas - Steam TurbineGas - Combined CycleGas - Combustion TurbineBiomassGeothermalWindSolarBattery StorageImportsDemand ResponseHydrogenBTM SolarLoadExcess Generation
2021 2024 2025 2027 2031 2035 2040 2045Installed Capacity (MW)
622 622 622 622 622 622 622 622 - - - - - - - - 426 307 307 307 234 - - - 493 493 493 493 493 266 266 266 503 731 731 731 668 909 1060 1248 - - - - - - - - - - - - - - - - - - 236 236 236 236 236 300 115 385 724 724 882 1312 1390 1813 - 50 183 228 547 1047 1136 1343 - - - - - - - - 46 53 56 61 71 81 93 93
- - - - - - - - 18 65 80 108 166 221 289 368
- - - - - - - - - - - - - - - - 622 622 622 622 622 622 622 622 - - - - - - - - 426 307 307 307 234 - - - 493 493 493 493 493 266 266 266 503 731 731 731 668 901 1001 1024 - - - - - - - - - - - - - - - - - - 300 300 300 300 300 301 115 385 927 927 972 1312 1640 2583 - 50 183 211 521 1047 1189 2082 - - - - - - - - 46 53 56 61 71 81 93 93
- - - - - - - - 18 65 80 108 166 221 289 368
- - - - - - - - - - - - - - - - 622 622 622 622 622 622 622 622 - - - - - - - - 426 307 307 307 234 - - - 493 493 493 493 493 266 266 266 503 731 731 731 668 938 1075 1253 - - - - - - - - - - - - - - - - - - 109 109 109 109 194 285 115 385 629 629 915 1312 1369 1805 - 50 183 256 580 1047 1131 1331 - - - - - - - - 46 53 56 61 71 81 93 93
- - - - - - - - 18 65 80 108 166 221 289 368
- - - - - - - - - - - - - - - -
Attachment D-1 E3 EPE Report Model Results June Page 14 of 34
Scenario Resource Type20 CO2 Red by 2040 Nuclear (Palo Verde)
Nuclear (SMR)Gas - Steam TurbineGas - Combined CycleGas - Combustion TurbineBiomassGeothermalWindSolarBattery StorageImportsDemand ResponseHydrogenBTM SolarLoadExcess Generation
40 CO2 Red by 2040 Nuclear (Palo Verde)Nuclear (SMR)Gas - Steam TurbineGas - Combined CycleGas - Combustion TurbineBiomassGeothermalWindSolarBattery StorageImportsDemand ResponseHydrogenBTM SolarLoadExcess Generation
60 CO2 Red by 2040 Nuclear (Palo Verde)Nuclear (SMR)Gas - Steam TurbineGas - Combined CycleGas - Combustion TurbineBiomassGeothermalWindSolarBattery StorageImportsDemand ResponseHydrogenBTM SolarLoadExcess Generation
2021 2024 2025 2027 2031 2035 2040 2045Installed Capacity (MW)
622 622 622 622 622 622 622 622 - - - - - - - - 426 307 307 307 234 - - - 493 493 493 493 493 266 266 266 503 731 731 731 668 952 1111 1270 - - - - - - - - - - - - - - - - - - 109 109 109 109 109 264 115 385 629 629 904 1242 1299 1733 - 50 183 256 582 1032 1116 1316 - - - - - - - - 46 53 56 61 71 81 93 93
- - - - - - - - 18 65 80 108 166 221 289 368
- - - - - - - - - - - - - - - - 622 622 622 622 622 622 622 622 - - - - - - - - 426 307 307 307 234 - - - 493 493 493 493 493 266 266 266 503 731 731 731 668 939 1064 1178 - - - - - - - - - - - - - - - - - - 109 109 109 109 221 300 115 385 629 629 915 1310 1390 2052 - 50 183 256 580 1045 1135 1573 - - - - - - - - 46 53 56 61 71 81 93 93
- - - - - - - - 18 65 80 108 166 221 289 368
- - - - - - - - - - - - - - - - 622 622 622 622 622 622 622 622 - - - - - - - - 426 307 307 307 234 - - - 493 493 493 493 493 266 266 266 503 731 731 731 668 938 987 1029 - - - - - - - - - - - - - - - - - - 109 109 109 109 300 301 115 385 629 629 915 1311 1822 2573 - 50 183 256 580 1046 1194 2062 - - - - - - - - 46 53 56 61 71 81 93 93
- - - - - - - - 18 65 80 108 166 221 289 368
- - - - - - - - - - - - - - - -
Attachment D-1 E3 EPE Report Model Results June Page 15 of 34
Scenario Resource Type80 CO2 Red by 2040 Nuclear (Palo Verde)
Nuclear (SMR)Gas - Steam TurbineGas - Combined CycleGas - Combustion TurbineBiomassGeothermalWindSolarBattery StorageImportsDemand ResponseHydrogenBTM SolarLoadExcess Generation
90 CO2 Red by 2040 Nuclear (Palo Verde)Nuclear (SMR)Gas - Steam TurbineGas - Combined CycleGas - Combustion TurbineBiomassGeothermalWindSolarBattery StorageImportsDemand ResponseHydrogenBTM SolarLoadExcess Generation
100 CO2 Red by 2040 Nuclear (Palo Verde)Nuclear (SMR)Gas - Steam TurbineGas - Combined CycleGas - Combustion TurbineBiomassGeothermalWindSolarBattery StorageImportsDemand ResponseHydrogenBTM SolarLoadExcess Generation
2021 2024 2025 2027 2031 2035 2040 2045Installed Capacity (MW)
622 622 622 622 622 622 622 622 - - - - - - - - 426 307 307 307 234 - - - 493 493 493 493 493 266 266 266 503 731 731 731 668 885 885 885 - - - - - - - - - - - - - - - - - - 192 192 192 192 507 507 115 385 629 629 891 1475 2226 3013 - 50 183 238 556 1080 1416 2455 - - - - - - - - 46 53 56 61 71 81 93 93
- - - - - - - - 18 65 80 108 166 221 289 368
- - - - - - - - - - - - - - - - 622 622 622 622 622 622 622 622 - - - - - - - - 426 307 307 307 234 - - - 493 493 493 493 493 266 266 266 503 731 731 731 668 819 819 819 - - - - - - - - - - - - - - - - - - 192 192 192 192 764 772 115 385 628 628 891 1681 2284 3081 - 50 183 238 556 1276 1601 2627 - - - - - - - - 46 53 56 61 71 81 93 93
- - - - - - - - 18 65 80 108 166 221 289 368
- - - - - - - - - - - - - - - - 622 622 622 622 622 622 622 622 - - - - - - - - 426 307 307 307 234 - - - 493 493 493 493 493 266 266 266 503 731 731 731 668 668 668 668 - - - - - - - - - - - - - - - - - - 132 132 132 132 1228 1605 115 385 629 629 908 2129 4851 5217 - 50 183 251 573 1864 6191 7470 - - - - - - - - 46 53 56 61 71 81 93 93
- - - - - - - - 18 65 80 108 166 221 298 701
- - - - - - - - - - - - - - - -
Attachment D-1 E3 EPE Report Model Results June Page 16 of 34
Scenario Resource Type100 CO2 Red by 2040 (w H2) Nuclear (Palo Verde)
Nuclear (SMR)Gas - Steam TurbineGas - Combined CycleGas - Combustion TurbineBiomassGeothermalWindSolarBattery StorageImportsDemand ResponseHydrogenBTM SolarLoadExcess Generation
2021 2024 2025 2027 2031 2035 2040 2045Installed Capacity (MW)
622 622 622 622 622 622 622 622 - - - - - - - - 426 307 307 307 234 - - - 493 493 493 493 493 266 - - 503 731 731 731 668 774 - - - - - - - - - - - - - - - - - - - - 231 231 231 231 687 687 115 385 628 628 883 1801 2353 3200 - 50 183 233 548 1403 1804 2864 - - - - - - - - 46 53 56 61 71 81 93 93
- - - - - - 1040 1040 18 65 80 108 166 221 289 368
- - - - - - - - - - - - - - - -
Attachment D-1 E3 EPE Report Model Results June Page 17 of 34
Scenario Resource TypeLeast-Cost (Reference Case) Nuclear (Palo Verde)
Nuclear (SMR)Gas - Steam TurbineGas - Combined CycleGas - Combustion TurbineBiomassGeothermalWindSolarBattery StorageImportsDemand ResponseHydrogenBTM SolarLoadExcess Generation
Least-Cost Case + ETA Resources Nuclear (Palo Verde)Nuclear (SMR)Gas - Steam TurbineGas - Combined CycleGas - Combustion TurbineBiomassGeothermalWindSolarBattery StorageImportsDemand ResponseHydrogenBTM SolarLoadExcess Generation
Separate System Planning Nuclear (Palo Verde)Nuclear (SMR)Gas - Steam TurbineGas - Combined CycleGas - Combustion TurbineBiomassGeothermalWindSolarBattery StorageImportsDemand ResponseHydrogenBTM SolarLoadExcess Generation
2021 2024 2025 2027 2031 2035 2040 2045- - - - - - - - - - - - - - - - - - - - - - - - - - - - - - - - - 228 228 228 228 512 671 878 - - - - - - - - - - - - - - - - - - 109 109 109 109 109 196 - 270 514 514 789 1196 1280 1842 - 50 183 256 582 1032 1116 1334 - - - - - - - - 46 53 56 61 71 81 93 93
- - - - - - - - 18 65 80 108 166 221 289 368
- - - - - - - - - - - - - - - - - - - - - - - - - - - - - - - - - - - - - - - - - - - - - - - - - 228 228 228 228 439 559 714 - - - - - - - - - - - - - - - - - - 204 204 204 204 204 264 - 270 514 514 772 1437 1666 2312 - 50 183 236 552 1084 1252 1748 - - - - - - - - 46 53 56 61 71 81 93 93
- - - - - - - - 18 65 80 108 166 221 289 368
- - - - - - - - - - - - - - - - - - - - - - - - - - - - - - - - - - - - - - - - - - - - - - - - - 228 228 228 228 395 395 549 - - - - - - - - - - - - - - - - - - 87 87 87 87 87 159 - 270 592 592 790 1622 2304 2901 - 50 271 293 634 1480 2207 2629 - - - - - - - - 46 53 56 61 71 81 93 93
- - - - - - - - 18 65 80 108 166 221 289 368
- - - - - - - - - - - - - - - -
Cumulative Capacity Additions (MW)
Attachment D-1 E3 EPE Report Model Results June Page 18 of 34
Scenario Resource TypeSeparate System Planning (w H2) Nuclear (Palo Verde)
Nuclear (SMR)Gas - Steam TurbineGas - Combined CycleGas - Combustion TurbineBiomassGeothermalWindSolarBattery StorageImportsDemand ResponseHydrogenBTM SolarLoadExcess Generation
Low Load Growth Nuclear (Palo Verde)Nuclear (SMR)Gas - Steam TurbineGas - Combined CycleGas - Combustion TurbineBiomassGeothermalWindSolarBattery StorageImportsDemand ResponseHydrogenBTM SolarLoadExcess Generation
High Load Growth Nuclear (Palo Verde)Nuclear (SMR)Gas - Steam TurbineGas - Combined CycleGas - Combustion TurbineBiomassGeothermalWindSolarBattery StorageImportsDemand ResponseHydrogenBTM SolarLoadExcess Generation
2021 2024 2025 2027 2031 2035 2040 2045Cumulative Capacity Additions (MW)
- - - - - - - - - - - - - - - - - - - - - - - - - - - - - - - - - 228 228 228 228 385 385 549 - - - - - - - - - - - - - - - - - - 129 129 129 129 172 212 - 270 557 557 821 1245 1627 2252 - 50 269 291 601 1038 1420 1791 - - - - - - - - 46 53 56 61 71 81 93 93
- - - - - 121 195 206 18 65 80 108 166 221 289 368
- - - - - - - - - - - - - - - - - - - - - - - - - - - - - - - - - - - - - - - - - - - - - - - - - 228 228 228 228 407 549 742 - - - - - - - - - - - - - - - - - - 96 96 96 96 96 153 - 270 426 426 628 1117 1198 1751 - 50 192 193 454 1012 1093 1307 - - - - - - - - 46 53 56 61 71 81 93 93
- - - - - - - - 18 65 80 108 166 221 289 368
- - - - - - - - - - - - - - - - - - - - - - - - - - - - - - - - - - - - - - - - - - - - - - - - - 228 228 228 228 622 797 1011 - - - - - - - - - - - - - - - - - - 123 123 123 123 123 266 - 270 562 562 931 1264 1351 1922 - 50 249 342 716 1048 1136 1357 - - - - - - - - 46 53 56 61 71 81 93 93
- - - - - - - - 18 65 80 108 166 221 289 368
- - - - - - - - - - - - - - - -
Attachment D-1 E3 EPE Report Model Results June Page 19 of 34
Scenario Resource TypeHigh DG Nuclear (Palo Verde)
Nuclear (SMR)Gas - Steam TurbineGas - Combined CycleGas - Combustion TurbineBiomassGeothermalWindSolarBattery StorageImportsDemand ResponseHydrogenBTM SolarLoadExcess Generation
High DSM Nuclear (Palo Verde)Nuclear (SMR)Gas - Steam TurbineGas - Combined CycleGas - Combustion TurbineBiomassGeothermalWindSolarBattery StorageImportsDemand ResponseHydrogenBTM SolarLoadExcess Generation
No New Gas Nuclear (Palo Verde)Nuclear (SMR)Gas - Steam TurbineGas - Combined CycleGas - Combustion TurbineBiomassGeothermalWindSolarBattery StorageImportsDemand ResponseHydrogenBTM SolarLoadExcess Generation
2021 2024 2025 2027 2031 2035 2040 2045Cumulative Capacity Additions (MW)
- - - - - - - - - - - - - - - - - - - - - - - - - - - - - - - - - 228 228 228 228 502 638 882 - - - - - - - - - - - - - - - - - - 106 106 106 106 106 249 - 270 472 472 646 966 1074 1285 - 50 183 252 571 1043 1151 1317 - - - - - - - - 46 53 56 61 71 81 93 93
- - - - - - - - 42 169 210 293 455 614 809 1032
- - - - - - - - - - - - - - - - - - - - - - - - - - - - - - - - - - - - - - - - - - - - - - - - - 228 228 228 228 361 486 665 - - - - - - - - - - - - - - - - - - 70 70 70 70 70 127 - 270 443 443 526 1101 1171 1646 - 50 187 191 425 1000 1070 1259 - - - - - - - - 49 66 71 82 100 101 103 103
- - - - - - - - 18 65 80 108 166 221 289 368
- - - - - - - - - - - - - - - - - - - - - - - - - - - - - - - - - - - - - - - - - - - - - - - - - 228 228 228 228 228 228 228 - - - - - - - - - - - - - - - - - - 132 132 132 132 132 132 - 270 514 514 793 2084 2716 3906 - 50 183 251 573 1864 2496 3684 - - - - - - - - 46 53 56 61 71 81 93 93
- - - - - - - - 18 65 80 108 166 221 289 368
- - - - - - - - - - - - - - - -
Attachment D-1 E3 EPE Report Model Results June Page 20 of 34
Scenario Resource TypeNo Lifetime Extensions Nuclear (Palo Verde)
Nuclear (SMR)Gas - Steam TurbineGas - Combined CycleGas - Combustion TurbineBiomassGeothermalWindSolarBattery StorageImportsDemand ResponseHydrogenBTM SolarLoadExcess Generation
High Gas Price Nuclear (Palo Verde)Nuclear (SMR)Gas - Steam TurbineGas - Combined CycleGas - Combustion TurbineBiomassGeothermalWindSolarBattery StorageImportsDemand ResponseHydrogenBTM SolarLoadExcess Generation
Low Carbon Price Nuclear (Palo Verde)Nuclear (SMR)Gas - Steam TurbineGas - Combined CycleGas - Combustion TurbineBiomassGeothermalWindSolarBattery StorageImportsDemand ResponseHydrogenBTM SolarLoadExcess Generation
2021 2024 2025 2027 2031 2035 2040 2045Cumulative Capacity Additions (MW)
- - - - - - - - - - - - - - - - - - - - - - - - - - - - - - - - - 228 228 411 411 511 669 878 - - - - - - - - - - - - - - - - - - 118 118 118 118 118 196 - 270 654 654 903 1190 1274 1841 - 50 230 434 743 1031 1115 1334 - - - - - - - - 46 53 56 61 71 81 93 93
- - - - - - - - 18 65 80 108 166 221 289 368
- - - - - - - - - - - - - - - - - - - - - - - - - - - - - - - - - - - - - - - - - - - - - - - - - 228 228 228 228 490 648 834 - - - - - - - - - - - - - - - - - - 142 142 142 142 142 264 - 270 514 514 790 1267 1351 1974 - 50 183 249 570 1047 1131 1362 - - - - - - - - 46 53 56 61 71 81 93 93
- - - - - - - - 18 65 80 108 166 221 289 368
- - - - - - - - - - - - - - - - - - - - - - - - - - - - - - - - - - - - - - - - - - - - - - - - - 228 228 228 228 480 638 827 - - - - - - - - - - - - - - - - - - 181 181 181 181 181 267 - 270 514 514 779 1267 1351 2009 - 50 183 240 559 1047 1131 1369 - - - - - - - - 46 53 56 61 71 81 93 93
- - - - - - - - 18 65 80 108 166 221 289 368
- - - - - - - - - - - - - - - -
Attachment D-1 E3 EPE Report Model Results June Page 21 of 34
Scenario Resource TypeMedium Carbon Price Nuclear (Palo Verde)
Nuclear (SMR)Gas - Steam TurbineGas - Combined CycleGas - Combustion TurbineBiomassGeothermalWindSolarBattery StorageImportsDemand ResponseHydrogenBTM SolarLoadExcess Generation
High Carbon Price Nuclear (Palo Verde)Nuclear (SMR)Gas - Steam TurbineGas - Combined CycleGas - Combustion TurbineBiomassGeothermalWindSolarBattery StorageImportsDemand ResponseHydrogenBTM SolarLoadExcess Generation
80 Clean by 2035 Nuclear (Palo Verde)Nuclear (SMR)Gas - Steam TurbineGas - Combined CycleGas - Combustion TurbineBiomassGeothermalWindSolarBattery StorageImportsDemand ResponseHydrogenBTM SolarLoadExcess Generation
2021 2024 2025 2027 2031 2035 2040 2045Cumulative Capacity Additions (MW)
- - - - - - - - - - - - - - - - - - - - - - - - - - - - - - - - - 228 228 228 228 469 620 808 - - - - - - - - - - - - - - - - - - 236 236 236 236 236 300 - 270 609 609 767 1267 1372 2075 - 50 183 228 547 1047 1136 1393 - - - - - - - - 46 53 56 61 71 81 93 93
- - - - - - - - 18 65 80 108 166 221 289 368
- - - - - - - - - - - - - - - - - - - - - - - - - - - - - - - - - - - - - - - - - - - - - - - - - 228 228 228 228 461 561 584 - - - - - - - - - - - - - - - - - - 300 300 300 300 300 301 - 270 812 812 857 1267 1622 2845 - 50 183 211 521 1047 1189 2132 - - - - - - - - 46 53 56 61 71 81 93 93
- - - - - - - - 18 65 80 108 166 221 289 368
- - - - - - - - - - - - - - - - - - - - - - - - - - - - - - - - - - - - - - - - - - - - - - - - - 228 228 228 228 498 635 813 - - - - - - - - - - - - - - - - - - 109 109 109 109 194 285 - 270 514 514 800 1267 1351 2067 - 50 183 256 580 1047 1131 1381 - - - - - - - - 46 53 56 61 71 81 93 93
- - - - - - - - 18 65 80 108 166 221 289 368
- - - - - - - - - - - - - - - -
Attachment D-1 E3 EPE Report Model Results June Page 22 of 34
Scenario Resource Type20 CO2 Red by 2040 Nuclear (Palo Verde)
Nuclear (SMR)Gas - Steam TurbineGas - Combined CycleGas - Combustion TurbineBiomassGeothermalWindSolarBattery StorageImportsDemand ResponseHydrogenBTM SolarLoadExcess Generation
40 CO2 Red by 2040 Nuclear (Palo Verde)Nuclear (SMR)Gas - Steam TurbineGas - Combined CycleGas - Combustion TurbineBiomassGeothermalWindSolarBattery StorageImportsDemand ResponseHydrogenBTM SolarLoadExcess Generation
60 CO2 Red by 2040 Nuclear (Palo Verde)Nuclear (SMR)Gas - Steam TurbineGas - Combined CycleGas - Combustion TurbineBiomassGeothermalWindSolarBattery StorageImportsDemand ResponseHydrogenBTM SolarLoadExcess Generation
2021 2024 2025 2027 2031 2035 2040 2045Cumulative Capacity Additions (MW)
- - - - - - - - - - - - - - - - - - - - - - - - - - - - - - - - - 228 228 228 228 512 671 830 - - - - - - - - - - - - - - - - - - 109 109 109 109 109 264 - 270 514 514 789 1197 1281 1995 - 50 183 256 582 1032 1116 1366 - - - - - - - - 46 53 56 61 71 81 93 93
- - - - - - - - 18 65 80 108 166 221 289 368
- - - - - - - - - - - - - - - - - - - - - - - - - - - - - - - - - - - - - - - - - - - - - - - - - 228 228 228 228 499 624 738 - - - - - - - - - - - - - - - - - - 109 109 109 109 221 300 - 270 514 514 800 1265 1372 2314 - 50 183 256 580 1045 1135 1623 - - - - - - - - 46 53 56 61 71 81 93 93
- - - - - - - - 18 65 80 108 166 221 289 368
- - - - - - - - - - - - - - - - - - - - - - - - - - - - - - - - - - - - - - - - - - - - - - - - - 228 228 228 228 498 547 589 - - - - - - - - - - - - - - - - - - 109 109 109 109 300 301 - 270 514 514 800 1266 1804 2835 - 50 183 256 580 1046 1194 2112 - - - - - - - - 46 53 56 61 71 81 93 93
- - - - - - - - 18 65 80 108 166 221 289 368
- - - - - - - - - - - - - - - -
Attachment D-1 E3 EPE Report Model Results June Page 23 of 34
Scenario Resource Type80 CO2 Red by 2040 Nuclear (Palo Verde)
Nuclear (SMR)Gas - Steam TurbineGas - Combined CycleGas - Combustion TurbineBiomassGeothermalWindSolarBattery StorageImportsDemand ResponseHydrogenBTM SolarLoadExcess Generation
90 CO2 Red by 2040 Nuclear (Palo Verde)Nuclear (SMR)Gas - Steam TurbineGas - Combined CycleGas - Combustion TurbineBiomassGeothermalWindSolarBattery StorageImportsDemand ResponseHydrogenBTM SolarLoadExcess Generation
100 CO2 Red by 2040 Nuclear (Palo Verde)Nuclear (SMR)Gas - Steam TurbineGas - Combined CycleGas - Combustion TurbineBiomassGeothermalWindSolarBattery StorageImportsDemand ResponseHydrogenBTM SolarLoadExcess Generation
2021 2024 2025 2027 2031 2035 2040 2045Cumulative Capacity Additions (MW)
- - - - - - - - - - - - - - - - - - - - - - - - - - - - - - - - - 228 228 228 228 445 445 445 - - - - - - - - - - - - - - - - - - 192 192 192 192 507 507 - 270 514 514 776 1430 2208 3275 - 50 183 238 556 1080 1416 2505 - - - - - - - - 46 53 56 61 71 81 93 93
- - - - - - - - 18 65 80 108 166 221 289 368
- - - - - - - - - - - - - - - - - - - - - - - - - - - - - - - - - - - - - - - - - - - - - - - - - 228 228 228 228 379 379 379 - - - - - - - - - - - - - - - - - - 192 192 192 192 764 772 - 270 513 513 776 1636 2266 3343 - 50 183 238 556 1276 1601 2677 - - - - - - - - 46 53 56 61 71 81 93 93
- - - - - - - - 18 65 80 108 166 221 289 368
- - - - - - - - - - - - - - - - - - - - - - - - - - - - - - - - - - - - - - - - - - - - - - - - - 228 228 228 228 228 228 228 - - - - - - - - - - - - - - - - - - 132 132 132 132 1228 1605 - 270 514 514 793 2084 4833 5479 - 50 183 251 573 1864 6191 7470 - - - - - - - - 46 53 56 61 71 81 93 93
- - - - - - - - 18 65 80 108 166 221 298 701
- - - - - - - - - - - - - - - -
Attachment D-1 E3 EPE Report Model Results June Page 24 of 34
Scenario Resource Type100 CO2 Red by 2040 (w H2) Nuclear (Palo Verde)
Nuclear (SMR)Gas - Steam TurbineGas - Combined CycleGas - Combustion TurbineBiomassGeothermalWindSolarBattery StorageImportsDemand ResponseHydrogenBTM SolarLoadExcess Generation
2021 2024 2025 2027 2031 2035 2040 2045Cumulative Capacity Additions (MW)
- - - - - - - - - - - - - - - - - - - - - - - - - - - - - - - - - 228 228 228 228 334 - - - - - - - - - - - - - - - - - - - - 231 231 231 231 687 687 - 270 513 513 768 1756 2335 3462 - 50 183 233 548 1403 1804 2914 - - - - - - - - 46 53 56 61 71 81 93 93
- - - - - - 334 334 18 65 80 108 166 221 289 368
- - - - - - - - - - - - - - - -
Attachment D-1 E3 EPE Report Model Results June Page 25 of 34
Scenario Resource TypeLeast-Cost (Reference Case) Nuclear (Palo Verde)
Nuclear (SMR)Gas - Steam TurbineGas - Combined CycleGas - Combustion TurbineBiomassGeothermalWindSolarBattery StorageImportsDemand ResponseHydrogenBTM SolarLoadExcess Generation
Least-Cost Case + ETA Resources Nuclear (Palo Verde)Nuclear (SMR)Gas - Steam TurbineGas - Combined CycleGas - Combustion TurbineBiomassGeothermalWindSolarBattery StorageImportsDemand ResponseHydrogenBTM SolarLoadExcess Generation
Separate System Planning Nuclear (Palo Verde)Nuclear (SMR)Gas - Steam TurbineGas - Combined CycleGas - Combustion TurbineBiomassGeothermalWindSolarBattery StorageImportsDemand ResponseHydrogenBTM SolarLoadExcess Generation
2021 2024 2025 2027 2031 2035 2040 2045- - - - - - - - - - - - - - - - - (119) (119) (119) (192) (426) (426) (426) - - - - - (227) (227) (227) - - - - (63) (63) (63) (63) - - - - - - - - - - - - - - - - - - - - - - - - - - - - - (70) (97) (377) - - - - - - - (50) - - - - - - - - - - - - - - - - - - - - - - - - - - - - - - - - - - - - - - - - - - - - - - - - - - - - - - - - - - - - - - - - - (119) (119) (119) (192) (426) (426) (426) - - - - - (227) (227) (227) - - - - (63) (63) (63) (63) - - - - - - - - - - - - - - - - - - - - - - - - - - - - - (70) (97) (377) - - - - - - - (50) - - - - - - - - - - - - - - - - - - - - - - - - - - - - - - - - - - - - - - - - - - - - - - - - - - - - - - - - - - - - - - - - - (119) (119) (119) (192) (426) (426) (426) - - - - - (227) (227) (227) - - - - (63) (63) (63) (63) - - - - - - - - - - - - - - - - - - - - - - - - - - - - - (70) (97) (377) - - - - - - - (50) - - - - - - - - - - - - - - - - - - - - - - - - - - - - - - - - - - - - - - - - - - - - - - - -
Cumulative Capacity Retirements (MW)
Attachment D-1 E3 EPE Report Model Results June Page 26 of 34
Scenario Resource TypeSeparate System Planning (w H2) Nuclear (Palo Verde)
Nuclear (SMR)Gas - Steam TurbineGas - Combined CycleGas - Combustion TurbineBiomassGeothermalWindSolarBattery StorageImportsDemand ResponseHydrogenBTM SolarLoadExcess Generation
Low Load Growth Nuclear (Palo Verde)Nuclear (SMR)Gas - Steam TurbineGas - Combined CycleGas - Combustion TurbineBiomassGeothermalWindSolarBattery StorageImportsDemand ResponseHydrogenBTM SolarLoadExcess Generation
High Load Growth Nuclear (Palo Verde)Nuclear (SMR)Gas - Steam TurbineGas - Combined CycleGas - Combustion TurbineBiomassGeothermalWindSolarBattery StorageImportsDemand ResponseHydrogenBTM SolarLoadExcess Generation
2021 2024 2025 2027 2031 2035 2040 2045Cumulative Capacity Retirements (MW)
- - - - - - - - - - - - - - - - - (119) (119) (119) (192) (426) (426) (426) - - - - - (227) (227) (227) - - - - (63) (63) (63) (63) - - - - - - - - - - - - - - - - - - - - - - - - - - - - - (70) (97) (377) - - - - - - - (50) - - - - - - - - - - - - - - - - - - - - - - - - - - - - - - - - - - - - - - - - - - - - - - - - - - - - - - - - - - - - - - - - - (119) (119) (119) (192) (426) (426) (426) - - - - - (227) (227) (227) - - - - (63) (63) (63) (63) - - - - - - - - - - - - - - - - - - - - - - - - - - - - - (70) (97) (377) - - - - - - - (50) - - - - - - - - - - - - - - - - - - - - - - - - - - - - - - - - - - - - - - - - - - - - - - - - - - - - - - - - - - - - - - - - - (119) (119) (119) (192) (426) (426) (426) - - - - - (227) (227) (227) - - - - (63) (63) (63) (63) - - - - - - - - - - - - - - - - - - - - - - - - - - - - - (70) (97) (377) - - - - - - - (50) - - - - - - - - - - - - - - - - - - - - - - - - - - - - - - - - - - - - - - - - - - - - - - - -
Attachment D-1 E3 EPE Report Model Results June Page 27 of 34
Scenario Resource TypeHigh DG Nuclear (Palo Verde)
Nuclear (SMR)Gas - Steam TurbineGas - Combined CycleGas - Combustion TurbineBiomassGeothermalWindSolarBattery StorageImportsDemand ResponseHydrogenBTM SolarLoadExcess Generation
High DSM Nuclear (Palo Verde)Nuclear (SMR)Gas - Steam TurbineGas - Combined CycleGas - Combustion TurbineBiomassGeothermalWindSolarBattery StorageImportsDemand ResponseHydrogenBTM SolarLoadExcess Generation
No New Gas Nuclear (Palo Verde)Nuclear (SMR)Gas - Steam TurbineGas - Combined CycleGas - Combustion TurbineBiomassGeothermalWindSolarBattery StorageImportsDemand ResponseHydrogenBTM SolarLoadExcess Generation
2021 2024 2025 2027 2031 2035 2040 2045Cumulative Capacity Retirements (MW)
- - - - - - - - - - - - - - - - - (119) (119) (119) (192) (426) (426) (426) - - - - - (227) (227) (227) - - - - (63) (63) (63) (63) - - - - - - - - - - - - - - - - - - - - - - - - - - - - - (70) (97) (377) - - - - - - - (50) - - - - - - - - - - - - - - - - - - - - - - - - - - - - - - - - - - - - - - - - - - - - - - - - - - - - - - - - - - - - - - - - - (119) (119) (119) (192) (426) (426) (426) - - - - - (227) (227) (227) - - - - (63) (63) (63) (63) - - - - - - - - - - - - - - - - - - - - - - - - - - - - - (70) (97) (377) - - - - - - - (50) - - - - - - - - - - - - - - - - - - - - - - - - - - - - - - - - - - - - - - - - - - - - - - - - - - - - - - - - - - - - - - - - - (119) (119) (119) (192) (426) (426) (426) - - - - - (227) (227) (227) - - - - (63) (63) (63) (63) - - - - - - - - - - - - - - - - - - - - - - - - - - - - - (70) (97) (377) - - - - - - - (50) - - - - - - - - - - - - - - - - - - - - - - - - - - - - - - - - - - - - - - - - - - - - - - - -
Attachment D-1 E3 EPE Report Model Results June Page 28 of 34
Scenario Resource TypeNo Lifetime Extensions Nuclear (Palo Verde)
Nuclear (SMR)Gas - Steam TurbineGas - Combined CycleGas - Combustion TurbineBiomassGeothermalWindSolarBattery StorageImportsDemand ResponseHydrogenBTM SolarLoadExcess Generation
High Gas Price Nuclear (Palo Verde)Nuclear (SMR)Gas - Steam TurbineGas - Combined CycleGas - Combustion TurbineBiomassGeothermalWindSolarBattery StorageImportsDemand ResponseHydrogenBTM SolarLoadExcess Generation
Low Carbon Price Nuclear (Palo Verde)Nuclear (SMR)Gas - Steam TurbineGas - Combined CycleGas - Combustion TurbineBiomassGeothermalWindSolarBattery StorageImportsDemand ResponseHydrogenBTM SolarLoadExcess Generation
2021 2024 2025 2027 2031 2035 2040 2045Cumulative Capacity Retirements (MW)
- - - - - - - - - - - - - - - - - (192) (192) (282) (282) (426) (426) (426) - - - (227) (227) (227) (227) (227) - - - - (63) (63) (63) (63) - - - - - - - - - - - - - - - - - - - - - - - - - - - - - (70) (97) (377) - - - - - - - (50) - - - - - - - - - - - - - - - - - - - - - - - - - - - - - - - - - - - - - - - - - - - - - - - - - - - - - - - - - - - - - - - - - (119) (119) (119) (192) (426) (426) (426) - - - - - (227) (227) (227) - - - - (63) (63) (63) (63) - - - - - - - - - - - - - - - - - - - - - - - - - - - - - (70) (97) (377) - - - - - - - (50) - - - - - - - - - - - - - - - - - - - - - - - - - - - - - - - - - - - - - - - - - - - - - - - - - - - - - - - - - - - - - - - - - (119) (119) (119) (192) (426) (426) (426) - - - - - (227) (227) (227) - - - - (63) (63) (63) (63) - - - - - - - - - - - - - - - - - - - - - - - - - - - - - (70) (97) (377) - - - - - - - (50) - - - - - - - - - - - - - - - - - - - - - - - - - - - - - - - - - - - - - - - - - - - - - - - -
Attachment D-1 E3 EPE Report Model Results June Page 29 of 34
Scenario Resource TypeMedium Carbon Price Nuclear (Palo Verde)
Nuclear (SMR)Gas - Steam TurbineGas - Combined CycleGas - Combustion TurbineBiomassGeothermalWindSolarBattery StorageImportsDemand ResponseHydrogenBTM SolarLoadExcess Generation
High Carbon Price Nuclear (Palo Verde)Nuclear (SMR)Gas - Steam TurbineGas - Combined CycleGas - Combustion TurbineBiomassGeothermalWindSolarBattery StorageImportsDemand ResponseHydrogenBTM SolarLoadExcess Generation
80 Clean by 2035 Nuclear (Palo Verde)Nuclear (SMR)Gas - Steam TurbineGas - Combined CycleGas - Combustion TurbineBiomassGeothermalWindSolarBattery StorageImportsDemand ResponseHydrogenBTM SolarLoadExcess Generation
2021 2024 2025 2027 2031 2035 2040 2045Cumulative Capacity Retirements (MW)
- - - - - - - - - - - - - - - - - (119) (119) (119) (192) (426) (426) (426) - - - - - (227) (227) (227) - - - - (63) (63) (63) (63) - - - - - - - - - - - - - - - - - - - - - - - - - - - - - (70) (97) (377) - - - - - - - (50) - - - - - - - - - - - - - - - - - - - - - - - - - - - - - - - - - - - - - - - - - - - - - - - - - - - - - - - - - - - - - - - - - (119) (119) (119) (192) (426) (426) (426) - - - - - (227) (227) (227) - - - - (63) (63) (63) (63) - - - - - - - - - - - - - - - - - - - - - - - - - - - - - (70) (97) (377) - - - - - - - (50) - - - - - - - - - - - - - - - - - - - - - - - - - - - - - - - - - - - - - - - - - - - - - - - - - - - - - - - - - - - - - - - - - (119) (119) (119) (192) (426) (426) (426) - - - - - (227) (227) (227) - - - - (63) (63) (63) (63) - - - - - - - - - - - - - - - - - - - - - - - - - - - - - (70) (97) (377) - - - - - - - (50) - - - - - - - - - - - - - - - - - - - - - - - - - - - - - - - - - - - - - - - - - - - - - - - -
Attachment D-1 E3 EPE Report Model Results June Page 30 of 34
Scenario Resource Type20 CO2 Red by 2040 Nuclear (Palo Verde)
Nuclear (SMR)Gas - Steam TurbineGas - Combined CycleGas - Combustion TurbineBiomassGeothermalWindSolarBattery StorageImportsDemand ResponseHydrogenBTM SolarLoadExcess Generation
40 CO2 Red by 2040 Nuclear (Palo Verde)Nuclear (SMR)Gas - Steam TurbineGas - Combined CycleGas - Combustion TurbineBiomassGeothermalWindSolarBattery StorageImportsDemand ResponseHydrogenBTM SolarLoadExcess Generation
60 CO2 Red by 2040 Nuclear (Palo Verde)Nuclear (SMR)Gas - Steam TurbineGas - Combined CycleGas - Combustion TurbineBiomassGeothermalWindSolarBattery StorageImportsDemand ResponseHydrogenBTM SolarLoadExcess Generation
2021 2024 2025 2027 2031 2035 2040 2045Cumulative Capacity Retirements (MW)
- - - - - - - - - - - - - - - - - (119) (119) (119) (192) (426) (426) (426) - - - - - (227) (227) (227) - - - - (63) (63) (63) (63) - - - - - - - - - - - - - - - - - - - - - - - - - - - - - (70) (97) (377) - - - - - - - (50) - - - - - - - - - - - - - - - - - - - - - - - - - - - - - - - - - - - - - - - - - - - - - - - - - - - - - - - - - - - - - - - - - (119) (119) (119) (192) (426) (426) (426) - - - - - (227) (227) (227) - - - - (63) (63) (63) (63) - - - - - - - - - - - - - - - - - - - - - - - - - - - - - (70) (97) (377) - - - - - - - (50) - - - - - - - - - - - - - - - - - - - - - - - - - - - - - - - - - - - - - - - - - - - - - - - - - - - - - - - - - - - - - - - - - (119) (119) (119) (192) (426) (426) (426) - - - - - (227) (227) (227) - - - - (63) (63) (63) (63) - - - - - - - - - - - - - - - - - - - - - - - - - - - - - (70) (97) (377) - - - - - - - (50) - - - - - - - - - - - - - - - - - - - - - - - - - - - - - - - - - - - - - - - - - - - - - - - -
Attachment D-1 E3 EPE Report Model Results June Page 31 of 34
Scenario Resource Type80 CO2 Red by 2040 Nuclear (Palo Verde)
Nuclear (SMR)Gas - Steam TurbineGas - Combined CycleGas - Combustion TurbineBiomassGeothermalWindSolarBattery StorageImportsDemand ResponseHydrogenBTM SolarLoadExcess Generation
90 CO2 Red by 2040 Nuclear (Palo Verde)Nuclear (SMR)Gas - Steam TurbineGas - Combined CycleGas - Combustion TurbineBiomassGeothermalWindSolarBattery StorageImportsDemand ResponseHydrogenBTM SolarLoadExcess Generation
100 CO2 Red by 2040 Nuclear (Palo Verde)Nuclear (SMR)Gas - Steam TurbineGas - Combined CycleGas - Combustion TurbineBiomassGeothermalWindSolarBattery StorageImportsDemand ResponseHydrogenBTM SolarLoadExcess Generation
2021 2024 2025 2027 2031 2035 2040 2045Cumulative Capacity Retirements (MW)
- - - - - - - - - - - - - - - - - (119) (119) (119) (192) (426) (426) (426) - - - - - (227) (227) (227) - - - - (63) (63) (63) (63) - - - - - - - - - - - - - - - - - - - - - - - - - - - - - (70) (97) (377) - - - - - - - (50) - - - - - - - - - - - - - - - - - - - - - - - - - - - - - - - - - - - - - - - - - - - - - - - - - - - - - - - - - - - - - - - - - (119) (119) (119) (192) (426) (426) (426) - - - - - (227) (227) (227) - - - - (63) (63) (63) (63) - - - - - - - - - - - - - - - - - - - - - - - - - - - - - (70) (97) (377) - - - - - - - (50) - - - - - - - - - - - - - - - - - - - - - - - - - - - - - - - - - - - - - - - - - - - - - - - - - - - - - - - - - - - - - - - - - (119) (119) (119) (192) (426) (426) (426) - - - - - (227) (227) (227) - - - - (63) (63) (63) (63) - - - - - - - - - - - - - - - - - - - - - - - - - - - - - (70) (97) (377) - - - - - - - (50) - - - - - - - - - - - - - - - - - - - - - - - - - - - - - - - - - - - - - - - - - - - - - - - -
Attachment D-1 E3 EPE Report Model Results June Page 32 of 34
Scenario Resource Type100 CO2 Red by 2040 (w H2) Nuclear (Palo Verde)
Nuclear (SMR)Gas - Steam TurbineGas - Combined CycleGas - Combustion TurbineBiomassGeothermalWindSolarBattery StorageImportsDemand ResponseHydrogenBTM SolarLoadExcess Generation
2021 2024 2025 2027 2031 2035 2040 2045Cumulative Capacity Retirements (MW)
- - - - - - - - - - - - - - - - - (119) (119) (119) (192) (426) (426) (426) - - - - - (227) (227) (227) - - - - (63) (63) (63) (63) - - - - - - - - - - - - - - - - - - - - - - - - - - - - - (70) (97) (377) - - - - - - - (50) - - - - - - - - - - - - - - - - - - - - - - - - - - - - - - - - - - - - - - - - - - - - - - - -
Attachment D-1 E3 EPE Report Model Results June Page 33 of 34
Scenario 2021 2024 2025 2027 2031 2035 2040 2045Least-Cost (Reference Case) 246$ 233$ 246$ 265$ 290$ 351$ 409$ 512$ Least-Cost Case + ETA Resources 246$ 233$ 249$ 266$ 291$ 356$ 412$ 519$ Separate System Planning 247$ 234$ 252$ 269$ 295$ 376$ 471$ 577$ Separate System Planning (w H2) 247$ 234$ 252$ 269$ 294$ 355$ 438$ 543$ Low Load Growth 239$ 227$ 239$ 255$ 275$ 327$ 380$ 478$ High Load Growth 253$ 239$ 256$ 277$ 307$ 377$ 439$ 546$ High DG 245$ 231$ 243$ 261$ 283$ 336$ 388$ 482$ High DSM 245$ 230$ 241$ 256$ 272$ 317$ 364$ 454$ No New Gas 246$ 233$ 247$ 265$ 290$ 394$ 470$ 601$ No Lifetime Extensions 246$ 228$ 246$ 276$ 307$ 354$ 412$ 515$ High Gas Price 257$ 242$ 252$ 272$ 297$ 358$ 418$ 522$ Low Carbon Price 291$ 277$ 285$ 304$ 329$ 390$ 450$ 556$ Medium Carbon Price 358$ 341$ 342$ 361$ 386$ 447$ 512$ 623$ High Carbon Price 469$ 449$ 433$ 452$ 478$ 539$ 609$ 730$ 80 Clean by 2035 246$ 233$ 246$ 265$ 290$ 352$ 409$ 512$ 20 CO2 Red by 2040 246$ 233$ 246$ 265$ 290$ 351$ 409$ 511$ 40 CO2 Red by 2040 246$ 233$ 246$ 265$ 290$ 352$ 409$ 519$ 60 CO2 Red by 2040 246$ 233$ 246$ 265$ 290$ 352$ 421$ 537$ 80 CO2 Red by 2040 246$ 233$ 248$ 266$ 290$ 356$ 464$ 580$ 90 CO2 Red by 2040 246$ 233$ 248$ 266$ 290$ 366$ 503$ 620$ 100 CO2 Red by 2040 246$ 233$ 247$ 265$ 290$ 394$ 1102$ 1269$ 100 CO2 Red by 2040 (w H2) 246$ 233$ 250$ 267$ 291$ 375$ 561$ 675$
Annual Revenue Requirement ($M)
Attachment D-1 E3 EPE Report Model Results June Page 34 of 34
Scenario Clean Energy Type 2021 2024 2025 2027 2031 2035 2040 2045Least-Cost (Reference Case) Renewable 4 12 22 23 28 35 36 40
Zero Carbon 62 68 77 76 79 81 77 75Least-Cost Case + ETA Resources Renewable 4 12 25 26 32 39 42 48
Zero Carbon 62 68 80 79 82 86 83 83Separate System Planning Renewable 4 12 23 23 28 39 42 46
Zero Carbon 62 68 78 77 78 85 83 81Separate System Planning (w H2) Renewable 4 12 24 24 29 36 41 45
Zero Carbon 62 68 79 78 80 82 83 80Low Load Growth Renewable 4 12 20 20 25 34 35 38
Zero Carbon 64 70 77 76 77 82 77 75High Load Growth Renewable 4 12 23 24 31 36 36 41
Zero Carbon 61 66 77 76 80 80 76 75High DG Renewable 4 13 22 24 29 35 37 40
Zero Carbon 63 70 78 77 79 82 78 76High DSM Renewable 4 12 19 20 23 33 34 37
Zero Carbon 63 69 76 75 75 82 78 75No New Gas Renewable 4 12 22 23 29 44 51 58
Zero Carbon 62 68 78 77 79 90 91 93No Lifetime Extensions Renewable 4 12 24 26 31 35 36 40
Zero Carbon 62 68 80 80 81 81 77 75High Gas Price Renewable 4 12 23 24 29 36 37 43
Zero Carbon 62 68 78 78 80 83 78 78Low Carbon Price Renewable 4 12 24 25 31 37 38 43
Zero Carbon 62 68 80 79 81 84 79 79Medium Carbon Price Renewable 4 12 27 28 33 39 41 46
Zero Carbon 62 68 83 82 83 86 82 81High Carbon Price Renewable 4 12 31 32 35 41 45 54
Zero Carbon 62 68 86 86 85 87 86 8980 Clean by 2035 Renewable 4 12 22 23 29 36 39 45
Zero Carbon 62 68 77 76 79 82 80 8020 CO2 Red by 2040 Renewable 4 12 22 23 29 35 36 43
Zero Carbon 62 68 77 76 79 81 77 7940 CO2 Red by 2040 Renewable 4 12 22 23 29 36 40 49
Zero Carbon 62 68 77 76 79 82 81 8460 CO2 Red by 2040 Renewable 4 12 22 23 29 35 46 54
Zero Carbon 62 68 77 76 79 82 87 8980 CO2 Red by 2040 Renewable 4 12 24 25 31 39 53 59
Zero Carbon 62 68 80 79 81 86 93 9490 CO2 Red by 2040 Renewable 4 12 24 25 31 42 56 62
Zero Carbon 62 68 80 79 81 88 97 97100 CO2 Red by 2040 Renewable 4 12 22 23 29 44 62 67
Zero Carbon 62 68 78 77 79 90 100 100100 CO2 Red by 2040 (w H2) Renewable 4 12 25 26 32 45 56 62
Zero Carbon 62 68 81 80 83 91 100 100
Clean Energy ( of Load)
Portfolio Analysis Results612021
El Paso Electric IRP
Modeling Update
Arne Olson Senior PartnerJack Moore Director
Joe Hooker Senior Managing ConsultantHuai Jiang Senior Consultant
Manu Mogadali Senior ConsultantChen Zhang Consultant
Attachment D-2 E-3 June IRP Presentation Page 1 of 37
2Confidential Draft
Agenda
Assumption updates
Updated Reference Case results
High DSM sensitivity results
New Mexico REA Requirements
New Mexico REA Scenario Results
Attachment D-2 E-3 June IRP Presentation Page 2 of 37
Assumption Updates
Attachment D-2 E-3 June IRP Presentation Page 3 of 37
4Confidential Draft
Unit Lifetime Extensions
E3 modeled unit lifetime extensions for the following units that are currently scheduled to retire prior to 2030
In the modeling unit extensions for Rio Grande 7 and Newman 2 are not selected but the other unit extensions are
Resource Planned Retirement Year
Extension Period
Capital + Fixed OampM
(2021 $kW-yr)Rio Grande 7 2022 5 years $11373Newman 1 2022 5 years $7859Newman 2 2022 5 years $7998Newman 3 2026 5 years $5812Newman 4 2026 5 years $4744
Attachment D-2 E-3 June IRP Presentation Page 4 of 37
5Confidential Draft
Planning Reserve Margin
The modeling assumes a 2-day-in-10-year reliability standard for 2025 as a transition to the more common 1-day-in-10-year reliability standard starting in 2030
Under this PRM all generators count toward the PRM based on their effective load carrying capability (ELCC)
Metric 2025 2030+
Reliability TargetTwo days with outages
every ten years on average (02 LOLE)
One day with outages every ten years on average (01 LOLE)
Target PCAP PRM 101 129
LOLE = Loss-of-Load Expectation PCAP = Perfect Capacity
Attachment D-2 E-3 June IRP Presentation Page 5 of 37
Updated Reference Case
Results
Attachment D-2 E-3 June IRP Presentation Page 6 of 37
7Confidential Draft
Scenarios and Sensitivities
Run Note Presented Previously
Presented Today
Least-Cost (Reference Case) Least-cost optimization used as reference case for all sensitivities
Least-Cost Case + REA Resources Additional resources added to Least-Cost Case for New Mexico REA
Separate System Planning New Mexico system planned separately for purposes of satisfying REA
Low Load Growth 3-4 higher native system load forecast
High Load Growth 3-4 lower native system load forecast
High DG High DG forecast
High DSM More smart thermostats doubling of energy efficiency
No New Gas No new gas after Newman 6
No Lifetime Extensions All plants retire as scheduled
High Gas Price Gas prices 15 higher
Low Carbon Price $8 per metric ton of CO2 in 2010 rising at 25 per year
Medium Carbon Price $20 per metric ton of CO2 in 2010 rising at 25 per year
High Carbon Price $40 per metric ton of CO2 in 2010 rising at 25 per year
80 Clean by 2035 80 zero-carbon energy
20 CO2 Red by 2040 20 reduction in CO2 emissions
40 CO2 Red by 2040 40 reduction in CO2 emissions
60 CO2 Red by 2040 60 reduction in CO2 emissions
80 CO2 Red by 2040 80 reduction in CO2 emissions
90 CO2 Red by 2040 90 reduction in CO2 emissions
100 CO2 Red by 2040 100 reduction in CO2 emissions
100 CO2 Red by 2040 (w H2) 100 reduction in CO2 emissions with hydrogen
Attachment D-2 E-3 June IRP Presentation Page 7 of 37
8Confidential Draft
Reference Case Additions and
Retirements
Total net additions by 2040
Storage ~1100 MW
Solar ~1500 MW
Wind ~100 MW
Gas (45) MW
DR = demand response BTM Solar = behind-the-meter solar
Attachment D-2 E-3 June IRP Presentation Page 8 of 37
9Confidential Draft
Reference Case Total Capacity
Total system capacity increases through 2045
bull Gas capacity declines 2027-2035 and then rises
bull Solar and storage capacity increase significantly
bull Wind and demand response increase more modestly
DR = demand response BTM Solar = behind-the-meter solar
Attachment D-2 E-3 June IRP Presentation Page 9 of 37
10Confidential Draft
Reference Case Annual Generation
BTM Solar = behind-the-meter solar
The amount of zero-carbon generation
increases markedly above current levels
Attachment D-2 E-3 June IRP Presentation Page 10 of 37
11Confidential Draft
Reference Case Effective Capacity
Load growth and resource
retirements together result in a
growing capacity need over time
which is met by a combination of
renewables storage demand
response and gas resources
Effective capacity is the amount of capacity that can be counted towards the PRM
Attachment D-2 E-3 June IRP Presentation Page 11 of 37
High DSM Sensitivity Results
Attachment D-2 E-3 June IRP Presentation Page 12 of 37
13Confidential Draft
High DSM Sensitivity Assumptions
Smart Thermostats Energy Efficiency
Base 50MW by 2040
High 60MW by 2040
Base 65 of native system load in 2040
High 13 of native system load in 2040
An incremental ~800 GWh in 2040 Corresponds to ~90 MW of savings on average throughout the year
Attachment D-2 E-3 June IRP Presentation Page 13 of 37
14Confidential Draft
High DSM Scenario Results
Change in Capacity Generation Mix
Attachment D-2 E-3 June IRP Presentation Page 14 of 37
New Mexico REA Requirements
Attachment D-2 E-3 June IRP Presentation Page 15 of 37
16Confidential Draft
New Mexico Renewable Energy Act
There are key requirements in the statutory language setting renewable energy and zero carbon requirements in New Mexico (emphasis added)
ldquoA public utility shall meet the renewable portfolio standard requirements as provided in this section to include renewable energy in its electric energy supply portfolio as demonstrated by its retirement of renewable energy certificates provided that the associated renewable energy is delivered to the public utility and assigned to the public utilitys New Mexico customershellip
(5) no later than January 1 2040 renewable energy resources shall supply no less than eighty percent of all retail sales of electricity in New Mexico provided that compliance with this standard until December 31 2047 shall not require the public utility to displace zero carbon resources in the utilitys generation portfolio on the effective date of this 2019 act and
(6) no later than January 1 2045 zero carbon resources shall supply one hundred percent of all retail sales of
electricity in New Mexico Reasonable and consistent progress shall be made over time toward this requirementrdquo
The scenarios analyzed consider multiple approaches for REA implementationbull Share of NM load served with renewable energy given that El Paso Electric serves NM load with
greater than 20 non-renewable zero-carbon resources (ie Palo Verde)
bull Annual vs hourly balancing periods for 100 zero-carbon generation
bull Whether combustion resources may be utilized to ensure reliability for NM customers
Attachment D-2 E-3 June IRP Presentation Page 16 of 37
17Confidential Draft
New Mexico REA Requirements in 2040+
The REA requires 80 RPS by 2040 unless doing so would require displacing existing zero-carbon generation
New Mexicorsquos share of Palo Verde 1 and 2 supplies 31 of New Mexicorsquos retail sales in 2040 and 27 in 2045
For purposes of IRP modeling El Paso Electric has directed E3 to require New Mexico zero-carbon generation (renewables + nuclear) to equal or exceed 100 of New Mexico retail sales or load starting in 2040
New Mexico Nuclear Generation amp Load
Nuclear Generation
Retail Sales
Total Load
Attachment D-2 E-3 June IRP Presentation Page 17 of 37
18Confidential Draft
Two Approaches for Modeling Zero-Carbon
Generation Balancing
bull New Mexico-allocated zero-carbon resources must generate enough energy on an annual basis to match the REA NM retail sales target
bull Natural gas resources andor imports can serve New Mexicorsquos energy needs in some hours if that generation is offset by additional zero-carbon generation in other hours
bull Annual balancing allows New Mexico customers to reap the benefits of being served by a larger system
Annual Balancing
bull New Mexico cannot receive power from gas resources or unspecified imports in any hour
bull Zero-carbon generation from New Mexico-allocated resources must serve New Mexico energy demand in all hours of the year
bull This would be a more stringent zero-carbon requirement as it would not allow for balancing between New Mexico and Texas resources
Hourly Balancing
NM-Allocated Resources
NM customers can be served by gas resources
and unspecified imports if offset in other hours
NM-Allocated Resources
Other Resources
NM customers cannot be served by gas resources
or unspecified imports an any hour
Attachment D-2 E-3 June IRP Presentation Page 18 of 37
19Confidential Draft
Two Approaches for Modeling Capacity
Pooling to Ensure Reliability
bull For reliability planning purposes NM and TX loads can be served by NM resources TX resources andor system resources
bull If the NM jurisdiction doesnrsquot have enough resources to satisfy load in an hour then it can rely on TX resources and vice versa
bull NM and TX customers must still pay for enough resources to satisfy their share of system reliability needs
Capacity Pooling Allowed
bull For planning purposes TX and NM must each have enough resources to ensure reliability across a range of potential conditions without relying on the other jurisdiction (ie on a standalone basis)
bull This would be a more stringent planning approach NM would need to plan to have enough resources without falling back on TX gas resources in some hours
Capacity Pooling NOT Allowed
NM-Allocated Resources
TX-Allocated Resources
NM-Allocated Resources
TX-Allocated Resources
All resources together ensure
systemwide reliability across all hours
subject to the reliability standard
For planning purposes each jurisdiction
ensures reliability on its own across all
hours subject to the reliability standard
Attachment D-2 E-3 June IRP Presentation Page 19 of 37
20Confidential Draft
New Mexico REA Scenarios and
Jurisdictional Allocation
E3 modeled a few scenarios with different approaches for how to satisfy the REA requirementsbull Different approaches of the REA requirements have meaningful implications on how
planning is performed for New Mexico customersbull The more stringent approaches of the REA requirements will result in higher system
costs relative to less stringent approaches
bull To ensure equitable treatment of customers across jurisdictions any incremental costs of satisfying the REA requirements would be allocated to New Mexico customers
For each scenario resources and costs are allocated between the New Mexico and Texas jurisdictionsbull The allocation of resources follows directly from a particular approach to modeling
REA compliance If a particular approach requires more resources to be added versus the least-cost case then those resources are allocated to the New Mexico jurisdiction
bull Capacity generation and cost for the New Mexico jurisdiction are presented for each scenario
Attachment D-2 E-3 June IRP Presentation Page 20 of 37
21Confidential Draft
Least Cost(ldquoLCrdquo)
Least Cost + REA Resources
(ldquoLC+REArdquo)
Separate System Planning
(ldquoSSPrdquo)
Portfoliooptimization
Least-cost system optimization
Reoptimize Least Cost to add additional renewables amp storage dedicated to NM to satisfy REA requirements
Optimize NM and TX systems independently
without modeling interactions between them
NM zero-carbon generation balancing period
Annual Annual Hourly
NM and TX capacity pooling to ensure reliability
Resource allocationResources allocated
proportionally more RECs allocated to NM
Incremental resources are allocated to New Mexico
Optimization identifies resources specifically for NM and TX jurisdictions
NM allocated new gas capacity
New Mexico REA Scenarios
More stringent REA interpretation
Attachment D-2 E-3 June IRP Presentation Page 21 of 37
New Mexico REA Scenario
Results
Attachment D-2 E-3 June IRP Presentation Page 22 of 37
23Confidential Draft
Least Cost(ldquoLCrdquo)
Least Cost + ETA Resources
(ldquoLC+ETArdquo)
Separate System Planning
(ldquoSSPrdquo)
Portfoliooptimization
Least-cost system optimization
Reoptimize Least Cost to add additional renewables amp storage dedicated to NM to satisfy ETA requirements
Optimize NM and TX systems independently
without modeling interactions between them
NM zero-carbon generation balancing period
Annual Annual Hourly
NM and TX capacity pooling to ensure reliability
Resource allocationResources allocated
proportionally more RECs allocated to NM
Incremental resources are allocated to New Mexico
Optimization identifies resources specifically for NM and TX jurisdictions
NM allocated new gas capacity
New Mexico REA Scenarios
Attachment D-2 E-3 June IRP Presentation Page 23 of 37
24Confidential Draft
Resource Portfolios and Costs by ScenarioLeast Cost Scenario
Total System New Mexico
This scenario allocates a share of new gas capacity to NM customers This capacity could be converted to run on a higher share of hydrogen fuel in the future More RECs would be allocated to NM customers to satisfy the REA
112 MW of new gas capacity is allocated to New Mexico customers by 2040
This analysis does not assume Palo Verde 3 generation is allocated to New Mexico resulting in a lower zero-carbon generation share than the rest of the system
Attachment D-2 E-3 June IRP Presentation Page 24 of 37
25Confidential Draft
Least Cost(ldquoLCrdquo)
Least Cost + REA Resources
(ldquoLC+REArdquo)
Separate System Planning
(ldquoSSPrdquo)
Portfoliooptimization
Least-cost system optimization
Reoptimize Least Cost to add additional renewables amp storage dedicated to NM to satisfy REA requirements
Optimize NM and TX systems independently
without modeling interactions between them
NM zero-carbon generation balancing period
Annual Annual Hourly
NM and TX capacity pooling to ensure reliability
Resource allocationResources allocated
proportionally more RECs allocated to NM
Incremental resources are allocated to New Mexico
Optimization identifies resources specifically for NM and TX jurisdictions
NM allocated new gas capacity
New Mexico REA Scenarios
Attachment D-2 E-3 June IRP Presentation Page 25 of 37
26Confidential Draft
Resource Portfolios and Costs by ScenarioLeast Cost + REA Scenario
Total System New Mexico
This scenario adds more solar and storage capacity for NM customers to satisfy the RPSREA targets while not allocating any new gas to NM customers This results in a modest cost increase vs Least Cost scenario
Gas generation serves a portion of New Mexico customersrsquo energy needs in some hours but that is more than offset by
Attachment D-2 E-3 June IRP Presentation Page 26 of 37
27Confidential Draft
New Mexico REA Scenarios
Least Cost(ldquoLCrdquo)
Least Cost + REA Resources
(ldquoLC+REArdquo)
Separate System Planning
(ldquoSSPrdquo)
Portfoliooptimization
Least-cost system optimization
Reoptimize Least Cost to add additional renewables amp storage dedicated to NM to satisfy REA requirements
Optimize NM and TX systems independently
without modeling interactions between them
NM zero-carbon generation balancing period
Annual Annual Hourly
NM and TX capacity pooling to ensure reliability
Resource allocationResources allocated
proportionally more RECs allocated to NM
Incremental resources are allocated to New Mexico
Optimization identifies resources specifically for NM and TX jurisdictions
NM allocated new gas capacity
Attachment D-2 E-3 June IRP Presentation Page 27 of 37
28Confidential Draft
Resource Portfolios and Costs by ScenarioSeparate System Planning Scenario
Total System New Mexico
This scenario requires significantly more resources for New Mexico to reach 100 absolute zero carbon and ensure reliability This results in a significant cost increase relative to the Least Cost scenario
Attachment D-2 E-3 June IRP Presentation Page 28 of 37
29Confidential Draft
Resource Portfolios and Costs by ScenarioSeparate System Planning (H2) Scenario
Total System New Mexico
Adding H2 capacity ensures reliability while significantly reducing solar and storage additions This mitigates cost impacts of achieving absolute zero carbon and planning to ensure reliability independently
Attachment D-2 E-3 June IRP Presentation Page 29 of 37
30Confidential Draft
New Mexico Capacity and CostLeast Cost Scenario
Least Cost Cost Impact vs Least Cost Scenario
The Least Cost scenario is the baseline for comparison Least
Cost
Attachment D-2 E-3 June IRP Presentation Page 30 of 37
31Confidential Draft
New Mexico Capacity and CostLeast Cost + REA Resources Scenario
Least Cost + REA Resources Cost Impact vs Least Cost Scenario
Least Cost + REA Resources
Least Cost
Attachment D-2 E-3 June IRP Presentation Page 31 of 37
32Confidential Draft
New Mexico Capacity and CostSeparate System Planning Scenario
Separate System Planning Cost Impact vs Least Cost Scenario
Least Cost + REA Resources
Separate System Planning
Least Cost
Attachment D-2 E-3 June IRP Presentation Page 32 of 37
33Confidential Draft
New Mexico Capacity and CostSeparate System Planning (H2) Scenario
Separate System Planning (H2) Cost Impact vs Least Cost Scenario
Least Cost + REA Resources
Separate System Planning (H2)
Separate System Planning
Least Cost
Attachment D-2 E-3 June IRP Presentation Page 33 of 37
34Confidential Draft
New Mexico Generation MixLeast Cost and Least Cost + REA Scenarios
Least Cost Least Cost + REA Resources
Attachment D-2 E-3 June IRP Presentation Page 34 of 37
35Confidential Draft
New Mexico Generation MixSeparate System Planning Scenarios
Separate System Planning Separate System Planning (H2)
Attachment D-2 E-3 June IRP Presentation Page 35 of 37
36Confidential Draft
Carbon Emissions Across Scenarios
CO2 Emissions in 2021 and 2040 Average Abatement Cost 2025-2040
Note emissions include emissions at company-owned facilities and emissions ascribed to imports2040
Attachment D-2 E-3 June IRP Presentation Page 36 of 37
Thank You
Thank You
Attachment D-2 E-3 June IRP Presentation Page 37 of 37
Attachment D-3 E3 EPE Report Model Results AugustPage 1 of 34
Scenario Resource Type 2021 2024 2025 2027 2031 2035 2040 2045Least-Cost (Reference Case) Nuclear (Palo Verde) 5148 5148 5148 5148 5148 5148 5148 5148
Nuclear (SMR) - - - - - - - - Gas - Steam Turbine 140 34 8 7 1 - - - Gas - Combined Cycle 1767 1373 1037 1148 1187 1075 1321 1513 Gas - Combustion Turbine 1027 1169 854 925 874 767 1251 1657 Biomass - - - - - - - - Geothermal - - - - - - - - Wind - - 354 357 361 316 381 730 Solar 289 952 1450 1467 2016 3050 3469 4199 Battery Storage - 12 (25) (26) (104) (215) (223) (248) Imports 391 336 266 261 296 278 360 440 Demand Response - - - - - - - - Hydrogen - - - - - - - - BTM Solar 37 135 165 225 344 460 601 763 Load 8771 9155 9258 9512 10123 10878 12308 14203 Excess Generation 14 130 416 397 431 636 374 456
Least-Cost Case + REA Resources Nuclear (Palo Verde) 5148 5148 5148 5148 5148 5148 5148 5148 Nuclear (SMR) - - - - - - - - Gas - Steam Turbine 140 34 4 11 1 - - - Gas - Combined Cycle 1767 1373 926 1001 1044 927 966 1101 Gas - Combustion Turbine 1027 1169 784 855 780 495 761 1005 Biomass - - - - - - - - Geothermal - - - - - - - - Wind - - 681 694 699 561 725 995 Solar 289 952 1340 1356 2030 3274 4121 5334 Battery Storage - 12 (29) (30) (105) (236) (277) (369) Imports 391 336 239 251 182 248 262 226 Demand Response - - - - - - - - Hydrogen - - - - - - - - BTM Solar 37 135 165 225 344 460 601 763 Load 8771 9155 9258 9512 10123 10878 12308 14203 Excess Generation 14 130 428 400 449 1144 1071 892
Separate System Planning Nuclear (Palo Verde) 5148 5148 5148 5148 5148 5148 5148 5148 Nuclear (SMR) - - - - - - - - Gas - Steam Turbine 140 34 1 2 - - - - Gas - Combined Cycle 1763 1385 1125 1238 1235 1000 1201 1349 Gas - Combustion Turbine 1048 1180 852 922 920 502 768 1046 Biomass - - - - - - - - Geothermal - - - - - - - - Wind - - 174 175 169 76 23 398 Solar 289 950 1556 1594 2135 3760 4704 5638 Battery Storage - 11 (55) (62) (129) (300) (367) (423) Imports 391 328 291 269 301 232 229 283 Demand Response - - - - - - - - Hydrogen - - - - - - - - BTM Solar 37 135 165 225 344 460 601 763 Load 8771 9155 9258 9512 10123 10878 12308 14203 Excess Generation 14 132 304 265 365 1270 2517 2452
Annual Energy (GWh)
Attachment D-3 E3 EPE Report Model Results AugustPage 2 of 34
Scenario Resource Type 2021 2024 2025 2027 2031 2035 2040 2045Annual Energy (GWh)
Separate System Planning (w H2) Nuclear (Palo Verde) 5148 5148 5148 5148 5148 5148 5148 5148 Nuclear (SMR) - - - - - - - - Gas - Steam Turbine 140 34 1 2 - - - - Gas - Combined Cycle 1763 1385 1101 1210 1223 1104 1199 1348 Gas - Combustion Turbine 1048 1180 843 915 870 762 793 1072 Biomass - - - - - - - - Geothermal - - - - - - - - Wind - - 214 215 207 202 285 678 Solar 289 950 1551 1588 2173 3139 4241 5147 Battery Storage - 11 (54) (61) (130) (221) (311) (365) Imports 391 328 288 270 288 285 278 331 Demand Response - - - - - - - - Hydrogen - - - - - - 74 80 BTM Solar 37 135 165 225 344 460 601 763 Load 8771 9155 9258 9512 10123 10878 12308 14203 Excess Generation 14 132 314 276 474 696 883 967
80 Clean by 2035 Nuclear (Palo Verde) 5148 5148 5148 5148 5148 5148 5148 5148 Nuclear (SMR) - - - - - - - - Gas - Steam Turbine 140 34 8 11 1 - - - Gas - Combined Cycle 1767 1373 1028 1131 1175 1088 1160 1293 Gas - Combustion Turbine 1027 1169 849 922 868 767 1055 1256 Biomass - - - - - - - - Geothermal - - - - - - - - Wind - - 378 381 385 342 650 1041 Solar 289 953 1450 1463 2012 3006 3689 4703 Battery Storage - 12 (24) (26) (103) (207) (238) (289) Imports 391 336 255 256 292 274 241 287 Demand Response - - - - - - - - Hydrogen - - - - - - - - BTM Solar 37 135 165 225 344 460 601 763 Load 8771 9155 9258 9512 10123 10878 12308 14203 Excess Generation 14 130 406 391 436 677 472 735
20 CO2 Red by 2040 Nuclear (Palo Verde) 5148 5148 5148 5148 5148 5148 5148 5148 Nuclear (SMR) - - - - - - - - Gas - Steam Turbine 140 34 8 11 1 - - - Gas - Combined Cycle 1767 1373 1027 1131 1175 1089 1253 1260 Gas - Combustion Turbine 1027 1169 849 922 868 765 1132 1187 Biomass - - - - - - - - Geothermal - - - - - - - - Wind - - 378 381 385 342 457 1095 Solar 289 953 1442 1456 2012 3007 3621 4792 Battery Storage - 12 (24) (26) (103) (207) (236) (297) Imports 391 336 264 264 292 275 332 255 Demand Response - - - - - - - - Hydrogen - - - - - - - - BTM Solar 37 135 165 225 344 460 601 763 Load 8771 9155 9258 9512 10123 10878 12308 14203 Excess Generation 14 129 415 398 436 676 463 752
Attachment D-3 E3 EPE Report Model Results AugustPage 3 of 34
Scenario Resource Type 2021 2024 2025 2027 2031 2035 2040 2045Annual Energy (GWh)
40 CO2 Red by 2040 Nuclear (Palo Verde) 5148 5148 5148 5148 5148 5148 5148 5148 Nuclear (SMR) - - - - - - - - Gas - Steam Turbine 140 34 8 11 1 - - - Gas - Combined Cycle 1767 1373 1027 1131 1175 1089 1060 1028 Gas - Combustion Turbine 1027 1169 849 922 868 767 790 822 Biomass - - - - - - - - Geothermal - - - - - - - - Wind - - 378 381 385 342 783 961 Solar 289 953 1441 1458 2013 3004 3980 5677 Battery Storage - 12 (24) (26) (103) (207) (264) (396) Imports 391 336 264 262 292 276 210 199 Demand Response - - - - - - - - Hydrogen - - - - - - - - BTM Solar 37 135 165 225 344 460 601 763 Load 8771 9155 9258 9512 10123 10878 12308 14203 Excess Generation 14 130 415 396 435 680 811 1196
60 CO2 Red by 2040 Nuclear (Palo Verde) 5148 5148 5148 5148 5148 5148 5148 5148 Nuclear (SMR) - - - - - - - - Gas - Steam Turbine 140 34 7 12 1 - - - Gas - Combined Cycle 1767 1373 1001 1093 1143 1029 780 735 Gas - Combustion Turbine 1027 1169 840 915 852 656 453 483 Biomass - - - - - - - - Geothermal - - - - - - - - Wind - - 444 448 451 388 853 808 Solar 289 953 1419 1436 2000 3174 4624 6588 Battery Storage - 12 (25) (26) (101) (226) (312) (488) Imports 391 336 259 260 286 250 161 166 Demand Response - - - - - - - - Hydrogen - - - - - - - - BTM Solar 37 135 165 225 344 460 601 763 Load 8771 9155 9258 9512 10123 10878 12308 14203 Excess Generation 14 129 411 390 452 766 1514 1850
80 CO2 Red by 2040 Nuclear (Palo Verde) 5148 5148 5148 5148 5148 5148 5148 5148 Nuclear (SMR) - - - - - - - - Gas - Steam Turbine 140 34 4 11 1 - - - Gas - Combined Cycle 1767 1373 914 986 1049 835 531 500 Gas - Combustion Turbine 1027 1169 771 842 725 399 127 142 Biomass - - - - - - - - Geothermal - - - - - - - - Wind - - 722 735 743 584 1310 1417 Solar 289 953 1329 1343 2004 3491 4869 6658 Battery Storage - 12 (31) (30) (102) (245) (342) (499) Imports 391 336 235 251 212 208 63 73 Demand Response - - - - - - - - Hydrogen - - - - - - - - BTM Solar 37 135 165 225 344 460 601 763 Load 8771 9155 9258 9512 10123 10878 12308 14203 Excess Generation 14 130 444 417 491 1350 2580 2939
Attachment D-3 E3 EPE Report Model Results AugustPage 4 of 34
Scenario Resource Type 2021 2024 2025 2027 2031 2035 2040 2045Annual Energy (GWh)
90 CO2 Red by 2040 Nuclear (Palo Verde) 5148 5148 5148 5148 5148 5148 5148 5148 Nuclear (SMR) - - - - - - - - Gas - Steam Turbine 140 34 4 11 2 - - - Gas - Combined Cycle 1767 1373 908 979 1009 778 304 290 Gas - Combustion Turbine 1027 1169 766 836 622 291 29 44 Biomass - - - - - - - - Geothermal - - - - - - - - Wind - - 740 754 763 513 1964 2116 Solar 289 952 1325 1339 2154 3842 4535 6263 Battery Storage - 12 (31) (30) (100) (278) (308) (453) Imports 391 336 232 250 182 125 35 32 Demand Response - - - - - - - - Hydrogen - - - - - - - - BTM Solar 37 135 165 225 344 460 601 763 Load 8771 9155 9258 9512 10123 10878 12308 14203 Excess Generation 14 130 452 424 650 1462 3356 3714
100 CO2 Red by 2040 (w H2) Nuclear (Palo Verde) 5148 5148 5148 5148 5148 5148 5148 5148 Nuclear (SMR) - - - - - - - - Gas - Steam Turbine 140 34 5 7 2 - - - Gas - Combined Cycle 1767 1373 860 928 924 643 - - Gas - Combustion Turbine 1027 1169 715 779 558 188 - - Biomass - - - - - - - - Geothermal - - - - - - - - Wind - - 896 917 922 557 1629 1685 Solar 289 952 1284 1297 2175 4069 4874 6693 Battery Storage - 12 (31) (32) (97) (302) (345) (509) Imports 391 336 215 242 148 114 - - Demand Response - - - - - - - - Hydrogen - - - - - - 400 423 BTM Solar 37 135 165 225 344 460 601 763 Load 8771 9155 9258 9512 10123 10878 12308 14203 Excess Generation 14 130 528 495 798 1795 3187 3597
100 CO2 Red by 2040 Nuclear (Palo Verde) 5148 5148 5148 5148 5148 5148 5148 5148 Nuclear (SMR) - - - - - - - - Gas - Steam Turbine 140 34 7 12 2 - - - Gas - Combined Cycle 1767 1373 1013 1110 924 643 - - Gas - Combustion Turbine 1027 1169 843 917 558 188 - - Biomass - - - - - - - - Geothermal - - - - - - - - Wind - - 416 419 922 557 1992 2629 Solar 289 952 1430 1445 2175 4069 4973 5542 Battery Storage - 12 (25) (26) (97) (302) (406) (572) Imports 391 336 260 261 148 114 - - Demand Response - - - - - - - - Hydrogen - - - - - - - - BTM Solar 37 135 165 225 344 460 601 1455 Load 8771 9155 9258 9512 10123 10878 12308 14203 Excess Generation 14 130 412 393 798 1795 11640 13062
Attachment D-3 E3 EPE Report Model Results AugustPage 5 of 34
Scenario Resource Type 2021 2024 2025 2027 2031 2035 2040 2045Annual Energy (GWh)
High DG Nuclear (Palo Verde) 5148 5148 5148 5148 5148 5148 5148 5148 Nuclear (SMR) - - - - - - - - Gas - Steam Turbine 134 31 9 12 1 - - - Gas - Combined Cycle 1728 1317 1044 1144 1175 1073 1273 1538 Gas - Combustion Turbine 1028 1123 885 923 846 711 1096 1713 Biomass - - - - - - - - Geothermal - - - - - - - - Wind - - 338 336 341 295 352 763 Solar 285 866 1148 1107 1485 2336 2661 2700 Battery Storage - 11 (25) (25) (105) (226) (249) (243) Imports 389 314 273 258 287 265 347 441 Demand Response - - - - - - - - Hydrogen - - - - - - - - BTM Solar 88 350 436 608 945 1276 1680 2144 Load 8771 9155 9258 9512 10123 10878 12308 14203 Excess Generation 18 217 389 432 552 696 602 379
High DSM Nuclear (Palo Verde) 5148 5148 5148 5148 5148 5148 5148 5148 Nuclear (SMR) - - - - - - - - Gas - Steam Turbine 133 30 2 3 0 - - - Gas - Combined Cycle 1744 1303 1197 1315 1357 1105 1320 1460 Gas - Combustion Turbine 1020 1111 977 1001 989 706 1104 1404 Biomass - - - - - - - - Geothermal - - - - - - - - Wind - - - - - - - 471 Solar 288 934 1274 1273 1604 2760 3166 3725 Battery Storage - 10 (25) (23) (80) (203) (216) (234) Imports 390 329 318 286 318 297 377 438 Demand Response - - - - - - - - Hydrogen - - - - - - - - BTM Solar 37 135 165 225 344 460 601 763 Load 8731 8994 9056 9230 9680 10273 11501 13177 Excess Generation 15 148 197 197 215 541 326 371
Low Load Nuclear (Palo Verde) 5148 5148 5148 5148 5148 5148 5148 5148 Nuclear (SMR) - - - - - - - - Gas - Steam Turbine 101 27 2 3 2 - - - Gas - Combined Cycle 1596 1244 1155 1300 1422 1129 1372 1496 Gas - Combustion Turbine 983 1065 942 985 1034 759 1214 1529 Biomass - - - - - - - - Geothermal - - - - - - - - Wind - - - - - - - 523 Solar 282 919 1260 1272 1563 2869 3314 3970 Battery Storage - 8 (26) (24) (69) (209) (222) (246) Imports 381 325 311 284 315 303 385 440 Demand Response - - - - - - - - Hydrogen - - - - - - - - BTM Solar 37 135 165 225 344 460 601 763 Load 8492 8862 8958 9194 9759 10459 11813 13623 Excess Generation 22 163 216 205 224 535 317 399
Attachment D-3 E3 EPE Report Model Results AugustPage 6 of 34
Scenario Resource Type 2021 2024 2025 2027 2031 2035 2040 2045Annual Energy (GWh)
High Load Nuclear (Palo Verde) 5148 5148 5148 5148 5148 5148 5148 5148 Nuclear (SMR) - - - - - - - - Gas - Steam Turbine 195 50 7 3 - - - - Gas - Combined Cycle 1909 1522 1077 1166 1126 1113 1386 1518 Gas - Combustion Turbine 1088 1256 889 937 786 875 1409 1781 Biomass - - - - - - - - Geothermal - - - - - - - - Wind - - 420 424 404 387 450 957 Solar 293 983 1618 1717 2556 3249 3659 4426 Battery Storage - 14 (42) (64) (158) (220) (224) (251) Imports 400 343 275 273 281 286 373 440 Demand Response - - - - - - - - Hydrogen - - - - - - - - BTM Solar 37 135 165 225 344 460 601 763 Load 9050 9448 9558 9830 10488 11297 12803 14784 Excess Generation 10 100 381 278 543 642 387 518
No Lifetime Extensions Nuclear (Palo Verde) 5148 5148 5148 5148 5148 5148 5148 5148 Nuclear (SMR) - - - - - - - - Gas - Steam Turbine 140 34 12 2 - - - - Gas - Combined Cycle 1767 1373 972 1029 1055 1069 1314 1513 Gas - Combustion Turbine 1027 1169 744 693 636 764 1246 1657 Biomass - - - - - - - - Geothermal - - - - - - - - Wind - - 364 369 340 337 408 730 Solar 289 952 1643 1894 2495 3039 3457 4199 Battery Storage - 12 (26) (92) (164) (214) (223) (248) Imports 391 336 235 243 270 276 357 440 Demand Response - - - - - - - - Hydrogen - - - - - - - - BTM Solar 37 135 165 225 344 460 601 763 Load 8771 9155 9258 9512 10123 10878 12308 14203 Excess Generation 14 130 669 413 585 637 371 456
No New Gas Nuclear (Palo Verde) 5148 5148 5148 5148 5148 5148 5148 5148 Nuclear (SMR) - - - - - - - - Gas - Steam Turbine 140 34 7 12 1 - - - Gas - Combined Cycle 1767 1373 1013 1110 1156 829 774 714 Gas - Combustion Turbine 1027 1169 843 917 859 294 269 286 Biomass - - - - - - - - Geothermal - - - - - - - - Wind - - 416 419 423 227 195 209 Solar 289 952 1430 1445 2002 4003 5562 7483 Battery Storage - 12 (25) (26) (102) (320) (460) (623) Imports 391 336 260 261 293 237 219 223 Demand Response - - - - - - - - Hydrogen - - - - - - - - BTM Solar 37 135 165 225 344 460 601 763 Load 8771 9155 9258 9512 10123 10878 12308 14203 Excess Generation 14 130 412 393 449 1709 2222 2760
Attachment D-3 E3 EPE Report Model Results AugustPage 7 of 34
Scenario Resource Type 2021 2024 2025 2027 2031 2035 2040 2045Annual Energy (GWh)
Low Carbon Price Nuclear (Palo Verde) 5148 5148 5148 5148 5148 5148 5148 5148 Nuclear (SMR) - - - - - - - - Gas - Steam Turbine 127 23 4 5 1 - - - Gas - Combined Cycle 1803 1433 1000 1092 1104 988 1204 1335 Gas - Combustion Turbine 1001 1107 776 839 788 598 1076 1338 Biomass - - - - - - - - Geothermal - - - - - - - - Wind - - 562 571 569 479 581 943 Solar 289 958 1390 1406 1988 3174 3609 4556 Battery Storage - 11 (30) (29) (104) (228) (238) (278) Imports 394 345 242 255 285 258 326 397 Demand Response - - - - - - - - Hydrogen - - - - - - - - BTM Solar 37 135 165 225 344 460 601 763 Load 8771 9155 9258 9512 10123 10878 12308 14203 Excess Generation 14 125 403 379 473 835 521 718
Mid Carbon Price Nuclear (Palo Verde) 5148 5148 5148 5148 5148 5148 5148 5148 Nuclear (SMR) - - - - - - - - Gas - Steam Turbine 120 22 3 4 1 - - - Gas - Combined Cycle 1822 1496 923 994 1017 922 1107 1275 Gas - Combustion Turbine 983 1036 596 663 681 475 938 1205 Biomass - - - - - - - - Geothermal - - - - - - - - Wind - - 771 794 801 650 804 1099 Solar 290 961 1474 1493 2020 3264 3720 4732 Battery Storage - 7 (35) (36) (101) (230) (245) (291) Imports 399 354 212 227 211 190 235 273 Demand Response - - - - - - - - Hydrogen - - - - - - - - BTM Solar 37 135 165 225 344 460 601 763 Load 8771 9155 9258 9512 10123 10878 12308 14203 Excess Generation 13 121 615 574 500 912 572 727
High Carbon Price Nuclear (Palo Verde) 5148 5148 5148 5148 5148 5148 5148 5148 Nuclear (SMR) - - - - - - - - Gas - Steam Turbine 119 21 3 3 2 - - - Gas - Combined Cycle 1835 1540 704 778 913 873 962 863 Gas - Combustion Turbine 962 989 447 494 545 394 614 583 Biomass - - - - - - - - Geothermal - - - - - - - - Wind - - 881 916 965 778 930 859 Solar 290 963 1760 1782 2130 3267 4138 6248 Battery Storage - 2 (37) (36) (98) (230) (275) (458) Imports 408 362 187 203 174 188 189 195 Demand Response - - - - - - - - Hydrogen - - - - - - - - BTM Solar 37 135 165 225 344 460 601 763 Load 8771 9155 9258 9512 10123 10878 12308 14203 Excess Generation 13 120 1146 1089 774 1061 1077 1549
Attachment D-3 E3 EPE Report Model Results AugustPage 8 of 34
Scenario Resource Type 2021 2024 2025 2027 2031 2035 2040 2045Annual Energy (GWh)
High Gas Price Nuclear (Palo Verde) 5148 5148 5148 5148 5148 5148 5148 5148 Nuclear (SMR) - - - - - - - - Gas - Steam Turbine 125 31 6 5 1 - - - Gas - Combined Cycle 1787 1400 1015 1115 1125 1015 1242 1350 Gas - Combustion Turbine 1008 1120 803 853 805 627 1127 1365 Biomass - - - - - - - - Geothermal - - - - - - - - Wind - - 444 448 451 387 467 924 Solar 290 956 1419 1435 1998 3161 3603 4486 Battery Storage - 9 (29) (28) (103) (224) (235) (274) Imports 403 360 287 309 355 303 354 440 Demand Response - - - - - - - - Hydrogen - - - - - - - - BTM Solar 37 135 165 225 344 460 601 763 Load 8771 9155 9258 9512 10123 10878 12308 14203 Excess Generation 13 127 411 390 455 783 483 702
Low Renewable and Storage Costs Nuclear (Palo Verde) 5148 5148 5148 5148 5148 5148 5148 5148 Nuclear (SMR) - - - - - - - - Gas - Steam Turbine 140 34 3 6 1 - - - Gas - Combined Cycle 1767 1373 984 1068 1096 1000 1220 1278 Gas - Combustion Turbine 1027 1169 842 925 824 652 1127 1243 Biomass - - - - - - - - Geothermal - - - - - - - - Wind - - 558 564 559 474 578 1026 Solar 289 952 1321 1330 1975 3102 3538 4621 Battery Storage - 12 (29) (29) (102) (221) (232) (288) Imports 391 336 265 275 279 262 328 411 Demand Response - - - - - - - - Hydrogen - - - - - - - - BTM Solar 37 135 165 225 344 460 601 763 Load 8771 9155 9258 9512 10123 10878 12308 14203 Excess Generation 14 130 324 309 486 807 490 896
Attachment D-3 E3 EPE Report Model Results AugustPage 9 of 34
Scenario Resource TypeLeast-Cost (Reference Case) Nuclear (Palo Verde)
Nuclear (SMR)Gas - Steam TurbineGas - Combined CycleGas - Combustion TurbineBiomassGeothermalWindSolarBattery StorageImportsDemand ResponseHydrogenBTM SolarLoadExcess Generation
Least-Cost Case + REA Resources Nuclear (Palo Verde)Nuclear (SMR)Gas - Steam TurbineGas - Combined CycleGas - Combustion TurbineBiomassGeothermalWindSolarBattery StorageImportsDemand ResponseHydrogenBTM SolarLoadExcess Generation
Separate System Planning Nuclear (Palo Verde)Nuclear (SMR)Gas - Steam TurbineGas - Combined CycleGas - Combustion TurbineBiomassGeothermalWindSolarBattery StorageImportsDemand ResponseHydrogenBTM SolarLoadExcess Generation
2021 2024 2025 2027 2031 2035 2040 2045622 622 622 622 622 622 622 622 - - - - - - - - 426 307 307 307 234 - - - 493 493 493 493 493 266 266 266 503 731 731 731 668 870 1059 1216 - - - - - - - - - - - - - - - - - - 102 102 102 102 102 197 115 385 621 621 823 1235 1309 1561 - 50 177 177 488 1029 1129 1277 - - - - - - - - 46 53 56 61 71 81 93 93
- - - - - - - - 18 65 80 108 166 221 289 368
- - - - - - - - - - - - - - - - 622 622 622 622 622 622 622 622 - - - - - - - - 426 307 307 307 234 - - - 493 493 493 493 493 266 266 266 503 731 731 731 668 809 942 1051 - - - - - - - - - - - - - - - - - - 203 203 203 203 232 300 115 385 544 544 795 1414 1693 2037 - 50 176 177 460 1067 1246 1682 - - - - - - - - 46 53 56 61 71 81 93 93
- - - - - - - - 18 65 80 108 166 221 289 368
- - - - - - - - - - - - - - - - 622 622 622 622 622 622 622 622 - - - - - - - - 426 307 307 307 234 - - - 493 493 493 493 493 266 266 266 503 731 731 731 668 755 755 864 - - - - - - - - - - - - - - - - - - 49 49 49 49 49 161 115 385 639 639 859 1701 2450 2712 - 50 280 304 591 1514 2344 2674 - - - - - - - - 46 53 56 61 71 81 93 93
- - - - - - - - 18 65 80 108 166 221 289 368
- - - - - - - - - - - - - - - -
Installed Capacity (MW)
Attachment D-3 E3 EPE Report Model Results AugustPage 10 of 34
Scenario Resource TypeSeparate System Planning (w H2) Nuclear (Palo Verde)
Nuclear (SMR)Gas - Steam TurbineGas - Combined CycleGas - Combustion TurbineBiomassGeothermalWindSolarBattery StorageImportsDemand ResponseHydrogenBTM SolarLoadExcess Generation
80 Clean by 2035 Nuclear (Palo Verde)Nuclear (SMR)Gas - Steam TurbineGas - Combined CycleGas - Combustion TurbineBiomassGeothermalWindSolarBattery StorageImportsDemand ResponseHydrogenBTM SolarLoadExcess Generation
20 CO2 Red by 2040 Nuclear (Palo Verde)Nuclear (SMR)Gas - Steam TurbineGas - Combined CycleGas - Combustion TurbineBiomassGeothermalWindSolarBattery StorageImportsDemand ResponseHydrogenBTM SolarLoadExcess Generation
2021 2024 2025 2027 2031 2035 2040 2045Installed Capacity (MW)
622 622 622 622 622 622 622 622 - - - - - - - - 426 307 307 307 234 - - - 493 493 493 493 493 266 266 266 503 731 731 731 668 755 755 864 - - - - - - - - - - - - - - - - - - 60 60 60 60 107 218 115 385 638 638 905 1312 1724 2031 - 50 278 303 570 1057 1496 1797 - - - - - - - - 46 53 56 61 71 81 93 93
- - - - - 123 206 212 18 65 80 108 166 221 289 368
- - - - - - - - - - - - - - - - 622 622 622 622 622 622 622 622 - - - - - - - - 426 307 307 307 234 - - - 493 493 493 493 493 266 266 266 503 731 731 731 668 910 1022 1149 - - - - - - - - - - - - - - - - - - 109 109 109 109 185 289 115 385 615 615 821 1233 1383 1799 - 50 177 177 486 968 1145 1327 - - - - - - - - 46 53 56 61 71 81 93 93
- - - - - - - - 18 65 80 108 166 221 289 368
- - - - - - - - - - - - - - - - 622 622 622 622 622 622 622 622 - - - - - - - - 426 307 307 307 234 - - - 493 493 493 493 493 266 266 266 503 731 731 731 668 910 1036 1138 - - - - - - - - - - - - - - - - - - 109 109 109 109 125 300 115 385 615 615 821 1233 1383 1837 - 50 177 177 486 968 1145 1359 - - - - - - - - 46 53 56 61 71 81 93 93
- - - - - - - - 18 65 80 108 166 221 289 368
- - - - - - - - - - - - - - - -
Attachment D-3 E3 EPE Report Model Results AugustPage 11 of 34
Scenario Resource Type40 CO2 Red by 2040 Nuclear (Palo Verde)
Nuclear (SMR)Gas - Steam TurbineGas - Combined CycleGas - Combustion TurbineBiomassGeothermalWindSolarBattery StorageImportsDemand ResponseHydrogenBTM SolarLoadExcess Generation
60 CO2 Red by 2040 Nuclear (Palo Verde)Nuclear (SMR)Gas - Steam TurbineGas - Combined CycleGas - Combustion TurbineBiomassGeothermalWindSolarBattery StorageImportsDemand ResponseHydrogenBTM SolarLoadExcess Generation
80 CO2 Red by 2040 Nuclear (Palo Verde)Nuclear (SMR)Gas - Steam TurbineGas - Combined CycleGas - Combustion TurbineBiomassGeothermalWindSolarBattery StorageImportsDemand ResponseHydrogenBTM SolarLoadExcess Generation
2021 2024 2025 2027 2031 2035 2040 2045Installed Capacity (MW)
622 622 622 622 622 622 622 622 - - - - - - - - 426 307 307 307 234 - - - 493 493 493 493 493 266 266 266 503 731 731 731 668 909 973 1022 - - - - - - - - - - - - - - - - - - 109 109 109 109 239 300 115 385 615 615 821 1234 1563 2248 - 50 177 177 486 969 1184 1746 - - - - - - - - 46 53 56 61 71 81 93 93
- - - - - - - - 18 65 80 108 166 221 289 368
- - - - - - - - - - - - - - - - 622 622 622 622 622 622 622 622 - - - - - - - - 426 307 307 307 234 - - - 493 493 493 493 493 266 266 266 503 731 731 731 668 849 892 897 - - - - - - - - - - - - - - - - - - 128 128 128 128 301 302 115 385 599 599 816 1309 1965 2744 - 50 177 177 481 1044 1347 2145 - - - - - - - - 46 53 56 61 71 81 93 93
- - - - - - - - 18 65 80 108 166 221 289 368
- - - - - - - - - - - - - - - - 622 622 622 622 622 622 622 622 - - - - - - - - 426 307 307 307 234 - - - 493 493 493 493 493 266 266 266 503 731 731 731 668 778 778 778 - - - - - - - - - - - - - - - - - - 217 217 217 217 552 585 115 385 538 538 793 1555 2257 3007 - 50 176 177 458 1097 1645 2461 - - - - - - - - 46 53 56 61 71 81 93 93
- - - - - - - - 18 65 80 108 166 221 289 368
- - - - - - - - - - - - - - - -
Attachment D-3 E3 EPE Report Model Results AugustPage 12 of 34
Scenario Resource Type90 CO2 Red by 2040 Nuclear (Palo Verde)
Nuclear (SMR)Gas - Steam TurbineGas - Combined CycleGas - Combustion TurbineBiomassGeothermalWindSolarBattery StorageImportsDemand ResponseHydrogenBTM SolarLoadExcess Generation
100 CO2 Red by 2040 (w H2) Nuclear (Palo Verde)Nuclear (SMR)Gas - Steam TurbineGas - Combined CycleGas - Combustion TurbineBiomassGeothermalWindSolarBattery StorageImportsDemand ResponseHydrogenBTM SolarLoadExcess Generation
100 CO2 Red by 2040 Nuclear (Palo Verde)Nuclear (SMR)Gas - Steam TurbineGas - Combined CycleGas - Combustion TurbineBiomassGeothermalWindSolarBattery StorageImportsDemand ResponseHydrogenBTM SolarLoadExcess Generation
2021 2024 2025 2027 2031 2035 2040 2045Installed Capacity (MW)
622 622 622 622 622 622 622 622 - - - - - - - - 426 307 307 307 234 - - - 493 493 493 493 493 266 266 266 503 731 731 731 668 726 726 726 - - - - - - - - - - - - - - - - - - 224 224 224 224 801 828 115 385 535 535 901 1679 2300 3049 - 50 176 177 452 1284 1777 2595 - - - - - - - - 46 53 56 61 71 81 93 93
- - - - - - - - 18 65 80 108 166 221 289 368
- - - - - - - - - - - - - - - - 622 622 622 622 622 622 622 622 - - - - - - - - 426 307 307 307 234 - - - 493 493 493 493 493 266 - - 503 731 731 731 668 688 - - - - - - - - - - - - - - - - - - - - 282 282 282 282 682 696 115 385 512 512 925 1801 2403 3178 - 50 176 177 445 1385 1955 2797 - - - - - - - - 46 53 56 61 71 81 93 93
- - - - - - 954 954 18 65 80 108 166 221 289 368
- - - - - - - - - - - - - - - - 622 622 622 622 622 622 622 622 - - - - - - - - 426 307 307 307 234 - - - 493 493 493 493 493 266 266 266 503 731 731 731 668 688 668 668 - - - - - - - - - - - - - - - - - - 120 120 282 282 1216 1605 115 385 606 606 925 1801 4851 5217 - 50 177 177 445 1385 6191 7470 - - - - - - - - 46 53 56 61 71 81 93 93
- - - - - - - - 18 65 80 108 166 221 289 701
- - - - - - - - - - - - - - - -
Attachment D-3 E3 EPE Report Model Results AugustPage 13 of 34
Scenario Resource TypeHigh DG Nuclear (Palo Verde)
Nuclear (SMR)Gas - Steam TurbineGas - Combined CycleGas - Combustion TurbineBiomassGeothermalWindSolarBattery StorageImportsDemand ResponseHydrogenBTM SolarLoadExcess Generation
High DSM Nuclear (Palo Verde)Nuclear (SMR)Gas - Steam TurbineGas - Combined CycleGas - Combustion TurbineBiomassGeothermalWindSolarBattery StorageImportsDemand ResponseHydrogenBTM SolarLoadExcess Generation
Low Load Nuclear (Palo Verde)Nuclear (SMR)Gas - Steam TurbineGas - Combined CycleGas - Combustion TurbineBiomassGeothermalWindSolarBattery StorageImportsDemand ResponseHydrogenBTM SolarLoadExcess Generation
2021 2024 2025 2027 2031 2035 2040 2045Installed Capacity (MW)
622 622 622 622 622 622 622 622 - - - - - - - - 426 307 307 307 234 - - - 493 493 493 493 493 266 266 266 503 731 731 731 668 860 1026 1228 - - - - - - - - - - - - - - - - - - 96 96 96 96 96 203 115 385 511 511 684 1010 1107 1018 - 50 176 176 479 1041 1166 1263 - - - - - - - - 46 53 56 61 71 81 93 93
- - - - - - - - 42 169 210 293 455 614 809 1032
- - - - - - - - - - - - - - - - 622 622 622 622 622 622 622 622 - - - - - - - - 426 307 307 307 234 - - - 493 493 493 493 493 266 266 266 503 731 731 731 668 778 942 1058 - - - - - - - - - - - - - - - - - - - - - - - 128 115 385 519 519 638 1149 1212 1386 - 50 184 184 406 1001 1091 1213 - - - - - - - - 49 66 71 82 100 101 103 103
- - - - - - - - 18 65 80 108 166 221 289 368
- - - - - - - - - - - - - - - - 622 622 622 622 622 622 622 622 - - - - - - - - 426 307 307 307 234 - - - 493 493 493 493 493 266 266 266 503 731 731 731 668 724 896 1019 - - - - - - - - - - - - - - - - - - - - - - - 141 115 385 521 521 628 1185 1261 1477 - 50 186 186 355 1019 1121 1262 - - - - - - - - 46 53 56 61 71 81 93 93
- - - - - - - - 18 65 80 108 166 221 289 368
- - - - - - - - - - - - - - - -
Attachment D-3 E3 EPE Report Model Results AugustPage 14 of 34
Scenario Resource TypeHigh Load Nuclear (Palo Verde)
Nuclear (SMR)Gas - Steam TurbineGas - Combined CycleGas - Combustion TurbineBiomassGeothermalWindSolarBattery StorageImportsDemand ResponseHydrogenBTM SolarLoadExcess Generation
No Lifetime Extensions Nuclear (Palo Verde)Nuclear (SMR)Gas - Steam TurbineGas - Combined CycleGas - Combustion TurbineBiomassGeothermalWindSolarBattery StorageImportsDemand ResponseHydrogenBTM SolarLoadExcess Generation
No New Gas Nuclear (Palo Verde)Nuclear (SMR)Gas - Steam TurbineGas - Combined CycleGas - Combustion TurbineBiomassGeothermalWindSolarBattery StorageImportsDemand ResponseHydrogenBTM SolarLoadExcess Generation
2021 2024 2025 2027 2031 2035 2040 2045Installed Capacity (MW)
622 622 622 622 622 622 622 622 - - - - - - - - 426 307 307 307 234 - - - 493 493 493 493 493 266 266 266 503 731 731 731 668 1043 1247 1411 - - - - - - - - - - - - - - - - - - 119 119 119 119 119 260 115 385 662 662 1040 1304 1377 1643 - 50 235 327 708 1042 1142 1292 - - - - - - - - 46 53 56 61 71 81 93 93
- - - - - - - - 18 65 80 108 166 221 289 368
- - - - - - - - - - - - - - - - 622 622 622 622 622 622 622 622 - - - - - - - - 426 234 234 144 144 - - - 493 493 493 266 266 266 266 266 503 731 731 829 766 869 1058 1216 - - - - - - - - - - - - - - - - - - 109 109 109 109 109 197 115 385 767 767 1027 1229 1302 1561 - 50 183 432 756 1027 1128 1277 - - - - - - - - 46 53 56 61 71 81 93 93
- - - - - - - - 18 65 80 108 166 221 289 368
- - - - - - - - - - - - - - - - 622 622 622 622 622 622 622 622 - - - - - - - - 426 307 307 307 234 - - - 493 493 493 493 493 266 266 266 503 731 731 731 668 668 668 668 - - - - - - - - - - - - - - - - - - 120 120 120 120 120 132 115 385 606 606 818 1876 2580 3422 - 50 177 177 483 1585 2342 3200 - - - - - - - - 46 53 56 61 71 81 93 93
- - - - - - - - 18 65 80 108 166 221 289 368
- - - - - - - - - - - - - - - -
Attachment D-3 E3 EPE Report Model Results AugustPage 15 of 34
Scenario Resource TypeLow Carbon Price Nuclear (Palo Verde)
Nuclear (SMR)Gas - Steam TurbineGas - Combined CycleGas - Combustion TurbineBiomassGeothermalWindSolarBattery StorageImportsDemand ResponseHydrogenBTM SolarLoadExcess Generation
Mid Carbon Price Nuclear (Palo Verde)Nuclear (SMR)Gas - Steam TurbineGas - Combined CycleGas - Combustion TurbineBiomassGeothermalWindSolarBattery StorageImportsDemand ResponseHydrogenBTM SolarLoadExcess Generation
High Carbon Price Nuclear (Palo Verde)Nuclear (SMR)Gas - Steam TurbineGas - Combined CycleGas - Combustion TurbineBiomassGeothermalWindSolarBattery StorageImportsDemand ResponseHydrogenBTM SolarLoadExcess Generation
2021 2024 2025 2027 2031 2035 2040 2045Installed Capacity (MW)
622 622 622 622 622 622 622 622 - - - - - - - - 426 307 307 307 234 - - - 493 493 493 493 493 266 266 266 503 731 731 731 668 840 1027 1164 - - - - - - - - - - - - - - - - - - 163 163 163 163 163 269 115 385 573 573 805 1309 1383 1738 - 50 176 176 470 1044 1145 1314 - - - - - - - - 46 53 56 61 71 81 93 93
- - - - - - - - 18 65 80 108 166 221 289 368
- - - - - - - - - - - - - - - - 622 622 622 622 622 622 622 622 - - - - - - - - 426 307 307 307 234 - - - 493 493 493 493 493 266 266 266 503 731 731 731 668 824 1006 1145 - - - - - - - - - - - - - - - - - - 238 238 238 238 238 300 115 385 633 633 791 1310 1400 1808 - 50 176 176 456 1045 1149 1334 - - - - - - - - 46 53 56 61 71 81 93 93
- - - - - - - - 18 65 80 108 166 221 289 368
- - - - - - - - - - - - - - - - 622 622 622 622 622 622 622 622 - - - - - - - - 426 307 307 307 234 - - - 493 493 493 493 493 266 266 266 503 731 731 731 668 817 944 944 - - - - - - - - - - - - - - - - - - 300 300 300 300 300 301 115 385 857 857 886 1310 1666 2536 - 50 176 176 445 1045 1206 2000 - - - - - - - - 46 53 56 61 71 81 93 93
- - - - - - - - 18 65 80 108 166 221 289 368
- - - - - - - - - - - - - - - -
Attachment D-3 E3 EPE Report Model Results AugustPage 16 of 34
Scenario Resource TypeHigh Gas Price Nuclear (Palo Verde)
Nuclear (SMR)Gas - Steam TurbineGas - Combined CycleGas - Combustion TurbineBiomassGeothermalWindSolarBattery StorageImportsDemand ResponseHydrogenBTM SolarLoadExcess Generation
Low Renewable and Storage Costs Nuclear (Palo Verde)Nuclear (SMR)Gas - Steam TurbineGas - Combined CycleGas - Combustion TurbineBiomassGeothermalWindSolarBattery StorageImportsDemand ResponseHydrogenBTM SolarLoadExcess Generation
2021 2024 2025 2027 2031 2035 2040 2045Installed Capacity (MW)
622 622 622 622 622 622 622 622 - - - - - - - - 426 307 307 307 234 - - - 493 493 493 493 493 266 266 266 503 731 731 731 668 848 1036 1170 - - - - - - - - - - - - - - - - - - 128 128 128 128 128 264 115 385 599 599 816 1309 1383 1710 - 50 177 177 481 1044 1145 1309 - - - - - - - - 46 53 56 61 71 81 93 93
- - - - - - - - 18 65 80 108 166 221 289 368
- - - - - - - - - - - - - - - - 622 622 622 622 622 622 622 622 - - - - - - - - 426 307 307 307 234 - - - 493 493 493 493 493 266 266 266 503 731 731 731 668 847 1034 1146 - - - - - - - - - - - - - - - - - - 160 160 160 160 160 300 115 385 525 525 806 1277 1351 1805 - 50 190 190 471 1037 1138 1335 - - - - - - - - 46 53 56 61 71 81 93 93
- - - - - - - - 18 65 80 108 166 221 289 368
- - - - - - - - - - - - - - - -
Attachment D-3 E3 EPE Report Model Results AugustPage 17 of 34
Scenario Resource TypeLeast-Cost (Reference Case) Nuclear (Palo Verde)
Nuclear (SMR)Gas - Steam TurbineGas - Combined CycleGas - Combustion TurbineBiomassGeothermalWindSolarBattery StorageImportsDemand ResponseHydrogenBTM SolarLoadExcess Generation
Least-Cost Case + REA Resources Nuclear (Palo Verde)Nuclear (SMR)Gas - Steam TurbineGas - Combined CycleGas - Combustion TurbineBiomassGeothermalWindSolarBattery StorageImportsDemand ResponseHydrogenBTM SolarLoadExcess Generation
Separate System Planning Nuclear (Palo Verde)Nuclear (SMR)Gas - Steam TurbineGas - Combined CycleGas - Combustion TurbineBiomassGeothermalWindSolarBattery StorageImportsDemand ResponseHydrogenBTM SolarLoadExcess Generation
2021 2024 2025 2027 2031 2035 2040 2045- - - - - - - - - - - - - - - - - - - - - - - - - - - - - - - - - 228 228 228 228 430 619 776 - - - - - - - - - - - - - - - - - - 102 102 102 102 102 197 - 270 506 506 708 1190 1291 1823 - 50 177 177 488 1029 1129 1327 - - - - - - - - 46 53 56 61 71 81 93 93
- - - - - - - - 18 65 80 108 166 221 289 368
- - - - - - - - - - - - - - - - - - - - - - - - - - - - - - - - - - - - - - - - - - - - - - - - - 228 228 228 228 369 502 611 - - - - - - - - - - - - - - - - - - 203 203 203 203 232 300 - 270 429 429 680 1369 1675 2299 - 50 176 177 460 1067 1246 1732 - - - - - - - - 46 53 56 61 71 81 93 93
- - - - - - - - 18 65 80 108 166 221 289 368
- - - - - - - - - - - - - - - - - - - - - - - - - - - - - - - - - - - - - - - - - - - - - - - - - 228 228 228 228 315 315 424 - - - - - - - - - - - - - - - - - - 49 49 49 49 49 161 - 270 524 524 744 1656 2432 2974 - 50 280 304 591 1514 2344 2724 - - - - - - - - 46 53 56 61 71 81 93 93
- - - - - - - - 18 65 80 108 166 221 289 368
- - - - - - - - - - - - - - - -
Cumulative Capacity Additions (MW)
Attachment D-3 E3 EPE Report Model Results AugustPage 18 of 34
Scenario Resource TypeSeparate System Planning (w H2) Nuclear (Palo Verde)
Nuclear (SMR)Gas - Steam TurbineGas - Combined CycleGas - Combustion TurbineBiomassGeothermalWindSolarBattery StorageImportsDemand ResponseHydrogenBTM SolarLoadExcess Generation
80 Clean by 2035 Nuclear (Palo Verde)Nuclear (SMR)Gas - Steam TurbineGas - Combined CycleGas - Combustion TurbineBiomassGeothermalWindSolarBattery StorageImportsDemand ResponseHydrogenBTM SolarLoadExcess Generation
20 CO2 Red by 2040 Nuclear (Palo Verde)Nuclear (SMR)Gas - Steam TurbineGas - Combined CycleGas - Combustion TurbineBiomassGeothermalWindSolarBattery StorageImportsDemand ResponseHydrogenBTM SolarLoadExcess Generation
2021 2024 2025 2027 2031 2035 2040 2045Cumulative Capacity Additions (MW)
- - - - - - - - - - - - - - - - - - - - - - - - - - - - - - - - - 228 228 228 228 315 315 424 - - - - - - - - - - - - - - - - - - 60 60 60 60 107 218 - 270 523 523 790 1267 1706 2293 - 50 278 303 570 1057 1496 1847 - - - - - - - - 46 53 56 61 71 81 93 93
- - - - - 123 206 212 18 65 80 108 166 221 289 368
- - - - - - - - - - - - - - - - - - - - - - - - - - - - - - - - - - - - - - - - - - - - - - - - - 228 228 228 228 470 582 709 - - - - - - - - - - - - - - - - - - 109 109 109 109 185 289 - 270 500 500 706 1188 1365 2061 - 50 177 177 486 968 1145 1377 - - - - - - - - 46 53 56 61 71 81 93 93
- - - - - - - - 18 65 80 108 166 221 289 368
- - - - - - - - - - - - - - - - - - - - - - - - - - - - - - - - - - - - - - - - - - - - - - - - - 228 228 228 228 470 596 698 - - - - - - - - - - - - - - - - - - 109 109 109 109 125 300 - 270 500 500 706 1188 1365 2099 - 50 177 177 486 968 1145 1409 - - - - - - - - 46 53 56 61 71 81 93 93
- - - - - - - - 18 65 80 108 166 221 289 368
- - - - - - - - - - - - - - - -
Attachment D-3 E3 EPE Report Model Results AugustPage 19 of 34
Scenario Resource Type40 CO2 Red by 2040 Nuclear (Palo Verde)
Nuclear (SMR)Gas - Steam TurbineGas - Combined CycleGas - Combustion TurbineBiomassGeothermalWindSolarBattery StorageImportsDemand ResponseHydrogenBTM SolarLoadExcess Generation
60 CO2 Red by 2040 Nuclear (Palo Verde)Nuclear (SMR)Gas - Steam TurbineGas - Combined CycleGas - Combustion TurbineBiomassGeothermalWindSolarBattery StorageImportsDemand ResponseHydrogenBTM SolarLoadExcess Generation
80 CO2 Red by 2040 Nuclear (Palo Verde)Nuclear (SMR)Gas - Steam TurbineGas - Combined CycleGas - Combustion TurbineBiomassGeothermalWindSolarBattery StorageImportsDemand ResponseHydrogenBTM SolarLoadExcess Generation
2021 2024 2025 2027 2031 2035 2040 2045Cumulative Capacity Additions (MW)
- - - - - - - - - - - - - - - - - - - - - - - - - - - - - - - - - 228 228 228 228 469 533 582 - - - - - - - - - - - - - - - - - - 109 109 109 109 239 300 - 270 500 500 706 1189 1545 2510 - 50 177 177 486 969 1184 1796 - - - - - - - - 46 53 56 61 71 81 93 93
- - - - - - - - 18 65 80 108 166 221 289 368
- - - - - - - - - - - - - - - - - - - - - - - - - - - - - - - - - - - - - - - - - - - - - - - - - 228 228 228 228 409 452 457 - - - - - - - - - - - - - - - - - - 128 128 128 128 301 302 - 270 484 484 701 1264 1947 3006 - 50 177 177 481 1044 1347 2195 - - - - - - - - 46 53 56 61 71 81 93 93
- - - - - - - - 18 65 80 108 166 221 289 368
- - - - - - - - - - - - - - - - - - - - - - - - - - - - - - - - - - - - - - - - - - - - - - - - - 228 228 228 228 338 338 338 - - - - - - - - - - - - - - - - - - 217 217 217 217 552 585 - 270 423 423 678 1510 2239 3269 - 50 176 177 458 1097 1645 2511 - - - - - - - - 46 53 56 61 71 81 93 93
- - - - - - - - 18 65 80 108 166 221 289 368
- - - - - - - - - - - - - - - -
Attachment D-3 E3 EPE Report Model Results AugustPage 20 of 34
Scenario Resource Type90 CO2 Red by 2040 Nuclear (Palo Verde)
Nuclear (SMR)Gas - Steam TurbineGas - Combined CycleGas - Combustion TurbineBiomassGeothermalWindSolarBattery StorageImportsDemand ResponseHydrogenBTM SolarLoadExcess Generation
100 CO2 Red by 2040 (w H2) Nuclear (Palo Verde)Nuclear (SMR)Gas - Steam TurbineGas - Combined CycleGas - Combustion TurbineBiomassGeothermalWindSolarBattery StorageImportsDemand ResponseHydrogenBTM SolarLoadExcess Generation
100 CO2 Red by 2040 Nuclear (Palo Verde)Nuclear (SMR)Gas - Steam TurbineGas - Combined CycleGas - Combustion TurbineBiomassGeothermalWindSolarBattery StorageImportsDemand ResponseHydrogenBTM SolarLoadExcess Generation
2021 2024 2025 2027 2031 2035 2040 2045Cumulative Capacity Additions (MW)
- - - - - - - - - - - - - - - - - - - - - - - - - - - - - - - - - 228 228 228 228 286 286 286 - - - - - - - - - - - - - - - - - - 224 224 224 224 801 828 - 270 420 420 786 1634 2282 3311 - 50 176 177 452 1284 1777 2645 - - - - - - - - 46 53 56 61 71 81 93 93
- - - - - - - - 18 65 80 108 166 221 289 368
- - - - - - - - - - - - - - - - - - - - - - - - - - - - - - - - - - - - - - - - - - - - - - - - - 228 228 228 228 248 - - - - - - - - - - - - - - - - - - - - 282 282 282 282 682 696 - 270 397 397 810 1756 2385 3440 - 50 176 177 445 1385 1955 2847 - - - - - - - - 46 53 56 61 71 81 93 93
- - - - - - 248 248 18 65 80 108 166 221 289 368
- - - - - - - - - - - - - - - - - - - - - - - - - - - - - - - - - - - - - - - - - - - - - - - - - 228 228 228 228 248 228 228 - - - - - - - - - - - - - - - - - - 120 120 282 282 1216 1605 - 270 491 491 810 1756 4833 5479 - 50 177 177 445 1385 6191 7520 - - - - - - - - 46 53 56 61 71 81 93 93
- - - - - - - - 18 65 80 108 166 221 289 701
- - - - - - - - - - - - - - - -
Attachment D-3 E3 EPE Report Model Results AugustPage 21 of 34
Scenario Resource TypeHigh DG Nuclear (Palo Verde)
Nuclear (SMR)Gas - Steam TurbineGas - Combined CycleGas - Combustion TurbineBiomassGeothermalWindSolarBattery StorageImportsDemand ResponseHydrogenBTM SolarLoadExcess Generation
High DSM Nuclear (Palo Verde)Nuclear (SMR)Gas - Steam TurbineGas - Combined CycleGas - Combustion TurbineBiomassGeothermalWindSolarBattery StorageImportsDemand ResponseHydrogenBTM SolarLoadExcess Generation
Low Load Nuclear (Palo Verde)Nuclear (SMR)Gas - Steam TurbineGas - Combined CycleGas - Combustion TurbineBiomassGeothermalWindSolarBattery StorageImportsDemand ResponseHydrogenBTM SolarLoadExcess Generation
2021 2024 2025 2027 2031 2035 2040 2045Cumulative Capacity Additions (MW)
- - - - - - - - - - - - - - - - - - - - - - - - - - - - - - - - - 228 228 228 228 420 586 788 - - - - - - - - - - - - - - - - - - 96 96 96 96 96 203 - 270 396 396 569 965 1089 1280 - 50 176 176 479 1041 1166 1313 - - - - - - - - 46 53 56 61 71 81 93 93
- - - - - - - - 42 169 210 293 455 614 809 1032
- - - - - - - - - - - - - - - - - - - - - - - - - - - - - - - - - - - - - - - - - - - - - - - - - 228 228 228 228 338 502 618 - - - - - - - - - - - - - - - - - - - - - - - 128 - 270 404 404 523 1104 1194 1648 - 50 184 184 406 1001 1091 1263 - - - - - - - - 49 66 71 82 100 101 103 103
- - - - - - - - 18 65 80 108 166 221 289 368
- - - - - - - - - - - - - - - - - - - - - - - - - - - - - - - - - - - - - - - - - - - - - - - - - 228 228 228 228 284 456 579 - - - - - - - - - - - - - - - - - - - - - - - 141 - 270 406 406 513 1140 1243 1739 - 50 186 186 355 1019 1121 1312 - - - - - - - - 46 53 56 61 71 81 93 93
- - - - - - - - 18 65 80 108 166 221 289 368
- - - - - - - - - - - - - - - -
Attachment D-3 E3 EPE Report Model Results AugustPage 22 of 34
Scenario Resource TypeHigh Load Nuclear (Palo Verde)
Nuclear (SMR)Gas - Steam TurbineGas - Combined CycleGas - Combustion TurbineBiomassGeothermalWindSolarBattery StorageImportsDemand ResponseHydrogenBTM SolarLoadExcess Generation
No Lifetime Extensions Nuclear (Palo Verde)Nuclear (SMR)Gas - Steam TurbineGas - Combined CycleGas - Combustion TurbineBiomassGeothermalWindSolarBattery StorageImportsDemand ResponseHydrogenBTM SolarLoadExcess Generation
No New Gas Nuclear (Palo Verde)Nuclear (SMR)Gas - Steam TurbineGas - Combined CycleGas - Combustion TurbineBiomassGeothermalWindSolarBattery StorageImportsDemand ResponseHydrogenBTM SolarLoadExcess Generation
2021 2024 2025 2027 2031 2035 2040 2045Cumulative Capacity Additions (MW)
- - - - - - - - - - - - - - - - - - - - - - - - - - - - - - - - - 228 228 228 228 603 807 971 - - - - - - - - - - - - - - - - - - 119 119 119 119 119 260 - 270 547 547 925 1259 1359 1905 - 50 235 327 708 1042 1142 1342 - - - - - - - - 46 53 56 61 71 81 93 93
- - - - - - - - 18 65 80 108 166 221 289 368
- - - - - - - - - - - - - - - - - - - - - - - - - - - - - - - - - - - - - - - - - - - - - - - - - 228 228 326 326 429 618 776 - - - - - - - - - - - - - - - - - - 109 109 109 109 109 197 - 270 652 652 912 1184 1284 1823 - 50 183 432 756 1027 1128 1327 - - - - - - - - 46 53 56 61 71 81 93 93
- - - - - - - - 18 65 80 108 166 221 289 368
- - - - - - - - - - - - - - - - - - - - - - - - - - - - - - - - - - - - - - - - - - - - - - - - - 228 228 228 228 228 228 228 - - - - - - - - - - - - - - - - - - 120 120 120 120 120 132 - 270 491 491 703 1831 2562 3684 - 50 177 177 483 1585 2342 3250 - - - - - - - - 46 53 56 61 71 81 93 93
- - - - - - - - 18 65 80 108 166 221 289 368
- - - - - - - - - - - - - - - -
Attachment D-3 E3 EPE Report Model Results AugustPage 23 of 34
Scenario Resource TypeLow Carbon Price Nuclear (Palo Verde)
Nuclear (SMR)Gas - Steam TurbineGas - Combined CycleGas - Combustion TurbineBiomassGeothermalWindSolarBattery StorageImportsDemand ResponseHydrogenBTM SolarLoadExcess Generation
Mid Carbon Price Nuclear (Palo Verde)Nuclear (SMR)Gas - Steam TurbineGas - Combined CycleGas - Combustion TurbineBiomassGeothermalWindSolarBattery StorageImportsDemand ResponseHydrogenBTM SolarLoadExcess Generation
High Carbon Price Nuclear (Palo Verde)Nuclear (SMR)Gas - Steam TurbineGas - Combined CycleGas - Combustion TurbineBiomassGeothermalWindSolarBattery StorageImportsDemand ResponseHydrogenBTM SolarLoadExcess Generation
2021 2024 2025 2027 2031 2035 2040 2045Cumulative Capacity Additions (MW)
- - - - - - - - - - - - - - - - - - - - - - - - - - - - - - - - - 228 228 228 228 400 587 724 - - - - - - - - - - - - - - - - - - 163 163 163 163 163 269 - 270 458 458 690 1264 1365 2000 - 50 176 176 470 1044 1145 1364 - - - - - - - - 46 53 56 61 71 81 93 93
- - - - - - - - 18 65 80 108 166 221 289 368
- - - - - - - - - - - - - - - - - - - - - - - - - - - - - - - - - - - - - - - - - - - - - - - - - 228 228 228 228 384 566 705 - - - - - - - - - - - - - - - - - - 238 238 238 238 238 300 - 270 518 518 676 1265 1382 2070 - 50 176 176 456 1045 1149 1384 - - - - - - - - 46 53 56 61 71 81 93 93
- - - - - - - - 18 65 80 108 166 221 289 368
- - - - - - - - - - - - - - - - - - - - - - - - - - - - - - - - - - - - - - - - - - - - - - - - - 228 228 228 228 377 504 504 - - - - - - - - - - - - - - - - - - 300 300 300 300 300 301 - 270 742 742 771 1265 1648 2798 - 50 176 176 445 1045 1206 2050 - - - - - - - - 46 53 56 61 71 81 93 93
- - - - - - - - 18 65 80 108 166 221 289 368
- - - - - - - - - - - - - - - -
Attachment D-3 E3 EPE Report Model Results AugustPage 24 of 34
Scenario Resource TypeHigh Gas Price Nuclear (Palo Verde)
Nuclear (SMR)Gas - Steam TurbineGas - Combined CycleGas - Combustion TurbineBiomassGeothermalWindSolarBattery StorageImportsDemand ResponseHydrogenBTM SolarLoadExcess Generation
Low Renewable and Storage Costs Nuclear (Palo Verde)Nuclear (SMR)Gas - Steam TurbineGas - Combined CycleGas - Combustion TurbineBiomassGeothermalWindSolarBattery StorageImportsDemand ResponseHydrogenBTM SolarLoadExcess Generation
2021 2024 2025 2027 2031 2035 2040 2045Cumulative Capacity Additions (MW)
- - - - - - - - - - - - - - - - - - - - - - - - - - - - - - - - - 228 228 228 228 408 596 730 - - - - - - - - - - - - - - - - - - 128 128 128 128 128 264 - 270 484 484 701 1264 1365 1972 - 50 177 177 481 1044 1145 1359 - - - - - - - - 46 53 56 61 71 81 93 93
- - - - - - - - 18 65 80 108 166 221 289 368
- - - - - - - - - - - - - - - - - - - - - - - - - - - - - - - - - - - - - - - - - - - - - - - - - 228 228 228 228 407 594 706 - - - - - - - - - - - - - - - - - - 160 160 160 160 160 300 - 270 410 410 691 1232 1333 2067 - 50 190 190 471 1037 1138 1385 - - - - - - - - 46 53 56 61 71 81 93 93
- - - - - - - - 18 65 80 108 166 221 289 368
- - - - - - - - - - - - - - - -
Attachment D-3 E3 EPE Report Model Results AugustPage 25 of 34
Scenario Resource TypeLeast-Cost (Reference Case) Nuclear (Palo Verde)
Nuclear (SMR)Gas - Steam TurbineGas - Combined CycleGas - Combustion TurbineBiomassGeothermalWindSolarBattery StorageImportsDemand ResponseHydrogenBTM SolarLoadExcess Generation
Least-Cost Case + REA Resources Nuclear (Palo Verde)Nuclear (SMR)Gas - Steam TurbineGas - Combined CycleGas - Combustion TurbineBiomassGeothermalWindSolarBattery StorageImportsDemand ResponseHydrogenBTM SolarLoadExcess Generation
Separate System Planning Nuclear (Palo Verde)Nuclear (SMR)Gas - Steam TurbineGas - Combined CycleGas - Combustion TurbineBiomassGeothermalWindSolarBattery StorageImportsDemand ResponseHydrogenBTM SolarLoadExcess Generation
2021 2024 2025 2027 2031 2035 2040 2045- - - - - - - - - - - - - - - - - (119) (119) (119) (192) (426) (426) (426) - - - - - (227) (227) (227) - - - - (63) (63) (63) (63) - - - - - - - - - - - - - - - - - - - - - - - - - - - - - (70) (97) (377) - - - - - - - (50) - - - - - - - - - - - - - - - - - - - - - - - - - - - - - - - - - - - - - - - - - - - - - - - - - - - - - - - - - - - - - - - - - (119) (119) (119) (192) (426) (426) (426) - - - - - (227) (227) (227) - - - - (63) (63) (63) (63) - - - - - - - - - - - - - - - - - - - - - - - - - - - - - (70) (97) (377) - - - - - - - (50) - - - - - - - - - - - - - - - - - - - - - - - - - - - - - - - - - - - - - - - - - - - - - - - - - - - - - - - - - - - - - - - - - (119) (119) (119) (192) (426) (426) (426) - - - - - (227) (227) (227) - - - - (63) (63) (63) (63) - - - - - - - - - - - - - - - - - - - - - - - - - - - - - (70) (97) (377) - - - - - - - (50) - - - - - - - - - - - - - - - - - - - - - - - - - - - - - - - - - - - - - - - - - - - - - - - -
Cumulative Capacity Retirements (MW)
Attachment D-3 E3 EPE Report Model Results AugustPage 26 of 34
Scenario Resource TypeSeparate System Planning (w H2) Nuclear (Palo Verde)
Nuclear (SMR)Gas - Steam TurbineGas - Combined CycleGas - Combustion TurbineBiomassGeothermalWindSolarBattery StorageImportsDemand ResponseHydrogenBTM SolarLoadExcess Generation
80 Clean by 2035 Nuclear (Palo Verde)Nuclear (SMR)Gas - Steam TurbineGas - Combined CycleGas - Combustion TurbineBiomassGeothermalWindSolarBattery StorageImportsDemand ResponseHydrogenBTM SolarLoadExcess Generation
20 CO2 Red by 2040 Nuclear (Palo Verde)Nuclear (SMR)Gas - Steam TurbineGas - Combined CycleGas - Combustion TurbineBiomassGeothermalWindSolarBattery StorageImportsDemand ResponseHydrogenBTM SolarLoadExcess Generation
2021 2024 2025 2027 2031 2035 2040 2045Cumulative Capacity Retirements (MW)
- - - - - - - - - - - - - - - - - (119) (119) (119) (192) (426) (426) (426) - - - - - (227) (227) (227) - - - - (63) (63) (63) (63) - - - - - - - - - - - - - - - - - - - - - - - - - - - - - (70) (97) (377) - - - - - - - (50) - - - - - - - - - - - - - - - - - - - - - - - - - - - - - - - - - - - - - - - - - - - - - - - - - - - - - - - - - - - - - - - - - (119) (119) (119) (192) (426) (426) (426) - - - - - (227) (227) (227) - - - - (63) (63) (63) (63) - - - - - - - - - - - - - - - - - - - - - - - - - - - - - (70) (97) (377) - - - - - - - (50) - - - - - - - - - - - - - - - - - - - - - - - - - - - - - - - - - - - - - - - - - - - - - - - - - - - - - - - - - - - - - - - - - (119) (119) (119) (192) (426) (426) (426) - - - - - (227) (227) (227) - - - - (63) (63) (63) (63) - - - - - - - - - - - - - - - - - - - - - - - - - - - - - (70) (97) (377) - - - - - - - (50) - - - - - - - - - - - - - - - - - - - - - - - - - - - - - - - - - - - - - - - - - - - - - - - -
Attachment D-3 E3 EPE Report Model Results AugustPage 27 of 34
Scenario Resource Type40 CO2 Red by 2040 Nuclear (Palo Verde)
Nuclear (SMR)Gas - Steam TurbineGas - Combined CycleGas - Combustion TurbineBiomassGeothermalWindSolarBattery StorageImportsDemand ResponseHydrogenBTM SolarLoadExcess Generation
60 CO2 Red by 2040 Nuclear (Palo Verde)Nuclear (SMR)Gas - Steam TurbineGas - Combined CycleGas - Combustion TurbineBiomassGeothermalWindSolarBattery StorageImportsDemand ResponseHydrogenBTM SolarLoadExcess Generation
80 CO2 Red by 2040 Nuclear (Palo Verde)Nuclear (SMR)Gas - Steam TurbineGas - Combined CycleGas - Combustion TurbineBiomassGeothermalWindSolarBattery StorageImportsDemand ResponseHydrogenBTM SolarLoadExcess Generation
2021 2024 2025 2027 2031 2035 2040 2045Cumulative Capacity Retirements (MW)
- - - - - - - - - - - - - - - - - (119) (119) (119) (192) (426) (426) (426) - - - - - (227) (227) (227) - - - - (63) (63) (63) (63) - - - - - - - -- - - - - - - -- - - - - - - -- - - - - (70) (97) (377) - - - - - - - (50) - - - - - - - -- - - - - - - -- - - - - - - -- - - - - - - -- - - - - - - -- - - - - - - -- - - - - - - -- - - - - - - -- (119) (119) (119) (192) (426) (426) (426) - - - - - (227) (227) (227) - - - - (63) (63) (63) (63) - - - - - - - -- - - - - - - -- - - - - - - -- - - - - (70) (97) (377) - - - - - - - (50) - - - - - - - -- - - - - - - -- - - - - - - -- - - - - - - -- - - - - - - -- - - - - - - -- - - - - - - -- - - - - - - -- (119) (119) (119) (192) (426) (426) (426) - - - - - (227) (227) (227) - - - - (63) (63) (63) (63) - - - - - - - -- - - - - - - -- - - - - - - -- - - - - (70) (97) (377) - - - - - - - (50) - - - - - - - -- - - - - - - -- - - - - - - -- - - - - - - -- - - - - - - -- - - - - - - -
Attachment D-3 E3 EPE Report Model Results AugustPage 28 of 34
Scenario Resource Type90 CO2 Red by 2040 Nuclear (Palo Verde)
Nuclear (SMR)Gas - Steam TurbineGas - Combined CycleGas - Combustion TurbineBiomassGeothermalWindSolarBattery StorageImportsDemand ResponseHydrogenBTM SolarLoadExcess Generation
100 CO2 Red by 2040 (w H2) Nuclear (Palo Verde)Nuclear (SMR)Gas - Steam TurbineGas - Combined CycleGas - Combustion TurbineBiomassGeothermalWindSolarBattery StorageImportsDemand ResponseHydrogenBTM SolarLoadExcess Generation
100 CO2 Red by 2040 Nuclear (Palo Verde)Nuclear (SMR)Gas - Steam TurbineGas - Combined CycleGas - Combustion TurbineBiomassGeothermalWindSolarBattery StorageImportsDemand ResponseHydrogenBTM SolarLoadExcess Generation
2021 2024 2025 2027 2031 2035 2040 2045Cumulative Capacity Retirements (MW)
- - - - - - - - - - - - - - - - - (119) (119) (119) (192) (426) (426) (426) - - - - - (227) (227) (227) - - - - (63) (63) (63) (63) - - - - - - - - - - - - - - - - - - - - - - - - - - - - - (70) (97) (377) - - - - - - - (50) - - - - - - - - - - - - - - - - - - - - - - - - - - - - - - - - - - - - - - - - - - - - - - - - - - - - - - - - - - - - - - - - - (119) (119) (119) (192) (426) (426) (426) - - - - - (227) (227) (227) - - - - (63) (63) (63) (63) - - - - - - - - - - - - - - - - - - - - - - - - - - - - - (70) (97) (377) - - - - - - - (50) - - - - - - - - - - - - - - - - - - - - - - - - - - - - - - - - - - - - - - - - - - - - - - - - - - - - - - - - - - - - - - - - - (119) (119) (119) (192) (426) (426) (426) - - - - - (227) (227) (227) - - - - (63) (63) (63) (63) - - - - - - - - - - - - - - - - - - - - - - - - - - - - - (70) (97) (377) - - - - - - - (50) - - - - - - - - - - - - - - - - - - - - - - - - - - - - - - - - - - - - - - - - - - - - - - - -
Attachment D-3 E3 EPE Report Model Results AugustPage 29 of 34
Scenario Resource TypeHigh DG Nuclear (Palo Verde)
Nuclear (SMR)Gas - Steam TurbineGas - Combined CycleGas - Combustion TurbineBiomassGeothermalWindSolarBattery StorageImportsDemand ResponseHydrogenBTM SolarLoadExcess Generation
High DSM Nuclear (Palo Verde)Nuclear (SMR)Gas - Steam TurbineGas - Combined CycleGas - Combustion TurbineBiomassGeothermalWindSolarBattery StorageImportsDemand ResponseHydrogenBTM SolarLoadExcess Generation
Low Load Nuclear (Palo Verde)Nuclear (SMR)Gas - Steam TurbineGas - Combined CycleGas - Combustion TurbineBiomassGeothermalWindSolarBattery StorageImportsDemand ResponseHydrogenBTM SolarLoadExcess Generation
2021 2024 2025 2027 2031 2035 2040 2045Cumulative Capacity Retirements (MW)
- - - - - - - - - - - - - - - - - (119) (119) (119) (192) (426) (426) (426) - - - - - (227) (227) (227) - - - - (63) (63) (63) (63) - - - - - - - - - - - - - - - - - - - - - - - - - - - - - (70) (97) (377) - - - - - - - (50) - - - - - - - - - - - - - - - - - - - - - - - - - - - - - - - - - - - - - - - - - - - - - - - - - - - - - - - - - - - - - - - - - (119) (119) (119) (192) (426) (426) (426) - - - - - (227) (227) (227) - - - - (63) (63) (63) (63) - - - - - - - - - - - - - - - - - - - - - - - - - - - - - (70) (97) (377) - - - - - - - (50) - - - - - - - - - - - - - - - - - - - - - - - - - - - - - - - - - - - - - - - - - - - - - - - - - - - - - - - - - - - - - - - - - (119) (119) (119) (192) (426) (426) (426) - - - - - (227) (227) (227) - - - - (63) (63) (63) (63) - - - - - - - - - - - - - - - - - - - - - - - - - - - - - (70) (97) (377) - - - - - - - (50) - - - - - - - - - - - - - - - - - - - - - - - - - - - - - - - - - - - - - - - - - - - - - - - -
Attachment D-3 E3 EPE Report Model Results AugustPage 30 of 34
Scenario Resource TypeHigh Load Nuclear (Palo Verde)
Nuclear (SMR)Gas - Steam TurbineGas - Combined CycleGas - Combustion TurbineBiomassGeothermalWindSolarBattery StorageImportsDemand ResponseHydrogenBTM SolarLoadExcess Generation
No Lifetime Extensions Nuclear (Palo Verde)Nuclear (SMR)Gas - Steam TurbineGas - Combined CycleGas - Combustion TurbineBiomassGeothermalWindSolarBattery StorageImportsDemand ResponseHydrogenBTM SolarLoadExcess Generation
No New Gas Nuclear (Palo Verde)Nuclear (SMR)Gas - Steam TurbineGas - Combined CycleGas - Combustion TurbineBiomassGeothermalWindSolarBattery StorageImportsDemand ResponseHydrogenBTM SolarLoadExcess Generation
2021 2024 2025 2027 2031 2035 2040 2045Cumulative Capacity Retirements (MW)
- - - - - - - - - - - - - - - - - (119) (119) (119) (192) (426) (426) (426) - - - - - (227) (227) (227) - - - - (63) (63) (63) (63) - - - - - - - - - - - - - - - - - - - - - - - - - - - - - (70) (97) (377) - - - - - - - (50) - - - - - - - - - - - - - - - - - - - - - - - - - - - - - - - - - - - - - - - - - - - - - - - - - - - - - - - - - - - - - - - - - (192) (192) (282) (282) (426) (426) (426) - - - (227) (227) (227) (227) (227) - - - - (63) (63) (63) (63) - - - - - - - - - - - - - - - - - - - - - - - - - - - - - (70) (97) (377) - - - - - - - (50) - - - - - - - - - - - - - - - - - - - - - - - - - - - - - - - - - - - - - - - - - - - - - - - - - - - - - - - - - - - - - - - - - (119) (119) (119) (192) (426) (426) (426) - - - - - (227) (227) (227) - - - - (63) (63) (63) (63) - - - - - - - - - - - - - - - - - - - - - - - - - - - - - (70) (97) (377) - - - - - - - (50) - - - - - - - - - - - - - - - - - - - - - - - - - - - - - - - - - - - - - - - - - - - - - - - -
Attachment D-3 E3 EPE Report Model Results AugustPage 31 of 34
Scenario Resource TypeLow Carbon Price Nuclear (Palo Verde)
Nuclear (SMR)Gas - Steam TurbineGas - Combined CycleGas - Combustion TurbineBiomassGeothermalWindSolarBattery StorageImportsDemand ResponseHydrogenBTM SolarLoadExcess Generation
Mid Carbon Price Nuclear (Palo Verde)Nuclear (SMR)Gas - Steam TurbineGas - Combined CycleGas - Combustion TurbineBiomassGeothermalWindSolarBattery StorageImportsDemand ResponseHydrogenBTM SolarLoadExcess Generation
High Carbon Price Nuclear (Palo Verde)Nuclear (SMR)Gas - Steam TurbineGas - Combined CycleGas - Combustion TurbineBiomassGeothermalWindSolarBattery StorageImportsDemand ResponseHydrogenBTM SolarLoadExcess Generation
2021 2024 2025 2027 2031 2035 2040 2045Cumulative Capacity Retirements (MW)
- - - - - - - - - - - - - - - - - (119) (119) (119) (192) (426) (426) (426) - - - - - (227) (227) (227) - - - - (63) (63) (63) (63) - - - - - - - - - - - - - - - - - - - - - - - - - - - - - (70) (97) (377) - - - - - - - (50) - - - - - - - - - - - - - - - - - - - - - - - - - - - - - - - - - - - - - - - - - - - - - - - - - - - - - - - - - - - - - - - - - (119) (119) (119) (192) (426) (426) (426) - - - - - (227) (227) (227) - - - - (63) (63) (63) (63) - - - - - - - - - - - - - - - - - - - - - - - - - - - - - (70) (97) (377) - - - - - - - (50) - - - - - - - - - - - - - - - - - - - - - - - - - - - - - - - - - - - - - - - - - - - - - - - - - - - - - - - - - - - - - - - - - (119) (119) (119) (192) (426) (426) (426) - - - - - (227) (227) (227) - - - - (63) (63) (63) (63) - - - - - - - - - - - - - - - - - - - - - - - - - - - - - (70) (97) (377) - - - - - - - (50) - - - - - - - - - - - - - - - - - - - - - - - - - - - - - - - - - - - - - - - - - - - - - - - -
Attachment D-3 E3 EPE Report Model Results AugustPage 32 of 34
Scenario Resource TypeHigh Gas Price Nuclear (Palo Verde)
Nuclear (SMR)Gas - Steam TurbineGas - Combined CycleGas - Combustion TurbineBiomassGeothermalWindSolarBattery StorageImportsDemand ResponseHydrogenBTM SolarLoadExcess Generation
Low Renewable and Storage Costs Nuclear (Palo Verde)Nuclear (SMR)Gas - Steam TurbineGas - Combined CycleGas - Combustion TurbineBiomassGeothermalWindSolarBattery StorageImportsDemand ResponseHydrogenBTM SolarLoadExcess Generation
2021 2024 2025 2027 2031 2035 2040 2045Cumulative Capacity Retirements (MW)
- - - - - - - - - - - - - - - - - (119) (119) (119) (192) (426) (426) (426) - - - - - (227) (227) (227) - - - - (63) (63) (63) (63) - - - - - - - - - - - - - - - - - - - - - - - - - - - - - (70) (97) (377) - - - - - - - (50) - - - - - - - - - - - - - - - - - - - - - - - - - - - - - - - - - - - - - - - - - - - - - - - - - - - - - - - - - - - - - - - - - (119) (119) (119) (192) (426) (426) (426) - - - - - (227) (227) (227) - - - - (63) (63) (63) (63) - - - - - - - - - - - - - - - - - - - - - - - - - - - - - (70) (97) (377) - - - - - - - (50) - - - - - - - - - - - - - - - - - - - - - - - - - - - - - - - - - - - - - - - - - - - - - - - -
Attachment D-3 E3 EPE Report Model Results AugustPage 33 of 34
Scenario 2021 2024 2025 2027 2031 2035 2040 2045Least-Cost (Reference Case) 246$ 233$ 245$ 262$ 284$ 340$ 402$ 498$ Least-Cost Case + REA Resources 246$ 233$ 247$ 262$ 285$ 343$ 406$ 506$ Separate System Planning 247$ 233$ 250$ 268$ 293$ 369$ 473$ 571$ Separate System Planning (w H2) 247$ 233$ 251$ 268$ 293$ 348$ 438$ 536$ 80 Clean by 2035 246$ 233$ 245$ 262$ 284$ 342$ 402$ 498$ 20 CO2 Red by 2040 246$ 233$ 245$ 262$ 284$ 342$ 402$ 499$ 40 CO2 Red by 2040 246$ 233$ 245$ 262$ 284$ 342$ 405$ 512$ 60 CO2 Red by 2040 246$ 233$ 246$ 262$ 284$ 341$ 419$ 531$ 80 CO2 Red by 2040 246$ 233$ 247$ 262$ 284$ 347$ 463$ 577$ 90 CO2 Red by 2040 246$ 233$ 247$ 263$ 287$ 357$ 500$ 615$ 100 CO2 Red by 2040 (w H2) 246$ 233$ 249$ 264$ 289$ 367$ 551$ 663$ 100 CO2 Red by 2040 246$ 233$ 245$ 262$ 289$ 367$ 1113$ 1282$ High DG 245$ 231$ 241$ 256$ 277$ 325$ 382$ 470$ High DSM 245$ 230$ 239$ 254$ 271$ 313$ 367$ 450$ Low Load 239$ 227$ 236$ 252$ 269$ 312$ 371$ 460$ High Load 253$ 239$ 255$ 276$ 307$ 374$ 441$ 540$ No Lifetime Extensions 246$ 228$ 243$ 266$ 298$ 344$ 406$ 502$ No New Gas 246$ 233$ 245$ 262$ 284$ 367$ 453$ 570$ Low Carbon Price 291$ 277$ 284$ 301$ 323$ 379$ 444$ 543$ Mid Carbon Price 358$ 341$ 341$ 358$ 381$ 436$ 505$ 611$ High Carbon Price 469$ 449$ 432$ 451$ 475$ 529$ 603$ 718$ High Gas Price 257$ 242$ 251$ 268$ 291$ 347$ 412$ 509$ Low Renewable and Storage Costs 246$ 233$ 240$ 256$ 274$ 321$ 379$ 463$
Annual Revenue Requirement ($MM)
Attachment D-3 E3 EPE Report Model Results AugustPage 34 of 34
Scenario Clean Energy Type 2021 2024 2025 2027 2031 2035 2040 2045Least-Cost (Reference Case) Renewable 4 12 21 21 27 34 36 39
Zero Carbon 62 68 77 75 77 81 77 75Least-Cost Case + REA Resources Renewable 4 12 24 24 30 39 43 49
Zero Carbon 62 68 79 78 80 85 84 84Separate System Planning Renewable 4 12 20 21 26 38 42 46
Zero Carbon 62 68 76 75 76 84 83 82Separate System Planning (w H2) Renewable 4 12 21 21 27 34 41 45
Zero Carbon 62 68 76 75 77 81 82 8180 Clean by 2035 Renewable 4 12 21 22 27 34 39 45
Zero Carbon 62 68 77 76 77 81 80 8020 CO2 Red by 2040 Renewable 4 12 21 22 27 34 37 46
Zero Carbon 62 68 77 76 77 81 78 8140 CO2 Red by 2040 Renewable 4 12 21 22 27 34 43 51
Zero Carbon 62 68 77 76 77 81 84 8660 CO2 Red by 2040 Renewable 4 12 22 22 27 36 48 56
Zero Carbon 62 68 77 76 78 83 89 9180 CO2 Red by 2040 Renewable 4 12 24 24 30 41 54 60
Zero Carbon 62 68 79 78 81 87 94 9590 CO2 Red by 2040 Renewable 4 12 24 24 32 43 56 62
Zero Carbon 62 68 79 78 82 89 97 98100 CO2 Red by 2040 (w H2) Renewable 4 12 25 26 34 45 56 62
Zero Carbon 62 68 81 79 84 92 100 100100 CO2 Red by 2040 Renewable 4 12 22 22 34 45 60 65
Zero Carbon 62 68 77 76 84 92 100 100High DG Renewable 4 13 21 22 27 35 37 39
Zero Carbon 63 70 76 75 77 82 78 74High DSM Renewable 4 12 16 16 20 31 32 37
Zero Carbon 63 69 73 72 73 80 76 75Low Load Renewable 4 12 16 16 19 31 33 38
Zero Carbon 64 70 73 72 72 79 75 75High Load Renewable 4 12 23 24 31 36 36 41
Zero Carbon 61 66 77 76 79 80 76 75No Lifetime Extensions Renewable 4 12 23 26 31 35 36 39
Zero Carbon 62 68 79 80 81 81 77 75No New Gas Renewable 4 12 22 22 27 42 50 57
Zero Carbon 62 68 77 76 77 88 90 92Low Carbon Price Renewable 4 12 23 23 28 37 38 43
Zero Carbon 62 68 78 77 79 83 79 79Mid Carbon Price Renewable 4 12 26 26 31 39 41 45
Zero Carbon 62 68 81 80 81 86 82 81High Carbon Price Renewable 4 12 30 31 34 41 45 54
Zero Carbon 62 68 86 85 84 87 86 89High Gas Price Renewable 4 12 22 22 27 36 37 43
Zero Carbon 62 68 77 76 78 82 78 78Low Renewable and Storage Costs Renewable 4 12 22 22 28 36 38 44
Zero Carbon 62 68 77 76 78 83 79 80
Clean Energy ( of Load)
BEFORE THE NEW MEXICO PUBLIC REGULATION COMMISSION
RULE 1773 NMAC FILING
EL PASO ELECTRIC COMPANY NOTICE OF 2021 INTEGRATED RESOURCE PLAN
2020-2021 PLANNING PROCESS AND PUBLIC ADVISORY PROCESS MEETINGS
DECLARATION OF CURTIS HUTCHESON OF NOTICE TO CUSTOMERS
I Curtis Hutcheson pursuant to Rule 1-011 NMRA state as follows
1 I affirm in writing under penalty of perjury under the laws of the State of New Mexico
that the following statements are true and correct
2 I am over 18 years of age and have personal knowledge of the facts stated herein I am
employed as Supervisor-Regulatory Case Management My business address is 100 N Stanton
Street El Paso Texas 79901
3 My responsibilities include the oversight and preparation of rate and regulatory filings
and compliance with the various regulatory requirements of the jurisdictions in which EPE
operates
4 Pursuant to Rule 17739H(1) NMAC the New Mexico Public Regulation Commission
(ldquoCommissionrdquo) requires EPE to provide notice of EPErsquos 2021 Integrated Resource Planrsquos
2020-2021 Planning Process and Public Advisory Process Meetings in the utilityrsquos billing
inserts
5 EPE directly mailed the required notice to all existing New Mexico customers in a bill
insert between June 4 2020 and July 2 2020 A copy of the bill insert is attached as Exhibit A to
Attachment E-1 Proof of Notice
2
this Affirmation
6 EPE also published the notice in the Las Cruces Sun News on May 31 2020 The affidavit
and tear sheet are attached as Exhibit B to this Affirmation
7 EPE provided notice on June 4 2020 30 days prior to the first scheduled meeting on
July 10 2020 to the commission interveners in its most recent general rate case and
participants in its most recent renewable energy energy efficiency and IRP proceedings The
email of the notice and certificate of service is attached as Exhibit C to this Affirmation
I submit this Declaration based upon my personal knowledge and upon information
and belief in support of EPErsquos 2021 Integrated Resource Planrsquos 2020-2021 Planning Process
and Public Advisory Process Meetings
FURTHER DECLARANT SAYETH NAUGHT
I declare under penalty of perjury that the foregoing is true and correct
Executed on May 13 2021
__s Curtis Hutcheson________
CURTIS HUTCHESON
Attachment E-1 Proof of Notice
BEFORE THE NEW MEXICO PUBLIC REGULATION COMMISSION
RULE 1773 NMAC FILING
EL PASO ELECTRIC COMPANY
NOTICE OF 2021 INTEGRATED RESOURCE PLAN
2020-2021 PUBLIC ADVISORY PROCESS MEETINGS
Notice is hereby given that
El Paso Electric Company (EPE) invites members of the public to participate in the Integrated Resource
Plan (ldquoIRPrdquo) public advisory process through a series of public meetings With public participation EPE
will develop its IRP pursuant to the New Mexico Efficient Use of Energy Act and the New Mexico Public
Regulation Commissions (Commission) IRP Rule 1773 NMAC EPEs IRP is developed to identify cost-
effective demand-side and supply-side electricity resources to serve EPEs customers over the next 20-
year planning period
The IRP will be submitted to the Commission no later than July 2021 Public participation is an important
component of the development and implementation of EPEs integrated resource planning in New
Mexico EPE encourages interested members of the public to attend these public meetings to provide
public input and commentary whether as a residential or business customer or as a representative of a
trade non-profit neighborhood shareholder civic or other group
Given the currently effective limitations on public gatherings in New Mexico and Texas the first scheduled
meeting will be held electronically and by phone conference on July 10 2020 at 200 pm MDT The IRP
process will be explained and additional meeting dates and locations will be set at that time Prior to
each meeting the presentation for that meeting will be posted on EPEs website wwwepeletriccom If
you are interested in attending the meeting or otherwise participating in the process please contact EPE
by emailing NMIRPepelectriccom or calling at (915) 543- 4354
Exhibit A Page 1 of 1Attachment E-1 Proof of Notice
Exhibit B Page 1 of 2Attachment E-1 Proof of Notice
2H SUNDAY MAY 31 2020 LAS CRUCES SUN-NEWS
4B-501 Notice to creditors by publi-cation and notice to creditors bywritten notice (mailing or other de-livery)[For use with Rules 1B-304 1B-306and 1B-401 NMRA]
STATE OF NEW MEXICOIN THE PROBATE COURTDONA ANA COUNTY
No 20-0074
IN THE MATTER OF THEESTATE OF Juliet S WilliamsDECEASED
NOTICE TO CREDITORSNOTICE IS HEREBY GIVEN thatthe undersigned has been appointedpersonal representative of the es-tate of the decedent All personshaving claims against the estate ofthe decedent are required to presenttheir claims within four (4) monthsafter the date of the first publica-tion of any published notice to cred-itors or sixty (60) days after thedate of mailing or other delivery ofthis notice whichever is later orthe claims will be forever barredClaims must be presented either tothe undersigned personal represen-tative at the address below or filedwith the Probate Court of DonaAna 845 N Motel Blvd 1-201 LasCruces NM 88007Dated May 2020s Edwin James Williams Jrsignature of representative
Edwin James Williams JrPrinted Name
17093 White Pine RdStreet address
Beaver dam VA 23015City state and ZIP code
4213196 Sun-News May 31 andJun 7 14 2020
To advertise visit
SELL ITBUY IT
FIND ITcars
garage sales
tickets
jobs
antiques
motorcycles
computers
boats
sports equipment
pets
instruments
jewelry
furniture
tablets
auctions
yard sales
collectibles
appliances
cameras
coins
Place yourclassified ad today
FINDING WORK SHOULDNrsquoT BE WORK
Your job search ends here
Get started by visitingjobsusatodaycom
HVAC TECHNICIAN II
ACO amp CODES-LABORER
ANIMAL CONTROL OFFICER
DASO CADET-UNCERTIFIED
ROADS-EQUIPMENT OPERATOR
ELECTIONS SPECIALIST-TEMPORARY
ROADS-HEAVY EQUIPMENT OPERATOR
DETENTION CENTER OFFICER TRAINEE
DOCUMENT TECHNICIAN-DC DISPOSITIONS
ENVIRONMENTAL CODES ENFORCEMENT OFFICER
WATERWASTEWATER OPERATOR III
Job Application amp Job Announcements available on our Website atwwwdonaanacountyorg
Computer kiosks are available in the Human Resources Department
DONtildeA ANA COUNTYJOB VACANCIES
CAMINO REALREGIONAL UTILITY AUTHORITY
JOB VACANCIES
Demolition Build RoadsLeveling
Business amp Service Directoryto advertise email ServiceDirectorylcsun-newscom
or call 8007645620
Exhibit B Page 2 of 2Attachment E-1 Proof of Notice
From Griego PatriciaTo Burns Nancy Griego Patricia Jeffrey Wechsler Diana Luna Kari Olson Lorraine Talley John F McIntyre
Schichtl James Hutcheson Marvin C Novela Mariah M Parsons Judith M Pleasant Linda G Perea Araceli Gastevenslawgmailcom jvega-brownlas-crucesorg joprovenciolas-crucesorg llarocquelas-crucesorg marcydlas-crucesorg davilalas-crucesorg JAGlas-crucesorg hconnellylas-crucesorg ddollahonlas-crucesorg tomfdonaanacountyorg rockybacchusgmailcomecomaxaclifeisgood2com lellisnmsuedu ghauboldadnmsuedu jdrakemodrallcomnwinterstelznerlawcom kherrmannstelznerlawcom rgallegosstelznerlawcom Nobleccaegmailcomstephaniedzur-Lawcom Lundin Robert gelliotnmaggov Cholla Khoury lawofficejasonmarkscomJsmithwatsonlawlcgmailcom mayortrujillocityofanthonynmorg mlsouleshotmailcombthroneattynewmexicocom Goodin Nelson fredkdonaanacountyorg Rickvotesolarorgtasolomon6gmailcom Dahlharrishotmailcom Jdittmerutilitechnet Jaherzsawvelcomakharrigersawvelcom Borman Bradford PRC Reynolds John PRC Chavez Milo PRC Sidler Jack PRCjohnbogatkostatenmus marctuplerstatenmus gilberttfuentesstatenmus Sisneros Anthony R PRCLeyba-Tercero Elisha PRC Fisk Russell PRC Amer Judith PRC Smith Michael C PRC Martinez-Rael PeggyPRC elizabethramirezstatenmus carolynglickstatenmus Hurst Elizabeth PRCchristopherryanstatenmus philipbsimpsoncomcastnet Kylejsmith124civmailmilrobertagantoncivmailmil hgellerswenergyorg jbrantswenergyorg ctcolumbiaaolcomltougascleanenergyregresearchcom dgegaxnmsuedu Ramonablabersierracluborgsricdonearthlinknet smichelwesternresourcesorg Beadles Cydney PRCpatoconnellwesternresourcesorg aprilelliottwesternresourcesorg dneidcoxnet schaefnogmailcomdavidvw77com bslocumdwmrlawcom jmcnallydwmrlawcom mbarkerdwmrlawcommzidovskymontandcom
Cc EPE_Reg_MgmtSubject Rule 1773 NMAC Filing EPEs Notice of 2020-2021 Public Advisory Process Meetings for 2021 IRP amp COSDate Thursday June 4 2020 105041 AMAttachments 2021 IRP Noticepdf
COS Notice of IRP Processpdf
Good morning Attached is El Paso Electric Companyrsquos Notice of its 2020-2021 Public AdvisoryProcess Meetings for the 2021 Integrated Resource Plan and Certificate of Service that was filed byemail with NMPRC Records today
Patricia ldquoTrishrdquo Griego| El Paso Electric CompanyLegal Assistant300 Galisteo St Suite 206Santa Fe New Mexico 87501T (505) 982-4713 | C (505) 470-4048Patriciagriegoepelectriccom
CONFIDENTIALITY NOTICE The information contained in this electronic mailtransmission is CONFIDENTIAL and it may qualify as material protected pursuantto the Texas Uniform Trade Secrets Act the New Mexico Uniform Trade SecretsAct or other laws If you are not the intended recipient please destroydelete thismessage and any attachments and immediately notify the sender
Exhibit C Page 1 of 1Attachment E-1 Proof of Notice

Atta
chm
ent B
-3
2021
Dem
and
Fore
cast
by
Juri
sdic
tion
Page
2 o
f 2
Nativ
e Sy
stem
Dem
and
Texa
sRe
side
ntial
Commercial amp
Ind
ustrial Sm
all
Commercial amp
Ind
ustrial La
rge
Street L
ighting
OPA To
tal Te
xas
New
Mex
ico
Reside
ntial
Commercial amp
Ind
ustrial Sm
all
Commercial amp
Ind
ustrial La
rge
Street L
ighting
OPA To
tal Ne
w Mex
ico
Compa
ny U
seRG
EC
Total Na
tive
System
2031
2032
2033
2034
2035
2036
2037
2038
2039
2040
819
841
871
901
936
973
102
0107
2113
4120
650
250
451
051
552
052
453
253
954
855
824
424
424
524
624
724
725
025
225
425
611
1112
1212
1212
1313
1331
231
331
631
932
232
432
833
233
734
3
188
8191
3195
4199
2203
6207
9214
2220
8228
6237
6
233
237
243
250
257
265
276
288
303
321
142
144
147
150
153
155
159
164
168
173
1717
1717
1716
1616
1717
11
11
11
11
11
9797
9910
010
110
210
410
510
710
9
489
496
506
517
528
540
556
574
595
620
44
44
44
44
44
2324
2425
2525
2627
2728
240
4243
6248
8253
8259
3264
8272
8281
3291
3302
8 Attachment B-3 2021 Demand Forecast by Jurisdiction
Page 2 of 2
Attachment B-4 Losses by Transmission and Distribution
Year Secondary Primary Transmission FERC Losses (MW)2021 130 4 4 0 1382022 133 4 4 0 1412023 135 4 4 0 1442024 137 4 4 0 1452025 139 4 4 0 1482026 141 4 4 0 1502027 144 4 5 0 1532028 146 4 5 0 1552029 149 4 5 0 1592030 152 5 5 0 1622031 155 5 5 0 1652032 157 5 5 0 1672033 160 5 5 0 1712034 163 5 5 0 1742035 166 5 5 0 1772036 169 5 5 0 1802037 173 5 5 0 1842038 176 5 6 0 1872039 179 5 6 0 1912040 182 5 6 0 194
Page 1 of 1
Attachment B-5 Typical Days Tables
Page 1 of 10
Attachment B-5 Typical Days Tables
Page 2 of 10
Attachment B-5 Typical Days Tables
Page 3 of 10
Attachment B-5 Typical Days Tables
Page 4 of 10
Attachment B-5 Typical Days Tables
Page 5 of 10
Attachment B-5 Typical Days Tables
Page 6 of 10
Attachment B-5 Typical Days Tables
Page 7 of 10
Attachment B-5 Typical Days Tables
Page 8 of 10
Attachment B-5 Typical Days Tables
Page 9 of 10
Attachment B-5 Typical Days Tables
Page 10 of 10
Page 1 of 7
Attachment C-1 Transmission Facilities TABLE 1 Existing EPE Transmission Lines 115 kV and Above
EL PASO ELECTRIC COMPANY
Existing 115 kV and Above Internal Lines
RATING LENGTH STATE
From To kV Circuit MVA
Normal MVA
Emerg Miles From To AMRAD EMPIRE 345 1 400 400 12510 TX NM CALIENTE AMRAD 345 1 785 785 567 TX NM CALIENTE PICANTE 345 1 788 788 73 TX TX EMPIRE EDDY 345 1 836 836 05 NM NM HIDALGO GREENLEE 345 1 765 765 600 NM AZ LUNA AFTON 345 1 921 987 573 NM NM LUNA DIABLO 345 1 939 939 849 NM NM LUNA HIDALGO 345 1 659 659 505 NM NM MACHO SPRINGS
LUNA 345 1 1031 1390 249 NM NM
MACHO SPRINGS
SPRINGERVILLE 345 1 728 728 2014 NM AZ
NEWMAN ARROYO 345 1 700 700 303 TX NM NEWMAN AFTON 345 1 924 1028 299 TX NM PICANTE NEWMAN 345 1 786 786 162 TX TX WESTMESA ARROYO 345 1 680 680 2018 NM NM MIMBRES TAP AIRPORT 115 1 123 163 27 NM NM
AMRAD HOLLOMAN 115 1 121 121 225 NM NM ANTHONY ARROYO 115 1 114 114 244 NM NM ANTHONY BORDER STEEL 115 1 165 220 52 NM TX ANTHONY SALOPEK 115 1 165 220 173 NM NM ANTHONY NEWMAN 115 1 165 212 123 NM TX ANTHONY NUWAY 115 1 165 220 66 NM TX ASCARATE TROWBRIDGE 115 1 181 181 05 TX TX ASCARATE COPPER 115 1 185 246 14 TX TX ASCARATE JUAREZ 115 1 185 247 24 TX AUSTIN MARLOW 115 1 227 227 12 TX TX BIGGS BLISS
INDUSTRIAL 115 1 185 246 22 TX TX
BLISS INDUSTRIAL
LIBERTY 115 1 185 246 22 TX TX
BUTTERFIELD FT BLISS 115 1 135 180 19 TX TX CALIENTE DIAMOND HEAD 115 1 185 247 61 TX TX CALIENTE MPS 115 1 69 87 85 TX TX CALIENTE MPS 115 2 268 332 31 TX TX CALIENTE MPS 115 3 268 332 31 TX TX CALIENTE VISTA 115 1 166 221 66 TX TX CHAPARRAL ORO GRANDE 115 1 135 165 354 NM NM COPPER PENDALE 115 1 185 246 51 TX TX
Page 2 of 7
EL PASO ELECTRIC COMPANY Existing 115 kV and Above
Internal Lines
RATING LENGTH STATE
From To kV Circuit MVA
Normal MVA
Emerg Miles From To COYOTE RGC_DELL CITY 115 1 23 23 108 TX TX COYOTE MONTWOOD 115 1 185 246 79 TX NM CROMO RIO GRANDE 115 1 135 180 09 TX TX DIABLO RIO GRANDE 115 1 332 441 29 NM TX DIABLO RIO GRANDE 115 2 332 441 29 NM NM DIABLO JUAREZ 115 1 185 247 23 NM DIAMOND HEAD
LANE 115 1 185 247 28 TX TX
DURAZNO ASCARATE 115 1 185 246 33 TX NM DYER SHEARMAN 115 1 135 180 96 TX TX DYER AUSTIN 115 1 185 246 21 TX TX EXECUTIVE RIO GRANDE 115 1 271 359 29 TX TX FT BLISS AUSTIN 115 1 135 180 18 TX TX GLOBAL REACH
VISTA 115 1 329 329 30 TX TX
HATCH JORNADA 115 1 45 45 334 NM NM JORNADA ARROYO 115 1 79 79 49 NM NM LANE WRANGLER 115 1 165 220 10 TX TX LAS CRUCES ARROYO 115 1 165 220 41 NM NM LAS CRUCES SALOPEK 115 1 165 220 50 NM NM LEO EAST DYER 115 1 185 246 38 TX TX LEO EAST MILAGRO 115 1 185 246 44 TX TX LIBERTY GLOBAL REACH 115 1 185 246 26 TX TX MAR LARGO 115 1 29 29 114 NM NM MARLOW TROWBRIDGE 115 1 181 181 11 TX TX MESA AUSTIN 115 1 165 220 61 TX TX MESA RIO GRANDE 115 1 268 268 23 TX NM MILAGRO NEWMAN 115 1 185 246 63 TX TX MONTWOOD CALIENTE 115 1 185 246 50 TX TX MPS COYOTE 115 1 249 387 31 TX TX MPS MONTWOOD 115 1 249 387 70 TX TX NEWMAN CHAPARRAL 115 1 135 180 29 TX NM NEWMAN BUTTERFIELD 115 1 135 280 167 TX TX NEWMAN SHEARMAN 115 1 135 280 73 TX TX NEWMAN PIPELINE 115 1 185 246 98 TX TX NEWMAN PICANTE 115 1 185 246 136 TX TX NUWAY MONTOYA 115 1 165 220 36 TX TX ORO GRANDE AMRAD 115 1 135 165 123 NM NM ORO GRANDE WHITE SANDS 115 1 75 75 228 NM NM PATRIOT NEWMAN 115 1 135 180 15 TX TX PATRIOT CROMO 115 1 135 180 184 TX TX PELICANO HORIZON 115 1 185 246 67 TX TX
Page 3 of 7
EL PASO ELECTRIC COMPANY Existing 115 kV and Above
Internal Lines
RATING LENGTH STATE
From To kV Circuit MVA
Normal MVA
Emerg Miles From To PELICANO MONTWOOD 115 1 185 246 38 TX TX PENDALE LANE 115 1 185 246 15 TX TX PICANTE GLOBAL REACH 115 1 185 246 60 TX TX PICANTE BIGGS 115 1 185 246 23 TX TX PIPELINE BIGGS 115 1 135 180 136 TX TX RIO GRANDE RIPLEY 115 1 165 220 30 NM TX RIPLEY THORN 115 1 135 180 19 TX TX SALOPEK ARROYO 115 1 135 180 107 NM NM SANTA TERESA MONTOYA 115 1 185 246 74 NM TX SANTA TERESA DIABLO 115 1 169 225 89 NM NM SCOTSDALE VISTA 115 1 135 180 52 TX TX SOL LANE 115 1 135 180 21 TX TX SOL VISTA 115 1 185 246 20 TX TX SPARKS HORIZON 115 1 185 246 38 TX TX SUNSET NORTH DURAZNO 115 1 185 246 46 TX TX SUNSET NORTH EXECUTIVE 115 1 271 359 23 TX TX THORN MONTOYA 115 1 135 180 30 TX TX WRANGLER SPARKS 115 1 185 246 40 TX TX
- Internal refers to lines within EPEs Balancing Area including lines connecting EPE to neighboring utilities however not including line segments partially owned by EPE external to EPEs control area
- Some transmission lines were identified to be capacity limited by smaller jumpers connected at the substations The line ratings reflected in the above table are based on-line jumper upgrade assumptions
- The ratings are generally based on conductor thermal capacities but may be derated due to sag limitations or other factors
- RGC_DC is Rio Grande Electric Cooperative Dell City - Emerg is short for Emergency
Page 4 of 7
TABLE 2 Existing 115 kV EPE Substation Transformers
EL PASO ELECTRIC COMPANY
Existing 115 kV Load amp Step-up Substation Transformers
RATING Normal Emergency State
MVA MVA AIRPORT 115239 336 376 NM AMRAD 115249 85 95 NM
ANTHONY T1 115239 336 376 NM ANTHONY T2 115239 560 627 NM ARROYO T2 115239 336 376 NM ARROYO T4 115239 336 376 NM
ASCARATE T4 11569 112 1288 TX ASCARATE T5 11569 112 1288 TX
AUSTIN T1 115138 500 560 TX AUSTIN T2 115138 560 627 TX
BORDER STEEL 115 T1 115138 392 439 TX
BORDER STEEL 115 T2 115138 392 439 TX BUTTERFIELD T1 115138 300 336 TX BUTTERFIELD T2 115138 300 336 TX
CALIENTE T3 115138 336 376 TX CENTRAL TEMP T1 115138 336 376 TX
CHAPARRAL T1 115138 336 376 NM CHAPARRAL T2 115138 336 376 NM
COPPER T1 115138 300 336 TX COPPER GEN T2 138115 840 941 TX
COX T2 11569 560
644 NM COYOTE T1 115138 300 336 TX CROMO T1 115138 300 336 TX CROMO T2 115138 336 376 TX
DIAMOND HEAD T1 115138 336 376 TX DURAZNO T1 115138 336 376 TX
DYER T3 11569 112 1288 TX EMRLD T1 115138 125 140 NM
EXECUTIVE T1 115138 560 627 TX EXECUTIVE T2 115138 560 627 TX
FT BLISS T1 115138 560 627 TX FT BLISS T2 115132 280 314 TX
GLOBAL REACH T1 115138 336 376 TX GLOBAL REACH T2 115138 560 627 TX
Page 5 of 7
EL PASO ELECTRIC COMPANY
Existing 115 kV Load amp Step-up Substation Transformers
RATING Normal Emergency State
MVA MVA HATCH T1 115249 300 336 NM
HORIZON T1 115138 336 376 TX JORNADA T1 115239 336 376 NM JORNADA T2 115239 560 627 NM
LANE T1 11569 100 115 TX LANE T2 115138 300 336 TX
LAS CRUCES T1 115239 672 753 NM LAS CRUCES T2 115239 672 753 NM
LEO EAST T1 115138 336 376 TX LEO EAST T2 115138 336 376 TX
MAR T1 11542 112 125 NM MESA T1 115138 300 336 TX MESA T2 115138 336 376 TX
MILAGRO T1 115138 336 376 TX MILAGRO T2 115138 336 376 TX MILAGRO T3 115138 336 376 TX MONTOYA T1 115249 336 376 TX MONTOYA T2 115239 560 627 TX MONTOYA T3 115239 560 627 TX
MONTWOOD T1 115239 560 627 TX MONTWOOD T3 115239 560 627 TX
MPS T1 138115 1400 1568 TX MPS T2 138115 1400 1568 TX MPS T3 138115 1400 1568 TX MPS T4 138115 1400 1568 TX
NEWMAN G1(T2) 138115 1254 1405 TX NEWMAN G2 (T6) 138115 1254 1405 TX NEWMAN G3 (T8) 138115 1254 1405 TX
NEWMAN 4G1 (T11) 138115 1250 1400 TX NEWMAN 4G2 (T9) 138115 1250 1400 TX NEWMAN 4S1 (T13) 138115 1250 1400 TX NEWMAN 5G1 (T15) 138115 1300 1456 TX NEWMAN 5G2 (T16) 138115 1300 1456 TX NEWMAN 5S1 (T14) 138115 1750 196 TX
NUWAY T1 115239 560 627 TX NUWAY T2 115239 560 627 TX
Page 6 of 7
EL PASO ELECTRIC COMPANY
Existing 115 kV Load amp Step-up Substation Transformers
RATING Normal Emergency State
MVA MVA PATRIOT T1 115138 336 376 TX
PELICANO T1 115239 560 627 TX PELICANO T2 115239 560 627 TX PENDALE T1 115138 336 376 TX PENDALE T2 115138 560 627 TX PICACHO T1 115249 560 627 NM REDEYE T1 115138 140 157 NM
RIO GRANDE T1 11569 112 1288 NM RIO GRANDE T2 11569 112 1288 NM
RIO GRANDE G8 (T7) 175115 1680 1882 NM RIO GRANDE G9 (T17) 138115 1320 1478 NM
RIPLEY T1 115138 336 376 TX RIPLEY T2 115138 560 627 TX
SALOPEK T1 115249 280 314 NM SALOPEK T2 115249 280 314 NM SALOPEK T3 115249 280 314 NM
SANTA TERESA T1 115239 336 376 NM SANTA TERESA T2 115239 336 376 NM
SCOTSDALE T1 11569 112 1288 TX SCOTSDALE T4 115138 560 627 TX SCOTSDALE T5 115138 560 627 TX SHEARMAN T1 115138 300 336 TX
SOL T1 115138 336 376 TX SOL T2 115138 300 336 TX
SPARKS T1 115138 336 376 TX SPARKS T2 115138 560 627 TX SPARKS T3
11569 100 115 TX
SUNSET NORTH T1 115138 336 376 TX SUNSET NORTH T2 115138 336 376 TX SUNSET NORTH T3 11569 112 1288 TX
TALAVERA TEMP T1 115239 165 185 NM THORN T1 115138 336 376 TX THORN T2 115138 336 376 TX
TRIUMPH TEMP T1 115239 336 376 TX VISTA T1 115138 300 336 TX VISTA T2 115138 300 336 TX
Page 7 of 7
EL PASO ELECTRIC COMPANY
Existing 115 kV Load amp Step-up Substation Transformers
RATING Normal Emergency State
MVA MVA WHITE SANDS T1 115138 300 336 NM
WRANGLER T1 115138 500 560 TX
Attachment C-2 Existing Units Operating CharacteristicsCapacity Factor ()Resources 2021 2024 2025 2027 2031 2035 2040 2045Newman 1 2 0 0 0 0 0 0 0Newman 2 1 0 0 0 0 0 0 0Newman 3 10 3 0 1 0 0 0 0Newman 4 14 5 2 3 1 0 0 0Newman 5 64 54 38 41 44 40 41 47Newman 6 0 12 7 8 6 3 4 6Copper 2 0 0 0 0 0 0 0Montana 1 26 29 20 21 20 11 19 23Montana 2 26 28 19 21 21 14 23 24Montana 3 17 17 13 14 12 5 11 16Montana 4 50 42 30 32 28 23 28 28Rio Grande 7 0 0 0 0 0 0 0 0Rio Grande 8 3 1 0 0 0 0 0 0Rio Grande 9 13 5 2 3 3 0 0 2Gas Peaker 0 0 0 0 0 3 3 5Palo Verde 1 94 94 94 94 94 94 94 94Palo Verde 2 94 94 94 94 94 94 94 94Palo Verde 3 94 94 94 94 94 94 94 94
Fuel Cost ($000)Resources 2021 2024 2025 2027 2031 2035 2040 2045Newman 1 431$ -$ -$ -$ -$ -$ -$ -$ Newman 2 273$ -$ -$ -$ -$ -$ -$ -$ Newman 3 2299$ 667$ 55$ 248$ 46$ -$ -$ -$ Newman 4 7893$ 2755$ 1080$ 1435$ 716$ -$ -$ -$ Newman 5 31126$ 24367$ 17006$ 19659$ 22951$ 21785$ 24625$ 28990$ Newman 6 -$ 5465$ 3596$ 4364$ 3762$ 1579$ 2380$ 4155$ Copper 1076$ 70$ -$ -$ -$ -$ -$ -$ Montana 1 4595$ 4852$ 3414$ 3784$ 4030$ 2455$ 4318$ 5534$ Montana 2 5153$ 5102$ 3468$ 4056$ 4447$ 3079$ 5285$ 5678$ Montana 3 3332$ 3087$ 2371$ 2768$ 2638$ 1279$ 2780$ 4139$ Montana 4 9507$ 7298$ 5383$ 5946$ 5665$ 4884$ 6297$ 6488$ Rio Grande 7 93$ -$ -$ -$ -$ -$ -$ -$ Rio Grande 8 1340$ 264$ 49$ 93$ -$ -$ -$ -$ Rio Grande 9 2675$ 987$ 413$ 603$ 706$ 42$ 22$ 429$ Gas Peaker -$ -$ -$ -$ -$ 1081$ 2239$ 5645$ Palo Verde 1 12111$ 12185$ 12222$ 12259$ 12370$ 12500$ 12667$ 12834$ Palo Verde 2 12169$ 12244$ 12281$ 12318$ 12430$ 12561$ 12728$ 12896$ Palo Verde 3 12111$ 12185$ 12222$ 12259$ 12370$ 12500$ 12667$ 12834$
Heat Rate (MMBtuMWh)Newman 1 1228Newman 2 1151Newman 3 1097Newman 4 1012Newman 5 7741Newman 6 10101Copper 19916Montana 1 9373Montana 2 9334Montana 3 9933Montana 4 9339Rio Grande 7 1179Rio Grande 8 11902Rio Grande 9 9881Gas Peaker 10101Palo Verde 1 10Palo Verde 2 10Palo Verde 3 10
Page 1 of 2
Attachment C-2 Existing Units Operating CharacteristicsFixed OampM ($000)Resources 2021 2024 2025 2027 2031 2035 2040 2045Newman 1 1704$ 5737$ 5737$ 5737$ -$ -$ -$ -$ Newman 2 1789$ -$ -$ -$ -$ -$ -$ -$ Newman 3 2221$ 2221$ 2221$ 5231$ 5231$ -$ -$ -$ Newman 4 5014$ 5014$ 5014$ 10769$ 10769$ -$ -$ -$ Newman 5 5563$ 5563$ 5563$ 5563$ 5563$ 5563$ 5563$ 5563$ Newman 6 -$ 2752$ 2752$ 2752$ 2752$ 2752$ 2752$ 2752$ Copper 1167$ 1167$ 1167$ 1167$ -$ -$ -$ -$ Montana 1 1613$ 1613$ 1613$ 1613$ 1613$ 1613$ 1613$ 1613$ Montana 2 1623$ 1623$ 1623$ 1623$ 1623$ 1623$ 1623$ 1623$ Montana 3 1484$ 1484$ 1484$ 1484$ 1484$ 1484$ 1484$ 1484$ Montana 4 1076$ 1076$ 1076$ 1076$ 1076$ 1076$ 1076$ 1076$ Rio Grande 7 1612$ -$ -$ -$ -$ -$ -$ -$ Rio Grande 8 4346$ 4346$ 4346$ 4346$ 4346$ -$ -$ -$ Rio Grande 9 2495$ 2495$ 2495$ 2495$ 2495$ 2495$ 2495$ 2495$ Gas Peaker -$ -$ -$ -$ -$ 1697$ 3312$ 4621$ Palo Verde 1 28313$ 28313$ 28313$ 28313$ 28313$ 28313$ 28313$ 28313$ Palo Verde 2 28313$ 28313$ 28313$ 28313$ 28313$ 28313$ 28313$ 28313$ Palo Verde 3 28313$ 28313$ 28313$ 28313$ 28313$ 28313$ 28313$ 28313$
Variable OampM ($000)Resources 2021 2024 2025 2027 2031 2035 2040 2045Newman 1 466$ -$ -$ -$ -$ -$ -$ -$ Newman 2 415$ -$ -$ -$ -$ -$ -$ -$ Newman 3 2388$ 695$ 57$ 257$ 48$ -$ -$ -$ Newman 4 8305$ 2887$ 1130$ 1497$ 744$ -$ -$ -$ Newman 5 33855$ 26821$ 18189$ 21158$ 24347$ 22746$ 25862$ 30331$ Newman 6 -$ 5964$ 3916$ 4688$ 3914$ 1639$ 2464$ 4299$ Copper 1581$ 282$ -$ -$ -$ -$ -$ -$ Montana 1 5119$ 5348$ 3764$ 4110$ 4219$ 2540$ 4463$ 5714$ Montana 2 5832$ 5707$ 3805$ 4427$ 4663$ 3195$ 5491$ 5881$ Montana 3 3700$ 3494$ 2602$ 3032$ 2777$ 1335$ 2895$ 4307$ Montana 4 10379$ 8028$ 6003$ 6579$ 6106$ 5134$ 6673$ 6808$ Rio Grande 7 161$ -$ -$ -$ -$ -$ -$ -$ Rio Grande 8 1700$ 269$ 50$ 94$ -$ -$ -$ -$ Rio Grande 9 3001$ 1138$ 487$ 689$ 741$ 44$ 23$ 447$ Gas Peaker -$ -$ -$ -$ -$ 1122$ 2319$ 5841$ Palo Verde 1 15537$ 15612$ 15649$ 15686$ 15797$ 15927$ 16094$ 16261$ Palo Verde 2 15613$ 15687$ 15724$ 15762$ 15873$ 16004$ 16172$ 16339$ Palo Verde 3 15537$ 15612$ 15649$ 15686$ 15797$ 15927$ 16094$ 16261$
Market Price
Year
Average Annual Price ($MWh)
2021 2024$ 2022 2043$ 2023 2050$ 2024 2008$ 2025 2020$ 2026 2007$ 2027 1981$ 2028 1998$ 2029 1919$ 2030 1863$ 2031 1927$ 2032 2020$ 2033 2009$ 2034 2021$ 2035 2016$ 2036 2031$ 2037 1998$ 2038 1927$ 2039 1895$ 2040 1836$ 2041 1843$ 2042 1832$ 2043 1825$ 2044 1895$ 2045 2025$
Page 2 of 2
Attachment D-1 E3 EPE Report Model Results June Page 1 of 34
Scenario Resource Type 2021 2024 2025 2027 2031 2035 2040 2045Least-Cost (Reference Case) Nuclear (Palo Verde) 5148 5148 5148 5148 5148 5148 5148 5148
Nuclear (SMR) - - - - - - - - Gas - Steam Turbine 140 34 7 3 - - - - Gas - Combined Cycle 1767 1373 1022 1111 1130 1065 1318 1502 Gas - Combustion Turbine 1027 1169 836 880 773 754 1250 1640 Biomass - - - - - - - - Geothermal - - - - - - - - Wind - - 379 382 375 336 409 720 Solar 289 952 1467 1551 2200 3058 3443 4239 Battery Storage - 12 (26) (48) (129) (217) (220) (250) Imports 391 336 260 259 282 273 358 440 Demand Response - - - - - - - - Hydrogen - - - - - - - - BTM Solar 37 135 165 225 344 460 601 763 Load 8771 9155 9258 9512 10123 10878 12308 14203 Excess Generation 14 130 430 342 496 657 373 475
Least-Cost Case + ETA Resources Nuclear (Palo Verde) 5148 5148 5148 5148 5148 5148 5148 5148 Nuclear (SMR) - - - - - - - - Gas - Steam Turbine 140 34 3 3 - - - - Gas - Combined Cycle 1767 1373 898 963 998 899 1053 1145 Gas - Combustion Turbine 1027 1169 720 761 686 461 790 1043 Biomass - - - - - - - - Geothermal - - - - - - - - Wind - - 670 688 675 555 653 815 Solar 289 953 1464 1530 2211 3351 4068 5345 Battery Storage - 12 (31) (45) (122) (241) (281) (370) Imports 391 336 220 239 184 245 275 314 Demand Response - - - - - - - - Hydrogen - - - - - - - - BTM Solar 37 135 165 225 344 460 601 763 Load 8771 9155 9258 9512 10123 10878 12308 14203 Excess Generation 14 130 564 480 558 1272 1040 940
Separate System Planning Nuclear (Palo Verde) 5148 5148 5148 5148 5148 5148 5148 5148 Nuclear (SMR) - - - - - - - - Gas - Steam Turbine 140 34 1 2 - - - - Gas - Combined Cycle 1766 1388 1031 1122 1141 969 1192 1385 Gas - Combustion Turbine 1040 1177 754 831 807 477 795 1105 Biomass - - - - - - - - Geothermal - - - - - - - - Wind - - 305 306 295 182 165 412 Solar 289 949 1648 1690 2236 3708 4532 5512 Battery Storage - 12 (54) (60) (138) (295) (350) (405) Imports 391 327 259 247 291 229 225 282 Demand Response - - - - - - - - Hydrogen - - - - - - - - BTM Solar 37 135 165 225 344 460 601 763 Load 8771 9155 9258 9512 10123 10878 12308 14203 Excess Generation 14 134 450 407 444 1288 2358 2353
Annual Energy (GWh)
Attachment D-1 E3 EPE Report Model Results June Page 2 of 34
Scenario Resource Type 2021 2024 2025 2027 2031 2035 2040 2045Annual Energy (GWh)
Separate System Planning (w H2) Nuclear (Palo Verde) 5148 5148 5148 5148 5148 5148 5148 5148 Nuclear (SMR) - - - - - - - - Gas - Steam Turbine 140 34 1 2 - - - - Gas - Combined Cycle 1766 1388 979 1049 1090 1035 1153 1384 Gas - Combustion Turbine 1040 1177 728 819 735 688 779 1129 Biomass - - - - - - - - Geothermal - - - - - - - - Wind - - 447 451 433 405 510 657 Solar 289 949 1594 1633 2242 3101 4087 5075 Battery Storage - 12 (56) (60) (136) (218) (297) (352) Imports 391 327 251 245 266 260 261 327 Demand Response - - - - - - - - Hydrogen - - - - - - 65 71 BTM Solar 37 135 165 225 344 460 601 763 Load 8771 9155 9258 9512 10123 10878 12308 14203 Excess Generation 14 133 444 402 574 772 872 919
Low Load Growth Nuclear (Palo Verde) 5148 5148 5148 5148 5148 5148 5148 5148 Nuclear (SMR) - - - - - - - - Gas - Steam Turbine 101 27 2 3 - - - - Gas - Combined Cycle 1596 1244 978 1065 1127 1025 1258 1472 Gas - Combustion Turbine 983 1065 799 875 806 644 1109 1492 Biomass - - - - - - - - Geothermal - - - - - - - - Wind - - 333 336 335 291 350 562 Solar 282 919 1293 1309 1805 2833 3220 3993 Battery Storage - 8 (29) (29) (96) (209) (215) (245) Imports 381 325 269 262 289 268 342 437 Demand Response - - - - - - - - Hydrogen - - - - - - - - BTM Solar 37 135 165 225 344 460 601 763 Load 8492 8862 8958 9194 9759 10459 11813 13623 Excess Generation 22 163 337 318 410 642 359 427
High Load Growth Nuclear (Palo Verde) 5148 5148 5148 5148 5148 5148 5148 5148 Nuclear (SMR) - - - - - - - - Gas - Steam Turbine 195 50 5 3 - - - - Gas - Combined Cycle 1909 1522 1067 1151 1118 1107 1388 1500 Gas - Combustion Turbine 1088 1256 865 914 776 867 1411 1747 Biomass - - - - - - - - Geothermal - - - - - - - - Wind - - 431 436 413 396 463 976 Solar 293 983 1651 1751 2569 3257 3642 4464 Battery Storage - 14 (47) (68) (159) (222) (222) (256) Imports 400 343 272 271 280 284 372 441 Demand Response - - - - - - - - Hydrogen - - - - - - - - BTM Solar 37 135 165 225 344 460 601 763 Load 9050 9447 9558 9830 10488 11297 12803 14783 Excess Generation 10 100 394 290 554 655 385 540
Attachment D-1 E3 EPE Report Model Results June Page 3 of 34
Scenario Resource Type 2021 2024 2025 2027 2031 2035 2040 2045Annual Energy (GWh)
High DG Nuclear (Palo Verde) 5148 5148 5148 5148 5148 5148 5148 5148 Nuclear (SMR) - - - - - - - - Gas - Steam Turbine 134 31 7 3 - - - - Gas - Combined Cycle 1728 1317 1001 1081 1111 1060 1266 1473 Gas - Combustion Turbine 1028 1123 814 825 742 696 1097 1614 Biomass - - - - - - - - Geothermal - - - - - - - - Wind - - 367 372 368 326 391 916 Solar 285 866 1263 1278 1665 2340 2627 2711 Battery Storage - 11 (25) (45) (126) (227) (245) (244) Imports 389 314 247 241 269 260 345 440 Demand Response - - - - - - - - Hydrogen - - - - - - - - BTM Solar 88 350 436 608 945 1276 1680 2144 Load 8771 9155 9258 9512 10123 10878 12308 14203 Excess Generation 18 217 513 492 614 714 600 432
High DSM Nuclear (Palo Verde) 5148 5148 5148 5148 5148 5148 5148 5148 Nuclear (SMR) - - - - - - - - Gas - Steam Turbine 133 30 2 3 0 - - - Gas - Combined Cycle 1744 1303 1041 1126 1198 1029 1234 1463 Gas - Combustion Turbine 1020 1111 869 907 900 610 1026 1407 Biomass - - - - - - - - Geothermal - - - - - - - - Wind - - 244 244 251 207 249 470 Solar 288 934 1332 1337 1621 2752 3114 3719 Battery Storage - 10 (28) (29) (86) (205) (213) (233) Imports 390 329 283 268 304 271 342 439 Demand Response - - - - - - - - Hydrogen - - - - - - - - BTM Solar 37 135 165 225 344 460 601 763 Load 8731 8994 9056 9230 9680 10273 11501 13177 Excess Generation 15 148 318 313 263 643 371 372
No New Gas Nuclear (Palo Verde) 5148 5148 5148 5148 5148 5148 5148 5148 Nuclear (SMR) - - - - - - - - Gas - Steam Turbine 140 34 6 3 - - - - Gas - Combined Cycle 1767 1373 984 1072 1095 716 702 637 Gas - Combustion Turbine 1027 1169 811 849 745 180 216 207 Biomass - - - - - - - - Geothermal - - - - - - - - Wind - - 455 462 452 210 208 210 Solar 289 952 1467 1545 2197 4287 5691 7680 Battery Storage - 12 (27) (47) (127) (348) (472) (649) Imports 391 336 251 255 270 225 213 206 Demand Response - - - - - - - - Hydrogen - - - - - - - - BTM Solar 37 135 165 225 344 460 601 763 Load 8771 9155 9258 9512 10123 10878 12308 14203 Excess Generation 14 130 458 372 536 2237 2586 3219
Attachment D-1 E3 EPE Report Model Results June Page 4 of 34
Scenario Resource Type 2021 2024 2025 2027 2031 2035 2040 2045Annual Energy (GWh)
No Lifetime Extensions Nuclear (Palo Verde) 5148 5148 5148 5148 5148 5148 5148 5148 Nuclear (SMR) - - - - - - - - Gas - Steam Turbine 140 34 2 0 - - - - Gas - Combined Cycle 1767 1373 948 1015 1050 1056 1308 1502 Gas - Combustion Turbine 1027 1169 707 680 634 745 1242 1640 Biomass - - - - - - - - Geothermal - - - - - - - - Wind - - 397 400 370 364 442 722 Solar 289 953 1693 1897 2475 3050 3432 4237 Battery Storage - 12 (38) (94) (164) (216) (219) (250) Imports 391 336 235 241 267 271 354 440 Demand Response - - - - - - - - Hydrogen - - - - - - - - BTM Solar 37 135 165 225 344 460 601 763 Load 8771 9155 9258 9512 10123 10878 12308 14203 Excess Generation 14 129 634 428 592 661 374 475
High Gas Price Nuclear (Palo Verde) 5148 5148 5148 5148 5148 5148 5148 5148 Nuclear (SMR) - - - - - - - - Gas - Steam Turbine 125 31 3 3 - - - - Gas - Combined Cycle 1787 1400 983 1060 1062 999 1234 1347 Gas - Combustion Turbine 1008 1120 764 786 698 607 1121 1361 Biomass - - - - - - - - Geothermal - - - - - - - - Wind - - 486 493 483 422 516 926 Solar 290 956 1465 1542 2190 3165 3570 4490 Battery Storage - 9 (31) (46) (126) (226) (232) (274) Imports 403 360 274 301 325 303 350 440 Demand Response - - - - - - - - Hydrogen - - - - - - - - BTM Solar 37 135 165 225 344 460 601 763 Load 8771 9155 9258 9512 10123 10878 12308 14203 Excess Generation 13 127 470 386 546 811 486 705
Low Carbon Price Nuclear (Palo Verde) 5148 5148 5148 5148 5148 5148 5148 5148 Nuclear (SMR) - - - - - - - - Gas - Steam Turbine 127 23 3 3 - - - - Gas - Combined Cycle 1803 1433 955 1021 1036 971 1189 1333 Gas - Combustion Turbine 1001 1107 711 750 678 571 1063 1333 Biomass - - - - - - - - Geothermal - - - - - - - - Wind - - 609 624 604 523 642 936 Solar 289 958 1476 1548 2179 3178 3576 4573 Battery Storage - 11 (32) (45) (124) (229) (234) (279) Imports 394 345 223 238 258 256 322 395 Demand Response - - - - - - - - Hydrogen - - - - - - - - BTM Solar 37 135 165 225 344 460 601 763 Load 8771 9155 9258 9512 10123 10878 12308 14203 Excess Generation 14 125 512 426 579 876 532 725
Attachment D-1 E3 EPE Report Model Results June Page 5 of 34
Scenario Resource Type 2021 2024 2025 2027 2031 2035 2040 2045Annual Energy (GWh)
Medium Carbon Price Nuclear (Palo Verde) 5148 5148 5148 5148 5148 5148 5148 5148 Nuclear (SMR) - - - - - - - - Gas - Steam Turbine 120 22 3 3 - - - - Gas - Combined Cycle 1822 1496 876 941 974 922 1115 1270 Gas - Combustion Turbine 983 1036 548 590 606 475 950 1199 Biomass - - - - - - - - Geothermal - - - - - - - - Wind - - 754 779 766 646 805 1098 Solar 290 961 1600 1663 2221 3268 3695 4746 Battery Storage - 7 (37) (47) (122) (230) (242) (293) Imports 399 354 200 210 187 190 235 271 Demand Response - - - - - - - - Hydrogen - - - - - - - - BTM Solar 37 135 165 225 344 460 601 763 Load 8771 9155 9258 9512 10123 10878 12308 14203 Excess Generation 13 121 763 676 588 911 560 726
High Carbon Price Nuclear (Palo Verde) 5148 5148 5148 5148 5148 5148 5148 5148 Nuclear (SMR) - - - - - - - - Gas - Steam Turbine 119 21 2 3 0 - - - Gas - Combined Cycle 1835 1540 658 724 862 872 979 832 Gas - Combustion Turbine 962 989 428 458 488 393 630 544 Biomass - - - - - - - - Geothermal - - - - - - - - Wind - - 869 904 927 776 940 832 Solar 290 963 1847 1900 2307 3272 4088 6364 Battery Storage - 2 (40) (46) (115) (230) (271) (474) Imports 408 362 181 195 162 187 193 192 Demand Response - - - - - - - - Hydrogen - - - - - - - - BTM Solar 37 135 165 225 344 460 601 763 Load 8771 9155 9258 9512 10123 10878 12308 14203 Excess Generation 13 120 1270 1182 882 1065 1041 1596
80 Clean by 2035 Nuclear (Palo Verde) 5148 5148 5148 5148 5148 5148 5148 5148 Nuclear (SMR) - - - - - - - - Gas - Steam Turbine 140 34 7 3 - - - - Gas - Combined Cycle 1767 1373 1022 1111 1127 1050 1159 1295 Gas - Combustion Turbine 1027 1169 836 880 766 696 1057 1256 Biomass - - - - - - - - Geothermal - - - - - - - - Wind - - 379 382 375 331 683 1029 Solar 289 952 1466 1551 2212 3155 3653 4715 Battery Storage - 12 (26) (48) (129) (224) (234) (290) Imports 391 336 261 260 278 264 240 286 Demand Response - - - - - - - - Hydrogen - - - - - - - - BTM Solar 37 135 165 225 344 460 601 763 Load 8771 9155 9258 9512 10123 10878 12308 14203 Excess Generation 14 130 431 343 514 770 469 738
Attachment D-1 E3 EPE Report Model Results June Page 6 of 34
Scenario Resource Type 2021 2024 2025 2027 2031 2035 2040 2045Annual Energy (GWh)
20 CO2 Red by 2040 Nuclear (Palo Verde) 5148 5148 5148 5148 5148 5148 5148 5148 Nuclear (SMR) - - - - - - - - Gas - Steam Turbine 140 34 7 3 - - - - Gas - Combined Cycle 1767 1373 1022 1111 1130 1065 1318 1342 Gas - Combustion Turbine 1027 1169 836 880 773 751 1249 1353 Biomass - - - - - - - - Geothermal - - - - - - - - Wind - - 379 382 375 336 409 927 Solar 289 952 1466 1549 2204 3061 3445 4548 Battery Storage - 12 (26) (48) (129) (217) (220) (277) Imports 391 336 261 262 277 274 357 397 Demand Response - - - - - - - - Hydrogen - - - - - - - - BTM Solar 37 135 165 225 344 460 601 763 Load 8771 9155 9258 9512 10123 10878 12308 14203 Excess Generation 14 130 431 345 491 655 371 705
40 CO2 Red by 2040 Nuclear (Palo Verde) 5148 5148 5148 5148 5148 5148 5148 5148 Nuclear (SMR) - - - - - - - - Gas - Steam Turbine 140 34 7 3 - - - - Gas - Combined Cycle 1767 1373 1022 1111 1127 1051 1133 1135 Gas - Combustion Turbine 1027 1169 836 880 766 696 980 985 Biomass - - - - - - - - Geothermal - - - - - - - - Wind - - 379 382 375 331 763 1034 Solar 289 953 1466 1549 2211 3151 3692 5268 Battery Storage - 12 (26) (48) (128) (224) (241) (350) Imports 391 336 261 262 279 265 232 219 Demand Response - - - - - - - - Hydrogen - - - - - - - - BTM Solar 37 135 165 225 344 460 601 763 Load 8771 9155 9258 9512 10123 10878 12308 14203 Excess Generation 14 129 432 345 515 768 533 965
60 CO2 Red by 2040 Nuclear (Palo Verde) 5148 5148 5148 5148 5148 5148 5148 5148 Nuclear (SMR) - - - - - - - - Gas - Steam Turbine 140 34 7 3 - - - - Gas - Combined Cycle 1767 1373 1022 1111 1127 1052 864 852 Gas - Combustion Turbine 1027 1169 836 880 766 698 561 560 Biomass - - - - - - - - Geothermal - - - - - - - - Wind - - 379 382 375 331 927 838 Solar 289 953 1466 1552 2213 3150 4319 6337 Battery Storage - 12 (26) (48) (128) (224) (276) (470) Imports 391 336 261 259 278 263 164 174 Demand Response - - - - - - - - Hydrogen - - - - - - - - BTM Solar 37 135 165 225 344 460 601 763 Load 8771 9155 9258 9512 10123 10878 12308 14203 Excess Generation 14 130 432 342 513 769 1338 1586
Attachment D-1 E3 EPE Report Model Results June Page 7 of 34
Scenario Resource Type 2021 2024 2025 2027 2031 2035 2040 2045Annual Energy (GWh)
80 CO2 Red by 2040 Nuclear (Palo Verde) 5148 5148 5148 5148 5148 5148 5148 5148 Nuclear (SMR) - - - - - - - - Gas - Steam Turbine 140 34 3 3 - - - - Gas - Combined Cycle 1767 1373 910 976 1017 907 577 550 Gas - Combustion Turbine 1027 1169 734 777 696 468 168 183 Biomass - - - - - - - - Geothermal - - - - - - - - Wind - - 638 654 638 532 1260 1231 Solar 289 952 1463 1531 2158 3371 4812 6758 Battery Storage - 12 (30) (45) (123) (239) (338) (517) Imports 391 336 227 241 245 232 80 88 Demand Response - - - - - - - - Hydrogen - - - - - - - - BTM Solar 37 135 165 225 344 460 601 763 Load 8771 9155 9258 9512 10123 10878 12308 14203 Excess Generation 14 130 546 461 605 1183 2430 2751
90 CO2 Red by 2040 Nuclear (Palo Verde) 5148 5148 5148 5148 5148 5148 5148 5148 Nuclear (SMR) - - - - - - - - Gas - Steam Turbine 140 34 3 3 - - - - Gas - Combined Cycle 1767 1373 910 978 1018 808 340 313 Gas - Combustion Turbine 1027 1169 736 776 696 320 41 58 Biomass - - - - - - - - Geothermal - - - - - - - - Wind - - 637 655 639 463 1965 1995 Solar 289 952 1462 1527 2156 3764 4483 6350 Battery Storage - 12 (30) (45) (123) (278) (311) (472) Imports 391 336 226 244 245 193 40 47 Demand Response - - - - - - - - Hydrogen - - - - - - - - BTM Solar 37 135 165 225 344 460 601 763 Load 8771 9155 9258 9512 10123 10878 12308 14203 Excess Generation 14 130 547 465 603 1440 3210 3645
100 CO2 Red by 2040 Nuclear (Palo Verde) 5148 5148 5148 5148 5148 5148 5148 5148 Nuclear (SMR) - - - - - - - - Gas - Steam Turbine 140 34 6 3 - - - - Gas - Combined Cycle 1767 1373 984 1072 1095 716 - - Gas - Combustion Turbine 1027 1169 811 849 745 180 - - Biomass - - - - - - - - Geothermal - - - - - - - - Wind - - 455 462 452 210 969 1406 Solar 289 952 1467 1545 2197 4287 6734 7595 Battery Storage - 12 (27) (47) (127) (348) (1163) (1402) Imports 391 336 251 255 270 225 - - Demand Response - - - - - - - - Hydrogen - - - - - - - - BTM Solar 37 135 165 225 344 460 620 1455 Load 8771 9155 9258 9512 10123 10878 12308 14203 Excess Generation 14 130 458 372 536 2237 10954 12232
Attachment D-1 E3 EPE Report Model Results June Page 8 of 34
Scenario Resource Type 2021 2024 2025 2027 2031 2035 2040 2045Annual Energy (GWh)
100 CO2 Red by 2040 (w H2) Nuclear (Palo Verde) 5148 5148 5148 5148 5148 5148 5148 5148 Nuclear (SMR) - - - - - - - - Gas - Steam Turbine 140 34 3 4 - - - - Gas - Combined Cycle 1767 1373 868 928 983 689 - - Gas - Combustion Turbine 1027 1169 692 732 627 210 - - Biomass - - - - - - - - Geothermal - - - - - - - - Wind - - 743 765 755 469 1700 1650 Solar 289 952 1460 1525 2217 4074 4752 6753 Battery Storage - 12 (31) (46) (122) (300) (336) (515) Imports 391 336 209 230 171 129 - - Demand Response - - - - - - - - Hydrogen - - - - - - 442 404 BTM Solar 37 135 165 225 344 460 601 763 Load 8771 9155 9258 9512 10123 10878 12308 14203 Excess Generation 14 130 616 528 575 1636 3102 3585
Attachment D-1 E3 EPE Report Model Results June Page 9 of 34
Scenario Resource TypeLeast-Cost (Reference Case) Nuclear (Palo Verde)
Nuclear (SMR)Gas - Steam TurbineGas - Combined CycleGas - Combustion TurbineBiomassGeothermalWindSolarBattery StorageImportsDemand ResponseHydrogenBTM SolarLoadExcess Generation
Least-Cost Case + ETA Resources Nuclear (Palo Verde)Nuclear (SMR)Gas - Steam TurbineGas - Combined CycleGas - Combustion TurbineBiomassGeothermalWindSolarBattery StorageImportsDemand ResponseHydrogenBTM SolarLoadExcess Generation
Separate System Planning Nuclear (Palo Verde)Nuclear (SMR)Gas - Steam TurbineGas - Combined CycleGas - Combustion TurbineBiomassGeothermalWindSolarBattery StorageImportsDemand ResponseHydrogenBTM SolarLoadExcess Generation
2021 2024 2025 2027 2031 2035 2040 2045622 622 622 622 622 622 622 622 - - - - - - - - 426 307 307 307 234 - - - 493 493 493 493 493 266 266 266 503 731 731 731 668 952 1111 1318 - - - - - - - - - - - - - - - - - - 109 109 109 109 109 196 115 385 629 629 904 1241 1298 1580 - 50 183 256 582 1032 1116 1284 - - - - - - - - 46 53 56 61 71 81 93 93
- - - - - - - - 18 65 80 108 166 221 289 368
- - - - - - - - - - - - - - - - 622 622 622 622 622 622 622 622 - - - - - - - - 426 307 307 307 234 - - - 493 493 493 493 493 266 266 266 503 731 731 731 668 879 999 1154 - - - - - - - - - - - - - - - - - - 204 204 204 204 204 264 115 385 629 629 887 1482 1684 2050 - 50 183 236 552 1084 1252 1698 - - - - - - - - 46 53 56 61 71 81 93 93
- - - - - - - - 18 65 80 108 166 221 289 368
- - - - - - - - - - - - - - - - 622 622 622 622 622 622 622 622 - - - - - - - - 426 307 307 307 234 - - - 493 493 493 493 493 266 266 266 503 731 731 731 668 835 835 989 - - - - - - - - - - - - - - - - - - 87 87 87 87 87 159 115 385 707 707 905 1667 2322 2639 - 50 271 293 634 1480 2207 2579 - - - - - - - - 46 53 56 61 71 81 93 93
- - - - - - - - 18 65 80 108 166 221 289 368
- - - - - - - - - - - - - - - -
Installed Capacity (MW)
Attachment D-1 E3 EPE Report Model Results June Page 10 of 34
Scenario Resource TypeSeparate System Planning (w H2) Nuclear (Palo Verde)
Nuclear (SMR)Gas - Steam TurbineGas - Combined CycleGas - Combustion TurbineBiomassGeothermalWindSolarBattery StorageImportsDemand ResponseHydrogenBTM SolarLoadExcess Generation
Low Load Growth Nuclear (Palo Verde)Nuclear (SMR)Gas - Steam TurbineGas - Combined CycleGas - Combustion TurbineBiomassGeothermalWindSolarBattery StorageImportsDemand ResponseHydrogenBTM SolarLoadExcess Generation
High Load Growth Nuclear (Palo Verde)Nuclear (SMR)Gas - Steam TurbineGas - Combined CycleGas - Combustion TurbineBiomassGeothermalWindSolarBattery StorageImportsDemand ResponseHydrogenBTM SolarLoadExcess Generation
2021 2024 2025 2027 2031 2035 2040 2045Installed Capacity (MW)
622 622 622 622 622 622 622 622 - - - - - - - - 426 307 307 307 234 - - - 493 493 493 493 493 266 266 266 503 731 731 731 668 825 825 989 - - - - - - - - - - - - - - - - - - 129 129 129 129 172 212 115 385 672 672 936 1290 1645 1990 - 50 269 291 601 1038 1420 1741 - - - - - - - - 46 53 56 61 71 81 93 93
- - - - - 121 195 206 18 65 80 108 166 221 289 368
- - - - - - - - - - - - - - - - 622 622 622 622 622 622 622 622 - - - - - - - - 426 307 307 307 234 - - - 493 493 493 493 493 266 266 266 503 731 731 731 668 847 989 1182 - - - - - - - - - - - - - - - - - - 96 96 96 96 96 153 115 385 541 541 743 1162 1216 1489 - 50 192 193 454 1012 1093 1257 - - - - - - - - 46 53 56 61 71 81 93 93
- - - - - - - - 18 65 80 108 166 221 289 368
- - - - - - - - - - - - - - - - 622 622 622 622 622 622 622 622 - - - - - - - - 426 307 307 307 234 - - - 493 493 493 493 493 266 266 266 503 731 731 731 668 1062 1237 1451 - - - - - - - - - - - - - - - - - - 123 123 123 123 123 266 115 385 677 677 1046 1309 1369 1660 - 50 249 342 716 1048 1136 1307 - - - - - - - - 46 53 56 61 71 81 93 93
- - - - - - - - 18 65 80 108 166 221 289 368
- - - - - - - - - - - - - - - -
Attachment D-1 E3 EPE Report Model Results June Page 11 of 34
Scenario Resource TypeHigh DG Nuclear (Palo Verde)
Nuclear (SMR)Gas - Steam TurbineGas - Combined CycleGas - Combustion TurbineBiomassGeothermalWindSolarBattery StorageImportsDemand ResponseHydrogenBTM SolarLoadExcess Generation
High DSM Nuclear (Palo Verde)Nuclear (SMR)Gas - Steam TurbineGas - Combined CycleGas - Combustion TurbineBiomassGeothermalWindSolarBattery StorageImportsDemand ResponseHydrogenBTM SolarLoadExcess Generation
No New Gas Nuclear (Palo Verde)Nuclear (SMR)Gas - Steam TurbineGas - Combined CycleGas - Combustion TurbineBiomassGeothermalWindSolarBattery StorageImportsDemand ResponseHydrogenBTM SolarLoadExcess Generation
2021 2024 2025 2027 2031 2035 2040 2045Installed Capacity (MW)
622 622 622 622 622 622 622 622 - - - - - - - - 426 307 307 307 234 - - - 493 493 493 493 493 266 266 266 503 731 731 731 668 942 1078 1322 - - - - - - - - - - - - - - - - - - 106 106 106 106 106 249 115 385 587 587 761 1011 1092 1023 - 50 183 252 571 1043 1151 1267 - - - - - - - - 46 53 56 61 71 81 93 93
- - - - - - - - 42 169 210 293 455 614 809 1032
- - - - - - - - - - - - - - - - 622 622 622 622 622 622 622 622 - - - - - - - - 426 307 307 307 234 - - - 493 493 493 493 493 266 266 266 503 731 731 731 668 801 926 1105 - - - - - - - - - - - - - - - - - - 70 70 70 70 70 127 115 385 558 558 641 1146 1189 1384 - 50 187 191 425 1000 1070 1209 - - - - - - - - 49 66 71 82 100 101 103 103
- - - - - - - - 18 65 80 108 166 221 289 368
- - - - - - - - - - - - - - - - 622 622 622 622 622 622 622 622 - - - - - - - - 426 307 307 307 234 - - - 493 493 493 493 493 266 266 266 503 731 731 731 668 668 668 668 - - - - - - - - - - - - - - - - - - 132 132 132 132 132 132 115 385 629 629 908 2129 2734 3644 - 50 183 251 573 1864 2496 3634 - - - - - - - - 46 53 56 61 71 81 93 93
- - - - - - - - 18 65 80 108 166 221 289 368
- - - - - - - - - - - - - - - -
Attachment D-1 E3 EPE Report Model Results June Page 12 of 34
Scenario Resource TypeNo Lifetime Extensions Nuclear (Palo Verde)
Nuclear (SMR)Gas - Steam TurbineGas - Combined CycleGas - Combustion TurbineBiomassGeothermalWindSolarBattery StorageImportsDemand ResponseHydrogenBTM SolarLoadExcess Generation
High Gas Price Nuclear (Palo Verde)Nuclear (SMR)Gas - Steam TurbineGas - Combined CycleGas - Combustion TurbineBiomassGeothermalWindSolarBattery StorageImportsDemand ResponseHydrogenBTM SolarLoadExcess Generation
Low Carbon Price Nuclear (Palo Verde)Nuclear (SMR)Gas - Steam TurbineGas - Combined CycleGas - Combustion TurbineBiomassGeothermalWindSolarBattery StorageImportsDemand ResponseHydrogenBTM SolarLoadExcess Generation
2021 2024 2025 2027 2031 2035 2040 2045Installed Capacity (MW)
622 622 622 622 622 622 622 622 - - - - - - - - 426 234 234 144 144 - - - 493 493 493 266 266 266 266 266 503 731 731 914 851 951 1109 1318 - - - - - - - - - - - - - - - - - - 118 118 118 118 118 196 115 385 769 769 1018 1235 1292 1579 - 50 230 434 743 1031 1115 1284 - - - - - - - - 46 53 56 61 71 81 93 93
- - - - - - - - 18 65 80 108 166 221 289 368
- - - - - - - - - - - - - - - - 622 622 622 622 622 622 622 622 - - - - - - - - 426 307 307 307 234 - - - 493 493 493 493 493 266 266 266 503 731 731 731 668 930 1088 1274 - - - - - - - - - - - - - - - - - - 142 142 142 142 142 264 115 385 629 629 905 1312 1369 1712 - 50 183 249 570 1047 1131 1312 - - - - - - - - 46 53 56 61 71 81 93 93
- - - - - - - - 18 65 80 108 166 221 289 368
- - - - - - - - - - - - - - - - 622 622 622 622 622 622 622 622 - - - - - - - - 426 307 307 307 234 - - - 493 493 493 493 493 266 266 266 503 731 731 731 668 920 1078 1267 - - - - - - - - - - - - - - - - - - 181 181 181 181 181 267 115 385 629 629 894 1312 1369 1747 - 50 183 240 559 1047 1131 1319 - - - - - - - - 46 53 56 61 71 81 93 93
- - - - - - - - 18 65 80 108 166 221 289 368
- - - - - - - - - - - - - - - -
Attachment D-1 E3 EPE Report Model Results June Page 13 of 34
Scenario Resource TypeMedium Carbon Price Nuclear (Palo Verde)
Nuclear (SMR)Gas - Steam TurbineGas - Combined CycleGas - Combustion TurbineBiomassGeothermalWindSolarBattery StorageImportsDemand ResponseHydrogenBTM SolarLoadExcess Generation
High Carbon Price Nuclear (Palo Verde)Nuclear (SMR)Gas - Steam TurbineGas - Combined CycleGas - Combustion TurbineBiomassGeothermalWindSolarBattery StorageImportsDemand ResponseHydrogenBTM SolarLoadExcess Generation
80 Clean by 2035 Nuclear (Palo Verde)Nuclear (SMR)Gas - Steam TurbineGas - Combined CycleGas - Combustion TurbineBiomassGeothermalWindSolarBattery StorageImportsDemand ResponseHydrogenBTM SolarLoadExcess Generation
2021 2024 2025 2027 2031 2035 2040 2045Installed Capacity (MW)
622 622 622 622 622 622 622 622 - - - - - - - - 426 307 307 307 234 - - - 493 493 493 493 493 266 266 266 503 731 731 731 668 909 1060 1248 - - - - - - - - - - - - - - - - - - 236 236 236 236 236 300 115 385 724 724 882 1312 1390 1813 - 50 183 228 547 1047 1136 1343 - - - - - - - - 46 53 56 61 71 81 93 93
- - - - - - - - 18 65 80 108 166 221 289 368
- - - - - - - - - - - - - - - - 622 622 622 622 622 622 622 622 - - - - - - - - 426 307 307 307 234 - - - 493 493 493 493 493 266 266 266 503 731 731 731 668 901 1001 1024 - - - - - - - - - - - - - - - - - - 300 300 300 300 300 301 115 385 927 927 972 1312 1640 2583 - 50 183 211 521 1047 1189 2082 - - - - - - - - 46 53 56 61 71 81 93 93
- - - - - - - - 18 65 80 108 166 221 289 368
- - - - - - - - - - - - - - - - 622 622 622 622 622 622 622 622 - - - - - - - - 426 307 307 307 234 - - - 493 493 493 493 493 266 266 266 503 731 731 731 668 938 1075 1253 - - - - - - - - - - - - - - - - - - 109 109 109 109 194 285 115 385 629 629 915 1312 1369 1805 - 50 183 256 580 1047 1131 1331 - - - - - - - - 46 53 56 61 71 81 93 93
- - - - - - - - 18 65 80 108 166 221 289 368
- - - - - - - - - - - - - - - -
Attachment D-1 E3 EPE Report Model Results June Page 14 of 34
Scenario Resource Type20 CO2 Red by 2040 Nuclear (Palo Verde)
Nuclear (SMR)Gas - Steam TurbineGas - Combined CycleGas - Combustion TurbineBiomassGeothermalWindSolarBattery StorageImportsDemand ResponseHydrogenBTM SolarLoadExcess Generation
40 CO2 Red by 2040 Nuclear (Palo Verde)Nuclear (SMR)Gas - Steam TurbineGas - Combined CycleGas - Combustion TurbineBiomassGeothermalWindSolarBattery StorageImportsDemand ResponseHydrogenBTM SolarLoadExcess Generation
60 CO2 Red by 2040 Nuclear (Palo Verde)Nuclear (SMR)Gas - Steam TurbineGas - Combined CycleGas - Combustion TurbineBiomassGeothermalWindSolarBattery StorageImportsDemand ResponseHydrogenBTM SolarLoadExcess Generation
2021 2024 2025 2027 2031 2035 2040 2045Installed Capacity (MW)
622 622 622 622 622 622 622 622 - - - - - - - - 426 307 307 307 234 - - - 493 493 493 493 493 266 266 266 503 731 731 731 668 952 1111 1270 - - - - - - - - - - - - - - - - - - 109 109 109 109 109 264 115 385 629 629 904 1242 1299 1733 - 50 183 256 582 1032 1116 1316 - - - - - - - - 46 53 56 61 71 81 93 93
- - - - - - - - 18 65 80 108 166 221 289 368
- - - - - - - - - - - - - - - - 622 622 622 622 622 622 622 622 - - - - - - - - 426 307 307 307 234 - - - 493 493 493 493 493 266 266 266 503 731 731 731 668 939 1064 1178 - - - - - - - - - - - - - - - - - - 109 109 109 109 221 300 115 385 629 629 915 1310 1390 2052 - 50 183 256 580 1045 1135 1573 - - - - - - - - 46 53 56 61 71 81 93 93
- - - - - - - - 18 65 80 108 166 221 289 368
- - - - - - - - - - - - - - - - 622 622 622 622 622 622 622 622 - - - - - - - - 426 307 307 307 234 - - - 493 493 493 493 493 266 266 266 503 731 731 731 668 938 987 1029 - - - - - - - - - - - - - - - - - - 109 109 109 109 300 301 115 385 629 629 915 1311 1822 2573 - 50 183 256 580 1046 1194 2062 - - - - - - - - 46 53 56 61 71 81 93 93
- - - - - - - - 18 65 80 108 166 221 289 368
- - - - - - - - - - - - - - - -
Attachment D-1 E3 EPE Report Model Results June Page 15 of 34
Scenario Resource Type80 CO2 Red by 2040 Nuclear (Palo Verde)
Nuclear (SMR)Gas - Steam TurbineGas - Combined CycleGas - Combustion TurbineBiomassGeothermalWindSolarBattery StorageImportsDemand ResponseHydrogenBTM SolarLoadExcess Generation
90 CO2 Red by 2040 Nuclear (Palo Verde)Nuclear (SMR)Gas - Steam TurbineGas - Combined CycleGas - Combustion TurbineBiomassGeothermalWindSolarBattery StorageImportsDemand ResponseHydrogenBTM SolarLoadExcess Generation
100 CO2 Red by 2040 Nuclear (Palo Verde)Nuclear (SMR)Gas - Steam TurbineGas - Combined CycleGas - Combustion TurbineBiomassGeothermalWindSolarBattery StorageImportsDemand ResponseHydrogenBTM SolarLoadExcess Generation
2021 2024 2025 2027 2031 2035 2040 2045Installed Capacity (MW)
622 622 622 622 622 622 622 622 - - - - - - - - 426 307 307 307 234 - - - 493 493 493 493 493 266 266 266 503 731 731 731 668 885 885 885 - - - - - - - - - - - - - - - - - - 192 192 192 192 507 507 115 385 629 629 891 1475 2226 3013 - 50 183 238 556 1080 1416 2455 - - - - - - - - 46 53 56 61 71 81 93 93
- - - - - - - - 18 65 80 108 166 221 289 368
- - - - - - - - - - - - - - - - 622 622 622 622 622 622 622 622 - - - - - - - - 426 307 307 307 234 - - - 493 493 493 493 493 266 266 266 503 731 731 731 668 819 819 819 - - - - - - - - - - - - - - - - - - 192 192 192 192 764 772 115 385 628 628 891 1681 2284 3081 - 50 183 238 556 1276 1601 2627 - - - - - - - - 46 53 56 61 71 81 93 93
- - - - - - - - 18 65 80 108 166 221 289 368
- - - - - - - - - - - - - - - - 622 622 622 622 622 622 622 622 - - - - - - - - 426 307 307 307 234 - - - 493 493 493 493 493 266 266 266 503 731 731 731 668 668 668 668 - - - - - - - - - - - - - - - - - - 132 132 132 132 1228 1605 115 385 629 629 908 2129 4851 5217 - 50 183 251 573 1864 6191 7470 - - - - - - - - 46 53 56 61 71 81 93 93
- - - - - - - - 18 65 80 108 166 221 298 701
- - - - - - - - - - - - - - - -
Attachment D-1 E3 EPE Report Model Results June Page 16 of 34
Scenario Resource Type100 CO2 Red by 2040 (w H2) Nuclear (Palo Verde)
Nuclear (SMR)Gas - Steam TurbineGas - Combined CycleGas - Combustion TurbineBiomassGeothermalWindSolarBattery StorageImportsDemand ResponseHydrogenBTM SolarLoadExcess Generation
2021 2024 2025 2027 2031 2035 2040 2045Installed Capacity (MW)
622 622 622 622 622 622 622 622 - - - - - - - - 426 307 307 307 234 - - - 493 493 493 493 493 266 - - 503 731 731 731 668 774 - - - - - - - - - - - - - - - - - - - - 231 231 231 231 687 687 115 385 628 628 883 1801 2353 3200 - 50 183 233 548 1403 1804 2864 - - - - - - - - 46 53 56 61 71 81 93 93
- - - - - - 1040 1040 18 65 80 108 166 221 289 368
- - - - - - - - - - - - - - - -
Attachment D-1 E3 EPE Report Model Results June Page 17 of 34
Scenario Resource TypeLeast-Cost (Reference Case) Nuclear (Palo Verde)
Nuclear (SMR)Gas - Steam TurbineGas - Combined CycleGas - Combustion TurbineBiomassGeothermalWindSolarBattery StorageImportsDemand ResponseHydrogenBTM SolarLoadExcess Generation
Least-Cost Case + ETA Resources Nuclear (Palo Verde)Nuclear (SMR)Gas - Steam TurbineGas - Combined CycleGas - Combustion TurbineBiomassGeothermalWindSolarBattery StorageImportsDemand ResponseHydrogenBTM SolarLoadExcess Generation
Separate System Planning Nuclear (Palo Verde)Nuclear (SMR)Gas - Steam TurbineGas - Combined CycleGas - Combustion TurbineBiomassGeothermalWindSolarBattery StorageImportsDemand ResponseHydrogenBTM SolarLoadExcess Generation
2021 2024 2025 2027 2031 2035 2040 2045- - - - - - - - - - - - - - - - - - - - - - - - - - - - - - - - - 228 228 228 228 512 671 878 - - - - - - - - - - - - - - - - - - 109 109 109 109 109 196 - 270 514 514 789 1196 1280 1842 - 50 183 256 582 1032 1116 1334 - - - - - - - - 46 53 56 61 71 81 93 93
- - - - - - - - 18 65 80 108 166 221 289 368
- - - - - - - - - - - - - - - - - - - - - - - - - - - - - - - - - - - - - - - - - - - - - - - - - 228 228 228 228 439 559 714 - - - - - - - - - - - - - - - - - - 204 204 204 204 204 264 - 270 514 514 772 1437 1666 2312 - 50 183 236 552 1084 1252 1748 - - - - - - - - 46 53 56 61 71 81 93 93
- - - - - - - - 18 65 80 108 166 221 289 368
- - - - - - - - - - - - - - - - - - - - - - - - - - - - - - - - - - - - - - - - - - - - - - - - - 228 228 228 228 395 395 549 - - - - - - - - - - - - - - - - - - 87 87 87 87 87 159 - 270 592 592 790 1622 2304 2901 - 50 271 293 634 1480 2207 2629 - - - - - - - - 46 53 56 61 71 81 93 93
- - - - - - - - 18 65 80 108 166 221 289 368
- - - - - - - - - - - - - - - -
Cumulative Capacity Additions (MW)
Attachment D-1 E3 EPE Report Model Results June Page 18 of 34
Scenario Resource TypeSeparate System Planning (w H2) Nuclear (Palo Verde)
Nuclear (SMR)Gas - Steam TurbineGas - Combined CycleGas - Combustion TurbineBiomassGeothermalWindSolarBattery StorageImportsDemand ResponseHydrogenBTM SolarLoadExcess Generation
Low Load Growth Nuclear (Palo Verde)Nuclear (SMR)Gas - Steam TurbineGas - Combined CycleGas - Combustion TurbineBiomassGeothermalWindSolarBattery StorageImportsDemand ResponseHydrogenBTM SolarLoadExcess Generation
High Load Growth Nuclear (Palo Verde)Nuclear (SMR)Gas - Steam TurbineGas - Combined CycleGas - Combustion TurbineBiomassGeothermalWindSolarBattery StorageImportsDemand ResponseHydrogenBTM SolarLoadExcess Generation
2021 2024 2025 2027 2031 2035 2040 2045Cumulative Capacity Additions (MW)
- - - - - - - - - - - - - - - - - - - - - - - - - - - - - - - - - 228 228 228 228 385 385 549 - - - - - - - - - - - - - - - - - - 129 129 129 129 172 212 - 270 557 557 821 1245 1627 2252 - 50 269 291 601 1038 1420 1791 - - - - - - - - 46 53 56 61 71 81 93 93
- - - - - 121 195 206 18 65 80 108 166 221 289 368
- - - - - - - - - - - - - - - - - - - - - - - - - - - - - - - - - - - - - - - - - - - - - - - - - 228 228 228 228 407 549 742 - - - - - - - - - - - - - - - - - - 96 96 96 96 96 153 - 270 426 426 628 1117 1198 1751 - 50 192 193 454 1012 1093 1307 - - - - - - - - 46 53 56 61 71 81 93 93
- - - - - - - - 18 65 80 108 166 221 289 368
- - - - - - - - - - - - - - - - - - - - - - - - - - - - - - - - - - - - - - - - - - - - - - - - - 228 228 228 228 622 797 1011 - - - - - - - - - - - - - - - - - - 123 123 123 123 123 266 - 270 562 562 931 1264 1351 1922 - 50 249 342 716 1048 1136 1357 - - - - - - - - 46 53 56 61 71 81 93 93
- - - - - - - - 18 65 80 108 166 221 289 368
- - - - - - - - - - - - - - - -
Attachment D-1 E3 EPE Report Model Results June Page 19 of 34
Scenario Resource TypeHigh DG Nuclear (Palo Verde)
Nuclear (SMR)Gas - Steam TurbineGas - Combined CycleGas - Combustion TurbineBiomassGeothermalWindSolarBattery StorageImportsDemand ResponseHydrogenBTM SolarLoadExcess Generation
High DSM Nuclear (Palo Verde)Nuclear (SMR)Gas - Steam TurbineGas - Combined CycleGas - Combustion TurbineBiomassGeothermalWindSolarBattery StorageImportsDemand ResponseHydrogenBTM SolarLoadExcess Generation
No New Gas Nuclear (Palo Verde)Nuclear (SMR)Gas - Steam TurbineGas - Combined CycleGas - Combustion TurbineBiomassGeothermalWindSolarBattery StorageImportsDemand ResponseHydrogenBTM SolarLoadExcess Generation
2021 2024 2025 2027 2031 2035 2040 2045Cumulative Capacity Additions (MW)
- - - - - - - - - - - - - - - - - - - - - - - - - - - - - - - - - 228 228 228 228 502 638 882 - - - - - - - - - - - - - - - - - - 106 106 106 106 106 249 - 270 472 472 646 966 1074 1285 - 50 183 252 571 1043 1151 1317 - - - - - - - - 46 53 56 61 71 81 93 93
- - - - - - - - 42 169 210 293 455 614 809 1032
- - - - - - - - - - - - - - - - - - - - - - - - - - - - - - - - - - - - - - - - - - - - - - - - - 228 228 228 228 361 486 665 - - - - - - - - - - - - - - - - - - 70 70 70 70 70 127 - 270 443 443 526 1101 1171 1646 - 50 187 191 425 1000 1070 1259 - - - - - - - - 49 66 71 82 100 101 103 103
- - - - - - - - 18 65 80 108 166 221 289 368
- - - - - - - - - - - - - - - - - - - - - - - - - - - - - - - - - - - - - - - - - - - - - - - - - 228 228 228 228 228 228 228 - - - - - - - - - - - - - - - - - - 132 132 132 132 132 132 - 270 514 514 793 2084 2716 3906 - 50 183 251 573 1864 2496 3684 - - - - - - - - 46 53 56 61 71 81 93 93
- - - - - - - - 18 65 80 108 166 221 289 368
- - - - - - - - - - - - - - - -
Attachment D-1 E3 EPE Report Model Results June Page 20 of 34
Scenario Resource TypeNo Lifetime Extensions Nuclear (Palo Verde)
Nuclear (SMR)Gas - Steam TurbineGas - Combined CycleGas - Combustion TurbineBiomassGeothermalWindSolarBattery StorageImportsDemand ResponseHydrogenBTM SolarLoadExcess Generation
High Gas Price Nuclear (Palo Verde)Nuclear (SMR)Gas - Steam TurbineGas - Combined CycleGas - Combustion TurbineBiomassGeothermalWindSolarBattery StorageImportsDemand ResponseHydrogenBTM SolarLoadExcess Generation
Low Carbon Price Nuclear (Palo Verde)Nuclear (SMR)Gas - Steam TurbineGas - Combined CycleGas - Combustion TurbineBiomassGeothermalWindSolarBattery StorageImportsDemand ResponseHydrogenBTM SolarLoadExcess Generation
2021 2024 2025 2027 2031 2035 2040 2045Cumulative Capacity Additions (MW)
- - - - - - - - - - - - - - - - - - - - - - - - - - - - - - - - - 228 228 411 411 511 669 878 - - - - - - - - - - - - - - - - - - 118 118 118 118 118 196 - 270 654 654 903 1190 1274 1841 - 50 230 434 743 1031 1115 1334 - - - - - - - - 46 53 56 61 71 81 93 93
- - - - - - - - 18 65 80 108 166 221 289 368
- - - - - - - - - - - - - - - - - - - - - - - - - - - - - - - - - - - - - - - - - - - - - - - - - 228 228 228 228 490 648 834 - - - - - - - - - - - - - - - - - - 142 142 142 142 142 264 - 270 514 514 790 1267 1351 1974 - 50 183 249 570 1047 1131 1362 - - - - - - - - 46 53 56 61 71 81 93 93
- - - - - - - - 18 65 80 108 166 221 289 368
- - - - - - - - - - - - - - - - - - - - - - - - - - - - - - - - - - - - - - - - - - - - - - - - - 228 228 228 228 480 638 827 - - - - - - - - - - - - - - - - - - 181 181 181 181 181 267 - 270 514 514 779 1267 1351 2009 - 50 183 240 559 1047 1131 1369 - - - - - - - - 46 53 56 61 71 81 93 93
- - - - - - - - 18 65 80 108 166 221 289 368
- - - - - - - - - - - - - - - -
Attachment D-1 E3 EPE Report Model Results June Page 21 of 34
Scenario Resource TypeMedium Carbon Price Nuclear (Palo Verde)
Nuclear (SMR)Gas - Steam TurbineGas - Combined CycleGas - Combustion TurbineBiomassGeothermalWindSolarBattery StorageImportsDemand ResponseHydrogenBTM SolarLoadExcess Generation
High Carbon Price Nuclear (Palo Verde)Nuclear (SMR)Gas - Steam TurbineGas - Combined CycleGas - Combustion TurbineBiomassGeothermalWindSolarBattery StorageImportsDemand ResponseHydrogenBTM SolarLoadExcess Generation
80 Clean by 2035 Nuclear (Palo Verde)Nuclear (SMR)Gas - Steam TurbineGas - Combined CycleGas - Combustion TurbineBiomassGeothermalWindSolarBattery StorageImportsDemand ResponseHydrogenBTM SolarLoadExcess Generation
2021 2024 2025 2027 2031 2035 2040 2045Cumulative Capacity Additions (MW)
- - - - - - - - - - - - - - - - - - - - - - - - - - - - - - - - - 228 228 228 228 469 620 808 - - - - - - - - - - - - - - - - - - 236 236 236 236 236 300 - 270 609 609 767 1267 1372 2075 - 50 183 228 547 1047 1136 1393 - - - - - - - - 46 53 56 61 71 81 93 93
- - - - - - - - 18 65 80 108 166 221 289 368
- - - - - - - - - - - - - - - - - - - - - - - - - - - - - - - - - - - - - - - - - - - - - - - - - 228 228 228 228 461 561 584 - - - - - - - - - - - - - - - - - - 300 300 300 300 300 301 - 270 812 812 857 1267 1622 2845 - 50 183 211 521 1047 1189 2132 - - - - - - - - 46 53 56 61 71 81 93 93
- - - - - - - - 18 65 80 108 166 221 289 368
- - - - - - - - - - - - - - - - - - - - - - - - - - - - - - - - - - - - - - - - - - - - - - - - - 228 228 228 228 498 635 813 - - - - - - - - - - - - - - - - - - 109 109 109 109 194 285 - 270 514 514 800 1267 1351 2067 - 50 183 256 580 1047 1131 1381 - - - - - - - - 46 53 56 61 71 81 93 93
- - - - - - - - 18 65 80 108 166 221 289 368
- - - - - - - - - - - - - - - -
Attachment D-1 E3 EPE Report Model Results June Page 22 of 34
Scenario Resource Type20 CO2 Red by 2040 Nuclear (Palo Verde)
Nuclear (SMR)Gas - Steam TurbineGas - Combined CycleGas - Combustion TurbineBiomassGeothermalWindSolarBattery StorageImportsDemand ResponseHydrogenBTM SolarLoadExcess Generation
40 CO2 Red by 2040 Nuclear (Palo Verde)Nuclear (SMR)Gas - Steam TurbineGas - Combined CycleGas - Combustion TurbineBiomassGeothermalWindSolarBattery StorageImportsDemand ResponseHydrogenBTM SolarLoadExcess Generation
60 CO2 Red by 2040 Nuclear (Palo Verde)Nuclear (SMR)Gas - Steam TurbineGas - Combined CycleGas - Combustion TurbineBiomassGeothermalWindSolarBattery StorageImportsDemand ResponseHydrogenBTM SolarLoadExcess Generation
2021 2024 2025 2027 2031 2035 2040 2045Cumulative Capacity Additions (MW)
- - - - - - - - - - - - - - - - - - - - - - - - - - - - - - - - - 228 228 228 228 512 671 830 - - - - - - - - - - - - - - - - - - 109 109 109 109 109 264 - 270 514 514 789 1197 1281 1995 - 50 183 256 582 1032 1116 1366 - - - - - - - - 46 53 56 61 71 81 93 93
- - - - - - - - 18 65 80 108 166 221 289 368
- - - - - - - - - - - - - - - - - - - - - - - - - - - - - - - - - - - - - - - - - - - - - - - - - 228 228 228 228 499 624 738 - - - - - - - - - - - - - - - - - - 109 109 109 109 221 300 - 270 514 514 800 1265 1372 2314 - 50 183 256 580 1045 1135 1623 - - - - - - - - 46 53 56 61 71 81 93 93
- - - - - - - - 18 65 80 108 166 221 289 368
- - - - - - - - - - - - - - - - - - - - - - - - - - - - - - - - - - - - - - - - - - - - - - - - - 228 228 228 228 498 547 589 - - - - - - - - - - - - - - - - - - 109 109 109 109 300 301 - 270 514 514 800 1266 1804 2835 - 50 183 256 580 1046 1194 2112 - - - - - - - - 46 53 56 61 71 81 93 93
- - - - - - - - 18 65 80 108 166 221 289 368
- - - - - - - - - - - - - - - -
Attachment D-1 E3 EPE Report Model Results June Page 23 of 34
Scenario Resource Type80 CO2 Red by 2040 Nuclear (Palo Verde)
Nuclear (SMR)Gas - Steam TurbineGas - Combined CycleGas - Combustion TurbineBiomassGeothermalWindSolarBattery StorageImportsDemand ResponseHydrogenBTM SolarLoadExcess Generation
90 CO2 Red by 2040 Nuclear (Palo Verde)Nuclear (SMR)Gas - Steam TurbineGas - Combined CycleGas - Combustion TurbineBiomassGeothermalWindSolarBattery StorageImportsDemand ResponseHydrogenBTM SolarLoadExcess Generation
100 CO2 Red by 2040 Nuclear (Palo Verde)Nuclear (SMR)Gas - Steam TurbineGas - Combined CycleGas - Combustion TurbineBiomassGeothermalWindSolarBattery StorageImportsDemand ResponseHydrogenBTM SolarLoadExcess Generation
2021 2024 2025 2027 2031 2035 2040 2045Cumulative Capacity Additions (MW)
- - - - - - - - - - - - - - - - - - - - - - - - - - - - - - - - - 228 228 228 228 445 445 445 - - - - - - - - - - - - - - - - - - 192 192 192 192 507 507 - 270 514 514 776 1430 2208 3275 - 50 183 238 556 1080 1416 2505 - - - - - - - - 46 53 56 61 71 81 93 93
- - - - - - - - 18 65 80 108 166 221 289 368
- - - - - - - - - - - - - - - - - - - - - - - - - - - - - - - - - - - - - - - - - - - - - - - - - 228 228 228 228 379 379 379 - - - - - - - - - - - - - - - - - - 192 192 192 192 764 772 - 270 513 513 776 1636 2266 3343 - 50 183 238 556 1276 1601 2677 - - - - - - - - 46 53 56 61 71 81 93 93
- - - - - - - - 18 65 80 108 166 221 289 368
- - - - - - - - - - - - - - - - - - - - - - - - - - - - - - - - - - - - - - - - - - - - - - - - - 228 228 228 228 228 228 228 - - - - - - - - - - - - - - - - - - 132 132 132 132 1228 1605 - 270 514 514 793 2084 4833 5479 - 50 183 251 573 1864 6191 7470 - - - - - - - - 46 53 56 61 71 81 93 93
- - - - - - - - 18 65 80 108 166 221 298 701
- - - - - - - - - - - - - - - -
Attachment D-1 E3 EPE Report Model Results June Page 24 of 34
Scenario Resource Type100 CO2 Red by 2040 (w H2) Nuclear (Palo Verde)
Nuclear (SMR)Gas - Steam TurbineGas - Combined CycleGas - Combustion TurbineBiomassGeothermalWindSolarBattery StorageImportsDemand ResponseHydrogenBTM SolarLoadExcess Generation
2021 2024 2025 2027 2031 2035 2040 2045Cumulative Capacity Additions (MW)
- - - - - - - - - - - - - - - - - - - - - - - - - - - - - - - - - 228 228 228 228 334 - - - - - - - - - - - - - - - - - - - - 231 231 231 231 687 687 - 270 513 513 768 1756 2335 3462 - 50 183 233 548 1403 1804 2914 - - - - - - - - 46 53 56 61 71 81 93 93
- - - - - - 334 334 18 65 80 108 166 221 289 368
- - - - - - - - - - - - - - - -
Attachment D-1 E3 EPE Report Model Results June Page 25 of 34
Scenario Resource TypeLeast-Cost (Reference Case) Nuclear (Palo Verde)
Nuclear (SMR)Gas - Steam TurbineGas - Combined CycleGas - Combustion TurbineBiomassGeothermalWindSolarBattery StorageImportsDemand ResponseHydrogenBTM SolarLoadExcess Generation
Least-Cost Case + ETA Resources Nuclear (Palo Verde)Nuclear (SMR)Gas - Steam TurbineGas - Combined CycleGas - Combustion TurbineBiomassGeothermalWindSolarBattery StorageImportsDemand ResponseHydrogenBTM SolarLoadExcess Generation
Separate System Planning Nuclear (Palo Verde)Nuclear (SMR)Gas - Steam TurbineGas - Combined CycleGas - Combustion TurbineBiomassGeothermalWindSolarBattery StorageImportsDemand ResponseHydrogenBTM SolarLoadExcess Generation
2021 2024 2025 2027 2031 2035 2040 2045- - - - - - - - - - - - - - - - - (119) (119) (119) (192) (426) (426) (426) - - - - - (227) (227) (227) - - - - (63) (63) (63) (63) - - - - - - - - - - - - - - - - - - - - - - - - - - - - - (70) (97) (377) - - - - - - - (50) - - - - - - - - - - - - - - - - - - - - - - - - - - - - - - - - - - - - - - - - - - - - - - - - - - - - - - - - - - - - - - - - - (119) (119) (119) (192) (426) (426) (426) - - - - - (227) (227) (227) - - - - (63) (63) (63) (63) - - - - - - - - - - - - - - - - - - - - - - - - - - - - - (70) (97) (377) - - - - - - - (50) - - - - - - - - - - - - - - - - - - - - - - - - - - - - - - - - - - - - - - - - - - - - - - - - - - - - - - - - - - - - - - - - - (119) (119) (119) (192) (426) (426) (426) - - - - - (227) (227) (227) - - - - (63) (63) (63) (63) - - - - - - - - - - - - - - - - - - - - - - - - - - - - - (70) (97) (377) - - - - - - - (50) - - - - - - - - - - - - - - - - - - - - - - - - - - - - - - - - - - - - - - - - - - - - - - - -
Cumulative Capacity Retirements (MW)
Attachment D-1 E3 EPE Report Model Results June Page 26 of 34
Scenario Resource TypeSeparate System Planning (w H2) Nuclear (Palo Verde)
Nuclear (SMR)Gas - Steam TurbineGas - Combined CycleGas - Combustion TurbineBiomassGeothermalWindSolarBattery StorageImportsDemand ResponseHydrogenBTM SolarLoadExcess Generation
Low Load Growth Nuclear (Palo Verde)Nuclear (SMR)Gas - Steam TurbineGas - Combined CycleGas - Combustion TurbineBiomassGeothermalWindSolarBattery StorageImportsDemand ResponseHydrogenBTM SolarLoadExcess Generation
High Load Growth Nuclear (Palo Verde)Nuclear (SMR)Gas - Steam TurbineGas - Combined CycleGas - Combustion TurbineBiomassGeothermalWindSolarBattery StorageImportsDemand ResponseHydrogenBTM SolarLoadExcess Generation
2021 2024 2025 2027 2031 2035 2040 2045Cumulative Capacity Retirements (MW)
- - - - - - - - - - - - - - - - - (119) (119) (119) (192) (426) (426) (426) - - - - - (227) (227) (227) - - - - (63) (63) (63) (63) - - - - - - - - - - - - - - - - - - - - - - - - - - - - - (70) (97) (377) - - - - - - - (50) - - - - - - - - - - - - - - - - - - - - - - - - - - - - - - - - - - - - - - - - - - - - - - - - - - - - - - - - - - - - - - - - - (119) (119) (119) (192) (426) (426) (426) - - - - - (227) (227) (227) - - - - (63) (63) (63) (63) - - - - - - - - - - - - - - - - - - - - - - - - - - - - - (70) (97) (377) - - - - - - - (50) - - - - - - - - - - - - - - - - - - - - - - - - - - - - - - - - - - - - - - - - - - - - - - - - - - - - - - - - - - - - - - - - - (119) (119) (119) (192) (426) (426) (426) - - - - - (227) (227) (227) - - - - (63) (63) (63) (63) - - - - - - - - - - - - - - - - - - - - - - - - - - - - - (70) (97) (377) - - - - - - - (50) - - - - - - - - - - - - - - - - - - - - - - - - - - - - - - - - - - - - - - - - - - - - - - - -
Attachment D-1 E3 EPE Report Model Results June Page 27 of 34
Scenario Resource TypeHigh DG Nuclear (Palo Verde)
Nuclear (SMR)Gas - Steam TurbineGas - Combined CycleGas - Combustion TurbineBiomassGeothermalWindSolarBattery StorageImportsDemand ResponseHydrogenBTM SolarLoadExcess Generation
High DSM Nuclear (Palo Verde)Nuclear (SMR)Gas - Steam TurbineGas - Combined CycleGas - Combustion TurbineBiomassGeothermalWindSolarBattery StorageImportsDemand ResponseHydrogenBTM SolarLoadExcess Generation
No New Gas Nuclear (Palo Verde)Nuclear (SMR)Gas - Steam TurbineGas - Combined CycleGas - Combustion TurbineBiomassGeothermalWindSolarBattery StorageImportsDemand ResponseHydrogenBTM SolarLoadExcess Generation
2021 2024 2025 2027 2031 2035 2040 2045Cumulative Capacity Retirements (MW)
- - - - - - - - - - - - - - - - - (119) (119) (119) (192) (426) (426) (426) - - - - - (227) (227) (227) - - - - (63) (63) (63) (63) - - - - - - - - - - - - - - - - - - - - - - - - - - - - - (70) (97) (377) - - - - - - - (50) - - - - - - - - - - - - - - - - - - - - - - - - - - - - - - - - - - - - - - - - - - - - - - - - - - - - - - - - - - - - - - - - - (119) (119) (119) (192) (426) (426) (426) - - - - - (227) (227) (227) - - - - (63) (63) (63) (63) - - - - - - - - - - - - - - - - - - - - - - - - - - - - - (70) (97) (377) - - - - - - - (50) - - - - - - - - - - - - - - - - - - - - - - - - - - - - - - - - - - - - - - - - - - - - - - - - - - - - - - - - - - - - - - - - - (119) (119) (119) (192) (426) (426) (426) - - - - - (227) (227) (227) - - - - (63) (63) (63) (63) - - - - - - - - - - - - - - - - - - - - - - - - - - - - - (70) (97) (377) - - - - - - - (50) - - - - - - - - - - - - - - - - - - - - - - - - - - - - - - - - - - - - - - - - - - - - - - - -
Attachment D-1 E3 EPE Report Model Results June Page 28 of 34
Scenario Resource TypeNo Lifetime Extensions Nuclear (Palo Verde)
Nuclear (SMR)Gas - Steam TurbineGas - Combined CycleGas - Combustion TurbineBiomassGeothermalWindSolarBattery StorageImportsDemand ResponseHydrogenBTM SolarLoadExcess Generation
High Gas Price Nuclear (Palo Verde)Nuclear (SMR)Gas - Steam TurbineGas - Combined CycleGas - Combustion TurbineBiomassGeothermalWindSolarBattery StorageImportsDemand ResponseHydrogenBTM SolarLoadExcess Generation
Low Carbon Price Nuclear (Palo Verde)Nuclear (SMR)Gas - Steam TurbineGas - Combined CycleGas - Combustion TurbineBiomassGeothermalWindSolarBattery StorageImportsDemand ResponseHydrogenBTM SolarLoadExcess Generation
2021 2024 2025 2027 2031 2035 2040 2045Cumulative Capacity Retirements (MW)
- - - - - - - - - - - - - - - - - (192) (192) (282) (282) (426) (426) (426) - - - (227) (227) (227) (227) (227) - - - - (63) (63) (63) (63) - - - - - - - - - - - - - - - - - - - - - - - - - - - - - (70) (97) (377) - - - - - - - (50) - - - - - - - - - - - - - - - - - - - - - - - - - - - - - - - - - - - - - - - - - - - - - - - - - - - - - - - - - - - - - - - - - (119) (119) (119) (192) (426) (426) (426) - - - - - (227) (227) (227) - - - - (63) (63) (63) (63) - - - - - - - - - - - - - - - - - - - - - - - - - - - - - (70) (97) (377) - - - - - - - (50) - - - - - - - - - - - - - - - - - - - - - - - - - - - - - - - - - - - - - - - - - - - - - - - - - - - - - - - - - - - - - - - - - (119) (119) (119) (192) (426) (426) (426) - - - - - (227) (227) (227) - - - - (63) (63) (63) (63) - - - - - - - - - - - - - - - - - - - - - - - - - - - - - (70) (97) (377) - - - - - - - (50) - - - - - - - - - - - - - - - - - - - - - - - - - - - - - - - - - - - - - - - - - - - - - - - -
Attachment D-1 E3 EPE Report Model Results June Page 29 of 34
Scenario Resource TypeMedium Carbon Price Nuclear (Palo Verde)
Nuclear (SMR)Gas - Steam TurbineGas - Combined CycleGas - Combustion TurbineBiomassGeothermalWindSolarBattery StorageImportsDemand ResponseHydrogenBTM SolarLoadExcess Generation
High Carbon Price Nuclear (Palo Verde)Nuclear (SMR)Gas - Steam TurbineGas - Combined CycleGas - Combustion TurbineBiomassGeothermalWindSolarBattery StorageImportsDemand ResponseHydrogenBTM SolarLoadExcess Generation
80 Clean by 2035 Nuclear (Palo Verde)Nuclear (SMR)Gas - Steam TurbineGas - Combined CycleGas - Combustion TurbineBiomassGeothermalWindSolarBattery StorageImportsDemand ResponseHydrogenBTM SolarLoadExcess Generation
2021 2024 2025 2027 2031 2035 2040 2045Cumulative Capacity Retirements (MW)
- - - - - - - - - - - - - - - - - (119) (119) (119) (192) (426) (426) (426) - - - - - (227) (227) (227) - - - - (63) (63) (63) (63) - - - - - - - - - - - - - - - - - - - - - - - - - - - - - (70) (97) (377) - - - - - - - (50) - - - - - - - - - - - - - - - - - - - - - - - - - - - - - - - - - - - - - - - - - - - - - - - - - - - - - - - - - - - - - - - - - (119) (119) (119) (192) (426) (426) (426) - - - - - (227) (227) (227) - - - - (63) (63) (63) (63) - - - - - - - - - - - - - - - - - - - - - - - - - - - - - (70) (97) (377) - - - - - - - (50) - - - - - - - - - - - - - - - - - - - - - - - - - - - - - - - - - - - - - - - - - - - - - - - - - - - - - - - - - - - - - - - - - (119) (119) (119) (192) (426) (426) (426) - - - - - (227) (227) (227) - - - - (63) (63) (63) (63) - - - - - - - - - - - - - - - - - - - - - - - - - - - - - (70) (97) (377) - - - - - - - (50) - - - - - - - - - - - - - - - - - - - - - - - - - - - - - - - - - - - - - - - - - - - - - - - -
Attachment D-1 E3 EPE Report Model Results June Page 30 of 34
Scenario Resource Type20 CO2 Red by 2040 Nuclear (Palo Verde)
Nuclear (SMR)Gas - Steam TurbineGas - Combined CycleGas - Combustion TurbineBiomassGeothermalWindSolarBattery StorageImportsDemand ResponseHydrogenBTM SolarLoadExcess Generation
40 CO2 Red by 2040 Nuclear (Palo Verde)Nuclear (SMR)Gas - Steam TurbineGas - Combined CycleGas - Combustion TurbineBiomassGeothermalWindSolarBattery StorageImportsDemand ResponseHydrogenBTM SolarLoadExcess Generation
60 CO2 Red by 2040 Nuclear (Palo Verde)Nuclear (SMR)Gas - Steam TurbineGas - Combined CycleGas - Combustion TurbineBiomassGeothermalWindSolarBattery StorageImportsDemand ResponseHydrogenBTM SolarLoadExcess Generation
2021 2024 2025 2027 2031 2035 2040 2045Cumulative Capacity Retirements (MW)
- - - - - - - - - - - - - - - - - (119) (119) (119) (192) (426) (426) (426) - - - - - (227) (227) (227) - - - - (63) (63) (63) (63) - - - - - - - - - - - - - - - - - - - - - - - - - - - - - (70) (97) (377) - - - - - - - (50) - - - - - - - - - - - - - - - - - - - - - - - - - - - - - - - - - - - - - - - - - - - - - - - - - - - - - - - - - - - - - - - - - (119) (119) (119) (192) (426) (426) (426) - - - - - (227) (227) (227) - - - - (63) (63) (63) (63) - - - - - - - - - - - - - - - - - - - - - - - - - - - - - (70) (97) (377) - - - - - - - (50) - - - - - - - - - - - - - - - - - - - - - - - - - - - - - - - - - - - - - - - - - - - - - - - - - - - - - - - - - - - - - - - - - (119) (119) (119) (192) (426) (426) (426) - - - - - (227) (227) (227) - - - - (63) (63) (63) (63) - - - - - - - - - - - - - - - - - - - - - - - - - - - - - (70) (97) (377) - - - - - - - (50) - - - - - - - - - - - - - - - - - - - - - - - - - - - - - - - - - - - - - - - - - - - - - - - -
Attachment D-1 E3 EPE Report Model Results June Page 31 of 34
Scenario Resource Type80 CO2 Red by 2040 Nuclear (Palo Verde)
Nuclear (SMR)Gas - Steam TurbineGas - Combined CycleGas - Combustion TurbineBiomassGeothermalWindSolarBattery StorageImportsDemand ResponseHydrogenBTM SolarLoadExcess Generation
90 CO2 Red by 2040 Nuclear (Palo Verde)Nuclear (SMR)Gas - Steam TurbineGas - Combined CycleGas - Combustion TurbineBiomassGeothermalWindSolarBattery StorageImportsDemand ResponseHydrogenBTM SolarLoadExcess Generation
100 CO2 Red by 2040 Nuclear (Palo Verde)Nuclear (SMR)Gas - Steam TurbineGas - Combined CycleGas - Combustion TurbineBiomassGeothermalWindSolarBattery StorageImportsDemand ResponseHydrogenBTM SolarLoadExcess Generation
2021 2024 2025 2027 2031 2035 2040 2045Cumulative Capacity Retirements (MW)
- - - - - - - - - - - - - - - - - (119) (119) (119) (192) (426) (426) (426) - - - - - (227) (227) (227) - - - - (63) (63) (63) (63) - - - - - - - - - - - - - - - - - - - - - - - - - - - - - (70) (97) (377) - - - - - - - (50) - - - - - - - - - - - - - - - - - - - - - - - - - - - - - - - - - - - - - - - - - - - - - - - - - - - - - - - - - - - - - - - - - (119) (119) (119) (192) (426) (426) (426) - - - - - (227) (227) (227) - - - - (63) (63) (63) (63) - - - - - - - - - - - - - - - - - - - - - - - - - - - - - (70) (97) (377) - - - - - - - (50) - - - - - - - - - - - - - - - - - - - - - - - - - - - - - - - - - - - - - - - - - - - - - - - - - - - - - - - - - - - - - - - - - (119) (119) (119) (192) (426) (426) (426) - - - - - (227) (227) (227) - - - - (63) (63) (63) (63) - - - - - - - - - - - - - - - - - - - - - - - - - - - - - (70) (97) (377) - - - - - - - (50) - - - - - - - - - - - - - - - - - - - - - - - - - - - - - - - - - - - - - - - - - - - - - - - -
Attachment D-1 E3 EPE Report Model Results June Page 32 of 34
Scenario Resource Type100 CO2 Red by 2040 (w H2) Nuclear (Palo Verde)
Nuclear (SMR)Gas - Steam TurbineGas - Combined CycleGas - Combustion TurbineBiomassGeothermalWindSolarBattery StorageImportsDemand ResponseHydrogenBTM SolarLoadExcess Generation
2021 2024 2025 2027 2031 2035 2040 2045Cumulative Capacity Retirements (MW)
- - - - - - - - - - - - - - - - - (119) (119) (119) (192) (426) (426) (426) - - - - - (227) (227) (227) - - - - (63) (63) (63) (63) - - - - - - - - - - - - - - - - - - - - - - - - - - - - - (70) (97) (377) - - - - - - - (50) - - - - - - - - - - - - - - - - - - - - - - - - - - - - - - - - - - - - - - - - - - - - - - - -
Attachment D-1 E3 EPE Report Model Results June Page 33 of 34
Scenario 2021 2024 2025 2027 2031 2035 2040 2045Least-Cost (Reference Case) 246$ 233$ 246$ 265$ 290$ 351$ 409$ 512$ Least-Cost Case + ETA Resources 246$ 233$ 249$ 266$ 291$ 356$ 412$ 519$ Separate System Planning 247$ 234$ 252$ 269$ 295$ 376$ 471$ 577$ Separate System Planning (w H2) 247$ 234$ 252$ 269$ 294$ 355$ 438$ 543$ Low Load Growth 239$ 227$ 239$ 255$ 275$ 327$ 380$ 478$ High Load Growth 253$ 239$ 256$ 277$ 307$ 377$ 439$ 546$ High DG 245$ 231$ 243$ 261$ 283$ 336$ 388$ 482$ High DSM 245$ 230$ 241$ 256$ 272$ 317$ 364$ 454$ No New Gas 246$ 233$ 247$ 265$ 290$ 394$ 470$ 601$ No Lifetime Extensions 246$ 228$ 246$ 276$ 307$ 354$ 412$ 515$ High Gas Price 257$ 242$ 252$ 272$ 297$ 358$ 418$ 522$ Low Carbon Price 291$ 277$ 285$ 304$ 329$ 390$ 450$ 556$ Medium Carbon Price 358$ 341$ 342$ 361$ 386$ 447$ 512$ 623$ High Carbon Price 469$ 449$ 433$ 452$ 478$ 539$ 609$ 730$ 80 Clean by 2035 246$ 233$ 246$ 265$ 290$ 352$ 409$ 512$ 20 CO2 Red by 2040 246$ 233$ 246$ 265$ 290$ 351$ 409$ 511$ 40 CO2 Red by 2040 246$ 233$ 246$ 265$ 290$ 352$ 409$ 519$ 60 CO2 Red by 2040 246$ 233$ 246$ 265$ 290$ 352$ 421$ 537$ 80 CO2 Red by 2040 246$ 233$ 248$ 266$ 290$ 356$ 464$ 580$ 90 CO2 Red by 2040 246$ 233$ 248$ 266$ 290$ 366$ 503$ 620$ 100 CO2 Red by 2040 246$ 233$ 247$ 265$ 290$ 394$ 1102$ 1269$ 100 CO2 Red by 2040 (w H2) 246$ 233$ 250$ 267$ 291$ 375$ 561$ 675$
Annual Revenue Requirement ($M)
Attachment D-1 E3 EPE Report Model Results June Page 34 of 34
Scenario Clean Energy Type 2021 2024 2025 2027 2031 2035 2040 2045Least-Cost (Reference Case) Renewable 4 12 22 23 28 35 36 40
Zero Carbon 62 68 77 76 79 81 77 75Least-Cost Case + ETA Resources Renewable 4 12 25 26 32 39 42 48
Zero Carbon 62 68 80 79 82 86 83 83Separate System Planning Renewable 4 12 23 23 28 39 42 46
Zero Carbon 62 68 78 77 78 85 83 81Separate System Planning (w H2) Renewable 4 12 24 24 29 36 41 45
Zero Carbon 62 68 79 78 80 82 83 80Low Load Growth Renewable 4 12 20 20 25 34 35 38
Zero Carbon 64 70 77 76 77 82 77 75High Load Growth Renewable 4 12 23 24 31 36 36 41
Zero Carbon 61 66 77 76 80 80 76 75High DG Renewable 4 13 22 24 29 35 37 40
Zero Carbon 63 70 78 77 79 82 78 76High DSM Renewable 4 12 19 20 23 33 34 37
Zero Carbon 63 69 76 75 75 82 78 75No New Gas Renewable 4 12 22 23 29 44 51 58
Zero Carbon 62 68 78 77 79 90 91 93No Lifetime Extensions Renewable 4 12 24 26 31 35 36 40
Zero Carbon 62 68 80 80 81 81 77 75High Gas Price Renewable 4 12 23 24 29 36 37 43
Zero Carbon 62 68 78 78 80 83 78 78Low Carbon Price Renewable 4 12 24 25 31 37 38 43
Zero Carbon 62 68 80 79 81 84 79 79Medium Carbon Price Renewable 4 12 27 28 33 39 41 46
Zero Carbon 62 68 83 82 83 86 82 81High Carbon Price Renewable 4 12 31 32 35 41 45 54
Zero Carbon 62 68 86 86 85 87 86 8980 Clean by 2035 Renewable 4 12 22 23 29 36 39 45
Zero Carbon 62 68 77 76 79 82 80 8020 CO2 Red by 2040 Renewable 4 12 22 23 29 35 36 43
Zero Carbon 62 68 77 76 79 81 77 7940 CO2 Red by 2040 Renewable 4 12 22 23 29 36 40 49
Zero Carbon 62 68 77 76 79 82 81 8460 CO2 Red by 2040 Renewable 4 12 22 23 29 35 46 54
Zero Carbon 62 68 77 76 79 82 87 8980 CO2 Red by 2040 Renewable 4 12 24 25 31 39 53 59
Zero Carbon 62 68 80 79 81 86 93 9490 CO2 Red by 2040 Renewable 4 12 24 25 31 42 56 62
Zero Carbon 62 68 80 79 81 88 97 97100 CO2 Red by 2040 Renewable 4 12 22 23 29 44 62 67
Zero Carbon 62 68 78 77 79 90 100 100100 CO2 Red by 2040 (w H2) Renewable 4 12 25 26 32 45 56 62
Zero Carbon 62 68 81 80 83 91 100 100
Clean Energy ( of Load)
Portfolio Analysis Results612021
El Paso Electric IRP
Modeling Update
Arne Olson Senior PartnerJack Moore Director
Joe Hooker Senior Managing ConsultantHuai Jiang Senior Consultant
Manu Mogadali Senior ConsultantChen Zhang Consultant
Attachment D-2 E-3 June IRP Presentation Page 1 of 37
2Confidential Draft
Agenda
Assumption updates
Updated Reference Case results
High DSM sensitivity results
New Mexico REA Requirements
New Mexico REA Scenario Results
Attachment D-2 E-3 June IRP Presentation Page 2 of 37
Assumption Updates
Attachment D-2 E-3 June IRP Presentation Page 3 of 37
4Confidential Draft
Unit Lifetime Extensions
E3 modeled unit lifetime extensions for the following units that are currently scheduled to retire prior to 2030
In the modeling unit extensions for Rio Grande 7 and Newman 2 are not selected but the other unit extensions are
Resource Planned Retirement Year
Extension Period
Capital + Fixed OampM
(2021 $kW-yr)Rio Grande 7 2022 5 years $11373Newman 1 2022 5 years $7859Newman 2 2022 5 years $7998Newman 3 2026 5 years $5812Newman 4 2026 5 years $4744
Attachment D-2 E-3 June IRP Presentation Page 4 of 37
5Confidential Draft
Planning Reserve Margin
The modeling assumes a 2-day-in-10-year reliability standard for 2025 as a transition to the more common 1-day-in-10-year reliability standard starting in 2030
Under this PRM all generators count toward the PRM based on their effective load carrying capability (ELCC)
Metric 2025 2030+
Reliability TargetTwo days with outages
every ten years on average (02 LOLE)
One day with outages every ten years on average (01 LOLE)
Target PCAP PRM 101 129
LOLE = Loss-of-Load Expectation PCAP = Perfect Capacity
Attachment D-2 E-3 June IRP Presentation Page 5 of 37
Updated Reference Case
Results
Attachment D-2 E-3 June IRP Presentation Page 6 of 37
7Confidential Draft
Scenarios and Sensitivities
Run Note Presented Previously
Presented Today
Least-Cost (Reference Case) Least-cost optimization used as reference case for all sensitivities
Least-Cost Case + REA Resources Additional resources added to Least-Cost Case for New Mexico REA
Separate System Planning New Mexico system planned separately for purposes of satisfying REA
Low Load Growth 3-4 higher native system load forecast
High Load Growth 3-4 lower native system load forecast
High DG High DG forecast
High DSM More smart thermostats doubling of energy efficiency
No New Gas No new gas after Newman 6
No Lifetime Extensions All plants retire as scheduled
High Gas Price Gas prices 15 higher
Low Carbon Price $8 per metric ton of CO2 in 2010 rising at 25 per year
Medium Carbon Price $20 per metric ton of CO2 in 2010 rising at 25 per year
High Carbon Price $40 per metric ton of CO2 in 2010 rising at 25 per year
80 Clean by 2035 80 zero-carbon energy
20 CO2 Red by 2040 20 reduction in CO2 emissions
40 CO2 Red by 2040 40 reduction in CO2 emissions
60 CO2 Red by 2040 60 reduction in CO2 emissions
80 CO2 Red by 2040 80 reduction in CO2 emissions
90 CO2 Red by 2040 90 reduction in CO2 emissions
100 CO2 Red by 2040 100 reduction in CO2 emissions
100 CO2 Red by 2040 (w H2) 100 reduction in CO2 emissions with hydrogen
Attachment D-2 E-3 June IRP Presentation Page 7 of 37
8Confidential Draft
Reference Case Additions and
Retirements
Total net additions by 2040
Storage ~1100 MW
Solar ~1500 MW
Wind ~100 MW
Gas (45) MW
DR = demand response BTM Solar = behind-the-meter solar
Attachment D-2 E-3 June IRP Presentation Page 8 of 37
9Confidential Draft
Reference Case Total Capacity
Total system capacity increases through 2045
bull Gas capacity declines 2027-2035 and then rises
bull Solar and storage capacity increase significantly
bull Wind and demand response increase more modestly
DR = demand response BTM Solar = behind-the-meter solar
Attachment D-2 E-3 June IRP Presentation Page 9 of 37
10Confidential Draft
Reference Case Annual Generation
BTM Solar = behind-the-meter solar
The amount of zero-carbon generation
increases markedly above current levels
Attachment D-2 E-3 June IRP Presentation Page 10 of 37
11Confidential Draft
Reference Case Effective Capacity
Load growth and resource
retirements together result in a
growing capacity need over time
which is met by a combination of
renewables storage demand
response and gas resources
Effective capacity is the amount of capacity that can be counted towards the PRM
Attachment D-2 E-3 June IRP Presentation Page 11 of 37
High DSM Sensitivity Results
Attachment D-2 E-3 June IRP Presentation Page 12 of 37
13Confidential Draft
High DSM Sensitivity Assumptions
Smart Thermostats Energy Efficiency
Base 50MW by 2040
High 60MW by 2040
Base 65 of native system load in 2040
High 13 of native system load in 2040
An incremental ~800 GWh in 2040 Corresponds to ~90 MW of savings on average throughout the year
Attachment D-2 E-3 June IRP Presentation Page 13 of 37
14Confidential Draft
High DSM Scenario Results
Change in Capacity Generation Mix
Attachment D-2 E-3 June IRP Presentation Page 14 of 37
New Mexico REA Requirements
Attachment D-2 E-3 June IRP Presentation Page 15 of 37
16Confidential Draft
New Mexico Renewable Energy Act
There are key requirements in the statutory language setting renewable energy and zero carbon requirements in New Mexico (emphasis added)
ldquoA public utility shall meet the renewable portfolio standard requirements as provided in this section to include renewable energy in its electric energy supply portfolio as demonstrated by its retirement of renewable energy certificates provided that the associated renewable energy is delivered to the public utility and assigned to the public utilitys New Mexico customershellip
(5) no later than January 1 2040 renewable energy resources shall supply no less than eighty percent of all retail sales of electricity in New Mexico provided that compliance with this standard until December 31 2047 shall not require the public utility to displace zero carbon resources in the utilitys generation portfolio on the effective date of this 2019 act and
(6) no later than January 1 2045 zero carbon resources shall supply one hundred percent of all retail sales of
electricity in New Mexico Reasonable and consistent progress shall be made over time toward this requirementrdquo
The scenarios analyzed consider multiple approaches for REA implementationbull Share of NM load served with renewable energy given that El Paso Electric serves NM load with
greater than 20 non-renewable zero-carbon resources (ie Palo Verde)
bull Annual vs hourly balancing periods for 100 zero-carbon generation
bull Whether combustion resources may be utilized to ensure reliability for NM customers
Attachment D-2 E-3 June IRP Presentation Page 16 of 37
17Confidential Draft
New Mexico REA Requirements in 2040+
The REA requires 80 RPS by 2040 unless doing so would require displacing existing zero-carbon generation
New Mexicorsquos share of Palo Verde 1 and 2 supplies 31 of New Mexicorsquos retail sales in 2040 and 27 in 2045
For purposes of IRP modeling El Paso Electric has directed E3 to require New Mexico zero-carbon generation (renewables + nuclear) to equal or exceed 100 of New Mexico retail sales or load starting in 2040
New Mexico Nuclear Generation amp Load
Nuclear Generation
Retail Sales
Total Load
Attachment D-2 E-3 June IRP Presentation Page 17 of 37
18Confidential Draft
Two Approaches for Modeling Zero-Carbon
Generation Balancing
bull New Mexico-allocated zero-carbon resources must generate enough energy on an annual basis to match the REA NM retail sales target
bull Natural gas resources andor imports can serve New Mexicorsquos energy needs in some hours if that generation is offset by additional zero-carbon generation in other hours
bull Annual balancing allows New Mexico customers to reap the benefits of being served by a larger system
Annual Balancing
bull New Mexico cannot receive power from gas resources or unspecified imports in any hour
bull Zero-carbon generation from New Mexico-allocated resources must serve New Mexico energy demand in all hours of the year
bull This would be a more stringent zero-carbon requirement as it would not allow for balancing between New Mexico and Texas resources
Hourly Balancing
NM-Allocated Resources
NM customers can be served by gas resources
and unspecified imports if offset in other hours
NM-Allocated Resources
Other Resources
NM customers cannot be served by gas resources
or unspecified imports an any hour
Attachment D-2 E-3 June IRP Presentation Page 18 of 37
19Confidential Draft
Two Approaches for Modeling Capacity
Pooling to Ensure Reliability
bull For reliability planning purposes NM and TX loads can be served by NM resources TX resources andor system resources
bull If the NM jurisdiction doesnrsquot have enough resources to satisfy load in an hour then it can rely on TX resources and vice versa
bull NM and TX customers must still pay for enough resources to satisfy their share of system reliability needs
Capacity Pooling Allowed
bull For planning purposes TX and NM must each have enough resources to ensure reliability across a range of potential conditions without relying on the other jurisdiction (ie on a standalone basis)
bull This would be a more stringent planning approach NM would need to plan to have enough resources without falling back on TX gas resources in some hours
Capacity Pooling NOT Allowed
NM-Allocated Resources
TX-Allocated Resources
NM-Allocated Resources
TX-Allocated Resources
All resources together ensure
systemwide reliability across all hours
subject to the reliability standard
For planning purposes each jurisdiction
ensures reliability on its own across all
hours subject to the reliability standard
Attachment D-2 E-3 June IRP Presentation Page 19 of 37
20Confidential Draft
New Mexico REA Scenarios and
Jurisdictional Allocation
E3 modeled a few scenarios with different approaches for how to satisfy the REA requirementsbull Different approaches of the REA requirements have meaningful implications on how
planning is performed for New Mexico customersbull The more stringent approaches of the REA requirements will result in higher system
costs relative to less stringent approaches
bull To ensure equitable treatment of customers across jurisdictions any incremental costs of satisfying the REA requirements would be allocated to New Mexico customers
For each scenario resources and costs are allocated between the New Mexico and Texas jurisdictionsbull The allocation of resources follows directly from a particular approach to modeling
REA compliance If a particular approach requires more resources to be added versus the least-cost case then those resources are allocated to the New Mexico jurisdiction
bull Capacity generation and cost for the New Mexico jurisdiction are presented for each scenario
Attachment D-2 E-3 June IRP Presentation Page 20 of 37
21Confidential Draft
Least Cost(ldquoLCrdquo)
Least Cost + REA Resources
(ldquoLC+REArdquo)
Separate System Planning
(ldquoSSPrdquo)
Portfoliooptimization
Least-cost system optimization
Reoptimize Least Cost to add additional renewables amp storage dedicated to NM to satisfy REA requirements
Optimize NM and TX systems independently
without modeling interactions between them
NM zero-carbon generation balancing period
Annual Annual Hourly
NM and TX capacity pooling to ensure reliability
Resource allocationResources allocated
proportionally more RECs allocated to NM
Incremental resources are allocated to New Mexico
Optimization identifies resources specifically for NM and TX jurisdictions
NM allocated new gas capacity
New Mexico REA Scenarios
More stringent REA interpretation
Attachment D-2 E-3 June IRP Presentation Page 21 of 37
New Mexico REA Scenario
Results
Attachment D-2 E-3 June IRP Presentation Page 22 of 37
23Confidential Draft
Least Cost(ldquoLCrdquo)
Least Cost + ETA Resources
(ldquoLC+ETArdquo)
Separate System Planning
(ldquoSSPrdquo)
Portfoliooptimization
Least-cost system optimization
Reoptimize Least Cost to add additional renewables amp storage dedicated to NM to satisfy ETA requirements
Optimize NM and TX systems independently
without modeling interactions between them
NM zero-carbon generation balancing period
Annual Annual Hourly
NM and TX capacity pooling to ensure reliability
Resource allocationResources allocated
proportionally more RECs allocated to NM
Incremental resources are allocated to New Mexico
Optimization identifies resources specifically for NM and TX jurisdictions
NM allocated new gas capacity
New Mexico REA Scenarios
Attachment D-2 E-3 June IRP Presentation Page 23 of 37
24Confidential Draft
Resource Portfolios and Costs by ScenarioLeast Cost Scenario
Total System New Mexico
This scenario allocates a share of new gas capacity to NM customers This capacity could be converted to run on a higher share of hydrogen fuel in the future More RECs would be allocated to NM customers to satisfy the REA
112 MW of new gas capacity is allocated to New Mexico customers by 2040
This analysis does not assume Palo Verde 3 generation is allocated to New Mexico resulting in a lower zero-carbon generation share than the rest of the system
Attachment D-2 E-3 June IRP Presentation Page 24 of 37
25Confidential Draft
Least Cost(ldquoLCrdquo)
Least Cost + REA Resources
(ldquoLC+REArdquo)
Separate System Planning
(ldquoSSPrdquo)
Portfoliooptimization
Least-cost system optimization
Reoptimize Least Cost to add additional renewables amp storage dedicated to NM to satisfy REA requirements
Optimize NM and TX systems independently
without modeling interactions between them
NM zero-carbon generation balancing period
Annual Annual Hourly
NM and TX capacity pooling to ensure reliability
Resource allocationResources allocated
proportionally more RECs allocated to NM
Incremental resources are allocated to New Mexico
Optimization identifies resources specifically for NM and TX jurisdictions
NM allocated new gas capacity
New Mexico REA Scenarios
Attachment D-2 E-3 June IRP Presentation Page 25 of 37
26Confidential Draft
Resource Portfolios and Costs by ScenarioLeast Cost + REA Scenario
Total System New Mexico
This scenario adds more solar and storage capacity for NM customers to satisfy the RPSREA targets while not allocating any new gas to NM customers This results in a modest cost increase vs Least Cost scenario
Gas generation serves a portion of New Mexico customersrsquo energy needs in some hours but that is more than offset by
Attachment D-2 E-3 June IRP Presentation Page 26 of 37
27Confidential Draft
New Mexico REA Scenarios
Least Cost(ldquoLCrdquo)
Least Cost + REA Resources
(ldquoLC+REArdquo)
Separate System Planning
(ldquoSSPrdquo)
Portfoliooptimization
Least-cost system optimization
Reoptimize Least Cost to add additional renewables amp storage dedicated to NM to satisfy REA requirements
Optimize NM and TX systems independently
without modeling interactions between them
NM zero-carbon generation balancing period
Annual Annual Hourly
NM and TX capacity pooling to ensure reliability
Resource allocationResources allocated
proportionally more RECs allocated to NM
Incremental resources are allocated to New Mexico
Optimization identifies resources specifically for NM and TX jurisdictions
NM allocated new gas capacity
Attachment D-2 E-3 June IRP Presentation Page 27 of 37
28Confidential Draft
Resource Portfolios and Costs by ScenarioSeparate System Planning Scenario
Total System New Mexico
This scenario requires significantly more resources for New Mexico to reach 100 absolute zero carbon and ensure reliability This results in a significant cost increase relative to the Least Cost scenario
Attachment D-2 E-3 June IRP Presentation Page 28 of 37
29Confidential Draft
Resource Portfolios and Costs by ScenarioSeparate System Planning (H2) Scenario
Total System New Mexico
Adding H2 capacity ensures reliability while significantly reducing solar and storage additions This mitigates cost impacts of achieving absolute zero carbon and planning to ensure reliability independently
Attachment D-2 E-3 June IRP Presentation Page 29 of 37
30Confidential Draft
New Mexico Capacity and CostLeast Cost Scenario
Least Cost Cost Impact vs Least Cost Scenario
The Least Cost scenario is the baseline for comparison Least
Cost
Attachment D-2 E-3 June IRP Presentation Page 30 of 37
31Confidential Draft
New Mexico Capacity and CostLeast Cost + REA Resources Scenario
Least Cost + REA Resources Cost Impact vs Least Cost Scenario
Least Cost + REA Resources
Least Cost
Attachment D-2 E-3 June IRP Presentation Page 31 of 37
32Confidential Draft
New Mexico Capacity and CostSeparate System Planning Scenario
Separate System Planning Cost Impact vs Least Cost Scenario
Least Cost + REA Resources
Separate System Planning
Least Cost
Attachment D-2 E-3 June IRP Presentation Page 32 of 37
33Confidential Draft
New Mexico Capacity and CostSeparate System Planning (H2) Scenario
Separate System Planning (H2) Cost Impact vs Least Cost Scenario
Least Cost + REA Resources
Separate System Planning (H2)
Separate System Planning
Least Cost
Attachment D-2 E-3 June IRP Presentation Page 33 of 37
34Confidential Draft
New Mexico Generation MixLeast Cost and Least Cost + REA Scenarios
Least Cost Least Cost + REA Resources
Attachment D-2 E-3 June IRP Presentation Page 34 of 37
35Confidential Draft
New Mexico Generation MixSeparate System Planning Scenarios
Separate System Planning Separate System Planning (H2)
Attachment D-2 E-3 June IRP Presentation Page 35 of 37
36Confidential Draft
Carbon Emissions Across Scenarios
CO2 Emissions in 2021 and 2040 Average Abatement Cost 2025-2040
Note emissions include emissions at company-owned facilities and emissions ascribed to imports2040
Attachment D-2 E-3 June IRP Presentation Page 36 of 37
Thank You
Thank You
Attachment D-2 E-3 June IRP Presentation Page 37 of 37
Attachment D-3 E3 EPE Report Model Results AugustPage 1 of 34
Scenario Resource Type 2021 2024 2025 2027 2031 2035 2040 2045Least-Cost (Reference Case) Nuclear (Palo Verde) 5148 5148 5148 5148 5148 5148 5148 5148
Nuclear (SMR) - - - - - - - - Gas - Steam Turbine 140 34 8 7 1 - - - Gas - Combined Cycle 1767 1373 1037 1148 1187 1075 1321 1513 Gas - Combustion Turbine 1027 1169 854 925 874 767 1251 1657 Biomass - - - - - - - - Geothermal - - - - - - - - Wind - - 354 357 361 316 381 730 Solar 289 952 1450 1467 2016 3050 3469 4199 Battery Storage - 12 (25) (26) (104) (215) (223) (248) Imports 391 336 266 261 296 278 360 440 Demand Response - - - - - - - - Hydrogen - - - - - - - - BTM Solar 37 135 165 225 344 460 601 763 Load 8771 9155 9258 9512 10123 10878 12308 14203 Excess Generation 14 130 416 397 431 636 374 456
Least-Cost Case + REA Resources Nuclear (Palo Verde) 5148 5148 5148 5148 5148 5148 5148 5148 Nuclear (SMR) - - - - - - - - Gas - Steam Turbine 140 34 4 11 1 - - - Gas - Combined Cycle 1767 1373 926 1001 1044 927 966 1101 Gas - Combustion Turbine 1027 1169 784 855 780 495 761 1005 Biomass - - - - - - - - Geothermal - - - - - - - - Wind - - 681 694 699 561 725 995 Solar 289 952 1340 1356 2030 3274 4121 5334 Battery Storage - 12 (29) (30) (105) (236) (277) (369) Imports 391 336 239 251 182 248 262 226 Demand Response - - - - - - - - Hydrogen - - - - - - - - BTM Solar 37 135 165 225 344 460 601 763 Load 8771 9155 9258 9512 10123 10878 12308 14203 Excess Generation 14 130 428 400 449 1144 1071 892
Separate System Planning Nuclear (Palo Verde) 5148 5148 5148 5148 5148 5148 5148 5148 Nuclear (SMR) - - - - - - - - Gas - Steam Turbine 140 34 1 2 - - - - Gas - Combined Cycle 1763 1385 1125 1238 1235 1000 1201 1349 Gas - Combustion Turbine 1048 1180 852 922 920 502 768 1046 Biomass - - - - - - - - Geothermal - - - - - - - - Wind - - 174 175 169 76 23 398 Solar 289 950 1556 1594 2135 3760 4704 5638 Battery Storage - 11 (55) (62) (129) (300) (367) (423) Imports 391 328 291 269 301 232 229 283 Demand Response - - - - - - - - Hydrogen - - - - - - - - BTM Solar 37 135 165 225 344 460 601 763 Load 8771 9155 9258 9512 10123 10878 12308 14203 Excess Generation 14 132 304 265 365 1270 2517 2452
Annual Energy (GWh)
Attachment D-3 E3 EPE Report Model Results AugustPage 2 of 34
Scenario Resource Type 2021 2024 2025 2027 2031 2035 2040 2045Annual Energy (GWh)
Separate System Planning (w H2) Nuclear (Palo Verde) 5148 5148 5148 5148 5148 5148 5148 5148 Nuclear (SMR) - - - - - - - - Gas - Steam Turbine 140 34 1 2 - - - - Gas - Combined Cycle 1763 1385 1101 1210 1223 1104 1199 1348 Gas - Combustion Turbine 1048 1180 843 915 870 762 793 1072 Biomass - - - - - - - - Geothermal - - - - - - - - Wind - - 214 215 207 202 285 678 Solar 289 950 1551 1588 2173 3139 4241 5147 Battery Storage - 11 (54) (61) (130) (221) (311) (365) Imports 391 328 288 270 288 285 278 331 Demand Response - - - - - - - - Hydrogen - - - - - - 74 80 BTM Solar 37 135 165 225 344 460 601 763 Load 8771 9155 9258 9512 10123 10878 12308 14203 Excess Generation 14 132 314 276 474 696 883 967
80 Clean by 2035 Nuclear (Palo Verde) 5148 5148 5148 5148 5148 5148 5148 5148 Nuclear (SMR) - - - - - - - - Gas - Steam Turbine 140 34 8 11 1 - - - Gas - Combined Cycle 1767 1373 1028 1131 1175 1088 1160 1293 Gas - Combustion Turbine 1027 1169 849 922 868 767 1055 1256 Biomass - - - - - - - - Geothermal - - - - - - - - Wind - - 378 381 385 342 650 1041 Solar 289 953 1450 1463 2012 3006 3689 4703 Battery Storage - 12 (24) (26) (103) (207) (238) (289) Imports 391 336 255 256 292 274 241 287 Demand Response - - - - - - - - Hydrogen - - - - - - - - BTM Solar 37 135 165 225 344 460 601 763 Load 8771 9155 9258 9512 10123 10878 12308 14203 Excess Generation 14 130 406 391 436 677 472 735
20 CO2 Red by 2040 Nuclear (Palo Verde) 5148 5148 5148 5148 5148 5148 5148 5148 Nuclear (SMR) - - - - - - - - Gas - Steam Turbine 140 34 8 11 1 - - - Gas - Combined Cycle 1767 1373 1027 1131 1175 1089 1253 1260 Gas - Combustion Turbine 1027 1169 849 922 868 765 1132 1187 Biomass - - - - - - - - Geothermal - - - - - - - - Wind - - 378 381 385 342 457 1095 Solar 289 953 1442 1456 2012 3007 3621 4792 Battery Storage - 12 (24) (26) (103) (207) (236) (297) Imports 391 336 264 264 292 275 332 255 Demand Response - - - - - - - - Hydrogen - - - - - - - - BTM Solar 37 135 165 225 344 460 601 763 Load 8771 9155 9258 9512 10123 10878 12308 14203 Excess Generation 14 129 415 398 436 676 463 752
Attachment D-3 E3 EPE Report Model Results AugustPage 3 of 34
Scenario Resource Type 2021 2024 2025 2027 2031 2035 2040 2045Annual Energy (GWh)
40 CO2 Red by 2040 Nuclear (Palo Verde) 5148 5148 5148 5148 5148 5148 5148 5148 Nuclear (SMR) - - - - - - - - Gas - Steam Turbine 140 34 8 11 1 - - - Gas - Combined Cycle 1767 1373 1027 1131 1175 1089 1060 1028 Gas - Combustion Turbine 1027 1169 849 922 868 767 790 822 Biomass - - - - - - - - Geothermal - - - - - - - - Wind - - 378 381 385 342 783 961 Solar 289 953 1441 1458 2013 3004 3980 5677 Battery Storage - 12 (24) (26) (103) (207) (264) (396) Imports 391 336 264 262 292 276 210 199 Demand Response - - - - - - - - Hydrogen - - - - - - - - BTM Solar 37 135 165 225 344 460 601 763 Load 8771 9155 9258 9512 10123 10878 12308 14203 Excess Generation 14 130 415 396 435 680 811 1196
60 CO2 Red by 2040 Nuclear (Palo Verde) 5148 5148 5148 5148 5148 5148 5148 5148 Nuclear (SMR) - - - - - - - - Gas - Steam Turbine 140 34 7 12 1 - - - Gas - Combined Cycle 1767 1373 1001 1093 1143 1029 780 735 Gas - Combustion Turbine 1027 1169 840 915 852 656 453 483 Biomass - - - - - - - - Geothermal - - - - - - - - Wind - - 444 448 451 388 853 808 Solar 289 953 1419 1436 2000 3174 4624 6588 Battery Storage - 12 (25) (26) (101) (226) (312) (488) Imports 391 336 259 260 286 250 161 166 Demand Response - - - - - - - - Hydrogen - - - - - - - - BTM Solar 37 135 165 225 344 460 601 763 Load 8771 9155 9258 9512 10123 10878 12308 14203 Excess Generation 14 129 411 390 452 766 1514 1850
80 CO2 Red by 2040 Nuclear (Palo Verde) 5148 5148 5148 5148 5148 5148 5148 5148 Nuclear (SMR) - - - - - - - - Gas - Steam Turbine 140 34 4 11 1 - - - Gas - Combined Cycle 1767 1373 914 986 1049 835 531 500 Gas - Combustion Turbine 1027 1169 771 842 725 399 127 142 Biomass - - - - - - - - Geothermal - - - - - - - - Wind - - 722 735 743 584 1310 1417 Solar 289 953 1329 1343 2004 3491 4869 6658 Battery Storage - 12 (31) (30) (102) (245) (342) (499) Imports 391 336 235 251 212 208 63 73 Demand Response - - - - - - - - Hydrogen - - - - - - - - BTM Solar 37 135 165 225 344 460 601 763 Load 8771 9155 9258 9512 10123 10878 12308 14203 Excess Generation 14 130 444 417 491 1350 2580 2939
Attachment D-3 E3 EPE Report Model Results AugustPage 4 of 34
Scenario Resource Type 2021 2024 2025 2027 2031 2035 2040 2045Annual Energy (GWh)
90 CO2 Red by 2040 Nuclear (Palo Verde) 5148 5148 5148 5148 5148 5148 5148 5148 Nuclear (SMR) - - - - - - - - Gas - Steam Turbine 140 34 4 11 2 - - - Gas - Combined Cycle 1767 1373 908 979 1009 778 304 290 Gas - Combustion Turbine 1027 1169 766 836 622 291 29 44 Biomass - - - - - - - - Geothermal - - - - - - - - Wind - - 740 754 763 513 1964 2116 Solar 289 952 1325 1339 2154 3842 4535 6263 Battery Storage - 12 (31) (30) (100) (278) (308) (453) Imports 391 336 232 250 182 125 35 32 Demand Response - - - - - - - - Hydrogen - - - - - - - - BTM Solar 37 135 165 225 344 460 601 763 Load 8771 9155 9258 9512 10123 10878 12308 14203 Excess Generation 14 130 452 424 650 1462 3356 3714
100 CO2 Red by 2040 (w H2) Nuclear (Palo Verde) 5148 5148 5148 5148 5148 5148 5148 5148 Nuclear (SMR) - - - - - - - - Gas - Steam Turbine 140 34 5 7 2 - - - Gas - Combined Cycle 1767 1373 860 928 924 643 - - Gas - Combustion Turbine 1027 1169 715 779 558 188 - - Biomass - - - - - - - - Geothermal - - - - - - - - Wind - - 896 917 922 557 1629 1685 Solar 289 952 1284 1297 2175 4069 4874 6693 Battery Storage - 12 (31) (32) (97) (302) (345) (509) Imports 391 336 215 242 148 114 - - Demand Response - - - - - - - - Hydrogen - - - - - - 400 423 BTM Solar 37 135 165 225 344 460 601 763 Load 8771 9155 9258 9512 10123 10878 12308 14203 Excess Generation 14 130 528 495 798 1795 3187 3597
100 CO2 Red by 2040 Nuclear (Palo Verde) 5148 5148 5148 5148 5148 5148 5148 5148 Nuclear (SMR) - - - - - - - - Gas - Steam Turbine 140 34 7 12 2 - - - Gas - Combined Cycle 1767 1373 1013 1110 924 643 - - Gas - Combustion Turbine 1027 1169 843 917 558 188 - - Biomass - - - - - - - - Geothermal - - - - - - - - Wind - - 416 419 922 557 1992 2629 Solar 289 952 1430 1445 2175 4069 4973 5542 Battery Storage - 12 (25) (26) (97) (302) (406) (572) Imports 391 336 260 261 148 114 - - Demand Response - - - - - - - - Hydrogen - - - - - - - - BTM Solar 37 135 165 225 344 460 601 1455 Load 8771 9155 9258 9512 10123 10878 12308 14203 Excess Generation 14 130 412 393 798 1795 11640 13062
Attachment D-3 E3 EPE Report Model Results AugustPage 5 of 34
Scenario Resource Type 2021 2024 2025 2027 2031 2035 2040 2045Annual Energy (GWh)
High DG Nuclear (Palo Verde) 5148 5148 5148 5148 5148 5148 5148 5148 Nuclear (SMR) - - - - - - - - Gas - Steam Turbine 134 31 9 12 1 - - - Gas - Combined Cycle 1728 1317 1044 1144 1175 1073 1273 1538 Gas - Combustion Turbine 1028 1123 885 923 846 711 1096 1713 Biomass - - - - - - - - Geothermal - - - - - - - - Wind - - 338 336 341 295 352 763 Solar 285 866 1148 1107 1485 2336 2661 2700 Battery Storage - 11 (25) (25) (105) (226) (249) (243) Imports 389 314 273 258 287 265 347 441 Demand Response - - - - - - - - Hydrogen - - - - - - - - BTM Solar 88 350 436 608 945 1276 1680 2144 Load 8771 9155 9258 9512 10123 10878 12308 14203 Excess Generation 18 217 389 432 552 696 602 379
High DSM Nuclear (Palo Verde) 5148 5148 5148 5148 5148 5148 5148 5148 Nuclear (SMR) - - - - - - - - Gas - Steam Turbine 133 30 2 3 0 - - - Gas - Combined Cycle 1744 1303 1197 1315 1357 1105 1320 1460 Gas - Combustion Turbine 1020 1111 977 1001 989 706 1104 1404 Biomass - - - - - - - - Geothermal - - - - - - - - Wind - - - - - - - 471 Solar 288 934 1274 1273 1604 2760 3166 3725 Battery Storage - 10 (25) (23) (80) (203) (216) (234) Imports 390 329 318 286 318 297 377 438 Demand Response - - - - - - - - Hydrogen - - - - - - - - BTM Solar 37 135 165 225 344 460 601 763 Load 8731 8994 9056 9230 9680 10273 11501 13177 Excess Generation 15 148 197 197 215 541 326 371
Low Load Nuclear (Palo Verde) 5148 5148 5148 5148 5148 5148 5148 5148 Nuclear (SMR) - - - - - - - - Gas - Steam Turbine 101 27 2 3 2 - - - Gas - Combined Cycle 1596 1244 1155 1300 1422 1129 1372 1496 Gas - Combustion Turbine 983 1065 942 985 1034 759 1214 1529 Biomass - - - - - - - - Geothermal - - - - - - - - Wind - - - - - - - 523 Solar 282 919 1260 1272 1563 2869 3314 3970 Battery Storage - 8 (26) (24) (69) (209) (222) (246) Imports 381 325 311 284 315 303 385 440 Demand Response - - - - - - - - Hydrogen - - - - - - - - BTM Solar 37 135 165 225 344 460 601 763 Load 8492 8862 8958 9194 9759 10459 11813 13623 Excess Generation 22 163 216 205 224 535 317 399
Attachment D-3 E3 EPE Report Model Results AugustPage 6 of 34
Scenario Resource Type 2021 2024 2025 2027 2031 2035 2040 2045Annual Energy (GWh)
High Load Nuclear (Palo Verde) 5148 5148 5148 5148 5148 5148 5148 5148 Nuclear (SMR) - - - - - - - - Gas - Steam Turbine 195 50 7 3 - - - - Gas - Combined Cycle 1909 1522 1077 1166 1126 1113 1386 1518 Gas - Combustion Turbine 1088 1256 889 937 786 875 1409 1781 Biomass - - - - - - - - Geothermal - - - - - - - - Wind - - 420 424 404 387 450 957 Solar 293 983 1618 1717 2556 3249 3659 4426 Battery Storage - 14 (42) (64) (158) (220) (224) (251) Imports 400 343 275 273 281 286 373 440 Demand Response - - - - - - - - Hydrogen - - - - - - - - BTM Solar 37 135 165 225 344 460 601 763 Load 9050 9448 9558 9830 10488 11297 12803 14784 Excess Generation 10 100 381 278 543 642 387 518
No Lifetime Extensions Nuclear (Palo Verde) 5148 5148 5148 5148 5148 5148 5148 5148 Nuclear (SMR) - - - - - - - - Gas - Steam Turbine 140 34 12 2 - - - - Gas - Combined Cycle 1767 1373 972 1029 1055 1069 1314 1513 Gas - Combustion Turbine 1027 1169 744 693 636 764 1246 1657 Biomass - - - - - - - - Geothermal - - - - - - - - Wind - - 364 369 340 337 408 730 Solar 289 952 1643 1894 2495 3039 3457 4199 Battery Storage - 12 (26) (92) (164) (214) (223) (248) Imports 391 336 235 243 270 276 357 440 Demand Response - - - - - - - - Hydrogen - - - - - - - - BTM Solar 37 135 165 225 344 460 601 763 Load 8771 9155 9258 9512 10123 10878 12308 14203 Excess Generation 14 130 669 413 585 637 371 456
No New Gas Nuclear (Palo Verde) 5148 5148 5148 5148 5148 5148 5148 5148 Nuclear (SMR) - - - - - - - - Gas - Steam Turbine 140 34 7 12 1 - - - Gas - Combined Cycle 1767 1373 1013 1110 1156 829 774 714 Gas - Combustion Turbine 1027 1169 843 917 859 294 269 286 Biomass - - - - - - - - Geothermal - - - - - - - - Wind - - 416 419 423 227 195 209 Solar 289 952 1430 1445 2002 4003 5562 7483 Battery Storage - 12 (25) (26) (102) (320) (460) (623) Imports 391 336 260 261 293 237 219 223 Demand Response - - - - - - - - Hydrogen - - - - - - - - BTM Solar 37 135 165 225 344 460 601 763 Load 8771 9155 9258 9512 10123 10878 12308 14203 Excess Generation 14 130 412 393 449 1709 2222 2760
Attachment D-3 E3 EPE Report Model Results AugustPage 7 of 34
Scenario Resource Type 2021 2024 2025 2027 2031 2035 2040 2045Annual Energy (GWh)
Low Carbon Price Nuclear (Palo Verde) 5148 5148 5148 5148 5148 5148 5148 5148 Nuclear (SMR) - - - - - - - - Gas - Steam Turbine 127 23 4 5 1 - - - Gas - Combined Cycle 1803 1433 1000 1092 1104 988 1204 1335 Gas - Combustion Turbine 1001 1107 776 839 788 598 1076 1338 Biomass - - - - - - - - Geothermal - - - - - - - - Wind - - 562 571 569 479 581 943 Solar 289 958 1390 1406 1988 3174 3609 4556 Battery Storage - 11 (30) (29) (104) (228) (238) (278) Imports 394 345 242 255 285 258 326 397 Demand Response - - - - - - - - Hydrogen - - - - - - - - BTM Solar 37 135 165 225 344 460 601 763 Load 8771 9155 9258 9512 10123 10878 12308 14203 Excess Generation 14 125 403 379 473 835 521 718
Mid Carbon Price Nuclear (Palo Verde) 5148 5148 5148 5148 5148 5148 5148 5148 Nuclear (SMR) - - - - - - - - Gas - Steam Turbine 120 22 3 4 1 - - - Gas - Combined Cycle 1822 1496 923 994 1017 922 1107 1275 Gas - Combustion Turbine 983 1036 596 663 681 475 938 1205 Biomass - - - - - - - - Geothermal - - - - - - - - Wind - - 771 794 801 650 804 1099 Solar 290 961 1474 1493 2020 3264 3720 4732 Battery Storage - 7 (35) (36) (101) (230) (245) (291) Imports 399 354 212 227 211 190 235 273 Demand Response - - - - - - - - Hydrogen - - - - - - - - BTM Solar 37 135 165 225 344 460 601 763 Load 8771 9155 9258 9512 10123 10878 12308 14203 Excess Generation 13 121 615 574 500 912 572 727
High Carbon Price Nuclear (Palo Verde) 5148 5148 5148 5148 5148 5148 5148 5148 Nuclear (SMR) - - - - - - - - Gas - Steam Turbine 119 21 3 3 2 - - - Gas - Combined Cycle 1835 1540 704 778 913 873 962 863 Gas - Combustion Turbine 962 989 447 494 545 394 614 583 Biomass - - - - - - - - Geothermal - - - - - - - - Wind - - 881 916 965 778 930 859 Solar 290 963 1760 1782 2130 3267 4138 6248 Battery Storage - 2 (37) (36) (98) (230) (275) (458) Imports 408 362 187 203 174 188 189 195 Demand Response - - - - - - - - Hydrogen - - - - - - - - BTM Solar 37 135 165 225 344 460 601 763 Load 8771 9155 9258 9512 10123 10878 12308 14203 Excess Generation 13 120 1146 1089 774 1061 1077 1549
Attachment D-3 E3 EPE Report Model Results AugustPage 8 of 34
Scenario Resource Type 2021 2024 2025 2027 2031 2035 2040 2045Annual Energy (GWh)
High Gas Price Nuclear (Palo Verde) 5148 5148 5148 5148 5148 5148 5148 5148 Nuclear (SMR) - - - - - - - - Gas - Steam Turbine 125 31 6 5 1 - - - Gas - Combined Cycle 1787 1400 1015 1115 1125 1015 1242 1350 Gas - Combustion Turbine 1008 1120 803 853 805 627 1127 1365 Biomass - - - - - - - - Geothermal - - - - - - - - Wind - - 444 448 451 387 467 924 Solar 290 956 1419 1435 1998 3161 3603 4486 Battery Storage - 9 (29) (28) (103) (224) (235) (274) Imports 403 360 287 309 355 303 354 440 Demand Response - - - - - - - - Hydrogen - - - - - - - - BTM Solar 37 135 165 225 344 460 601 763 Load 8771 9155 9258 9512 10123 10878 12308 14203 Excess Generation 13 127 411 390 455 783 483 702
Low Renewable and Storage Costs Nuclear (Palo Verde) 5148 5148 5148 5148 5148 5148 5148 5148 Nuclear (SMR) - - - - - - - - Gas - Steam Turbine 140 34 3 6 1 - - - Gas - Combined Cycle 1767 1373 984 1068 1096 1000 1220 1278 Gas - Combustion Turbine 1027 1169 842 925 824 652 1127 1243 Biomass - - - - - - - - Geothermal - - - - - - - - Wind - - 558 564 559 474 578 1026 Solar 289 952 1321 1330 1975 3102 3538 4621 Battery Storage - 12 (29) (29) (102) (221) (232) (288) Imports 391 336 265 275 279 262 328 411 Demand Response - - - - - - - - Hydrogen - - - - - - - - BTM Solar 37 135 165 225 344 460 601 763 Load 8771 9155 9258 9512 10123 10878 12308 14203 Excess Generation 14 130 324 309 486 807 490 896
Attachment D-3 E3 EPE Report Model Results AugustPage 9 of 34
Scenario Resource TypeLeast-Cost (Reference Case) Nuclear (Palo Verde)
Nuclear (SMR)Gas - Steam TurbineGas - Combined CycleGas - Combustion TurbineBiomassGeothermalWindSolarBattery StorageImportsDemand ResponseHydrogenBTM SolarLoadExcess Generation
Least-Cost Case + REA Resources Nuclear (Palo Verde)Nuclear (SMR)Gas - Steam TurbineGas - Combined CycleGas - Combustion TurbineBiomassGeothermalWindSolarBattery StorageImportsDemand ResponseHydrogenBTM SolarLoadExcess Generation
Separate System Planning Nuclear (Palo Verde)Nuclear (SMR)Gas - Steam TurbineGas - Combined CycleGas - Combustion TurbineBiomassGeothermalWindSolarBattery StorageImportsDemand ResponseHydrogenBTM SolarLoadExcess Generation
2021 2024 2025 2027 2031 2035 2040 2045622 622 622 622 622 622 622 622 - - - - - - - - 426 307 307 307 234 - - - 493 493 493 493 493 266 266 266 503 731 731 731 668 870 1059 1216 - - - - - - - - - - - - - - - - - - 102 102 102 102 102 197 115 385 621 621 823 1235 1309 1561 - 50 177 177 488 1029 1129 1277 - - - - - - - - 46 53 56 61 71 81 93 93
- - - - - - - - 18 65 80 108 166 221 289 368
- - - - - - - - - - - - - - - - 622 622 622 622 622 622 622 622 - - - - - - - - 426 307 307 307 234 - - - 493 493 493 493 493 266 266 266 503 731 731 731 668 809 942 1051 - - - - - - - - - - - - - - - - - - 203 203 203 203 232 300 115 385 544 544 795 1414 1693 2037 - 50 176 177 460 1067 1246 1682 - - - - - - - - 46 53 56 61 71 81 93 93
- - - - - - - - 18 65 80 108 166 221 289 368
- - - - - - - - - - - - - - - - 622 622 622 622 622 622 622 622 - - - - - - - - 426 307 307 307 234 - - - 493 493 493 493 493 266 266 266 503 731 731 731 668 755 755 864 - - - - - - - - - - - - - - - - - - 49 49 49 49 49 161 115 385 639 639 859 1701 2450 2712 - 50 280 304 591 1514 2344 2674 - - - - - - - - 46 53 56 61 71 81 93 93
- - - - - - - - 18 65 80 108 166 221 289 368
- - - - - - - - - - - - - - - -
Installed Capacity (MW)
Attachment D-3 E3 EPE Report Model Results AugustPage 10 of 34
Scenario Resource TypeSeparate System Planning (w H2) Nuclear (Palo Verde)
Nuclear (SMR)Gas - Steam TurbineGas - Combined CycleGas - Combustion TurbineBiomassGeothermalWindSolarBattery StorageImportsDemand ResponseHydrogenBTM SolarLoadExcess Generation
80 Clean by 2035 Nuclear (Palo Verde)Nuclear (SMR)Gas - Steam TurbineGas - Combined CycleGas - Combustion TurbineBiomassGeothermalWindSolarBattery StorageImportsDemand ResponseHydrogenBTM SolarLoadExcess Generation
20 CO2 Red by 2040 Nuclear (Palo Verde)Nuclear (SMR)Gas - Steam TurbineGas - Combined CycleGas - Combustion TurbineBiomassGeothermalWindSolarBattery StorageImportsDemand ResponseHydrogenBTM SolarLoadExcess Generation
2021 2024 2025 2027 2031 2035 2040 2045Installed Capacity (MW)
622 622 622 622 622 622 622 622 - - - - - - - - 426 307 307 307 234 - - - 493 493 493 493 493 266 266 266 503 731 731 731 668 755 755 864 - - - - - - - - - - - - - - - - - - 60 60 60 60 107 218 115 385 638 638 905 1312 1724 2031 - 50 278 303 570 1057 1496 1797 - - - - - - - - 46 53 56 61 71 81 93 93
- - - - - 123 206 212 18 65 80 108 166 221 289 368
- - - - - - - - - - - - - - - - 622 622 622 622 622 622 622 622 - - - - - - - - 426 307 307 307 234 - - - 493 493 493 493 493 266 266 266 503 731 731 731 668 910 1022 1149 - - - - - - - - - - - - - - - - - - 109 109 109 109 185 289 115 385 615 615 821 1233 1383 1799 - 50 177 177 486 968 1145 1327 - - - - - - - - 46 53 56 61 71 81 93 93
- - - - - - - - 18 65 80 108 166 221 289 368
- - - - - - - - - - - - - - - - 622 622 622 622 622 622 622 622 - - - - - - - - 426 307 307 307 234 - - - 493 493 493 493 493 266 266 266 503 731 731 731 668 910 1036 1138 - - - - - - - - - - - - - - - - - - 109 109 109 109 125 300 115 385 615 615 821 1233 1383 1837 - 50 177 177 486 968 1145 1359 - - - - - - - - 46 53 56 61 71 81 93 93
- - - - - - - - 18 65 80 108 166 221 289 368
- - - - - - - - - - - - - - - -
Attachment D-3 E3 EPE Report Model Results AugustPage 11 of 34
Scenario Resource Type40 CO2 Red by 2040 Nuclear (Palo Verde)
Nuclear (SMR)Gas - Steam TurbineGas - Combined CycleGas - Combustion TurbineBiomassGeothermalWindSolarBattery StorageImportsDemand ResponseHydrogenBTM SolarLoadExcess Generation
60 CO2 Red by 2040 Nuclear (Palo Verde)Nuclear (SMR)Gas - Steam TurbineGas - Combined CycleGas - Combustion TurbineBiomassGeothermalWindSolarBattery StorageImportsDemand ResponseHydrogenBTM SolarLoadExcess Generation
80 CO2 Red by 2040 Nuclear (Palo Verde)Nuclear (SMR)Gas - Steam TurbineGas - Combined CycleGas - Combustion TurbineBiomassGeothermalWindSolarBattery StorageImportsDemand ResponseHydrogenBTM SolarLoadExcess Generation
2021 2024 2025 2027 2031 2035 2040 2045Installed Capacity (MW)
622 622 622 622 622 622 622 622 - - - - - - - - 426 307 307 307 234 - - - 493 493 493 493 493 266 266 266 503 731 731 731 668 909 973 1022 - - - - - - - - - - - - - - - - - - 109 109 109 109 239 300 115 385 615 615 821 1234 1563 2248 - 50 177 177 486 969 1184 1746 - - - - - - - - 46 53 56 61 71 81 93 93
- - - - - - - - 18 65 80 108 166 221 289 368
- - - - - - - - - - - - - - - - 622 622 622 622 622 622 622 622 - - - - - - - - 426 307 307 307 234 - - - 493 493 493 493 493 266 266 266 503 731 731 731 668 849 892 897 - - - - - - - - - - - - - - - - - - 128 128 128 128 301 302 115 385 599 599 816 1309 1965 2744 - 50 177 177 481 1044 1347 2145 - - - - - - - - 46 53 56 61 71 81 93 93
- - - - - - - - 18 65 80 108 166 221 289 368
- - - - - - - - - - - - - - - - 622 622 622 622 622 622 622 622 - - - - - - - - 426 307 307 307 234 - - - 493 493 493 493 493 266 266 266 503 731 731 731 668 778 778 778 - - - - - - - - - - - - - - - - - - 217 217 217 217 552 585 115 385 538 538 793 1555 2257 3007 - 50 176 177 458 1097 1645 2461 - - - - - - - - 46 53 56 61 71 81 93 93
- - - - - - - - 18 65 80 108 166 221 289 368
- - - - - - - - - - - - - - - -
Attachment D-3 E3 EPE Report Model Results AugustPage 12 of 34
Scenario Resource Type90 CO2 Red by 2040 Nuclear (Palo Verde)
Nuclear (SMR)Gas - Steam TurbineGas - Combined CycleGas - Combustion TurbineBiomassGeothermalWindSolarBattery StorageImportsDemand ResponseHydrogenBTM SolarLoadExcess Generation
100 CO2 Red by 2040 (w H2) Nuclear (Palo Verde)Nuclear (SMR)Gas - Steam TurbineGas - Combined CycleGas - Combustion TurbineBiomassGeothermalWindSolarBattery StorageImportsDemand ResponseHydrogenBTM SolarLoadExcess Generation
100 CO2 Red by 2040 Nuclear (Palo Verde)Nuclear (SMR)Gas - Steam TurbineGas - Combined CycleGas - Combustion TurbineBiomassGeothermalWindSolarBattery StorageImportsDemand ResponseHydrogenBTM SolarLoadExcess Generation
2021 2024 2025 2027 2031 2035 2040 2045Installed Capacity (MW)
622 622 622 622 622 622 622 622 - - - - - - - - 426 307 307 307 234 - - - 493 493 493 493 493 266 266 266 503 731 731 731 668 726 726 726 - - - - - - - - - - - - - - - - - - 224 224 224 224 801 828 115 385 535 535 901 1679 2300 3049 - 50 176 177 452 1284 1777 2595 - - - - - - - - 46 53 56 61 71 81 93 93
- - - - - - - - 18 65 80 108 166 221 289 368
- - - - - - - - - - - - - - - - 622 622 622 622 622 622 622 622 - - - - - - - - 426 307 307 307 234 - - - 493 493 493 493 493 266 - - 503 731 731 731 668 688 - - - - - - - - - - - - - - - - - - - - 282 282 282 282 682 696 115 385 512 512 925 1801 2403 3178 - 50 176 177 445 1385 1955 2797 - - - - - - - - 46 53 56 61 71 81 93 93
- - - - - - 954 954 18 65 80 108 166 221 289 368
- - - - - - - - - - - - - - - - 622 622 622 622 622 622 622 622 - - - - - - - - 426 307 307 307 234 - - - 493 493 493 493 493 266 266 266 503 731 731 731 668 688 668 668 - - - - - - - - - - - - - - - - - - 120 120 282 282 1216 1605 115 385 606 606 925 1801 4851 5217 - 50 177 177 445 1385 6191 7470 - - - - - - - - 46 53 56 61 71 81 93 93
- - - - - - - - 18 65 80 108 166 221 289 701
- - - - - - - - - - - - - - - -
Attachment D-3 E3 EPE Report Model Results AugustPage 13 of 34
Scenario Resource TypeHigh DG Nuclear (Palo Verde)
Nuclear (SMR)Gas - Steam TurbineGas - Combined CycleGas - Combustion TurbineBiomassGeothermalWindSolarBattery StorageImportsDemand ResponseHydrogenBTM SolarLoadExcess Generation
High DSM Nuclear (Palo Verde)Nuclear (SMR)Gas - Steam TurbineGas - Combined CycleGas - Combustion TurbineBiomassGeothermalWindSolarBattery StorageImportsDemand ResponseHydrogenBTM SolarLoadExcess Generation
Low Load Nuclear (Palo Verde)Nuclear (SMR)Gas - Steam TurbineGas - Combined CycleGas - Combustion TurbineBiomassGeothermalWindSolarBattery StorageImportsDemand ResponseHydrogenBTM SolarLoadExcess Generation
2021 2024 2025 2027 2031 2035 2040 2045Installed Capacity (MW)
622 622 622 622 622 622 622 622 - - - - - - - - 426 307 307 307 234 - - - 493 493 493 493 493 266 266 266 503 731 731 731 668 860 1026 1228 - - - - - - - - - - - - - - - - - - 96 96 96 96 96 203 115 385 511 511 684 1010 1107 1018 - 50 176 176 479 1041 1166 1263 - - - - - - - - 46 53 56 61 71 81 93 93
- - - - - - - - 42 169 210 293 455 614 809 1032
- - - - - - - - - - - - - - - - 622 622 622 622 622 622 622 622 - - - - - - - - 426 307 307 307 234 - - - 493 493 493 493 493 266 266 266 503 731 731 731 668 778 942 1058 - - - - - - - - - - - - - - - - - - - - - - - 128 115 385 519 519 638 1149 1212 1386 - 50 184 184 406 1001 1091 1213 - - - - - - - - 49 66 71 82 100 101 103 103
- - - - - - - - 18 65 80 108 166 221 289 368
- - - - - - - - - - - - - - - - 622 622 622 622 622 622 622 622 - - - - - - - - 426 307 307 307 234 - - - 493 493 493 493 493 266 266 266 503 731 731 731 668 724 896 1019 - - - - - - - - - - - - - - - - - - - - - - - 141 115 385 521 521 628 1185 1261 1477 - 50 186 186 355 1019 1121 1262 - - - - - - - - 46 53 56 61 71 81 93 93
- - - - - - - - 18 65 80 108 166 221 289 368
- - - - - - - - - - - - - - - -
Attachment D-3 E3 EPE Report Model Results AugustPage 14 of 34
Scenario Resource TypeHigh Load Nuclear (Palo Verde)
Nuclear (SMR)Gas - Steam TurbineGas - Combined CycleGas - Combustion TurbineBiomassGeothermalWindSolarBattery StorageImportsDemand ResponseHydrogenBTM SolarLoadExcess Generation
No Lifetime Extensions Nuclear (Palo Verde)Nuclear (SMR)Gas - Steam TurbineGas - Combined CycleGas - Combustion TurbineBiomassGeothermalWindSolarBattery StorageImportsDemand ResponseHydrogenBTM SolarLoadExcess Generation
No New Gas Nuclear (Palo Verde)Nuclear (SMR)Gas - Steam TurbineGas - Combined CycleGas - Combustion TurbineBiomassGeothermalWindSolarBattery StorageImportsDemand ResponseHydrogenBTM SolarLoadExcess Generation
2021 2024 2025 2027 2031 2035 2040 2045Installed Capacity (MW)
622 622 622 622 622 622 622 622 - - - - - - - - 426 307 307 307 234 - - - 493 493 493 493 493 266 266 266 503 731 731 731 668 1043 1247 1411 - - - - - - - - - - - - - - - - - - 119 119 119 119 119 260 115 385 662 662 1040 1304 1377 1643 - 50 235 327 708 1042 1142 1292 - - - - - - - - 46 53 56 61 71 81 93 93
- - - - - - - - 18 65 80 108 166 221 289 368
- - - - - - - - - - - - - - - - 622 622 622 622 622 622 622 622 - - - - - - - - 426 234 234 144 144 - - - 493 493 493 266 266 266 266 266 503 731 731 829 766 869 1058 1216 - - - - - - - - - - - - - - - - - - 109 109 109 109 109 197 115 385 767 767 1027 1229 1302 1561 - 50 183 432 756 1027 1128 1277 - - - - - - - - 46 53 56 61 71 81 93 93
- - - - - - - - 18 65 80 108 166 221 289 368
- - - - - - - - - - - - - - - - 622 622 622 622 622 622 622 622 - - - - - - - - 426 307 307 307 234 - - - 493 493 493 493 493 266 266 266 503 731 731 731 668 668 668 668 - - - - - - - - - - - - - - - - - - 120 120 120 120 120 132 115 385 606 606 818 1876 2580 3422 - 50 177 177 483 1585 2342 3200 - - - - - - - - 46 53 56 61 71 81 93 93
- - - - - - - - 18 65 80 108 166 221 289 368
- - - - - - - - - - - - - - - -
Attachment D-3 E3 EPE Report Model Results AugustPage 15 of 34
Scenario Resource TypeLow Carbon Price Nuclear (Palo Verde)
Nuclear (SMR)Gas - Steam TurbineGas - Combined CycleGas - Combustion TurbineBiomassGeothermalWindSolarBattery StorageImportsDemand ResponseHydrogenBTM SolarLoadExcess Generation
Mid Carbon Price Nuclear (Palo Verde)Nuclear (SMR)Gas - Steam TurbineGas - Combined CycleGas - Combustion TurbineBiomassGeothermalWindSolarBattery StorageImportsDemand ResponseHydrogenBTM SolarLoadExcess Generation
High Carbon Price Nuclear (Palo Verde)Nuclear (SMR)Gas - Steam TurbineGas - Combined CycleGas - Combustion TurbineBiomassGeothermalWindSolarBattery StorageImportsDemand ResponseHydrogenBTM SolarLoadExcess Generation
2021 2024 2025 2027 2031 2035 2040 2045Installed Capacity (MW)
622 622 622 622 622 622 622 622 - - - - - - - - 426 307 307 307 234 - - - 493 493 493 493 493 266 266 266 503 731 731 731 668 840 1027 1164 - - - - - - - - - - - - - - - - - - 163 163 163 163 163 269 115 385 573 573 805 1309 1383 1738 - 50 176 176 470 1044 1145 1314 - - - - - - - - 46 53 56 61 71 81 93 93
- - - - - - - - 18 65 80 108 166 221 289 368
- - - - - - - - - - - - - - - - 622 622 622 622 622 622 622 622 - - - - - - - - 426 307 307 307 234 - - - 493 493 493 493 493 266 266 266 503 731 731 731 668 824 1006 1145 - - - - - - - - - - - - - - - - - - 238 238 238 238 238 300 115 385 633 633 791 1310 1400 1808 - 50 176 176 456 1045 1149 1334 - - - - - - - - 46 53 56 61 71 81 93 93
- - - - - - - - 18 65 80 108 166 221 289 368
- - - - - - - - - - - - - - - - 622 622 622 622 622 622 622 622 - - - - - - - - 426 307 307 307 234 - - - 493 493 493 493 493 266 266 266 503 731 731 731 668 817 944 944 - - - - - - - - - - - - - - - - - - 300 300 300 300 300 301 115 385 857 857 886 1310 1666 2536 - 50 176 176 445 1045 1206 2000 - - - - - - - - 46 53 56 61 71 81 93 93
- - - - - - - - 18 65 80 108 166 221 289 368
- - - - - - - - - - - - - - - -
Attachment D-3 E3 EPE Report Model Results AugustPage 16 of 34
Scenario Resource TypeHigh Gas Price Nuclear (Palo Verde)
Nuclear (SMR)Gas - Steam TurbineGas - Combined CycleGas - Combustion TurbineBiomassGeothermalWindSolarBattery StorageImportsDemand ResponseHydrogenBTM SolarLoadExcess Generation
Low Renewable and Storage Costs Nuclear (Palo Verde)Nuclear (SMR)Gas - Steam TurbineGas - Combined CycleGas - Combustion TurbineBiomassGeothermalWindSolarBattery StorageImportsDemand ResponseHydrogenBTM SolarLoadExcess Generation
2021 2024 2025 2027 2031 2035 2040 2045Installed Capacity (MW)
622 622 622 622 622 622 622 622 - - - - - - - - 426 307 307 307 234 - - - 493 493 493 493 493 266 266 266 503 731 731 731 668 848 1036 1170 - - - - - - - - - - - - - - - - - - 128 128 128 128 128 264 115 385 599 599 816 1309 1383 1710 - 50 177 177 481 1044 1145 1309 - - - - - - - - 46 53 56 61 71 81 93 93
- - - - - - - - 18 65 80 108 166 221 289 368
- - - - - - - - - - - - - - - - 622 622 622 622 622 622 622 622 - - - - - - - - 426 307 307 307 234 - - - 493 493 493 493 493 266 266 266 503 731 731 731 668 847 1034 1146 - - - - - - - - - - - - - - - - - - 160 160 160 160 160 300 115 385 525 525 806 1277 1351 1805 - 50 190 190 471 1037 1138 1335 - - - - - - - - 46 53 56 61 71 81 93 93
- - - - - - - - 18 65 80 108 166 221 289 368
- - - - - - - - - - - - - - - -
Attachment D-3 E3 EPE Report Model Results AugustPage 17 of 34
Scenario Resource TypeLeast-Cost (Reference Case) Nuclear (Palo Verde)
Nuclear (SMR)Gas - Steam TurbineGas - Combined CycleGas - Combustion TurbineBiomassGeothermalWindSolarBattery StorageImportsDemand ResponseHydrogenBTM SolarLoadExcess Generation
Least-Cost Case + REA Resources Nuclear (Palo Verde)Nuclear (SMR)Gas - Steam TurbineGas - Combined CycleGas - Combustion TurbineBiomassGeothermalWindSolarBattery StorageImportsDemand ResponseHydrogenBTM SolarLoadExcess Generation
Separate System Planning Nuclear (Palo Verde)Nuclear (SMR)Gas - Steam TurbineGas - Combined CycleGas - Combustion TurbineBiomassGeothermalWindSolarBattery StorageImportsDemand ResponseHydrogenBTM SolarLoadExcess Generation
2021 2024 2025 2027 2031 2035 2040 2045- - - - - - - - - - - - - - - - - - - - - - - - - - - - - - - - - 228 228 228 228 430 619 776 - - - - - - - - - - - - - - - - - - 102 102 102 102 102 197 - 270 506 506 708 1190 1291 1823 - 50 177 177 488 1029 1129 1327 - - - - - - - - 46 53 56 61 71 81 93 93
- - - - - - - - 18 65 80 108 166 221 289 368
- - - - - - - - - - - - - - - - - - - - - - - - - - - - - - - - - - - - - - - - - - - - - - - - - 228 228 228 228 369 502 611 - - - - - - - - - - - - - - - - - - 203 203 203 203 232 300 - 270 429 429 680 1369 1675 2299 - 50 176 177 460 1067 1246 1732 - - - - - - - - 46 53 56 61 71 81 93 93
- - - - - - - - 18 65 80 108 166 221 289 368
- - - - - - - - - - - - - - - - - - - - - - - - - - - - - - - - - - - - - - - - - - - - - - - - - 228 228 228 228 315 315 424 - - - - - - - - - - - - - - - - - - 49 49 49 49 49 161 - 270 524 524 744 1656 2432 2974 - 50 280 304 591 1514 2344 2724 - - - - - - - - 46 53 56 61 71 81 93 93
- - - - - - - - 18 65 80 108 166 221 289 368
- - - - - - - - - - - - - - - -
Cumulative Capacity Additions (MW)
Attachment D-3 E3 EPE Report Model Results AugustPage 18 of 34
Scenario Resource TypeSeparate System Planning (w H2) Nuclear (Palo Verde)
Nuclear (SMR)Gas - Steam TurbineGas - Combined CycleGas - Combustion TurbineBiomassGeothermalWindSolarBattery StorageImportsDemand ResponseHydrogenBTM SolarLoadExcess Generation
80 Clean by 2035 Nuclear (Palo Verde)Nuclear (SMR)Gas - Steam TurbineGas - Combined CycleGas - Combustion TurbineBiomassGeothermalWindSolarBattery StorageImportsDemand ResponseHydrogenBTM SolarLoadExcess Generation
20 CO2 Red by 2040 Nuclear (Palo Verde)Nuclear (SMR)Gas - Steam TurbineGas - Combined CycleGas - Combustion TurbineBiomassGeothermalWindSolarBattery StorageImportsDemand ResponseHydrogenBTM SolarLoadExcess Generation
2021 2024 2025 2027 2031 2035 2040 2045Cumulative Capacity Additions (MW)
- - - - - - - - - - - - - - - - - - - - - - - - - - - - - - - - - 228 228 228 228 315 315 424 - - - - - - - - - - - - - - - - - - 60 60 60 60 107 218 - 270 523 523 790 1267 1706 2293 - 50 278 303 570 1057 1496 1847 - - - - - - - - 46 53 56 61 71 81 93 93
- - - - - 123 206 212 18 65 80 108 166 221 289 368
- - - - - - - - - - - - - - - - - - - - - - - - - - - - - - - - - - - - - - - - - - - - - - - - - 228 228 228 228 470 582 709 - - - - - - - - - - - - - - - - - - 109 109 109 109 185 289 - 270 500 500 706 1188 1365 2061 - 50 177 177 486 968 1145 1377 - - - - - - - - 46 53 56 61 71 81 93 93
- - - - - - - - 18 65 80 108 166 221 289 368
- - - - - - - - - - - - - - - - - - - - - - - - - - - - - - - - - - - - - - - - - - - - - - - - - 228 228 228 228 470 596 698 - - - - - - - - - - - - - - - - - - 109 109 109 109 125 300 - 270 500 500 706 1188 1365 2099 - 50 177 177 486 968 1145 1409 - - - - - - - - 46 53 56 61 71 81 93 93
- - - - - - - - 18 65 80 108 166 221 289 368
- - - - - - - - - - - - - - - -
Attachment D-3 E3 EPE Report Model Results AugustPage 19 of 34
Scenario Resource Type40 CO2 Red by 2040 Nuclear (Palo Verde)
Nuclear (SMR)Gas - Steam TurbineGas - Combined CycleGas - Combustion TurbineBiomassGeothermalWindSolarBattery StorageImportsDemand ResponseHydrogenBTM SolarLoadExcess Generation
60 CO2 Red by 2040 Nuclear (Palo Verde)Nuclear (SMR)Gas - Steam TurbineGas - Combined CycleGas - Combustion TurbineBiomassGeothermalWindSolarBattery StorageImportsDemand ResponseHydrogenBTM SolarLoadExcess Generation
80 CO2 Red by 2040 Nuclear (Palo Verde)Nuclear (SMR)Gas - Steam TurbineGas - Combined CycleGas - Combustion TurbineBiomassGeothermalWindSolarBattery StorageImportsDemand ResponseHydrogenBTM SolarLoadExcess Generation
2021 2024 2025 2027 2031 2035 2040 2045Cumulative Capacity Additions (MW)
- - - - - - - - - - - - - - - - - - - - - - - - - - - - - - - - - 228 228 228 228 469 533 582 - - - - - - - - - - - - - - - - - - 109 109 109 109 239 300 - 270 500 500 706 1189 1545 2510 - 50 177 177 486 969 1184 1796 - - - - - - - - 46 53 56 61 71 81 93 93
- - - - - - - - 18 65 80 108 166 221 289 368
- - - - - - - - - - - - - - - - - - - - - - - - - - - - - - - - - - - - - - - - - - - - - - - - - 228 228 228 228 409 452 457 - - - - - - - - - - - - - - - - - - 128 128 128 128 301 302 - 270 484 484 701 1264 1947 3006 - 50 177 177 481 1044 1347 2195 - - - - - - - - 46 53 56 61 71 81 93 93
- - - - - - - - 18 65 80 108 166 221 289 368
- - - - - - - - - - - - - - - - - - - - - - - - - - - - - - - - - - - - - - - - - - - - - - - - - 228 228 228 228 338 338 338 - - - - - - - - - - - - - - - - - - 217 217 217 217 552 585 - 270 423 423 678 1510 2239 3269 - 50 176 177 458 1097 1645 2511 - - - - - - - - 46 53 56 61 71 81 93 93
- - - - - - - - 18 65 80 108 166 221 289 368
- - - - - - - - - - - - - - - -
Attachment D-3 E3 EPE Report Model Results AugustPage 20 of 34
Scenario Resource Type90 CO2 Red by 2040 Nuclear (Palo Verde)
Nuclear (SMR)Gas - Steam TurbineGas - Combined CycleGas - Combustion TurbineBiomassGeothermalWindSolarBattery StorageImportsDemand ResponseHydrogenBTM SolarLoadExcess Generation
100 CO2 Red by 2040 (w H2) Nuclear (Palo Verde)Nuclear (SMR)Gas - Steam TurbineGas - Combined CycleGas - Combustion TurbineBiomassGeothermalWindSolarBattery StorageImportsDemand ResponseHydrogenBTM SolarLoadExcess Generation
100 CO2 Red by 2040 Nuclear (Palo Verde)Nuclear (SMR)Gas - Steam TurbineGas - Combined CycleGas - Combustion TurbineBiomassGeothermalWindSolarBattery StorageImportsDemand ResponseHydrogenBTM SolarLoadExcess Generation
2021 2024 2025 2027 2031 2035 2040 2045Cumulative Capacity Additions (MW)
- - - - - - - - - - - - - - - - - - - - - - - - - - - - - - - - - 228 228 228 228 286 286 286 - - - - - - - - - - - - - - - - - - 224 224 224 224 801 828 - 270 420 420 786 1634 2282 3311 - 50 176 177 452 1284 1777 2645 - - - - - - - - 46 53 56 61 71 81 93 93
- - - - - - - - 18 65 80 108 166 221 289 368
- - - - - - - - - - - - - - - - - - - - - - - - - - - - - - - - - - - - - - - - - - - - - - - - - 228 228 228 228 248 - - - - - - - - - - - - - - - - - - - - 282 282 282 282 682 696 - 270 397 397 810 1756 2385 3440 - 50 176 177 445 1385 1955 2847 - - - - - - - - 46 53 56 61 71 81 93 93
- - - - - - 248 248 18 65 80 108 166 221 289 368
- - - - - - - - - - - - - - - - - - - - - - - - - - - - - - - - - - - - - - - - - - - - - - - - - 228 228 228 228 248 228 228 - - - - - - - - - - - - - - - - - - 120 120 282 282 1216 1605 - 270 491 491 810 1756 4833 5479 - 50 177 177 445 1385 6191 7520 - - - - - - - - 46 53 56 61 71 81 93 93
- - - - - - - - 18 65 80 108 166 221 289 701
- - - - - - - - - - - - - - - -
Attachment D-3 E3 EPE Report Model Results AugustPage 21 of 34
Scenario Resource TypeHigh DG Nuclear (Palo Verde)
Nuclear (SMR)Gas - Steam TurbineGas - Combined CycleGas - Combustion TurbineBiomassGeothermalWindSolarBattery StorageImportsDemand ResponseHydrogenBTM SolarLoadExcess Generation
High DSM Nuclear (Palo Verde)Nuclear (SMR)Gas - Steam TurbineGas - Combined CycleGas - Combustion TurbineBiomassGeothermalWindSolarBattery StorageImportsDemand ResponseHydrogenBTM SolarLoadExcess Generation
Low Load Nuclear (Palo Verde)Nuclear (SMR)Gas - Steam TurbineGas - Combined CycleGas - Combustion TurbineBiomassGeothermalWindSolarBattery StorageImportsDemand ResponseHydrogenBTM SolarLoadExcess Generation
2021 2024 2025 2027 2031 2035 2040 2045Cumulative Capacity Additions (MW)
- - - - - - - - - - - - - - - - - - - - - - - - - - - - - - - - - 228 228 228 228 420 586 788 - - - - - - - - - - - - - - - - - - 96 96 96 96 96 203 - 270 396 396 569 965 1089 1280 - 50 176 176 479 1041 1166 1313 - - - - - - - - 46 53 56 61 71 81 93 93
- - - - - - - - 42 169 210 293 455 614 809 1032
- - - - - - - - - - - - - - - - - - - - - - - - - - - - - - - - - - - - - - - - - - - - - - - - - 228 228 228 228 338 502 618 - - - - - - - - - - - - - - - - - - - - - - - 128 - 270 404 404 523 1104 1194 1648 - 50 184 184 406 1001 1091 1263 - - - - - - - - 49 66 71 82 100 101 103 103
- - - - - - - - 18 65 80 108 166 221 289 368
- - - - - - - - - - - - - - - - - - - - - - - - - - - - - - - - - - - - - - - - - - - - - - - - - 228 228 228 228 284 456 579 - - - - - - - - - - - - - - - - - - - - - - - 141 - 270 406 406 513 1140 1243 1739 - 50 186 186 355 1019 1121 1312 - - - - - - - - 46 53 56 61 71 81 93 93
- - - - - - - - 18 65 80 108 166 221 289 368
- - - - - - - - - - - - - - - -
Attachment D-3 E3 EPE Report Model Results AugustPage 22 of 34
Scenario Resource TypeHigh Load Nuclear (Palo Verde)
Nuclear (SMR)Gas - Steam TurbineGas - Combined CycleGas - Combustion TurbineBiomassGeothermalWindSolarBattery StorageImportsDemand ResponseHydrogenBTM SolarLoadExcess Generation
No Lifetime Extensions Nuclear (Palo Verde)Nuclear (SMR)Gas - Steam TurbineGas - Combined CycleGas - Combustion TurbineBiomassGeothermalWindSolarBattery StorageImportsDemand ResponseHydrogenBTM SolarLoadExcess Generation
No New Gas Nuclear (Palo Verde)Nuclear (SMR)Gas - Steam TurbineGas - Combined CycleGas - Combustion TurbineBiomassGeothermalWindSolarBattery StorageImportsDemand ResponseHydrogenBTM SolarLoadExcess Generation
2021 2024 2025 2027 2031 2035 2040 2045Cumulative Capacity Additions (MW)
- - - - - - - - - - - - - - - - - - - - - - - - - - - - - - - - - 228 228 228 228 603 807 971 - - - - - - - - - - - - - - - - - - 119 119 119 119 119 260 - 270 547 547 925 1259 1359 1905 - 50 235 327 708 1042 1142 1342 - - - - - - - - 46 53 56 61 71 81 93 93
- - - - - - - - 18 65 80 108 166 221 289 368
- - - - - - - - - - - - - - - - - - - - - - - - - - - - - - - - - - - - - - - - - - - - - - - - - 228 228 326 326 429 618 776 - - - - - - - - - - - - - - - - - - 109 109 109 109 109 197 - 270 652 652 912 1184 1284 1823 - 50 183 432 756 1027 1128 1327 - - - - - - - - 46 53 56 61 71 81 93 93
- - - - - - - - 18 65 80 108 166 221 289 368
- - - - - - - - - - - - - - - - - - - - - - - - - - - - - - - - - - - - - - - - - - - - - - - - - 228 228 228 228 228 228 228 - - - - - - - - - - - - - - - - - - 120 120 120 120 120 132 - 270 491 491 703 1831 2562 3684 - 50 177 177 483 1585 2342 3250 - - - - - - - - 46 53 56 61 71 81 93 93
- - - - - - - - 18 65 80 108 166 221 289 368
- - - - - - - - - - - - - - - -
Attachment D-3 E3 EPE Report Model Results AugustPage 23 of 34
Scenario Resource TypeLow Carbon Price Nuclear (Palo Verde)
Nuclear (SMR)Gas - Steam TurbineGas - Combined CycleGas - Combustion TurbineBiomassGeothermalWindSolarBattery StorageImportsDemand ResponseHydrogenBTM SolarLoadExcess Generation
Mid Carbon Price Nuclear (Palo Verde)Nuclear (SMR)Gas - Steam TurbineGas - Combined CycleGas - Combustion TurbineBiomassGeothermalWindSolarBattery StorageImportsDemand ResponseHydrogenBTM SolarLoadExcess Generation
High Carbon Price Nuclear (Palo Verde)Nuclear (SMR)Gas - Steam TurbineGas - Combined CycleGas - Combustion TurbineBiomassGeothermalWindSolarBattery StorageImportsDemand ResponseHydrogenBTM SolarLoadExcess Generation
2021 2024 2025 2027 2031 2035 2040 2045Cumulative Capacity Additions (MW)
- - - - - - - - - - - - - - - - - - - - - - - - - - - - - - - - - 228 228 228 228 400 587 724 - - - - - - - - - - - - - - - - - - 163 163 163 163 163 269 - 270 458 458 690 1264 1365 2000 - 50 176 176 470 1044 1145 1364 - - - - - - - - 46 53 56 61 71 81 93 93
- - - - - - - - 18 65 80 108 166 221 289 368
- - - - - - - - - - - - - - - - - - - - - - - - - - - - - - - - - - - - - - - - - - - - - - - - - 228 228 228 228 384 566 705 - - - - - - - - - - - - - - - - - - 238 238 238 238 238 300 - 270 518 518 676 1265 1382 2070 - 50 176 176 456 1045 1149 1384 - - - - - - - - 46 53 56 61 71 81 93 93
- - - - - - - - 18 65 80 108 166 221 289 368
- - - - - - - - - - - - - - - - - - - - - - - - - - - - - - - - - - - - - - - - - - - - - - - - - 228 228 228 228 377 504 504 - - - - - - - - - - - - - - - - - - 300 300 300 300 300 301 - 270 742 742 771 1265 1648 2798 - 50 176 176 445 1045 1206 2050 - - - - - - - - 46 53 56 61 71 81 93 93
- - - - - - - - 18 65 80 108 166 221 289 368
- - - - - - - - - - - - - - - -
Attachment D-3 E3 EPE Report Model Results AugustPage 24 of 34
Scenario Resource TypeHigh Gas Price Nuclear (Palo Verde)
Nuclear (SMR)Gas - Steam TurbineGas - Combined CycleGas - Combustion TurbineBiomassGeothermalWindSolarBattery StorageImportsDemand ResponseHydrogenBTM SolarLoadExcess Generation
Low Renewable and Storage Costs Nuclear (Palo Verde)Nuclear (SMR)Gas - Steam TurbineGas - Combined CycleGas - Combustion TurbineBiomassGeothermalWindSolarBattery StorageImportsDemand ResponseHydrogenBTM SolarLoadExcess Generation
2021 2024 2025 2027 2031 2035 2040 2045Cumulative Capacity Additions (MW)
- - - - - - - - - - - - - - - - - - - - - - - - - - - - - - - - - 228 228 228 228 408 596 730 - - - - - - - - - - - - - - - - - - 128 128 128 128 128 264 - 270 484 484 701 1264 1365 1972 - 50 177 177 481 1044 1145 1359 - - - - - - - - 46 53 56 61 71 81 93 93
- - - - - - - - 18 65 80 108 166 221 289 368
- - - - - - - - - - - - - - - - - - - - - - - - - - - - - - - - - - - - - - - - - - - - - - - - - 228 228 228 228 407 594 706 - - - - - - - - - - - - - - - - - - 160 160 160 160 160 300 - 270 410 410 691 1232 1333 2067 - 50 190 190 471 1037 1138 1385 - - - - - - - - 46 53 56 61 71 81 93 93
- - - - - - - - 18 65 80 108 166 221 289 368
- - - - - - - - - - - - - - - -
Attachment D-3 E3 EPE Report Model Results AugustPage 25 of 34
Scenario Resource TypeLeast-Cost (Reference Case) Nuclear (Palo Verde)
Nuclear (SMR)Gas - Steam TurbineGas - Combined CycleGas - Combustion TurbineBiomassGeothermalWindSolarBattery StorageImportsDemand ResponseHydrogenBTM SolarLoadExcess Generation
Least-Cost Case + REA Resources Nuclear (Palo Verde)Nuclear (SMR)Gas - Steam TurbineGas - Combined CycleGas - Combustion TurbineBiomassGeothermalWindSolarBattery StorageImportsDemand ResponseHydrogenBTM SolarLoadExcess Generation
Separate System Planning Nuclear (Palo Verde)Nuclear (SMR)Gas - Steam TurbineGas - Combined CycleGas - Combustion TurbineBiomassGeothermalWindSolarBattery StorageImportsDemand ResponseHydrogenBTM SolarLoadExcess Generation
2021 2024 2025 2027 2031 2035 2040 2045- - - - - - - - - - - - - - - - - (119) (119) (119) (192) (426) (426) (426) - - - - - (227) (227) (227) - - - - (63) (63) (63) (63) - - - - - - - - - - - - - - - - - - - - - - - - - - - - - (70) (97) (377) - - - - - - - (50) - - - - - - - - - - - - - - - - - - - - - - - - - - - - - - - - - - - - - - - - - - - - - - - - - - - - - - - - - - - - - - - - - (119) (119) (119) (192) (426) (426) (426) - - - - - (227) (227) (227) - - - - (63) (63) (63) (63) - - - - - - - - - - - - - - - - - - - - - - - - - - - - - (70) (97) (377) - - - - - - - (50) - - - - - - - - - - - - - - - - - - - - - - - - - - - - - - - - - - - - - - - - - - - - - - - - - - - - - - - - - - - - - - - - - (119) (119) (119) (192) (426) (426) (426) - - - - - (227) (227) (227) - - - - (63) (63) (63) (63) - - - - - - - - - - - - - - - - - - - - - - - - - - - - - (70) (97) (377) - - - - - - - (50) - - - - - - - - - - - - - - - - - - - - - - - - - - - - - - - - - - - - - - - - - - - - - - - -
Cumulative Capacity Retirements (MW)
Attachment D-3 E3 EPE Report Model Results AugustPage 26 of 34
Scenario Resource TypeSeparate System Planning (w H2) Nuclear (Palo Verde)
Nuclear (SMR)Gas - Steam TurbineGas - Combined CycleGas - Combustion TurbineBiomassGeothermalWindSolarBattery StorageImportsDemand ResponseHydrogenBTM SolarLoadExcess Generation
80 Clean by 2035 Nuclear (Palo Verde)Nuclear (SMR)Gas - Steam TurbineGas - Combined CycleGas - Combustion TurbineBiomassGeothermalWindSolarBattery StorageImportsDemand ResponseHydrogenBTM SolarLoadExcess Generation
20 CO2 Red by 2040 Nuclear (Palo Verde)Nuclear (SMR)Gas - Steam TurbineGas - Combined CycleGas - Combustion TurbineBiomassGeothermalWindSolarBattery StorageImportsDemand ResponseHydrogenBTM SolarLoadExcess Generation
2021 2024 2025 2027 2031 2035 2040 2045Cumulative Capacity Retirements (MW)
- - - - - - - - - - - - - - - - - (119) (119) (119) (192) (426) (426) (426) - - - - - (227) (227) (227) - - - - (63) (63) (63) (63) - - - - - - - - - - - - - - - - - - - - - - - - - - - - - (70) (97) (377) - - - - - - - (50) - - - - - - - - - - - - - - - - - - - - - - - - - - - - - - - - - - - - - - - - - - - - - - - - - - - - - - - - - - - - - - - - - (119) (119) (119) (192) (426) (426) (426) - - - - - (227) (227) (227) - - - - (63) (63) (63) (63) - - - - - - - - - - - - - - - - - - - - - - - - - - - - - (70) (97) (377) - - - - - - - (50) - - - - - - - - - - - - - - - - - - - - - - - - - - - - - - - - - - - - - - - - - - - - - - - - - - - - - - - - - - - - - - - - - (119) (119) (119) (192) (426) (426) (426) - - - - - (227) (227) (227) - - - - (63) (63) (63) (63) - - - - - - - - - - - - - - - - - - - - - - - - - - - - - (70) (97) (377) - - - - - - - (50) - - - - - - - - - - - - - - - - - - - - - - - - - - - - - - - - - - - - - - - - - - - - - - - -
Attachment D-3 E3 EPE Report Model Results AugustPage 27 of 34
Scenario Resource Type40 CO2 Red by 2040 Nuclear (Palo Verde)
Nuclear (SMR)Gas - Steam TurbineGas - Combined CycleGas - Combustion TurbineBiomassGeothermalWindSolarBattery StorageImportsDemand ResponseHydrogenBTM SolarLoadExcess Generation
60 CO2 Red by 2040 Nuclear (Palo Verde)Nuclear (SMR)Gas - Steam TurbineGas - Combined CycleGas - Combustion TurbineBiomassGeothermalWindSolarBattery StorageImportsDemand ResponseHydrogenBTM SolarLoadExcess Generation
80 CO2 Red by 2040 Nuclear (Palo Verde)Nuclear (SMR)Gas - Steam TurbineGas - Combined CycleGas - Combustion TurbineBiomassGeothermalWindSolarBattery StorageImportsDemand ResponseHydrogenBTM SolarLoadExcess Generation
2021 2024 2025 2027 2031 2035 2040 2045Cumulative Capacity Retirements (MW)
- - - - - - - - - - - - - - - - - (119) (119) (119) (192) (426) (426) (426) - - - - - (227) (227) (227) - - - - (63) (63) (63) (63) - - - - - - - -- - - - - - - -- - - - - - - -- - - - - (70) (97) (377) - - - - - - - (50) - - - - - - - -- - - - - - - -- - - - - - - -- - - - - - - -- - - - - - - -- - - - - - - -- - - - - - - -- - - - - - - -- (119) (119) (119) (192) (426) (426) (426) - - - - - (227) (227) (227) - - - - (63) (63) (63) (63) - - - - - - - -- - - - - - - -- - - - - - - -- - - - - (70) (97) (377) - - - - - - - (50) - - - - - - - -- - - - - - - -- - - - - - - -- - - - - - - -- - - - - - - -- - - - - - - -- - - - - - - -- - - - - - - -- (119) (119) (119) (192) (426) (426) (426) - - - - - (227) (227) (227) - - - - (63) (63) (63) (63) - - - - - - - -- - - - - - - -- - - - - - - -- - - - - (70) (97) (377) - - - - - - - (50) - - - - - - - -- - - - - - - -- - - - - - - -- - - - - - - -- - - - - - - -- - - - - - - -
Attachment D-3 E3 EPE Report Model Results AugustPage 28 of 34
Scenario Resource Type90 CO2 Red by 2040 Nuclear (Palo Verde)
Nuclear (SMR)Gas - Steam TurbineGas - Combined CycleGas - Combustion TurbineBiomassGeothermalWindSolarBattery StorageImportsDemand ResponseHydrogenBTM SolarLoadExcess Generation
100 CO2 Red by 2040 (w H2) Nuclear (Palo Verde)Nuclear (SMR)Gas - Steam TurbineGas - Combined CycleGas - Combustion TurbineBiomassGeothermalWindSolarBattery StorageImportsDemand ResponseHydrogenBTM SolarLoadExcess Generation
100 CO2 Red by 2040 Nuclear (Palo Verde)Nuclear (SMR)Gas - Steam TurbineGas - Combined CycleGas - Combustion TurbineBiomassGeothermalWindSolarBattery StorageImportsDemand ResponseHydrogenBTM SolarLoadExcess Generation
2021 2024 2025 2027 2031 2035 2040 2045Cumulative Capacity Retirements (MW)
- - - - - - - - - - - - - - - - - (119) (119) (119) (192) (426) (426) (426) - - - - - (227) (227) (227) - - - - (63) (63) (63) (63) - - - - - - - - - - - - - - - - - - - - - - - - - - - - - (70) (97) (377) - - - - - - - (50) - - - - - - - - - - - - - - - - - - - - - - - - - - - - - - - - - - - - - - - - - - - - - - - - - - - - - - - - - - - - - - - - - (119) (119) (119) (192) (426) (426) (426) - - - - - (227) (227) (227) - - - - (63) (63) (63) (63) - - - - - - - - - - - - - - - - - - - - - - - - - - - - - (70) (97) (377) - - - - - - - (50) - - - - - - - - - - - - - - - - - - - - - - - - - - - - - - - - - - - - - - - - - - - - - - - - - - - - - - - - - - - - - - - - - (119) (119) (119) (192) (426) (426) (426) - - - - - (227) (227) (227) - - - - (63) (63) (63) (63) - - - - - - - - - - - - - - - - - - - - - - - - - - - - - (70) (97) (377) - - - - - - - (50) - - - - - - - - - - - - - - - - - - - - - - - - - - - - - - - - - - - - - - - - - - - - - - - -
Attachment D-3 E3 EPE Report Model Results AugustPage 29 of 34
Scenario Resource TypeHigh DG Nuclear (Palo Verde)
Nuclear (SMR)Gas - Steam TurbineGas - Combined CycleGas - Combustion TurbineBiomassGeothermalWindSolarBattery StorageImportsDemand ResponseHydrogenBTM SolarLoadExcess Generation
High DSM Nuclear (Palo Verde)Nuclear (SMR)Gas - Steam TurbineGas - Combined CycleGas - Combustion TurbineBiomassGeothermalWindSolarBattery StorageImportsDemand ResponseHydrogenBTM SolarLoadExcess Generation
Low Load Nuclear (Palo Verde)Nuclear (SMR)Gas - Steam TurbineGas - Combined CycleGas - Combustion TurbineBiomassGeothermalWindSolarBattery StorageImportsDemand ResponseHydrogenBTM SolarLoadExcess Generation
2021 2024 2025 2027 2031 2035 2040 2045Cumulative Capacity Retirements (MW)
- - - - - - - - - - - - - - - - - (119) (119) (119) (192) (426) (426) (426) - - - - - (227) (227) (227) - - - - (63) (63) (63) (63) - - - - - - - - - - - - - - - - - - - - - - - - - - - - - (70) (97) (377) - - - - - - - (50) - - - - - - - - - - - - - - - - - - - - - - - - - - - - - - - - - - - - - - - - - - - - - - - - - - - - - - - - - - - - - - - - - (119) (119) (119) (192) (426) (426) (426) - - - - - (227) (227) (227) - - - - (63) (63) (63) (63) - - - - - - - - - - - - - - - - - - - - - - - - - - - - - (70) (97) (377) - - - - - - - (50) - - - - - - - - - - - - - - - - - - - - - - - - - - - - - - - - - - - - - - - - - - - - - - - - - - - - - - - - - - - - - - - - - (119) (119) (119) (192) (426) (426) (426) - - - - - (227) (227) (227) - - - - (63) (63) (63) (63) - - - - - - - - - - - - - - - - - - - - - - - - - - - - - (70) (97) (377) - - - - - - - (50) - - - - - - - - - - - - - - - - - - - - - - - - - - - - - - - - - - - - - - - - - - - - - - - -
Attachment D-3 E3 EPE Report Model Results AugustPage 30 of 34
Scenario Resource TypeHigh Load Nuclear (Palo Verde)
Nuclear (SMR)Gas - Steam TurbineGas - Combined CycleGas - Combustion TurbineBiomassGeothermalWindSolarBattery StorageImportsDemand ResponseHydrogenBTM SolarLoadExcess Generation
No Lifetime Extensions Nuclear (Palo Verde)Nuclear (SMR)Gas - Steam TurbineGas - Combined CycleGas - Combustion TurbineBiomassGeothermalWindSolarBattery StorageImportsDemand ResponseHydrogenBTM SolarLoadExcess Generation
No New Gas Nuclear (Palo Verde)Nuclear (SMR)Gas - Steam TurbineGas - Combined CycleGas - Combustion TurbineBiomassGeothermalWindSolarBattery StorageImportsDemand ResponseHydrogenBTM SolarLoadExcess Generation
2021 2024 2025 2027 2031 2035 2040 2045Cumulative Capacity Retirements (MW)
- - - - - - - - - - - - - - - - - (119) (119) (119) (192) (426) (426) (426) - - - - - (227) (227) (227) - - - - (63) (63) (63) (63) - - - - - - - - - - - - - - - - - - - - - - - - - - - - - (70) (97) (377) - - - - - - - (50) - - - - - - - - - - - - - - - - - - - - - - - - - - - - - - - - - - - - - - - - - - - - - - - - - - - - - - - - - - - - - - - - - (192) (192) (282) (282) (426) (426) (426) - - - (227) (227) (227) (227) (227) - - - - (63) (63) (63) (63) - - - - - - - - - - - - - - - - - - - - - - - - - - - - - (70) (97) (377) - - - - - - - (50) - - - - - - - - - - - - - - - - - - - - - - - - - - - - - - - - - - - - - - - - - - - - - - - - - - - - - - - - - - - - - - - - - (119) (119) (119) (192) (426) (426) (426) - - - - - (227) (227) (227) - - - - (63) (63) (63) (63) - - - - - - - - - - - - - - - - - - - - - - - - - - - - - (70) (97) (377) - - - - - - - (50) - - - - - - - - - - - - - - - - - - - - - - - - - - - - - - - - - - - - - - - - - - - - - - - -
Attachment D-3 E3 EPE Report Model Results AugustPage 31 of 34
Scenario Resource TypeLow Carbon Price Nuclear (Palo Verde)
Nuclear (SMR)Gas - Steam TurbineGas - Combined CycleGas - Combustion TurbineBiomassGeothermalWindSolarBattery StorageImportsDemand ResponseHydrogenBTM SolarLoadExcess Generation
Mid Carbon Price Nuclear (Palo Verde)Nuclear (SMR)Gas - Steam TurbineGas - Combined CycleGas - Combustion TurbineBiomassGeothermalWindSolarBattery StorageImportsDemand ResponseHydrogenBTM SolarLoadExcess Generation
High Carbon Price Nuclear (Palo Verde)Nuclear (SMR)Gas - Steam TurbineGas - Combined CycleGas - Combustion TurbineBiomassGeothermalWindSolarBattery StorageImportsDemand ResponseHydrogenBTM SolarLoadExcess Generation
2021 2024 2025 2027 2031 2035 2040 2045Cumulative Capacity Retirements (MW)
- - - - - - - - - - - - - - - - - (119) (119) (119) (192) (426) (426) (426) - - - - - (227) (227) (227) - - - - (63) (63) (63) (63) - - - - - - - - - - - - - - - - - - - - - - - - - - - - - (70) (97) (377) - - - - - - - (50) - - - - - - - - - - - - - - - - - - - - - - - - - - - - - - - - - - - - - - - - - - - - - - - - - - - - - - - - - - - - - - - - - (119) (119) (119) (192) (426) (426) (426) - - - - - (227) (227) (227) - - - - (63) (63) (63) (63) - - - - - - - - - - - - - - - - - - - - - - - - - - - - - (70) (97) (377) - - - - - - - (50) - - - - - - - - - - - - - - - - - - - - - - - - - - - - - - - - - - - - - - - - - - - - - - - - - - - - - - - - - - - - - - - - - (119) (119) (119) (192) (426) (426) (426) - - - - - (227) (227) (227) - - - - (63) (63) (63) (63) - - - - - - - - - - - - - - - - - - - - - - - - - - - - - (70) (97) (377) - - - - - - - (50) - - - - - - - - - - - - - - - - - - - - - - - - - - - - - - - - - - - - - - - - - - - - - - - -
Attachment D-3 E3 EPE Report Model Results AugustPage 32 of 34
Scenario Resource TypeHigh Gas Price Nuclear (Palo Verde)
Nuclear (SMR)Gas - Steam TurbineGas - Combined CycleGas - Combustion TurbineBiomassGeothermalWindSolarBattery StorageImportsDemand ResponseHydrogenBTM SolarLoadExcess Generation
Low Renewable and Storage Costs Nuclear (Palo Verde)Nuclear (SMR)Gas - Steam TurbineGas - Combined CycleGas - Combustion TurbineBiomassGeothermalWindSolarBattery StorageImportsDemand ResponseHydrogenBTM SolarLoadExcess Generation
2021 2024 2025 2027 2031 2035 2040 2045Cumulative Capacity Retirements (MW)
- - - - - - - - - - - - - - - - - (119) (119) (119) (192) (426) (426) (426) - - - - - (227) (227) (227) - - - - (63) (63) (63) (63) - - - - - - - - - - - - - - - - - - - - - - - - - - - - - (70) (97) (377) - - - - - - - (50) - - - - - - - - - - - - - - - - - - - - - - - - - - - - - - - - - - - - - - - - - - - - - - - - - - - - - - - - - - - - - - - - - (119) (119) (119) (192) (426) (426) (426) - - - - - (227) (227) (227) - - - - (63) (63) (63) (63) - - - - - - - - - - - - - - - - - - - - - - - - - - - - - (70) (97) (377) - - - - - - - (50) - - - - - - - - - - - - - - - - - - - - - - - - - - - - - - - - - - - - - - - - - - - - - - - -
Attachment D-3 E3 EPE Report Model Results AugustPage 33 of 34
Scenario 2021 2024 2025 2027 2031 2035 2040 2045Least-Cost (Reference Case) 246$ 233$ 245$ 262$ 284$ 340$ 402$ 498$ Least-Cost Case + REA Resources 246$ 233$ 247$ 262$ 285$ 343$ 406$ 506$ Separate System Planning 247$ 233$ 250$ 268$ 293$ 369$ 473$ 571$ Separate System Planning (w H2) 247$ 233$ 251$ 268$ 293$ 348$ 438$ 536$ 80 Clean by 2035 246$ 233$ 245$ 262$ 284$ 342$ 402$ 498$ 20 CO2 Red by 2040 246$ 233$ 245$ 262$ 284$ 342$ 402$ 499$ 40 CO2 Red by 2040 246$ 233$ 245$ 262$ 284$ 342$ 405$ 512$ 60 CO2 Red by 2040 246$ 233$ 246$ 262$ 284$ 341$ 419$ 531$ 80 CO2 Red by 2040 246$ 233$ 247$ 262$ 284$ 347$ 463$ 577$ 90 CO2 Red by 2040 246$ 233$ 247$ 263$ 287$ 357$ 500$ 615$ 100 CO2 Red by 2040 (w H2) 246$ 233$ 249$ 264$ 289$ 367$ 551$ 663$ 100 CO2 Red by 2040 246$ 233$ 245$ 262$ 289$ 367$ 1113$ 1282$ High DG 245$ 231$ 241$ 256$ 277$ 325$ 382$ 470$ High DSM 245$ 230$ 239$ 254$ 271$ 313$ 367$ 450$ Low Load 239$ 227$ 236$ 252$ 269$ 312$ 371$ 460$ High Load 253$ 239$ 255$ 276$ 307$ 374$ 441$ 540$ No Lifetime Extensions 246$ 228$ 243$ 266$ 298$ 344$ 406$ 502$ No New Gas 246$ 233$ 245$ 262$ 284$ 367$ 453$ 570$ Low Carbon Price 291$ 277$ 284$ 301$ 323$ 379$ 444$ 543$ Mid Carbon Price 358$ 341$ 341$ 358$ 381$ 436$ 505$ 611$ High Carbon Price 469$ 449$ 432$ 451$ 475$ 529$ 603$ 718$ High Gas Price 257$ 242$ 251$ 268$ 291$ 347$ 412$ 509$ Low Renewable and Storage Costs 246$ 233$ 240$ 256$ 274$ 321$ 379$ 463$
Annual Revenue Requirement ($MM)
Attachment D-3 E3 EPE Report Model Results AugustPage 34 of 34
Scenario Clean Energy Type 2021 2024 2025 2027 2031 2035 2040 2045Least-Cost (Reference Case) Renewable 4 12 21 21 27 34 36 39
Zero Carbon 62 68 77 75 77 81 77 75Least-Cost Case + REA Resources Renewable 4 12 24 24 30 39 43 49
Zero Carbon 62 68 79 78 80 85 84 84Separate System Planning Renewable 4 12 20 21 26 38 42 46
Zero Carbon 62 68 76 75 76 84 83 82Separate System Planning (w H2) Renewable 4 12 21 21 27 34 41 45
Zero Carbon 62 68 76 75 77 81 82 8180 Clean by 2035 Renewable 4 12 21 22 27 34 39 45
Zero Carbon 62 68 77 76 77 81 80 8020 CO2 Red by 2040 Renewable 4 12 21 22 27 34 37 46
Zero Carbon 62 68 77 76 77 81 78 8140 CO2 Red by 2040 Renewable 4 12 21 22 27 34 43 51
Zero Carbon 62 68 77 76 77 81 84 8660 CO2 Red by 2040 Renewable 4 12 22 22 27 36 48 56
Zero Carbon 62 68 77 76 78 83 89 9180 CO2 Red by 2040 Renewable 4 12 24 24 30 41 54 60
Zero Carbon 62 68 79 78 81 87 94 9590 CO2 Red by 2040 Renewable 4 12 24 24 32 43 56 62
Zero Carbon 62 68 79 78 82 89 97 98100 CO2 Red by 2040 (w H2) Renewable 4 12 25 26 34 45 56 62
Zero Carbon 62 68 81 79 84 92 100 100100 CO2 Red by 2040 Renewable 4 12 22 22 34 45 60 65
Zero Carbon 62 68 77 76 84 92 100 100High DG Renewable 4 13 21 22 27 35 37 39
Zero Carbon 63 70 76 75 77 82 78 74High DSM Renewable 4 12 16 16 20 31 32 37
Zero Carbon 63 69 73 72 73 80 76 75Low Load Renewable 4 12 16 16 19 31 33 38
Zero Carbon 64 70 73 72 72 79 75 75High Load Renewable 4 12 23 24 31 36 36 41
Zero Carbon 61 66 77 76 79 80 76 75No Lifetime Extensions Renewable 4 12 23 26 31 35 36 39
Zero Carbon 62 68 79 80 81 81 77 75No New Gas Renewable 4 12 22 22 27 42 50 57
Zero Carbon 62 68 77 76 77 88 90 92Low Carbon Price Renewable 4 12 23 23 28 37 38 43
Zero Carbon 62 68 78 77 79 83 79 79Mid Carbon Price Renewable 4 12 26 26 31 39 41 45
Zero Carbon 62 68 81 80 81 86 82 81High Carbon Price Renewable 4 12 30 31 34 41 45 54
Zero Carbon 62 68 86 85 84 87 86 89High Gas Price Renewable 4 12 22 22 27 36 37 43
Zero Carbon 62 68 77 76 78 82 78 78Low Renewable and Storage Costs Renewable 4 12 22 22 28 36 38 44
Zero Carbon 62 68 77 76 78 83 79 80
Clean Energy ( of Load)
BEFORE THE NEW MEXICO PUBLIC REGULATION COMMISSION
RULE 1773 NMAC FILING
EL PASO ELECTRIC COMPANY NOTICE OF 2021 INTEGRATED RESOURCE PLAN
2020-2021 PLANNING PROCESS AND PUBLIC ADVISORY PROCESS MEETINGS
DECLARATION OF CURTIS HUTCHESON OF NOTICE TO CUSTOMERS
I Curtis Hutcheson pursuant to Rule 1-011 NMRA state as follows
1 I affirm in writing under penalty of perjury under the laws of the State of New Mexico
that the following statements are true and correct
2 I am over 18 years of age and have personal knowledge of the facts stated herein I am
employed as Supervisor-Regulatory Case Management My business address is 100 N Stanton
Street El Paso Texas 79901
3 My responsibilities include the oversight and preparation of rate and regulatory filings
and compliance with the various regulatory requirements of the jurisdictions in which EPE
operates
4 Pursuant to Rule 17739H(1) NMAC the New Mexico Public Regulation Commission
(ldquoCommissionrdquo) requires EPE to provide notice of EPErsquos 2021 Integrated Resource Planrsquos
2020-2021 Planning Process and Public Advisory Process Meetings in the utilityrsquos billing
inserts
5 EPE directly mailed the required notice to all existing New Mexico customers in a bill
insert between June 4 2020 and July 2 2020 A copy of the bill insert is attached as Exhibit A to
Attachment E-1 Proof of Notice
2
this Affirmation
6 EPE also published the notice in the Las Cruces Sun News on May 31 2020 The affidavit
and tear sheet are attached as Exhibit B to this Affirmation
7 EPE provided notice on June 4 2020 30 days prior to the first scheduled meeting on
July 10 2020 to the commission interveners in its most recent general rate case and
participants in its most recent renewable energy energy efficiency and IRP proceedings The
email of the notice and certificate of service is attached as Exhibit C to this Affirmation
I submit this Declaration based upon my personal knowledge and upon information
and belief in support of EPErsquos 2021 Integrated Resource Planrsquos 2020-2021 Planning Process
and Public Advisory Process Meetings
FURTHER DECLARANT SAYETH NAUGHT
I declare under penalty of perjury that the foregoing is true and correct
Executed on May 13 2021
__s Curtis Hutcheson________
CURTIS HUTCHESON
Attachment E-1 Proof of Notice
BEFORE THE NEW MEXICO PUBLIC REGULATION COMMISSION
RULE 1773 NMAC FILING
EL PASO ELECTRIC COMPANY
NOTICE OF 2021 INTEGRATED RESOURCE PLAN
2020-2021 PUBLIC ADVISORY PROCESS MEETINGS
Notice is hereby given that
El Paso Electric Company (EPE) invites members of the public to participate in the Integrated Resource
Plan (ldquoIRPrdquo) public advisory process through a series of public meetings With public participation EPE
will develop its IRP pursuant to the New Mexico Efficient Use of Energy Act and the New Mexico Public
Regulation Commissions (Commission) IRP Rule 1773 NMAC EPEs IRP is developed to identify cost-
effective demand-side and supply-side electricity resources to serve EPEs customers over the next 20-
year planning period
The IRP will be submitted to the Commission no later than July 2021 Public participation is an important
component of the development and implementation of EPEs integrated resource planning in New
Mexico EPE encourages interested members of the public to attend these public meetings to provide
public input and commentary whether as a residential or business customer or as a representative of a
trade non-profit neighborhood shareholder civic or other group
Given the currently effective limitations on public gatherings in New Mexico and Texas the first scheduled
meeting will be held electronically and by phone conference on July 10 2020 at 200 pm MDT The IRP
process will be explained and additional meeting dates and locations will be set at that time Prior to
each meeting the presentation for that meeting will be posted on EPEs website wwwepeletriccom If
you are interested in attending the meeting or otherwise participating in the process please contact EPE
by emailing NMIRPepelectriccom or calling at (915) 543- 4354
Exhibit A Page 1 of 1Attachment E-1 Proof of Notice
Exhibit B Page 1 of 2Attachment E-1 Proof of Notice
2H SUNDAY MAY 31 2020 LAS CRUCES SUN-NEWS
4B-501 Notice to creditors by publi-cation and notice to creditors bywritten notice (mailing or other de-livery)[For use with Rules 1B-304 1B-306and 1B-401 NMRA]
STATE OF NEW MEXICOIN THE PROBATE COURTDONA ANA COUNTY
No 20-0074
IN THE MATTER OF THEESTATE OF Juliet S WilliamsDECEASED
NOTICE TO CREDITORSNOTICE IS HEREBY GIVEN thatthe undersigned has been appointedpersonal representative of the es-tate of the decedent All personshaving claims against the estate ofthe decedent are required to presenttheir claims within four (4) monthsafter the date of the first publica-tion of any published notice to cred-itors or sixty (60) days after thedate of mailing or other delivery ofthis notice whichever is later orthe claims will be forever barredClaims must be presented either tothe undersigned personal represen-tative at the address below or filedwith the Probate Court of DonaAna 845 N Motel Blvd 1-201 LasCruces NM 88007Dated May 2020s Edwin James Williams Jrsignature of representative
Edwin James Williams JrPrinted Name
17093 White Pine RdStreet address
Beaver dam VA 23015City state and ZIP code
4213196 Sun-News May 31 andJun 7 14 2020
To advertise visit
SELL ITBUY IT
FIND ITcars
garage sales
tickets
jobs
antiques
motorcycles
computers
boats
sports equipment
pets
instruments
jewelry
furniture
tablets
auctions
yard sales
collectibles
appliances
cameras
coins
Place yourclassified ad today
FINDING WORK SHOULDNrsquoT BE WORK
Your job search ends here
Get started by visitingjobsusatodaycom
HVAC TECHNICIAN II
ACO amp CODES-LABORER
ANIMAL CONTROL OFFICER
DASO CADET-UNCERTIFIED
ROADS-EQUIPMENT OPERATOR
ELECTIONS SPECIALIST-TEMPORARY
ROADS-HEAVY EQUIPMENT OPERATOR
DETENTION CENTER OFFICER TRAINEE
DOCUMENT TECHNICIAN-DC DISPOSITIONS
ENVIRONMENTAL CODES ENFORCEMENT OFFICER
WATERWASTEWATER OPERATOR III
Job Application amp Job Announcements available on our Website atwwwdonaanacountyorg
Computer kiosks are available in the Human Resources Department
DONtildeA ANA COUNTYJOB VACANCIES
CAMINO REALREGIONAL UTILITY AUTHORITY
JOB VACANCIES
Demolition Build RoadsLeveling
Business amp Service Directoryto advertise email ServiceDirectorylcsun-newscom
or call 8007645620
Exhibit B Page 2 of 2Attachment E-1 Proof of Notice
From Griego PatriciaTo Burns Nancy Griego Patricia Jeffrey Wechsler Diana Luna Kari Olson Lorraine Talley John F McIntyre
Schichtl James Hutcheson Marvin C Novela Mariah M Parsons Judith M Pleasant Linda G Perea Araceli Gastevenslawgmailcom jvega-brownlas-crucesorg joprovenciolas-crucesorg llarocquelas-crucesorg marcydlas-crucesorg davilalas-crucesorg JAGlas-crucesorg hconnellylas-crucesorg ddollahonlas-crucesorg tomfdonaanacountyorg rockybacchusgmailcomecomaxaclifeisgood2com lellisnmsuedu ghauboldadnmsuedu jdrakemodrallcomnwinterstelznerlawcom kherrmannstelznerlawcom rgallegosstelznerlawcom Nobleccaegmailcomstephaniedzur-Lawcom Lundin Robert gelliotnmaggov Cholla Khoury lawofficejasonmarkscomJsmithwatsonlawlcgmailcom mayortrujillocityofanthonynmorg mlsouleshotmailcombthroneattynewmexicocom Goodin Nelson fredkdonaanacountyorg Rickvotesolarorgtasolomon6gmailcom Dahlharrishotmailcom Jdittmerutilitechnet Jaherzsawvelcomakharrigersawvelcom Borman Bradford PRC Reynolds John PRC Chavez Milo PRC Sidler Jack PRCjohnbogatkostatenmus marctuplerstatenmus gilberttfuentesstatenmus Sisneros Anthony R PRCLeyba-Tercero Elisha PRC Fisk Russell PRC Amer Judith PRC Smith Michael C PRC Martinez-Rael PeggyPRC elizabethramirezstatenmus carolynglickstatenmus Hurst Elizabeth PRCchristopherryanstatenmus philipbsimpsoncomcastnet Kylejsmith124civmailmilrobertagantoncivmailmil hgellerswenergyorg jbrantswenergyorg ctcolumbiaaolcomltougascleanenergyregresearchcom dgegaxnmsuedu Ramonablabersierracluborgsricdonearthlinknet smichelwesternresourcesorg Beadles Cydney PRCpatoconnellwesternresourcesorg aprilelliottwesternresourcesorg dneidcoxnet schaefnogmailcomdavidvw77com bslocumdwmrlawcom jmcnallydwmrlawcom mbarkerdwmrlawcommzidovskymontandcom
Cc EPE_Reg_MgmtSubject Rule 1773 NMAC Filing EPEs Notice of 2020-2021 Public Advisory Process Meetings for 2021 IRP amp COSDate Thursday June 4 2020 105041 AMAttachments 2021 IRP Noticepdf
COS Notice of IRP Processpdf
Good morning Attached is El Paso Electric Companyrsquos Notice of its 2020-2021 Public AdvisoryProcess Meetings for the 2021 Integrated Resource Plan and Certificate of Service that was filed byemail with NMPRC Records today
Patricia ldquoTrishrdquo Griego| El Paso Electric CompanyLegal Assistant300 Galisteo St Suite 206Santa Fe New Mexico 87501T (505) 982-4713 | C (505) 470-4048Patriciagriegoepelectriccom
CONFIDENTIALITY NOTICE The information contained in this electronic mailtransmission is CONFIDENTIAL and it may qualify as material protected pursuantto the Texas Uniform Trade Secrets Act the New Mexico Uniform Trade SecretsAct or other laws If you are not the intended recipient please destroydelete thismessage and any attachments and immediately notify the sender
Exhibit C Page 1 of 1Attachment E-1 Proof of Notice

Attachment B-5 Typical Days Tables
Page 3 of 10
Attachment B-5 Typical Days Tables
Page 4 of 10
Attachment B-5 Typical Days Tables
Page 5 of 10
Attachment B-5 Typical Days Tables
Page 6 of 10
Attachment B-5 Typical Days Tables
Page 7 of 10
Attachment B-5 Typical Days Tables
Page 8 of 10
Attachment B-5 Typical Days Tables
Page 9 of 10
Attachment B-5 Typical Days Tables
Page 10 of 10
Page 1 of 7
Attachment C-1 Transmission Facilities TABLE 1 Existing EPE Transmission Lines 115 kV and Above
EL PASO ELECTRIC COMPANY
Existing 115 kV and Above Internal Lines
RATING LENGTH STATE
From To kV Circuit MVA
Normal MVA
Emerg Miles From To AMRAD EMPIRE 345 1 400 400 12510 TX NM CALIENTE AMRAD 345 1 785 785 567 TX NM CALIENTE PICANTE 345 1 788 788 73 TX TX EMPIRE EDDY 345 1 836 836 05 NM NM HIDALGO GREENLEE 345 1 765 765 600 NM AZ LUNA AFTON 345 1 921 987 573 NM NM LUNA DIABLO 345 1 939 939 849 NM NM LUNA HIDALGO 345 1 659 659 505 NM NM MACHO SPRINGS
LUNA 345 1 1031 1390 249 NM NM
MACHO SPRINGS
SPRINGERVILLE 345 1 728 728 2014 NM AZ
NEWMAN ARROYO 345 1 700 700 303 TX NM NEWMAN AFTON 345 1 924 1028 299 TX NM PICANTE NEWMAN 345 1 786 786 162 TX TX WESTMESA ARROYO 345 1 680 680 2018 NM NM MIMBRES TAP AIRPORT 115 1 123 163 27 NM NM
AMRAD HOLLOMAN 115 1 121 121 225 NM NM ANTHONY ARROYO 115 1 114 114 244 NM NM ANTHONY BORDER STEEL 115 1 165 220 52 NM TX ANTHONY SALOPEK 115 1 165 220 173 NM NM ANTHONY NEWMAN 115 1 165 212 123 NM TX ANTHONY NUWAY 115 1 165 220 66 NM TX ASCARATE TROWBRIDGE 115 1 181 181 05 TX TX ASCARATE COPPER 115 1 185 246 14 TX TX ASCARATE JUAREZ 115 1 185 247 24 TX AUSTIN MARLOW 115 1 227 227 12 TX TX BIGGS BLISS
INDUSTRIAL 115 1 185 246 22 TX TX
BLISS INDUSTRIAL
LIBERTY 115 1 185 246 22 TX TX
BUTTERFIELD FT BLISS 115 1 135 180 19 TX TX CALIENTE DIAMOND HEAD 115 1 185 247 61 TX TX CALIENTE MPS 115 1 69 87 85 TX TX CALIENTE MPS 115 2 268 332 31 TX TX CALIENTE MPS 115 3 268 332 31 TX TX CALIENTE VISTA 115 1 166 221 66 TX TX CHAPARRAL ORO GRANDE 115 1 135 165 354 NM NM COPPER PENDALE 115 1 185 246 51 TX TX
Page 2 of 7
EL PASO ELECTRIC COMPANY Existing 115 kV and Above
Internal Lines
RATING LENGTH STATE
From To kV Circuit MVA
Normal MVA
Emerg Miles From To COYOTE RGC_DELL CITY 115 1 23 23 108 TX TX COYOTE MONTWOOD 115 1 185 246 79 TX NM CROMO RIO GRANDE 115 1 135 180 09 TX TX DIABLO RIO GRANDE 115 1 332 441 29 NM TX DIABLO RIO GRANDE 115 2 332 441 29 NM NM DIABLO JUAREZ 115 1 185 247 23 NM DIAMOND HEAD
LANE 115 1 185 247 28 TX TX
DURAZNO ASCARATE 115 1 185 246 33 TX NM DYER SHEARMAN 115 1 135 180 96 TX TX DYER AUSTIN 115 1 185 246 21 TX TX EXECUTIVE RIO GRANDE 115 1 271 359 29 TX TX FT BLISS AUSTIN 115 1 135 180 18 TX TX GLOBAL REACH
VISTA 115 1 329 329 30 TX TX
HATCH JORNADA 115 1 45 45 334 NM NM JORNADA ARROYO 115 1 79 79 49 NM NM LANE WRANGLER 115 1 165 220 10 TX TX LAS CRUCES ARROYO 115 1 165 220 41 NM NM LAS CRUCES SALOPEK 115 1 165 220 50 NM NM LEO EAST DYER 115 1 185 246 38 TX TX LEO EAST MILAGRO 115 1 185 246 44 TX TX LIBERTY GLOBAL REACH 115 1 185 246 26 TX TX MAR LARGO 115 1 29 29 114 NM NM MARLOW TROWBRIDGE 115 1 181 181 11 TX TX MESA AUSTIN 115 1 165 220 61 TX TX MESA RIO GRANDE 115 1 268 268 23 TX NM MILAGRO NEWMAN 115 1 185 246 63 TX TX MONTWOOD CALIENTE 115 1 185 246 50 TX TX MPS COYOTE 115 1 249 387 31 TX TX MPS MONTWOOD 115 1 249 387 70 TX TX NEWMAN CHAPARRAL 115 1 135 180 29 TX NM NEWMAN BUTTERFIELD 115 1 135 280 167 TX TX NEWMAN SHEARMAN 115 1 135 280 73 TX TX NEWMAN PIPELINE 115 1 185 246 98 TX TX NEWMAN PICANTE 115 1 185 246 136 TX TX NUWAY MONTOYA 115 1 165 220 36 TX TX ORO GRANDE AMRAD 115 1 135 165 123 NM NM ORO GRANDE WHITE SANDS 115 1 75 75 228 NM NM PATRIOT NEWMAN 115 1 135 180 15 TX TX PATRIOT CROMO 115 1 135 180 184 TX TX PELICANO HORIZON 115 1 185 246 67 TX TX
Page 3 of 7
EL PASO ELECTRIC COMPANY Existing 115 kV and Above
Internal Lines
RATING LENGTH STATE
From To kV Circuit MVA
Normal MVA
Emerg Miles From To PELICANO MONTWOOD 115 1 185 246 38 TX TX PENDALE LANE 115 1 185 246 15 TX TX PICANTE GLOBAL REACH 115 1 185 246 60 TX TX PICANTE BIGGS 115 1 185 246 23 TX TX PIPELINE BIGGS 115 1 135 180 136 TX TX RIO GRANDE RIPLEY 115 1 165 220 30 NM TX RIPLEY THORN 115 1 135 180 19 TX TX SALOPEK ARROYO 115 1 135 180 107 NM NM SANTA TERESA MONTOYA 115 1 185 246 74 NM TX SANTA TERESA DIABLO 115 1 169 225 89 NM NM SCOTSDALE VISTA 115 1 135 180 52 TX TX SOL LANE 115 1 135 180 21 TX TX SOL VISTA 115 1 185 246 20 TX TX SPARKS HORIZON 115 1 185 246 38 TX TX SUNSET NORTH DURAZNO 115 1 185 246 46 TX TX SUNSET NORTH EXECUTIVE 115 1 271 359 23 TX TX THORN MONTOYA 115 1 135 180 30 TX TX WRANGLER SPARKS 115 1 185 246 40 TX TX
- Internal refers to lines within EPEs Balancing Area including lines connecting EPE to neighboring utilities however not including line segments partially owned by EPE external to EPEs control area
- Some transmission lines were identified to be capacity limited by smaller jumpers connected at the substations The line ratings reflected in the above table are based on-line jumper upgrade assumptions
- The ratings are generally based on conductor thermal capacities but may be derated due to sag limitations or other factors
- RGC_DC is Rio Grande Electric Cooperative Dell City - Emerg is short for Emergency
Page 4 of 7
TABLE 2 Existing 115 kV EPE Substation Transformers
EL PASO ELECTRIC COMPANY
Existing 115 kV Load amp Step-up Substation Transformers
RATING Normal Emergency State
MVA MVA AIRPORT 115239 336 376 NM AMRAD 115249 85 95 NM
ANTHONY T1 115239 336 376 NM ANTHONY T2 115239 560 627 NM ARROYO T2 115239 336 376 NM ARROYO T4 115239 336 376 NM
ASCARATE T4 11569 112 1288 TX ASCARATE T5 11569 112 1288 TX
AUSTIN T1 115138 500 560 TX AUSTIN T2 115138 560 627 TX
BORDER STEEL 115 T1 115138 392 439 TX
BORDER STEEL 115 T2 115138 392 439 TX BUTTERFIELD T1 115138 300 336 TX BUTTERFIELD T2 115138 300 336 TX
CALIENTE T3 115138 336 376 TX CENTRAL TEMP T1 115138 336 376 TX
CHAPARRAL T1 115138 336 376 NM CHAPARRAL T2 115138 336 376 NM
COPPER T1 115138 300 336 TX COPPER GEN T2 138115 840 941 TX
COX T2 11569 560
644 NM COYOTE T1 115138 300 336 TX CROMO T1 115138 300 336 TX CROMO T2 115138 336 376 TX
DIAMOND HEAD T1 115138 336 376 TX DURAZNO T1 115138 336 376 TX
DYER T3 11569 112 1288 TX EMRLD T1 115138 125 140 NM
EXECUTIVE T1 115138 560 627 TX EXECUTIVE T2 115138 560 627 TX
FT BLISS T1 115138 560 627 TX FT BLISS T2 115132 280 314 TX
GLOBAL REACH T1 115138 336 376 TX GLOBAL REACH T2 115138 560 627 TX
Page 5 of 7
EL PASO ELECTRIC COMPANY
Existing 115 kV Load amp Step-up Substation Transformers
RATING Normal Emergency State
MVA MVA HATCH T1 115249 300 336 NM
HORIZON T1 115138 336 376 TX JORNADA T1 115239 336 376 NM JORNADA T2 115239 560 627 NM
LANE T1 11569 100 115 TX LANE T2 115138 300 336 TX
LAS CRUCES T1 115239 672 753 NM LAS CRUCES T2 115239 672 753 NM
LEO EAST T1 115138 336 376 TX LEO EAST T2 115138 336 376 TX
MAR T1 11542 112 125 NM MESA T1 115138 300 336 TX MESA T2 115138 336 376 TX
MILAGRO T1 115138 336 376 TX MILAGRO T2 115138 336 376 TX MILAGRO T3 115138 336 376 TX MONTOYA T1 115249 336 376 TX MONTOYA T2 115239 560 627 TX MONTOYA T3 115239 560 627 TX
MONTWOOD T1 115239 560 627 TX MONTWOOD T3 115239 560 627 TX
MPS T1 138115 1400 1568 TX MPS T2 138115 1400 1568 TX MPS T3 138115 1400 1568 TX MPS T4 138115 1400 1568 TX
NEWMAN G1(T2) 138115 1254 1405 TX NEWMAN G2 (T6) 138115 1254 1405 TX NEWMAN G3 (T8) 138115 1254 1405 TX
NEWMAN 4G1 (T11) 138115 1250 1400 TX NEWMAN 4G2 (T9) 138115 1250 1400 TX NEWMAN 4S1 (T13) 138115 1250 1400 TX NEWMAN 5G1 (T15) 138115 1300 1456 TX NEWMAN 5G2 (T16) 138115 1300 1456 TX NEWMAN 5S1 (T14) 138115 1750 196 TX
NUWAY T1 115239 560 627 TX NUWAY T2 115239 560 627 TX
Page 6 of 7
EL PASO ELECTRIC COMPANY
Existing 115 kV Load amp Step-up Substation Transformers
RATING Normal Emergency State
MVA MVA PATRIOT T1 115138 336 376 TX
PELICANO T1 115239 560 627 TX PELICANO T2 115239 560 627 TX PENDALE T1 115138 336 376 TX PENDALE T2 115138 560 627 TX PICACHO T1 115249 560 627 NM REDEYE T1 115138 140 157 NM
RIO GRANDE T1 11569 112 1288 NM RIO GRANDE T2 11569 112 1288 NM
RIO GRANDE G8 (T7) 175115 1680 1882 NM RIO GRANDE G9 (T17) 138115 1320 1478 NM
RIPLEY T1 115138 336 376 TX RIPLEY T2 115138 560 627 TX
SALOPEK T1 115249 280 314 NM SALOPEK T2 115249 280 314 NM SALOPEK T3 115249 280 314 NM
SANTA TERESA T1 115239 336 376 NM SANTA TERESA T2 115239 336 376 NM
SCOTSDALE T1 11569 112 1288 TX SCOTSDALE T4 115138 560 627 TX SCOTSDALE T5 115138 560 627 TX SHEARMAN T1 115138 300 336 TX
SOL T1 115138 336 376 TX SOL T2 115138 300 336 TX
SPARKS T1 115138 336 376 TX SPARKS T2 115138 560 627 TX SPARKS T3
11569 100 115 TX
SUNSET NORTH T1 115138 336 376 TX SUNSET NORTH T2 115138 336 376 TX SUNSET NORTH T3 11569 112 1288 TX
TALAVERA TEMP T1 115239 165 185 NM THORN T1 115138 336 376 TX THORN T2 115138 336 376 TX
TRIUMPH TEMP T1 115239 336 376 TX VISTA T1 115138 300 336 TX VISTA T2 115138 300 336 TX
Page 7 of 7
EL PASO ELECTRIC COMPANY
Existing 115 kV Load amp Step-up Substation Transformers
RATING Normal Emergency State
MVA MVA WHITE SANDS T1 115138 300 336 NM
WRANGLER T1 115138 500 560 TX
Attachment C-2 Existing Units Operating CharacteristicsCapacity Factor ()Resources 2021 2024 2025 2027 2031 2035 2040 2045Newman 1 2 0 0 0 0 0 0 0Newman 2 1 0 0 0 0 0 0 0Newman 3 10 3 0 1 0 0 0 0Newman 4 14 5 2 3 1 0 0 0Newman 5 64 54 38 41 44 40 41 47Newman 6 0 12 7 8 6 3 4 6Copper 2 0 0 0 0 0 0 0Montana 1 26 29 20 21 20 11 19 23Montana 2 26 28 19 21 21 14 23 24Montana 3 17 17 13 14 12 5 11 16Montana 4 50 42 30 32 28 23 28 28Rio Grande 7 0 0 0 0 0 0 0 0Rio Grande 8 3 1 0 0 0 0 0 0Rio Grande 9 13 5 2 3 3 0 0 2Gas Peaker 0 0 0 0 0 3 3 5Palo Verde 1 94 94 94 94 94 94 94 94Palo Verde 2 94 94 94 94 94 94 94 94Palo Verde 3 94 94 94 94 94 94 94 94
Fuel Cost ($000)Resources 2021 2024 2025 2027 2031 2035 2040 2045Newman 1 431$ -$ -$ -$ -$ -$ -$ -$ Newman 2 273$ -$ -$ -$ -$ -$ -$ -$ Newman 3 2299$ 667$ 55$ 248$ 46$ -$ -$ -$ Newman 4 7893$ 2755$ 1080$ 1435$ 716$ -$ -$ -$ Newman 5 31126$ 24367$ 17006$ 19659$ 22951$ 21785$ 24625$ 28990$ Newman 6 -$ 5465$ 3596$ 4364$ 3762$ 1579$ 2380$ 4155$ Copper 1076$ 70$ -$ -$ -$ -$ -$ -$ Montana 1 4595$ 4852$ 3414$ 3784$ 4030$ 2455$ 4318$ 5534$ Montana 2 5153$ 5102$ 3468$ 4056$ 4447$ 3079$ 5285$ 5678$ Montana 3 3332$ 3087$ 2371$ 2768$ 2638$ 1279$ 2780$ 4139$ Montana 4 9507$ 7298$ 5383$ 5946$ 5665$ 4884$ 6297$ 6488$ Rio Grande 7 93$ -$ -$ -$ -$ -$ -$ -$ Rio Grande 8 1340$ 264$ 49$ 93$ -$ -$ -$ -$ Rio Grande 9 2675$ 987$ 413$ 603$ 706$ 42$ 22$ 429$ Gas Peaker -$ -$ -$ -$ -$ 1081$ 2239$ 5645$ Palo Verde 1 12111$ 12185$ 12222$ 12259$ 12370$ 12500$ 12667$ 12834$ Palo Verde 2 12169$ 12244$ 12281$ 12318$ 12430$ 12561$ 12728$ 12896$ Palo Verde 3 12111$ 12185$ 12222$ 12259$ 12370$ 12500$ 12667$ 12834$
Heat Rate (MMBtuMWh)Newman 1 1228Newman 2 1151Newman 3 1097Newman 4 1012Newman 5 7741Newman 6 10101Copper 19916Montana 1 9373Montana 2 9334Montana 3 9933Montana 4 9339Rio Grande 7 1179Rio Grande 8 11902Rio Grande 9 9881Gas Peaker 10101Palo Verde 1 10Palo Verde 2 10Palo Verde 3 10
Page 1 of 2
Attachment C-2 Existing Units Operating CharacteristicsFixed OampM ($000)Resources 2021 2024 2025 2027 2031 2035 2040 2045Newman 1 1704$ 5737$ 5737$ 5737$ -$ -$ -$ -$ Newman 2 1789$ -$ -$ -$ -$ -$ -$ -$ Newman 3 2221$ 2221$ 2221$ 5231$ 5231$ -$ -$ -$ Newman 4 5014$ 5014$ 5014$ 10769$ 10769$ -$ -$ -$ Newman 5 5563$ 5563$ 5563$ 5563$ 5563$ 5563$ 5563$ 5563$ Newman 6 -$ 2752$ 2752$ 2752$ 2752$ 2752$ 2752$ 2752$ Copper 1167$ 1167$ 1167$ 1167$ -$ -$ -$ -$ Montana 1 1613$ 1613$ 1613$ 1613$ 1613$ 1613$ 1613$ 1613$ Montana 2 1623$ 1623$ 1623$ 1623$ 1623$ 1623$ 1623$ 1623$ Montana 3 1484$ 1484$ 1484$ 1484$ 1484$ 1484$ 1484$ 1484$ Montana 4 1076$ 1076$ 1076$ 1076$ 1076$ 1076$ 1076$ 1076$ Rio Grande 7 1612$ -$ -$ -$ -$ -$ -$ -$ Rio Grande 8 4346$ 4346$ 4346$ 4346$ 4346$ -$ -$ -$ Rio Grande 9 2495$ 2495$ 2495$ 2495$ 2495$ 2495$ 2495$ 2495$ Gas Peaker -$ -$ -$ -$ -$ 1697$ 3312$ 4621$ Palo Verde 1 28313$ 28313$ 28313$ 28313$ 28313$ 28313$ 28313$ 28313$ Palo Verde 2 28313$ 28313$ 28313$ 28313$ 28313$ 28313$ 28313$ 28313$ Palo Verde 3 28313$ 28313$ 28313$ 28313$ 28313$ 28313$ 28313$ 28313$
Variable OampM ($000)Resources 2021 2024 2025 2027 2031 2035 2040 2045Newman 1 466$ -$ -$ -$ -$ -$ -$ -$ Newman 2 415$ -$ -$ -$ -$ -$ -$ -$ Newman 3 2388$ 695$ 57$ 257$ 48$ -$ -$ -$ Newman 4 8305$ 2887$ 1130$ 1497$ 744$ -$ -$ -$ Newman 5 33855$ 26821$ 18189$ 21158$ 24347$ 22746$ 25862$ 30331$ Newman 6 -$ 5964$ 3916$ 4688$ 3914$ 1639$ 2464$ 4299$ Copper 1581$ 282$ -$ -$ -$ -$ -$ -$ Montana 1 5119$ 5348$ 3764$ 4110$ 4219$ 2540$ 4463$ 5714$ Montana 2 5832$ 5707$ 3805$ 4427$ 4663$ 3195$ 5491$ 5881$ Montana 3 3700$ 3494$ 2602$ 3032$ 2777$ 1335$ 2895$ 4307$ Montana 4 10379$ 8028$ 6003$ 6579$ 6106$ 5134$ 6673$ 6808$ Rio Grande 7 161$ -$ -$ -$ -$ -$ -$ -$ Rio Grande 8 1700$ 269$ 50$ 94$ -$ -$ -$ -$ Rio Grande 9 3001$ 1138$ 487$ 689$ 741$ 44$ 23$ 447$ Gas Peaker -$ -$ -$ -$ -$ 1122$ 2319$ 5841$ Palo Verde 1 15537$ 15612$ 15649$ 15686$ 15797$ 15927$ 16094$ 16261$ Palo Verde 2 15613$ 15687$ 15724$ 15762$ 15873$ 16004$ 16172$ 16339$ Palo Verde 3 15537$ 15612$ 15649$ 15686$ 15797$ 15927$ 16094$ 16261$
Market Price
Year
Average Annual Price ($MWh)
2021 2024$ 2022 2043$ 2023 2050$ 2024 2008$ 2025 2020$ 2026 2007$ 2027 1981$ 2028 1998$ 2029 1919$ 2030 1863$ 2031 1927$ 2032 2020$ 2033 2009$ 2034 2021$ 2035 2016$ 2036 2031$ 2037 1998$ 2038 1927$ 2039 1895$ 2040 1836$ 2041 1843$ 2042 1832$ 2043 1825$ 2044 1895$ 2045 2025$
Page 2 of 2
Attachment D-1 E3 EPE Report Model Results June Page 1 of 34
Scenario Resource Type 2021 2024 2025 2027 2031 2035 2040 2045Least-Cost (Reference Case) Nuclear (Palo Verde) 5148 5148 5148 5148 5148 5148 5148 5148
Nuclear (SMR) - - - - - - - - Gas - Steam Turbine 140 34 7 3 - - - - Gas - Combined Cycle 1767 1373 1022 1111 1130 1065 1318 1502 Gas - Combustion Turbine 1027 1169 836 880 773 754 1250 1640 Biomass - - - - - - - - Geothermal - - - - - - - - Wind - - 379 382 375 336 409 720 Solar 289 952 1467 1551 2200 3058 3443 4239 Battery Storage - 12 (26) (48) (129) (217) (220) (250) Imports 391 336 260 259 282 273 358 440 Demand Response - - - - - - - - Hydrogen - - - - - - - - BTM Solar 37 135 165 225 344 460 601 763 Load 8771 9155 9258 9512 10123 10878 12308 14203 Excess Generation 14 130 430 342 496 657 373 475
Least-Cost Case + ETA Resources Nuclear (Palo Verde) 5148 5148 5148 5148 5148 5148 5148 5148 Nuclear (SMR) - - - - - - - - Gas - Steam Turbine 140 34 3 3 - - - - Gas - Combined Cycle 1767 1373 898 963 998 899 1053 1145 Gas - Combustion Turbine 1027 1169 720 761 686 461 790 1043 Biomass - - - - - - - - Geothermal - - - - - - - - Wind - - 670 688 675 555 653 815 Solar 289 953 1464 1530 2211 3351 4068 5345 Battery Storage - 12 (31) (45) (122) (241) (281) (370) Imports 391 336 220 239 184 245 275 314 Demand Response - - - - - - - - Hydrogen - - - - - - - - BTM Solar 37 135 165 225 344 460 601 763 Load 8771 9155 9258 9512 10123 10878 12308 14203 Excess Generation 14 130 564 480 558 1272 1040 940
Separate System Planning Nuclear (Palo Verde) 5148 5148 5148 5148 5148 5148 5148 5148 Nuclear (SMR) - - - - - - - - Gas - Steam Turbine 140 34 1 2 - - - - Gas - Combined Cycle 1766 1388 1031 1122 1141 969 1192 1385 Gas - Combustion Turbine 1040 1177 754 831 807 477 795 1105 Biomass - - - - - - - - Geothermal - - - - - - - - Wind - - 305 306 295 182 165 412 Solar 289 949 1648 1690 2236 3708 4532 5512 Battery Storage - 12 (54) (60) (138) (295) (350) (405) Imports 391 327 259 247 291 229 225 282 Demand Response - - - - - - - - Hydrogen - - - - - - - - BTM Solar 37 135 165 225 344 460 601 763 Load 8771 9155 9258 9512 10123 10878 12308 14203 Excess Generation 14 134 450 407 444 1288 2358 2353
Annual Energy (GWh)
Attachment D-1 E3 EPE Report Model Results June Page 2 of 34
Scenario Resource Type 2021 2024 2025 2027 2031 2035 2040 2045Annual Energy (GWh)
Separate System Planning (w H2) Nuclear (Palo Verde) 5148 5148 5148 5148 5148 5148 5148 5148 Nuclear (SMR) - - - - - - - - Gas - Steam Turbine 140 34 1 2 - - - - Gas - Combined Cycle 1766 1388 979 1049 1090 1035 1153 1384 Gas - Combustion Turbine 1040 1177 728 819 735 688 779 1129 Biomass - - - - - - - - Geothermal - - - - - - - - Wind - - 447 451 433 405 510 657 Solar 289 949 1594 1633 2242 3101 4087 5075 Battery Storage - 12 (56) (60) (136) (218) (297) (352) Imports 391 327 251 245 266 260 261 327 Demand Response - - - - - - - - Hydrogen - - - - - - 65 71 BTM Solar 37 135 165 225 344 460 601 763 Load 8771 9155 9258 9512 10123 10878 12308 14203 Excess Generation 14 133 444 402 574 772 872 919
Low Load Growth Nuclear (Palo Verde) 5148 5148 5148 5148 5148 5148 5148 5148 Nuclear (SMR) - - - - - - - - Gas - Steam Turbine 101 27 2 3 - - - - Gas - Combined Cycle 1596 1244 978 1065 1127 1025 1258 1472 Gas - Combustion Turbine 983 1065 799 875 806 644 1109 1492 Biomass - - - - - - - - Geothermal - - - - - - - - Wind - - 333 336 335 291 350 562 Solar 282 919 1293 1309 1805 2833 3220 3993 Battery Storage - 8 (29) (29) (96) (209) (215) (245) Imports 381 325 269 262 289 268 342 437 Demand Response - - - - - - - - Hydrogen - - - - - - - - BTM Solar 37 135 165 225 344 460 601 763 Load 8492 8862 8958 9194 9759 10459 11813 13623 Excess Generation 22 163 337 318 410 642 359 427
High Load Growth Nuclear (Palo Verde) 5148 5148 5148 5148 5148 5148 5148 5148 Nuclear (SMR) - - - - - - - - Gas - Steam Turbine 195 50 5 3 - - - - Gas - Combined Cycle 1909 1522 1067 1151 1118 1107 1388 1500 Gas - Combustion Turbine 1088 1256 865 914 776 867 1411 1747 Biomass - - - - - - - - Geothermal - - - - - - - - Wind - - 431 436 413 396 463 976 Solar 293 983 1651 1751 2569 3257 3642 4464 Battery Storage - 14 (47) (68) (159) (222) (222) (256) Imports 400 343 272 271 280 284 372 441 Demand Response - - - - - - - - Hydrogen - - - - - - - - BTM Solar 37 135 165 225 344 460 601 763 Load 9050 9447 9558 9830 10488 11297 12803 14783 Excess Generation 10 100 394 290 554 655 385 540
Attachment D-1 E3 EPE Report Model Results June Page 3 of 34
Scenario Resource Type 2021 2024 2025 2027 2031 2035 2040 2045Annual Energy (GWh)
High DG Nuclear (Palo Verde) 5148 5148 5148 5148 5148 5148 5148 5148 Nuclear (SMR) - - - - - - - - Gas - Steam Turbine 134 31 7 3 - - - - Gas - Combined Cycle 1728 1317 1001 1081 1111 1060 1266 1473 Gas - Combustion Turbine 1028 1123 814 825 742 696 1097 1614 Biomass - - - - - - - - Geothermal - - - - - - - - Wind - - 367 372 368 326 391 916 Solar 285 866 1263 1278 1665 2340 2627 2711 Battery Storage - 11 (25) (45) (126) (227) (245) (244) Imports 389 314 247 241 269 260 345 440 Demand Response - - - - - - - - Hydrogen - - - - - - - - BTM Solar 88 350 436 608 945 1276 1680 2144 Load 8771 9155 9258 9512 10123 10878 12308 14203 Excess Generation 18 217 513 492 614 714 600 432
High DSM Nuclear (Palo Verde) 5148 5148 5148 5148 5148 5148 5148 5148 Nuclear (SMR) - - - - - - - - Gas - Steam Turbine 133 30 2 3 0 - - - Gas - Combined Cycle 1744 1303 1041 1126 1198 1029 1234 1463 Gas - Combustion Turbine 1020 1111 869 907 900 610 1026 1407 Biomass - - - - - - - - Geothermal - - - - - - - - Wind - - 244 244 251 207 249 470 Solar 288 934 1332 1337 1621 2752 3114 3719 Battery Storage - 10 (28) (29) (86) (205) (213) (233) Imports 390 329 283 268 304 271 342 439 Demand Response - - - - - - - - Hydrogen - - - - - - - - BTM Solar 37 135 165 225 344 460 601 763 Load 8731 8994 9056 9230 9680 10273 11501 13177 Excess Generation 15 148 318 313 263 643 371 372
No New Gas Nuclear (Palo Verde) 5148 5148 5148 5148 5148 5148 5148 5148 Nuclear (SMR) - - - - - - - - Gas - Steam Turbine 140 34 6 3 - - - - Gas - Combined Cycle 1767 1373 984 1072 1095 716 702 637 Gas - Combustion Turbine 1027 1169 811 849 745 180 216 207 Biomass - - - - - - - - Geothermal - - - - - - - - Wind - - 455 462 452 210 208 210 Solar 289 952 1467 1545 2197 4287 5691 7680 Battery Storage - 12 (27) (47) (127) (348) (472) (649) Imports 391 336 251 255 270 225 213 206 Demand Response - - - - - - - - Hydrogen - - - - - - - - BTM Solar 37 135 165 225 344 460 601 763 Load 8771 9155 9258 9512 10123 10878 12308 14203 Excess Generation 14 130 458 372 536 2237 2586 3219
Attachment D-1 E3 EPE Report Model Results June Page 4 of 34
Scenario Resource Type 2021 2024 2025 2027 2031 2035 2040 2045Annual Energy (GWh)
No Lifetime Extensions Nuclear (Palo Verde) 5148 5148 5148 5148 5148 5148 5148 5148 Nuclear (SMR) - - - - - - - - Gas - Steam Turbine 140 34 2 0 - - - - Gas - Combined Cycle 1767 1373 948 1015 1050 1056 1308 1502 Gas - Combustion Turbine 1027 1169 707 680 634 745 1242 1640 Biomass - - - - - - - - Geothermal - - - - - - - - Wind - - 397 400 370 364 442 722 Solar 289 953 1693 1897 2475 3050 3432 4237 Battery Storage - 12 (38) (94) (164) (216) (219) (250) Imports 391 336 235 241 267 271 354 440 Demand Response - - - - - - - - Hydrogen - - - - - - - - BTM Solar 37 135 165 225 344 460 601 763 Load 8771 9155 9258 9512 10123 10878 12308 14203 Excess Generation 14 129 634 428 592 661 374 475
High Gas Price Nuclear (Palo Verde) 5148 5148 5148 5148 5148 5148 5148 5148 Nuclear (SMR) - - - - - - - - Gas - Steam Turbine 125 31 3 3 - - - - Gas - Combined Cycle 1787 1400 983 1060 1062 999 1234 1347 Gas - Combustion Turbine 1008 1120 764 786 698 607 1121 1361 Biomass - - - - - - - - Geothermal - - - - - - - - Wind - - 486 493 483 422 516 926 Solar 290 956 1465 1542 2190 3165 3570 4490 Battery Storage - 9 (31) (46) (126) (226) (232) (274) Imports 403 360 274 301 325 303 350 440 Demand Response - - - - - - - - Hydrogen - - - - - - - - BTM Solar 37 135 165 225 344 460 601 763 Load 8771 9155 9258 9512 10123 10878 12308 14203 Excess Generation 13 127 470 386 546 811 486 705
Low Carbon Price Nuclear (Palo Verde) 5148 5148 5148 5148 5148 5148 5148 5148 Nuclear (SMR) - - - - - - - - Gas - Steam Turbine 127 23 3 3 - - - - Gas - Combined Cycle 1803 1433 955 1021 1036 971 1189 1333 Gas - Combustion Turbine 1001 1107 711 750 678 571 1063 1333 Biomass - - - - - - - - Geothermal - - - - - - - - Wind - - 609 624 604 523 642 936 Solar 289 958 1476 1548 2179 3178 3576 4573 Battery Storage - 11 (32) (45) (124) (229) (234) (279) Imports 394 345 223 238 258 256 322 395 Demand Response - - - - - - - - Hydrogen - - - - - - - - BTM Solar 37 135 165 225 344 460 601 763 Load 8771 9155 9258 9512 10123 10878 12308 14203 Excess Generation 14 125 512 426 579 876 532 725
Attachment D-1 E3 EPE Report Model Results June Page 5 of 34
Scenario Resource Type 2021 2024 2025 2027 2031 2035 2040 2045Annual Energy (GWh)
Medium Carbon Price Nuclear (Palo Verde) 5148 5148 5148 5148 5148 5148 5148 5148 Nuclear (SMR) - - - - - - - - Gas - Steam Turbine 120 22 3 3 - - - - Gas - Combined Cycle 1822 1496 876 941 974 922 1115 1270 Gas - Combustion Turbine 983 1036 548 590 606 475 950 1199 Biomass - - - - - - - - Geothermal - - - - - - - - Wind - - 754 779 766 646 805 1098 Solar 290 961 1600 1663 2221 3268 3695 4746 Battery Storage - 7 (37) (47) (122) (230) (242) (293) Imports 399 354 200 210 187 190 235 271 Demand Response - - - - - - - - Hydrogen - - - - - - - - BTM Solar 37 135 165 225 344 460 601 763 Load 8771 9155 9258 9512 10123 10878 12308 14203 Excess Generation 13 121 763 676 588 911 560 726
High Carbon Price Nuclear (Palo Verde) 5148 5148 5148 5148 5148 5148 5148 5148 Nuclear (SMR) - - - - - - - - Gas - Steam Turbine 119 21 2 3 0 - - - Gas - Combined Cycle 1835 1540 658 724 862 872 979 832 Gas - Combustion Turbine 962 989 428 458 488 393 630 544 Biomass - - - - - - - - Geothermal - - - - - - - - Wind - - 869 904 927 776 940 832 Solar 290 963 1847 1900 2307 3272 4088 6364 Battery Storage - 2 (40) (46) (115) (230) (271) (474) Imports 408 362 181 195 162 187 193 192 Demand Response - - - - - - - - Hydrogen - - - - - - - - BTM Solar 37 135 165 225 344 460 601 763 Load 8771 9155 9258 9512 10123 10878 12308 14203 Excess Generation 13 120 1270 1182 882 1065 1041 1596
80 Clean by 2035 Nuclear (Palo Verde) 5148 5148 5148 5148 5148 5148 5148 5148 Nuclear (SMR) - - - - - - - - Gas - Steam Turbine 140 34 7 3 - - - - Gas - Combined Cycle 1767 1373 1022 1111 1127 1050 1159 1295 Gas - Combustion Turbine 1027 1169 836 880 766 696 1057 1256 Biomass - - - - - - - - Geothermal - - - - - - - - Wind - - 379 382 375 331 683 1029 Solar 289 952 1466 1551 2212 3155 3653 4715 Battery Storage - 12 (26) (48) (129) (224) (234) (290) Imports 391 336 261 260 278 264 240 286 Demand Response - - - - - - - - Hydrogen - - - - - - - - BTM Solar 37 135 165 225 344 460 601 763 Load 8771 9155 9258 9512 10123 10878 12308 14203 Excess Generation 14 130 431 343 514 770 469 738
Attachment D-1 E3 EPE Report Model Results June Page 6 of 34
Scenario Resource Type 2021 2024 2025 2027 2031 2035 2040 2045Annual Energy (GWh)
20 CO2 Red by 2040 Nuclear (Palo Verde) 5148 5148 5148 5148 5148 5148 5148 5148 Nuclear (SMR) - - - - - - - - Gas - Steam Turbine 140 34 7 3 - - - - Gas - Combined Cycle 1767 1373 1022 1111 1130 1065 1318 1342 Gas - Combustion Turbine 1027 1169 836 880 773 751 1249 1353 Biomass - - - - - - - - Geothermal - - - - - - - - Wind - - 379 382 375 336 409 927 Solar 289 952 1466 1549 2204 3061 3445 4548 Battery Storage - 12 (26) (48) (129) (217) (220) (277) Imports 391 336 261 262 277 274 357 397 Demand Response - - - - - - - - Hydrogen - - - - - - - - BTM Solar 37 135 165 225 344 460 601 763 Load 8771 9155 9258 9512 10123 10878 12308 14203 Excess Generation 14 130 431 345 491 655 371 705
40 CO2 Red by 2040 Nuclear (Palo Verde) 5148 5148 5148 5148 5148 5148 5148 5148 Nuclear (SMR) - - - - - - - - Gas - Steam Turbine 140 34 7 3 - - - - Gas - Combined Cycle 1767 1373 1022 1111 1127 1051 1133 1135 Gas - Combustion Turbine 1027 1169 836 880 766 696 980 985 Biomass - - - - - - - - Geothermal - - - - - - - - Wind - - 379 382 375 331 763 1034 Solar 289 953 1466 1549 2211 3151 3692 5268 Battery Storage - 12 (26) (48) (128) (224) (241) (350) Imports 391 336 261 262 279 265 232 219 Demand Response - - - - - - - - Hydrogen - - - - - - - - BTM Solar 37 135 165 225 344 460 601 763 Load 8771 9155 9258 9512 10123 10878 12308 14203 Excess Generation 14 129 432 345 515 768 533 965
60 CO2 Red by 2040 Nuclear (Palo Verde) 5148 5148 5148 5148 5148 5148 5148 5148 Nuclear (SMR) - - - - - - - - Gas - Steam Turbine 140 34 7 3 - - - - Gas - Combined Cycle 1767 1373 1022 1111 1127 1052 864 852 Gas - Combustion Turbine 1027 1169 836 880 766 698 561 560 Biomass - - - - - - - - Geothermal - - - - - - - - Wind - - 379 382 375 331 927 838 Solar 289 953 1466 1552 2213 3150 4319 6337 Battery Storage - 12 (26) (48) (128) (224) (276) (470) Imports 391 336 261 259 278 263 164 174 Demand Response - - - - - - - - Hydrogen - - - - - - - - BTM Solar 37 135 165 225 344 460 601 763 Load 8771 9155 9258 9512 10123 10878 12308 14203 Excess Generation 14 130 432 342 513 769 1338 1586
Attachment D-1 E3 EPE Report Model Results June Page 7 of 34
Scenario Resource Type 2021 2024 2025 2027 2031 2035 2040 2045Annual Energy (GWh)
80 CO2 Red by 2040 Nuclear (Palo Verde) 5148 5148 5148 5148 5148 5148 5148 5148 Nuclear (SMR) - - - - - - - - Gas - Steam Turbine 140 34 3 3 - - - - Gas - Combined Cycle 1767 1373 910 976 1017 907 577 550 Gas - Combustion Turbine 1027 1169 734 777 696 468 168 183 Biomass - - - - - - - - Geothermal - - - - - - - - Wind - - 638 654 638 532 1260 1231 Solar 289 952 1463 1531 2158 3371 4812 6758 Battery Storage - 12 (30) (45) (123) (239) (338) (517) Imports 391 336 227 241 245 232 80 88 Demand Response - - - - - - - - Hydrogen - - - - - - - - BTM Solar 37 135 165 225 344 460 601 763 Load 8771 9155 9258 9512 10123 10878 12308 14203 Excess Generation 14 130 546 461 605 1183 2430 2751
90 CO2 Red by 2040 Nuclear (Palo Verde) 5148 5148 5148 5148 5148 5148 5148 5148 Nuclear (SMR) - - - - - - - - Gas - Steam Turbine 140 34 3 3 - - - - Gas - Combined Cycle 1767 1373 910 978 1018 808 340 313 Gas - Combustion Turbine 1027 1169 736 776 696 320 41 58 Biomass - - - - - - - - Geothermal - - - - - - - - Wind - - 637 655 639 463 1965 1995 Solar 289 952 1462 1527 2156 3764 4483 6350 Battery Storage - 12 (30) (45) (123) (278) (311) (472) Imports 391 336 226 244 245 193 40 47 Demand Response - - - - - - - - Hydrogen - - - - - - - - BTM Solar 37 135 165 225 344 460 601 763 Load 8771 9155 9258 9512 10123 10878 12308 14203 Excess Generation 14 130 547 465 603 1440 3210 3645
100 CO2 Red by 2040 Nuclear (Palo Verde) 5148 5148 5148 5148 5148 5148 5148 5148 Nuclear (SMR) - - - - - - - - Gas - Steam Turbine 140 34 6 3 - - - - Gas - Combined Cycle 1767 1373 984 1072 1095 716 - - Gas - Combustion Turbine 1027 1169 811 849 745 180 - - Biomass - - - - - - - - Geothermal - - - - - - - - Wind - - 455 462 452 210 969 1406 Solar 289 952 1467 1545 2197 4287 6734 7595 Battery Storage - 12 (27) (47) (127) (348) (1163) (1402) Imports 391 336 251 255 270 225 - - Demand Response - - - - - - - - Hydrogen - - - - - - - - BTM Solar 37 135 165 225 344 460 620 1455 Load 8771 9155 9258 9512 10123 10878 12308 14203 Excess Generation 14 130 458 372 536 2237 10954 12232
Attachment D-1 E3 EPE Report Model Results June Page 8 of 34
Scenario Resource Type 2021 2024 2025 2027 2031 2035 2040 2045Annual Energy (GWh)
100 CO2 Red by 2040 (w H2) Nuclear (Palo Verde) 5148 5148 5148 5148 5148 5148 5148 5148 Nuclear (SMR) - - - - - - - - Gas - Steam Turbine 140 34 3 4 - - - - Gas - Combined Cycle 1767 1373 868 928 983 689 - - Gas - Combustion Turbine 1027 1169 692 732 627 210 - - Biomass - - - - - - - - Geothermal - - - - - - - - Wind - - 743 765 755 469 1700 1650 Solar 289 952 1460 1525 2217 4074 4752 6753 Battery Storage - 12 (31) (46) (122) (300) (336) (515) Imports 391 336 209 230 171 129 - - Demand Response - - - - - - - - Hydrogen - - - - - - 442 404 BTM Solar 37 135 165 225 344 460 601 763 Load 8771 9155 9258 9512 10123 10878 12308 14203 Excess Generation 14 130 616 528 575 1636 3102 3585
Attachment D-1 E3 EPE Report Model Results June Page 9 of 34
Scenario Resource TypeLeast-Cost (Reference Case) Nuclear (Palo Verde)
Nuclear (SMR)Gas - Steam TurbineGas - Combined CycleGas - Combustion TurbineBiomassGeothermalWindSolarBattery StorageImportsDemand ResponseHydrogenBTM SolarLoadExcess Generation
Least-Cost Case + ETA Resources Nuclear (Palo Verde)Nuclear (SMR)Gas - Steam TurbineGas - Combined CycleGas - Combustion TurbineBiomassGeothermalWindSolarBattery StorageImportsDemand ResponseHydrogenBTM SolarLoadExcess Generation
Separate System Planning Nuclear (Palo Verde)Nuclear (SMR)Gas - Steam TurbineGas - Combined CycleGas - Combustion TurbineBiomassGeothermalWindSolarBattery StorageImportsDemand ResponseHydrogenBTM SolarLoadExcess Generation
2021 2024 2025 2027 2031 2035 2040 2045622 622 622 622 622 622 622 622 - - - - - - - - 426 307 307 307 234 - - - 493 493 493 493 493 266 266 266 503 731 731 731 668 952 1111 1318 - - - - - - - - - - - - - - - - - - 109 109 109 109 109 196 115 385 629 629 904 1241 1298 1580 - 50 183 256 582 1032 1116 1284 - - - - - - - - 46 53 56 61 71 81 93 93
- - - - - - - - 18 65 80 108 166 221 289 368
- - - - - - - - - - - - - - - - 622 622 622 622 622 622 622 622 - - - - - - - - 426 307 307 307 234 - - - 493 493 493 493 493 266 266 266 503 731 731 731 668 879 999 1154 - - - - - - - - - - - - - - - - - - 204 204 204 204 204 264 115 385 629 629 887 1482 1684 2050 - 50 183 236 552 1084 1252 1698 - - - - - - - - 46 53 56 61 71 81 93 93
- - - - - - - - 18 65 80 108 166 221 289 368
- - - - - - - - - - - - - - - - 622 622 622 622 622 622 622 622 - - - - - - - - 426 307 307 307 234 - - - 493 493 493 493 493 266 266 266 503 731 731 731 668 835 835 989 - - - - - - - - - - - - - - - - - - 87 87 87 87 87 159 115 385 707 707 905 1667 2322 2639 - 50 271 293 634 1480 2207 2579 - - - - - - - - 46 53 56 61 71 81 93 93
- - - - - - - - 18 65 80 108 166 221 289 368
- - - - - - - - - - - - - - - -
Installed Capacity (MW)
Attachment D-1 E3 EPE Report Model Results June Page 10 of 34
Scenario Resource TypeSeparate System Planning (w H2) Nuclear (Palo Verde)
Nuclear (SMR)Gas - Steam TurbineGas - Combined CycleGas - Combustion TurbineBiomassGeothermalWindSolarBattery StorageImportsDemand ResponseHydrogenBTM SolarLoadExcess Generation
Low Load Growth Nuclear (Palo Verde)Nuclear (SMR)Gas - Steam TurbineGas - Combined CycleGas - Combustion TurbineBiomassGeothermalWindSolarBattery StorageImportsDemand ResponseHydrogenBTM SolarLoadExcess Generation
High Load Growth Nuclear (Palo Verde)Nuclear (SMR)Gas - Steam TurbineGas - Combined CycleGas - Combustion TurbineBiomassGeothermalWindSolarBattery StorageImportsDemand ResponseHydrogenBTM SolarLoadExcess Generation
2021 2024 2025 2027 2031 2035 2040 2045Installed Capacity (MW)
622 622 622 622 622 622 622 622 - - - - - - - - 426 307 307 307 234 - - - 493 493 493 493 493 266 266 266 503 731 731 731 668 825 825 989 - - - - - - - - - - - - - - - - - - 129 129 129 129 172 212 115 385 672 672 936 1290 1645 1990 - 50 269 291 601 1038 1420 1741 - - - - - - - - 46 53 56 61 71 81 93 93
- - - - - 121 195 206 18 65 80 108 166 221 289 368
- - - - - - - - - - - - - - - - 622 622 622 622 622 622 622 622 - - - - - - - - 426 307 307 307 234 - - - 493 493 493 493 493 266 266 266 503 731 731 731 668 847 989 1182 - - - - - - - - - - - - - - - - - - 96 96 96 96 96 153 115 385 541 541 743 1162 1216 1489 - 50 192 193 454 1012 1093 1257 - - - - - - - - 46 53 56 61 71 81 93 93
- - - - - - - - 18 65 80 108 166 221 289 368
- - - - - - - - - - - - - - - - 622 622 622 622 622 622 622 622 - - - - - - - - 426 307 307 307 234 - - - 493 493 493 493 493 266 266 266 503 731 731 731 668 1062 1237 1451 - - - - - - - - - - - - - - - - - - 123 123 123 123 123 266 115 385 677 677 1046 1309 1369 1660 - 50 249 342 716 1048 1136 1307 - - - - - - - - 46 53 56 61 71 81 93 93
- - - - - - - - 18 65 80 108 166 221 289 368
- - - - - - - - - - - - - - - -
Attachment D-1 E3 EPE Report Model Results June Page 11 of 34
Scenario Resource TypeHigh DG Nuclear (Palo Verde)
Nuclear (SMR)Gas - Steam TurbineGas - Combined CycleGas - Combustion TurbineBiomassGeothermalWindSolarBattery StorageImportsDemand ResponseHydrogenBTM SolarLoadExcess Generation
High DSM Nuclear (Palo Verde)Nuclear (SMR)Gas - Steam TurbineGas - Combined CycleGas - Combustion TurbineBiomassGeothermalWindSolarBattery StorageImportsDemand ResponseHydrogenBTM SolarLoadExcess Generation
No New Gas Nuclear (Palo Verde)Nuclear (SMR)Gas - Steam TurbineGas - Combined CycleGas - Combustion TurbineBiomassGeothermalWindSolarBattery StorageImportsDemand ResponseHydrogenBTM SolarLoadExcess Generation
2021 2024 2025 2027 2031 2035 2040 2045Installed Capacity (MW)
622 622 622 622 622 622 622 622 - - - - - - - - 426 307 307 307 234 - - - 493 493 493 493 493 266 266 266 503 731 731 731 668 942 1078 1322 - - - - - - - - - - - - - - - - - - 106 106 106 106 106 249 115 385 587 587 761 1011 1092 1023 - 50 183 252 571 1043 1151 1267 - - - - - - - - 46 53 56 61 71 81 93 93
- - - - - - - - 42 169 210 293 455 614 809 1032
- - - - - - - - - - - - - - - - 622 622 622 622 622 622 622 622 - - - - - - - - 426 307 307 307 234 - - - 493 493 493 493 493 266 266 266 503 731 731 731 668 801 926 1105 - - - - - - - - - - - - - - - - - - 70 70 70 70 70 127 115 385 558 558 641 1146 1189 1384 - 50 187 191 425 1000 1070 1209 - - - - - - - - 49 66 71 82 100 101 103 103
- - - - - - - - 18 65 80 108 166 221 289 368
- - - - - - - - - - - - - - - - 622 622 622 622 622 622 622 622 - - - - - - - - 426 307 307 307 234 - - - 493 493 493 493 493 266 266 266 503 731 731 731 668 668 668 668 - - - - - - - - - - - - - - - - - - 132 132 132 132 132 132 115 385 629 629 908 2129 2734 3644 - 50 183 251 573 1864 2496 3634 - - - - - - - - 46 53 56 61 71 81 93 93
- - - - - - - - 18 65 80 108 166 221 289 368
- - - - - - - - - - - - - - - -
Attachment D-1 E3 EPE Report Model Results June Page 12 of 34
Scenario Resource TypeNo Lifetime Extensions Nuclear (Palo Verde)
Nuclear (SMR)Gas - Steam TurbineGas - Combined CycleGas - Combustion TurbineBiomassGeothermalWindSolarBattery StorageImportsDemand ResponseHydrogenBTM SolarLoadExcess Generation
High Gas Price Nuclear (Palo Verde)Nuclear (SMR)Gas - Steam TurbineGas - Combined CycleGas - Combustion TurbineBiomassGeothermalWindSolarBattery StorageImportsDemand ResponseHydrogenBTM SolarLoadExcess Generation
Low Carbon Price Nuclear (Palo Verde)Nuclear (SMR)Gas - Steam TurbineGas - Combined CycleGas - Combustion TurbineBiomassGeothermalWindSolarBattery StorageImportsDemand ResponseHydrogenBTM SolarLoadExcess Generation
2021 2024 2025 2027 2031 2035 2040 2045Installed Capacity (MW)
622 622 622 622 622 622 622 622 - - - - - - - - 426 234 234 144 144 - - - 493 493 493 266 266 266 266 266 503 731 731 914 851 951 1109 1318 - - - - - - - - - - - - - - - - - - 118 118 118 118 118 196 115 385 769 769 1018 1235 1292 1579 - 50 230 434 743 1031 1115 1284 - - - - - - - - 46 53 56 61 71 81 93 93
- - - - - - - - 18 65 80 108 166 221 289 368
- - - - - - - - - - - - - - - - 622 622 622 622 622 622 622 622 - - - - - - - - 426 307 307 307 234 - - - 493 493 493 493 493 266 266 266 503 731 731 731 668 930 1088 1274 - - - - - - - - - - - - - - - - - - 142 142 142 142 142 264 115 385 629 629 905 1312 1369 1712 - 50 183 249 570 1047 1131 1312 - - - - - - - - 46 53 56 61 71 81 93 93
- - - - - - - - 18 65 80 108 166 221 289 368
- - - - - - - - - - - - - - - - 622 622 622 622 622 622 622 622 - - - - - - - - 426 307 307 307 234 - - - 493 493 493 493 493 266 266 266 503 731 731 731 668 920 1078 1267 - - - - - - - - - - - - - - - - - - 181 181 181 181 181 267 115 385 629 629 894 1312 1369 1747 - 50 183 240 559 1047 1131 1319 - - - - - - - - 46 53 56 61 71 81 93 93
- - - - - - - - 18 65 80 108 166 221 289 368
- - - - - - - - - - - - - - - -
Attachment D-1 E3 EPE Report Model Results June Page 13 of 34
Scenario Resource TypeMedium Carbon Price Nuclear (Palo Verde)
Nuclear (SMR)Gas - Steam TurbineGas - Combined CycleGas - Combustion TurbineBiomassGeothermalWindSolarBattery StorageImportsDemand ResponseHydrogenBTM SolarLoadExcess Generation
High Carbon Price Nuclear (Palo Verde)Nuclear (SMR)Gas - Steam TurbineGas - Combined CycleGas - Combustion TurbineBiomassGeothermalWindSolarBattery StorageImportsDemand ResponseHydrogenBTM SolarLoadExcess Generation
80 Clean by 2035 Nuclear (Palo Verde)Nuclear (SMR)Gas - Steam TurbineGas - Combined CycleGas - Combustion TurbineBiomassGeothermalWindSolarBattery StorageImportsDemand ResponseHydrogenBTM SolarLoadExcess Generation
2021 2024 2025 2027 2031 2035 2040 2045Installed Capacity (MW)
622 622 622 622 622 622 622 622 - - - - - - - - 426 307 307 307 234 - - - 493 493 493 493 493 266 266 266 503 731 731 731 668 909 1060 1248 - - - - - - - - - - - - - - - - - - 236 236 236 236 236 300 115 385 724 724 882 1312 1390 1813 - 50 183 228 547 1047 1136 1343 - - - - - - - - 46 53 56 61 71 81 93 93
- - - - - - - - 18 65 80 108 166 221 289 368
- - - - - - - - - - - - - - - - 622 622 622 622 622 622 622 622 - - - - - - - - 426 307 307 307 234 - - - 493 493 493 493 493 266 266 266 503 731 731 731 668 901 1001 1024 - - - - - - - - - - - - - - - - - - 300 300 300 300 300 301 115 385 927 927 972 1312 1640 2583 - 50 183 211 521 1047 1189 2082 - - - - - - - - 46 53 56 61 71 81 93 93
- - - - - - - - 18 65 80 108 166 221 289 368
- - - - - - - - - - - - - - - - 622 622 622 622 622 622 622 622 - - - - - - - - 426 307 307 307 234 - - - 493 493 493 493 493 266 266 266 503 731 731 731 668 938 1075 1253 - - - - - - - - - - - - - - - - - - 109 109 109 109 194 285 115 385 629 629 915 1312 1369 1805 - 50 183 256 580 1047 1131 1331 - - - - - - - - 46 53 56 61 71 81 93 93
- - - - - - - - 18 65 80 108 166 221 289 368
- - - - - - - - - - - - - - - -
Attachment D-1 E3 EPE Report Model Results June Page 14 of 34
Scenario Resource Type20 CO2 Red by 2040 Nuclear (Palo Verde)
Nuclear (SMR)Gas - Steam TurbineGas - Combined CycleGas - Combustion TurbineBiomassGeothermalWindSolarBattery StorageImportsDemand ResponseHydrogenBTM SolarLoadExcess Generation
40 CO2 Red by 2040 Nuclear (Palo Verde)Nuclear (SMR)Gas - Steam TurbineGas - Combined CycleGas - Combustion TurbineBiomassGeothermalWindSolarBattery StorageImportsDemand ResponseHydrogenBTM SolarLoadExcess Generation
60 CO2 Red by 2040 Nuclear (Palo Verde)Nuclear (SMR)Gas - Steam TurbineGas - Combined CycleGas - Combustion TurbineBiomassGeothermalWindSolarBattery StorageImportsDemand ResponseHydrogenBTM SolarLoadExcess Generation
2021 2024 2025 2027 2031 2035 2040 2045Installed Capacity (MW)
622 622 622 622 622 622 622 622 - - - - - - - - 426 307 307 307 234 - - - 493 493 493 493 493 266 266 266 503 731 731 731 668 952 1111 1270 - - - - - - - - - - - - - - - - - - 109 109 109 109 109 264 115 385 629 629 904 1242 1299 1733 - 50 183 256 582 1032 1116 1316 - - - - - - - - 46 53 56 61 71 81 93 93
- - - - - - - - 18 65 80 108 166 221 289 368
- - - - - - - - - - - - - - - - 622 622 622 622 622 622 622 622 - - - - - - - - 426 307 307 307 234 - - - 493 493 493 493 493 266 266 266 503 731 731 731 668 939 1064 1178 - - - - - - - - - - - - - - - - - - 109 109 109 109 221 300 115 385 629 629 915 1310 1390 2052 - 50 183 256 580 1045 1135 1573 - - - - - - - - 46 53 56 61 71 81 93 93
- - - - - - - - 18 65 80 108 166 221 289 368
- - - - - - - - - - - - - - - - 622 622 622 622 622 622 622 622 - - - - - - - - 426 307 307 307 234 - - - 493 493 493 493 493 266 266 266 503 731 731 731 668 938 987 1029 - - - - - - - - - - - - - - - - - - 109 109 109 109 300 301 115 385 629 629 915 1311 1822 2573 - 50 183 256 580 1046 1194 2062 - - - - - - - - 46 53 56 61 71 81 93 93
- - - - - - - - 18 65 80 108 166 221 289 368
- - - - - - - - - - - - - - - -
Attachment D-1 E3 EPE Report Model Results June Page 15 of 34
Scenario Resource Type80 CO2 Red by 2040 Nuclear (Palo Verde)
Nuclear (SMR)Gas - Steam TurbineGas - Combined CycleGas - Combustion TurbineBiomassGeothermalWindSolarBattery StorageImportsDemand ResponseHydrogenBTM SolarLoadExcess Generation
90 CO2 Red by 2040 Nuclear (Palo Verde)Nuclear (SMR)Gas - Steam TurbineGas - Combined CycleGas - Combustion TurbineBiomassGeothermalWindSolarBattery StorageImportsDemand ResponseHydrogenBTM SolarLoadExcess Generation
100 CO2 Red by 2040 Nuclear (Palo Verde)Nuclear (SMR)Gas - Steam TurbineGas - Combined CycleGas - Combustion TurbineBiomassGeothermalWindSolarBattery StorageImportsDemand ResponseHydrogenBTM SolarLoadExcess Generation
2021 2024 2025 2027 2031 2035 2040 2045Installed Capacity (MW)
622 622 622 622 622 622 622 622 - - - - - - - - 426 307 307 307 234 - - - 493 493 493 493 493 266 266 266 503 731 731 731 668 885 885 885 - - - - - - - - - - - - - - - - - - 192 192 192 192 507 507 115 385 629 629 891 1475 2226 3013 - 50 183 238 556 1080 1416 2455 - - - - - - - - 46 53 56 61 71 81 93 93
- - - - - - - - 18 65 80 108 166 221 289 368
- - - - - - - - - - - - - - - - 622 622 622 622 622 622 622 622 - - - - - - - - 426 307 307 307 234 - - - 493 493 493 493 493 266 266 266 503 731 731 731 668 819 819 819 - - - - - - - - - - - - - - - - - - 192 192 192 192 764 772 115 385 628 628 891 1681 2284 3081 - 50 183 238 556 1276 1601 2627 - - - - - - - - 46 53 56 61 71 81 93 93
- - - - - - - - 18 65 80 108 166 221 289 368
- - - - - - - - - - - - - - - - 622 622 622 622 622 622 622 622 - - - - - - - - 426 307 307 307 234 - - - 493 493 493 493 493 266 266 266 503 731 731 731 668 668 668 668 - - - - - - - - - - - - - - - - - - 132 132 132 132 1228 1605 115 385 629 629 908 2129 4851 5217 - 50 183 251 573 1864 6191 7470 - - - - - - - - 46 53 56 61 71 81 93 93
- - - - - - - - 18 65 80 108 166 221 298 701
- - - - - - - - - - - - - - - -
Attachment D-1 E3 EPE Report Model Results June Page 16 of 34
Scenario Resource Type100 CO2 Red by 2040 (w H2) Nuclear (Palo Verde)
Nuclear (SMR)Gas - Steam TurbineGas - Combined CycleGas - Combustion TurbineBiomassGeothermalWindSolarBattery StorageImportsDemand ResponseHydrogenBTM SolarLoadExcess Generation
2021 2024 2025 2027 2031 2035 2040 2045Installed Capacity (MW)
622 622 622 622 622 622 622 622 - - - - - - - - 426 307 307 307 234 - - - 493 493 493 493 493 266 - - 503 731 731 731 668 774 - - - - - - - - - - - - - - - - - - - - 231 231 231 231 687 687 115 385 628 628 883 1801 2353 3200 - 50 183 233 548 1403 1804 2864 - - - - - - - - 46 53 56 61 71 81 93 93
- - - - - - 1040 1040 18 65 80 108 166 221 289 368
- - - - - - - - - - - - - - - -
Attachment D-1 E3 EPE Report Model Results June Page 17 of 34
Scenario Resource TypeLeast-Cost (Reference Case) Nuclear (Palo Verde)
Nuclear (SMR)Gas - Steam TurbineGas - Combined CycleGas - Combustion TurbineBiomassGeothermalWindSolarBattery StorageImportsDemand ResponseHydrogenBTM SolarLoadExcess Generation
Least-Cost Case + ETA Resources Nuclear (Palo Verde)Nuclear (SMR)Gas - Steam TurbineGas - Combined CycleGas - Combustion TurbineBiomassGeothermalWindSolarBattery StorageImportsDemand ResponseHydrogenBTM SolarLoadExcess Generation
Separate System Planning Nuclear (Palo Verde)Nuclear (SMR)Gas - Steam TurbineGas - Combined CycleGas - Combustion TurbineBiomassGeothermalWindSolarBattery StorageImportsDemand ResponseHydrogenBTM SolarLoadExcess Generation
2021 2024 2025 2027 2031 2035 2040 2045- - - - - - - - - - - - - - - - - - - - - - - - - - - - - - - - - 228 228 228 228 512 671 878 - - - - - - - - - - - - - - - - - - 109 109 109 109 109 196 - 270 514 514 789 1196 1280 1842 - 50 183 256 582 1032 1116 1334 - - - - - - - - 46 53 56 61 71 81 93 93
- - - - - - - - 18 65 80 108 166 221 289 368
- - - - - - - - - - - - - - - - - - - - - - - - - - - - - - - - - - - - - - - - - - - - - - - - - 228 228 228 228 439 559 714 - - - - - - - - - - - - - - - - - - 204 204 204 204 204 264 - 270 514 514 772 1437 1666 2312 - 50 183 236 552 1084 1252 1748 - - - - - - - - 46 53 56 61 71 81 93 93
- - - - - - - - 18 65 80 108 166 221 289 368
- - - - - - - - - - - - - - - - - - - - - - - - - - - - - - - - - - - - - - - - - - - - - - - - - 228 228 228 228 395 395 549 - - - - - - - - - - - - - - - - - - 87 87 87 87 87 159 - 270 592 592 790 1622 2304 2901 - 50 271 293 634 1480 2207 2629 - - - - - - - - 46 53 56 61 71 81 93 93
- - - - - - - - 18 65 80 108 166 221 289 368
- - - - - - - - - - - - - - - -
Cumulative Capacity Additions (MW)
Attachment D-1 E3 EPE Report Model Results June Page 18 of 34
Scenario Resource TypeSeparate System Planning (w H2) Nuclear (Palo Verde)
Nuclear (SMR)Gas - Steam TurbineGas - Combined CycleGas - Combustion TurbineBiomassGeothermalWindSolarBattery StorageImportsDemand ResponseHydrogenBTM SolarLoadExcess Generation
Low Load Growth Nuclear (Palo Verde)Nuclear (SMR)Gas - Steam TurbineGas - Combined CycleGas - Combustion TurbineBiomassGeothermalWindSolarBattery StorageImportsDemand ResponseHydrogenBTM SolarLoadExcess Generation
High Load Growth Nuclear (Palo Verde)Nuclear (SMR)Gas - Steam TurbineGas - Combined CycleGas - Combustion TurbineBiomassGeothermalWindSolarBattery StorageImportsDemand ResponseHydrogenBTM SolarLoadExcess Generation
2021 2024 2025 2027 2031 2035 2040 2045Cumulative Capacity Additions (MW)
- - - - - - - - - - - - - - - - - - - - - - - - - - - - - - - - - 228 228 228 228 385 385 549 - - - - - - - - - - - - - - - - - - 129 129 129 129 172 212 - 270 557 557 821 1245 1627 2252 - 50 269 291 601 1038 1420 1791 - - - - - - - - 46 53 56 61 71 81 93 93
- - - - - 121 195 206 18 65 80 108 166 221 289 368
- - - - - - - - - - - - - - - - - - - - - - - - - - - - - - - - - - - - - - - - - - - - - - - - - 228 228 228 228 407 549 742 - - - - - - - - - - - - - - - - - - 96 96 96 96 96 153 - 270 426 426 628 1117 1198 1751 - 50 192 193 454 1012 1093 1307 - - - - - - - - 46 53 56 61 71 81 93 93
- - - - - - - - 18 65 80 108 166 221 289 368
- - - - - - - - - - - - - - - - - - - - - - - - - - - - - - - - - - - - - - - - - - - - - - - - - 228 228 228 228 622 797 1011 - - - - - - - - - - - - - - - - - - 123 123 123 123 123 266 - 270 562 562 931 1264 1351 1922 - 50 249 342 716 1048 1136 1357 - - - - - - - - 46 53 56 61 71 81 93 93
- - - - - - - - 18 65 80 108 166 221 289 368
- - - - - - - - - - - - - - - -
Attachment D-1 E3 EPE Report Model Results June Page 19 of 34
Scenario Resource TypeHigh DG Nuclear (Palo Verde)
Nuclear (SMR)Gas - Steam TurbineGas - Combined CycleGas - Combustion TurbineBiomassGeothermalWindSolarBattery StorageImportsDemand ResponseHydrogenBTM SolarLoadExcess Generation
High DSM Nuclear (Palo Verde)Nuclear (SMR)Gas - Steam TurbineGas - Combined CycleGas - Combustion TurbineBiomassGeothermalWindSolarBattery StorageImportsDemand ResponseHydrogenBTM SolarLoadExcess Generation
No New Gas Nuclear (Palo Verde)Nuclear (SMR)Gas - Steam TurbineGas - Combined CycleGas - Combustion TurbineBiomassGeothermalWindSolarBattery StorageImportsDemand ResponseHydrogenBTM SolarLoadExcess Generation
2021 2024 2025 2027 2031 2035 2040 2045Cumulative Capacity Additions (MW)
- - - - - - - - - - - - - - - - - - - - - - - - - - - - - - - - - 228 228 228 228 502 638 882 - - - - - - - - - - - - - - - - - - 106 106 106 106 106 249 - 270 472 472 646 966 1074 1285 - 50 183 252 571 1043 1151 1317 - - - - - - - - 46 53 56 61 71 81 93 93
- - - - - - - - 42 169 210 293 455 614 809 1032
- - - - - - - - - - - - - - - - - - - - - - - - - - - - - - - - - - - - - - - - - - - - - - - - - 228 228 228 228 361 486 665 - - - - - - - - - - - - - - - - - - 70 70 70 70 70 127 - 270 443 443 526 1101 1171 1646 - 50 187 191 425 1000 1070 1259 - - - - - - - - 49 66 71 82 100 101 103 103
- - - - - - - - 18 65 80 108 166 221 289 368
- - - - - - - - - - - - - - - - - - - - - - - - - - - - - - - - - - - - - - - - - - - - - - - - - 228 228 228 228 228 228 228 - - - - - - - - - - - - - - - - - - 132 132 132 132 132 132 - 270 514 514 793 2084 2716 3906 - 50 183 251 573 1864 2496 3684 - - - - - - - - 46 53 56 61 71 81 93 93
- - - - - - - - 18 65 80 108 166 221 289 368
- - - - - - - - - - - - - - - -
Attachment D-1 E3 EPE Report Model Results June Page 20 of 34
Scenario Resource TypeNo Lifetime Extensions Nuclear (Palo Verde)
Nuclear (SMR)Gas - Steam TurbineGas - Combined CycleGas - Combustion TurbineBiomassGeothermalWindSolarBattery StorageImportsDemand ResponseHydrogenBTM SolarLoadExcess Generation
High Gas Price Nuclear (Palo Verde)Nuclear (SMR)Gas - Steam TurbineGas - Combined CycleGas - Combustion TurbineBiomassGeothermalWindSolarBattery StorageImportsDemand ResponseHydrogenBTM SolarLoadExcess Generation
Low Carbon Price Nuclear (Palo Verde)Nuclear (SMR)Gas - Steam TurbineGas - Combined CycleGas - Combustion TurbineBiomassGeothermalWindSolarBattery StorageImportsDemand ResponseHydrogenBTM SolarLoadExcess Generation
2021 2024 2025 2027 2031 2035 2040 2045Cumulative Capacity Additions (MW)
- - - - - - - - - - - - - - - - - - - - - - - - - - - - - - - - - 228 228 411 411 511 669 878 - - - - - - - - - - - - - - - - - - 118 118 118 118 118 196 - 270 654 654 903 1190 1274 1841 - 50 230 434 743 1031 1115 1334 - - - - - - - - 46 53 56 61 71 81 93 93
- - - - - - - - 18 65 80 108 166 221 289 368
- - - - - - - - - - - - - - - - - - - - - - - - - - - - - - - - - - - - - - - - - - - - - - - - - 228 228 228 228 490 648 834 - - - - - - - - - - - - - - - - - - 142 142 142 142 142 264 - 270 514 514 790 1267 1351 1974 - 50 183 249 570 1047 1131 1362 - - - - - - - - 46 53 56 61 71 81 93 93
- - - - - - - - 18 65 80 108 166 221 289 368
- - - - - - - - - - - - - - - - - - - - - - - - - - - - - - - - - - - - - - - - - - - - - - - - - 228 228 228 228 480 638 827 - - - - - - - - - - - - - - - - - - 181 181 181 181 181 267 - 270 514 514 779 1267 1351 2009 - 50 183 240 559 1047 1131 1369 - - - - - - - - 46 53 56 61 71 81 93 93
- - - - - - - - 18 65 80 108 166 221 289 368
- - - - - - - - - - - - - - - -
Attachment D-1 E3 EPE Report Model Results June Page 21 of 34
Scenario Resource TypeMedium Carbon Price Nuclear (Palo Verde)
Nuclear (SMR)Gas - Steam TurbineGas - Combined CycleGas - Combustion TurbineBiomassGeothermalWindSolarBattery StorageImportsDemand ResponseHydrogenBTM SolarLoadExcess Generation
High Carbon Price Nuclear (Palo Verde)Nuclear (SMR)Gas - Steam TurbineGas - Combined CycleGas - Combustion TurbineBiomassGeothermalWindSolarBattery StorageImportsDemand ResponseHydrogenBTM SolarLoadExcess Generation
80 Clean by 2035 Nuclear (Palo Verde)Nuclear (SMR)Gas - Steam TurbineGas - Combined CycleGas - Combustion TurbineBiomassGeothermalWindSolarBattery StorageImportsDemand ResponseHydrogenBTM SolarLoadExcess Generation
2021 2024 2025 2027 2031 2035 2040 2045Cumulative Capacity Additions (MW)
- - - - - - - - - - - - - - - - - - - - - - - - - - - - - - - - - 228 228 228 228 469 620 808 - - - - - - - - - - - - - - - - - - 236 236 236 236 236 300 - 270 609 609 767 1267 1372 2075 - 50 183 228 547 1047 1136 1393 - - - - - - - - 46 53 56 61 71 81 93 93
- - - - - - - - 18 65 80 108 166 221 289 368
- - - - - - - - - - - - - - - - - - - - - - - - - - - - - - - - - - - - - - - - - - - - - - - - - 228 228 228 228 461 561 584 - - - - - - - - - - - - - - - - - - 300 300 300 300 300 301 - 270 812 812 857 1267 1622 2845 - 50 183 211 521 1047 1189 2132 - - - - - - - - 46 53 56 61 71 81 93 93
- - - - - - - - 18 65 80 108 166 221 289 368
- - - - - - - - - - - - - - - - - - - - - - - - - - - - - - - - - - - - - - - - - - - - - - - - - 228 228 228 228 498 635 813 - - - - - - - - - - - - - - - - - - 109 109 109 109 194 285 - 270 514 514 800 1267 1351 2067 - 50 183 256 580 1047 1131 1381 - - - - - - - - 46 53 56 61 71 81 93 93
- - - - - - - - 18 65 80 108 166 221 289 368
- - - - - - - - - - - - - - - -
Attachment D-1 E3 EPE Report Model Results June Page 22 of 34
Scenario Resource Type20 CO2 Red by 2040 Nuclear (Palo Verde)
Nuclear (SMR)Gas - Steam TurbineGas - Combined CycleGas - Combustion TurbineBiomassGeothermalWindSolarBattery StorageImportsDemand ResponseHydrogenBTM SolarLoadExcess Generation
40 CO2 Red by 2040 Nuclear (Palo Verde)Nuclear (SMR)Gas - Steam TurbineGas - Combined CycleGas - Combustion TurbineBiomassGeothermalWindSolarBattery StorageImportsDemand ResponseHydrogenBTM SolarLoadExcess Generation
60 CO2 Red by 2040 Nuclear (Palo Verde)Nuclear (SMR)Gas - Steam TurbineGas - Combined CycleGas - Combustion TurbineBiomassGeothermalWindSolarBattery StorageImportsDemand ResponseHydrogenBTM SolarLoadExcess Generation
2021 2024 2025 2027 2031 2035 2040 2045Cumulative Capacity Additions (MW)
- - - - - - - - - - - - - - - - - - - - - - - - - - - - - - - - - 228 228 228 228 512 671 830 - - - - - - - - - - - - - - - - - - 109 109 109 109 109 264 - 270 514 514 789 1197 1281 1995 - 50 183 256 582 1032 1116 1366 - - - - - - - - 46 53 56 61 71 81 93 93
- - - - - - - - 18 65 80 108 166 221 289 368
- - - - - - - - - - - - - - - - - - - - - - - - - - - - - - - - - - - - - - - - - - - - - - - - - 228 228 228 228 499 624 738 - - - - - - - - - - - - - - - - - - 109 109 109 109 221 300 - 270 514 514 800 1265 1372 2314 - 50 183 256 580 1045 1135 1623 - - - - - - - - 46 53 56 61 71 81 93 93
- - - - - - - - 18 65 80 108 166 221 289 368
- - - - - - - - - - - - - - - - - - - - - - - - - - - - - - - - - - - - - - - - - - - - - - - - - 228 228 228 228 498 547 589 - - - - - - - - - - - - - - - - - - 109 109 109 109 300 301 - 270 514 514 800 1266 1804 2835 - 50 183 256 580 1046 1194 2112 - - - - - - - - 46 53 56 61 71 81 93 93
- - - - - - - - 18 65 80 108 166 221 289 368
- - - - - - - - - - - - - - - -
Attachment D-1 E3 EPE Report Model Results June Page 23 of 34
Scenario Resource Type80 CO2 Red by 2040 Nuclear (Palo Verde)
Nuclear (SMR)Gas - Steam TurbineGas - Combined CycleGas - Combustion TurbineBiomassGeothermalWindSolarBattery StorageImportsDemand ResponseHydrogenBTM SolarLoadExcess Generation
90 CO2 Red by 2040 Nuclear (Palo Verde)Nuclear (SMR)Gas - Steam TurbineGas - Combined CycleGas - Combustion TurbineBiomassGeothermalWindSolarBattery StorageImportsDemand ResponseHydrogenBTM SolarLoadExcess Generation
100 CO2 Red by 2040 Nuclear (Palo Verde)Nuclear (SMR)Gas - Steam TurbineGas - Combined CycleGas - Combustion TurbineBiomassGeothermalWindSolarBattery StorageImportsDemand ResponseHydrogenBTM SolarLoadExcess Generation
2021 2024 2025 2027 2031 2035 2040 2045Cumulative Capacity Additions (MW)
- - - - - - - - - - - - - - - - - - - - - - - - - - - - - - - - - 228 228 228 228 445 445 445 - - - - - - - - - - - - - - - - - - 192 192 192 192 507 507 - 270 514 514 776 1430 2208 3275 - 50 183 238 556 1080 1416 2505 - - - - - - - - 46 53 56 61 71 81 93 93
- - - - - - - - 18 65 80 108 166 221 289 368
- - - - - - - - - - - - - - - - - - - - - - - - - - - - - - - - - - - - - - - - - - - - - - - - - 228 228 228 228 379 379 379 - - - - - - - - - - - - - - - - - - 192 192 192 192 764 772 - 270 513 513 776 1636 2266 3343 - 50 183 238 556 1276 1601 2677 - - - - - - - - 46 53 56 61 71 81 93 93
- - - - - - - - 18 65 80 108 166 221 289 368
- - - - - - - - - - - - - - - - - - - - - - - - - - - - - - - - - - - - - - - - - - - - - - - - - 228 228 228 228 228 228 228 - - - - - - - - - - - - - - - - - - 132 132 132 132 1228 1605 - 270 514 514 793 2084 4833 5479 - 50 183 251 573 1864 6191 7470 - - - - - - - - 46 53 56 61 71 81 93 93
- - - - - - - - 18 65 80 108 166 221 298 701
- - - - - - - - - - - - - - - -
Attachment D-1 E3 EPE Report Model Results June Page 24 of 34
Scenario Resource Type100 CO2 Red by 2040 (w H2) Nuclear (Palo Verde)
Nuclear (SMR)Gas - Steam TurbineGas - Combined CycleGas - Combustion TurbineBiomassGeothermalWindSolarBattery StorageImportsDemand ResponseHydrogenBTM SolarLoadExcess Generation
2021 2024 2025 2027 2031 2035 2040 2045Cumulative Capacity Additions (MW)
- - - - - - - - - - - - - - - - - - - - - - - - - - - - - - - - - 228 228 228 228 334 - - - - - - - - - - - - - - - - - - - - 231 231 231 231 687 687 - 270 513 513 768 1756 2335 3462 - 50 183 233 548 1403 1804 2914 - - - - - - - - 46 53 56 61 71 81 93 93
- - - - - - 334 334 18 65 80 108 166 221 289 368
- - - - - - - - - - - - - - - -
Attachment D-1 E3 EPE Report Model Results June Page 25 of 34
Scenario Resource TypeLeast-Cost (Reference Case) Nuclear (Palo Verde)
Nuclear (SMR)Gas - Steam TurbineGas - Combined CycleGas - Combustion TurbineBiomassGeothermalWindSolarBattery StorageImportsDemand ResponseHydrogenBTM SolarLoadExcess Generation
Least-Cost Case + ETA Resources Nuclear (Palo Verde)Nuclear (SMR)Gas - Steam TurbineGas - Combined CycleGas - Combustion TurbineBiomassGeothermalWindSolarBattery StorageImportsDemand ResponseHydrogenBTM SolarLoadExcess Generation
Separate System Planning Nuclear (Palo Verde)Nuclear (SMR)Gas - Steam TurbineGas - Combined CycleGas - Combustion TurbineBiomassGeothermalWindSolarBattery StorageImportsDemand ResponseHydrogenBTM SolarLoadExcess Generation
2021 2024 2025 2027 2031 2035 2040 2045- - - - - - - - - - - - - - - - - (119) (119) (119) (192) (426) (426) (426) - - - - - (227) (227) (227) - - - - (63) (63) (63) (63) - - - - - - - - - - - - - - - - - - - - - - - - - - - - - (70) (97) (377) - - - - - - - (50) - - - - - - - - - - - - - - - - - - - - - - - - - - - - - - - - - - - - - - - - - - - - - - - - - - - - - - - - - - - - - - - - - (119) (119) (119) (192) (426) (426) (426) - - - - - (227) (227) (227) - - - - (63) (63) (63) (63) - - - - - - - - - - - - - - - - - - - - - - - - - - - - - (70) (97) (377) - - - - - - - (50) - - - - - - - - - - - - - - - - - - - - - - - - - - - - - - - - - - - - - - - - - - - - - - - - - - - - - - - - - - - - - - - - - (119) (119) (119) (192) (426) (426) (426) - - - - - (227) (227) (227) - - - - (63) (63) (63) (63) - - - - - - - - - - - - - - - - - - - - - - - - - - - - - (70) (97) (377) - - - - - - - (50) - - - - - - - - - - - - - - - - - - - - - - - - - - - - - - - - - - - - - - - - - - - - - - - -
Cumulative Capacity Retirements (MW)
Attachment D-1 E3 EPE Report Model Results June Page 26 of 34
Scenario Resource TypeSeparate System Planning (w H2) Nuclear (Palo Verde)
Nuclear (SMR)Gas - Steam TurbineGas - Combined CycleGas - Combustion TurbineBiomassGeothermalWindSolarBattery StorageImportsDemand ResponseHydrogenBTM SolarLoadExcess Generation
Low Load Growth Nuclear (Palo Verde)Nuclear (SMR)Gas - Steam TurbineGas - Combined CycleGas - Combustion TurbineBiomassGeothermalWindSolarBattery StorageImportsDemand ResponseHydrogenBTM SolarLoadExcess Generation
High Load Growth Nuclear (Palo Verde)Nuclear (SMR)Gas - Steam TurbineGas - Combined CycleGas - Combustion TurbineBiomassGeothermalWindSolarBattery StorageImportsDemand ResponseHydrogenBTM SolarLoadExcess Generation
2021 2024 2025 2027 2031 2035 2040 2045Cumulative Capacity Retirements (MW)
- - - - - - - - - - - - - - - - - (119) (119) (119) (192) (426) (426) (426) - - - - - (227) (227) (227) - - - - (63) (63) (63) (63) - - - - - - - - - - - - - - - - - - - - - - - - - - - - - (70) (97) (377) - - - - - - - (50) - - - - - - - - - - - - - - - - - - - - - - - - - - - - - - - - - - - - - - - - - - - - - - - - - - - - - - - - - - - - - - - - - (119) (119) (119) (192) (426) (426) (426) - - - - - (227) (227) (227) - - - - (63) (63) (63) (63) - - - - - - - - - - - - - - - - - - - - - - - - - - - - - (70) (97) (377) - - - - - - - (50) - - - - - - - - - - - - - - - - - - - - - - - - - - - - - - - - - - - - - - - - - - - - - - - - - - - - - - - - - - - - - - - - - (119) (119) (119) (192) (426) (426) (426) - - - - - (227) (227) (227) - - - - (63) (63) (63) (63) - - - - - - - - - - - - - - - - - - - - - - - - - - - - - (70) (97) (377) - - - - - - - (50) - - - - - - - - - - - - - - - - - - - - - - - - - - - - - - - - - - - - - - - - - - - - - - - -
Attachment D-1 E3 EPE Report Model Results June Page 27 of 34
Scenario Resource TypeHigh DG Nuclear (Palo Verde)
Nuclear (SMR)Gas - Steam TurbineGas - Combined CycleGas - Combustion TurbineBiomassGeothermalWindSolarBattery StorageImportsDemand ResponseHydrogenBTM SolarLoadExcess Generation
High DSM Nuclear (Palo Verde)Nuclear (SMR)Gas - Steam TurbineGas - Combined CycleGas - Combustion TurbineBiomassGeothermalWindSolarBattery StorageImportsDemand ResponseHydrogenBTM SolarLoadExcess Generation
No New Gas Nuclear (Palo Verde)Nuclear (SMR)Gas - Steam TurbineGas - Combined CycleGas - Combustion TurbineBiomassGeothermalWindSolarBattery StorageImportsDemand ResponseHydrogenBTM SolarLoadExcess Generation
2021 2024 2025 2027 2031 2035 2040 2045Cumulative Capacity Retirements (MW)
- - - - - - - - - - - - - - - - - (119) (119) (119) (192) (426) (426) (426) - - - - - (227) (227) (227) - - - - (63) (63) (63) (63) - - - - - - - - - - - - - - - - - - - - - - - - - - - - - (70) (97) (377) - - - - - - - (50) - - - - - - - - - - - - - - - - - - - - - - - - - - - - - - - - - - - - - - - - - - - - - - - - - - - - - - - - - - - - - - - - - (119) (119) (119) (192) (426) (426) (426) - - - - - (227) (227) (227) - - - - (63) (63) (63) (63) - - - - - - - - - - - - - - - - - - - - - - - - - - - - - (70) (97) (377) - - - - - - - (50) - - - - - - - - - - - - - - - - - - - - - - - - - - - - - - - - - - - - - - - - - - - - - - - - - - - - - - - - - - - - - - - - - (119) (119) (119) (192) (426) (426) (426) - - - - - (227) (227) (227) - - - - (63) (63) (63) (63) - - - - - - - - - - - - - - - - - - - - - - - - - - - - - (70) (97) (377) - - - - - - - (50) - - - - - - - - - - - - - - - - - - - - - - - - - - - - - - - - - - - - - - - - - - - - - - - -
Attachment D-1 E3 EPE Report Model Results June Page 28 of 34
Scenario Resource TypeNo Lifetime Extensions Nuclear (Palo Verde)
Nuclear (SMR)Gas - Steam TurbineGas - Combined CycleGas - Combustion TurbineBiomassGeothermalWindSolarBattery StorageImportsDemand ResponseHydrogenBTM SolarLoadExcess Generation
High Gas Price Nuclear (Palo Verde)Nuclear (SMR)Gas - Steam TurbineGas - Combined CycleGas - Combustion TurbineBiomassGeothermalWindSolarBattery StorageImportsDemand ResponseHydrogenBTM SolarLoadExcess Generation
Low Carbon Price Nuclear (Palo Verde)Nuclear (SMR)Gas - Steam TurbineGas - Combined CycleGas - Combustion TurbineBiomassGeothermalWindSolarBattery StorageImportsDemand ResponseHydrogenBTM SolarLoadExcess Generation
2021 2024 2025 2027 2031 2035 2040 2045Cumulative Capacity Retirements (MW)
- - - - - - - - - - - - - - - - - (192) (192) (282) (282) (426) (426) (426) - - - (227) (227) (227) (227) (227) - - - - (63) (63) (63) (63) - - - - - - - - - - - - - - - - - - - - - - - - - - - - - (70) (97) (377) - - - - - - - (50) - - - - - - - - - - - - - - - - - - - - - - - - - - - - - - - - - - - - - - - - - - - - - - - - - - - - - - - - - - - - - - - - - (119) (119) (119) (192) (426) (426) (426) - - - - - (227) (227) (227) - - - - (63) (63) (63) (63) - - - - - - - - - - - - - - - - - - - - - - - - - - - - - (70) (97) (377) - - - - - - - (50) - - - - - - - - - - - - - - - - - - - - - - - - - - - - - - - - - - - - - - - - - - - - - - - - - - - - - - - - - - - - - - - - - (119) (119) (119) (192) (426) (426) (426) - - - - - (227) (227) (227) - - - - (63) (63) (63) (63) - - - - - - - - - - - - - - - - - - - - - - - - - - - - - (70) (97) (377) - - - - - - - (50) - - - - - - - - - - - - - - - - - - - - - - - - - - - - - - - - - - - - - - - - - - - - - - - -
Attachment D-1 E3 EPE Report Model Results June Page 29 of 34
Scenario Resource TypeMedium Carbon Price Nuclear (Palo Verde)
Nuclear (SMR)Gas - Steam TurbineGas - Combined CycleGas - Combustion TurbineBiomassGeothermalWindSolarBattery StorageImportsDemand ResponseHydrogenBTM SolarLoadExcess Generation
High Carbon Price Nuclear (Palo Verde)Nuclear (SMR)Gas - Steam TurbineGas - Combined CycleGas - Combustion TurbineBiomassGeothermalWindSolarBattery StorageImportsDemand ResponseHydrogenBTM SolarLoadExcess Generation
80 Clean by 2035 Nuclear (Palo Verde)Nuclear (SMR)Gas - Steam TurbineGas - Combined CycleGas - Combustion TurbineBiomassGeothermalWindSolarBattery StorageImportsDemand ResponseHydrogenBTM SolarLoadExcess Generation
2021 2024 2025 2027 2031 2035 2040 2045Cumulative Capacity Retirements (MW)
- - - - - - - - - - - - - - - - - (119) (119) (119) (192) (426) (426) (426) - - - - - (227) (227) (227) - - - - (63) (63) (63) (63) - - - - - - - - - - - - - - - - - - - - - - - - - - - - - (70) (97) (377) - - - - - - - (50) - - - - - - - - - - - - - - - - - - - - - - - - - - - - - - - - - - - - - - - - - - - - - - - - - - - - - - - - - - - - - - - - - (119) (119) (119) (192) (426) (426) (426) - - - - - (227) (227) (227) - - - - (63) (63) (63) (63) - - - - - - - - - - - - - - - - - - - - - - - - - - - - - (70) (97) (377) - - - - - - - (50) - - - - - - - - - - - - - - - - - - - - - - - - - - - - - - - - - - - - - - - - - - - - - - - - - - - - - - - - - - - - - - - - - (119) (119) (119) (192) (426) (426) (426) - - - - - (227) (227) (227) - - - - (63) (63) (63) (63) - - - - - - - - - - - - - - - - - - - - - - - - - - - - - (70) (97) (377) - - - - - - - (50) - - - - - - - - - - - - - - - - - - - - - - - - - - - - - - - - - - - - - - - - - - - - - - - -
Attachment D-1 E3 EPE Report Model Results June Page 30 of 34
Scenario Resource Type20 CO2 Red by 2040 Nuclear (Palo Verde)
Nuclear (SMR)Gas - Steam TurbineGas - Combined CycleGas - Combustion TurbineBiomassGeothermalWindSolarBattery StorageImportsDemand ResponseHydrogenBTM SolarLoadExcess Generation
40 CO2 Red by 2040 Nuclear (Palo Verde)Nuclear (SMR)Gas - Steam TurbineGas - Combined CycleGas - Combustion TurbineBiomassGeothermalWindSolarBattery StorageImportsDemand ResponseHydrogenBTM SolarLoadExcess Generation
60 CO2 Red by 2040 Nuclear (Palo Verde)Nuclear (SMR)Gas - Steam TurbineGas - Combined CycleGas - Combustion TurbineBiomassGeothermalWindSolarBattery StorageImportsDemand ResponseHydrogenBTM SolarLoadExcess Generation
2021 2024 2025 2027 2031 2035 2040 2045Cumulative Capacity Retirements (MW)
- - - - - - - - - - - - - - - - - (119) (119) (119) (192) (426) (426) (426) - - - - - (227) (227) (227) - - - - (63) (63) (63) (63) - - - - - - - - - - - - - - - - - - - - - - - - - - - - - (70) (97) (377) - - - - - - - (50) - - - - - - - - - - - - - - - - - - - - - - - - - - - - - - - - - - - - - - - - - - - - - - - - - - - - - - - - - - - - - - - - - (119) (119) (119) (192) (426) (426) (426) - - - - - (227) (227) (227) - - - - (63) (63) (63) (63) - - - - - - - - - - - - - - - - - - - - - - - - - - - - - (70) (97) (377) - - - - - - - (50) - - - - - - - - - - - - - - - - - - - - - - - - - - - - - - - - - - - - - - - - - - - - - - - - - - - - - - - - - - - - - - - - - (119) (119) (119) (192) (426) (426) (426) - - - - - (227) (227) (227) - - - - (63) (63) (63) (63) - - - - - - - - - - - - - - - - - - - - - - - - - - - - - (70) (97) (377) - - - - - - - (50) - - - - - - - - - - - - - - - - - - - - - - - - - - - - - - - - - - - - - - - - - - - - - - - -
Attachment D-1 E3 EPE Report Model Results June Page 31 of 34
Scenario Resource Type80 CO2 Red by 2040 Nuclear (Palo Verde)
Nuclear (SMR)Gas - Steam TurbineGas - Combined CycleGas - Combustion TurbineBiomassGeothermalWindSolarBattery StorageImportsDemand ResponseHydrogenBTM SolarLoadExcess Generation
90 CO2 Red by 2040 Nuclear (Palo Verde)Nuclear (SMR)Gas - Steam TurbineGas - Combined CycleGas - Combustion TurbineBiomassGeothermalWindSolarBattery StorageImportsDemand ResponseHydrogenBTM SolarLoadExcess Generation
100 CO2 Red by 2040 Nuclear (Palo Verde)Nuclear (SMR)Gas - Steam TurbineGas - Combined CycleGas - Combustion TurbineBiomassGeothermalWindSolarBattery StorageImportsDemand ResponseHydrogenBTM SolarLoadExcess Generation
2021 2024 2025 2027 2031 2035 2040 2045Cumulative Capacity Retirements (MW)
- - - - - - - - - - - - - - - - - (119) (119) (119) (192) (426) (426) (426) - - - - - (227) (227) (227) - - - - (63) (63) (63) (63) - - - - - - - - - - - - - - - - - - - - - - - - - - - - - (70) (97) (377) - - - - - - - (50) - - - - - - - - - - - - - - - - - - - - - - - - - - - - - - - - - - - - - - - - - - - - - - - - - - - - - - - - - - - - - - - - - (119) (119) (119) (192) (426) (426) (426) - - - - - (227) (227) (227) - - - - (63) (63) (63) (63) - - - - - - - - - - - - - - - - - - - - - - - - - - - - - (70) (97) (377) - - - - - - - (50) - - - - - - - - - - - - - - - - - - - - - - - - - - - - - - - - - - - - - - - - - - - - - - - - - - - - - - - - - - - - - - - - - (119) (119) (119) (192) (426) (426) (426) - - - - - (227) (227) (227) - - - - (63) (63) (63) (63) - - - - - - - - - - - - - - - - - - - - - - - - - - - - - (70) (97) (377) - - - - - - - (50) - - - - - - - - - - - - - - - - - - - - - - - - - - - - - - - - - - - - - - - - - - - - - - - -
Attachment D-1 E3 EPE Report Model Results June Page 32 of 34
Scenario Resource Type100 CO2 Red by 2040 (w H2) Nuclear (Palo Verde)
Nuclear (SMR)Gas - Steam TurbineGas - Combined CycleGas - Combustion TurbineBiomassGeothermalWindSolarBattery StorageImportsDemand ResponseHydrogenBTM SolarLoadExcess Generation
2021 2024 2025 2027 2031 2035 2040 2045Cumulative Capacity Retirements (MW)
- - - - - - - - - - - - - - - - - (119) (119) (119) (192) (426) (426) (426) - - - - - (227) (227) (227) - - - - (63) (63) (63) (63) - - - - - - - - - - - - - - - - - - - - - - - - - - - - - (70) (97) (377) - - - - - - - (50) - - - - - - - - - - - - - - - - - - - - - - - - - - - - - - - - - - - - - - - - - - - - - - - -
Attachment D-1 E3 EPE Report Model Results June Page 33 of 34
Scenario 2021 2024 2025 2027 2031 2035 2040 2045Least-Cost (Reference Case) 246$ 233$ 246$ 265$ 290$ 351$ 409$ 512$ Least-Cost Case + ETA Resources 246$ 233$ 249$ 266$ 291$ 356$ 412$ 519$ Separate System Planning 247$ 234$ 252$ 269$ 295$ 376$ 471$ 577$ Separate System Planning (w H2) 247$ 234$ 252$ 269$ 294$ 355$ 438$ 543$ Low Load Growth 239$ 227$ 239$ 255$ 275$ 327$ 380$ 478$ High Load Growth 253$ 239$ 256$ 277$ 307$ 377$ 439$ 546$ High DG 245$ 231$ 243$ 261$ 283$ 336$ 388$ 482$ High DSM 245$ 230$ 241$ 256$ 272$ 317$ 364$ 454$ No New Gas 246$ 233$ 247$ 265$ 290$ 394$ 470$ 601$ No Lifetime Extensions 246$ 228$ 246$ 276$ 307$ 354$ 412$ 515$ High Gas Price 257$ 242$ 252$ 272$ 297$ 358$ 418$ 522$ Low Carbon Price 291$ 277$ 285$ 304$ 329$ 390$ 450$ 556$ Medium Carbon Price 358$ 341$ 342$ 361$ 386$ 447$ 512$ 623$ High Carbon Price 469$ 449$ 433$ 452$ 478$ 539$ 609$ 730$ 80 Clean by 2035 246$ 233$ 246$ 265$ 290$ 352$ 409$ 512$ 20 CO2 Red by 2040 246$ 233$ 246$ 265$ 290$ 351$ 409$ 511$ 40 CO2 Red by 2040 246$ 233$ 246$ 265$ 290$ 352$ 409$ 519$ 60 CO2 Red by 2040 246$ 233$ 246$ 265$ 290$ 352$ 421$ 537$ 80 CO2 Red by 2040 246$ 233$ 248$ 266$ 290$ 356$ 464$ 580$ 90 CO2 Red by 2040 246$ 233$ 248$ 266$ 290$ 366$ 503$ 620$ 100 CO2 Red by 2040 246$ 233$ 247$ 265$ 290$ 394$ 1102$ 1269$ 100 CO2 Red by 2040 (w H2) 246$ 233$ 250$ 267$ 291$ 375$ 561$ 675$
Annual Revenue Requirement ($M)
Attachment D-1 E3 EPE Report Model Results June Page 34 of 34
Scenario Clean Energy Type 2021 2024 2025 2027 2031 2035 2040 2045Least-Cost (Reference Case) Renewable 4 12 22 23 28 35 36 40
Zero Carbon 62 68 77 76 79 81 77 75Least-Cost Case + ETA Resources Renewable 4 12 25 26 32 39 42 48
Zero Carbon 62 68 80 79 82 86 83 83Separate System Planning Renewable 4 12 23 23 28 39 42 46
Zero Carbon 62 68 78 77 78 85 83 81Separate System Planning (w H2) Renewable 4 12 24 24 29 36 41 45
Zero Carbon 62 68 79 78 80 82 83 80Low Load Growth Renewable 4 12 20 20 25 34 35 38
Zero Carbon 64 70 77 76 77 82 77 75High Load Growth Renewable 4 12 23 24 31 36 36 41
Zero Carbon 61 66 77 76 80 80 76 75High DG Renewable 4 13 22 24 29 35 37 40
Zero Carbon 63 70 78 77 79 82 78 76High DSM Renewable 4 12 19 20 23 33 34 37
Zero Carbon 63 69 76 75 75 82 78 75No New Gas Renewable 4 12 22 23 29 44 51 58
Zero Carbon 62 68 78 77 79 90 91 93No Lifetime Extensions Renewable 4 12 24 26 31 35 36 40
Zero Carbon 62 68 80 80 81 81 77 75High Gas Price Renewable 4 12 23 24 29 36 37 43
Zero Carbon 62 68 78 78 80 83 78 78Low Carbon Price Renewable 4 12 24 25 31 37 38 43
Zero Carbon 62 68 80 79 81 84 79 79Medium Carbon Price Renewable 4 12 27 28 33 39 41 46
Zero Carbon 62 68 83 82 83 86 82 81High Carbon Price Renewable 4 12 31 32 35 41 45 54
Zero Carbon 62 68 86 86 85 87 86 8980 Clean by 2035 Renewable 4 12 22 23 29 36 39 45
Zero Carbon 62 68 77 76 79 82 80 8020 CO2 Red by 2040 Renewable 4 12 22 23 29 35 36 43
Zero Carbon 62 68 77 76 79 81 77 7940 CO2 Red by 2040 Renewable 4 12 22 23 29 36 40 49
Zero Carbon 62 68 77 76 79 82 81 8460 CO2 Red by 2040 Renewable 4 12 22 23 29 35 46 54
Zero Carbon 62 68 77 76 79 82 87 8980 CO2 Red by 2040 Renewable 4 12 24 25 31 39 53 59
Zero Carbon 62 68 80 79 81 86 93 9490 CO2 Red by 2040 Renewable 4 12 24 25 31 42 56 62
Zero Carbon 62 68 80 79 81 88 97 97100 CO2 Red by 2040 Renewable 4 12 22 23 29 44 62 67
Zero Carbon 62 68 78 77 79 90 100 100100 CO2 Red by 2040 (w H2) Renewable 4 12 25 26 32 45 56 62
Zero Carbon 62 68 81 80 83 91 100 100
Clean Energy ( of Load)
Portfolio Analysis Results612021
El Paso Electric IRP
Modeling Update
Arne Olson Senior PartnerJack Moore Director
Joe Hooker Senior Managing ConsultantHuai Jiang Senior Consultant
Manu Mogadali Senior ConsultantChen Zhang Consultant
Attachment D-2 E-3 June IRP Presentation Page 1 of 37
2Confidential Draft
Agenda
Assumption updates
Updated Reference Case results
High DSM sensitivity results
New Mexico REA Requirements
New Mexico REA Scenario Results
Attachment D-2 E-3 June IRP Presentation Page 2 of 37
Assumption Updates
Attachment D-2 E-3 June IRP Presentation Page 3 of 37
4Confidential Draft
Unit Lifetime Extensions
E3 modeled unit lifetime extensions for the following units that are currently scheduled to retire prior to 2030
In the modeling unit extensions for Rio Grande 7 and Newman 2 are not selected but the other unit extensions are
Resource Planned Retirement Year
Extension Period
Capital + Fixed OampM
(2021 $kW-yr)Rio Grande 7 2022 5 years $11373Newman 1 2022 5 years $7859Newman 2 2022 5 years $7998Newman 3 2026 5 years $5812Newman 4 2026 5 years $4744
Attachment D-2 E-3 June IRP Presentation Page 4 of 37
5Confidential Draft
Planning Reserve Margin
The modeling assumes a 2-day-in-10-year reliability standard for 2025 as a transition to the more common 1-day-in-10-year reliability standard starting in 2030
Under this PRM all generators count toward the PRM based on their effective load carrying capability (ELCC)
Metric 2025 2030+
Reliability TargetTwo days with outages
every ten years on average (02 LOLE)
One day with outages every ten years on average (01 LOLE)
Target PCAP PRM 101 129
LOLE = Loss-of-Load Expectation PCAP = Perfect Capacity
Attachment D-2 E-3 June IRP Presentation Page 5 of 37
Updated Reference Case
Results
Attachment D-2 E-3 June IRP Presentation Page 6 of 37
7Confidential Draft
Scenarios and Sensitivities
Run Note Presented Previously
Presented Today
Least-Cost (Reference Case) Least-cost optimization used as reference case for all sensitivities
Least-Cost Case + REA Resources Additional resources added to Least-Cost Case for New Mexico REA
Separate System Planning New Mexico system planned separately for purposes of satisfying REA
Low Load Growth 3-4 higher native system load forecast
High Load Growth 3-4 lower native system load forecast
High DG High DG forecast
High DSM More smart thermostats doubling of energy efficiency
No New Gas No new gas after Newman 6
No Lifetime Extensions All plants retire as scheduled
High Gas Price Gas prices 15 higher
Low Carbon Price $8 per metric ton of CO2 in 2010 rising at 25 per year
Medium Carbon Price $20 per metric ton of CO2 in 2010 rising at 25 per year
High Carbon Price $40 per metric ton of CO2 in 2010 rising at 25 per year
80 Clean by 2035 80 zero-carbon energy
20 CO2 Red by 2040 20 reduction in CO2 emissions
40 CO2 Red by 2040 40 reduction in CO2 emissions
60 CO2 Red by 2040 60 reduction in CO2 emissions
80 CO2 Red by 2040 80 reduction in CO2 emissions
90 CO2 Red by 2040 90 reduction in CO2 emissions
100 CO2 Red by 2040 100 reduction in CO2 emissions
100 CO2 Red by 2040 (w H2) 100 reduction in CO2 emissions with hydrogen
Attachment D-2 E-3 June IRP Presentation Page 7 of 37
8Confidential Draft
Reference Case Additions and
Retirements
Total net additions by 2040
Storage ~1100 MW
Solar ~1500 MW
Wind ~100 MW
Gas (45) MW
DR = demand response BTM Solar = behind-the-meter solar
Attachment D-2 E-3 June IRP Presentation Page 8 of 37
9Confidential Draft
Reference Case Total Capacity
Total system capacity increases through 2045
bull Gas capacity declines 2027-2035 and then rises
bull Solar and storage capacity increase significantly
bull Wind and demand response increase more modestly
DR = demand response BTM Solar = behind-the-meter solar
Attachment D-2 E-3 June IRP Presentation Page 9 of 37
10Confidential Draft
Reference Case Annual Generation
BTM Solar = behind-the-meter solar
The amount of zero-carbon generation
increases markedly above current levels
Attachment D-2 E-3 June IRP Presentation Page 10 of 37
11Confidential Draft
Reference Case Effective Capacity
Load growth and resource
retirements together result in a
growing capacity need over time
which is met by a combination of
renewables storage demand
response and gas resources
Effective capacity is the amount of capacity that can be counted towards the PRM
Attachment D-2 E-3 June IRP Presentation Page 11 of 37
High DSM Sensitivity Results
Attachment D-2 E-3 June IRP Presentation Page 12 of 37
13Confidential Draft
High DSM Sensitivity Assumptions
Smart Thermostats Energy Efficiency
Base 50MW by 2040
High 60MW by 2040
Base 65 of native system load in 2040
High 13 of native system load in 2040
An incremental ~800 GWh in 2040 Corresponds to ~90 MW of savings on average throughout the year
Attachment D-2 E-3 June IRP Presentation Page 13 of 37
14Confidential Draft
High DSM Scenario Results
Change in Capacity Generation Mix
Attachment D-2 E-3 June IRP Presentation Page 14 of 37
New Mexico REA Requirements
Attachment D-2 E-3 June IRP Presentation Page 15 of 37
16Confidential Draft
New Mexico Renewable Energy Act
There are key requirements in the statutory language setting renewable energy and zero carbon requirements in New Mexico (emphasis added)
ldquoA public utility shall meet the renewable portfolio standard requirements as provided in this section to include renewable energy in its electric energy supply portfolio as demonstrated by its retirement of renewable energy certificates provided that the associated renewable energy is delivered to the public utility and assigned to the public utilitys New Mexico customershellip
(5) no later than January 1 2040 renewable energy resources shall supply no less than eighty percent of all retail sales of electricity in New Mexico provided that compliance with this standard until December 31 2047 shall not require the public utility to displace zero carbon resources in the utilitys generation portfolio on the effective date of this 2019 act and
(6) no later than January 1 2045 zero carbon resources shall supply one hundred percent of all retail sales of
electricity in New Mexico Reasonable and consistent progress shall be made over time toward this requirementrdquo
The scenarios analyzed consider multiple approaches for REA implementationbull Share of NM load served with renewable energy given that El Paso Electric serves NM load with
greater than 20 non-renewable zero-carbon resources (ie Palo Verde)
bull Annual vs hourly balancing periods for 100 zero-carbon generation
bull Whether combustion resources may be utilized to ensure reliability for NM customers
Attachment D-2 E-3 June IRP Presentation Page 16 of 37
17Confidential Draft
New Mexico REA Requirements in 2040+
The REA requires 80 RPS by 2040 unless doing so would require displacing existing zero-carbon generation
New Mexicorsquos share of Palo Verde 1 and 2 supplies 31 of New Mexicorsquos retail sales in 2040 and 27 in 2045
For purposes of IRP modeling El Paso Electric has directed E3 to require New Mexico zero-carbon generation (renewables + nuclear) to equal or exceed 100 of New Mexico retail sales or load starting in 2040
New Mexico Nuclear Generation amp Load
Nuclear Generation
Retail Sales
Total Load
Attachment D-2 E-3 June IRP Presentation Page 17 of 37
18Confidential Draft
Two Approaches for Modeling Zero-Carbon
Generation Balancing
bull New Mexico-allocated zero-carbon resources must generate enough energy on an annual basis to match the REA NM retail sales target
bull Natural gas resources andor imports can serve New Mexicorsquos energy needs in some hours if that generation is offset by additional zero-carbon generation in other hours
bull Annual balancing allows New Mexico customers to reap the benefits of being served by a larger system
Annual Balancing
bull New Mexico cannot receive power from gas resources or unspecified imports in any hour
bull Zero-carbon generation from New Mexico-allocated resources must serve New Mexico energy demand in all hours of the year
bull This would be a more stringent zero-carbon requirement as it would not allow for balancing between New Mexico and Texas resources
Hourly Balancing
NM-Allocated Resources
NM customers can be served by gas resources
and unspecified imports if offset in other hours
NM-Allocated Resources
Other Resources
NM customers cannot be served by gas resources
or unspecified imports an any hour
Attachment D-2 E-3 June IRP Presentation Page 18 of 37
19Confidential Draft
Two Approaches for Modeling Capacity
Pooling to Ensure Reliability
bull For reliability planning purposes NM and TX loads can be served by NM resources TX resources andor system resources
bull If the NM jurisdiction doesnrsquot have enough resources to satisfy load in an hour then it can rely on TX resources and vice versa
bull NM and TX customers must still pay for enough resources to satisfy their share of system reliability needs
Capacity Pooling Allowed
bull For planning purposes TX and NM must each have enough resources to ensure reliability across a range of potential conditions without relying on the other jurisdiction (ie on a standalone basis)
bull This would be a more stringent planning approach NM would need to plan to have enough resources without falling back on TX gas resources in some hours
Capacity Pooling NOT Allowed
NM-Allocated Resources
TX-Allocated Resources
NM-Allocated Resources
TX-Allocated Resources
All resources together ensure
systemwide reliability across all hours
subject to the reliability standard
For planning purposes each jurisdiction
ensures reliability on its own across all
hours subject to the reliability standard
Attachment D-2 E-3 June IRP Presentation Page 19 of 37
20Confidential Draft
New Mexico REA Scenarios and
Jurisdictional Allocation
E3 modeled a few scenarios with different approaches for how to satisfy the REA requirementsbull Different approaches of the REA requirements have meaningful implications on how
planning is performed for New Mexico customersbull The more stringent approaches of the REA requirements will result in higher system
costs relative to less stringent approaches
bull To ensure equitable treatment of customers across jurisdictions any incremental costs of satisfying the REA requirements would be allocated to New Mexico customers
For each scenario resources and costs are allocated between the New Mexico and Texas jurisdictionsbull The allocation of resources follows directly from a particular approach to modeling
REA compliance If a particular approach requires more resources to be added versus the least-cost case then those resources are allocated to the New Mexico jurisdiction
bull Capacity generation and cost for the New Mexico jurisdiction are presented for each scenario
Attachment D-2 E-3 June IRP Presentation Page 20 of 37
21Confidential Draft
Least Cost(ldquoLCrdquo)
Least Cost + REA Resources
(ldquoLC+REArdquo)
Separate System Planning
(ldquoSSPrdquo)
Portfoliooptimization
Least-cost system optimization
Reoptimize Least Cost to add additional renewables amp storage dedicated to NM to satisfy REA requirements
Optimize NM and TX systems independently
without modeling interactions between them
NM zero-carbon generation balancing period
Annual Annual Hourly
NM and TX capacity pooling to ensure reliability
Resource allocationResources allocated
proportionally more RECs allocated to NM
Incremental resources are allocated to New Mexico
Optimization identifies resources specifically for NM and TX jurisdictions
NM allocated new gas capacity
New Mexico REA Scenarios
More stringent REA interpretation
Attachment D-2 E-3 June IRP Presentation Page 21 of 37
New Mexico REA Scenario
Results
Attachment D-2 E-3 June IRP Presentation Page 22 of 37
23Confidential Draft
Least Cost(ldquoLCrdquo)
Least Cost + ETA Resources
(ldquoLC+ETArdquo)
Separate System Planning
(ldquoSSPrdquo)
Portfoliooptimization
Least-cost system optimization
Reoptimize Least Cost to add additional renewables amp storage dedicated to NM to satisfy ETA requirements
Optimize NM and TX systems independently
without modeling interactions between them
NM zero-carbon generation balancing period
Annual Annual Hourly
NM and TX capacity pooling to ensure reliability
Resource allocationResources allocated
proportionally more RECs allocated to NM
Incremental resources are allocated to New Mexico
Optimization identifies resources specifically for NM and TX jurisdictions
NM allocated new gas capacity
New Mexico REA Scenarios
Attachment D-2 E-3 June IRP Presentation Page 23 of 37
24Confidential Draft
Resource Portfolios and Costs by ScenarioLeast Cost Scenario
Total System New Mexico
This scenario allocates a share of new gas capacity to NM customers This capacity could be converted to run on a higher share of hydrogen fuel in the future More RECs would be allocated to NM customers to satisfy the REA
112 MW of new gas capacity is allocated to New Mexico customers by 2040
This analysis does not assume Palo Verde 3 generation is allocated to New Mexico resulting in a lower zero-carbon generation share than the rest of the system
Attachment D-2 E-3 June IRP Presentation Page 24 of 37
25Confidential Draft
Least Cost(ldquoLCrdquo)
Least Cost + REA Resources
(ldquoLC+REArdquo)
Separate System Planning
(ldquoSSPrdquo)
Portfoliooptimization
Least-cost system optimization
Reoptimize Least Cost to add additional renewables amp storage dedicated to NM to satisfy REA requirements
Optimize NM and TX systems independently
without modeling interactions between them
NM zero-carbon generation balancing period
Annual Annual Hourly
NM and TX capacity pooling to ensure reliability
Resource allocationResources allocated
proportionally more RECs allocated to NM
Incremental resources are allocated to New Mexico
Optimization identifies resources specifically for NM and TX jurisdictions
NM allocated new gas capacity
New Mexico REA Scenarios
Attachment D-2 E-3 June IRP Presentation Page 25 of 37
26Confidential Draft
Resource Portfolios and Costs by ScenarioLeast Cost + REA Scenario
Total System New Mexico
This scenario adds more solar and storage capacity for NM customers to satisfy the RPSREA targets while not allocating any new gas to NM customers This results in a modest cost increase vs Least Cost scenario
Gas generation serves a portion of New Mexico customersrsquo energy needs in some hours but that is more than offset by
Attachment D-2 E-3 June IRP Presentation Page 26 of 37
27Confidential Draft
New Mexico REA Scenarios
Least Cost(ldquoLCrdquo)
Least Cost + REA Resources
(ldquoLC+REArdquo)
Separate System Planning
(ldquoSSPrdquo)
Portfoliooptimization
Least-cost system optimization
Reoptimize Least Cost to add additional renewables amp storage dedicated to NM to satisfy REA requirements
Optimize NM and TX systems independently
without modeling interactions between them
NM zero-carbon generation balancing period
Annual Annual Hourly
NM and TX capacity pooling to ensure reliability
Resource allocationResources allocated
proportionally more RECs allocated to NM
Incremental resources are allocated to New Mexico
Optimization identifies resources specifically for NM and TX jurisdictions
NM allocated new gas capacity
Attachment D-2 E-3 June IRP Presentation Page 27 of 37
28Confidential Draft
Resource Portfolios and Costs by ScenarioSeparate System Planning Scenario
Total System New Mexico
This scenario requires significantly more resources for New Mexico to reach 100 absolute zero carbon and ensure reliability This results in a significant cost increase relative to the Least Cost scenario
Attachment D-2 E-3 June IRP Presentation Page 28 of 37
29Confidential Draft
Resource Portfolios and Costs by ScenarioSeparate System Planning (H2) Scenario
Total System New Mexico
Adding H2 capacity ensures reliability while significantly reducing solar and storage additions This mitigates cost impacts of achieving absolute zero carbon and planning to ensure reliability independently
Attachment D-2 E-3 June IRP Presentation Page 29 of 37
30Confidential Draft
New Mexico Capacity and CostLeast Cost Scenario
Least Cost Cost Impact vs Least Cost Scenario
The Least Cost scenario is the baseline for comparison Least
Cost
Attachment D-2 E-3 June IRP Presentation Page 30 of 37
31Confidential Draft
New Mexico Capacity and CostLeast Cost + REA Resources Scenario
Least Cost + REA Resources Cost Impact vs Least Cost Scenario
Least Cost + REA Resources
Least Cost
Attachment D-2 E-3 June IRP Presentation Page 31 of 37
32Confidential Draft
New Mexico Capacity and CostSeparate System Planning Scenario
Separate System Planning Cost Impact vs Least Cost Scenario
Least Cost + REA Resources
Separate System Planning
Least Cost
Attachment D-2 E-3 June IRP Presentation Page 32 of 37
33Confidential Draft
New Mexico Capacity and CostSeparate System Planning (H2) Scenario
Separate System Planning (H2) Cost Impact vs Least Cost Scenario
Least Cost + REA Resources
Separate System Planning (H2)
Separate System Planning
Least Cost
Attachment D-2 E-3 June IRP Presentation Page 33 of 37
34Confidential Draft
New Mexico Generation MixLeast Cost and Least Cost + REA Scenarios
Least Cost Least Cost + REA Resources
Attachment D-2 E-3 June IRP Presentation Page 34 of 37
35Confidential Draft
New Mexico Generation MixSeparate System Planning Scenarios
Separate System Planning Separate System Planning (H2)
Attachment D-2 E-3 June IRP Presentation Page 35 of 37
36Confidential Draft
Carbon Emissions Across Scenarios
CO2 Emissions in 2021 and 2040 Average Abatement Cost 2025-2040
Note emissions include emissions at company-owned facilities and emissions ascribed to imports2040
Attachment D-2 E-3 June IRP Presentation Page 36 of 37
Thank You
Thank You
Attachment D-2 E-3 June IRP Presentation Page 37 of 37
Attachment D-3 E3 EPE Report Model Results AugustPage 1 of 34
Scenario Resource Type 2021 2024 2025 2027 2031 2035 2040 2045Least-Cost (Reference Case) Nuclear (Palo Verde) 5148 5148 5148 5148 5148 5148 5148 5148
Nuclear (SMR) - - - - - - - - Gas - Steam Turbine 140 34 8 7 1 - - - Gas - Combined Cycle 1767 1373 1037 1148 1187 1075 1321 1513 Gas - Combustion Turbine 1027 1169 854 925 874 767 1251 1657 Biomass - - - - - - - - Geothermal - - - - - - - - Wind - - 354 357 361 316 381 730 Solar 289 952 1450 1467 2016 3050 3469 4199 Battery Storage - 12 (25) (26) (104) (215) (223) (248) Imports 391 336 266 261 296 278 360 440 Demand Response - - - - - - - - Hydrogen - - - - - - - - BTM Solar 37 135 165 225 344 460 601 763 Load 8771 9155 9258 9512 10123 10878 12308 14203 Excess Generation 14 130 416 397 431 636 374 456
Least-Cost Case + REA Resources Nuclear (Palo Verde) 5148 5148 5148 5148 5148 5148 5148 5148 Nuclear (SMR) - - - - - - - - Gas - Steam Turbine 140 34 4 11 1 - - - Gas - Combined Cycle 1767 1373 926 1001 1044 927 966 1101 Gas - Combustion Turbine 1027 1169 784 855 780 495 761 1005 Biomass - - - - - - - - Geothermal - - - - - - - - Wind - - 681 694 699 561 725 995 Solar 289 952 1340 1356 2030 3274 4121 5334 Battery Storage - 12 (29) (30) (105) (236) (277) (369) Imports 391 336 239 251 182 248 262 226 Demand Response - - - - - - - - Hydrogen - - - - - - - - BTM Solar 37 135 165 225 344 460 601 763 Load 8771 9155 9258 9512 10123 10878 12308 14203 Excess Generation 14 130 428 400 449 1144 1071 892
Separate System Planning Nuclear (Palo Verde) 5148 5148 5148 5148 5148 5148 5148 5148 Nuclear (SMR) - - - - - - - - Gas - Steam Turbine 140 34 1 2 - - - - Gas - Combined Cycle 1763 1385 1125 1238 1235 1000 1201 1349 Gas - Combustion Turbine 1048 1180 852 922 920 502 768 1046 Biomass - - - - - - - - Geothermal - - - - - - - - Wind - - 174 175 169 76 23 398 Solar 289 950 1556 1594 2135 3760 4704 5638 Battery Storage - 11 (55) (62) (129) (300) (367) (423) Imports 391 328 291 269 301 232 229 283 Demand Response - - - - - - - - Hydrogen - - - - - - - - BTM Solar 37 135 165 225 344 460 601 763 Load 8771 9155 9258 9512 10123 10878 12308 14203 Excess Generation 14 132 304 265 365 1270 2517 2452
Annual Energy (GWh)
Attachment D-3 E3 EPE Report Model Results AugustPage 2 of 34
Scenario Resource Type 2021 2024 2025 2027 2031 2035 2040 2045Annual Energy (GWh)
Separate System Planning (w H2) Nuclear (Palo Verde) 5148 5148 5148 5148 5148 5148 5148 5148 Nuclear (SMR) - - - - - - - - Gas - Steam Turbine 140 34 1 2 - - - - Gas - Combined Cycle 1763 1385 1101 1210 1223 1104 1199 1348 Gas - Combustion Turbine 1048 1180 843 915 870 762 793 1072 Biomass - - - - - - - - Geothermal - - - - - - - - Wind - - 214 215 207 202 285 678 Solar 289 950 1551 1588 2173 3139 4241 5147 Battery Storage - 11 (54) (61) (130) (221) (311) (365) Imports 391 328 288 270 288 285 278 331 Demand Response - - - - - - - - Hydrogen - - - - - - 74 80 BTM Solar 37 135 165 225 344 460 601 763 Load 8771 9155 9258 9512 10123 10878 12308 14203 Excess Generation 14 132 314 276 474 696 883 967
80 Clean by 2035 Nuclear (Palo Verde) 5148 5148 5148 5148 5148 5148 5148 5148 Nuclear (SMR) - - - - - - - - Gas - Steam Turbine 140 34 8 11 1 - - - Gas - Combined Cycle 1767 1373 1028 1131 1175 1088 1160 1293 Gas - Combustion Turbine 1027 1169 849 922 868 767 1055 1256 Biomass - - - - - - - - Geothermal - - - - - - - - Wind - - 378 381 385 342 650 1041 Solar 289 953 1450 1463 2012 3006 3689 4703 Battery Storage - 12 (24) (26) (103) (207) (238) (289) Imports 391 336 255 256 292 274 241 287 Demand Response - - - - - - - - Hydrogen - - - - - - - - BTM Solar 37 135 165 225 344 460 601 763 Load 8771 9155 9258 9512 10123 10878 12308 14203 Excess Generation 14 130 406 391 436 677 472 735
20 CO2 Red by 2040 Nuclear (Palo Verde) 5148 5148 5148 5148 5148 5148 5148 5148 Nuclear (SMR) - - - - - - - - Gas - Steam Turbine 140 34 8 11 1 - - - Gas - Combined Cycle 1767 1373 1027 1131 1175 1089 1253 1260 Gas - Combustion Turbine 1027 1169 849 922 868 765 1132 1187 Biomass - - - - - - - - Geothermal - - - - - - - - Wind - - 378 381 385 342 457 1095 Solar 289 953 1442 1456 2012 3007 3621 4792 Battery Storage - 12 (24) (26) (103) (207) (236) (297) Imports 391 336 264 264 292 275 332 255 Demand Response - - - - - - - - Hydrogen - - - - - - - - BTM Solar 37 135 165 225 344 460 601 763 Load 8771 9155 9258 9512 10123 10878 12308 14203 Excess Generation 14 129 415 398 436 676 463 752
Attachment D-3 E3 EPE Report Model Results AugustPage 3 of 34
Scenario Resource Type 2021 2024 2025 2027 2031 2035 2040 2045Annual Energy (GWh)
40 CO2 Red by 2040 Nuclear (Palo Verde) 5148 5148 5148 5148 5148 5148 5148 5148 Nuclear (SMR) - - - - - - - - Gas - Steam Turbine 140 34 8 11 1 - - - Gas - Combined Cycle 1767 1373 1027 1131 1175 1089 1060 1028 Gas - Combustion Turbine 1027 1169 849 922 868 767 790 822 Biomass - - - - - - - - Geothermal - - - - - - - - Wind - - 378 381 385 342 783 961 Solar 289 953 1441 1458 2013 3004 3980 5677 Battery Storage - 12 (24) (26) (103) (207) (264) (396) Imports 391 336 264 262 292 276 210 199 Demand Response - - - - - - - - Hydrogen - - - - - - - - BTM Solar 37 135 165 225 344 460 601 763 Load 8771 9155 9258 9512 10123 10878 12308 14203 Excess Generation 14 130 415 396 435 680 811 1196
60 CO2 Red by 2040 Nuclear (Palo Verde) 5148 5148 5148 5148 5148 5148 5148 5148 Nuclear (SMR) - - - - - - - - Gas - Steam Turbine 140 34 7 12 1 - - - Gas - Combined Cycle 1767 1373 1001 1093 1143 1029 780 735 Gas - Combustion Turbine 1027 1169 840 915 852 656 453 483 Biomass - - - - - - - - Geothermal - - - - - - - - Wind - - 444 448 451 388 853 808 Solar 289 953 1419 1436 2000 3174 4624 6588 Battery Storage - 12 (25) (26) (101) (226) (312) (488) Imports 391 336 259 260 286 250 161 166 Demand Response - - - - - - - - Hydrogen - - - - - - - - BTM Solar 37 135 165 225 344 460 601 763 Load 8771 9155 9258 9512 10123 10878 12308 14203 Excess Generation 14 129 411 390 452 766 1514 1850
80 CO2 Red by 2040 Nuclear (Palo Verde) 5148 5148 5148 5148 5148 5148 5148 5148 Nuclear (SMR) - - - - - - - - Gas - Steam Turbine 140 34 4 11 1 - - - Gas - Combined Cycle 1767 1373 914 986 1049 835 531 500 Gas - Combustion Turbine 1027 1169 771 842 725 399 127 142 Biomass - - - - - - - - Geothermal - - - - - - - - Wind - - 722 735 743 584 1310 1417 Solar 289 953 1329 1343 2004 3491 4869 6658 Battery Storage - 12 (31) (30) (102) (245) (342) (499) Imports 391 336 235 251 212 208 63 73 Demand Response - - - - - - - - Hydrogen - - - - - - - - BTM Solar 37 135 165 225 344 460 601 763 Load 8771 9155 9258 9512 10123 10878 12308 14203 Excess Generation 14 130 444 417 491 1350 2580 2939
Attachment D-3 E3 EPE Report Model Results AugustPage 4 of 34
Scenario Resource Type 2021 2024 2025 2027 2031 2035 2040 2045Annual Energy (GWh)
90 CO2 Red by 2040 Nuclear (Palo Verde) 5148 5148 5148 5148 5148 5148 5148 5148 Nuclear (SMR) - - - - - - - - Gas - Steam Turbine 140 34 4 11 2 - - - Gas - Combined Cycle 1767 1373 908 979 1009 778 304 290 Gas - Combustion Turbine 1027 1169 766 836 622 291 29 44 Biomass - - - - - - - - Geothermal - - - - - - - - Wind - - 740 754 763 513 1964 2116 Solar 289 952 1325 1339 2154 3842 4535 6263 Battery Storage - 12 (31) (30) (100) (278) (308) (453) Imports 391 336 232 250 182 125 35 32 Demand Response - - - - - - - - Hydrogen - - - - - - - - BTM Solar 37 135 165 225 344 460 601 763 Load 8771 9155 9258 9512 10123 10878 12308 14203 Excess Generation 14 130 452 424 650 1462 3356 3714
100 CO2 Red by 2040 (w H2) Nuclear (Palo Verde) 5148 5148 5148 5148 5148 5148 5148 5148 Nuclear (SMR) - - - - - - - - Gas - Steam Turbine 140 34 5 7 2 - - - Gas - Combined Cycle 1767 1373 860 928 924 643 - - Gas - Combustion Turbine 1027 1169 715 779 558 188 - - Biomass - - - - - - - - Geothermal - - - - - - - - Wind - - 896 917 922 557 1629 1685 Solar 289 952 1284 1297 2175 4069 4874 6693 Battery Storage - 12 (31) (32) (97) (302) (345) (509) Imports 391 336 215 242 148 114 - - Demand Response - - - - - - - - Hydrogen - - - - - - 400 423 BTM Solar 37 135 165 225 344 460 601 763 Load 8771 9155 9258 9512 10123 10878 12308 14203 Excess Generation 14 130 528 495 798 1795 3187 3597
100 CO2 Red by 2040 Nuclear (Palo Verde) 5148 5148 5148 5148 5148 5148 5148 5148 Nuclear (SMR) - - - - - - - - Gas - Steam Turbine 140 34 7 12 2 - - - Gas - Combined Cycle 1767 1373 1013 1110 924 643 - - Gas - Combustion Turbine 1027 1169 843 917 558 188 - - Biomass - - - - - - - - Geothermal - - - - - - - - Wind - - 416 419 922 557 1992 2629 Solar 289 952 1430 1445 2175 4069 4973 5542 Battery Storage - 12 (25) (26) (97) (302) (406) (572) Imports 391 336 260 261 148 114 - - Demand Response - - - - - - - - Hydrogen - - - - - - - - BTM Solar 37 135 165 225 344 460 601 1455 Load 8771 9155 9258 9512 10123 10878 12308 14203 Excess Generation 14 130 412 393 798 1795 11640 13062
Attachment D-3 E3 EPE Report Model Results AugustPage 5 of 34
Scenario Resource Type 2021 2024 2025 2027 2031 2035 2040 2045Annual Energy (GWh)
High DG Nuclear (Palo Verde) 5148 5148 5148 5148 5148 5148 5148 5148 Nuclear (SMR) - - - - - - - - Gas - Steam Turbine 134 31 9 12 1 - - - Gas - Combined Cycle 1728 1317 1044 1144 1175 1073 1273 1538 Gas - Combustion Turbine 1028 1123 885 923 846 711 1096 1713 Biomass - - - - - - - - Geothermal - - - - - - - - Wind - - 338 336 341 295 352 763 Solar 285 866 1148 1107 1485 2336 2661 2700 Battery Storage - 11 (25) (25) (105) (226) (249) (243) Imports 389 314 273 258 287 265 347 441 Demand Response - - - - - - - - Hydrogen - - - - - - - - BTM Solar 88 350 436 608 945 1276 1680 2144 Load 8771 9155 9258 9512 10123 10878 12308 14203 Excess Generation 18 217 389 432 552 696 602 379
High DSM Nuclear (Palo Verde) 5148 5148 5148 5148 5148 5148 5148 5148 Nuclear (SMR) - - - - - - - - Gas - Steam Turbine 133 30 2 3 0 - - - Gas - Combined Cycle 1744 1303 1197 1315 1357 1105 1320 1460 Gas - Combustion Turbine 1020 1111 977 1001 989 706 1104 1404 Biomass - - - - - - - - Geothermal - - - - - - - - Wind - - - - - - - 471 Solar 288 934 1274 1273 1604 2760 3166 3725 Battery Storage - 10 (25) (23) (80) (203) (216) (234) Imports 390 329 318 286 318 297 377 438 Demand Response - - - - - - - - Hydrogen - - - - - - - - BTM Solar 37 135 165 225 344 460 601 763 Load 8731 8994 9056 9230 9680 10273 11501 13177 Excess Generation 15 148 197 197 215 541 326 371
Low Load Nuclear (Palo Verde) 5148 5148 5148 5148 5148 5148 5148 5148 Nuclear (SMR) - - - - - - - - Gas - Steam Turbine 101 27 2 3 2 - - - Gas - Combined Cycle 1596 1244 1155 1300 1422 1129 1372 1496 Gas - Combustion Turbine 983 1065 942 985 1034 759 1214 1529 Biomass - - - - - - - - Geothermal - - - - - - - - Wind - - - - - - - 523 Solar 282 919 1260 1272 1563 2869 3314 3970 Battery Storage - 8 (26) (24) (69) (209) (222) (246) Imports 381 325 311 284 315 303 385 440 Demand Response - - - - - - - - Hydrogen - - - - - - - - BTM Solar 37 135 165 225 344 460 601 763 Load 8492 8862 8958 9194 9759 10459 11813 13623 Excess Generation 22 163 216 205 224 535 317 399
Attachment D-3 E3 EPE Report Model Results AugustPage 6 of 34
Scenario Resource Type 2021 2024 2025 2027 2031 2035 2040 2045Annual Energy (GWh)
High Load Nuclear (Palo Verde) 5148 5148 5148 5148 5148 5148 5148 5148 Nuclear (SMR) - - - - - - - - Gas - Steam Turbine 195 50 7 3 - - - - Gas - Combined Cycle 1909 1522 1077 1166 1126 1113 1386 1518 Gas - Combustion Turbine 1088 1256 889 937 786 875 1409 1781 Biomass - - - - - - - - Geothermal - - - - - - - - Wind - - 420 424 404 387 450 957 Solar 293 983 1618 1717 2556 3249 3659 4426 Battery Storage - 14 (42) (64) (158) (220) (224) (251) Imports 400 343 275 273 281 286 373 440 Demand Response - - - - - - - - Hydrogen - - - - - - - - BTM Solar 37 135 165 225 344 460 601 763 Load 9050 9448 9558 9830 10488 11297 12803 14784 Excess Generation 10 100 381 278 543 642 387 518
No Lifetime Extensions Nuclear (Palo Verde) 5148 5148 5148 5148 5148 5148 5148 5148 Nuclear (SMR) - - - - - - - - Gas - Steam Turbine 140 34 12 2 - - - - Gas - Combined Cycle 1767 1373 972 1029 1055 1069 1314 1513 Gas - Combustion Turbine 1027 1169 744 693 636 764 1246 1657 Biomass - - - - - - - - Geothermal - - - - - - - - Wind - - 364 369 340 337 408 730 Solar 289 952 1643 1894 2495 3039 3457 4199 Battery Storage - 12 (26) (92) (164) (214) (223) (248) Imports 391 336 235 243 270 276 357 440 Demand Response - - - - - - - - Hydrogen - - - - - - - - BTM Solar 37 135 165 225 344 460 601 763 Load 8771 9155 9258 9512 10123 10878 12308 14203 Excess Generation 14 130 669 413 585 637 371 456
No New Gas Nuclear (Palo Verde) 5148 5148 5148 5148 5148 5148 5148 5148 Nuclear (SMR) - - - - - - - - Gas - Steam Turbine 140 34 7 12 1 - - - Gas - Combined Cycle 1767 1373 1013 1110 1156 829 774 714 Gas - Combustion Turbine 1027 1169 843 917 859 294 269 286 Biomass - - - - - - - - Geothermal - - - - - - - - Wind - - 416 419 423 227 195 209 Solar 289 952 1430 1445 2002 4003 5562 7483 Battery Storage - 12 (25) (26) (102) (320) (460) (623) Imports 391 336 260 261 293 237 219 223 Demand Response - - - - - - - - Hydrogen - - - - - - - - BTM Solar 37 135 165 225 344 460 601 763 Load 8771 9155 9258 9512 10123 10878 12308 14203 Excess Generation 14 130 412 393 449 1709 2222 2760
Attachment D-3 E3 EPE Report Model Results AugustPage 7 of 34
Scenario Resource Type 2021 2024 2025 2027 2031 2035 2040 2045Annual Energy (GWh)
Low Carbon Price Nuclear (Palo Verde) 5148 5148 5148 5148 5148 5148 5148 5148 Nuclear (SMR) - - - - - - - - Gas - Steam Turbine 127 23 4 5 1 - - - Gas - Combined Cycle 1803 1433 1000 1092 1104 988 1204 1335 Gas - Combustion Turbine 1001 1107 776 839 788 598 1076 1338 Biomass - - - - - - - - Geothermal - - - - - - - - Wind - - 562 571 569 479 581 943 Solar 289 958 1390 1406 1988 3174 3609 4556 Battery Storage - 11 (30) (29) (104) (228) (238) (278) Imports 394 345 242 255 285 258 326 397 Demand Response - - - - - - - - Hydrogen - - - - - - - - BTM Solar 37 135 165 225 344 460 601 763 Load 8771 9155 9258 9512 10123 10878 12308 14203 Excess Generation 14 125 403 379 473 835 521 718
Mid Carbon Price Nuclear (Palo Verde) 5148 5148 5148 5148 5148 5148 5148 5148 Nuclear (SMR) - - - - - - - - Gas - Steam Turbine 120 22 3 4 1 - - - Gas - Combined Cycle 1822 1496 923 994 1017 922 1107 1275 Gas - Combustion Turbine 983 1036 596 663 681 475 938 1205 Biomass - - - - - - - - Geothermal - - - - - - - - Wind - - 771 794 801 650 804 1099 Solar 290 961 1474 1493 2020 3264 3720 4732 Battery Storage - 7 (35) (36) (101) (230) (245) (291) Imports 399 354 212 227 211 190 235 273 Demand Response - - - - - - - - Hydrogen - - - - - - - - BTM Solar 37 135 165 225 344 460 601 763 Load 8771 9155 9258 9512 10123 10878 12308 14203 Excess Generation 13 121 615 574 500 912 572 727
High Carbon Price Nuclear (Palo Verde) 5148 5148 5148 5148 5148 5148 5148 5148 Nuclear (SMR) - - - - - - - - Gas - Steam Turbine 119 21 3 3 2 - - - Gas - Combined Cycle 1835 1540 704 778 913 873 962 863 Gas - Combustion Turbine 962 989 447 494 545 394 614 583 Biomass - - - - - - - - Geothermal - - - - - - - - Wind - - 881 916 965 778 930 859 Solar 290 963 1760 1782 2130 3267 4138 6248 Battery Storage - 2 (37) (36) (98) (230) (275) (458) Imports 408 362 187 203 174 188 189 195 Demand Response - - - - - - - - Hydrogen - - - - - - - - BTM Solar 37 135 165 225 344 460 601 763 Load 8771 9155 9258 9512 10123 10878 12308 14203 Excess Generation 13 120 1146 1089 774 1061 1077 1549
Attachment D-3 E3 EPE Report Model Results AugustPage 8 of 34
Scenario Resource Type 2021 2024 2025 2027 2031 2035 2040 2045Annual Energy (GWh)
High Gas Price Nuclear (Palo Verde) 5148 5148 5148 5148 5148 5148 5148 5148 Nuclear (SMR) - - - - - - - - Gas - Steam Turbine 125 31 6 5 1 - - - Gas - Combined Cycle 1787 1400 1015 1115 1125 1015 1242 1350 Gas - Combustion Turbine 1008 1120 803 853 805 627 1127 1365 Biomass - - - - - - - - Geothermal - - - - - - - - Wind - - 444 448 451 387 467 924 Solar 290 956 1419 1435 1998 3161 3603 4486 Battery Storage - 9 (29) (28) (103) (224) (235) (274) Imports 403 360 287 309 355 303 354 440 Demand Response - - - - - - - - Hydrogen - - - - - - - - BTM Solar 37 135 165 225 344 460 601 763 Load 8771 9155 9258 9512 10123 10878 12308 14203 Excess Generation 13 127 411 390 455 783 483 702
Low Renewable and Storage Costs Nuclear (Palo Verde) 5148 5148 5148 5148 5148 5148 5148 5148 Nuclear (SMR) - - - - - - - - Gas - Steam Turbine 140 34 3 6 1 - - - Gas - Combined Cycle 1767 1373 984 1068 1096 1000 1220 1278 Gas - Combustion Turbine 1027 1169 842 925 824 652 1127 1243 Biomass - - - - - - - - Geothermal - - - - - - - - Wind - - 558 564 559 474 578 1026 Solar 289 952 1321 1330 1975 3102 3538 4621 Battery Storage - 12 (29) (29) (102) (221) (232) (288) Imports 391 336 265 275 279 262 328 411 Demand Response - - - - - - - - Hydrogen - - - - - - - - BTM Solar 37 135 165 225 344 460 601 763 Load 8771 9155 9258 9512 10123 10878 12308 14203 Excess Generation 14 130 324 309 486 807 490 896
Attachment D-3 E3 EPE Report Model Results AugustPage 9 of 34
Scenario Resource TypeLeast-Cost (Reference Case) Nuclear (Palo Verde)
Nuclear (SMR)Gas - Steam TurbineGas - Combined CycleGas - Combustion TurbineBiomassGeothermalWindSolarBattery StorageImportsDemand ResponseHydrogenBTM SolarLoadExcess Generation
Least-Cost Case + REA Resources Nuclear (Palo Verde)Nuclear (SMR)Gas - Steam TurbineGas - Combined CycleGas - Combustion TurbineBiomassGeothermalWindSolarBattery StorageImportsDemand ResponseHydrogenBTM SolarLoadExcess Generation
Separate System Planning Nuclear (Palo Verde)Nuclear (SMR)Gas - Steam TurbineGas - Combined CycleGas - Combustion TurbineBiomassGeothermalWindSolarBattery StorageImportsDemand ResponseHydrogenBTM SolarLoadExcess Generation
2021 2024 2025 2027 2031 2035 2040 2045622 622 622 622 622 622 622 622 - - - - - - - - 426 307 307 307 234 - - - 493 493 493 493 493 266 266 266 503 731 731 731 668 870 1059 1216 - - - - - - - - - - - - - - - - - - 102 102 102 102 102 197 115 385 621 621 823 1235 1309 1561 - 50 177 177 488 1029 1129 1277 - - - - - - - - 46 53 56 61 71 81 93 93
- - - - - - - - 18 65 80 108 166 221 289 368
- - - - - - - - - - - - - - - - 622 622 622 622 622 622 622 622 - - - - - - - - 426 307 307 307 234 - - - 493 493 493 493 493 266 266 266 503 731 731 731 668 809 942 1051 - - - - - - - - - - - - - - - - - - 203 203 203 203 232 300 115 385 544 544 795 1414 1693 2037 - 50 176 177 460 1067 1246 1682 - - - - - - - - 46 53 56 61 71 81 93 93
- - - - - - - - 18 65 80 108 166 221 289 368
- - - - - - - - - - - - - - - - 622 622 622 622 622 622 622 622 - - - - - - - - 426 307 307 307 234 - - - 493 493 493 493 493 266 266 266 503 731 731 731 668 755 755 864 - - - - - - - - - - - - - - - - - - 49 49 49 49 49 161 115 385 639 639 859 1701 2450 2712 - 50 280 304 591 1514 2344 2674 - - - - - - - - 46 53 56 61 71 81 93 93
- - - - - - - - 18 65 80 108 166 221 289 368
- - - - - - - - - - - - - - - -
Installed Capacity (MW)
Attachment D-3 E3 EPE Report Model Results AugustPage 10 of 34
Scenario Resource TypeSeparate System Planning (w H2) Nuclear (Palo Verde)
Nuclear (SMR)Gas - Steam TurbineGas - Combined CycleGas - Combustion TurbineBiomassGeothermalWindSolarBattery StorageImportsDemand ResponseHydrogenBTM SolarLoadExcess Generation
80 Clean by 2035 Nuclear (Palo Verde)Nuclear (SMR)Gas - Steam TurbineGas - Combined CycleGas - Combustion TurbineBiomassGeothermalWindSolarBattery StorageImportsDemand ResponseHydrogenBTM SolarLoadExcess Generation
20 CO2 Red by 2040 Nuclear (Palo Verde)Nuclear (SMR)Gas - Steam TurbineGas - Combined CycleGas - Combustion TurbineBiomassGeothermalWindSolarBattery StorageImportsDemand ResponseHydrogenBTM SolarLoadExcess Generation
2021 2024 2025 2027 2031 2035 2040 2045Installed Capacity (MW)
622 622 622 622 622 622 622 622 - - - - - - - - 426 307 307 307 234 - - - 493 493 493 493 493 266 266 266 503 731 731 731 668 755 755 864 - - - - - - - - - - - - - - - - - - 60 60 60 60 107 218 115 385 638 638 905 1312 1724 2031 - 50 278 303 570 1057 1496 1797 - - - - - - - - 46 53 56 61 71 81 93 93
- - - - - 123 206 212 18 65 80 108 166 221 289 368
- - - - - - - - - - - - - - - - 622 622 622 622 622 622 622 622 - - - - - - - - 426 307 307 307 234 - - - 493 493 493 493 493 266 266 266 503 731 731 731 668 910 1022 1149 - - - - - - - - - - - - - - - - - - 109 109 109 109 185 289 115 385 615 615 821 1233 1383 1799 - 50 177 177 486 968 1145 1327 - - - - - - - - 46 53 56 61 71 81 93 93
- - - - - - - - 18 65 80 108 166 221 289 368
- - - - - - - - - - - - - - - - 622 622 622 622 622 622 622 622 - - - - - - - - 426 307 307 307 234 - - - 493 493 493 493 493 266 266 266 503 731 731 731 668 910 1036 1138 - - - - - - - - - - - - - - - - - - 109 109 109 109 125 300 115 385 615 615 821 1233 1383 1837 - 50 177 177 486 968 1145 1359 - - - - - - - - 46 53 56 61 71 81 93 93
- - - - - - - - 18 65 80 108 166 221 289 368
- - - - - - - - - - - - - - - -
Attachment D-3 E3 EPE Report Model Results AugustPage 11 of 34
Scenario Resource Type40 CO2 Red by 2040 Nuclear (Palo Verde)
Nuclear (SMR)Gas - Steam TurbineGas - Combined CycleGas - Combustion TurbineBiomassGeothermalWindSolarBattery StorageImportsDemand ResponseHydrogenBTM SolarLoadExcess Generation
60 CO2 Red by 2040 Nuclear (Palo Verde)Nuclear (SMR)Gas - Steam TurbineGas - Combined CycleGas - Combustion TurbineBiomassGeothermalWindSolarBattery StorageImportsDemand ResponseHydrogenBTM SolarLoadExcess Generation
80 CO2 Red by 2040 Nuclear (Palo Verde)Nuclear (SMR)Gas - Steam TurbineGas - Combined CycleGas - Combustion TurbineBiomassGeothermalWindSolarBattery StorageImportsDemand ResponseHydrogenBTM SolarLoadExcess Generation
2021 2024 2025 2027 2031 2035 2040 2045Installed Capacity (MW)
622 622 622 622 622 622 622 622 - - - - - - - - 426 307 307 307 234 - - - 493 493 493 493 493 266 266 266 503 731 731 731 668 909 973 1022 - - - - - - - - - - - - - - - - - - 109 109 109 109 239 300 115 385 615 615 821 1234 1563 2248 - 50 177 177 486 969 1184 1746 - - - - - - - - 46 53 56 61 71 81 93 93
- - - - - - - - 18 65 80 108 166 221 289 368
- - - - - - - - - - - - - - - - 622 622 622 622 622 622 622 622 - - - - - - - - 426 307 307 307 234 - - - 493 493 493 493 493 266 266 266 503 731 731 731 668 849 892 897 - - - - - - - - - - - - - - - - - - 128 128 128 128 301 302 115 385 599 599 816 1309 1965 2744 - 50 177 177 481 1044 1347 2145 - - - - - - - - 46 53 56 61 71 81 93 93
- - - - - - - - 18 65 80 108 166 221 289 368
- - - - - - - - - - - - - - - - 622 622 622 622 622 622 622 622 - - - - - - - - 426 307 307 307 234 - - - 493 493 493 493 493 266 266 266 503 731 731 731 668 778 778 778 - - - - - - - - - - - - - - - - - - 217 217 217 217 552 585 115 385 538 538 793 1555 2257 3007 - 50 176 177 458 1097 1645 2461 - - - - - - - - 46 53 56 61 71 81 93 93
- - - - - - - - 18 65 80 108 166 221 289 368
- - - - - - - - - - - - - - - -
Attachment D-3 E3 EPE Report Model Results AugustPage 12 of 34
Scenario Resource Type90 CO2 Red by 2040 Nuclear (Palo Verde)
Nuclear (SMR)Gas - Steam TurbineGas - Combined CycleGas - Combustion TurbineBiomassGeothermalWindSolarBattery StorageImportsDemand ResponseHydrogenBTM SolarLoadExcess Generation
100 CO2 Red by 2040 (w H2) Nuclear (Palo Verde)Nuclear (SMR)Gas - Steam TurbineGas - Combined CycleGas - Combustion TurbineBiomassGeothermalWindSolarBattery StorageImportsDemand ResponseHydrogenBTM SolarLoadExcess Generation
100 CO2 Red by 2040 Nuclear (Palo Verde)Nuclear (SMR)Gas - Steam TurbineGas - Combined CycleGas - Combustion TurbineBiomassGeothermalWindSolarBattery StorageImportsDemand ResponseHydrogenBTM SolarLoadExcess Generation
2021 2024 2025 2027 2031 2035 2040 2045Installed Capacity (MW)
622 622 622 622 622 622 622 622 - - - - - - - - 426 307 307 307 234 - - - 493 493 493 493 493 266 266 266 503 731 731 731 668 726 726 726 - - - - - - - - - - - - - - - - - - 224 224 224 224 801 828 115 385 535 535 901 1679 2300 3049 - 50 176 177 452 1284 1777 2595 - - - - - - - - 46 53 56 61 71 81 93 93
- - - - - - - - 18 65 80 108 166 221 289 368
- - - - - - - - - - - - - - - - 622 622 622 622 622 622 622 622 - - - - - - - - 426 307 307 307 234 - - - 493 493 493 493 493 266 - - 503 731 731 731 668 688 - - - - - - - - - - - - - - - - - - - - 282 282 282 282 682 696 115 385 512 512 925 1801 2403 3178 - 50 176 177 445 1385 1955 2797 - - - - - - - - 46 53 56 61 71 81 93 93
- - - - - - 954 954 18 65 80 108 166 221 289 368
- - - - - - - - - - - - - - - - 622 622 622 622 622 622 622 622 - - - - - - - - 426 307 307 307 234 - - - 493 493 493 493 493 266 266 266 503 731 731 731 668 688 668 668 - - - - - - - - - - - - - - - - - - 120 120 282 282 1216 1605 115 385 606 606 925 1801 4851 5217 - 50 177 177 445 1385 6191 7470 - - - - - - - - 46 53 56 61 71 81 93 93
- - - - - - - - 18 65 80 108 166 221 289 701
- - - - - - - - - - - - - - - -
Attachment D-3 E3 EPE Report Model Results AugustPage 13 of 34
Scenario Resource TypeHigh DG Nuclear (Palo Verde)
Nuclear (SMR)Gas - Steam TurbineGas - Combined CycleGas - Combustion TurbineBiomassGeothermalWindSolarBattery StorageImportsDemand ResponseHydrogenBTM SolarLoadExcess Generation
High DSM Nuclear (Palo Verde)Nuclear (SMR)Gas - Steam TurbineGas - Combined CycleGas - Combustion TurbineBiomassGeothermalWindSolarBattery StorageImportsDemand ResponseHydrogenBTM SolarLoadExcess Generation
Low Load Nuclear (Palo Verde)Nuclear (SMR)Gas - Steam TurbineGas - Combined CycleGas - Combustion TurbineBiomassGeothermalWindSolarBattery StorageImportsDemand ResponseHydrogenBTM SolarLoadExcess Generation
2021 2024 2025 2027 2031 2035 2040 2045Installed Capacity (MW)
622 622 622 622 622 622 622 622 - - - - - - - - 426 307 307 307 234 - - - 493 493 493 493 493 266 266 266 503 731 731 731 668 860 1026 1228 - - - - - - - - - - - - - - - - - - 96 96 96 96 96 203 115 385 511 511 684 1010 1107 1018 - 50 176 176 479 1041 1166 1263 - - - - - - - - 46 53 56 61 71 81 93 93
- - - - - - - - 42 169 210 293 455 614 809 1032
- - - - - - - - - - - - - - - - 622 622 622 622 622 622 622 622 - - - - - - - - 426 307 307 307 234 - - - 493 493 493 493 493 266 266 266 503 731 731 731 668 778 942 1058 - - - - - - - - - - - - - - - - - - - - - - - 128 115 385 519 519 638 1149 1212 1386 - 50 184 184 406 1001 1091 1213 - - - - - - - - 49 66 71 82 100 101 103 103
- - - - - - - - 18 65 80 108 166 221 289 368
- - - - - - - - - - - - - - - - 622 622 622 622 622 622 622 622 - - - - - - - - 426 307 307 307 234 - - - 493 493 493 493 493 266 266 266 503 731 731 731 668 724 896 1019 - - - - - - - - - - - - - - - - - - - - - - - 141 115 385 521 521 628 1185 1261 1477 - 50 186 186 355 1019 1121 1262 - - - - - - - - 46 53 56 61 71 81 93 93
- - - - - - - - 18 65 80 108 166 221 289 368
- - - - - - - - - - - - - - - -
Attachment D-3 E3 EPE Report Model Results AugustPage 14 of 34
Scenario Resource TypeHigh Load Nuclear (Palo Verde)
Nuclear (SMR)Gas - Steam TurbineGas - Combined CycleGas - Combustion TurbineBiomassGeothermalWindSolarBattery StorageImportsDemand ResponseHydrogenBTM SolarLoadExcess Generation
No Lifetime Extensions Nuclear (Palo Verde)Nuclear (SMR)Gas - Steam TurbineGas - Combined CycleGas - Combustion TurbineBiomassGeothermalWindSolarBattery StorageImportsDemand ResponseHydrogenBTM SolarLoadExcess Generation
No New Gas Nuclear (Palo Verde)Nuclear (SMR)Gas - Steam TurbineGas - Combined CycleGas - Combustion TurbineBiomassGeothermalWindSolarBattery StorageImportsDemand ResponseHydrogenBTM SolarLoadExcess Generation
2021 2024 2025 2027 2031 2035 2040 2045Installed Capacity (MW)
622 622 622 622 622 622 622 622 - - - - - - - - 426 307 307 307 234 - - - 493 493 493 493 493 266 266 266 503 731 731 731 668 1043 1247 1411 - - - - - - - - - - - - - - - - - - 119 119 119 119 119 260 115 385 662 662 1040 1304 1377 1643 - 50 235 327 708 1042 1142 1292 - - - - - - - - 46 53 56 61 71 81 93 93
- - - - - - - - 18 65 80 108 166 221 289 368
- - - - - - - - - - - - - - - - 622 622 622 622 622 622 622 622 - - - - - - - - 426 234 234 144 144 - - - 493 493 493 266 266 266 266 266 503 731 731 829 766 869 1058 1216 - - - - - - - - - - - - - - - - - - 109 109 109 109 109 197 115 385 767 767 1027 1229 1302 1561 - 50 183 432 756 1027 1128 1277 - - - - - - - - 46 53 56 61 71 81 93 93
- - - - - - - - 18 65 80 108 166 221 289 368
- - - - - - - - - - - - - - - - 622 622 622 622 622 622 622 622 - - - - - - - - 426 307 307 307 234 - - - 493 493 493 493 493 266 266 266 503 731 731 731 668 668 668 668 - - - - - - - - - - - - - - - - - - 120 120 120 120 120 132 115 385 606 606 818 1876 2580 3422 - 50 177 177 483 1585 2342 3200 - - - - - - - - 46 53 56 61 71 81 93 93
- - - - - - - - 18 65 80 108 166 221 289 368
- - - - - - - - - - - - - - - -
Attachment D-3 E3 EPE Report Model Results AugustPage 15 of 34
Scenario Resource TypeLow Carbon Price Nuclear (Palo Verde)
Nuclear (SMR)Gas - Steam TurbineGas - Combined CycleGas - Combustion TurbineBiomassGeothermalWindSolarBattery StorageImportsDemand ResponseHydrogenBTM SolarLoadExcess Generation
Mid Carbon Price Nuclear (Palo Verde)Nuclear (SMR)Gas - Steam TurbineGas - Combined CycleGas - Combustion TurbineBiomassGeothermalWindSolarBattery StorageImportsDemand ResponseHydrogenBTM SolarLoadExcess Generation
High Carbon Price Nuclear (Palo Verde)Nuclear (SMR)Gas - Steam TurbineGas - Combined CycleGas - Combustion TurbineBiomassGeothermalWindSolarBattery StorageImportsDemand ResponseHydrogenBTM SolarLoadExcess Generation
2021 2024 2025 2027 2031 2035 2040 2045Installed Capacity (MW)
622 622 622 622 622 622 622 622 - - - - - - - - 426 307 307 307 234 - - - 493 493 493 493 493 266 266 266 503 731 731 731 668 840 1027 1164 - - - - - - - - - - - - - - - - - - 163 163 163 163 163 269 115 385 573 573 805 1309 1383 1738 - 50 176 176 470 1044 1145 1314 - - - - - - - - 46 53 56 61 71 81 93 93
- - - - - - - - 18 65 80 108 166 221 289 368
- - - - - - - - - - - - - - - - 622 622 622 622 622 622 622 622 - - - - - - - - 426 307 307 307 234 - - - 493 493 493 493 493 266 266 266 503 731 731 731 668 824 1006 1145 - - - - - - - - - - - - - - - - - - 238 238 238 238 238 300 115 385 633 633 791 1310 1400 1808 - 50 176 176 456 1045 1149 1334 - - - - - - - - 46 53 56 61 71 81 93 93
- - - - - - - - 18 65 80 108 166 221 289 368
- - - - - - - - - - - - - - - - 622 622 622 622 622 622 622 622 - - - - - - - - 426 307 307 307 234 - - - 493 493 493 493 493 266 266 266 503 731 731 731 668 817 944 944 - - - - - - - - - - - - - - - - - - 300 300 300 300 300 301 115 385 857 857 886 1310 1666 2536 - 50 176 176 445 1045 1206 2000 - - - - - - - - 46 53 56 61 71 81 93 93
- - - - - - - - 18 65 80 108 166 221 289 368
- - - - - - - - - - - - - - - -
Attachment D-3 E3 EPE Report Model Results AugustPage 16 of 34
Scenario Resource TypeHigh Gas Price Nuclear (Palo Verde)
Nuclear (SMR)Gas - Steam TurbineGas - Combined CycleGas - Combustion TurbineBiomassGeothermalWindSolarBattery StorageImportsDemand ResponseHydrogenBTM SolarLoadExcess Generation
Low Renewable and Storage Costs Nuclear (Palo Verde)Nuclear (SMR)Gas - Steam TurbineGas - Combined CycleGas - Combustion TurbineBiomassGeothermalWindSolarBattery StorageImportsDemand ResponseHydrogenBTM SolarLoadExcess Generation
2021 2024 2025 2027 2031 2035 2040 2045Installed Capacity (MW)
622 622 622 622 622 622 622 622 - - - - - - - - 426 307 307 307 234 - - - 493 493 493 493 493 266 266 266 503 731 731 731 668 848 1036 1170 - - - - - - - - - - - - - - - - - - 128 128 128 128 128 264 115 385 599 599 816 1309 1383 1710 - 50 177 177 481 1044 1145 1309 - - - - - - - - 46 53 56 61 71 81 93 93
- - - - - - - - 18 65 80 108 166 221 289 368
- - - - - - - - - - - - - - - - 622 622 622 622 622 622 622 622 - - - - - - - - 426 307 307 307 234 - - - 493 493 493 493 493 266 266 266 503 731 731 731 668 847 1034 1146 - - - - - - - - - - - - - - - - - - 160 160 160 160 160 300 115 385 525 525 806 1277 1351 1805 - 50 190 190 471 1037 1138 1335 - - - - - - - - 46 53 56 61 71 81 93 93
- - - - - - - - 18 65 80 108 166 221 289 368
- - - - - - - - - - - - - - - -
Attachment D-3 E3 EPE Report Model Results AugustPage 17 of 34
Scenario Resource TypeLeast-Cost (Reference Case) Nuclear (Palo Verde)
Nuclear (SMR)Gas - Steam TurbineGas - Combined CycleGas - Combustion TurbineBiomassGeothermalWindSolarBattery StorageImportsDemand ResponseHydrogenBTM SolarLoadExcess Generation
Least-Cost Case + REA Resources Nuclear (Palo Verde)Nuclear (SMR)Gas - Steam TurbineGas - Combined CycleGas - Combustion TurbineBiomassGeothermalWindSolarBattery StorageImportsDemand ResponseHydrogenBTM SolarLoadExcess Generation
Separate System Planning Nuclear (Palo Verde)Nuclear (SMR)Gas - Steam TurbineGas - Combined CycleGas - Combustion TurbineBiomassGeothermalWindSolarBattery StorageImportsDemand ResponseHydrogenBTM SolarLoadExcess Generation
2021 2024 2025 2027 2031 2035 2040 2045- - - - - - - - - - - - - - - - - - - - - - - - - - - - - - - - - 228 228 228 228 430 619 776 - - - - - - - - - - - - - - - - - - 102 102 102 102 102 197 - 270 506 506 708 1190 1291 1823 - 50 177 177 488 1029 1129 1327 - - - - - - - - 46 53 56 61 71 81 93 93
- - - - - - - - 18 65 80 108 166 221 289 368
- - - - - - - - - - - - - - - - - - - - - - - - - - - - - - - - - - - - - - - - - - - - - - - - - 228 228 228 228 369 502 611 - - - - - - - - - - - - - - - - - - 203 203 203 203 232 300 - 270 429 429 680 1369 1675 2299 - 50 176 177 460 1067 1246 1732 - - - - - - - - 46 53 56 61 71 81 93 93
- - - - - - - - 18 65 80 108 166 221 289 368
- - - - - - - - - - - - - - - - - - - - - - - - - - - - - - - - - - - - - - - - - - - - - - - - - 228 228 228 228 315 315 424 - - - - - - - - - - - - - - - - - - 49 49 49 49 49 161 - 270 524 524 744 1656 2432 2974 - 50 280 304 591 1514 2344 2724 - - - - - - - - 46 53 56 61 71 81 93 93
- - - - - - - - 18 65 80 108 166 221 289 368
- - - - - - - - - - - - - - - -
Cumulative Capacity Additions (MW)
Attachment D-3 E3 EPE Report Model Results AugustPage 18 of 34
Scenario Resource TypeSeparate System Planning (w H2) Nuclear (Palo Verde)
Nuclear (SMR)Gas - Steam TurbineGas - Combined CycleGas - Combustion TurbineBiomassGeothermalWindSolarBattery StorageImportsDemand ResponseHydrogenBTM SolarLoadExcess Generation
80 Clean by 2035 Nuclear (Palo Verde)Nuclear (SMR)Gas - Steam TurbineGas - Combined CycleGas - Combustion TurbineBiomassGeothermalWindSolarBattery StorageImportsDemand ResponseHydrogenBTM SolarLoadExcess Generation
20 CO2 Red by 2040 Nuclear (Palo Verde)Nuclear (SMR)Gas - Steam TurbineGas - Combined CycleGas - Combustion TurbineBiomassGeothermalWindSolarBattery StorageImportsDemand ResponseHydrogenBTM SolarLoadExcess Generation
2021 2024 2025 2027 2031 2035 2040 2045Cumulative Capacity Additions (MW)
- - - - - - - - - - - - - - - - - - - - - - - - - - - - - - - - - 228 228 228 228 315 315 424 - - - - - - - - - - - - - - - - - - 60 60 60 60 107 218 - 270 523 523 790 1267 1706 2293 - 50 278 303 570 1057 1496 1847 - - - - - - - - 46 53 56 61 71 81 93 93
- - - - - 123 206 212 18 65 80 108 166 221 289 368
- - - - - - - - - - - - - - - - - - - - - - - - - - - - - - - - - - - - - - - - - - - - - - - - - 228 228 228 228 470 582 709 - - - - - - - - - - - - - - - - - - 109 109 109 109 185 289 - 270 500 500 706 1188 1365 2061 - 50 177 177 486 968 1145 1377 - - - - - - - - 46 53 56 61 71 81 93 93
- - - - - - - - 18 65 80 108 166 221 289 368
- - - - - - - - - - - - - - - - - - - - - - - - - - - - - - - - - - - - - - - - - - - - - - - - - 228 228 228 228 470 596 698 - - - - - - - - - - - - - - - - - - 109 109 109 109 125 300 - 270 500 500 706 1188 1365 2099 - 50 177 177 486 968 1145 1409 - - - - - - - - 46 53 56 61 71 81 93 93
- - - - - - - - 18 65 80 108 166 221 289 368
- - - - - - - - - - - - - - - -
Attachment D-3 E3 EPE Report Model Results AugustPage 19 of 34
Scenario Resource Type40 CO2 Red by 2040 Nuclear (Palo Verde)
Nuclear (SMR)Gas - Steam TurbineGas - Combined CycleGas - Combustion TurbineBiomassGeothermalWindSolarBattery StorageImportsDemand ResponseHydrogenBTM SolarLoadExcess Generation
60 CO2 Red by 2040 Nuclear (Palo Verde)Nuclear (SMR)Gas - Steam TurbineGas - Combined CycleGas - Combustion TurbineBiomassGeothermalWindSolarBattery StorageImportsDemand ResponseHydrogenBTM SolarLoadExcess Generation
80 CO2 Red by 2040 Nuclear (Palo Verde)Nuclear (SMR)Gas - Steam TurbineGas - Combined CycleGas - Combustion TurbineBiomassGeothermalWindSolarBattery StorageImportsDemand ResponseHydrogenBTM SolarLoadExcess Generation
2021 2024 2025 2027 2031 2035 2040 2045Cumulative Capacity Additions (MW)
- - - - - - - - - - - - - - - - - - - - - - - - - - - - - - - - - 228 228 228 228 469 533 582 - - - - - - - - - - - - - - - - - - 109 109 109 109 239 300 - 270 500 500 706 1189 1545 2510 - 50 177 177 486 969 1184 1796 - - - - - - - - 46 53 56 61 71 81 93 93
- - - - - - - - 18 65 80 108 166 221 289 368
- - - - - - - - - - - - - - - - - - - - - - - - - - - - - - - - - - - - - - - - - - - - - - - - - 228 228 228 228 409 452 457 - - - - - - - - - - - - - - - - - - 128 128 128 128 301 302 - 270 484 484 701 1264 1947 3006 - 50 177 177 481 1044 1347 2195 - - - - - - - - 46 53 56 61 71 81 93 93
- - - - - - - - 18 65 80 108 166 221 289 368
- - - - - - - - - - - - - - - - - - - - - - - - - - - - - - - - - - - - - - - - - - - - - - - - - 228 228 228 228 338 338 338 - - - - - - - - - - - - - - - - - - 217 217 217 217 552 585 - 270 423 423 678 1510 2239 3269 - 50 176 177 458 1097 1645 2511 - - - - - - - - 46 53 56 61 71 81 93 93
- - - - - - - - 18 65 80 108 166 221 289 368
- - - - - - - - - - - - - - - -
Attachment D-3 E3 EPE Report Model Results AugustPage 20 of 34
Scenario Resource Type90 CO2 Red by 2040 Nuclear (Palo Verde)
Nuclear (SMR)Gas - Steam TurbineGas - Combined CycleGas - Combustion TurbineBiomassGeothermalWindSolarBattery StorageImportsDemand ResponseHydrogenBTM SolarLoadExcess Generation
100 CO2 Red by 2040 (w H2) Nuclear (Palo Verde)Nuclear (SMR)Gas - Steam TurbineGas - Combined CycleGas - Combustion TurbineBiomassGeothermalWindSolarBattery StorageImportsDemand ResponseHydrogenBTM SolarLoadExcess Generation
100 CO2 Red by 2040 Nuclear (Palo Verde)Nuclear (SMR)Gas - Steam TurbineGas - Combined CycleGas - Combustion TurbineBiomassGeothermalWindSolarBattery StorageImportsDemand ResponseHydrogenBTM SolarLoadExcess Generation
2021 2024 2025 2027 2031 2035 2040 2045Cumulative Capacity Additions (MW)
- - - - - - - - - - - - - - - - - - - - - - - - - - - - - - - - - 228 228 228 228 286 286 286 - - - - - - - - - - - - - - - - - - 224 224 224 224 801 828 - 270 420 420 786 1634 2282 3311 - 50 176 177 452 1284 1777 2645 - - - - - - - - 46 53 56 61 71 81 93 93
- - - - - - - - 18 65 80 108 166 221 289 368
- - - - - - - - - - - - - - - - - - - - - - - - - - - - - - - - - - - - - - - - - - - - - - - - - 228 228 228 228 248 - - - - - - - - - - - - - - - - - - - - 282 282 282 282 682 696 - 270 397 397 810 1756 2385 3440 - 50 176 177 445 1385 1955 2847 - - - - - - - - 46 53 56 61 71 81 93 93
- - - - - - 248 248 18 65 80 108 166 221 289 368
- - - - - - - - - - - - - - - - - - - - - - - - - - - - - - - - - - - - - - - - - - - - - - - - - 228 228 228 228 248 228 228 - - - - - - - - - - - - - - - - - - 120 120 282 282 1216 1605 - 270 491 491 810 1756 4833 5479 - 50 177 177 445 1385 6191 7520 - - - - - - - - 46 53 56 61 71 81 93 93
- - - - - - - - 18 65 80 108 166 221 289 701
- - - - - - - - - - - - - - - -
Attachment D-3 E3 EPE Report Model Results AugustPage 21 of 34
Scenario Resource TypeHigh DG Nuclear (Palo Verde)
Nuclear (SMR)Gas - Steam TurbineGas - Combined CycleGas - Combustion TurbineBiomassGeothermalWindSolarBattery StorageImportsDemand ResponseHydrogenBTM SolarLoadExcess Generation
High DSM Nuclear (Palo Verde)Nuclear (SMR)Gas - Steam TurbineGas - Combined CycleGas - Combustion TurbineBiomassGeothermalWindSolarBattery StorageImportsDemand ResponseHydrogenBTM SolarLoadExcess Generation
Low Load Nuclear (Palo Verde)Nuclear (SMR)Gas - Steam TurbineGas - Combined CycleGas - Combustion TurbineBiomassGeothermalWindSolarBattery StorageImportsDemand ResponseHydrogenBTM SolarLoadExcess Generation
2021 2024 2025 2027 2031 2035 2040 2045Cumulative Capacity Additions (MW)
- - - - - - - - - - - - - - - - - - - - - - - - - - - - - - - - - 228 228 228 228 420 586 788 - - - - - - - - - - - - - - - - - - 96 96 96 96 96 203 - 270 396 396 569 965 1089 1280 - 50 176 176 479 1041 1166 1313 - - - - - - - - 46 53 56 61 71 81 93 93
- - - - - - - - 42 169 210 293 455 614 809 1032
- - - - - - - - - - - - - - - - - - - - - - - - - - - - - - - - - - - - - - - - - - - - - - - - - 228 228 228 228 338 502 618 - - - - - - - - - - - - - - - - - - - - - - - 128 - 270 404 404 523 1104 1194 1648 - 50 184 184 406 1001 1091 1263 - - - - - - - - 49 66 71 82 100 101 103 103
- - - - - - - - 18 65 80 108 166 221 289 368
- - - - - - - - - - - - - - - - - - - - - - - - - - - - - - - - - - - - - - - - - - - - - - - - - 228 228 228 228 284 456 579 - - - - - - - - - - - - - - - - - - - - - - - 141 - 270 406 406 513 1140 1243 1739 - 50 186 186 355 1019 1121 1312 - - - - - - - - 46 53 56 61 71 81 93 93
- - - - - - - - 18 65 80 108 166 221 289 368
- - - - - - - - - - - - - - - -
Attachment D-3 E3 EPE Report Model Results AugustPage 22 of 34
Scenario Resource TypeHigh Load Nuclear (Palo Verde)
Nuclear (SMR)Gas - Steam TurbineGas - Combined CycleGas - Combustion TurbineBiomassGeothermalWindSolarBattery StorageImportsDemand ResponseHydrogenBTM SolarLoadExcess Generation
No Lifetime Extensions Nuclear (Palo Verde)Nuclear (SMR)Gas - Steam TurbineGas - Combined CycleGas - Combustion TurbineBiomassGeothermalWindSolarBattery StorageImportsDemand ResponseHydrogenBTM SolarLoadExcess Generation
No New Gas Nuclear (Palo Verde)Nuclear (SMR)Gas - Steam TurbineGas - Combined CycleGas - Combustion TurbineBiomassGeothermalWindSolarBattery StorageImportsDemand ResponseHydrogenBTM SolarLoadExcess Generation
2021 2024 2025 2027 2031 2035 2040 2045Cumulative Capacity Additions (MW)
- - - - - - - - - - - - - - - - - - - - - - - - - - - - - - - - - 228 228 228 228 603 807 971 - - - - - - - - - - - - - - - - - - 119 119 119 119 119 260 - 270 547 547 925 1259 1359 1905 - 50 235 327 708 1042 1142 1342 - - - - - - - - 46 53 56 61 71 81 93 93
- - - - - - - - 18 65 80 108 166 221 289 368
- - - - - - - - - - - - - - - - - - - - - - - - - - - - - - - - - - - - - - - - - - - - - - - - - 228 228 326 326 429 618 776 - - - - - - - - - - - - - - - - - - 109 109 109 109 109 197 - 270 652 652 912 1184 1284 1823 - 50 183 432 756 1027 1128 1327 - - - - - - - - 46 53 56 61 71 81 93 93
- - - - - - - - 18 65 80 108 166 221 289 368
- - - - - - - - - - - - - - - - - - - - - - - - - - - - - - - - - - - - - - - - - - - - - - - - - 228 228 228 228 228 228 228 - - - - - - - - - - - - - - - - - - 120 120 120 120 120 132 - 270 491 491 703 1831 2562 3684 - 50 177 177 483 1585 2342 3250 - - - - - - - - 46 53 56 61 71 81 93 93
- - - - - - - - 18 65 80 108 166 221 289 368
- - - - - - - - - - - - - - - -
Attachment D-3 E3 EPE Report Model Results AugustPage 23 of 34
Scenario Resource TypeLow Carbon Price Nuclear (Palo Verde)
Nuclear (SMR)Gas - Steam TurbineGas - Combined CycleGas - Combustion TurbineBiomassGeothermalWindSolarBattery StorageImportsDemand ResponseHydrogenBTM SolarLoadExcess Generation
Mid Carbon Price Nuclear (Palo Verde)Nuclear (SMR)Gas - Steam TurbineGas - Combined CycleGas - Combustion TurbineBiomassGeothermalWindSolarBattery StorageImportsDemand ResponseHydrogenBTM SolarLoadExcess Generation
High Carbon Price Nuclear (Palo Verde)Nuclear (SMR)Gas - Steam TurbineGas - Combined CycleGas - Combustion TurbineBiomassGeothermalWindSolarBattery StorageImportsDemand ResponseHydrogenBTM SolarLoadExcess Generation
2021 2024 2025 2027 2031 2035 2040 2045Cumulative Capacity Additions (MW)
- - - - - - - - - - - - - - - - - - - - - - - - - - - - - - - - - 228 228 228 228 400 587 724 - - - - - - - - - - - - - - - - - - 163 163 163 163 163 269 - 270 458 458 690 1264 1365 2000 - 50 176 176 470 1044 1145 1364 - - - - - - - - 46 53 56 61 71 81 93 93
- - - - - - - - 18 65 80 108 166 221 289 368
- - - - - - - - - - - - - - - - - - - - - - - - - - - - - - - - - - - - - - - - - - - - - - - - - 228 228 228 228 384 566 705 - - - - - - - - - - - - - - - - - - 238 238 238 238 238 300 - 270 518 518 676 1265 1382 2070 - 50 176 176 456 1045 1149 1384 - - - - - - - - 46 53 56 61 71 81 93 93
- - - - - - - - 18 65 80 108 166 221 289 368
- - - - - - - - - - - - - - - - - - - - - - - - - - - - - - - - - - - - - - - - - - - - - - - - - 228 228 228 228 377 504 504 - - - - - - - - - - - - - - - - - - 300 300 300 300 300 301 - 270 742 742 771 1265 1648 2798 - 50 176 176 445 1045 1206 2050 - - - - - - - - 46 53 56 61 71 81 93 93
- - - - - - - - 18 65 80 108 166 221 289 368
- - - - - - - - - - - - - - - -
Attachment D-3 E3 EPE Report Model Results AugustPage 24 of 34
Scenario Resource TypeHigh Gas Price Nuclear (Palo Verde)
Nuclear (SMR)Gas - Steam TurbineGas - Combined CycleGas - Combustion TurbineBiomassGeothermalWindSolarBattery StorageImportsDemand ResponseHydrogenBTM SolarLoadExcess Generation
Low Renewable and Storage Costs Nuclear (Palo Verde)Nuclear (SMR)Gas - Steam TurbineGas - Combined CycleGas - Combustion TurbineBiomassGeothermalWindSolarBattery StorageImportsDemand ResponseHydrogenBTM SolarLoadExcess Generation
2021 2024 2025 2027 2031 2035 2040 2045Cumulative Capacity Additions (MW)
- - - - - - - - - - - - - - - - - - - - - - - - - - - - - - - - - 228 228 228 228 408 596 730 - - - - - - - - - - - - - - - - - - 128 128 128 128 128 264 - 270 484 484 701 1264 1365 1972 - 50 177 177 481 1044 1145 1359 - - - - - - - - 46 53 56 61 71 81 93 93
- - - - - - - - 18 65 80 108 166 221 289 368
- - - - - - - - - - - - - - - - - - - - - - - - - - - - - - - - - - - - - - - - - - - - - - - - - 228 228 228 228 407 594 706 - - - - - - - - - - - - - - - - - - 160 160 160 160 160 300 - 270 410 410 691 1232 1333 2067 - 50 190 190 471 1037 1138 1385 - - - - - - - - 46 53 56 61 71 81 93 93
- - - - - - - - 18 65 80 108 166 221 289 368
- - - - - - - - - - - - - - - -
Attachment D-3 E3 EPE Report Model Results AugustPage 25 of 34
Scenario Resource TypeLeast-Cost (Reference Case) Nuclear (Palo Verde)
Nuclear (SMR)Gas - Steam TurbineGas - Combined CycleGas - Combustion TurbineBiomassGeothermalWindSolarBattery StorageImportsDemand ResponseHydrogenBTM SolarLoadExcess Generation
Least-Cost Case + REA Resources Nuclear (Palo Verde)Nuclear (SMR)Gas - Steam TurbineGas - Combined CycleGas - Combustion TurbineBiomassGeothermalWindSolarBattery StorageImportsDemand ResponseHydrogenBTM SolarLoadExcess Generation
Separate System Planning Nuclear (Palo Verde)Nuclear (SMR)Gas - Steam TurbineGas - Combined CycleGas - Combustion TurbineBiomassGeothermalWindSolarBattery StorageImportsDemand ResponseHydrogenBTM SolarLoadExcess Generation
2021 2024 2025 2027 2031 2035 2040 2045- - - - - - - - - - - - - - - - - (119) (119) (119) (192) (426) (426) (426) - - - - - (227) (227) (227) - - - - (63) (63) (63) (63) - - - - - - - - - - - - - - - - - - - - - - - - - - - - - (70) (97) (377) - - - - - - - (50) - - - - - - - - - - - - - - - - - - - - - - - - - - - - - - - - - - - - - - - - - - - - - - - - - - - - - - - - - - - - - - - - - (119) (119) (119) (192) (426) (426) (426) - - - - - (227) (227) (227) - - - - (63) (63) (63) (63) - - - - - - - - - - - - - - - - - - - - - - - - - - - - - (70) (97) (377) - - - - - - - (50) - - - - - - - - - - - - - - - - - - - - - - - - - - - - - - - - - - - - - - - - - - - - - - - - - - - - - - - - - - - - - - - - - (119) (119) (119) (192) (426) (426) (426) - - - - - (227) (227) (227) - - - - (63) (63) (63) (63) - - - - - - - - - - - - - - - - - - - - - - - - - - - - - (70) (97) (377) - - - - - - - (50) - - - - - - - - - - - - - - - - - - - - - - - - - - - - - - - - - - - - - - - - - - - - - - - -
Cumulative Capacity Retirements (MW)
Attachment D-3 E3 EPE Report Model Results AugustPage 26 of 34
Scenario Resource TypeSeparate System Planning (w H2) Nuclear (Palo Verde)
Nuclear (SMR)Gas - Steam TurbineGas - Combined CycleGas - Combustion TurbineBiomassGeothermalWindSolarBattery StorageImportsDemand ResponseHydrogenBTM SolarLoadExcess Generation
80 Clean by 2035 Nuclear (Palo Verde)Nuclear (SMR)Gas - Steam TurbineGas - Combined CycleGas - Combustion TurbineBiomassGeothermalWindSolarBattery StorageImportsDemand ResponseHydrogenBTM SolarLoadExcess Generation
20 CO2 Red by 2040 Nuclear (Palo Verde)Nuclear (SMR)Gas - Steam TurbineGas - Combined CycleGas - Combustion TurbineBiomassGeothermalWindSolarBattery StorageImportsDemand ResponseHydrogenBTM SolarLoadExcess Generation
2021 2024 2025 2027 2031 2035 2040 2045Cumulative Capacity Retirements (MW)
- - - - - - - - - - - - - - - - - (119) (119) (119) (192) (426) (426) (426) - - - - - (227) (227) (227) - - - - (63) (63) (63) (63) - - - - - - - - - - - - - - - - - - - - - - - - - - - - - (70) (97) (377) - - - - - - - (50) - - - - - - - - - - - - - - - - - - - - - - - - - - - - - - - - - - - - - - - - - - - - - - - - - - - - - - - - - - - - - - - - - (119) (119) (119) (192) (426) (426) (426) - - - - - (227) (227) (227) - - - - (63) (63) (63) (63) - - - - - - - - - - - - - - - - - - - - - - - - - - - - - (70) (97) (377) - - - - - - - (50) - - - - - - - - - - - - - - - - - - - - - - - - - - - - - - - - - - - - - - - - - - - - - - - - - - - - - - - - - - - - - - - - - (119) (119) (119) (192) (426) (426) (426) - - - - - (227) (227) (227) - - - - (63) (63) (63) (63) - - - - - - - - - - - - - - - - - - - - - - - - - - - - - (70) (97) (377) - - - - - - - (50) - - - - - - - - - - - - - - - - - - - - - - - - - - - - - - - - - - - - - - - - - - - - - - - -
Attachment D-3 E3 EPE Report Model Results AugustPage 27 of 34
Scenario Resource Type40 CO2 Red by 2040 Nuclear (Palo Verde)
Nuclear (SMR)Gas - Steam TurbineGas - Combined CycleGas - Combustion TurbineBiomassGeothermalWindSolarBattery StorageImportsDemand ResponseHydrogenBTM SolarLoadExcess Generation
60 CO2 Red by 2040 Nuclear (Palo Verde)Nuclear (SMR)Gas - Steam TurbineGas - Combined CycleGas - Combustion TurbineBiomassGeothermalWindSolarBattery StorageImportsDemand ResponseHydrogenBTM SolarLoadExcess Generation
80 CO2 Red by 2040 Nuclear (Palo Verde)Nuclear (SMR)Gas - Steam TurbineGas - Combined CycleGas - Combustion TurbineBiomassGeothermalWindSolarBattery StorageImportsDemand ResponseHydrogenBTM SolarLoadExcess Generation
2021 2024 2025 2027 2031 2035 2040 2045Cumulative Capacity Retirements (MW)
- - - - - - - - - - - - - - - - - (119) (119) (119) (192) (426) (426) (426) - - - - - (227) (227) (227) - - - - (63) (63) (63) (63) - - - - - - - -- - - - - - - -- - - - - - - -- - - - - (70) (97) (377) - - - - - - - (50) - - - - - - - -- - - - - - - -- - - - - - - -- - - - - - - -- - - - - - - -- - - - - - - -- - - - - - - -- - - - - - - -- (119) (119) (119) (192) (426) (426) (426) - - - - - (227) (227) (227) - - - - (63) (63) (63) (63) - - - - - - - -- - - - - - - -- - - - - - - -- - - - - (70) (97) (377) - - - - - - - (50) - - - - - - - -- - - - - - - -- - - - - - - -- - - - - - - -- - - - - - - -- - - - - - - -- - - - - - - -- - - - - - - -- (119) (119) (119) (192) (426) (426) (426) - - - - - (227) (227) (227) - - - - (63) (63) (63) (63) - - - - - - - -- - - - - - - -- - - - - - - -- - - - - (70) (97) (377) - - - - - - - (50) - - - - - - - -- - - - - - - -- - - - - - - -- - - - - - - -- - - - - - - -- - - - - - - -
Attachment D-3 E3 EPE Report Model Results AugustPage 28 of 34
Scenario Resource Type90 CO2 Red by 2040 Nuclear (Palo Verde)
Nuclear (SMR)Gas - Steam TurbineGas - Combined CycleGas - Combustion TurbineBiomassGeothermalWindSolarBattery StorageImportsDemand ResponseHydrogenBTM SolarLoadExcess Generation
100 CO2 Red by 2040 (w H2) Nuclear (Palo Verde)Nuclear (SMR)Gas - Steam TurbineGas - Combined CycleGas - Combustion TurbineBiomassGeothermalWindSolarBattery StorageImportsDemand ResponseHydrogenBTM SolarLoadExcess Generation
100 CO2 Red by 2040 Nuclear (Palo Verde)Nuclear (SMR)Gas - Steam TurbineGas - Combined CycleGas - Combustion TurbineBiomassGeothermalWindSolarBattery StorageImportsDemand ResponseHydrogenBTM SolarLoadExcess Generation
2021 2024 2025 2027 2031 2035 2040 2045Cumulative Capacity Retirements (MW)
- - - - - - - - - - - - - - - - - (119) (119) (119) (192) (426) (426) (426) - - - - - (227) (227) (227) - - - - (63) (63) (63) (63) - - - - - - - - - - - - - - - - - - - - - - - - - - - - - (70) (97) (377) - - - - - - - (50) - - - - - - - - - - - - - - - - - - - - - - - - - - - - - - - - - - - - - - - - - - - - - - - - - - - - - - - - - - - - - - - - - (119) (119) (119) (192) (426) (426) (426) - - - - - (227) (227) (227) - - - - (63) (63) (63) (63) - - - - - - - - - - - - - - - - - - - - - - - - - - - - - (70) (97) (377) - - - - - - - (50) - - - - - - - - - - - - - - - - - - - - - - - - - - - - - - - - - - - - - - - - - - - - - - - - - - - - - - - - - - - - - - - - - (119) (119) (119) (192) (426) (426) (426) - - - - - (227) (227) (227) - - - - (63) (63) (63) (63) - - - - - - - - - - - - - - - - - - - - - - - - - - - - - (70) (97) (377) - - - - - - - (50) - - - - - - - - - - - - - - - - - - - - - - - - - - - - - - - - - - - - - - - - - - - - - - - -
Attachment D-3 E3 EPE Report Model Results AugustPage 29 of 34
Scenario Resource TypeHigh DG Nuclear (Palo Verde)
Nuclear (SMR)Gas - Steam TurbineGas - Combined CycleGas - Combustion TurbineBiomassGeothermalWindSolarBattery StorageImportsDemand ResponseHydrogenBTM SolarLoadExcess Generation
High DSM Nuclear (Palo Verde)Nuclear (SMR)Gas - Steam TurbineGas - Combined CycleGas - Combustion TurbineBiomassGeothermalWindSolarBattery StorageImportsDemand ResponseHydrogenBTM SolarLoadExcess Generation
Low Load Nuclear (Palo Verde)Nuclear (SMR)Gas - Steam TurbineGas - Combined CycleGas - Combustion TurbineBiomassGeothermalWindSolarBattery StorageImportsDemand ResponseHydrogenBTM SolarLoadExcess Generation
2021 2024 2025 2027 2031 2035 2040 2045Cumulative Capacity Retirements (MW)
- - - - - - - - - - - - - - - - - (119) (119) (119) (192) (426) (426) (426) - - - - - (227) (227) (227) - - - - (63) (63) (63) (63) - - - - - - - - - - - - - - - - - - - - - - - - - - - - - (70) (97) (377) - - - - - - - (50) - - - - - - - - - - - - - - - - - - - - - - - - - - - - - - - - - - - - - - - - - - - - - - - - - - - - - - - - - - - - - - - - - (119) (119) (119) (192) (426) (426) (426) - - - - - (227) (227) (227) - - - - (63) (63) (63) (63) - - - - - - - - - - - - - - - - - - - - - - - - - - - - - (70) (97) (377) - - - - - - - (50) - - - - - - - - - - - - - - - - - - - - - - - - - - - - - - - - - - - - - - - - - - - - - - - - - - - - - - - - - - - - - - - - - (119) (119) (119) (192) (426) (426) (426) - - - - - (227) (227) (227) - - - - (63) (63) (63) (63) - - - - - - - - - - - - - - - - - - - - - - - - - - - - - (70) (97) (377) - - - - - - - (50) - - - - - - - - - - - - - - - - - - - - - - - - - - - - - - - - - - - - - - - - - - - - - - - -
Attachment D-3 E3 EPE Report Model Results AugustPage 30 of 34
Scenario Resource TypeHigh Load Nuclear (Palo Verde)
Nuclear (SMR)Gas - Steam TurbineGas - Combined CycleGas - Combustion TurbineBiomassGeothermalWindSolarBattery StorageImportsDemand ResponseHydrogenBTM SolarLoadExcess Generation
No Lifetime Extensions Nuclear (Palo Verde)Nuclear (SMR)Gas - Steam TurbineGas - Combined CycleGas - Combustion TurbineBiomassGeothermalWindSolarBattery StorageImportsDemand ResponseHydrogenBTM SolarLoadExcess Generation
No New Gas Nuclear (Palo Verde)Nuclear (SMR)Gas - Steam TurbineGas - Combined CycleGas - Combustion TurbineBiomassGeothermalWindSolarBattery StorageImportsDemand ResponseHydrogenBTM SolarLoadExcess Generation
2021 2024 2025 2027 2031 2035 2040 2045Cumulative Capacity Retirements (MW)
- - - - - - - - - - - - - - - - - (119) (119) (119) (192) (426) (426) (426) - - - - - (227) (227) (227) - - - - (63) (63) (63) (63) - - - - - - - - - - - - - - - - - - - - - - - - - - - - - (70) (97) (377) - - - - - - - (50) - - - - - - - - - - - - - - - - - - - - - - - - - - - - - - - - - - - - - - - - - - - - - - - - - - - - - - - - - - - - - - - - - (192) (192) (282) (282) (426) (426) (426) - - - (227) (227) (227) (227) (227) - - - - (63) (63) (63) (63) - - - - - - - - - - - - - - - - - - - - - - - - - - - - - (70) (97) (377) - - - - - - - (50) - - - - - - - - - - - - - - - - - - - - - - - - - - - - - - - - - - - - - - - - - - - - - - - - - - - - - - - - - - - - - - - - - (119) (119) (119) (192) (426) (426) (426) - - - - - (227) (227) (227) - - - - (63) (63) (63) (63) - - - - - - - - - - - - - - - - - - - - - - - - - - - - - (70) (97) (377) - - - - - - - (50) - - - - - - - - - - - - - - - - - - - - - - - - - - - - - - - - - - - - - - - - - - - - - - - -
Attachment D-3 E3 EPE Report Model Results AugustPage 31 of 34
Scenario Resource TypeLow Carbon Price Nuclear (Palo Verde)
Nuclear (SMR)Gas - Steam TurbineGas - Combined CycleGas - Combustion TurbineBiomassGeothermalWindSolarBattery StorageImportsDemand ResponseHydrogenBTM SolarLoadExcess Generation
Mid Carbon Price Nuclear (Palo Verde)Nuclear (SMR)Gas - Steam TurbineGas - Combined CycleGas - Combustion TurbineBiomassGeothermalWindSolarBattery StorageImportsDemand ResponseHydrogenBTM SolarLoadExcess Generation
High Carbon Price Nuclear (Palo Verde)Nuclear (SMR)Gas - Steam TurbineGas - Combined CycleGas - Combustion TurbineBiomassGeothermalWindSolarBattery StorageImportsDemand ResponseHydrogenBTM SolarLoadExcess Generation
2021 2024 2025 2027 2031 2035 2040 2045Cumulative Capacity Retirements (MW)
- - - - - - - - - - - - - - - - - (119) (119) (119) (192) (426) (426) (426) - - - - - (227) (227) (227) - - - - (63) (63) (63) (63) - - - - - - - - - - - - - - - - - - - - - - - - - - - - - (70) (97) (377) - - - - - - - (50) - - - - - - - - - - - - - - - - - - - - - - - - - - - - - - - - - - - - - - - - - - - - - - - - - - - - - - - - - - - - - - - - - (119) (119) (119) (192) (426) (426) (426) - - - - - (227) (227) (227) - - - - (63) (63) (63) (63) - - - - - - - - - - - - - - - - - - - - - - - - - - - - - (70) (97) (377) - - - - - - - (50) - - - - - - - - - - - - - - - - - - - - - - - - - - - - - - - - - - - - - - - - - - - - - - - - - - - - - - - - - - - - - - - - - (119) (119) (119) (192) (426) (426) (426) - - - - - (227) (227) (227) - - - - (63) (63) (63) (63) - - - - - - - - - - - - - - - - - - - - - - - - - - - - - (70) (97) (377) - - - - - - - (50) - - - - - - - - - - - - - - - - - - - - - - - - - - - - - - - - - - - - - - - - - - - - - - - -
Attachment D-3 E3 EPE Report Model Results AugustPage 32 of 34
Scenario Resource TypeHigh Gas Price Nuclear (Palo Verde)
Nuclear (SMR)Gas - Steam TurbineGas - Combined CycleGas - Combustion TurbineBiomassGeothermalWindSolarBattery StorageImportsDemand ResponseHydrogenBTM SolarLoadExcess Generation
Low Renewable and Storage Costs Nuclear (Palo Verde)Nuclear (SMR)Gas - Steam TurbineGas - Combined CycleGas - Combustion TurbineBiomassGeothermalWindSolarBattery StorageImportsDemand ResponseHydrogenBTM SolarLoadExcess Generation
2021 2024 2025 2027 2031 2035 2040 2045Cumulative Capacity Retirements (MW)
- - - - - - - - - - - - - - - - - (119) (119) (119) (192) (426) (426) (426) - - - - - (227) (227) (227) - - - - (63) (63) (63) (63) - - - - - - - - - - - - - - - - - - - - - - - - - - - - - (70) (97) (377) - - - - - - - (50) - - - - - - - - - - - - - - - - - - - - - - - - - - - - - - - - - - - - - - - - - - - - - - - - - - - - - - - - - - - - - - - - - (119) (119) (119) (192) (426) (426) (426) - - - - - (227) (227) (227) - - - - (63) (63) (63) (63) - - - - - - - - - - - - - - - - - - - - - - - - - - - - - (70) (97) (377) - - - - - - - (50) - - - - - - - - - - - - - - - - - - - - - - - - - - - - - - - - - - - - - - - - - - - - - - - -
Attachment D-3 E3 EPE Report Model Results AugustPage 33 of 34
Scenario 2021 2024 2025 2027 2031 2035 2040 2045Least-Cost (Reference Case) 246$ 233$ 245$ 262$ 284$ 340$ 402$ 498$ Least-Cost Case + REA Resources 246$ 233$ 247$ 262$ 285$ 343$ 406$ 506$ Separate System Planning 247$ 233$ 250$ 268$ 293$ 369$ 473$ 571$ Separate System Planning (w H2) 247$ 233$ 251$ 268$ 293$ 348$ 438$ 536$ 80 Clean by 2035 246$ 233$ 245$ 262$ 284$ 342$ 402$ 498$ 20 CO2 Red by 2040 246$ 233$ 245$ 262$ 284$ 342$ 402$ 499$ 40 CO2 Red by 2040 246$ 233$ 245$ 262$ 284$ 342$ 405$ 512$ 60 CO2 Red by 2040 246$ 233$ 246$ 262$ 284$ 341$ 419$ 531$ 80 CO2 Red by 2040 246$ 233$ 247$ 262$ 284$ 347$ 463$ 577$ 90 CO2 Red by 2040 246$ 233$ 247$ 263$ 287$ 357$ 500$ 615$ 100 CO2 Red by 2040 (w H2) 246$ 233$ 249$ 264$ 289$ 367$ 551$ 663$ 100 CO2 Red by 2040 246$ 233$ 245$ 262$ 289$ 367$ 1113$ 1282$ High DG 245$ 231$ 241$ 256$ 277$ 325$ 382$ 470$ High DSM 245$ 230$ 239$ 254$ 271$ 313$ 367$ 450$ Low Load 239$ 227$ 236$ 252$ 269$ 312$ 371$ 460$ High Load 253$ 239$ 255$ 276$ 307$ 374$ 441$ 540$ No Lifetime Extensions 246$ 228$ 243$ 266$ 298$ 344$ 406$ 502$ No New Gas 246$ 233$ 245$ 262$ 284$ 367$ 453$ 570$ Low Carbon Price 291$ 277$ 284$ 301$ 323$ 379$ 444$ 543$ Mid Carbon Price 358$ 341$ 341$ 358$ 381$ 436$ 505$ 611$ High Carbon Price 469$ 449$ 432$ 451$ 475$ 529$ 603$ 718$ High Gas Price 257$ 242$ 251$ 268$ 291$ 347$ 412$ 509$ Low Renewable and Storage Costs 246$ 233$ 240$ 256$ 274$ 321$ 379$ 463$
Annual Revenue Requirement ($MM)
Attachment D-3 E3 EPE Report Model Results AugustPage 34 of 34
Scenario Clean Energy Type 2021 2024 2025 2027 2031 2035 2040 2045Least-Cost (Reference Case) Renewable 4 12 21 21 27 34 36 39
Zero Carbon 62 68 77 75 77 81 77 75Least-Cost Case + REA Resources Renewable 4 12 24 24 30 39 43 49
Zero Carbon 62 68 79 78 80 85 84 84Separate System Planning Renewable 4 12 20 21 26 38 42 46
Zero Carbon 62 68 76 75 76 84 83 82Separate System Planning (w H2) Renewable 4 12 21 21 27 34 41 45
Zero Carbon 62 68 76 75 77 81 82 8180 Clean by 2035 Renewable 4 12 21 22 27 34 39 45
Zero Carbon 62 68 77 76 77 81 80 8020 CO2 Red by 2040 Renewable 4 12 21 22 27 34 37 46
Zero Carbon 62 68 77 76 77 81 78 8140 CO2 Red by 2040 Renewable 4 12 21 22 27 34 43 51
Zero Carbon 62 68 77 76 77 81 84 8660 CO2 Red by 2040 Renewable 4 12 22 22 27 36 48 56
Zero Carbon 62 68 77 76 78 83 89 9180 CO2 Red by 2040 Renewable 4 12 24 24 30 41 54 60
Zero Carbon 62 68 79 78 81 87 94 9590 CO2 Red by 2040 Renewable 4 12 24 24 32 43 56 62
Zero Carbon 62 68 79 78 82 89 97 98100 CO2 Red by 2040 (w H2) Renewable 4 12 25 26 34 45 56 62
Zero Carbon 62 68 81 79 84 92 100 100100 CO2 Red by 2040 Renewable 4 12 22 22 34 45 60 65
Zero Carbon 62 68 77 76 84 92 100 100High DG Renewable 4 13 21 22 27 35 37 39
Zero Carbon 63 70 76 75 77 82 78 74High DSM Renewable 4 12 16 16 20 31 32 37
Zero Carbon 63 69 73 72 73 80 76 75Low Load Renewable 4 12 16 16 19 31 33 38
Zero Carbon 64 70 73 72 72 79 75 75High Load Renewable 4 12 23 24 31 36 36 41
Zero Carbon 61 66 77 76 79 80 76 75No Lifetime Extensions Renewable 4 12 23 26 31 35 36 39
Zero Carbon 62 68 79 80 81 81 77 75No New Gas Renewable 4 12 22 22 27 42 50 57
Zero Carbon 62 68 77 76 77 88 90 92Low Carbon Price Renewable 4 12 23 23 28 37 38 43
Zero Carbon 62 68 78 77 79 83 79 79Mid Carbon Price Renewable 4 12 26 26 31 39 41 45
Zero Carbon 62 68 81 80 81 86 82 81High Carbon Price Renewable 4 12 30 31 34 41 45 54
Zero Carbon 62 68 86 85 84 87 86 89High Gas Price Renewable 4 12 22 22 27 36 37 43
Zero Carbon 62 68 77 76 78 82 78 78Low Renewable and Storage Costs Renewable 4 12 22 22 28 36 38 44
Zero Carbon 62 68 77 76 78 83 79 80
Clean Energy ( of Load)
BEFORE THE NEW MEXICO PUBLIC REGULATION COMMISSION
RULE 1773 NMAC FILING
EL PASO ELECTRIC COMPANY NOTICE OF 2021 INTEGRATED RESOURCE PLAN
2020-2021 PLANNING PROCESS AND PUBLIC ADVISORY PROCESS MEETINGS
DECLARATION OF CURTIS HUTCHESON OF NOTICE TO CUSTOMERS
I Curtis Hutcheson pursuant to Rule 1-011 NMRA state as follows
1 I affirm in writing under penalty of perjury under the laws of the State of New Mexico
that the following statements are true and correct
2 I am over 18 years of age and have personal knowledge of the facts stated herein I am
employed as Supervisor-Regulatory Case Management My business address is 100 N Stanton
Street El Paso Texas 79901
3 My responsibilities include the oversight and preparation of rate and regulatory filings
and compliance with the various regulatory requirements of the jurisdictions in which EPE
operates
4 Pursuant to Rule 17739H(1) NMAC the New Mexico Public Regulation Commission
(ldquoCommissionrdquo) requires EPE to provide notice of EPErsquos 2021 Integrated Resource Planrsquos
2020-2021 Planning Process and Public Advisory Process Meetings in the utilityrsquos billing
inserts
5 EPE directly mailed the required notice to all existing New Mexico customers in a bill
insert between June 4 2020 and July 2 2020 A copy of the bill insert is attached as Exhibit A to
Attachment E-1 Proof of Notice
2
this Affirmation
6 EPE also published the notice in the Las Cruces Sun News on May 31 2020 The affidavit
and tear sheet are attached as Exhibit B to this Affirmation
7 EPE provided notice on June 4 2020 30 days prior to the first scheduled meeting on
July 10 2020 to the commission interveners in its most recent general rate case and
participants in its most recent renewable energy energy efficiency and IRP proceedings The
email of the notice and certificate of service is attached as Exhibit C to this Affirmation
I submit this Declaration based upon my personal knowledge and upon information
and belief in support of EPErsquos 2021 Integrated Resource Planrsquos 2020-2021 Planning Process
and Public Advisory Process Meetings
FURTHER DECLARANT SAYETH NAUGHT
I declare under penalty of perjury that the foregoing is true and correct
Executed on May 13 2021
__s Curtis Hutcheson________
CURTIS HUTCHESON
Attachment E-1 Proof of Notice
BEFORE THE NEW MEXICO PUBLIC REGULATION COMMISSION
RULE 1773 NMAC FILING
EL PASO ELECTRIC COMPANY
NOTICE OF 2021 INTEGRATED RESOURCE PLAN
2020-2021 PUBLIC ADVISORY PROCESS MEETINGS
Notice is hereby given that
El Paso Electric Company (EPE) invites members of the public to participate in the Integrated Resource
Plan (ldquoIRPrdquo) public advisory process through a series of public meetings With public participation EPE
will develop its IRP pursuant to the New Mexico Efficient Use of Energy Act and the New Mexico Public
Regulation Commissions (Commission) IRP Rule 1773 NMAC EPEs IRP is developed to identify cost-
effective demand-side and supply-side electricity resources to serve EPEs customers over the next 20-
year planning period
The IRP will be submitted to the Commission no later than July 2021 Public participation is an important
component of the development and implementation of EPEs integrated resource planning in New
Mexico EPE encourages interested members of the public to attend these public meetings to provide
public input and commentary whether as a residential or business customer or as a representative of a
trade non-profit neighborhood shareholder civic or other group
Given the currently effective limitations on public gatherings in New Mexico and Texas the first scheduled
meeting will be held electronically and by phone conference on July 10 2020 at 200 pm MDT The IRP
process will be explained and additional meeting dates and locations will be set at that time Prior to
each meeting the presentation for that meeting will be posted on EPEs website wwwepeletriccom If
you are interested in attending the meeting or otherwise participating in the process please contact EPE
by emailing NMIRPepelectriccom or calling at (915) 543- 4354
Exhibit A Page 1 of 1Attachment E-1 Proof of Notice
Exhibit B Page 1 of 2Attachment E-1 Proof of Notice
2H SUNDAY MAY 31 2020 LAS CRUCES SUN-NEWS
4B-501 Notice to creditors by publi-cation and notice to creditors bywritten notice (mailing or other de-livery)[For use with Rules 1B-304 1B-306and 1B-401 NMRA]
STATE OF NEW MEXICOIN THE PROBATE COURTDONA ANA COUNTY
No 20-0074
IN THE MATTER OF THEESTATE OF Juliet S WilliamsDECEASED
NOTICE TO CREDITORSNOTICE IS HEREBY GIVEN thatthe undersigned has been appointedpersonal representative of the es-tate of the decedent All personshaving claims against the estate ofthe decedent are required to presenttheir claims within four (4) monthsafter the date of the first publica-tion of any published notice to cred-itors or sixty (60) days after thedate of mailing or other delivery ofthis notice whichever is later orthe claims will be forever barredClaims must be presented either tothe undersigned personal represen-tative at the address below or filedwith the Probate Court of DonaAna 845 N Motel Blvd 1-201 LasCruces NM 88007Dated May 2020s Edwin James Williams Jrsignature of representative
Edwin James Williams JrPrinted Name
17093 White Pine RdStreet address
Beaver dam VA 23015City state and ZIP code
4213196 Sun-News May 31 andJun 7 14 2020
To advertise visit
SELL ITBUY IT
FIND ITcars
garage sales
tickets
jobs
antiques
motorcycles
computers
boats
sports equipment
pets
instruments
jewelry
furniture
tablets
auctions
yard sales
collectibles
appliances
cameras
coins
Place yourclassified ad today
FINDING WORK SHOULDNrsquoT BE WORK
Your job search ends here
Get started by visitingjobsusatodaycom
HVAC TECHNICIAN II
ACO amp CODES-LABORER
ANIMAL CONTROL OFFICER
DASO CADET-UNCERTIFIED
ROADS-EQUIPMENT OPERATOR
ELECTIONS SPECIALIST-TEMPORARY
ROADS-HEAVY EQUIPMENT OPERATOR
DETENTION CENTER OFFICER TRAINEE
DOCUMENT TECHNICIAN-DC DISPOSITIONS
ENVIRONMENTAL CODES ENFORCEMENT OFFICER
WATERWASTEWATER OPERATOR III
Job Application amp Job Announcements available on our Website atwwwdonaanacountyorg
Computer kiosks are available in the Human Resources Department
DONtildeA ANA COUNTYJOB VACANCIES
CAMINO REALREGIONAL UTILITY AUTHORITY
JOB VACANCIES
Demolition Build RoadsLeveling
Business amp Service Directoryto advertise email ServiceDirectorylcsun-newscom
or call 8007645620
Exhibit B Page 2 of 2Attachment E-1 Proof of Notice
From Griego PatriciaTo Burns Nancy Griego Patricia Jeffrey Wechsler Diana Luna Kari Olson Lorraine Talley John F McIntyre
Schichtl James Hutcheson Marvin C Novela Mariah M Parsons Judith M Pleasant Linda G Perea Araceli Gastevenslawgmailcom jvega-brownlas-crucesorg joprovenciolas-crucesorg llarocquelas-crucesorg marcydlas-crucesorg davilalas-crucesorg JAGlas-crucesorg hconnellylas-crucesorg ddollahonlas-crucesorg tomfdonaanacountyorg rockybacchusgmailcomecomaxaclifeisgood2com lellisnmsuedu ghauboldadnmsuedu jdrakemodrallcomnwinterstelznerlawcom kherrmannstelznerlawcom rgallegosstelznerlawcom Nobleccaegmailcomstephaniedzur-Lawcom Lundin Robert gelliotnmaggov Cholla Khoury lawofficejasonmarkscomJsmithwatsonlawlcgmailcom mayortrujillocityofanthonynmorg mlsouleshotmailcombthroneattynewmexicocom Goodin Nelson fredkdonaanacountyorg Rickvotesolarorgtasolomon6gmailcom Dahlharrishotmailcom Jdittmerutilitechnet Jaherzsawvelcomakharrigersawvelcom Borman Bradford PRC Reynolds John PRC Chavez Milo PRC Sidler Jack PRCjohnbogatkostatenmus marctuplerstatenmus gilberttfuentesstatenmus Sisneros Anthony R PRCLeyba-Tercero Elisha PRC Fisk Russell PRC Amer Judith PRC Smith Michael C PRC Martinez-Rael PeggyPRC elizabethramirezstatenmus carolynglickstatenmus Hurst Elizabeth PRCchristopherryanstatenmus philipbsimpsoncomcastnet Kylejsmith124civmailmilrobertagantoncivmailmil hgellerswenergyorg jbrantswenergyorg ctcolumbiaaolcomltougascleanenergyregresearchcom dgegaxnmsuedu Ramonablabersierracluborgsricdonearthlinknet smichelwesternresourcesorg Beadles Cydney PRCpatoconnellwesternresourcesorg aprilelliottwesternresourcesorg dneidcoxnet schaefnogmailcomdavidvw77com bslocumdwmrlawcom jmcnallydwmrlawcom mbarkerdwmrlawcommzidovskymontandcom
Cc EPE_Reg_MgmtSubject Rule 1773 NMAC Filing EPEs Notice of 2020-2021 Public Advisory Process Meetings for 2021 IRP amp COSDate Thursday June 4 2020 105041 AMAttachments 2021 IRP Noticepdf
COS Notice of IRP Processpdf
Good morning Attached is El Paso Electric Companyrsquos Notice of its 2020-2021 Public AdvisoryProcess Meetings for the 2021 Integrated Resource Plan and Certificate of Service that was filed byemail with NMPRC Records today
Patricia ldquoTrishrdquo Griego| El Paso Electric CompanyLegal Assistant300 Galisteo St Suite 206Santa Fe New Mexico 87501T (505) 982-4713 | C (505) 470-4048Patriciagriegoepelectriccom
CONFIDENTIALITY NOTICE The information contained in this electronic mailtransmission is CONFIDENTIAL and it may qualify as material protected pursuantto the Texas Uniform Trade Secrets Act the New Mexico Uniform Trade SecretsAct or other laws If you are not the intended recipient please destroydelete thismessage and any attachments and immediately notify the sender
Exhibit C Page 1 of 1Attachment E-1 Proof of Notice