attachment 7.7 sa power networks: future operating model ... - 7.7 public - sapn future... · ˜ ˝...
TRANSCRIPT

Attachment 7.7
SA Power Networks: Future Operating Model 2013-2028

SAPowerNetworksFuture Operating Model 2013–2028


SAPowerNetworksFuture Operating Model 2013–2028


Executive Summary 4
1. Introduction 6
1.1 Background 6
1.2 Purpose 6
1.3 Process 6
2. Overview 6
3. Business Drivers 7
3.1 Environmental Policy 7
3.2 State and Local Planning 8
3.3 Customer Expectations 8
3.4 Community Expectations 8
3.5 Distributed Energy Resources 8
3.6 Electrification of Transportation 11
3.7 Network Performance 12
3.8 Asset Renewal 12
3.9 Remote Monitoring and Control 13
3.10 Data Management 16
3.11 Regulatory Incentives 16
3.12 Aging Workforce 16
4. Our Roadmap to 2028 17
5. Our Network in 2028 21
5.1 Urban 22
5.2 Rural and Remote 24
5.3 Demand Side Participation 25
6. Key Operations in 2028 28
6.1 Customer Service 28
6.2 Customer Connections 28
6.3 Network Development 30
6.4 Asset Management 31
6.5 Supply Restoration 33
7. Key Roles in 2028 38
7.1 Customer Project Manager 38
7.2 Customer Service Agent 39
7.3 Control Room Operator 40
7.4 Network Planner 41
7.5 Asset Designer 42
7.6 Field Crew Member 43
7.7 Asset Manager 44
7.8 Supporting Roles 45
8. Conclusion 46
8.1 The Challenge Ahead 46
8.2 Relentless Improvement 46
9. Abbreviations 47
Contents

4 talkingpower.com.au SA POWER NETWORKS FUTURE OPERATING MODEL 2013–2028
By 2028 we expect significant changes in how our customers use our network, as well as in the widespread deployment of intelligent technology. This will drive change in, firstly how we design, build and operate the network and, secondly its level of performance. The entire electricity sector is experiencing unprecedented change. SA Power Networks, as the electricity distributor for South Australia, has recognised the significance of a wide array of associated challenges to its current operating model. Over the past few years, the organisation has responded, in the first instance, by investigating what the future operating model might look like, and how these challenges can become a business opportunity for efficiency and growth.
The purpose of this document is to identify and communicate the key challenges and opportunities that will most likely shape SA Power Networks over the next 15 years, including what the future will likely mean for the organisation’s key business processes and roles.
Importantly, the Future Operating Model represents our best view of our likely operating environment over a 15 year horizon. This vision will be regularly reviewed and updated to ensure that our business strategies over the longer term are optimal.
Business Drivers Changes in our operating environment will influence our Future Operating Model to varying degrees. The relative timing and intensity of key business driver developments will determine the timing, pace and scope of changes over the next 15 years.
These business drivers can be categorised into 5 main groups• Customer and Community Expectations• Government and Regulation• Customer and Network Technology• Systems and Information Technology• Aging Assets and Workforce
One important business driver shaping our approach is customer and community expectations. We know from regulatory customer engagement activities (as part of our regulatory reset preparations) and through extensive work on our Customer Service Strategy that the following are important to customers:• Customer Experience, including information
that is up to date, accurate and available via multiple channels
• Community Safety and Reliability, including appropriate bushfire risk management approaches for today’s society, and as always, ensuring network assets are maintained and developed in order to deliver on reliability, quality and demand expectations
• Visual Amenity, such as incorporating design aesthetics into new and existing network infrastructure
• Meeting the needs of the ‘Evolving Customer’, such as by supporting their access to greater choice in energy options, including continued upgrades to support a two-way network
These points highlight fundamental changes that may require innovative approaches to our future business directions. For example, our response may be new lines of business in a competitive environment. Such opportunities will likely revolve around technology such as demand and energy management, Demand Side Participation and support for customer-side technologies including Electric Vehicles.
Roadmap to 2028By producing a roadmap to 2028 we are attempting to provide expected timings of major developments in our operating environment, as well as reflecting our potential strategic responses over the next 15 years.
Our Network in 2028Our view of the Network in 2028 varies due to network topology and location. Urban, Rural and Remote areas will have differing numbers of customers connected, as well as different configurations and performance.
In urban areas by 2028 we expect an increase in medium and high density residential developments, which will approach zero net energy by relying on renewable energy, onsite energy storage, and demand management systems. Demand Side Participation will become a key feature of customers’ interaction with the network. We expect that this will facilitate two way energy flows on the network between communities and suburbs, requiring management of the low voltage network.
Rural and remote customers are expected to embrace renewable technologies plus energy storage as they become cost competitive with mains-supplied electricity. Through the use of monitoring and control capabilities we expect to greatly reduce fault location and rectification times for those customers especially when this occurs from escalating frequency of extreme weather events.
Key Operations for the futureAs we move into the next 15 years our core business processes must respond to the business drivers set out above. Key operations will continue to focus on Customer Service, Customer Connections, Network Development, Asset Management and Supply Restoration.
We expect that customer interactions will increase and become more diverse, and that connections will become more complex as we integrate customer-side energy technologies with the network.
Our network will be increasingly optimised using technology such as the Advanced Distribution Management System (ADMS) to forecast daily loads across the network and to reconfigure it dynamically using automated switches and remote monitoring and control.
Manual asset inspections will be reduced due to online sensors, airborne drone-based video capture and aircraft-based LIDAR survey techniques.
Supply restoration performance will improve with the deployment of improved network monitoring and advanced metering infrastructure that will notify us whenever a single customer is without supply, thereby circumventing the requirement for the customer to alert us to the fault.
Executive Summary

talkingpower.com.au 5SA POWER NETWORKS FUTURE OPERATING MODEL 2013–2028
Key RolesIn order to carry out these key business operations in the future we must invest in the development of our people. The introduction of new technology into the business will enable us to perform our existing roles more productively, however it will require us to learn and use new skills and techniques.
While every role in SA Power Networks supports the success of our business, we have used the roles in this document as examples to illustrate the expected impact of our Future Operating Model on our day to day activities.
ConclusionSA Power Networks faces an unprecedented quantum of change over the next 10 to 15 years driven by major changes in the relative costs of decentralised energy generation, retail prices, the emergence of new customer-side and network-side technologies, and the need to manage an aging asset fleet, among others.
SA Power Networks will continue to review and refine its Future Operating Model, and proactively utilise this vision in its strategy development processes.
Executive Summary
6 talkingpower.com.au SA POWER NETWORKS FUTURE OPERATING MODEL 2013–2028
2. Overview1. Introduction
This document summarises the results of SA Power Networks’ strategic initiative to define an appropriate Future Operating Model given our understanding of internal and external strategic business drivers and view of our operating environment in 2028.
1.1 BackgroundWe are currently part way through the five-year regulatory control period, which commenced on 1 July 2010. While we are delivering on our commitments for this regulatory period, we have already begun planning for the next regulatory period and the associated proposal to the Australian Energy Regulator (AER). The proposal is due in October 2014.
However, the significant potential for change on multiple fronts over the 15 year time horizon calls for clarity of vision regarding:• Customer needs,• Technology trends,• Regulatory change, and• Market developments, among other things.
So, SA Power Networks’ senior management recognised the need to develop and maintain a longer-term view regarding the organisation’s future operating environment and strategic direction. This view would be used to guide our investment decisions, and to help facilitate the understanding of our key stakeholders.
1.2 PurposeThe purpose of this document is to identify and communicate the key challenges and opportunities that will most likely shape SA Power Networks over the next 15 years, including what that future will mean for the organisation’s key business processes and roles.
The development of an optimised and aligned view of SA Power Networks’ Future Operating Model provides us and our key stakeholders with a longer term view of the organisation’s strategic direction and operational configuration.
With this in mind, the intention of this document is not to explicitly define SA Power Networks’ future scope or structure, nor does it provide definitive answers regarding our future technology and business choices, many of which have yet to be made.
Rather, the Future Operating Model represents a ‘living document’ vision that offers long-term directional insights into our most likely future development paths. These insights will help to guide our staff and decision makers in the coming years.
1.3 ProcessSA Power Networks originally developed its Future Operating Model in 2011 through a series of workshops attended by key stakeholders and subject matter experts from across and outside the business.
The workshops examined SA Power Networks’ future customers, their needs, values and expectations, as well as the impact of emerging customer and network technologies on our network.
The SA Power Networks Future Operating Model was then conceptualised and refined based on workshop outcomes and a series of in-depth follow-up meetings.
The Future Operating Model was updated in 2013 as part of SA Power Networks’ strategic planning process. Stakeholders and subject matter experts were engaged through a workshop to reconsider the Future Operating Model in light of new developments in its operating environment and outlook.
To the extent possible at the time of writing, the update also involved review of the insights revealed in the early stages of SA Power Networks’ 2015-2020 reset stakeholder engagement program.
Key developments considered as part of this review included: • the impact of Liquefied Natural Gas exports
on domestic gas market pricing• the impact of non-conventional gas and
oil supplies on international energy markets• changes to hot water, solar photo-voltaic
(PV) and carbon abatement support policies• the rapid fall in solar PV prices• the pace of consumer side energy
technology development• changing customer behaviour in response
to electricity pricing• national reform of the network regulatory
framework
This document is organised as follows:• Business Drivers — This section details
the key factors that will drive SA Power Networks’ Future Operating Model.
• Our Roadmap to 2028 — This section presents SA Power Networks’ view of the timing of key developments.
• Our Customers and Network in 2028 — This section profiles SA Power Networks’ urban, rural and remote customers and networks.
• Key Operations in 2028 — This section outlines SA Power Networks’ Future Operating Model in terms of its key processes.
• Key Roles in 2028 — This section describes the impact of the Future Operating Model on key roles.
• Conclusion — This section summarises the challenges ahead, and outlines SA Power Networks’ strategic response.

talkingpower.com.au 7SA POWER NETWORKS FUTURE OPERATING MODEL 2013–2028
3. Business Drivers
New trends in retail electricity prices, government policy, technology, customer expectations, and industry regulation are emerging alongside established longer-term trends in our asset and organisational age profile, confirming the onset of significant changes in our operating environment.
Changes in our operating environment will influence our Future Operating Model to varying degrees. The relative timing and intensity of key business driver developments will determine the timing, pace and scope of changes as we move to our Future Operating Model over the next 15 years.
3.1 Environmental Policy Environmental policies will drive the adoption of renewable and lower carbon energy systems within our network, and will lead to lower energy consumption overall. Key policies are: • Renewable energy targets; • Carbon policy; • Energy efficiency standards; and • Federal and State subsidies.
We expect the role of small scale renewable energy targets and subsidies to decline over the next 5-10 years, as rises in retail prices and declining technology costs make solar PV, microwind and residential combined heat and power generation increasingly cost effective.
Although the long-term environmental policy positions of government are difficult to anticipate, SA Power Networks does expect a carbon price and demanding minimum energy performance standards by 2028.
A policy mandate to drive aspects of network automation, in order to enable the nation’s carbon reduction or renewable energy generation targets, while not yet in existence, would have a major impact on the timing but not necessarily the scope of SA Power Networks’ Future Operating Model.
Legend:Greater Adelaide RegionSouth Australian Government Regions
Urban Areas:Built-up areasPlanned urban lands to 2038Growth areas — 15 years zoned supplyLong-term urban growth areas (16–30 years supply — this land will be prioritised for rezoning as the 15 year land supply is utilised)
Investigation areas for urban growth
Employment:New strategic employment lands
Transport:Main road
0 10 20 30
N
Figure 3.1: South Australian Government’s 30 Year Plan, Urban Expansion Priorities

8 talkingpower.com.au SA POWER NETWORKS FUTURE OPERATING MODEL 2013–2028
3. Business Drivers
3.2 State and Local Planning The South Australian Government’s 30 Year Plan (the Plan) for greater Adelaide will influence the number and types of premises requiring connection to our network over the next 15 years.
The Plan’s key directions, which include: • A compact and carbon efficient city; • Housing diversity — with an emphasis
on medium density living; and • Transit oriented developments, will also
have a major impact on customer behaviour and choices over this timeframe.
The Plan’s targets will drive higher population density growth corridors and transit oriented developments, as well as a reduction of average residential energy consumption by 10%, and 25% for government buildings.
SA Power Networks expects increasing movement by State and local planning authorities towards community based energy systems and net zero carbon residential developments by 2028 to support South Australia’s ambitious 60% emissions reduction target by 2050.
3.3 Customer Expectations Changing customer expectations around the range and levels of our services will drive the need to further invest in customer service channels and capabilities.
Customers are increasingly able to access high quality information with few limitations on location or time due to advances in communications technology. This has raised expectations for accurate, timely information via a wide range of channels including smart phone applications and social networking sites.
Customers are also increasingly accustomed to controlling what information they receive and how they receive it using preferences, portals and dashboards, which they expect to be able to easily configure themselves.
Their rising expectations regarding the availability, timeliness, accuracy and relevance of information will need to be met if we are to maintain existing customer satisfaction performance over the next 15 years.
As customer needs evolve from relatively simple connection and fault rectification requests to more sophisticated energy management services and support queries, SA Power Networks will need to be prepared to address the changed circumstances.
3.4 Community Expectations Community expectations regarding the configuration, location and management of our assets will drive our future asset designs and operating practices.
Community demand for infrastructure that is more aesthetically pleasing with a reduced environmental impact will require increased investment in more compact, fit-for-setting substations (whether indoor or outdoor), greater EMF shielding, and more environmentally friendly vegetation-trimming practices.
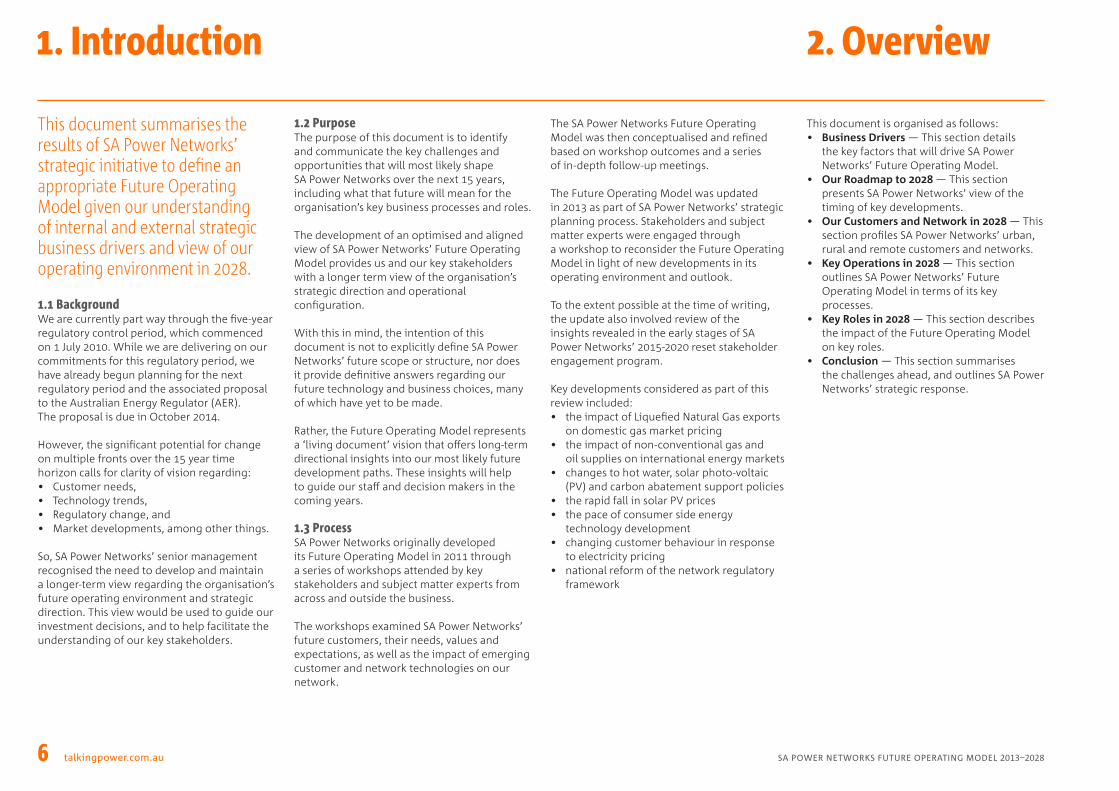
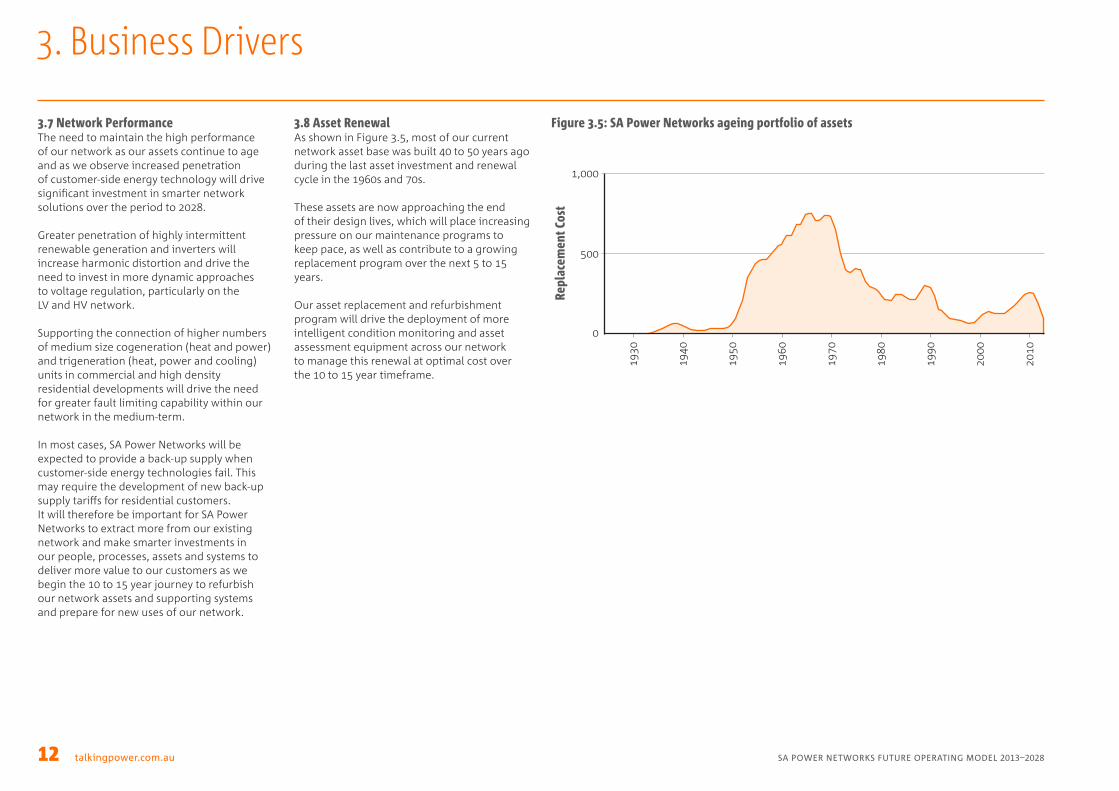
3.5 Distributed Energy Resources Customer equipment and appliances are becoming increasingly intelligent, and new energy technologies are emerging to provide customers with greater choice and potential savings on their energy bill. Figure 3.2 illustrates presently available smart appliances and customer-side technologies.
Smart appliances are already being introduced into Australia that will enable customers to shift usage patterns, where grid pricing incentives are available. With the right incentives, customers could soon allow us to control these networked devices to provide demand reduction, enabling more efficient use of our network.
talkingpower.com.au 9SA POWER NETWORKS FUTURE OPERATING MODEL 2013–2028
3. Business Drivers
Figure 3.2: Energy management systems will be a standard feature in many homes, coordinating local generation, storage and consumption of energy
10 talkingpower.com.au SA POWER NETWORKS FUTURE OPERATING MODEL 2013–2028
3. Business Drivers
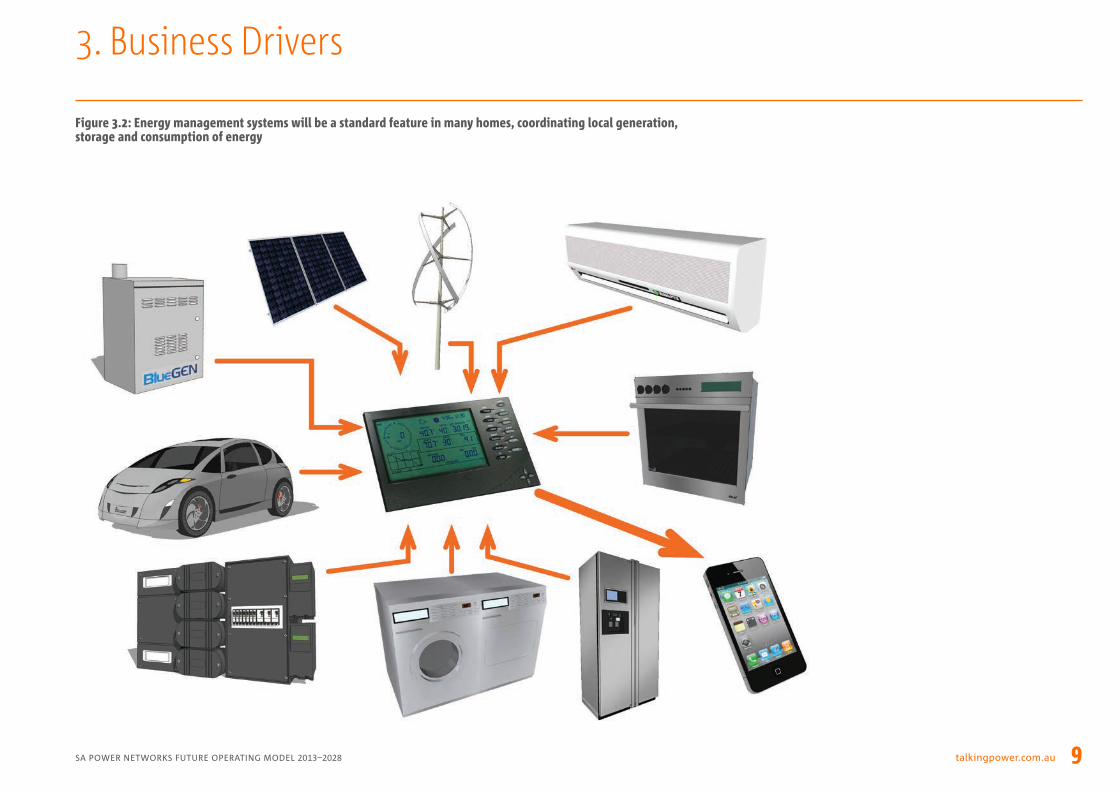
Customer take-up of solar PV systems has accelerated as a result of generous government incentives and declining technology costs. As shown in Figure 3.3, the number of solar PV installations per year in South Australia leapt from 1,600 in 2008/09 to over 145,000 in 2012/13, and continue to grow.
Customer adoption of emerging energy technologies will increase the amount of embedded generation and storage on our network, which we will need to manage to ensure our customers continue to receive a safe, secure, reliable and high quality electricity supply.
SA Power Networks expects significant take-up of the following customer-side energy technologies over the next 15 years: • Solar PV — Already very popular, we expect
solar PV in 60% of South Australian houses by 2028.
• Microwind — Although not yet widely available, 7% of rural properties are expected to adopt this technology by 2028.
• CHP — Potential government support of this very energy efficient technology could lead to significant take up in premises with access to natural gas.
• Energy Storage — Products have begun to emerge, and it is possible that 20% of customers will have some form of storage onsite by 2028.
• Energy Management Systems — Basic systems are expected to be in 60% of residential premises by 2028.
We expect new residential developments to have a higher rate of customer-side technology installations compared to existing homes.
Figure 3.3: Solar photo-voltaic (PV) connections to SA Power Networks’ distribution network
PV C
usto
mer
s Con
nect
ed
Appr
oved
kW
Cap
acit
y of
Con
nect
ed P
V
PV Customers and PV Capacity kW ApprovedEffective capacity in use may be 81% of approved capacity
1/7/2008 1/7/2009 1/7/2010 1/7/2011 1/7/2012 1/7/2013 1/7/20141/7/2007
PV Customers Connected Approved Capacity of Connected PV
240,000
220,000
200,000
180,000
160,000
140,000
120,000
100,000
80,000
60,000
40,000
20,000
0
600,000
550,000
500,000
450,000
400,000
350,000
300,000
250,000
200,000
150,000
100,000
50,000
0

talkingpower.com.au 11SA POWER NETWORKS FUTURE OPERATING MODEL 2013–2028
3. Business Drivers
Figure 3.4 presents our long-term view of customer adoption of customer-side energy technologies in our network area. Actual adoption rates will depend on the cost and availability of the technology and the retail price of electricity and gas (in the case of gas-fuelled co-generation and tri-generation).
Complex two-way power flows within our Low Voltage (LV) and High Voltage (HV) networks will be created as more customer-side energy technologies are deployed. This will drive the need to increase network capacity and/or required widespread use of intelligent voltage regulation control schemes to manage network voltage along with sophisticated integrated control and protection systems to manage customer quality of supply.
SA Power Networks will need to develop effective connection processes, and the requisite protection, monitoring and control systems, to ensure we are capable of enabling these new uses for our network as they emerge.
3.6 Electrification of Transportation Breakthroughs in battery technology, rising petrol prices and growing concerns regarding its future availability are among the main drivers behind the rapid growth of electric vehicles (EVs).
Nissan, Mitsubishi, BMW, Audi, Ford and General Motors have all launched production scale EVs in the European, Asian and North American markets, and most major manufacturers are planning to introduce a wide range of EVs over the next 5 years.
The first production scale EV was sold in South Australia in 2010, and most of the major international vehicle manufacturers are planning to offer models in Australia by 2015.
With batteries sized around 16 kWh, an average daily consumption of 4.85 kWh and residential charging rates of 2.4 kW to 3.6 kW, EVs represent a major new load on the network capable of driving the need for significant additional investment in capacity.
While it is too early to develop a definitive forecast of EV adoption in our network, preliminary modelling suggests that an uncoordinated introduction could double an individual residential customer’s peak demand. The potential impact of EVs on peak demand, as well as the opportunity to tap into EV batteries to provide network support using vehicle-to-grid technology, is expected to drive the need for investment in EV integration technologies and new tariffs.
Figure 3.4: Expected penetration of distributed energy resources over the next 15 years
70% 80% 90%
Energy Management System
Energy Storage
Electric Vehicles
Wind — Rural
Solar PV
Premises ExistingPremises New
0% 10% 20% 30% 40% 50% 60%
12 talkingpower.com.au SA POWER NETWORKS FUTURE OPERATING MODEL 2013–2028
3.7 Network Performance The need to maintain the high performance of our network as our assets continue to age and as we observe increased penetration of customer-side energy technology will drive significant investment in smarter network solutions over the period to 2028.
Greater penetration of highly intermittent renewable generation and inverters will increase harmonic distortion and drive the need to invest in more dynamic approaches to voltage regulation, particularly on the LV and HV network.
Supporting the connection of higher numbers of medium size cogeneration (heat and power) and trigeneration (heat, power and cooling) units in commercial and high density residential developments will drive the need for greater fault limiting capability within our network in the medium-term.
In most cases, SA Power Networks will be expected to provide a back-up supply when customer-side energy technologies fail. This may require the development of new back-up supply tariffs for residential customers. It will therefore be important for SA Power Networks to extract more from our existing network and make smarter investments in our people, processes, assets and systems to deliver more value to our customers as we begin the 10 to 15 year journey to refurbish our network assets and supporting systems and prepare for new uses of our network.
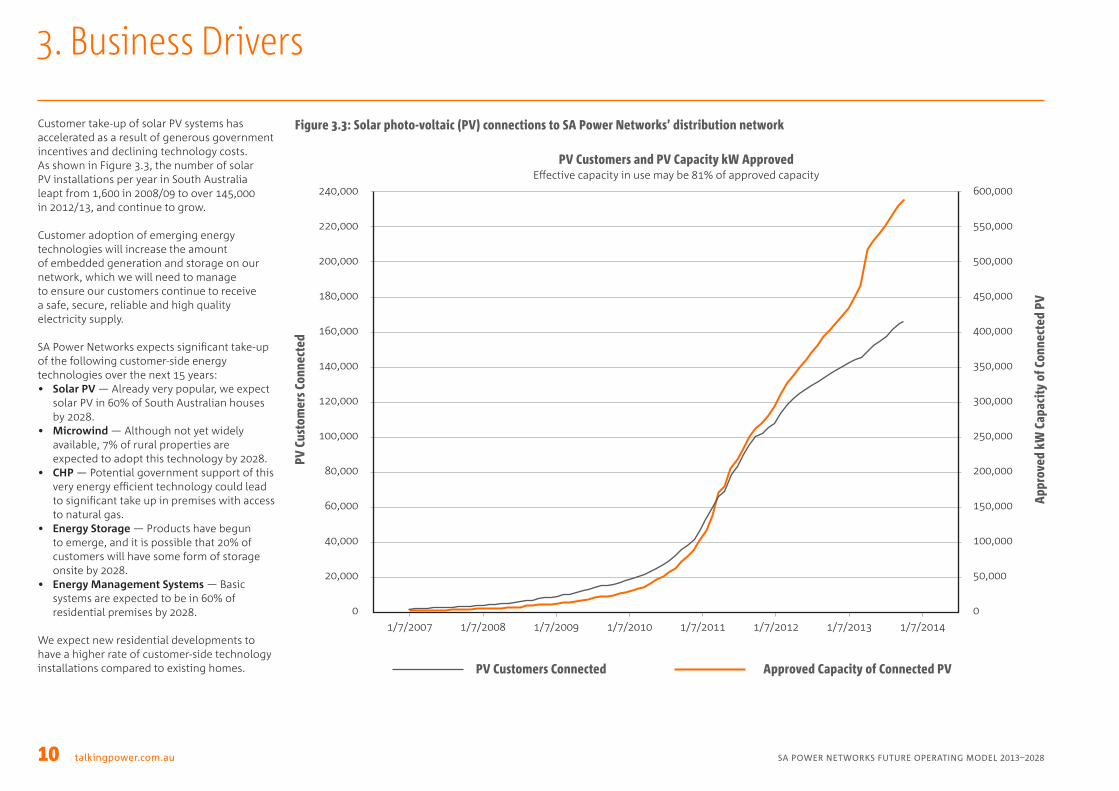
3.8 Asset Renewal As shown in Figure 3.5, most of our current network asset base was built 40 to 50 years ago during the last asset investment and renewal cycle in the 1960s and 70s.
These assets are now approaching the end of their design lives, which will place increasing pressure on our maintenance programs to keep pace, as well as contribute to a growing replacement program over the next 5 to 15 years.
Our asset replacement and refurbishment program will drive the deployment of more intelligent condition monitoring and asset assessment equipment across our network to manage this renewal at optimal cost over the 10 to 15 year timeframe.
3. Business Drivers
Figure 3.5: SA Power Networks ageing portfolio of assets
1,000
500
0
1930
1940
1950
1960
1970
1980
1990
2000
2010
Repl
acem
ent C
ost

talkingpower.com.au 13SA POWER NETWORKS FUTURE OPERATING MODEL 2013–2028
3. Business Drivers
3.9 Remote Monitoring and ControlIncreasingly, electricity distribution networks are being augmented with communications-enabled remote monitoring and control devices and enabling, interconnected software applications. This helps to optimise the connectivity between power suppliers, customers and networks, thereby improving efficiency, reliability, and quality of electricity supply.
The increasing availability of cost effective network control, communications and integration technology, and the need to manage aging network assets, is driving the adoption of greater remote monitoring and control technology worldwide.
As shown in Table 3.1, communications, telemetry and automation enabled electricity networks are able to address a number of emerging industry challenges, including managing aging assets, improving load factor, smoothly integrating electric vehicles, enabling further penetration of embedded generation and managing the resulting two way power flows.
Contemporary network capabilities are developed through the deployment of monitoring and control infrastructure across distribution field assets, which consist of a vastly greater number of sensors and controls, broadband communications, and an integrated IT system connecting a wide range of specialised software applications.
Industry Challenge Existing Network Intelligent Network
Engaging high penetration of customers to efficiently manage demand
Connecting a high penetration of rooftop solar PV
Supporting the electrification of light duty transportation
Connecting highly efficient, low carbon residential cogeneration systems
Supporting greater customer choice of pricing and environmental options
Safely extending the life of aging assets
Continuing to provide a high quality, reliable supply at an affordable price
Minimising energy losses and associated carbon impacts of the network
Table 3.1: Benefits of network modernisation when tackling key electricity industry issues

14 talkingpower.com.au SA POWER NETWORKS FUTURE OPERATING MODEL 2013–2028
Figure 3.6 demonstrates the integration of typical modern network architecture, which is being developed and deployed in Australia and overseas. The utilisation of this communications-enabled technology (ie controls and sensors) is prevalent in the generation and transmission network sectors of the Australian electricity supply industry. However use of the technology, although robust, is only now beginning to emerge within the distribution network sector.
3. Business Drivers
Figure 3.6: Typical network modernisation architecture
USER APPLICATIONS
SAP
CRM
/BI
LLIN
G
GIS
MO
BILI
TY
OM
S
ADM
S
SCAD
A
AMS
DATAINTEGRATION
CONTROL SENSORS
ELECTRICITYSUPPLY
RESOURCES
COMMUNICATIONINFRASTRUCTURE

talkingpower.com.au 15SA POWER NETWORKS FUTURE OPERATING MODEL 2013–2028
The penetration of customer-side energy technologies, the cost effectiveness of monitoring, control and automation solutions, and the regulatory treatment of proposed investment will all be key drivers of the actual timing and pace of SA Power Networks’ remote monitoring and control capabilities. As this transformation occurs over the coming years, we expect to be able to deliver improvements in reliability, safety and productivity, reduce capital investment and increase customer value. Figure 3.7 illustrates the potential benefits of a modernised network over time for SA Power Networks.
3. Business Drivers
Figure 3.7: SA Power Networks’ focus areas for Remote Monitoring & Control
Manage risk Automation and/or addition of control devices in bushfire areas to reduce risk of fire starts & harm to the public
Optimise asset investment Increased strategic monitoring to maximise asset life and optimise capacity expenditure
Manage reliability Deployment of automation to worst performing areas of the network
Enable the two-way grid Preparing the network for deployment of significant additional embedded generation, storage and intelligent customer equipment

16 talkingpower.com.au SA POWER NETWORKS FUTURE OPERATING MODEL 2013–2028
3.10 Data Management Most of the data we currently manage is generated by our metering, network control and asset management processes.
Moving forward it will be essential that we better manage our data requirements for each of these areas: • Customer Metering — Each advanced meter
will generate approximately 17,500 data points relative to the current 4 per year.
• Network Control — Expansion across our distribution network will mean 100 times more end nodes than our current SCADA system.
• Asset Management — We could be collecting 1,000 times more data on the condition of our assets each year.
In addition to the massive growth in our existing datasets, we will need to manage more of our data in real-time, as well as manage new datasets in support of new services such as Distributed Energy Resources (DER) integration.
The need to process this mass of data into useful real-time information will drive our investment in effective, real-time data collection, processing, and presentation technologies and infrastructure.
3.11 Regulatory Incentives We are now regulated by the Australian Energy Regulator (AER), which is responsible for regulating all distribution network businesses operating within the National Electricity Market (NEM).
The AER has established a host of new regulatory incentives to encourage greater use of demand management, efficient operating costs and improvements in service reliability. It has also increased the focus upon consumer concerns and preferences, as well as the need for more effective stakeholder management in general.
The AER has introduced a targeted service reliability scheme over the current 5 year control period that will increase (or reduce) our revenue by 3-5% if reliability improves (or falls) relative to recent historic levels.
A new regulatory investment test for distribution networks (‘RIT-D’) has been introduced to encourage recognition of a wider range of network and non-network project benefits, including the reduction in network electricity losses for investments over $5 million.
One potential regulatory mechanism that could also drive our Future Operating Model is an explicit incentive to maximise the connection of customer-side energy technologies to our network, similar to what has been introduced in the United Kingdom.
3.12 Aging Workforce Many of our staff are expected to retire over the next 10 to 15 years, placing strain on the organisation as we strive to capture and transfer their deep and specific knowledge and skill to the next generation of employees.
Replacing a substantial portion of the workforce will require major organisational effort, and it is critical that these new employees are effectively trained and equipped to deal with SA Power Networks’ future challenges.
3. Business Drivers

talkingpower.com.au 17SA POWER NETWORKS FUTURE OPERATING MODEL 2013–2028
3. Business Drivers 4. Our Roadmap to 2028
Figure 3.8: Impact of Business Driver on SA Power Networks’ Future Operating Model and the Urgency of SA Power Networks’ Response
High
Low
Low High
Impa
ct o
n SA
Pow
er N
etw
orks
’ Fu
ture
Ope
rati
ng M
odel
Urgency of SA Power Networks’ Response
ElectricVehicles
Service Expectations
DSRAggregators
Remote Monitoring& Control
Aging Workforce
Bushfire Risk
Tri/Cogeneration
Solar PV AdoptionEnergy Efficiency
Visual Amenity Metering Contestability
Energy StorageAging Assets
Regulatory Benchmarking
Regulatory Incentives
State Planning
Our roadmap lays out the expected timing and nature of major developments in our operating environment, as well as our strategic response to them over the next 15 years to 2028.
Ultimately, our roadmap leads us to a picture of what we expect our customers and network will look like in 2028, providing the strategic context for our Future Operating Model.

18 talkingpower.com.au SA POWER NETWORKS FUTURE OPERATING MODEL 2013–2028
4. Our Roadmap to 2028
2013 2018 2023 2028
Policy and Regulation
Environment
Network Feed-in tariffs closed, new solar connections to receive market rates
SA agrees to National energy efficiency target of 30% by 2030
Significant increase in the Renewable Energy Target set for 2050, 8 star buildings and mandatory performance disclosure for all property sales
Net zero carbon target established for new commercial and residential developments
Network PerformanceMetering contestability and performance benchmarking introduced
Regulator moots increased revenue at risk for reliability from 5% to 8% of revenue
Power quality and losses incentive schemes introduced by the Regulator
Reliability schemes extended to include interaction with microgrids
Network Investment
Significant ramp up of asset data acquisition, foundation work on ADMS project and North Adelaide trials with customers and network automation continue
Network capital program forecast with funding for asset renewal program, bushfire safety enhancements and network automation
Capital program remains significant, driven by ongoing asset renewals, second generation network automation, support major Demand Side Participation and customer service systems
Moderating capital program approved, decline due to end of Demand Side Participation and DER enablement and renewal investment peak
Energy Prices
Fuel and Carbon Prices
Spot natural gas prices at $6 per MMBtu, no LNG terminals completed to link market with international prices
Expected LNG demand increases natural gas spot prices to $10 per MMBtu, carbon pricing remains low
LNG and carbon prices fall back to 2013 levels, due to renewables decreasing demand. Petrol prices rising
Natural gas prices remain flat to better compete with renewable and storage technologies. Petrol prices continue to increase
Pool Spot Prices
South Australian peak prices highest in Australia, but high renewable generation driving volatile prices
Electricity pricing differential between peak and offpeak period increases due to increasing wind penetration
Renewables to be dispatched at right prices to balance generation load and push pool spot energy prices back to 2013 averages
Average spot prices continue to fall and become less volatile resulting from comparable generation mix operating costs, 2am now the peak demand period due to load shifting

talkingpower.com.au 19SA POWER NETWORKS FUTURE OPERATING MODEL 2013–2028
4. Our Roadmap to 2028
2013 2018 2023 2028
Customers and Community
New Connections
Average residential demand is 4 kVA (diversified), few commercial buildings include onsite generator
Load factor significantly declining due to rising energy efficiency and switch to solar PV
Developer use of embedded energy systems begins to impact diversified demand (kVA) and consumption (kWh)
Average kWh falls by 30% relative to 2013, network load factor begins to increase resulting from investment in network optimisation
Customer Profile
60% of customers have a smart phone, emerging use of online information services
Smart phone penetration at 80%; customers expect full smart phone service application and help with connecting their distributed generation
Customers with electric vehicles, renewable generation, battery storage and microgrids in need of new services
Sophisticated customer energy management systems automating network and market interactions
Community
Community engagement highlights desire for greater customer experience, consideration on visual amenity, importance of community safety and reliability and to support the evolving customer
Regional communities wanting increased security beginning to examine community based power alternatives
Community increasingly intolerant of new assets, rising energy prices or supply disruptions
Reliability of regional communities improves using microgrids
Distributed Energy Resources
Renewables
Solar PV adoption the highest in Australia at 20%, commercial market begins to take-off
Grid parity and leasing model drive 35% of domestic and 10% of commercial sites to install solar PV
Solar PV penetration begins to saturate at 60–70% of dwellings, network equipment installed to prevent self-disconnection becoming an issue
Rising penetration of storage begins to soak up excess solar at the LV and HV level
Thermal Generation
Trigeneration systems proposed for premium commercial and government properties
First residential CHP units hit the market, offering 1-3kW of power and hotwater at 85% efficiency
Competitive renewable prices limit role of trigen to niche new commercial and high density residential developments
Competitively priced natural gas leads to CHP in apartments and niche commercial buildings
Batteries and Electric Vehicles
First generation production scale electric vehicles on sale, 16 kWh battery capacity, 2.4 kW to 3.6 kW charge
Charging infrastructure limited to wider Adelaide; residential energy storage solutions emerge
Commercial storage solutions emerge for network and customer applications; must compete with Non-Network solutions and renewable technologies
Availability, choice and economics drive increasing rate of EV adoption to 30% of annual sales

20 talkingpower.com.au SA POWER NETWORKS FUTURE OPERATING MODEL 2013–2028
4. Our Roadmap to 2028
2013 2018 2023 2028
Network Performance
Reliability and Power QualityNetwork performance historically among the best in Australia
Targeted investment and operational initiatives maintain reliability in a growing two-way network
Greater renewables penetration and two way power flows increasingly impact power quality
Suburban network reliability cost effectively improved by 25% using network automation
Investment
A significant proportion of network assets approaching the originally intended design life
Substatial investment replacing aged assets and improve network automation
Advanced meter penetration high, enabling better customer service, reliability and retail competition. Investment in power quality increased
30% of assets replaced with greater intelligence; 1 PB of data generated each year
Operational Developments
Customer Service
New customer information channels and self-service options introduced; structured approach to priorities implemented
Contact centre capabilities establish industry leadership in communications, service levels and energy advice. Use of self-service channels expanding
Advanced metering enables on-demand services for customers and real-time status information
Non-network solutions are now first offerings to customers using expert systems
Network Development
Early technology roll out for Remote Monitoring and Control; ADMS, GIS and IT being upgraded
Planning and design changes made to accommodate visual amenity, customer-side technology and fit for purpose substations
Major network segmentation and meshing program developed as part of network automation initiative
Distributed energy resources and micro-grids fully integrated into network planning and operation
Asset Management
Increased levels of inspection introduced to support the move to condition based maintenance for increasingly aged assets
Modular asset specifications developed for asset replacement program
Predictive asset maintenance and automated inspection pilots rolled out across network
Maintenance strategy focusing on expanding predictive maintenance across assets and failure modes
Remote Monitoring and control
IT landscape being streamlined and integrated; core systems using services bus
Deploying Remote Monitoring and Control systems to enable network automation; unified data model implemented
Advanced network functionality and second generation infrastructure being rolled out
Real-time network optimisation and asset condition assessment functionality established
Field Operations
Depot of the Future and continuous improvement initiatives launched to improve operating effectiveness
Standardisation of designs, plant and equipment reduce substation delivery costs
Rules developed and systems identified to underpin greater automation and visibility to workers of assets and performance
Supply chain, scheduling, dispatch and network access automated; remote temporary depots deployed

talkingpower.com.au 21SA POWER NETWORKS FUTURE OPERATING MODEL 2013–2028
5. Our Network in 2028
By 2028, we expect targeted regulatory incentives, high energy costs, and the emergence and adoption of new customer- side energy technologies to have made a major impact on the way many of our customers connect to the network, how we design, build and operate it, and its level of performance. Although our network covers 178,200 square kilometres of South Australia, most of our customers and load are concentrated in the greater Adelaide metropolitan area and a few regional centres (see Figure 5.1).
SA Power Networks’ view of our future network configuration and performance, as well as the customers connected to it, therefore varies by network topology and location: • Urban — Meshed network serving greater
Adelaide and the Central Business District (CBD)
• Rural — Radial network serving regional communities and centres, eg Fleurieu Peninsula (Rural — Short)
• Remote — Single Wire Earth Return (SWER) network serving remote homesteads (Rural — Long)
Figure 5.1: SA Power Networks service area
Legend275kV Transmission line132kV Transmission linePower stationPumping stationSubstationAboriginal lands
Distributors:SA Power NetworksOther distributorsAboriginal lands (Managed by SA Power Networks)Remote areas electrical supply (Managed by SA Power Networks)
N
MARALINGA TJARUTJA LANDS
YALATALAND
ANANGUPIT JANT JAT JARA
YANKUNYT JAT JARALANDS

22 talkingpower.com.au SA POWER NETWORKS FUTURE OPERATING MODEL 2013–2028
5. Our Network in 2028
5.1 Urban Residential and commercial customer take-up of customer-side energy technologies is expected to be highest in our urban network, posing the greatest challenge to the network and current operating practices.
An increasing number of commercial, high density and medium density residential developments will be (or will approach) net zero energy, relying on renewable energy, onsite energy storage, demand management systems and trigeneration to minimise their network usage and charges while meeting their daily energy requirements.
The emergence of two-way power flows between some of the wealthier suburbs and neighbouring commercial centres will require the development of dynamic protection systems, distributed deployment of voltage regulators, and the introduction of a market clearing function to ensure least cost energy dispatch within the zone.
The rising cost of supporting customer-side energy technologies and maintaining reliability will lead to the deployment of a comprehensive enabling infrastructure comprising widespread sensors, controls and use of carrier grade telecommunication networks — enabling a step change in network performance.
Many of our line and earth fault indicators, voltage regulators, switches, reclosers, circuit breakers, online asset monitoring equipment, advanced meters and customer-side energy technologies will be connected and accessible in real-time by field staff, control room operators, engineers, customer service agents, and operational systems.
Figure 5.2: Urban residential customer of the future
Electric vehicles will be increasingly prevalent, offering a local source of storage, and an alternative method for transporting energy to the home.
Onsite energy storage will be used to balance the home’s available sources of electricity with generation at the lowest possible cost.
Solar PV will be less expensive than retail electricity, and cover unshaded portions of customers’ rooves.
Energy management systems (EMS) will be a standard feature in many homes, coordinating local generation, storage and consumption of energy.
Wind turbines suited to the turbulent, low wind suburban environment will increasingly be installed.
Onsite generation will be used to supply ultra-efficient electricity and heat. Excess electricity will be exported to the grid for sale.
Intelligent appliances will be networked with the EMS, which will manage their operating parameters according to customer’s cost and environmental preferences.
Sustainable building codes will minimise the energy used by the home, but not necessarily its peak demand.

talkingpower.com.au 23SA POWER NETWORKS FUTURE OPERATING MODEL 2013–2028
5. Our Network in 2028
This level of connectivity and control will be protected by an enhanced level of cyber security to ensure access to information and control functionality is restricted to authorised users and systems only.
Greater monitoring and control of our network and assets, a standardised information model, and an enterprise services bus connecting information flows between the various technical systems will underpin the development of an accurate, real-time network model, asset condition assessment, and dynamic network optimisation capability.
Our relentless focus on cost effectively improving customer reliability will lead to greater sectionalisation and interconnection of our suburban network. By 2028, average customers per feeder in urban areas will fall to 1,000 from 1,200 in 2013, and the average interconnection of zone substations will climb to 2.5 from 2 in 2013, meaning the network will be increasingly ‘meshed’ and flexible.
The result will be that most of our suburban customers experience far fewer sustained network outages, enjoy the benefits of improved power quality, and have the ability to connect a range of customer-side technologies affording them lower energy bills and a lower environmental impact than they are currently able to experience.
Figure 5.3: Medium density and mixed use customers utilising renewable generation technology and trigeneration

24 talkingpower.com.au SA POWER NETWORKS FUTURE OPERATING MODEL 2013–2028
5.2 Rural and Remote Rural customers and communities are expected to embrace solar PV, microwind and energy storage technologies as they become increasingly cost competitive with mains-supplied electricity, with the added benefit of higher reliability than the network alone.
The take-up of customer-side energy technologies in our rural network is expected to be the highest as a percentage of total customers, supported by our own distributed energy services and solutions aimed at maintaining or improving customer reliability at least cost.
Some rural customers and communities will have installed complete energy systems capable of running in an island mode to save money, improve reliability and reduce the environmental impact of trucking and burning fossil fuels.
SA Power Networks’ rural network and supporting control systems will be capable of integrating and utilising these ‘microgrids’ to further enhance overall network reliability during system disturbances and to minimise investment and operating costs, where feasible.
The availability of cost effective, non-network alternatives is expected to improve the reliability and power quality of our currently underserved customers at the end of long SWER lines. The SWER lines will remain in place, but they will increasingly serve a trickle charging function, topping-up rural energy storage systems (or even more isolated remote areas).
The rising value of losses, regulatory incentives and an improved capability to connect customer-side energy technologies is expected
to lead to the introduction of higher voltages to supply our rural network, where commercially and technically feasible.
Although network topology will limit the deployment of automation schemes across our rural network, greater asset monitoring and control capabilities will be in place to greatly reduce fault location and rectification times.
5. Our Network in 2028
Figure 5.4: Remote customer using DER to improve reliability and reduce costs
Onsite energy storage will be used to balance the home’s available sources of electricity with generation at the lowest possible cost.
Wind turbines will act as an additional source of electricity generation.
Solar PV will provide the home with onsite generation, enabling it to operate in ‘island mode’.
talkingpower.com.au 25SA POWER NETWORKS FUTURE OPERATING MODEL 2013–2028
5.3 Demand Side ParticipationThe continued take-up of distributed energy resources in urban and rural settings will provide flexibility of customer load, thus providing a means to reduce peak demands and improve network utilisation, resulting in lower network costs.
These benefits will accompany increased customer participation, supplied by:• Cost reflective tariffs: basing a portion
of a customer’s bill on peak demand requirements rather than energy consumption, reducing inequities and encouraging efficient investment and behavioural decisions by customers;
• Customer engagement: providing customers with the tools and knowledge to gain the benefits of more efficient use of energy; and
• Controlled load programs: to maximise and manage distributed energy resources to efficiently integrate renewables and other DER into our network.
More advanced meters that enable measurement of customer demand, help control distributed energy resources, and provide feedback to customers on their consumption patterns among other things, will underpin these approaches.
Ultimately, customers’ energy management systems will enable demand side participation to be automated, with their system automatically responding to pricing or load control signals from the network or other market participants to optimise energy usage in the customer’s premises.
5. Our Network in 2028
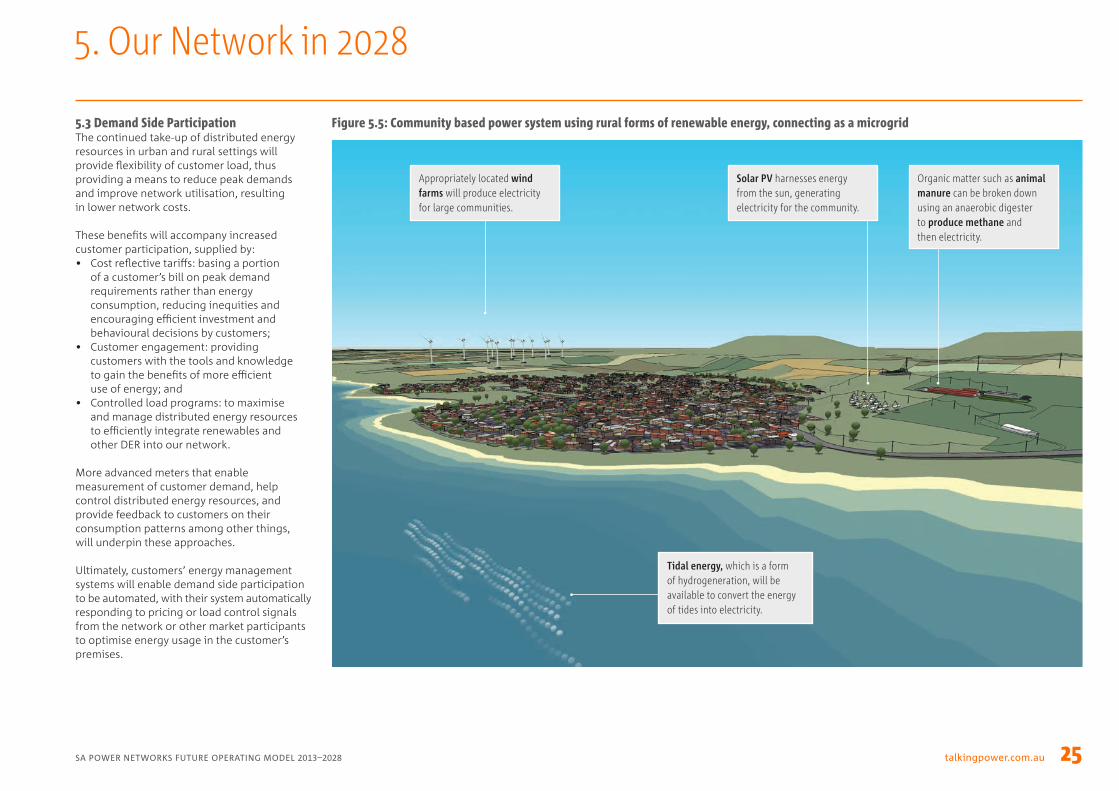
Figure 5.5: Community based power system using rural forms of renewable energy, connecting as a microgrid
Appropriately located wind farms will produce electricity for large communities.
Solar PV harnesses energy from the sun, generating electricity for the community.
Organic matter such as animal manure can be broken down using an anaerobic digester to produce methane and then electricity.
Tidal energy, which is a form of hydrogeneration, will be available to convert the energy of tides into electricity.

26 talkingpower.com.au SA POWER NETWORKS FUTURE OPERATING MODEL 2013–2028
5. Our Network in 2028
2013 2028
Urban Rural-Short Rural-Long Urban Rural-Short Rural-Long
Future Topology
Average Customers per Feeder 1,200 550 190 1,000 525 170
Automated Feeder Ties 0 0 0 180 60 0
Intelligent Assets
Switching Devices* 1,850 880 20 2,200 1,300 500
Voltage Regulation Schemes — Feeder 42 80 249 72 165 460
IEC 61850 Substations 0% 0% 0% 10% 5% 5%
Substation Transformers 80% 50% 25% 100% 100% 90%
Distribution Transformers** 0% 0% 0% 10% 10% 5%
Substation Energy Storage*** 0 0 0 0 4 0
Advanced Meters 3,400 0 0 900,000 60,000 6,000
* Switching devices will have other functionality incorporated (ie fault indication, outage notification)** Technology trials currently underway*** Significant technology advancement may increase the take-up of these units
Table 5.1 summarises a number of expected key changes to the make-up of our distribution network over 15 years to 2028

talkingpower.com.au 27SA POWER NETWORKS FUTURE OPERATING MODEL 2013–2028
5. Our Network in 2028
2013 2028
Urban Rural-Short Rural-Long Urban Rural-Short Rural-Long
Intelligent Functions
Monitoring and Control Some Some None Yes Yes Some
Distribution Automation Some Some None Yes Yes Some
Customer Technology Integration None None None Yes Yes Some
Real-time Volt-Var Optimisation None None None Yes Yes Yes
Real-time Asset Assessment None None None Yes Some Some
Real-time Configuration Optimisation None None None Yes Some Some
Network Performance
Electric Vehicles Connected*** 30 10 0 60,000/5% 4,000 100
Solar PV Connected 25% 7% 1% 60% 40% 5%
Microwind Connected <1% <1% <1% 2% 7% 7%
Tri/Cogeneration Connected <1% <1% 0 2% 1% <1%
Microgrids Connected 0 1 0 150 50 100
Distribution Losses 6% 10% 12% 6% 8% 10%

28 talkingpower.com.au SA POWER NETWORKS FUTURE OPERATING MODEL 2013–2028
6. Key Operations in 2028
Changes in our future operating environment over the next 15 years, particularly the areas highlighted in the business drivers section, will require commensurate changes in our Future Operating Model. The following sections detail how we expect our core business processes of serving and connecting customers, developing the network, managing our assets, and restoring supply to our customers will operate in 2028.
6.1 Customer ServiceThe rapid rise in smart phone ownership, increasingly technology savvy customers, and expectations of tailored, 24/7 access to information and service are driving a change in how we expect to provide customer service to our customers in the future.
Customer service of the future will be proactive, and delivered over a wide range of communication channels, in addition to human interactions. This will be enabled by information systems containing an up-to-date, end-to-end view of the customer, including their preferences, contact history, and relevant network outage or construction activity.
By 2028 we expect customer interactions to increase. While the normal customer interactions with field staff for connections or repairs will remain constant, there will be increased demand from customers wanting tailored information from us, relating to new and potentially complex matters, including smart technologies and innovations in tariffs.
This information may be technical in nature or related to activity that directly affects the customer and we will need to provide relevant information to help guide their decisions. This information will be delivered through their preferred communications method and will need to be timely, consistent and accurate.
Using the wide range of channels, customers can expect a consistent level of service and information, irrespective of the channel. There will be full visibility within our business of the end-to-end interaction so if customers switch channels, we will still be able to deliver a prompt and efficient response.
6.2 Customer Connections SA Power Networks provides customer connection services to property developers, electricians and retailers on behalf of their end user customers. The connection of property developments is handled by our network Customer Solutions team, while individual properties are dealt with by the Connection Services group.
Increased penetration of customer-side energy technologies will require new approaches to quoting and connecting customers, and potentially new services to ensure customers continue to be able to access a safe, reliable supply at an affordable price.
An entirely new way of quoting, pricing and connecting customers will be required in the special circumstance of a micro-grid development or property, which will be able to supply much or all of its own energy under normal circumstances, but may also be contracted to provide network support services, or wish to trade excess energy in the market.
These types of customers will be placed on some form of backup supply tariff to recover the cost of the network capacity SA Power Networks will still be expected to provide.
The introduction of cost reflective pricing down to the residential level using advanced metering will drive a change in customer behaviour and investment. By providing an incentive to reduce peak network usage through capacity based charges, average maximum demand for new residential connections is expected to fall from 4 kVA to 3 kVA by 2028.
Major process changes are expected to include greater process transparency and efficiency through increased automation, the move to a paperless process, and improved customer data integration that will enable ‘shadowing’ of customer assets in our systems during their development.
Connection Requests The majority of connection requests where suitable infrastructure already exists will be made online and will be automatically processed by our workflow system, which will improve efficiency and transparency. The online quotation system will allow electricians to self-serve, automatically generating connection quotations that will feed into works management and load forecasting systems once approved.
Retailer requests received through our business-to-business digital gateway for re-energisation or de-energisation of already connected sites will be automatically processed by our Advanced Metering Infrastructure (AMI) system, which will be able to turn power on or off remotely through the meter on the exact day and time requested.
More complex connections, or where the connection could impact the network, will still require a more detailed site investigation and review by Network Planning. The introduction of more sophisticated network planning tools will help minimise the number needing significant engineering attention.
talkingpower.com.au 29SA POWER NETWORKS FUTURE OPERATING MODEL 2013–2028
6. Key Operations in 2028
Customer Connections — Customer Service New customer needs and raised expectations regarding the timeliness, accuracy and availability of information will drive changes in SA Power Networks’ customer connection services.
Customers will have greater control over the timing of routine connections, though this control may come at a premium cost where Demand Side Response (DSR) is used to create a special network access window. This will be supported by the greater use of accredited service providers, which will help avoid internal resource constraints.
Connection service customers will be able to monitor and manage their connection requests online in real-time, or via existing telephone and email channels. Any delays or requests for additional information will be notified to them using their preferred methods of contact.
In addition to the range of network engineering services we currently offer, we expect to be offering a range of complementary distributed energy solutions and related installation, management and maintenance services.
Invoices for connection services will be made available online or via email, except by special request, and most forms of electronic payment will be accepted.
Connection Planning Customer Project Managers, who are currently responsible for managing complex customer connections, will increasingly specialise in particular types of customer-side energy technologies, eg trigeneration, energy storage or renewables, in order to provide an efficient service.
Network Planning and Engineering Services will continue to play a major role in the planning and design of the 10% of major customer connections where the connection arrangements are complex, or there is the potential for a major network impact, eg microgrids.
Network Planning and Engineering Services will increasingly be called upon to integrate customer-side energy technologies into network planning and operational processes. This will require additional assets, (eg voltage regulators), and systems interfaces between DSR and the Advanced Distribution Management System (ADMS).
The availability of robust forecasting and load flow information down to the HV and LV levels will provide greater visibility to Network Planners and enable them to be less conservative in their estimates, potentially reducing connection costs. These connection costs may be further reduced by allowing SA Power Networks to manage some portion of load.
Managing fault levels associated with greater customer connection of customer-side energy technologies will be a major network planning and design consideration, encouraged by regulatory incentives to maximise network access for these efficient, low carbon energy sources.
Connection Services SA Power Networks anticipates that the harmonisation of state-based technical and access regulations will lead to the introduction of a competitive market for simple customer connections and asset relocation services in South Australia, which will also be an opportunity for new unregulated revenue.
Accredited Service Provider (ASP) schemes have been operating in Queensland and New South Wales for many years, enabling network businesses there to focus their resources on more complex and high value activities.
Managing an ASP scheme will require additional engineering resources to validate and approve ASP designs, the hiring and training of Installation Inspectors to inspect the quality of their work, and new supporting systems and processes.
Asset designs, technical information, and ‘as-built’ drawings created during the customer connection process will be exchanged using standard industry formats. Temporary data will automatically appear as ‘shadowed’ in our technical systems, and made ‘live’ upon commissioning.

30 talkingpower.com.au SA POWER NETWORKS FUTURE OPERATING MODEL 2013–2028
6.3 Network Development The deployment of greater remote monitoring and control technology will have a profound impact on our network development processes, and the roles and systems that underpin them.
SA Power Networks will continue to develop and implement network projects to improve reliability, provide additional capacity and replacement of end of life assets, but we will be able to deliver them more efficiently through better information, asset sharing, greater standardisation and access to cost effective non-network alternatives.
Substation of the FutureThe fundamental design of our substations has remained largely unchanged over the past 50 years — serving to transform high voltage ‘bulk energy’ from the transmission and sub-transmission networks into voltages suitable to distribute electrical energy to the local region.
However, community and technology forces are driving major changes in how substations will be developed and designed in the future.
The most obvious change will be the visual appearance of substations, with a greater focus on design elements that enable them to be sensitive to their surroundings. Such elements will be jointly designed in consultation with the local community. In the city, architectural screening techniques will be used widely, whereas in the country, stands of vegetation will ensure substations are barely visible from roadways.
However, more technical aspects of substation design will also be changing. The dramatic growth in embedded micro-generation will mean that substations must now play a key role in enabling the ‘two-way grid’ — managing network configuration, protection and voltage levels in a grid where energy may be flowing along feeders either to or from customers. New technologies will also be apparent, eg energy storage systems may be used to defer network upgrades, and optical fibre being used to connect relays and substation plant rather than copper wiring.
Figure 6.1: Substations of the future will be sensitive to their surroundings

talkingpower.com.au 31SA POWER NETWORKS FUTURE OPERATING MODEL 2013–2028
Network Optimisation The ADMS will forecast daily loads across our network area, reconfiguring it dynamically using remotely controlled switches to optimise the network configuration, minimising losses, maximising network access, and avoiding most asset overload situations.
Asset loadings will be based on prevailing environmental conditions, updated in real-time. The ADMS will enable higher loading when temperatures are cooler or winds are high. Real-time dynamic rating and greater DSR will enable us to increase our average level of asset utilisation.
Where anticipated short-term network constraints are not alleviated through network reconfiguration, the ADMS will schedule additional capacity using cost effective non-network alternatives registered in the DSR system, potentially generating a small payment to customers.
Constraint Identification Longer-term network planning activities will utilise the ADMS’s long-term forecasting engine, combined with scheduled customer connection information and registered non-network solutions, to determine the timing, placement, size and nature of network projects for reliability, replacement and augmentation expenditure.
The long-term constraint identification process will be automatically updated on a daily basis, generating reports regarding the expected state of the network across annual, 5 year, 10 year and longer-term time horizons. This information will be accessible across the organisation by suitably authorised personnel.
The long-term network forecasting process will develop an initial, optimised program of network projects to address anticipated needs using formalised business rules, standardised network options, and current market information regarding non-network alternatives.
Changes in network security standards to a more probabilistic approach will enable forecasted loads and credible contingencies to be met by more non-network alternatives (where they are least cost), reducing the average cost of meeting our statutory obligations.
The availability and integration of non-network solutions into network planning, operation and support systems could allow Network Planning to defer up to one third of some network projects by more than two to three years on average, saving costs.
Project Development Once a project need has been identified by the system and approved by Network Planning, suppliers of non-network options will be notified and invited to tender for deferring the identified constraint. The most appropriate option will be implemented.
Network projects will utilise low impact designs and streamlined construction methods to satisfy reasonable community demands while keeping project cost low.
Project costs will be minimised through use of standardised asset building blocks, plant and system designs, which will also help streamline the design process and lead to greater throughput potential.
Asset configurations will be optimised using sophisticated network planning tools capable of identifying the best overall design given SA Power Networks’ specific cost, security, reliability and safety performance ranking criteria.
The integration of planning, project and works management systems will automate procurement and resource planning of approved projects, providing all parties with full transparency regarding project staging and the supply chain.
Works Management Materials, contracted services and internal labour for approved projects will be automatically sourced and scheduled by the Works Management System (WMS), which will be monitored and controlled by the project manager through a personally configured project management portal.
Scheduling optimisation, greater asset standardisation, prefabricated modular design components, and solid state secondary systems will help link all work to individual assets and reduce the complexity, effort and time needed to complete and connect new substations.
Access to the network to connect new assets will be scheduled based on negotiations between the WMS and ADMS, with pre-commissioning tests carried out using the self-diagnostic capabilities of the intelligent assets.
All ‘shadowed’ information and data created as part of the development of a new network asset, eg ‘as-built’ drawings and technical manuals, will be immediately made ‘live’ in our systems and available to field, control room and engineering staff upon commissioning.
6.4 Asset Management In the future, our assets will behave more like a modern car, telling us when they require a tune-up, a minor part replaced, or a major overhaul.
The management of older assets will also be revolutionised by the real-time availability of detailed asset loading and condition information, enabling predictive and condition based asset management practices.
Finally, a more intelligent and dynamically managed network will help reduce asset wear-and-tear from overloading, poor power quality, animal contact and vegetation.
The result of these step changes in asset management capability will be a substantial drop in in-service asset failures, improved reliability, and lower operating and maintenance costs.
The downside to increased asset and network intelligence will be the need to manage associated asset software and data, which will cover hundreds of thousands of devices.

32 talkingpower.com.au SA POWER NETWORKS FUTURE OPERATING MODEL 2013–2028
6. Key Operations in 2028
Asset AssessmentManual inspections will be reduced by as much as one third by online sensors, airborne drone-based video capture and aircraft-based LIDAR survey techniques. High accuracy monitoring equipment will be used to capture detailed voltage, current and harmonic information.
Each asset will be issued with a unique identifier that will enable unprecedented monitoring of individual assets, including investment, maintenance and condition histories, and support improved management of entire asset populations.
The retrofitting of more asset monitoring and the introduction of advanced metering will generate an enormous amount of data, which must be collected, processed, stored and made available to SA Power Networks personnel.
Asset data streamed from the field will be fed into our Asset Management System (AMS), which will use sophisticated modelling to identify specific patterns that indicate a potential failure in its infancy, or signify that it is time to trim encroaching vegetation.
Figure 6.2: Remote asset inspections will be enabled by advances in airborne drone technology
talkingpower.com.au 33SA POWER NETWORKS FUTURE OPERATING MODEL 2013–2028
6. Key Operations in 2028
Maintenance Planning Optimised maintenance strategies and programs will be developed by the AMS based on each asset’s actual operation, environmental conditions, loading and SA Power Networks’ Risk and Asset Management Policies.
Asset populations nearing the end of their useful lives will be automatically nominated for replacement or refurbishment when they are in breach of SA Power Networks’ risk policy or the required capital expenditure is lower cost than the expected ongoing maintenance expenditure.
Again, the integration of maintenance and works management systems will help automate procurement and resource planning of approved maintenance activities, providing all parties with full transparency regarding program delivery, critical spares and the supply chain.
Works Management Routine maintenance will be automatically processed by our WMS, which will also coordinate network access and resources via interfaces with the respective systems.
Asset maintenance tasks for field crews will be optimised across real-time, daily, weekly and longer time horizons to support the optimisation of dispatch, scheduling, rostering and resourcing functions.
Preventative tasks will focus on manual inspections and maintenance of older assets with limited real-time assessment monitoring and increasingly frequent maintenance requirements.
Newer, more intelligent assets and those amenable to online monitoring and predictive maintenance techniques will enable a growing number of maintenance tasks to be dynamically determined.
The identification of an early asset failure by an intelligent asset or the predictive capabilities of SA Power Networks’ AMS will be notified in real-time to the WMS, which will determine and schedule the most appropriate response.
Work on critical assets with a high likelihood of a near-term failure will be dispatched to nearby field crews for immediate attention. Dynamic network reconfiguration will provide asset access without interrupting customer supply.
6.5 Supply Restoration A complete, real-time view of our network status down to the individual customer level, combined with an automated fault response capability, will greatly improve our ability to restore customers without supply.
Similar to network planning and asset management processes, a more intelligent network and supporting operational practices such as those enabled by depots of the future will drive a step change in our performance, often by preventing a customer outage in the first place.
Network Optimisation Active network optimisation by the ADMS will identify more critical asset overloads before they happen, automatically rerouting power or calling on Demand Side Resources (DSR) to avoid asset failures.
The network will be dynamically configured in response to network emergencies, such as adjusting protection settings in advance of lightning storms, or scheduling additional embedded storage or generation during heat waves to support peak cooling load.
Asset Assessment Real-time, computer assisted asset condition assessment will be used to address many of our key outage drivers before they occur, including vegetation overgrowth, conductor clashing, protection mal-operations and early asset condition-induced failures.
Fault Detection and Response The deployment of advanced metering infrastructure will mean that we are notified whenever a single customer is without supply, instead of waiting for that customer to contact us, often after hours when returning home in the evening.
When outages are detected either through our extensive sensor network or via customer reports, our Outage Management System (OMS) will work in conjunction with other operational systems including the Geographic Information System (GIS) to pinpoint the affected assets, their location and the likely cause.
Using an up-to-date network model, our ADMS system will identify the most appropriate switching to return supply to the greatest number of customers in the shortest amount of time. Utilising ‘point and click’ functionality, switching restoration schemes will be implemented in under one minute.
Control Room Operators will monitor and validate ADMS operations and recommendations using its real-time visualisation of the network status, and advanced what-if scenario functionality.

34 talkingpower.com.au SA POWER NETWORKS FUTURE OPERATING MODEL 2013–2028
Figure 6.3 illustrates the impact of an increasingly sectionalised network. In 2028, a fault that occurs on the blue feeder will mean that only customers in the orange shaded area will experience a prolonged interruption (as opposed to the entire blue shaded area today). Remotely operated switches A and B will be operated to isolate the fault. The feeder tie at point C and substation circuit breaker at point D will be operated to ensure that supply is restored within one minute to the remaining areas shaded in blue, thereby significantly reducing the number of customers impacted by the fault.
6. Key Operations in 2028
Figure 6.3: In 2028, the urban network will be increasingly interconnected and able to automatically isolate faults, restoring power to the maximum number of customers
A B
D
C
LegendFeeder tie with remotely operated switch and sensor (normally open)Remotely operated switch with sensor (normally closed)Sensor onlyTransformerExternal feederZone substationFault

talkingpower.com.au 35SA POWER NETWORKS FUTURE OPERATING MODEL 2013–2028
6. Key Operations in 2028
Depot of the FutureChanges in the way we expect to design, build, operate and maintain our network over the next fifteen years may require a change in the location, design and operation of our depots. Key drivers include community requirements for sensitive low impact operations, and greater expected use of prefabricated and standardised assets, just-in-time inventory, and external business partners for service delivery.
Depots of the Future will utilise design that is environmentally sustainable, standardised, sensitive to their surroundings, and away from residential areas. They will feature safety in design and integrated logistics for efficient vehicle, pedestrian and materials storage and movement. The location of depots will allow the service areas to be optimised creating faster response times for supply restoration and better employee to customer ratios.
Figure 6.4: Depots will feature safety in design and integrated logistics for efficient vehicle, pedestrian and materials storage and movement

36 talkingpower.com.au SA POWER NETWORKS FUTURE OPERATING MODEL 2013–2028
Supply Restoration — Customer Service Our Interactive Voice Response (IVR) system will be updated in real-time with information regarding customers affected by outages, the nature of the outage, and an estimate of the time to restore supply.
Customers who apply will receive a notification when we identify a probable outage at their premises, including the nature of the outage and expected restoration time.
We will proactively notify our customers during extreme conditions such as a prolonged heatwave or storm, greatly reducing the impact on the contact centre while keeping customers updated through SMS, smart phone applications or their in-home energy management system.
Customers calling into our contact centre will have their entire service history and real-time supply status available to the Customer Service Agent prior to being connected to ensure a consistent and satisfying service experience. The Customer Service Agent will be able to use the AMI system to instantly confirm customer outage queries by querying the meter in real-time. Customers will be offered a quote to repair faults on their side of the meter. Those of our customers supplied by microgrids or other back-up forms of supply will automatically disconnect from the network and operate in island mode until it is safe to re-connect them.
6. Key Operations in 2028
Figure 6.5: Customers will receive real time notification and information on the status of electricity supply to their homes
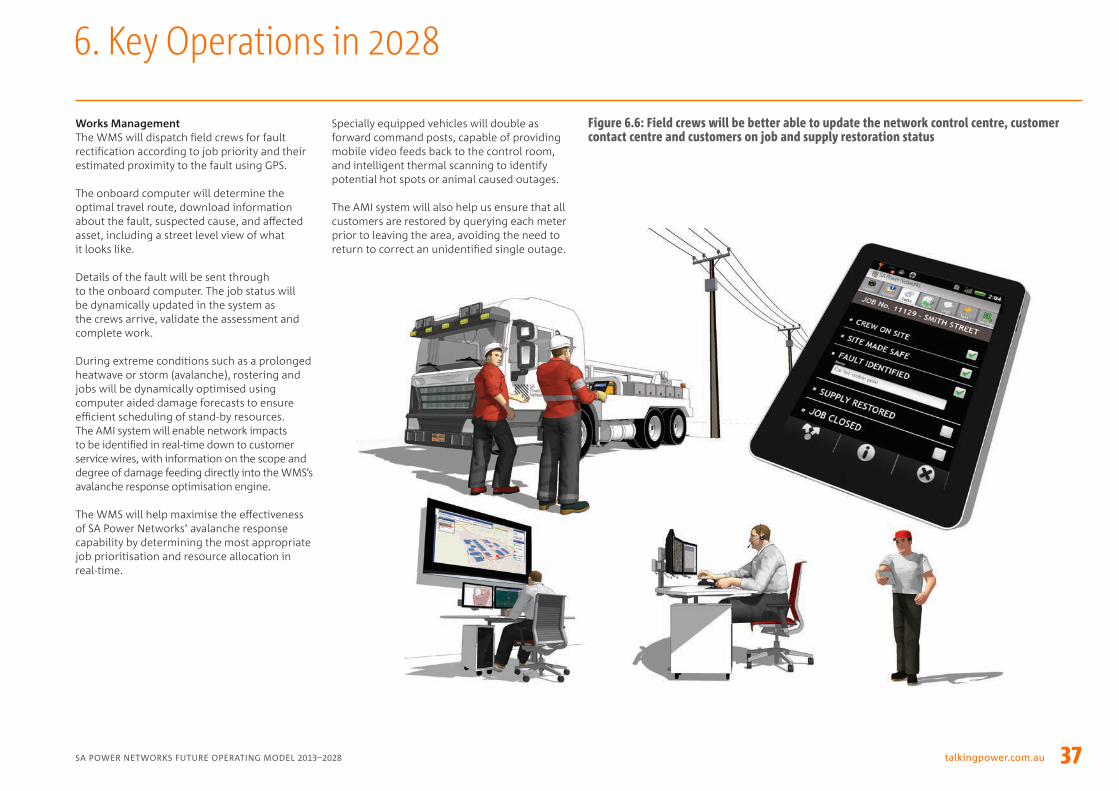
talkingpower.com.au 37SA POWER NETWORKS FUTURE OPERATING MODEL 2013–2028
Works Management The WMS will dispatch field crews for fault rectification according to job priority and their estimated proximity to the fault using GPS.
The onboard computer will determine the optimal travel route, download information about the fault, suspected cause, and affected asset, including a street level view of what it looks like.
Details of the fault will be sent through to the onboard computer. The job status will be dynamically updated in the system as the crews arrive, validate the assessment and complete work.
During extreme conditions such as a prolonged heatwave or storm (avalanche), rostering and jobs will be dynamically optimised using computer aided damage forecasts to ensure efficient scheduling of stand-by resources. The AMI system will enable network impacts to be identified in real-time down to customer service wires, with information on the scope and degree of damage feeding directly into the WMS’s avalanche response optimisation engine.
The WMS will help maximise the effectiveness of SA Power Networks’ avalanche response capability by determining the most appropriate job prioritisation and resource allocation in real-time.
Specially equipped vehicles will double as forward command posts, capable of providing mobile video feeds back to the control room, and intelligent thermal scanning to identify potential hot spots or animal caused outages.
The AMI system will also help us ensure that all customers are restored by querying each meter prior to leaving the area, avoiding the need to return to correct an unidentified single outage.
6. Key Operations in 2028
Figure 6.6: Field crews will be better able to update the network control centre, customer contact centre and customers on job and supply restoration status

38 talkingpower.com.au SA POWER NETWORKS FUTURE OPERATING MODEL 2013–2028
Having an engaged, skilled and safe workforce is critical to the success of our business, and it will continue to be as important in 2028 as it is today. Our investments in the technology, assets and processes described in this document will be matched by our ongoing investment in the development of our people.
The introduction of new technology into the business will enable us to perform our existing roles more efficiently and effectively, but will require us to learn to use new tools and techniques.
Our customers’ evolving needs and expectations will require us to develop new skills and capabilities, such as knowledge of customer-side energy technologies and decentralised system planning and operation.
Changes in stakeholder expectations will require adjustments in how we currently perform work, including how we design substations, manage vegetation and respond during emergencies.
In 2028 our leaders will have led their high performing work groups through these changes and challenges. They will actively encourage innovation and creativity, and foster an environment where employees are empowered and inspired to achieve their personal goals and to work together to accomplish great things for the organisation.
While every role in SA Power Networks supports the success of our business, we have used the following roles as examples to illustrate the expected impact of our Future Operating Model on our day to day activities.
7.1 Customer Project ManagerChanging customer connection needs, greater use of online, integrated planning tools, the introduction of an Accredited Service Provider (ASP) scheme and higher service level expectations will be the key changes facing a future Customer Project Manager (CPM).
CPMs will be able to view and manage customer requests in real-time using a customised portal. This will provide up-to-date information regarding the number and nature of customer requests, highlighting anything exceptional for their attention and potential action.
The Customer Connection System will automate the connection process for routine customer connections, particularly for electricians in the suburban network. CPMs will therefore focus on developing connection solutions for more complex requests, which will typically be larger or involve customer-side energy technologies.
By accessing systems with pre-loaded templates of customer connection solutions and a complete picture of the current and expected future network, CPMs will be able to perform more of the project development activities currently undertaken by Network Planning.
CPMs will also become more specialised in DER technologies and solutions, with expertise in EV charging infrastructure, renewables, microgrids, load control platforms, trigeneration and cogeneration, and energy storage.
Specialised knowledge and expertise will enable them to determine the most appropriate solution for customers wishing to connect, whether it involves technical integration with our network or the development of a complete solution.
7. Key Roles in 2028
Figure 7.1: An SA Power Networks Project Officer works with a customer on the connection of a new EV charging station to the network

talkingpower.com.au 39SA POWER NETWORKS FUTURE OPERATING MODEL 2013–2028
7.2 Customer Service Agent Customer Service Agents (CSA) in 2028 will have access to detailed, up-to-date information regarding a single view of customers, the network, projects and service requests in an integrated portal.
This will aid in providing customers with detailed information regarding faults and planned outages, emergencies and connections, as well as the range of value added services offered by SA Power Networks’ unregulated business.
With most customers choosing the convenience and lower cost option of self-service, CSAs are likely to encounter more complex queries or having to educate less technologically aware customers.
The CSA role will shift towards a greater focus on being the central customer champion within the organisation, monitoring and improving service levels on behalf of their ‘clients’.
They will also be charged with playing a key role in improving the organisation’s commercial performance, by identifying opportunities to reduce servicing costs or increase revenues through provision of new services.
This may include becoming a trusted advisor to customers or the wide range of value-added distributed energy services available to them, such as signing up for a premium reliability package.
The use of a number of communications channels including the IVR, effective voice recognition technology and proactive notification broadcasts will free up CSAs’ time to focus on customers in crisis such as during extreme weather events.
7. Key Roles in 2028
Figure 7.2: Customer Service Agents will have access to up-to-date customer service history and network information
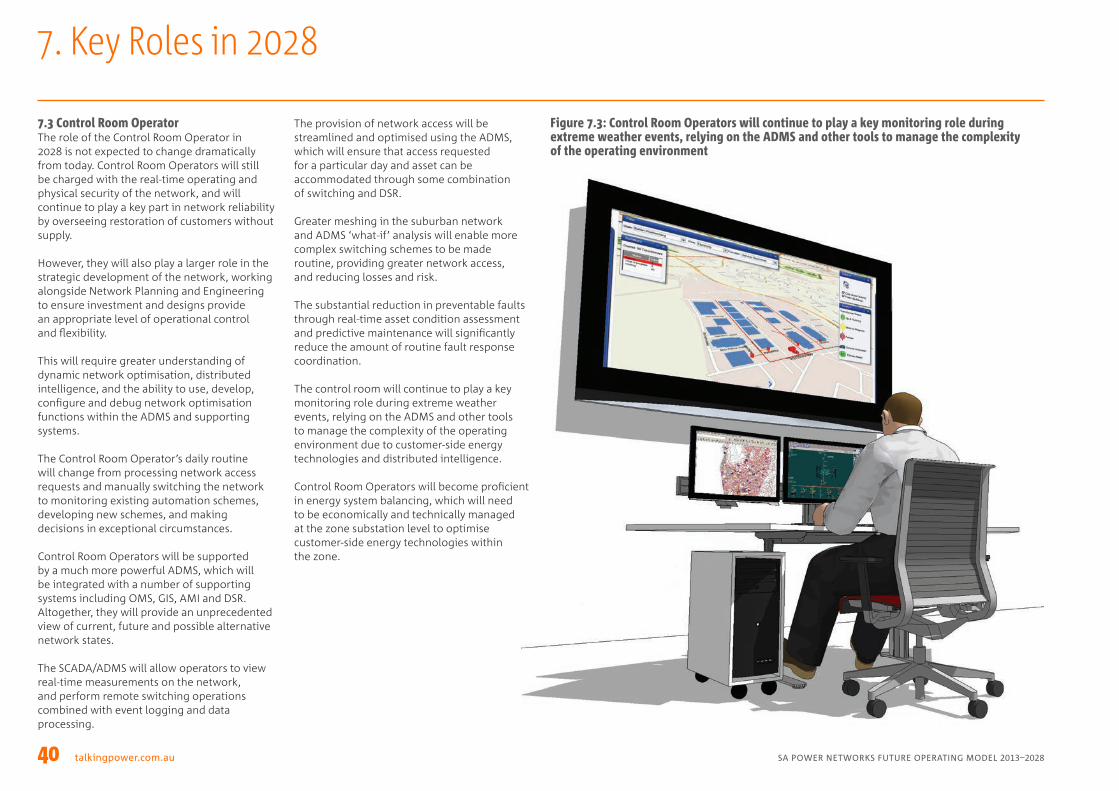
40 talkingpower.com.au SA POWER NETWORKS FUTURE OPERATING MODEL 2013–2028
7.3 Control Room Operator The role of the Control Room Operator in 2028 is not expected to change dramatically from today. Control Room Operators will still be charged with the real-time operating and physical security of the network, and will continue to play a key part in network reliability by overseeing restoration of customers without supply.
However, they will also play a larger role in the strategic development of the network, working alongside Network Planning and Engineering to ensure investment and designs provide an appropriate level of operational control and flexibility.
This will require greater understanding of dynamic network optimisation, distributed intelligence, and the ability to use, develop, configure and debug network optimisation functions within the ADMS and supporting systems.
The Control Room Operator’s daily routine will change from processing network access requests and manually switching the network to monitoring existing automation schemes, developing new schemes, and making decisions in exceptional circumstances.
Control Room Operators will be supported by a much more powerful ADMS, which will be integrated with a number of supporting systems including OMS, GIS, AMI and DSR. Altogether, they will provide an unprecedented view of current, future and possible alternative network states.
The SCADA/ADMS will allow operators to view real-time measurements on the network, and perform remote switching operations combined with event logging and data processing.
The provision of network access will be streamlined and optimised using the ADMS, which will ensure that access requested for a particular day and asset can be accommodated through some combination of switching and DSR.
Greater meshing in the suburban network and ADMS ‘what-if’ analysis will enable more complex switching schemes to be made routine, providing greater network access, and reducing losses and risk.
The substantial reduction in preventable faults through real-time asset condition assessment and predictive maintenance will significantly reduce the amount of routine fault response coordination.
The control room will continue to play a key monitoring role during extreme weather events, relying on the ADMS and other tools to manage the complexity of the operating environment due to customer-side energy technologies and distributed intelligence.
Control Room Operators will become proficient in energy system balancing, which will need to be economically and technically managed at the zone substation level to optimise customer-side energy technologies within the zone.
7. Key Roles in 2028
Figure 7.3: Control Room Operators will continue to play a key monitoring role during extreme weather events, relying on the ADMS and other tools to manage the complexity of the operating environment

talkingpower.com.au 41SA POWER NETWORKS FUTURE OPERATING MODEL 2013–2028
7.4 Network Planner Network Planners in 2028 will continue to ensure that the network is planned to comply with statutory levels of security and reliability while meeting all credible load growth at least cost.
Much of today’s routine work reviewing connection requests, developing forecasts, and identifying and addressing emerging network constraints will be relieved to some degree by the ADMS and network planning software.
These systems will provide Network Planners and other authorised personnel with up-to-date forecasts of asset constraints, and generate optimised development programs and interconnection schemes given SA Power Networks’ business rules.
Although standard approaches will come with the network planning toolkit, Planners will still need to determine the business rules, project building blocks and interconnection schemes appropriate for SA Power Networks’ network.
More complex planning tasks will be supported by sophisticated planning software, capable of performing complex ‘what-if’ scenarios, and integrating the safety, reliability, cost and technical performance of various network as well as non-network options, (eg distributed storage and generation).
The growing penetration of customer-side energy technologies and greater degree of network meshing, monitoring and control will challenge Network Planners from a complexity perspective, while providing them with an unprecedented opportunity to optimise the network’s long-term technical and commercial performance and potential.
Network Planners will be more knowledgeable in the integrated planning of energy systems. They will also be able to effectively plan for the associated two-way power flows, power quality issues and fault levels driven by the rising number of customer-side energy technologies connecting to the network.
They will also spend more time investigating strategic network topologies, voltages and configuration options that take advantage of newly emerging network planning techniques, customer-side energy technologies and rapidly evolving network technology.
This will include the widespread and strategic application of a number of existing planning practices, including the use of thermal inertia to meet peak demand, sharing assets between substations and utilising non-network alternatives under controlled conditions.
7. Key Roles in 2028
Figure 7.4: Network Planners will be supported by sophisticated planning software, capable of integrating the safety, reliability, cost and technical performance of various network and non-network options
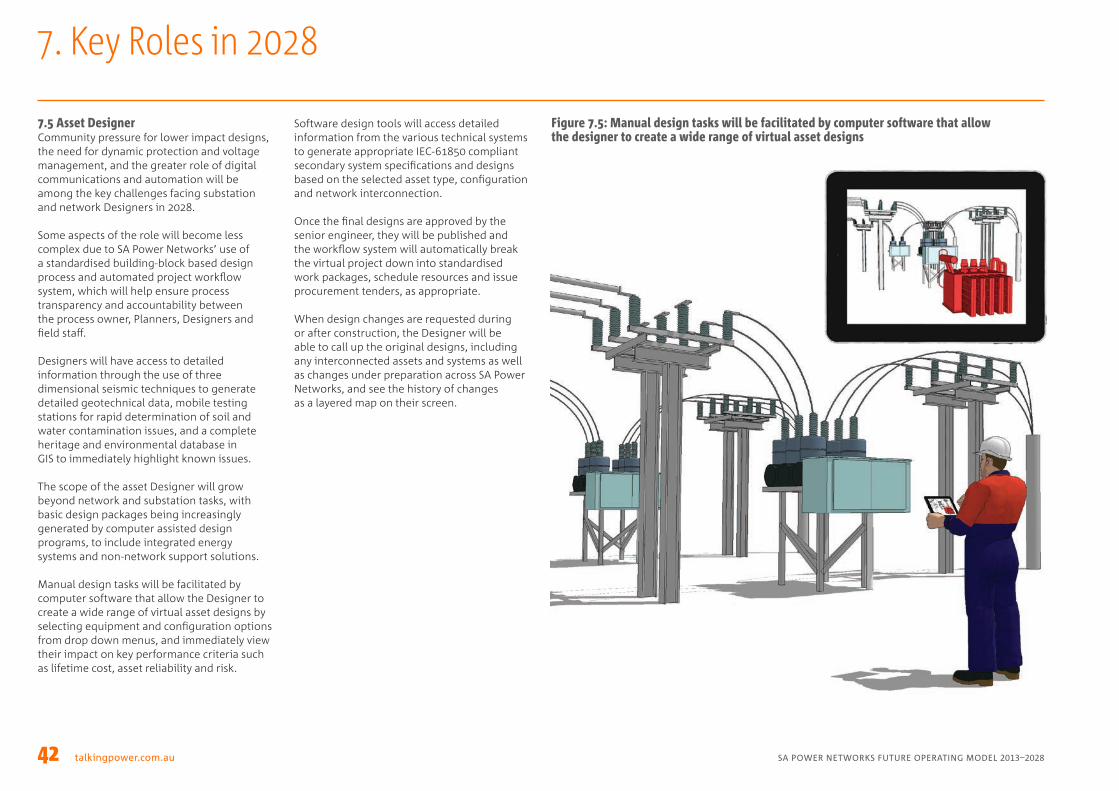
42 talkingpower.com.au SA POWER NETWORKS FUTURE OPERATING MODEL 2013–2028
7.5 Asset Designer Community pressure for lower impact designs, the need for dynamic protection and voltage management, and the greater role of digital communications and automation will be among the key challenges facing substation and network Designers in 2028.
Some aspects of the role will become less complex due to SA Power Networks’ use of a standardised building-block based design process and automated project workflow system, which will help ensure process transparency and accountability between the process owner, Planners, Designers and field staff.
Designers will have access to detailed information through the use of three dimensional seismic techniques to generate detailed geotechnical data, mobile testing stations for rapid determination of soil and water contamination issues, and a complete heritage and environmental database in GIS to immediately highlight known issues.
The scope of the asset Designer will grow beyond network and substation tasks, with basic design packages being increasingly generated by computer assisted design programs, to include integrated energy systems and non-network support solutions.
Manual design tasks will be facilitated by computer software that allow the Designer to create a wide range of virtual asset designs by selecting equipment and configuration options from drop down menus, and immediately view their impact on key performance criteria such as lifetime cost, asset reliability and risk.
Software design tools will access detailed information from the various technical systems to generate appropriate IEC-61850 compliant secondary system specifications and designs based on the selected asset type, configuration and network interconnection.
Once the final designs are approved by the senior engineer, they will be published and the workflow system will automatically break the virtual project down into standardised work packages, schedule resources and issue procurement tenders, as appropriate.
When design changes are requested during or after construction, the Designer will be able to call up the original designs, including any interconnected assets and systems as well as changes under preparation across SA Power Networks, and see the history of changes as a layered map on their screen.
Figure 7.5: Manual design tasks will be facilitated by computer software that allow the designer to create a wide range of virtual asset designs
7. Key Roles in 2028

talkingpower.com.au 43SA POWER NETWORKS FUTURE OPERATING MODEL 2013–2028
7.6 Field Crew Member The role of field crews is unlikely to change dramatically between the present and 2028, though they will have access to a range of new tools, equipment and systems that will help them perform their work more effectively and efficiently.
The deployment of more intelligence across our network and assets will require our field crews to have a greater understanding of telecommunication and information technology assets.
The construction of new network assets will involve more onsite integration of prefabricated components, the installation of fibre optic instead of copper cables for protection and communications, and the configuration and testing of substation ‘routers’ or information buses.
Commissioning, diagnosing and maintaining these assets will require the use of specialised, often digital tools, which our field crews will be trained to use, just as they are trained to use meggers and other specialised tools today.
Work will be issued electronically to vehicle onboard computer systems, which will also hold detailed, up-to-date information on all our network customers and assets, including their service histories, assessed condition and current configuration.
Our field crew’s ability to respond to faults will be greatly improved through computer assisted identification, characterisation and location of the fault, and the efficient dispatch of nearby work crews. The ADMS will also ensure network status information is made available via the Intranet.
Our fleet vehicles will feature significantly more onboard computing power and technology, including: • three dimensional viewing of complex asset
information; • ability to access real-time information
on asset performance and history; and • a video camera for onsite consultations
with remote staff.
Much of our fleet vehicles, including Elevated Work Platforms, are likely to be electric and at least partially powered by zero carbon, renewable energy.
7. Key Roles in 2028
Figure 7.6: The construction of new network assets will involve more onsite integration of prefabricated components which will assist field crews in improving construction times
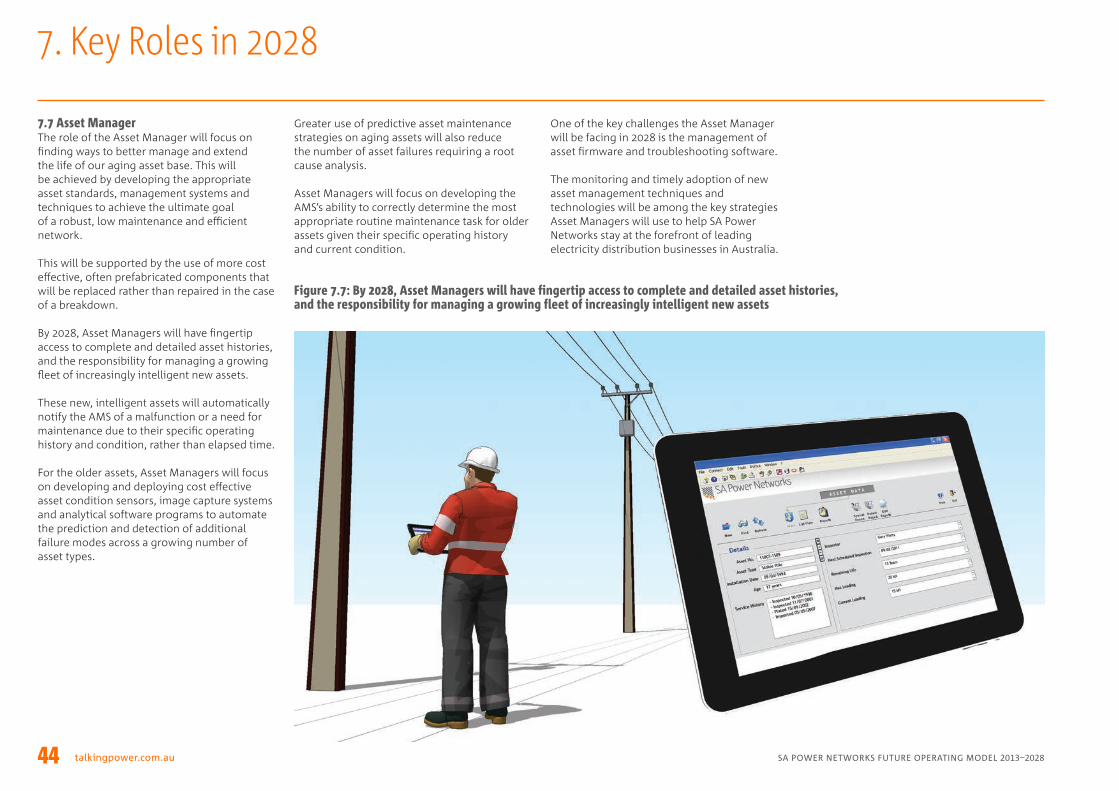
44 talkingpower.com.au SA POWER NETWORKS FUTURE OPERATING MODEL 2013–2028
7.7 Asset Manager The role of the Asset Manager will focus on finding ways to better manage and extend the life of our aging asset base. This will be achieved by developing the appropriate asset standards, management systems and techniques to achieve the ultimate goal of a robust, low maintenance and efficient network.
This will be supported by the use of more cost effective, often prefabricated components that will be replaced rather than repaired in the case of a breakdown.
By 2028, Asset Managers will have fingertip access to complete and detailed asset histories, and the responsibility for managing a growing fleet of increasingly intelligent new assets.
These new, intelligent assets will automatically notify the AMS of a malfunction or a need for maintenance due to their specific operating history and condition, rather than elapsed time.
For the older assets, Asset Managers will focus on developing and deploying cost effective asset condition sensors, image capture systems and analytical software programs to automate the prediction and detection of additional failure modes across a growing number of asset types.
Greater use of predictive asset maintenance strategies on aging assets will also reduce the number of asset failures requiring a root cause analysis.
Asset Managers will focus on developing the AMS’s ability to correctly determine the most appropriate routine maintenance task for older assets given their specific operating history and current condition.
One of the key challenges the Asset Manager will be facing in 2028 is the management of asset firmware and troubleshooting software.
The monitoring and timely adoption of new asset management techniques and technologies will be among the key strategies Asset Managers will use to help SA Power Networks stay at the forefront of leading electricity distribution businesses in Australia.
7. Key Roles in 2028
Figure 7.7: By 2028, Asset Managers will have fingertip access to complete and detailed asset histories, and the responsibility for managing a growing fleet of increasingly intelligent new assets

talkingpower.com.au 45SA POWER NETWORKS FUTURE OPERATING MODEL 2013–2028
7. Key Roles in 2028
7.8 Supporting RolesWhile the above roles detail specific examples it is also important to recognise supporting roles that will be required to enable this vision. Such roles include but are not limited to IT, Consumer Engagement and Workforce Development.
ITWith the increase in technology covering a myriad of areas, IT will be a key supporting role in 2028. There will be a need for integrating systems, dealing with intelligent assets and the associated data generated as well as the operation and maintenance of complex data systems.
Consumer and Community EngagementIn 2013, consumer and community engagement is emerging as a priority area with requirements being stipulated in new regulations. By 2028 this role will be required to be embedded within SA Power Networks to ensure we work with the community on matters such as visual amenity and bushfire management, among many other things.
Workforce Development Workforce Development will prove vital to retaining existing knowledge as a significant portion of our workforce retires over the coming years. This role will focus not just on current knowledge but also on beginning to transition the workforce to develop the skills and knowledge to deal with the host of new technology and expectations.
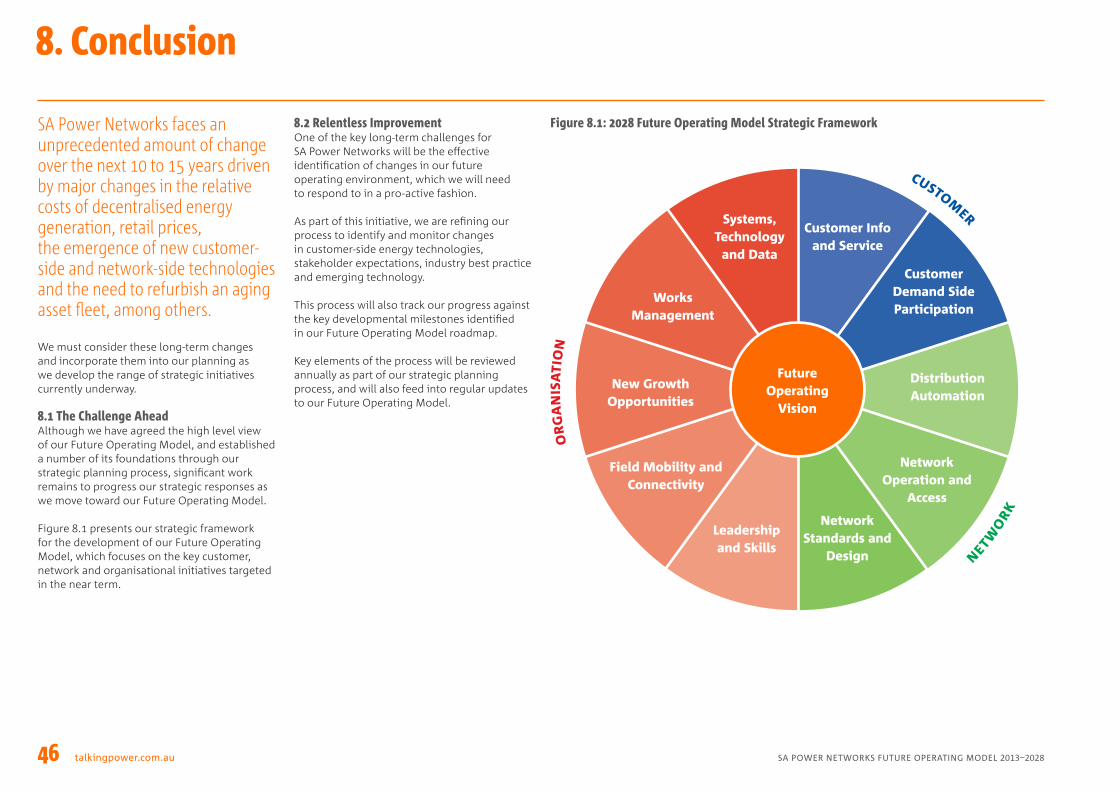
46 talkingpower.com.au SA POWER NETWORKS FUTURE OPERATING MODEL 2013–2028
8. Conclusion
SA Power Networks faces an unprecedented amount of change over the next 10 to 15 years driven by major changes in the relative costs of decentralised energy generation, retail prices, the emergence of new customer-side and network-side technologies and the need to refurbish an aging asset fleet, among others.
We must consider these long-term changes and incorporate them into our planning as we develop the range of strategic initiatives currently underway.
8.1 The Challenge Ahead Although we have agreed the high level view of our Future Operating Model, and established a number of its foundations through our strategic planning process, significant work remains to progress our strategic responses as we move toward our Future Operating Model.
Figure 8.1 presents our strategic framework for the development of our Future Operating Model, which focuses on the key customer, network and organisational initiatives targeted in the near term.
8.2 Relentless Improvement One of the key long-term challenges for SA Power Networks will be the effective identification of changes in our future operating environment, which we will need to respond to in a pro-active fashion.
As part of this initiative, we are refining our process to identify and monitor changes in customer-side energy technologies, stakeholder expectations, industry best practice and emerging technology.
This process will also track our progress against the key developmental milestones identified in our Future Operating Model roadmap.
Key elements of the process will be reviewed annually as part of our strategic planning process, and will also feed into regular updates to our Future Operating Model.
Figure 8.1: 2028 Future Operating Model Strategic Framework
Future Operating
Vision
Customer Info and Service
Customer Demand SideParticipation
Distribution Automation
Network Operation and
Access
Network Standards and
Design
Leadershipand Skills
Field Mobility and Connectivity
New Growth Opportunities
Works Management
Systems, Technology
and Data
OR
GA
NIS
ATI
ON
CUSTOMER
NETWO
RK

talkingpower.com.au 47SA POWER NETWORKS FUTURE OPERATING MODEL 2013–2028
ADMS Advanced Distribution Management System AER Australian Energy Regulator AMI Advanced Metering Infrastructure AMS Asset Management System ASP Accredited Service Provider CHP Combined Heat and Power CIS Customer Information System CPM Customer Project ManagerCSA Customer Service Agent DER Distributed Energy Resources DSR Demand Side Response EV Electric Vehicle GIS Geospatial Information System GPS Global Positioning System HV High Voltage IEC International Electrotechnical Commission IVR Interactive Voice Response kVA Kilovolt-ampere kW Kilowatt kWh Kilowatt-hour LNG Liquefied Natural Gas LV Low Voltage MW Megawatt MWh Megawatt-hour NEM National Electricity Market OMS Outage Management System PV Photo-Voltaic SWER Single Wire Earth Return WMS Works Management System
9. Abbreviations

48 talkingpower.com.au SA POWER NETWORKS FUTURE OPERATING MODEL 2013–2028


www.sapowernetworks.com.au3252