atomic force spectroscopies: a toolbox for probing the biological
TRANSCRIPT
1
Atomic Force Spectroscopies: A Toolbox for Probing the Biological Matter
Michele Giocondo et al.* CNR-IPCF, Institute for Chemical and Physical Processes, National Research Council
Italy
1. Introduction
Since its introduction in the early 1980’s (Binnig et al., 1986), scanning probe microscopy (SPM) has shown its huge potential for the investigation of the matter at the micro- and nano- scale. In the following years, many variants have been introduced, exploiting electrostatic, magnetic or van der Waals-like forces acting between the sample surface and the probe. In the present chapter, we will be concerned with the latter, also known as atomic force microscopy (AFM). The heart of an atomic force microscope is a sharp tip attached to the extremity of a flexible cantilever, that interacts with the sample surface while the sample is scanned under the tip. The interaction forces between the tip and the sample cause the bending of the cantilever. When the sample is scanned under the tip, the tiny movements of the cantilever are detected by an optical lever system (a device for magnifying small angular displacements of a rotating body, exploiting the reflection of a fixed laser beam over a small mirror attached to the body) producing a spot of light whose position is measured, and they are used as the basis to reconstruct a pseudo-3D image of the sample surface. An atomic force microscope offers the possibility to operate in many different modes (namely: contact, non-contact and intermittent-contact modes), making this technique extremely versatile as it can be adapted to many classes of materials, from the solid state to the biological molecules. According to the sample stiffness, one can adopt the most suitable operating mode in order to reduce or even prevent any damage of the observed specimen.
Nowadays, AFM has proven as an essential tool for the analysis of microbial systems. Emerging methods have rapidly been implemented to make them available to biologists and there exists a great potential for future applications of this technique to biological systems. At the level of the whole cell, AFM has provided an integrated analysis of how the microbial cell exploits its environment through the cell surface. At the macromolecular level, AFM investigation into the properties of surface macromolecules and the energies associated with
*Said Houmadi1, Emanuela Bruno1,2, Maria P. De Santo1,2, Luca De Stefano3, Emmanuelle Lacaze4, Sara Longobardi5 and Paola Giardina5 1CNR-IPCF, Institute for Chemical and Physical Processes, National Research Council, Italy 2Department of Physics, Università della Calabria, Italy 3CNR-IMM Institute for Microelectronics and Microsystems, National Research Council, Italy 4CNRS-INSP Institute of Nano-Sciences National Scientific Research Council, France 5Dept. of Organic Chemistry and Biochemistry, University of Naples “Federico II”, Italy
www.intechopen.com
Atomic Force Microscopy Investigations into Biology – From Cell to Protein
4
their conformation and functionality has helped unravel the complex interactions of microbial cells (Casuso et al., 2011; Wright et al., 2010). AFM has been used for the characterization of marine gel network and marine biopolymers self-assembly, which are not accessible by other techniques (Radic et al., 2011). Moreover, submolecular details of protein surfaces can be identified and conformational changes visualized. It allows visualization of macromolecules without labelling, and provides information on the sizes and forms of protein complexes (Baclayon et al., 2010). Indeed AFM is now recognized as the tool of choice for studying biomolecular machines at work, allowing direct observation of function-related structural changes induced by variation of temperature, pH, ionic strength.
Probably the most striking results have been obtained on membrane proteins using contact mode imaging (Muller et al., 2011). The case of membrane proteins is particularly interesting because they are, due to their amphiphilic character, inherently difficult to study with other techniques. Not only can membrane protein surfaces be imaged in their native environment and their oligomeric states resolved, but conformational changes can be visualized, and the forces dictating protein folding in the presence or absence of ligands can be assessed. Moreover, unlike other local probe microscopy such as scanning tunneling microscopy (STM), the AFM offers the possibility to investigate any type of samples (conductor, semiconductor, insulator, inorganic and organic) but also can work under controlled conditions like ultra-high vacuum (UHV) or under physiological liquid environments like the ones required in biological membrane domain. This makes it a very useful instrument for probing these kind of samples.
AFM techniques are normally used for surface imaging. Length and height measurements for surface features can be easily performed on micrometric and nanometric scale and statistically analyzed (roughness, size dispersion). Nevertheless, beyond the bare surface imaging, an AFM can perform much more sophisticated analyses based on the possibility to measure the forces acting between the probing tip and the sample surface, or some other quantities strictly connected to the interaction force details such as the cantilever resonance frequency shift or/and the phase lag between the driving signal and the cantilever response, when in non-contact or intermittent-contact mode. These operating modes are grouped under the common hat of atomic force spectroscopy (AFS). Thanks to the very accurate positioning allowed by the piezoelectric scanners and to the closed-loop feedback control, it is possible to perform the sampling of the interaction forces as a function of the tip-sample gap. These forces can be measured in a static mode, the “so-called” repulsive or contact mode, or in a more indirect manner in the dynamical regime, occurring in the non-contact mode, exploiting the attractive region of the interaction force, and the tapping mode that in rough can be considered as a combination of the remaining.
Because of the extreme weakness of the measurable forces, and the related possibility to tune the sample perturbation, AFS is a powerful tool to probe fragile samples, such as biological molecules like proteins in particular. Many nanoscopic features can be revealed by this technique, ranging from hydropathy to visco-elasticity. Moreover, sample patterning in the physical-chemical properties can be revealed by the combined use of AFS with AFM topographic imaging.
This chapter is devoted to a review of the available atomic force spectroscopic modes and their application to the biological matter. Section 2 is devoted to a short introduction to the
www.intechopen.com
Atomic Force Spectroscopies: A Toolbox for Probing the Biological Matter
5
AFM fundamentals; in Section 3 the theoretical basis of AFM is presented; finally, in Section 4 applications of force spectroscopy to biological and soft materials are presented along with experimental details and a discussion of some relevant experiments.
2. AFM fundamentals
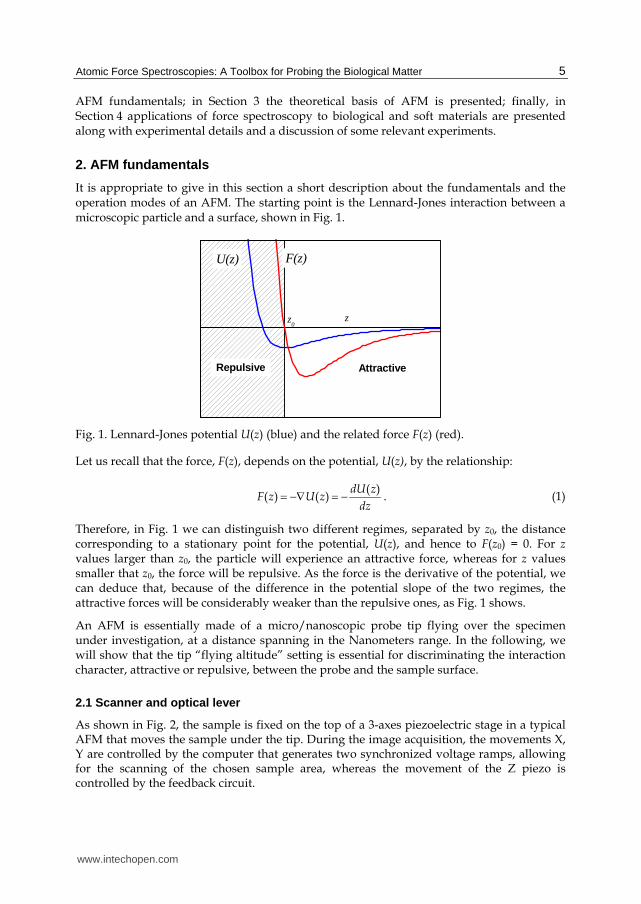
It is appropriate to give in this section a short description about the fundamentals and the operation modes of an AFM. The starting point is the Lennard-Jones interaction between a microscopic particle and a surface, shown in Fig. 1.
z0
U(z)
Repulsive
z
F(z)
Attractive
Fig. 1. Lennard-Jones potential U(z) (blue) and the related force F(z) (red).
Let us recall that the force, F(z), depends on the potential, U(z), by the relationship:
( )
( ) ( )dU z
F z U zdz
. (1)
Therefore, in Fig. 1 we can distinguish two different regimes, separated by z0, the distance corresponding to a stationary point for the potential, U(z), and hence to F(z0) = 0. For z values larger than z0, the particle will experience an attractive force, whereas for z values smaller that z0, the force will be repulsive. As the force is the derivative of the potential, we can deduce that, because of the difference in the potential slope of the two regimes, the attractive forces will be considerably weaker than the repulsive ones, as Fig. 1 shows.
An AFM is essentially made of a micro/nanoscopic probe tip flying over the specimen under investigation, at a distance spanning in the Nanometers range. In the following, we will show that the tip “flying altitude” setting is essential for discriminating the interaction character, attractive or repulsive, between the probe and the sample surface.
2.1 Scanner and optical lever
As shown in Fig. 2, the sample is fixed on the top of a 3-axes piezoelectric stage in a typical AFM that moves the sample under the tip. During the image acquisition, the movements X, Y are controlled by the computer that generates two synchronized voltage ramps, allowing for the scanning of the chosen sample area, whereas the movement of the Z piezo is controlled by the feedback circuit.
www.intechopen.com
Atomic Force Microscopy Investigations into Biology – From Cell to Protein
6
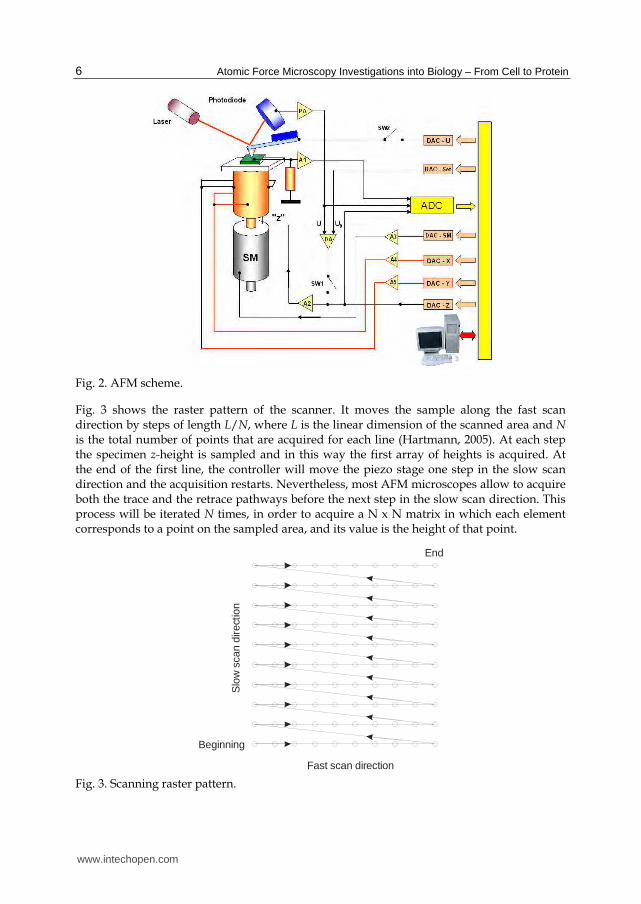
Fig. 2. AFM scheme.
Fig. 3 shows the raster pattern of the scanner. It moves the sample along the fast scan direction by steps of length L/N, where L is the linear dimension of the scanned area and N is the total number of points that are acquired for each line (Hartmann, 2005). At each step the specimen z-height is sampled and in this way the first array of heights is acquired. At the end of the first line, the controller will move the piezo stage one step in the slow scan direction and the acquisition restarts. Nevertheless, most AFM microscopes allow to acquire both the trace and the retrace pathways before the next step in the slow scan direction. This process will be iterated N times, in order to acquire a N x N matrix in which each element corresponds to a point on the sampled area, and its value is the height of that point.
Beginning
End
Fast scan direction
Slo
w s
can
dire
ctio
n
Fig. 3. Scanning raster pattern.
www.intechopen.com

Atomic Force Spectroscopies: A Toolbox for Probing the Biological Matter
7
In short, there are three operating modes in SFM: contact, non-contact, and tapping (also called intermittent contact) mode. The coarse positioning is accomplished by step motors that are driven by the control system, allowing the automatic approach of the tip to the sample. The same software allows for the acquisition of multiple images of the sample area at high resolution, particularly useful for imaging living tissues. The AFM head stage contains the optical system, consisting of the laser and photodiode, for the detection of the micro lever deflection (Fig. 2).
The cantilever bends up and down when the sample is scanned under the tip due to the interaction forces between the tip and the sample, providing information on the sample height. Depending on the sample roughness, the movement of the cantilever can be very small, less than 1 nm. A detection system that is able to record such tiny variation in the cantilever bending is required. The system is also known as optical lever and it is composed by a laser diode and a two or a four segments photodiode. The laser diode is equipped with a lens that provides a spot size in the order of a few microns. The laser is fixed at the top of the head through a plate that can be adjusted across two micrometric screws, in order to focus the spot on the cantilever. The beam reflected by the cantilever is directed towards the centre of a two or four quadrants photodetector; the last can record simultaneously the vertical and horizontal displacement of the spot. The optical system (Fig. 4) can thus measure two quantities: the deflection of the cantilever due to the attractive or repulsive force, Fz, (topography) and the torsion of the cantilever due to the lateral component of the interaction force, FL, of the tip-surface force (friction force).
Fig. 4. Optical detection scheme of the cantilever deflection.
The deflection in either the vertical or lateral direction is determined by suitably combining the four quadrants output, i.e. (A + B) : (C + D) or (A + C) : (B + D), where A, B, C, and D are the respective output voltages proportional to the beam intensity on each quadrant. (Bhushan, 2003)
2.2 AFM operating modes
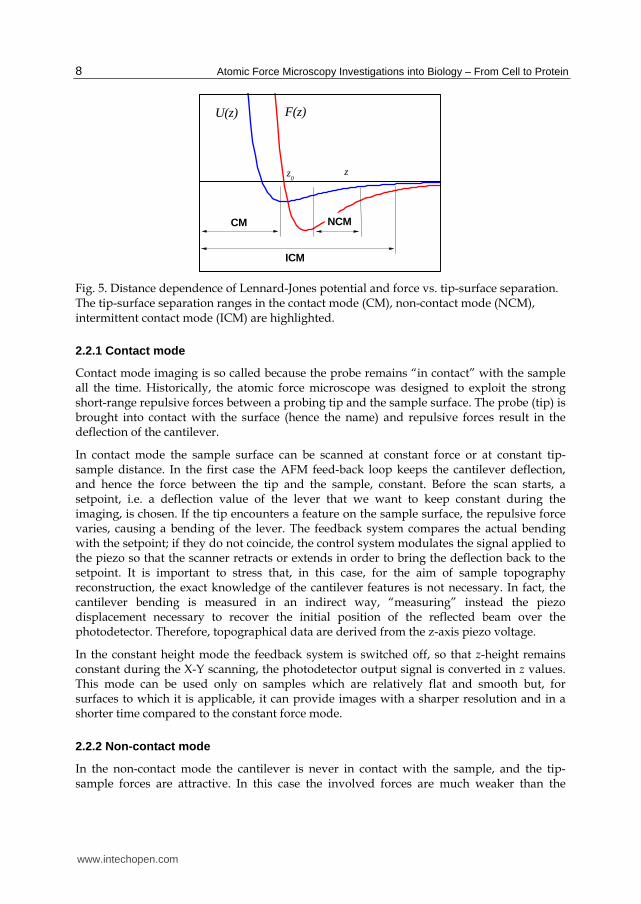
In describing the operating AFM modes usually we refer to the main interaction forces between the tip and the sample, coming from the Lennard-Jones interaction. In Fig. 5 it is depicted the potential and the related force acting between the tip and the sample as a function of the distance z.
www.intechopen.com
Atomic Force Microscopy Investigations into Biology – From Cell to Protein
8
z0
U(z)
ICM
CM
z
F(z)
NCM
Fig. 5. Distance dependence of Lennard-Jones potential and force vs. tip-surface separation. The tip-surface separation ranges in the contact mode (CM), non-contact mode (NCM), intermittent contact mode (ICM) are highlighted.
2.2.1 Contact mode
Contact mode imaging is so called because the probe remains “in contact” with the sample all the time. Historically, the atomic force microscope was designed to exploit the strong short-range repulsive forces between a probing tip and the sample surface. The probe (tip) is brought into contact with the surface (hence the name) and repulsive forces result in the deflection of the cantilever.
In contact mode the sample surface can be scanned at constant force or at constant tip- sample distance. In the first case the AFM feed-back loop keeps the cantilever deflection, and hence the force between the tip and the sample, constant. Before the scan starts, a setpoint, i.e. a deflection value of the lever that we want to keep constant during the imaging, is chosen. If the tip encounters a feature on the sample surface, the repulsive force varies, causing a bending of the lever. The feedback system compares the actual bending with the setpoint; if they do not coincide, the control system modulates the signal applied to the piezo so that the scanner retracts or extends in order to bring the deflection back to the setpoint. It is important to stress that, in this case, for the aim of sample topography reconstruction, the exact knowledge of the cantilever features is not necessary. In fact, the cantilever bending is measured in an indirect way, “measuring” instead the piezo displacement necessary to recover the initial position of the reflected beam over the photodetector. Therefore, topographical data are derived from the z-axis piezo voltage.
In the constant height mode the feedback system is switched off, so that z-height remains constant during the X-Y scanning, the photodetector output signal is converted in z values. This mode can be used only on samples which are relatively flat and smooth but, for surfaces to which it is applicable, it can provide images with a sharper resolution and in a shorter time compared to the constant force mode.
2.2.2 Non-contact mode
In the non-contact mode the cantilever is never in contact with the sample, and the tip-sample forces are attractive. In this case the involved forces are much weaker than the
www.intechopen.com
Atomic Force Spectroscopies: A Toolbox for Probing the Biological Matter
9
contact mode case, and hence a more sensitive and sophisticated detection technique, instead of the bare cantilever displacement, is required.
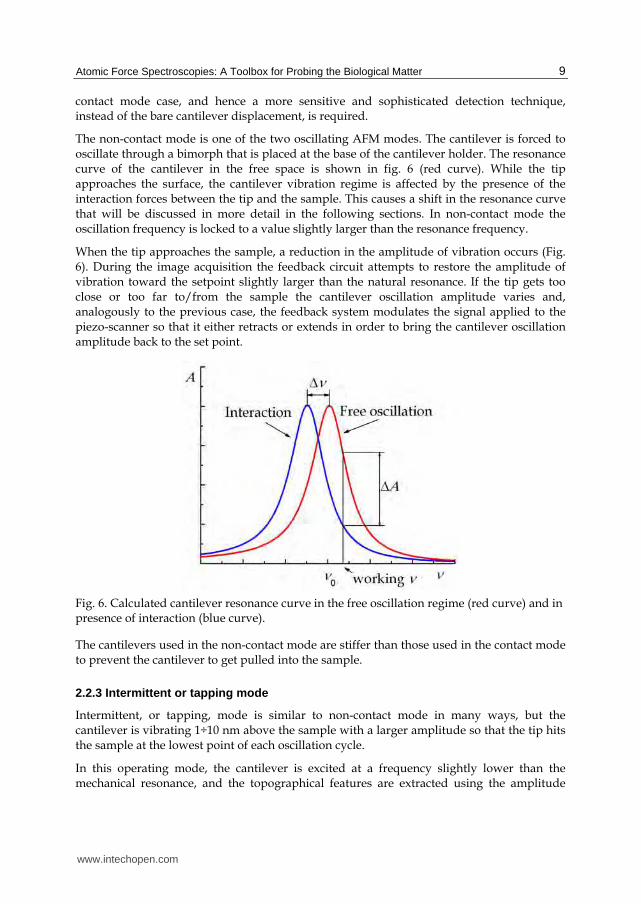
The non-contact mode is one of the two oscillating AFM modes. The cantilever is forced to oscillate through a bimorph that is placed at the base of the cantilever holder. The resonance curve of the cantilever in the free space is shown in fig. 6 (red curve). While the tip approaches the surface, the cantilever vibration regime is affected by the presence of the interaction forces between the tip and the sample. This causes a shift in the resonance curve that will be discussed in more detail in the following sections. In non-contact mode the oscillation frequency is locked to a value slightly larger than the resonance frequency.
When the tip approaches the sample, a reduction in the amplitude of vibration occurs (Fig. 6). During the image acquisition the feedback circuit attempts to restore the amplitude of vibration toward the setpoint slightly larger than the natural resonance. If the tip gets too close or too far to/from the sample the cantilever oscillation amplitude varies and, analogously to the previous case, the feedback system modulates the signal applied to the piezo-scanner so that it either retracts or extends in order to bring the cantilever oscillation amplitude back to the set point.
Fig. 6. Calculated cantilever resonance curve in the free oscillation regime (red curve) and in presence of interaction (blue curve).
The cantilevers used in the non-contact mode are stiffer than those used in the contact mode to prevent the cantilever to get pulled into the sample.
2.2.3 Intermittent or tapping mode
Intermittent, or tapping, mode is similar to non-contact mode in many ways, but the cantilever is vibrating 1÷10 nm above the sample with a larger amplitude so that the tip hits the sample at the lowest point of each oscillation cycle.
In this operating mode, the cantilever is excited at a frequency slightly lower than the mechanical resonance, and the topographical features are extracted using the amplitude
www.intechopen.com
Atomic Force Microscopy Investigations into Biology – From Cell to Protein
10
modulation due to the forces generated by the intermittent interaction between the AFM tip and the sample. Tapping mode is possible at ambient temperature; however, the non-contact and intermittent modes of operation are easier in vacuum where the damping of cantilever oscillations is negligible, allowing for a much sharper resonance peak of the cantilever and hence higher sensitivity while measuring the shift in resonance frequency (Gauthier & Tsukada, 1999; Gauthier et al., 2001; Gauthier & Pérez, 2002; Giessibl, 1997, Giessibl & Bielefeldt 2000, Hong et al., 1999; Jarvis et al., 2001; Martìnez & Garcia., 2006; Matsushige, 2001). Tapping mode is the most used operating mode in biology. It is not disruptive for fragile samples since it eliminates completely friction forces between the tip and the sample that are dominant in contact mode. At the same time its resolution is better than in the no contact mode, in which the tip is in average farer from the sample.
3. AFM spectroscopic modes
Spectroscopy in AFM, in both static and dynamic modes, is a powerful technique to reach a deep insight in the properties of the sample surfaces beyond topography, as it allows the measurement of forces in the nN range. There are several theories describing the interaction between a tip and a sample surface that become very refined when they go to dynamic modes. Here we will introduce the main interaction forces between a tip and a sample and how they can be visualized in the static and dynamic AFM modes.
3.1 Interaction between microscopic bodies: A spherical tip and a flat surface
When describing the interaction between a tip and a sample the best starting point is the interaction between two atoms or small molecules. Usually, we refer to van der Waals interaction that is made of three main contributions: the Keesom interaction (between existing dipoles), the Debye interaction (between dipole-induced dipole), and the London interaction (dispersion forces of quantum mechanical nature). van der Waals interaction is long ranged (r > 10 nm) and can be expressed as:
6 6dip ind disp
vdW
C C CCw
r r
(2)
Where C is a constant that takes into account the polarization properties of the two atoms or small molecules. At very small molecular separations, the electronic clouds of atoms overlap, giving rise to very strong repulsive forces.
The potential that better describes the interaction between two atoms or small molecules, including also the attractive van der Waals interaction, was proposed in 1931 by John Lennard-Jones:
12 6
( ) 4w rr r
(3)
where is the minimum energy andis the diameter of a sphere approximating the atom or molecule. When calculating the interaction between microscopic bodies, other forces have to be taken into account together with the afore mentioned van der Waals forces, i.e. electrostatic, adhesion and capillary forces.
www.intechopen.com
Atomic Force Spectroscopies: A Toolbox for Probing the Biological Matter
11
We can calculate the van der Waals attractive force between macroscopic bodies in vacuum, under proper approximations, taking into account the densities and the shapes of the two bodies. For example, the interaction energy between a flat surface and a tip, approximated by a sphere of radius R, can be obtained adding up the pairwise interactions between all the molecules in the tip and in the surface, and be expressed as (Israelachvili, 1992):
206( )
HRF
d a (4)
H is the Hamaker constant that accounts for the material density and polarizability, featuring a typical value of 10-19 J for the condensed phase in vacuum. d is the distance between the tip and the sample and a0 is an intramolecular distance introduced to avoid the force divergence at the contact. For a tip with a curvature radius R = 10 nm, d = 3Å and H = 10-19 J, van der Waals forces are about F = 1.9 nN.
As mentioned above, other forces are involved in the interaction between a tip and a flat surface. As an example, electrostatic forces can be very strong and long ranged, and their intensity depends on how charges are positioned in the media involved in the interaction. Fortunately, in air the electrostatic interaction forces can be minimized with proper experimental devices as, for example, grounding the tip.
During the contact between the tip and the surface, adhesion forces play an important role. We introduce a few fundamental concepts on adhesion. We define “work of adhesion” as the free energy exchange needed to separate two unit areas, 1 and 2, from the contact, and bring them to an infinite distance. For two different media this energy is called work of adhesion W12, while for identical media the energy is called work of cohesion W11. The surface energy or surface tension is the energy necessary to increase the body surface of one unit area. The process of creation of a unit area can be seen as the energy necessary to separate two half areas from the contact then, the work of cohesion is related to the surface tension as W11/2. For solid media 1 is denoted as S while for liquid media 1 = L. When the surfaces are immersed in a third medium such as water vapor, few water molecules can be adsorbed on the surfaces causing the surface tension to lowers to new values SV or LV.
In the interaction between the tip and the sample the surface deformation due to the mechanical contact between the two surfaces must be taken into account. This deformation depends on the applied force and on the material properties. There are several models that describe this phenomenon. In particular, Johnson-Kendall-Roberts (JKR) and Derjaguin-Muller-Toporov (DMT) have provided analytical relationships between deformation and applied force. These models are used as standard models for tribology studies using AFM. The JKR model describes the contact between two surfaces with relatively low stiffness and high adhesion forces. The adhesion force magnitude is calculated as:
20
98 6a
HRF
a (5)
Nevertheless, real surfaces are never completely rigid and can deform under the influence of attractive forces, giving rise to finite contact area even if no external loads are applied. In JKR theory, the contact area between a spherical surface of radius R and a flat surface, with elastic modulus K, more deformable than the sphere, is expressed as:
www.intechopen.com

Atomic Force Microscopy Investigations into Biology – From Cell to Protein
12
2 212 12 123 6 (3 )
Ra F RW W F RW
K (6)
Unlike the JKR model, the DMT model describes the contact between rigid surfaces in the case of low adhesion forces and small tip radii. The contact force is calculated using the relationship:
3*2
0 024
( ) ( ) ,3 3ts
s
E RF d a d d a (7)
where:
2 2
*1 11 t s
t sE EE
(8)
E and are respectively the Young modulus and the Poisson coefficient. The subscripts t and s are related respectively to the tip and the surface.
However, these models have some limitations. They suppose the surfaces to be completely flat. As a matter of fact, real surfaces have some roughness that has to be considered in the calculation of the adhesion force. When working in air, small amounts of water vapor in the atmosphere can capillary condense in the contact points, causing an additional attractive force between surfaces. If we consider a sphere of radius R and a flat surface separated by a distance d, the capillary force that is applied in the contact points is given by:
4 ( cos )
1
LC
RF
d
D
(9)
where D is the height of the tip immersed in the water meniscus, and θ is the contact angle.
3.2 Spectroscopy mode in static AFM: Force vs. distance curves
Force spectroscopy is a technique to measure forces acting between a tip and a sample surface (Cappella &. Dietler, 1999). It is performed with the tip held in a fixed position in the plane parallel to the sample surface while, in the perpendicular direction, the sample moves by gradually approaching to or retracting from the tip. This results in a force vs. distance curve. To obtain quantitative data from force vs. distance curve measurements, important details must be respected. To accurately measure the deflection of the cantilever, a force curve between the tip and a hard substrate is used to determine the cantilever sensitivity, which relates the cantilever deflection to the voltage of the z-piezo stage. After this calibration the laser alignment has to be kept unchanged. The next step is to convert the deflection into a force using the force constant of the selected cantilever. This value, together with the resonance frequency, is specified by the manufacturer, but generally for each cantilever there can be a quite large difference between the real value and those declared by the manufacturer. Therefore, to ensure the ability to collect data accurately, direct determination of the force constant is advised. Different methods to measure the force
www.intechopen.com
Atomic Force Spectroscopies: A Toolbox for Probing the Biological Matter
13
constant can be used (Cleveland et al., 1993; Torii et al., 1996). Perhaps the most accessible calibration technique is the thermal noise method (Hutter & Bechhoefer 1993).
During the acquisition of a force vs. distance curve the sample is approached to the tip while the cantilever deflection, c, is recorded. The cantilever bending force is given by the well-known Hooke law:
Fc = - kc (10)
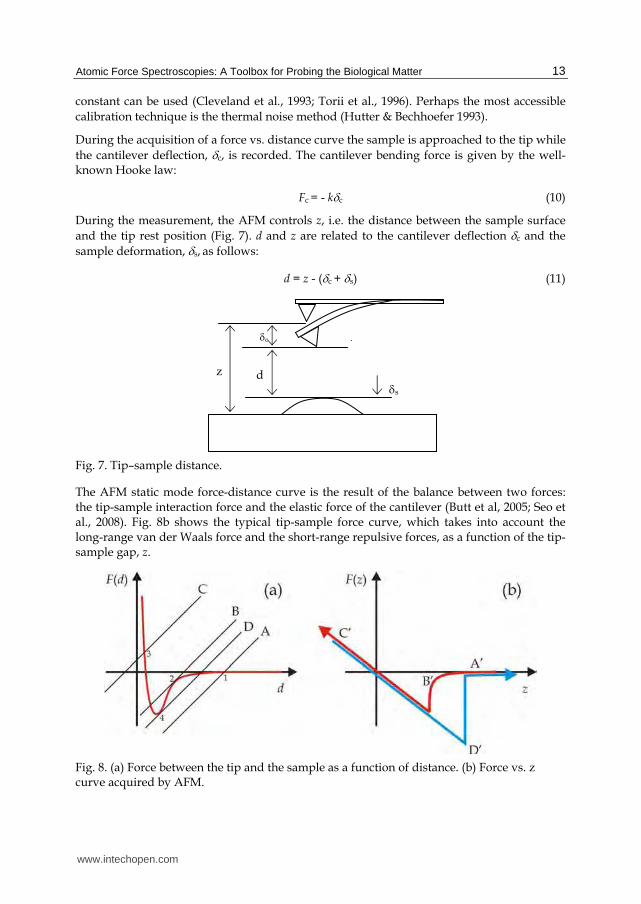
During the measurement, the AFM controls z, i.e. the distance between the sample surface and the tip rest position (Fig. 7). d and z are related to the cantilever deflection c and the sample deformation, s, as follows:
d = z - (c + s) (11)
Fig. 7. Tip–sample distance.
The AFM static mode force-distance curve is the result of the balance between two forces: the tip-sample interaction force and the elastic force of the cantilever (Butt et al, 2005; Seo et al., 2008). Fig. 8b shows the typical tip-sample force curve, which takes into account the long-range van der Waals force and the short-range repulsive forces, as a function of the tip-sample gap, z.
Fig. 8. (a) Force between the tip and the sample as a function of distance. (b) Force vs. z curve acquired by AFM.
s
z
c d
www.intechopen.com
Atomic Force Microscopy Investigations into Biology – From Cell to Protein
14
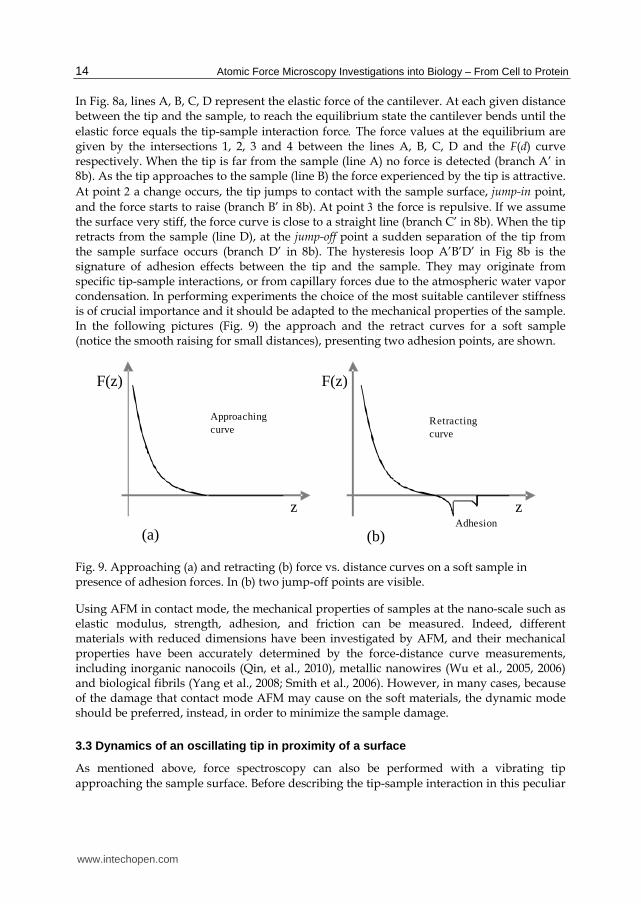
In Fig. 8a, lines A, B, C, D represent the elastic force of the cantilever. At each given distance between the tip and the sample, to reach the equilibrium state the cantilever bends until the elastic force equals the tip-sample interaction force The force values at the equilibrium are given by the intersections 1, 2, 3 and 4 between the lines A, B, C, D and the F(d) curve respectively. When the tip is far from the sample (line A) no force is detected (branch A’ in 8b). As the tip approaches to the sample (line B) the force experienced by the tip is attractive. At point a change occurs, the tip jumps to contact with the sample surface, jump-in point, and the force starts to raise (branch B’ in 8b). At point the force is repulsive. If we assume the surface very stiff, the force curve is close to a straight line (branch C’ in 8b). When the tip retracts from the sample (line D), at the jump-off point a sudden separation of the tip from the sample surface occurs (branch D’ in 8b). The hysteresis loop A’B’D’ in Fig 8b is the signature of adhesion effects between the tip and the sample. They may originate from specific tip-sample interactions, or from capillary forces due to the atmospheric water vapor condensation. In performing experiments the choice of the most suitable cantilever stiffness is of crucial importance and it should be adapted to the mechanical properties of the sample. In the following pictures (Fig. 9) the approach and the retract curves for a soft sample (notice the smooth raising for small distances), presenting two adhesion points, are shown.
Adhesion
z
F(z)
Approaching curve
z
F(z)
Retracting curve
(a) (b)
Fig. 9. Approaching (a) and retracting (b) force vs. distance curves on a soft sample in presence of adhesion forces. In (b) two jump-off points are visible.
Using AFM in contact mode, the mechanical properties of samples at the nano-scale such as elastic modulus, strength, adhesion, and friction can be measured. Indeed, different materials with reduced dimensions have been investigated by AFM, and their mechanical properties have been accurately determined by the force-distance curve measurements, including inorganic nanocoils (Qin, et al., 2010), metallic nanowires (Wu et al., 2005, 2006) and biological fibrils (Yang et al., 2008; Smith et al., 2006). However, in many cases, because of the damage that contact mode AFM may cause on the soft materials, the dynamic mode should be preferred, instead, in order to minimize the sample damage.
3.3 Dynamics of an oscillating tip in proximity of a surface
As mentioned above, force spectroscopy can also be performed with a vibrating tip approaching the sample surface. Before describing the tip-sample interaction in this peculiar
www.intechopen.com
Atomic Force Spectroscopies: A Toolbox for Probing the Biological Matter
15
case we will introduce few concepts on the dynamics of a vibrating lever. The forces acting on a vibrating lever are basically three: its weight (a force that is distributed along the lever), the weight of the tip attached to the lever (which represents a concentrated force at one point) and the external force that acts between the tip and the surface as if it was concentrated in one point. Every point in the lever oscillates with a harmonic motion with the exception of its support and the nodal points which are stationary. The lever dynamics in the free space (i.e., far from the surface where the tip-sample force is null) can be approximated to that of a forced-damped harmonic oscillator and hence described through the related well known equation:
2
2d x dx
m kx c Fdtdt
(12)
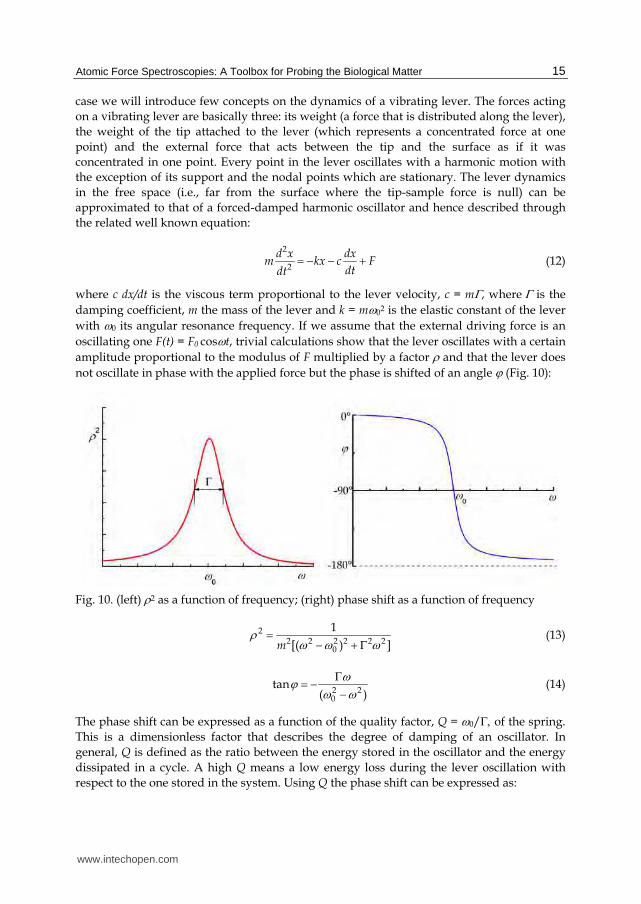
where c dx/dt is the viscous term proportional to the lever velocity, c = m, where is the damping coefficient, m the mass of the lever and k = m02 is the elastic constant of the lever with 0 its angular resonance frequency. If we assume that the external driving force is an oscillating one F(t) = F0 cost, trivial calculations show that the lever oscillates with a certain amplitude proportional to the modulus of F multiplied by a factor and that the lever does not oscillate in phase with the applied force but the phase is shifted of an angle (Fig. 10):
Fig. 10. (left) 2 as a function of frequency; (right) phase shift as a function of frequency
22 2 2 2 2 2
0
1[( ) ]m
(13)
2 20
tan( )
(14)
The phase shift can be expressed as a function of the quality factor, Q = 0/ of the spring. This is a dimensionless factor that describes the degree of damping of an oscillator. In general, Q is defined as the ratio between the energy stored in the oscillator and the energy dissipated in a cycle. A high Q means a low energy loss during the lever oscillation with respect to the one stored in the system. Using Q the phase shift can be expressed as:
www.intechopen.com
Atomic Force Microscopy Investigations into Biology – From Cell to Protein
16
02tan
( )m
Q k m
(15)
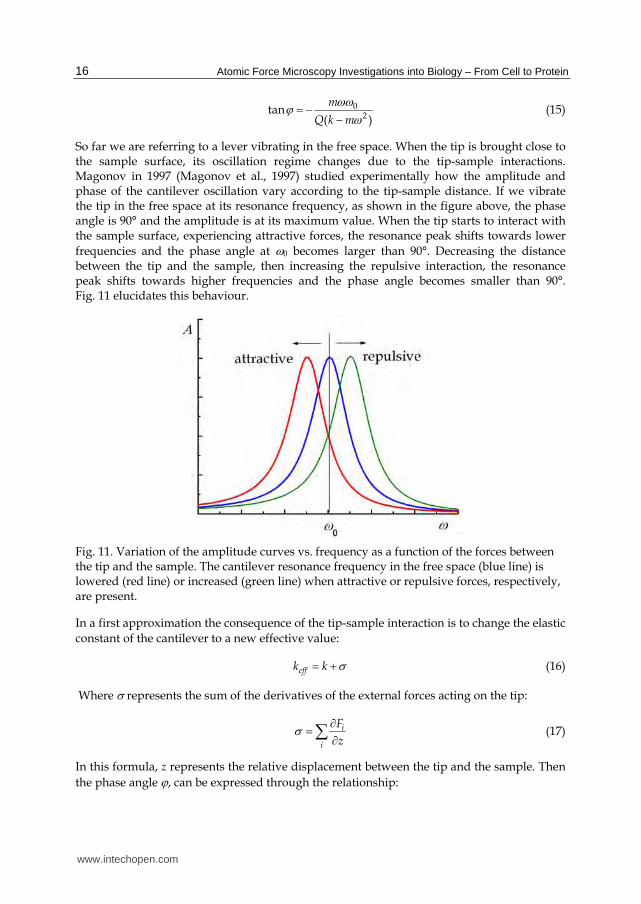
So far we are referring to a lever vibrating in the free space. When the tip is brought close to the sample surface, its oscillation regime changes due to the tip-sample interactions. Magonov in 1997 (Magonov et al., 1997) studied experimentally how the amplitude and phase of the cantilever oscillation vary according to the tip-sample distance. If we vibrate the tip in the free space at its resonance frequency, as shown in the figure above, the phase angle is 90° and the amplitude is at its maximum value. When the tip starts to interact with the sample surface, experiencing attractive forces, the resonance peak shifts towards lower frequencies and the phase angle at 0 becomes larger than 90°. Decreasing the distance between the tip and the sample, then increasing the repulsive interaction, the resonance peak shifts towards higher frequencies and the phase angle becomes smaller than 90°. Fig. 11 elucidates this behaviour.
Fig. 11. Variation of the amplitude curves vs. frequency as a function of the forces between the tip and the sample. The cantilever resonance frequency in the free space (blue line) is lowered (red line) or increased (green line) when attractive or repulsive forces, respectively, are present.
In a first approximation the consequence of the tip-sample interaction is to change the elastic constant of the cantilever to a new effective value:
effk k (16)
Where represents the sum of the derivatives of the external forces acting on the tip:
i
i
F
z (17)
In this formula, z represents the relative displacement between the tip and the sample. Then the phase angle , can be expressed through the relationship:
www.intechopen.com
Atomic Force Spectroscopies: A Toolbox for Probing the Biological Matter
17
02tan( )
( )m
Q k m
(18)
This expression is useful to relate the phase to the oscillation frequency.
To quantitatively describe the cantilever movement when the oscillating tip approaches the sample surfaces we need to go back to the expression for the damped harmonic oscillator, introducing new terms. When the tip hits the sample, it experiences van der Waals forces, but if the sample is soft and has viscoelastic properties, as often happens with polymers and biological materials, there is also a dissipation of part of the energy stored in the oscillator through the sample, then a viscous damping has to be taken into account. The cantilever motion can then be described through the following equation:
2
2 ts v
d x dxm kx c F F F
dtdt (19)
where Fv represents the viscous response of the sample to the tip movement and is given by:
v
dzF R
dt (20)
where is the sample viscosity, R is the tip radius and the sample deformation. In this model the sample is characterized by its elastic and viscosity coefficients. Interaction forces, as previously described, can be described by the modified DMT mechanics that takes into account adhesion forces:
02
3*2
0 020
,6
4( ) ,
63 3
vdW
ts
DTMS
HRF z a
zF
E R HRF a z z a
a
(21)
Analogously, if capillary forces are not negligible, a further term has to be added to the force expression.
3.4 Spectroscopy mode in dynamic AFM mode: Phase vs. distance curves
Garcia and colleagues (Garcia & Perez, 2002; Tamayo & Garcia, 1996, 1997) numerically approached the problem of the cantilever motion, obtaining a trend for the phase of the oscillation as a function of the distance between the tip and the sample. In Fig. 12 experimental results are reported (only the approach curve is shown). For large separations (z > 60 nm) the phase is 90°, as expected, and no appreciable shifts are observed. When the tip gets closer to the sample surface, an increase of the phase is observed. There, the interaction potential is dominated by attractive forces. The positive gradient of the force shifts the cantilever resonance frequency to lower values. This, in turn, shifts the phase upwards. While approaching closer to the surface, when in the tip-sample interaction repulsive contributions dominate, the phase shift decreases with decreasing separation due to the negative gradient of the interaction force.
www.intechopen.com

Atomic Force Microscopy Investigations into Biology – From Cell to Protein
18
Phase vs. distance curves are particularly useful for the information they can provide on the energy dissipated in the sample, helping in assessing the visco-elastic properties of the material.
In Fig.12, the difference between the tip interacting with a hard surface, mica, and a soft polymeric one, polypropylene, is shown. Three major differences between the mica and the PP curves are observed.
Fig. 12. Phase vs. distance curves for a hard material (solid line) and a soft one (dashed line)
1. The transition between non-contact and intermittent contact produces a sudden decrease of the phase for mica, while in the polymer there is a smooth variation.
2. The phase shift between the starting and final position is larger for mica than for polymer.
3. The polymer also shows an increase of the phase for tip–sample equilibrium separations smaller than 20 nm.
These results underline the complex behavior of phase shifts in dynamic force microscopy where elastic and inelastic processes alike may be involved. Cleveland and his colleagues (Cleveland et al., 1998) studied a model for the interaction in terms of power dissipated by the cantilever. At equilibrium, the average energy that is supplied to the cantilever must be equal to the average energy that is dissipated by the cantilever itself and by the tip during a cycle. Cleveland splits the power dissipated in two parts:
0in tipP P P (22)
where Pin is the average power provided to the lever, P0 is the power dissipated by the body of the lever in air and can be modeled by viscous damping, while Ptip takes into account all the possible dissipations due to the interaction between tip and sample. Pin and P0 can be calculated and this leads to an expression for the power dissipated by the tip as a function of the phase φ when the cantilever oscillates close to its resonance frequency:
2
0 01sin 1
2tip
kA AP
Q A
(23)
where A0 is the oscillation amplitude in the free space.
www.intechopen.com
Atomic Force Spectroscopies: A Toolbox for Probing the Biological Matter
19
4. Applications to biological samples
4.1 Single Molecule Force Spectroscopy
During recent years single molecule force spectroscopy (SMFS) methods have been developed to perform mechanical experiments with single molecules on generic surfaces under ambient conditions and within liquid electrolytes. Single molecule experiments allow the precise measurement of inter- and intra-molecular forces, providing the experimental platform for understanding, at a molecular level, adhesion and de-adhesion processes. In SMFS experiments force is applied to molecules by stretching them between the sample surface and the tip of an AFM cantilever featuring a typical spring constant in the 10-100 pN/nm range. Molecules are attached to the AFM tip by covalent bonding or through antibodies at specific sites (Zheng et al., 2011). Often, in order to address proteins specifically, force measurements are performed using functionalized tips.
Early experiments were concerned in the interaction between pairs molecules, such as the ligand-receptor pair biotin-avidin (Florin et al., 1994), complementary strands of DNA (Lee et al., 1994) or an antibody-antigen (Dammer et al., 1996).
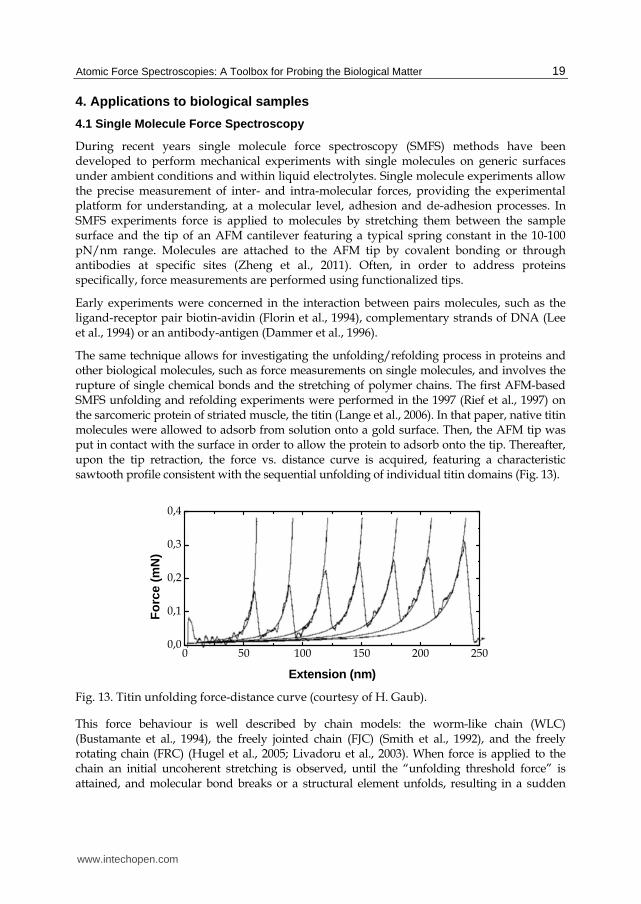
The same technique allows for investigating the unfolding/refolding process in proteins and other biological molecules, such as force measurements on single molecules, and involves the rupture of single chemical bonds and the stretching of polymer chains. The first AFM-based SMFS unfolding and refolding experiments were performed in the 1997 (Rief et al., 1997) on the sarcomeric protein of striated muscle, the titin (Lange et al., 2006). In that paper, native titin molecules were allowed to adsorb from solution onto a gold surface. Then, the AFM tip was put in contact with the surface in order to allow the protein to adsorb onto the tip. Thereafter, upon the tip retraction, the force vs. distance curve is acquired, featuring a characteristic sawtooth profile consistent with the sequential unfolding of individual titin domains (Fig. 13).
Fig. 13. Titin unfolding force-distance curve (courtesy of H. Gaub).
This force behaviour is well described by chain models: the worm-like chain (WLC) (Bustamante et al., 1994), the freely jointed chain (FJC) (Smith et al., 1992), and the freely rotating chain (FRC) (Hugel et al., 2005; Livadoru et al., 2003). When force is applied to the chain an initial uncoherent stretching is observed, until the “unfolding threshold force” is attained, and molecular bond breaks or a structural element unfolds, resulting in a sudden
0 50 100 150 200 2500,0
0,1
0,2
0,3
0,4
Fo
rce
(mN
)
Extension (nm)
www.intechopen.com
Atomic Force Microscopy Investigations into Biology – From Cell to Protein
20
increase in contour length and in a drop in force (see Fig. 13). Another interesting feature of the curve force is the increasing in the peaks maxima with the increasing extension. This behavior is ascribed to the circumstance that the weakest domains unfold first and the strongest last.
Experiments were also performed on reconstituted and native membrane proteins (Kedrov et al., 2005; Oesterhelt et al., 2000; Preiner et al., 2007), and on cells (Alsteens et al., 2009). When the chain stretching starts by increasing the external force below the unfolding threshold, the energy barrier between the folded and unfolded states lowers, making the system more sensitive to other experimental parameters such as pulling speed (Dudko et al., 2008; Evans et al., 1997) or temperature (Schlierf & Rief, 2005). Under these conditions, a fluctuation can push the system to overcome the unfolding barrier, entering in the model as stochastic contributions.
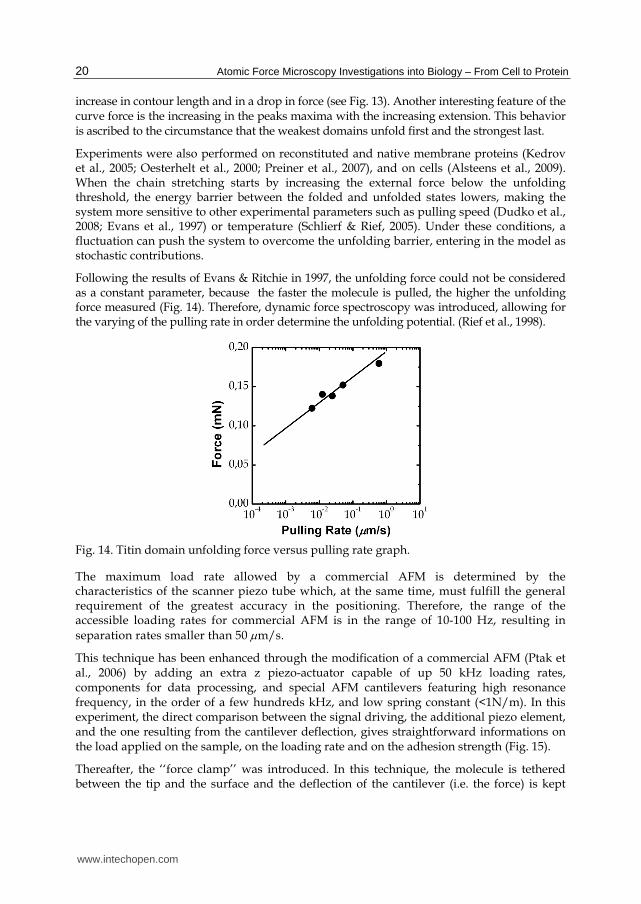
Following the results of Evans & Ritchie in 1997, the unfolding force could not be considered as a constant parameter, because the faster the molecule is pulled, the higher the unfolding force measured (Fig. 14). Therefore, dynamic force spectroscopy was introduced, allowing for the varying of the pulling rate in order determine the unfolding potential. (Rief et al., 1998).
Fig. 14. Titin domain unfolding force versus pulling rate graph.
The maximum load rate allowed by a commercial AFM is determined by the characteristics of the scanner piezo tube which, at the same time, must fulfill the general requirement of the greatest accuracy in the positioning. Therefore, the range of the accessible loading rates for commercial AFM is in the range of 10-100 Hz, resulting in separation rates smaller than 50 m/s.
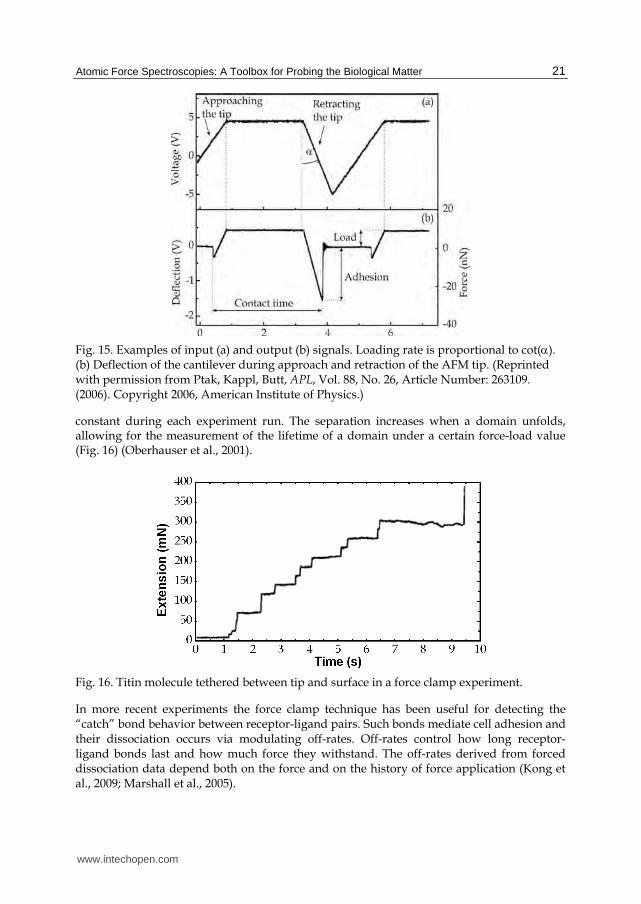
This technique has been enhanced through the modification of a commercial AFM (Ptak et al., 2006) by adding an extra z piezo-actuator capable of up 50 kHz loading rates, components for data processing, and special AFM cantilevers featuring high resonance frequency, in the order of a few hundreds kHz, and low spring constant (<1N/m). In this experiment, the direct comparison between the signal driving, the additional piezo element, and the one resulting from the cantilever deflection, gives straightforward informations on the load applied on the sample, on the loading rate and on the adhesion strength (Fig. 15).
Thereafter, the ‘‘force clamp’’ was introduced. In this technique, the molecule is tethered between the tip and the surface and the deflection of the cantilever (i.e. the force) is kept
www.intechopen.com
Atomic Force Spectroscopies: A Toolbox for Probing the Biological Matter
21
Fig. 15. Examples of input (a) and output (b) signals. Loading rate is proportional to cot(). (b) Deflection of the cantilever during approach and retraction of the AFM tip. (Reprinted with permission from Ptak, Kappl, Butt, APL, Vol. 88, No. 26, Article Number: 263109. (2006). Copyright 2006, American Institute of Physics.)
constant during each experiment run. The separation increases when a domain unfolds, allowing for the measurement of the lifetime of a domain under a certain force-load value (Fig. 16) (Oberhauser et al., 2001).
Fig. 16. Titin molecule tethered between tip and surface in a force clamp experiment.
In more recent experiments the force clamp technique has been useful for detecting the “catch” bond behavior between receptor-ligand pairs. Such bonds mediate cell adhesion and their dissociation occurs via modulating off-rates. Off-rates control how long receptor-ligand bonds last and how much force they withstand. The off-rates derived from forced dissociation data depend both on the force and on the history of force application (Kong et al., 2009; Marshall et al., 2005).
www.intechopen.com
Atomic Force Microscopy Investigations into Biology – From Cell to Protein
22
4.2 Viscoelasticity and adhesion forces measurements
Contact mode force spectroscopy is based on the detection of the static or quasi-static cantilever bending. Here, “quasi-static” has to be read in terms of relatively slow oscillations, well below the cantilever resonance. In such cases, informations are extracted directly and only from the cantilever deflection that “measures” the applied force.
Dynamic mode AFM allows one to go further into the tip-sample interaction details and, in addition, the oscillation amplitude and the phase shift can be recorded simultaneously, offering further “probes” for detecting different sample properties. In AFM dynamic modes, both non-contact (NC) and intermittent contact (IC), the cantilever is excited to oscillate at or close to the resonance; nevertheless, in the IC mode, oscillation amplitudes are larger, spanning between the attractive and the repulsive part of the tip-sample interaction potential. The result is an intermittent contact between the tip and the sample, whose dynamics are influenced by the sample properties such as adhesion, elasticity, or visco-elasticity. All these features can be revealed by the analysis of the amplitude-phase-distance (APD) curves, where the amplitude and the phase of the oscillating cantilever are recorded as a function of the average tip-sample distance.
Tamayo & Garcia (1996), proposed a model in which viscoelasticity and adhesion forces are considered as possible sources of phase contrast. When large oscillation amplitudes are used, the amplitude-distance curves feature discontinuities connected to the transition from the purely attractive regime, to the repulsive interaction occurring close to the lower inflection point of the vibrating cantilever (Anczykowski et al., 1996). In this work, a comparison between experimental results and computer simulations has been performed, considering different oscillatory regimes (above, below and at the resonance), and they display evidence of the role of contamination layers in the discontinuities in the phase curves. More recently Garcia & San Paulo (1999) demonstrated that the attractive to repulsive regime transition has a clear signature in the phase vs. distance curve, where a net phase jump from values above 90° to values below 90°, discriminates the two regimes: in the repulsive regime is always < 90°, whereas the attractive regime is characterized by phase shifts > 90°.
When oscillating a tip, the attractive–repulsive regime transition can be influenced by the presence of an adsorbed water film. This aspect has been faced by Zitzler et al. (2002), who measured the critical oscillation amplitude for which the attractive/repulsive transition occurs vs. the Relative Humidity (RH). They demonstrate that, for both hydrophilic tip and sample, there is an increasing in the critical amplitude when increasing the RH value. On the contrary, this effect is not observed in the case of hydrophobic sample/hydrophilic tip for which the critical amplitude is practically independent on RH. In practice, the forces connected to the cyclic formation-rupture of a capillary neck enter in the dynamical model with the role of an attractive contribution, affecting possible quantitative, or even qualitative, measurements of local adhesion, elastic or visco-elastic properties of the sample.
As a consequence, force spectroscopy experiments in dynamic AFM mode should be carried out under controlled humidity and temperature, in order to discriminate the effect of capillary condensation. These techniques are becoming relatively popular for high resolution imaging of soft materials in tapping mode (Thomson, 2005). Nevertheless, the effect of the water film, or of the inhomogeneities in the physical properties, can severely
www.intechopen.com
Atomic Force Spectroscopies: A Toolbox for Probing the Biological Matter
23
affect the topographic image of heterogeneous samples, featuring areas with different physical-chemical properties, as micro- or nano- composites. This influence can result in wrong height measurements and in some extreme cases even contrast inversion can be observed (Kopp-Marsaudon et al., 2000; Palacios-Lidon et al., 2010). The possibility to investigate physical and chemical properties at the nano-scale in some cases has been used to reveal structural features or conformational properties of complex molecules and aggregates. In literature a reduced number of papers devoted to this subject can be found, essentially devoted to polymers studies(Zhuang et al., 2005).
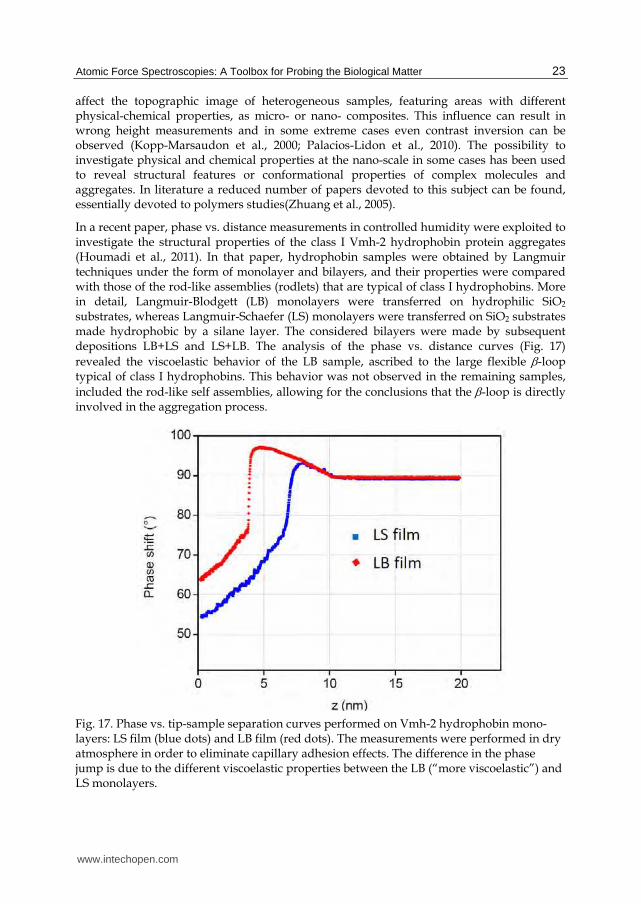
In a recent paper, phase vs. distance measurements in controlled humidity were exploited to investigate the structural properties of the class I Vmh-2 hydrophobin protein aggregates (Houmadi et al., 2011). In that paper, hydrophobin samples were obtained by Langmuir techniques under the form of monolayer and bilayers, and their properties were compared with those of the rod-like assemblies (rodlets) that are typical of class I hydrophobins. More in detail, Langmuir-Blodgett (LB) monolayers were transferred on hydrophilic SiO2 substrates, whereas Langmuir-Schaefer (LS) monolayers were transferred on SiO2 substrates made hydrophobic by a silane layer. The considered bilayers were made by subsequent depositions LB+LS and LS+LB. The analysis of the phase vs. distance curves (Fig. 17) revealed the viscoelastic behavior of the LB sample, ascribed to the large flexible -loop typical of class I hydrophobins. This behavior was not observed in the remaining samples, included the rod-like self assemblies, allowing for the conclusions that the -loop is directly involved in the aggregation process.
Fig. 17. Phase vs. tip-sample separation curves performed on Vmh-2 hydrophobin mono-layers: LS film (blue dots) and LB film (red dots). The measurements were performed in dry atmosphere in order to eliminate capillary adhesion effects. The difference in the phase jump is due to the different viscoelastic properties between the LB (“more viscoelastic”) and LS monolayers.
www.intechopen.com

Atomic Force Microscopy Investigations into Biology – From Cell to Protein
24
5. Conclusion
In this chapter, we have described various applications for the AFM, and have explained some possibilities offered by this technique for the samples investigation, in particular for biological matter. We have emphasized the possibility to obtain three-dimensional images with a high resolution in various AFM modes, but also discussed how to obtain information beyond the topography, including surface roughness, mechanical and other structural sample properties. Due to advantages that the AFM technique offers, it is extensively used in several domains, varying from physics, to biology, to polymer sciences. However, there is still room for improvement of this technique. Indeed, the development of commercial instruments continues, in order to increase the ability to acquire images in a much shorter time. This will play an important role in the field of bio-nanotechnology.
6. References
Alsteens, D.; Dupres, V.; Klotz, S. A.; Gaur, N. K.; Lipke, P. N. & Dufrêne, Y. F. (2009). Unfolding individual Als5p adhesion proteins on live cells. ACS Nano, Vol. 3, No. 7, pp. 1677–1682.
Anczykowski, B.; Kruger, D. & Fuchs, H. (1996). Cantilever dynamics in quasinoncontact force microscopy: Spectroscopic aspects. PHYSICAL REVIEW B, Vol. 53, No. 23, pp. 15485-15488
Baclayon, M.; Roos, W. H. & Wuite, G. J. L. (2010) Sampling Protein Form and Function with the Atomic Force Microscope. MOLECULAR & CELLULAR PROTEOMICS, Vol. 9, No. 8, pp. 1678-1688
Bhushan, B. (2003). Handbook of Nanotechnology (2nd Edition). Springer, ISBN 978-3-642-02524-2.
Binnig, G.; Quate, C. F. & Gerber, Ch. (1986). Atomic Force Microscope. Phys. Rev. Lett., Vol. 56, 930
Bustamante, C.; Marko, J. F.; Siggia, E.D. & Smith, S. (1994). Entropic elasticity of lambda-phage DNA. Science, 1994, Vol. 265, pp. 1599-1600.
Butt, H.J.; Cappella, B. & Kappl, M. (2005). Force measurements with the atomic force microscope: Technique, interpretation and applications. SURFACE SCIENCE
REPORTS, Vol. 59, pp. 1–152. Cappella, B. & Dietler G. (1999). Force-distance curves by atomic force microscopy, Surf. Sci.
Rep., Vol. 34, No. 1-3, pp. 1-104. Casuso, I.; Rico, F. & Scheuring, S. (2011) Biological AFM: where we come from - where we
are - where we may go. JOURNAL OF MOLECULAR RECOGNITION, Vol. 24, No. 3, pp. 406-413
Cleveland, J.P.; Anczykowski, B.; Schmid, A.E. & Elings V.B. (1998). Energy dissipation in tapping-mode atomic force microscopy. APPLIED PHYSICS LETTERS, Vol.72, pp.2613-2615.
Cleveland, J.P.; Manne, S.; Bocek, D. & Hansma, P.K. (1993). A non-destructive method for determining the spring constant of cantilevers for scanning force microscopy. REVIEW OF SCIENTIFIC INSTRUMENTS, Vol. 64, No. 2, pp. 403-405.
www.intechopen.com
Atomic Force Spectroscopies: A Toolbox for Probing the Biological Matter
25
Dammer, U.; Hegner, M.; Anselmetti, D.; Wagner, P.; Dreier, M.; Huber, W. & Güntherodt, H. J. (1996). Specific antigen/antibody interactions measured by force microscopy. Biophys. J., Vol. 70, No. 5, pp. 2437–2441.
Dougan, L.; Feng, G.; Lu, H. & Fernandez, J. M. (2008). Solvent molecules bridge the mechanical unfolding transition state of a protein. Proc. Natl. Acad. Sci. USA, Vol. 105, pp. 3185-3190.
Dudko, O. K.; Hummer, G. & Szabo, A. (2008). Theory, analysis, and interpretation of single-molecule force spectroscopy experiments. Proc. Natl. Acad. Sci. USA, Vol. 105, pp. 15755-15760.
Evans, E. & Ritchie, K.; (1997). Dynamic strength of molecular adhesion bonds. Biophys J, Vol. 72, pp. 1541-1555.
Florin, E-L., Moy, V. T. & Gaub H. E. (1994). Adhesion forces between individual ligand-receptor pairs. Science, Vol. 264, pp. 415–417.
Garcia, R. & San Paulo, A. (1999). Attractive and repulsive tip-sample interaction regimes in tapping-mode atomic force microscopy. PHYSICAL REVIEW B, Vol. 60, No. 7, pp. 4961-4967
Garcia, R. & Perez, R. (2002). Dynamic atomic force microscopy methods. SURFACE
SCIENCE REPORTS, Vol. 47, pp. 197-301. Gauthier, M. & Tsukada, M. (1999). Theory of noncontact dissipation force microscopy.
Physical Review B, Vol. 60, No. 16, pp. 11716-11722. Gauthier, M.; Sasaki, N. & Tsukada, M. (2001). Dynamics of the cantilever in noncontact
dynamic force microscopy: The steady-state approximation and beyond. Physical
Review B, vol.64, pp. 085409. Gauthier, M.; Pérez, R.; Arai, T.; Tomitori, M. & Tsukada, M. (2002). Interplay between
Nonlinearity, Scan Speed, Damping, and Electronics in Frequency Modulation Atomic-Force Microscopy. Physical Review Letters, Vol. 89, No. 14, Article number 146104.
Giessibl, F. J. (1997). Forces and frequency shifts in atomic-resolution dynamic-force microscopy. Physical Review B, Vol. 56, No. 24, pp. 16010-16015.
Giessibl, F. J. & Bielefeldt, H. (2000). Physical interpretation of frequency-modulation atomic force microscopy, PHYSICAL REVIEW B, Vol. 61, No. 15, pp. 9968-9971
Hartmann, U. (n.d.). An Elementary Introduction to Atomic Force Microscopy and Related Methods. Jul. 10, 2011,
<http://www.uni-saarland.de/fak7/hartmann/files/docs/pdf/download/IntroductionAfm.pdf>
Hong, J.W.; Park, S.I. & Khim, Z.G. (1999). Measurement of hardness, surface potential, and charge distribution with dynamic contact mode electrostatic force microscope. Review of Scientific Instruments, Vol. 70, No. 30, pp. 1735-1739.
Houmadi, S.; Rodriguez R. D.; Longobardi, S.; Giardina, P.; Fauré M. C.; Giocondo, M. & Lacaze, E. (2011). Self-assembly of hydrophobin protein rodlets studied with atomic force spectroscopy in dynamic mode. (In press on Langmuir, Manuscript Number: la2028093, DOI: http://dx.doi.org/10.1021/la2028093).
www.intechopen.com
Atomic Force Microscopy Investigations into Biology – From Cell to Protein
26
Hugel, T.; Rief, M.; Seitz, M.; Gaub, H. E. & Netz R. R. (2005). Highly stretched single polymers: atomic-force-microscope experiments versus ab-initio theory. Phys Rev
Lett, Vol. 94 pp. 048301. Hutter, J.L. & Bechhoefer, J. (1993). Calibration of atomic-force microscope tips. REVIEW OF
SCIENTIFIC INSTRUMENTS, Vol. 64, No. 7, pp. 1868-1873. Israelachvili, J. N. (1992), Intermolecular and Surface Forces. (2nd edition), Academic Press Inc,
978-0123751812. Jarvis, M. R.; Pérez,R. & Payne, M. C. (2001). Can Atomic Force Microscopy Achieve Atomic
Resolution in Contact Mode?. Physical Review Letters, vol. 86, No. 7, pp. 1287-1290. Kedrov, A.; Krieg, M.; Ziegler, C.; Kuhlbrandt, W. & Muller, D. J. (2005). Locating ligand
binding and activation of a single antiporter. EMBO Rep. Vol. 6, No. 7, pp. 668–674. Kong, F.; Garcia, A. J.; Mould, A. P.; Humphries, M. J. & Zhu, C. (2009). Demonstration of
catch bonds between an integrin and its ligand. J. Cell Biol., Vol. 185, No. 7, pp. 1275–1284.
Kopp-Marsaudon, S.; Leclere, P.; Dubourg, F.; et al. (2000). Quantitative measurement of the mechanical contribution to tapping-mode atomic force microscopy images of soft materials. LANGMUIR, Vol. 16, No. 22, pp. 8432-8437
Lange, S.; Ehler, E. & Gautel, M. (2006). From A to Z and back? Multicompartment proteins in the sarcomere, TRENDS IN CELL BIOLOGY, Vol. 16, No. 1, pp. 11-18
Lee, G.U.; Chrisey, L.A. & Colton, R. J. (1994). Direct measurements of the forces between complementary strands of DNA. Science, Vol. 266, pp. 771–773.
Livadaru, L.; Netz, R. R. & Kreuzer, H. J. (2003). Stretching response of discrete semiflexible polymers. Macromolecules, Vol. 36, pp. 3732-3714.
Magonov, S.N.; Elings, V. & Whangbo, M.H. (1997). Phase imaging and stiffness in tapping mode atomic force microscopy. SURFACE SCIENCE, Vol. 375, pp. L385-L391.
Marshall, B. T.; Sarangapani, K. K.; Lou, J. H.; McEver, R. P. & Zhu, C. (2005). Force history dependence of receptor-ligand dissociation. Biophys. J., Vol. 88, No. 2, pp. 1458–1466.
Martìnez, N. F. & Garcìa, R. (2006). Measuring phase shifts and energy dissipation with amplitude modulation atomic force microscopy. Nanotechnology, Vol. 17, pp. S167–S172.
Matsushige, K.; Kobayashi, K.; Yamada, H.; Itoh, H. & Horiuchi, T. (2001). Review of
Scientific Instruments, vol. 72, No. 12, pp. 4383-4387. Mueller, S.A.; Mueller, D.J. & Engel, A. (2011) Assessing the structure and function of single
biomolecules with scanning transmission electron and atomic force microscopes. MICRON, Vol. 42, No. 2, pp. 186-195
Oberhauser, A. F.; Hansma, P. K.; Carrion-Vazquez, M. & Fernandez, J. M. (2001). Stepwise unfolding of titin under force-clamp atomic force microscopy. Proc. Natl. Acad. Sci.
USA, Vol. 98, No. 2, pp. 468–472. Oesterhelt, F.; Oesterhelt, D.; Pfeiffer, M.; Engel, A.; Gaub, H. E. & Mueller D. J. (2000).
Unfolding pathways of individual bacteriorhodopsins. Science, Vol. 288, No. 5463, pp. 143–146.
www.intechopen.com
Atomic Force Spectroscopies: A Toolbox for Probing the Biological Matter
27
Palacios-Lidon, E.; Munuera, C.; Ocal, C.; et al. (2010). Contrast inversion in non-contact Dynamic Scanning Force Microscopy: What is high and what is low? ULTRAMICROSCOPY, Vol. 110, No. 7, pp. 789-800
Preiner, J.; Janovjak, H.; Rankl, C.; Knaus, H.; Cisneros, D. A.; Kedrov, A.; Kienberger, F.; Muller, D. J. & Hinterdorfer, P. (2007). Free energy of membrane protein unfolding derived from single-molecule force measurements. Biophys. J., Vol. 93, No. 3, pp. 930–937.
Ptak, A.; Kappl, M. & Butt, H. J. (2006). Modified atomic force microscope for high-rate dynamic force spectroscopy. APPLIED PHYSICS LETTERS, Vol. 88, No. 26, Article Number: 263109.
Qin, Y.; Kim, Y.; Zhang, L.; Lee, S.-M.; Yang, R.B.; Pan, A.L.; Mathwig, K.; Alexe, M.; Gösele, U. & Knez, M. (2010). Preparation and elastic properties of helical nanotubes obtained by atomic layer deposition with carbon nanocoils as templates. SMALL, Vol. 6, No. 8, pp. 910–914.
Radic, T. M.; Svetlicic, V.; Zutic, V.; et al. (2011). Seawater at the nanoscale: marine gel imaged by atomic force microscopy. JOURNAL OF MOLECULAR RECOGNITION, Vol. 24, No. 3, pp.: 397-405
Rief, M.; Gautel, M.; Oesterhelt, F.; Fernandez, J. M. & Gaub, H. E. (1997). Reversible Unfolding of Individual Titin Immunoglobulin Domains by AFM, Science, Vol. 16, pp. 1109-1112.
Rief, M.; Gautel, M.; Schemmel, A. & Gaub, H. E. (1998). The mechanical stability of immunoglobulin and fibronectin III domains in the muscle protein titin measured by atomic force microscopy. Biophys. J., Vol. 75, pp. 3008–3014.
Schlierf, M. & Rief, M. (2005). Temperature softening of a protein in singlemolecule experiments. J Mol Biol, Vol. 354, pp. 497-503.
Seo, Y. & Jhe, W. (2008). Atomic force microscopy and spectroscopy. REPORTS ON
PROGRESS IN PHYSICS, Vol. 71, 016101, 24pp. Smith, S. B.; Finzi, L. & Bustamante, C. (1992). Direct mechanical measurements of the
elasticity of single DNA-molecules by using magnetic beads. Science, Vol. 258, pp. 1122-1126.Wright, C. J.; Shah, M. K.; Powell, L. C.; et al. (2010). Application of AFM From Microbial Cell to Biofilm. SCANNING Vol. 32, No. 3, pp. 134-149
Smith, J.F.; Knowles, T.P.J.; Dobson, C.M.; MacPhee, C.E. & Welland, M.E. (2006). Characterization of the nanoscale properties of individual amyloid fibrils. PROCEEDINGS OF THE NATIONAL ACADEMY OF SCIENCES OF THE UNITED
STATES OF AMERICA, Vol. 103, No. 44, pp. 15806-15811. Tamayo, J. & Garcia, R. (1996). Deformation, contact time, and phase contrast in tapping
mode scanning force microscopy. LANGMUIR, Vol. 12, No. 18, pp. 4430-4435 Tamayo, J. & Garcıa, R. (1997). Effects of elastic and inelastic interactions on phase contrast
images in tapping-mode scanning force microscopy. APPLIED PHYSICS LETTERS, Vol. 71, No. 16, pp. 2394-2396.
Thomson, N. H. (2005). The substructure of immunoglobulin G resolved to 25 kDa using amplitude modulation AFM in air. ULTRAMICROSCOPY, Vol. 105, No. 1-4 pp. 103-110
www.intechopen.com

Atomic Force Microscopy Investigations into Biology – From Cell to Protein
28
Torii, A.; Sasaki, M.; Hane, K. & Okuma, S. (1996). A method for determining the spring constant of cantilevers for atomic force microscopy. MEASUREMENT SCIENCE &
TECHNOLOGY, Vol. 7, No. 2, pp. 179-184. Wu, B.; Heidelberg, A. & Boland, J.J. (2005). Mechanical properties of ultrahigh-strength
gold nanowires. NATURE MATERIALS, Vol. 4, No. 7, pp.525-529. Wu, B.; Heidelberg, A.; Boland, J.J; Sader J.E.; Sun, X.M. & Li, Y.D. (2006). Microstructure-
hardened silver nanowires. NANOLETTERS, Vol. 6, No. 3, pp. 468-472. Yang, L.; Van der Werf, K.O.; Fitié, C.F.C.; Bennink, M.L.; Dijkstra, P.J.; Feijen, J. (2008).
Mechanical properties of native and cross-linked type I collagen fibrils. BIOPHYSICAL JOURNAL, Vol. 94, No. 6, pp. 2204–2211
Zheng, P.; Cao, Y. & Li H. (2011). Title: Facile Method of Constructing Polyproteins for Single-Molecule Force Spectroscopy Studies. LANGMUIR, Vol. 27, No. 10, pp. 5713-5718.
Zhuang, W.; Ecker, C.; Metselaar, G. A.; et al. (2005). SFM characterization of poly(isocyanodipeptide) single polymer chains in controlled environments: Effect of tip adhesion and chain swelling. MACROMOLECULES, Vol. 38, No. 2, pp. 473-480
Zitzler, L.; Herminghaus, S. & Mugele, F. (2002). Capillary forces in tapping mode atomic force microscopy. PHYSICAL REVIEW B, Vol. 66, No. 15, Article Number: 155436
www.intechopen.com
Atomic Force Microscopy Investigations into Biology - From Cellto ProteinEdited by Dr. Christopher Frewin
ISBN 978-953-51-0114-7Hard cover, 354 pagesPublisher InTechPublished online 07, March, 2012Published in print edition March, 2012
InTech EuropeUniversity Campus STeP Ri Slavka Krautzeka 83/A 51000 Rijeka, Croatia Phone: +385 (51) 770 447 Fax: +385 (51) 686 166www.intechopen.com
InTech ChinaUnit 405, Office Block, Hotel Equatorial Shanghai No.65, Yan An Road (West), Shanghai, 200040, China
Phone: +86-21-62489820 Fax: +86-21-62489821
The atomic force microscope (AFM) has become one of the leading nanoscale measurement techniques formaterials science since its creation in the 1980's, but has been gaining popularity in a seemingly unrelatedfield of science: biology. The AFM naturally lends itself to investigating the topological surfaces of biologicalobjects, from whole cells to protein particulates, and can also be used to determine physical properties such asYoung's modulus, stiffness, molecular bond strength, surface friction, and many more. One of the mostimportant reasons for the rise of biological AFM is that you can measure materials within a physiologicallyrelevant environment (i.e. liquids). This book is a collection of works beginning with an introduction to the AFMalong with techniques and methods of sample preparation. Then the book displays current research coveringsubjects ranging from nano-particulates, proteins, DNA, viruses, cellular structures, and the characterization ofliving cells.
How to referenceIn order to correctly reference this scholarly work, feel free to copy and paste the following:
Michele Giocondo, Said Houmadi, Emanuela Bruno, Maria P. De Santo, Luca De Stefano, EmmanuelleLacaze, Sara Longobardi and Paola Giardina (2012). Atomic Force Spectroscopies: A Toolbox for Probing theBiological Matter, Atomic Force Microscopy Investigations into Biology - From Cell to Protein, Dr. ChristopherFrewin (Ed.), ISBN: 978-953-51-0114-7, InTech, Available from: http://www.intechopen.com/books/atomic-force-microscopy-investigations-into-biology-from-cell-to-protein/atomic-force-spectroscopies-a-toolbox-for-probing-the-biological-matter

© 2012 The Author(s). Licensee IntechOpen. This is an open access articledistributed under the terms of the Creative Commons Attribution 3.0License, which permits unrestricted use, distribution, and reproduction inany medium, provided the original work is properly cited.