atmospheric energy conversion characteristics of heavy ... · atmospheric energy conversion...
TRANSCRIPT

Atmósfera 28(4), 231-241 (2015)
Atmospheric energy conversion characteristics of heavy rainfall in Sindh during the 2011 monsoon
GE FEICollaborative Innovation Center on Forecast and Evaluation of Meteorological
Disasters; KLME, Nanjing University of Information Science and Technology, Nanjing, China
ZAHEER AHMAD BABARCollaborative Innovation Center on Forecast and Evaluation of Meteorological
Disasters; KLME, Nanjing University of Information Science and Technology, Nanjing, China; Pakistan Meteorological Department, Islamabad, Pakistan
GUO SHENG-LICollaborative Innovation Center on Forecast and Evaluation of Meteorological
Disasters; KLME, Nanjing University of Information Science and Technology, Nanjing, ChinaCorresponding author; e-mail: [email protected]
CHEN YUNNational Meteorological Center of the China Meteorological Administration, Beijing, China
ZHI XIE-FEICollaborative Innovation Center on Forecast and Evaluation of Meteorological
Disasters; KLME, Nanjing University of Information Science and Technology, Nanjing, China
TANG WEI-WEIChongqing Institute of Environmental Science, Chongqing, China
Received: December 11, 2012; accepted: June 19, 2015
RESUMEN
El monzón del sudeste asiático se presenta todos los años de junio a septiembre en la mayor parte del sub-continente indio, lo cual incluye a Paquistán, la India y Bangladesh. Estos vientos ricos en humedad son forzados a elevarse por la cordillera del Himalaya, lo que ocasiona precipitación extrema en varias partes del subcontinente, especialmente en Paquistán. El objetivo de este estudio es analizar las características y distribución de la conversión de energía atmosférica durante la intensa precipitación registrada en Sindh, Paquistán, durante el periodo agosto-septiembre de 2011. Los resultados muestran que la atmósfera cambia de estable a inestable cuando el valor de la energía es igual o mayor a siete. Bajo la influencia de las cir-culaciones atmosféricas y las condiciones del terreno, la energía cinética es bloqueada por las montañas y convertida de manera continua en energía potencial dentro del sistema de precipitación. Cuando la fase de energía máxima persiste por un tiempo considerable, puede ocasionar precipitaciones intensas cuya humedad procede principalmente del Mar Arábico y la bahía de Bengala.
ABSTRACT
South Asian monsoon occurs in most parts of the Indian subcontinent including Pakistan, India and Bangla-desh during the period June to September of every year. These winds rich in moisture are forced to lift by the
232 F. Ge et al.
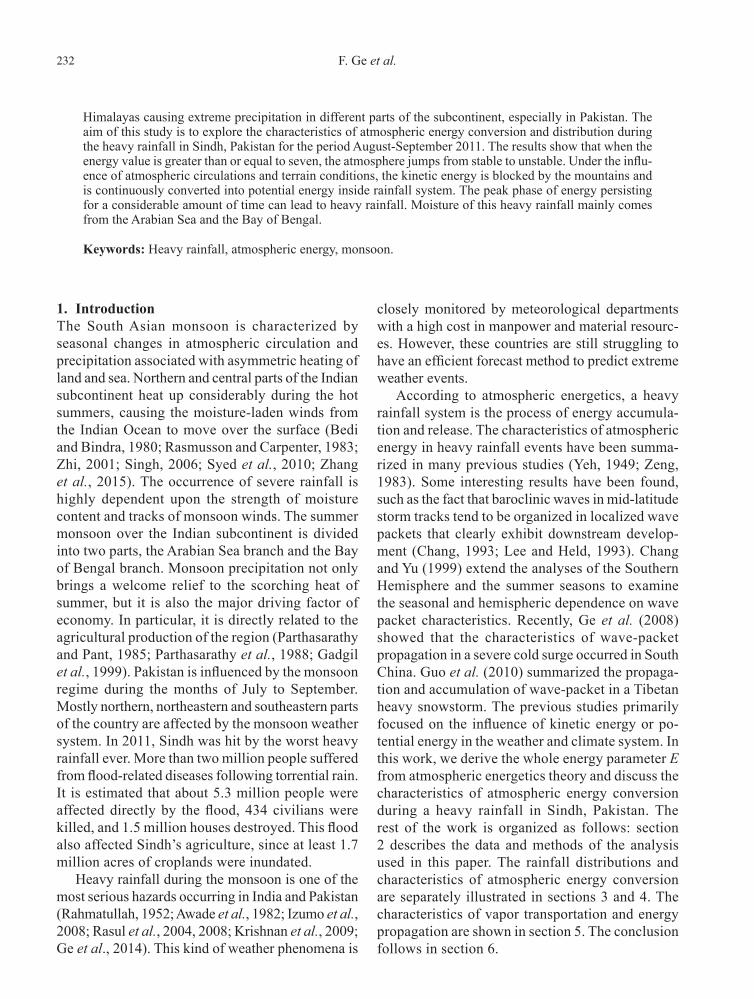
Himalayas causing extreme precipitation in different parts of the subcontinent, especially in Pakistan. The aim of this study is to explore the characteristics of atmospheric energy conversion and distribution during the heavy rainfall in Sindh, Pakistan for the period August-September 2011. The results show that when the energy value is greater than or equal to seven, the atmosphere jumps from stable to unstable. Under the influ-ence of atmospheric circulations and terrain conditions, the kinetic energy is blocked by the mountains and is continuously converted into potential energy inside rainfall system. The peak phase of energy persisting for a considerable amount of time can lead to heavy rainfall. Moisture of this heavy rainfall mainly comes from the Arabian Sea and the Bay of Bengal.
Keywords: Heavy rainfall, atmospheric energy, monsoon.
1. IntroductionThe South Asian monsoon is characterized by seasonal changes in atmospheric circulation and precipitation associated with asymmetric heating of land and sea. Northern and central parts of the Indian subcontinent heat up considerably during the hot summers, causing the moisture-laden winds from the Indian Ocean to move over the surface (Bedi and Bindra, 1980; Rasmusson and Carpenter, 1983; Zhi, 2001; Singh, 2006; Syed et al., 2010; Zhang et al., 2015). The occurrence of severe rainfall is highly dependent upon the strength of moisture content and tracks of monsoon winds. The summer monsoon over the Indian subcontinent is divided into two parts, the Arabian Sea branch and the Bay of Bengal branch. Monsoon precipitation not only brings a welcome relief to the scorching heat of summer, but it is also the major driving factor of economy. In particular, it is directly related to the agricultural production of the region (Parthasarathy and Pant, 1985; Parthasarathy et al., 1988; Gadgil et al., 1999). Pakistan is influenced by the monsoon regime during the months of July to September. Mostly northern, northeastern and southeastern parts of the country are affected by the monsoon weather system. In 2011, Sindh was hit by the worst heavy rainfall ever. More than two million people suffered from flood-related diseases following torrential rain. It is estimated that about 5.3 million people were affected directly by the flood, 434 civilians were killed, and 1.5 million houses destroyed. This flood also affected Sindh’s agriculture, since at least 1.7 million acres of croplands were inundated.
Heavy rainfall during the monsoon is one of the most serious hazards occurring in India and Pakistan (Rahmatullah, 1952; Awade et al., 1982; Izumo et al., 2008; Rasul et al., 2004, 2008; Krishnan et al., 2009; Ge et al., 2014). This kind of weather phenomena is
closely monitored by meteorological departments with a high cost in manpower and material resourc-es. However, these countries are still struggling to have an efficient forecast method to predict extreme weather events.
According to atmospheric energetics, a heavy rainfall system is the process of energy accumula-tion and release. The characteristics of atmospheric energy in heavy rainfall events have been summa-rized in many previous studies (Yeh, 1949; Zeng, 1983). Some interesting results have been found, such as the fact that baroclinic waves in mid-latitude storm tracks tend to be organized in localized wave packets that clearly exhibit downstream develop-ment (Chang, 1993; Lee and Held, 1993). Chang and Yu (1999) extend the analyses of the Southern Hemisphere and the summer seasons to examine the seasonal and hemispheric dependence on wave packet characteristics. Recently, Ge et al. (2008) showed that the characteristics of wave-packet propagation in a severe cold surge occurred in South China. Guo et al. (2010) summarized the propaga-tion and accumulation of wave-packet in a Tibetan heavy snowstorm. The previous studies primarily focused on the influence of kinetic energy or po-tential energy in the weather and climate system. In this work, we derive the whole energy parameter E from atmospheric energetics theory and discuss the characteristics of atmospheric energy conversion during a heavy rainfall in Sindh, Pakistan. The rest of the work is organized as follows: section 2 describes the data and methods of the analysis used in this paper. The rainfall distributions and characteristics of atmospheric energy conversion are separately illustrated in sections 3 and 4. The characteristics of vapor transportation and energy propagation are shown in section 5. The conclusion follows in section 6.
233Atmospheric energy conversion characteristics of heavy rainfall
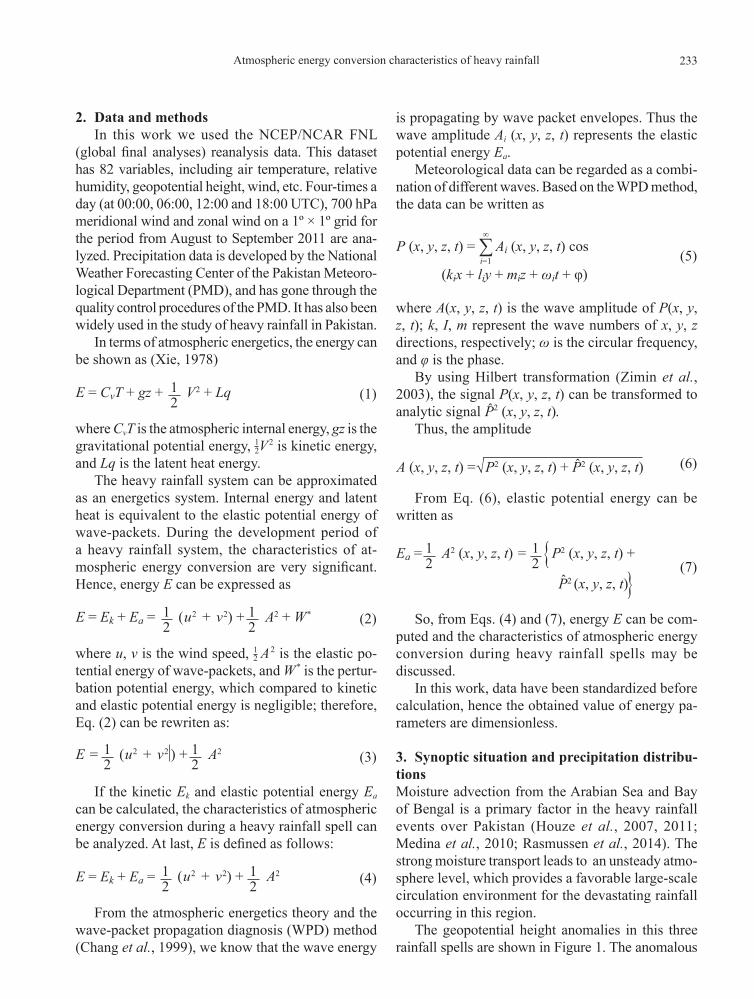
2. Data and methodsIn this work we used the NCEP/NCAR FNL
(global final analyses) reanalysis data. This dataset has 82 variables, including air temperature, relative humidity, geopotential height, wind, etc. Four-times a day (at 00:00, 06:00, 12:00 and 18:00 UTC), 700 hPa meridional wind and zonal wind on a 1º × 1º grid for the period from August to September 2011 are ana-lyzed. Precipitation data is developed by the National Weather Forecasting Center of the Pakistan Meteoro-logical Department (PMD), and has gone through the quality control procedures of the PMD. It has also been widely used in the study of heavy rainfall in Pakistan.
In terms of atmospheric energetics, the energy can be shown as (Xie, 1978)
E = CvT + gz + 12
V2 + Lq (1)
where CvT is the atmospheric internal energy, gz is the gravitational potential energy, V2 is kinetic energy, and Lq is the latent heat energy.
The heavy rainfall system can be approximated as an energetics system. Internal energy and latent heat is equivalent to the elastic potential energy of wave-packets. During the development period of a heavy rainfall system, the characteristics of at-mospheric energy conversion are very significant. Hence, energy E can be expressed as
E = Ek + Ea = A2 + W*12
(u2 + v2) + 12 (2)
where u, v is the wind speed, A2 is the elastic po-tential energy of wave-packets, and W* is the pertur-bation potential energy, which compared to kinetic and elastic potential energy is negligible; therefore, Eq. (2) can be rewriten as:
E = A212
(u2 + v2 ) + 12 (3)
If the kinetic Ek and elastic potential energy Ea can be calculated, the characteristics of atmospheric energy conversion during a heavy rainfall spell can be analyzed. At last, E is defined as follows:
A212
(u2 + v2) + 12
E = Ek + Ea = (4)
From the atmospheric energetics theory and the wave-packet propagation diagnosis (WPD) method (Chang et al., 1999), we know that the wave energy
is propagating by wave packet envelopes. Thus the wave amplitude Ai (x, y, z, t) represents the elastic potential energy Ea.
Meteorological data can be regarded as a combi-nation of different waves. Based on the WPD method, the data can be written as
P (x, y, z, t) = Ai (x, y, z, t) cosi=1
∞
∑ (kix + liy + miz + ωit + φ)
(5)
where A(x, y, z, t) is the wave amplitude of P(x, y, z, t); k, I, m represent the wave numbers of x, y, z directions, respectively; ω is the circular frequency, and φ is the phase.
By using Hilbert transformation (Zimin et al., 2003), the signal P(x, y, z, t) can be transformed to analytic signal .
Thus, the amplitude
A (x, y, z, t) =√P2 (x, y, z, t) + P2 (x, y, z, t)ˆ (6)
From Eq. (6), elastic potential energy can be written as
Ea = P2 (x, y, z, t) + {P2 (x, y, z, t) ˆ }
= A2 (x, y, z, t) 12
12 (7)
So, from Eqs. (4) and (7), energy E can be com-puted and the characteristics of atmospheric energy conversion during heavy rainfall spells may be discussed.
In this work, data have been standardized before calculation, hence the obtained value of energy pa-rameters are dimensionless.
3. Synoptic situation and precipitation distribu-tionsMoisture advection from the Arabian Sea and Bay of Bengal is a primary factor in the heavy rainfall events over Pakistan (Houze et al., 2007, 2011; Medina et al., 2010; Rasmussen et al., 2014). The strong moisture transport leads to an unsteady atmo-sphere level, which provides a favorable large-scale circulation environment for the devastating rainfall occurring in this region.
The geopotential height anomalies in this three rainfall spells are shown in Figure 1. The anomalous

234 F. Ge et al.
circulations are quite prominent on both the 500 and 700 hPa charts. The 500 hPa high pressure area is
present over the Tibetan Plateau during all three heavy rainfall spells and is connected with strong ridging and
Latit
ude
N (º
)
50(a) (b)
200180160
140
120
12012010080
6040
40
20
20
0
0
–20 –60
–40
–20
–20
140
100
100
80
80
60
60
60
80
40
40
20
–20
–20
–20
80
80
60
60
60
40
40
40
20
2020
0
00
200180
–20
–20
204060
80
80
80
20200
0
0
10
10
10
20
2010
0–10
20
30
30
0
–10
–10
–10
–20
–20
–30–30–40
0
0
0
0
0
0
60
40
40
120
100
–20
–20
–40
–40
200
0
0
45
40
35
30
25
20
15
10
5
EQ
Latit
ude
N (º
)
50
45
40
35
30
25
20
15
10
5
EQ
(c) (d)
Longitude E (º)40 45 50 55 60 65 70 75 80 85 90 95 100
Latit
ude
N (º
)
50
45
40
35
30
25
20
15
10
5
EQ
(e)
Longitude E (º)40 45 50 55 60 65 70 75 80 85 90 95 100
(f)
Fig. 1. Geopotential height anomalies in three heavy rainfall spells: (a) 500 hPa from August 9 to 12; (b) 700 hPa from August 9 to 12; (c) 500 hPa from August 29 to 31; (d) 700 hPa from August 29 to 31; (e) 500 hPa from September 7 to 9; (f) 700 hPa from September 7 to 9.
235Atmospheric energy conversion characteristics of heavy rainfall
atmospheric blocking in midlatitudes. The low-pres-sure systems moved over the area of Sindh from the Indian states of Rajasthan and Gujarat, and were significantly enhanced. This caused the southwesterly winds to provide abundant moisture from the Arabian Sea to the flatland regions of central and southern Paki-stan. The strong cyclonic circulation was also present at 700 hPa over the north Arabian Sea and the Bay of Bengal. This implies that the westward flow at 700 hPa from the Bay of Bengal transported enormous moisture across the subcontinent into central and southern Pa-kistan. As a result, most of the precipitation is limited to the southern part of the country, especially in Sindh.
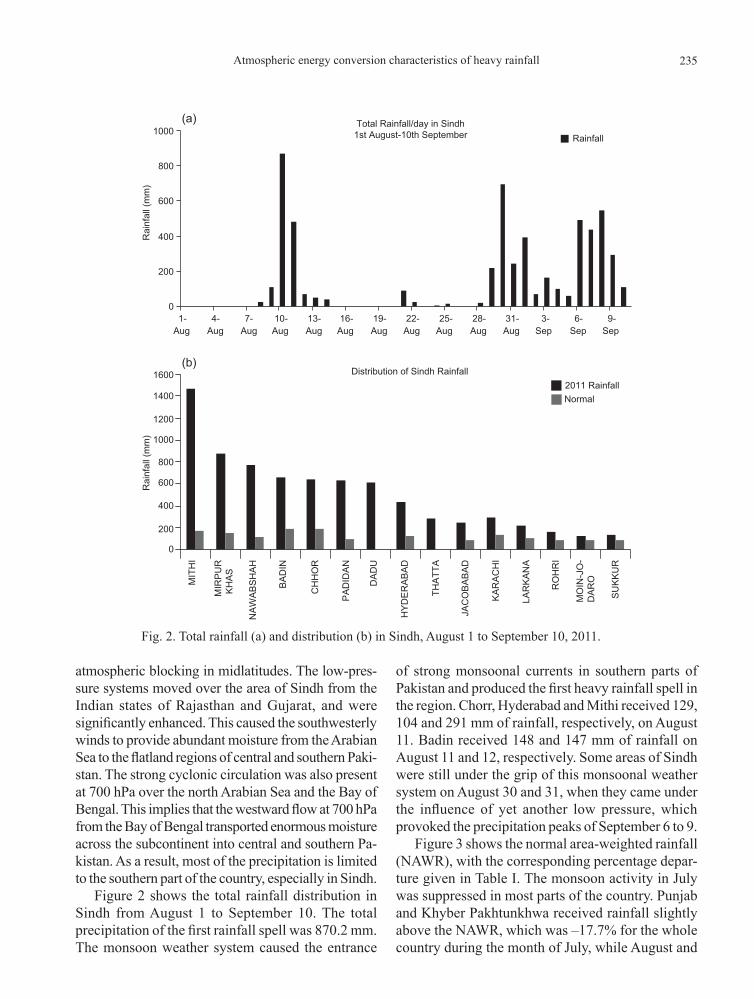
Figure 2 shows the total rainfall distribution in Sindh from August 1 to September 10. The total precipitation of the first rainfall spell was 870.2 mm. The monsoon weather system caused the entrance
of strong monsoonal currents in southern parts of Pakistan and produced the first heavy rainfall spell in the region. Chorr, Hyderabad and Mithi received 129, 104 and 291 mm of rainfall, respectively, on August 11. Badin received 148 and 147 mm of rainfall on August 11 and 12, respectively. Some areas of Sindh were still under the grip of this monsoonal weather system on August 30 and 31, when they came under the influence of yet another low pressure, which provoked the precipitation peaks of September 6 to 9.
Figure 3 shows the normal area-weighted rainfall (NAWR), with the corresponding percentage depar-ture given in Table I. The monsoon activity in July was suppressed in most parts of the country. Punjab and Khyber Pakhtunkhwa received rainfall slightly above the NAWR, which was –17.7% for the whole country during the month of July, while August and
0
200
400
600
800
1000(a)
(b)
Total Rainfall/day in Sindh1st August-10th September
1- 4-Aug Aug Aug Aug Aug Aug Aug Aug Aug Aug Aug Sep Sep Sep
7- 10- 13- 16- 19- 22- 25- 28- 31- 3- 6- 9-
0
MIT
HI
Rai
nfal
l (m
m)
Rainfall
Distribution of Sindh Rainfall2011 RainfallNormal
Rai
nfal
l (m
m)
1600
1400
1200
1000
800
600
400
200
SU
KK
UR
MO
IN-J
O-
DA
RO
RO
HR
I
LAR
KA
NA
KA
RA
CH
I
JAC
OB
AB
AD
THA
TTA
HY
DE
RA
BA
D
DA
DU
PA
DID
AN
CH
HO
R
BA
DIN
NA
WA
BS
HA
H
MIR
PU
R K
HA
S
Fig. 2. Total rainfall (a) and distribution (b) in Sindh, August 1 to September 10, 2011.

236 F. Ge et al.
September remained the most active months for monsoon rains. As a whole, Pakistan received 58.9% above the normal rainfall in August while in Septem-ber this figure was 394.9%. For the whole monsoon period (July-September), the country received 71.6% above the normal rainfall. In 2011, Sindh received the heaviest monsoon rainfall in 51 years; in September alone, it received 1177.2% above the normal rainfall.
4. Characteristics and distributions of atmo-spheric energy conversion in three rainfall spells4.1 Distributions of kinetic and potential energyFigure 4 simulates the terrain condictions of Pakistan, which possesses quite complicated physiographical features that include the northern high mountain ranges (the Himalayas, the Karakoram and the Hin-dukush), the western bordering highlands and the Indus plains.
More than 50% of the annual total rainfall in Paki-stan is received during the summer monsoon season. Rainfall in Pakistan is not only affected by monsoon weather systems but also by terrain characteristics. In the recent past, these areas have also been influenced by severe rainfall events. On July 28, 2003, heavy
rainfall swept the whole of Sindh and claimed 84 human lives. The agricultural plains between Kara-chi and Badin city were inundated with flood water (Rasul et al., 2005). On July 29, 2010 the monsoon extended over the northwestern mountainous region of Pakistan and caused heavy torrential rains over Khyber Pakhtunkhwa, Punjab and Sindh provinces (Akhtar, 2011). These studies demonstrated that during summer monsoons, terrain conditions have a significant role on heavy rainfall events in Pakistan.
Figure 5 shows the distributions of kinetic energy Ek, potential energy Ea and total energy E in rainfall spells. It is apparent that the value of E (shadings) is very high in Sindh, yet the distributions of Ek and Ea are different. The value of Ek is much lower than Ea in the rainfall area and its distribution is influenced by 700 hPa wind field (Fig. 5a, c, e). The distributions of Ea are similar to E and the heavy rainfall also occurs in this area (Fig. 5b, d, f).
By analyzing the distributions of Ek and Ea, we can infer that the occurrence of heavy rainfall has impacted on its energy conversion process. In this spell, atmospheric energy is unstable due to warm moisture transport from the Arabian Sea and the
% Departure
Pakistan = 71.6 % Above normal
(a) (b)
NAWR = 137.5 mm
–100 % – –59 % Deficient–59 % – –20 % Below normal–19 % – +19 % Normal+20 % – +566 % Above normal
10 %(NAWR = 225.2 mm)
39.2 %(NAWR = 58.8 mm)
247.4 %(NAWR = 127.5 mm)
47.7 %(NAWR = 235.7 mm)
Fig. 3. (a) Normal area weighted rainfall and (b) distribution of percentage departures.
Table I. Percentage departures of the Pakistan monsoon rainfall, 2011.
Region July August September* July-September*
Pakistan –17.7 58.9 394.9 71.6Khyber Pakhtunkhwa 0.8 8.8 37.9 10Punjab 1.2 16.6 283.8 47.7Balochistan –36.2 21.6 395.3 39.2Sindh –72.1 271.4 1177.2 247.4
* Until September 22.

237Atmospheric energy conversion characteristics of heavy rainfall
Bay of Bengal by the movement of energy. When they arrive in Pakistan, the northern and western high mountain ranges block their movement. In these circumstances, energy is conducive to reflect and accumulate in Sindh. Moreover, heavy rainfall occurs when the E value is greater than or equal to the thresholds, and the rainfall area remains under the grip of high energy values.
Generally, kinetic energy Ek represents the traveling wave energy and potential energy Ea is on behalf of the standing wave energy. Because Sindh province is mainly a plain land that lies between the Punjab plain and the Arabian Sea, the traveling wave energy is blocked by mountains, and then comes back and remains still. Furthermore, with the beginning of rainfall, kinetic energy is continuously converted into potential energy inside the rainfall system; it will lead to high values of energy E for a long period. The peak phase of energy E can lead to the maintenance of a heavy rainfall process for a considerable amount of time. Hence the conversion of mid level atmospheric energy can be a substantial reason for these heavy rainfall spells.
5. Characteristics of energy propagation and 850 hPa moisture flux divergence in three rain-fall spellsIt is well known that sufficient moisture transporta-tion has a major role in heavy rainfall occurrences. Figure 6 shows the characteristics of energy prop-agation and 850 hPa moisture transportation. The
value of 850 hPa moisture flux divergence is above –70(10–5 g/(cm2 hPa)) and the ascent motion is also intensive in the rainfall area (Fig. 6b, d, f). As seen in the profile map of E (Fig. 6a, c, e), the energy level is always high and its propagation characteristic is obviously present in the three heavy rainfall spells. For instance, extreme heavy rainfall also occurred on August 30 and 31, when the value of energy E (with the zonal distribution shown in Figure 5c) is above 7. The energy features during the other two spells are also similar to that presented in Figure 6c. Further analyses show that movement of E indicates the pres-ence of moisture coming from the Arabian Sea and the Bay of Bengal. With E propagating northwesterly, moisture is constantly transported to Sindh, becoming a continuous source of heavy rainfall.
6. ConclusionHeavy rainfall is a natural phenomenon, however it becomes a hazard when it causes loss of human life and properties. Pakistan is a rainfall-prone country where the monsoon occurs during July to Septem-ber every year. However, some scientific questions such as the atmospheric energy characteristics of heavy rainfall in the Indian subcontinent are still unclear. In this work, based on the NCEP/NCAR FNL reanalysis data and the PMD precipitation data, atmospheric energy conversion and the dis-tribution characteristics of heavy rainfall in Sindh during Monsoon 2011 are discussed. The results show that atmospheric energy inter-conversion
Latit
ude
N (º
)
36
34
32
30
28
26
2460 62 64
Longitude E (º)66 68
8000
7000
6000
5000
4000
3000
2000
(m)
1000
070 72 74 76 78
Fig. 4. Terrain conditions of Pakistan.

238 F. Ge et al.
played a significant role during this heavy rainfall. When E ≥ 7, the atmosphere jumps from a stable to an unstable condition and heavy rainfall occurs. In addition, the peak phase of energy E can lead to
the maintenance of heavy rainfall for a considerable amount of time. Under the influence of circulation and terrain conditions, mountains blocked kinetic energy during the three rainfall events. Further, with
36(a) (b)
34
32
30
28
26
24
2220
Latit
ude
N (º
)
36
34
32
30
28
26
24
2210
Latit
ude
N (º
)
20(c) (d)
10
36
34
32
30
28
26
24
2260
1 3 4 5 6 7 8 10
62 64 66 68 70 7220
74 76 78
Latit
ude
N (º
)
Longitude E (º)60 62 64 66 68 70 72
2074 76 78
Longitude E (º)
(e) (f)
Fig. 5. Kinetic energy Ek and potential energy Ea of the 700 hPa wind field in the rainfall spells. Left panel (Ek): (a) August 10, 2011; (c) August 30, 2011; (e) September 8, 2011 (contour: Ek, shadings: E, vector arrow: 700 hPa wind field). Right panel (Ea): (b) August 10, 2011; (d) August 30, 2011; (f) September, 8 2011 (contour: Ea, shadings: E, vector arrow: 700 hPa wind field).

239Atmospheric energy conversion characteristics of heavy rainfall
Fig. 6. Left panel: 23º-28º N time-longitude profile map of energy E in 700 hPa wind field: (a) August 8 to 10, 2011; (c) August 28 to September 10, 2011; (e) September 5 to 10, 2011. Right panel: 850 hPa moisture flux divergence (shaded areas [unit × 10–5 g/cm2 hPa]) and vapor flux (arrows): (b) August 10, 2011; (d) August 30, 2011; (f) September 8, 2011.
50
45
40
35
30
25
2040 50 60 70 80 90
(a) (b)
(c) (d)
(e) (f)
12UTC12AUG2011
00UTC12AUG2011
00UTC11AUG2011
00UTC10AUG2011
00UTC09AUG2011
00UTC08AUG2011
12UTC11AUG2011
12UTC10AUG2011
12UTC09AUG2011
12UTC08AUG2011
00UTC02SEP2011
12UTC01SEP2011
12UTC23AUG2011
12UTC30AUG2011
12UTC29AUG2011
12UTC28AUG2011
00UTC01SEP2011
00UTC31AUG2011
00UTC30AUG2011
00UTC29AUG2011
00UTC10SEP2011
12UTC09SEP2011
12UTC08SEP2011
12UTC07SEP2011
12UTC06SEP2011
12UTC05SEP2011
00UTC09SEP2011
00UTC08SEP2011
00UTC07SEP2011
00UTC06SEP2011
60 62 64 66 68 70 72 74 76
14–10
–30–40
–50
–60
–70
12
10
8
64
2
10
8
7
65
43
1
78Longitude E (º)
Longitude E (º)0.3
Latit
ude
N (º
)50
45
40
35
30
25
20
Latit
ude
N (º
)
50
45
40
35
30
25
20
Latit
ude
N (º
)
60 62 64 66 68 70 72 74 76 78Longitude E (º)
60 62 64 66 68 70 72 74 76 78Longitude E (º)
10
8
7
65
43
1
40 50 60 70 80 90Longitude E (º)
0.2
40 50 60 70 80 90Longitude E (º)
0.2
–10
–30–40
–50
–60
–70
–10
–30–40
–50
–60
–70

240 F. Ge et al.
the beginning of rainfall, kinetic energy was con-tinuously converted into potential energy inside the rainfall system. The distributions of Ea are similar to E and the high-energy value corresponds to the heavy rainfall region.
The analysis of energy E and moisture flux di-vergence indicates that in these heavy rainfall spells moisture came mainly from the Arabian Sea and the Bay of Bengal. This moisture also provided a favorable condition for the sustained heavy rainfall events. The effect of energy parameter E can be further examined in daily weather diagnosis and can also be used to investigate the causes of heavy rainfall events in different parts of the world. The energy conversion mechanism needs comprehensive research as this may lead to meaningful implications for future weather forecasting.
AcknowledgmentsThis study acknowledges the support of Jiangsu Planned Projects for Postdoctoral Research Funds (1402004B), National Basic Research Program “973” of China (2012CB955200), Max Planck Institute for Meteorology (MPI-M) fellowship, and Priority Academic Program Development of Jiangsu Higher Education Institutions (PAPD).
ReferencesAkhtar H., 2011. The south Asiatic monsoon and flood
hazards in the Indus river basin, Pakistan. Journal of Basic and Applied Sciences 7, 101-115.
Awade S. T., M. Y. Totagi and S. M. Bawiskar, 1982. Wave to wave and wave to zonal mean flow kinetic energy exchanges during contrasting monsoon years. Pure Appl. Geophys. 120, 463-482.
Bedi H. S. and M. M. S. Bindra, 1980. Principal compo-nents of monsoon rainfall. Tellus A 32, 296-298.
Chang E. K. M., 1993. Downstream development of ba-roclinic waves as inferred from regression analysis. J. Atmos. Sci. 50, 2038-2053.
Chang E. K. M., 1999. Characteristics of wave packets in the upper troposphere. Part II: Seasonal and hemispher-ic variations. J. Atmos. Sci. 56, 1729-1747.
Chang E. K. M. and D. B. Yu, 1999. Characteristics of wave packets in the upper troposphere. Part I: North-ern Hemisphere winter. J. Atmos. Sci. 56, 1708-1728.
Gadgil S., Y. P. Abrol and P. R. Seshagiri Rao, 1999. On growth and fluctuation of Indian foodgrain production. Curr. Sci. India 76, 548-556.
Ge F., T. G. Xiao, R. H. Jin, W. B. Chen and W. W. Tang, 2008. Propagation and accumulation of perturbation energy in the severe cold surge, ice-snow and frozen disaster in South China during January 2008 (in Chi-nese). Meteorological Monthly 34, 11-20.
Ge F., Z. A. Babar, S. L. Guo, X. F. Zhi, Y. Chen and W.W. Tang, 2014. Heavy rainfall in Pakistan during 27-29 July 2010: Role of atmospheric energy conversion characteristics. Mausam 65, 57-66.
Guo S. L., F. Ge, R. Ma, T. G. Xiao and W. W. Tang, 2010. The characteristic of wave-packet propagation in Mar 2005 Tibet snowstorm (in Chinese). Transactions of Atmospheric Sciences 34, 410-415.
Houze R. A. Jr., D. C. Wilton and B. F. Smull, 2007. Monsoon convection in the Himalayan region as seen by the TRMM Precipitation Radar. Q. J. R. Meteorol. Soc.133, 1389-1411.
Houze R. A. Jr., K. L. Rasmussen, S. Medina, S. R. Brodzik and U. Romatschke, 2011. Anomalous atmospheric events leading to the summer 2010 floods in Pakistan. Bull. Amer. Meteor. Soc. 92, 291-298.
Izumo T., C. B. Montegut, J. J. Luo, S. K. Behera, S. Masson and T. Yamagata, 2008. The role of the west-ern Arabian Sea upwelling in Indian monsoon rainfall variability. J. Climate 21, 5603-5623.
Krishnan R., V. Kumar, M. Sugi and J. Yoshimura, 2009. Internal feedbacks from monsoon-midlatitude interac-tions during droughts in the Indian summer monsoon. J. Atmos. Sci. 66, 553-578.
Lee S., and I. M. Held, 1993. Baroclinic wave packets in models and observations. J. Atmos. Sci. 50, 1413-1428.
Medina S., R. A. Houze Jr., A. Kumar and D. Niyogi, 2010. Summer monsoon convection in the Himalayan region: Terrain and land cover effects. Quart. J. Roy. Meteor. Soc. 136, 593-616.
Parthasarathy B. and G. B. Pant, 1985. Seasonal relation-ships between Indian summer monsoon rainfall and the southern oscillation. J. Climatol. 5, 369-378.
Parthasarathy B., A. A. Munot and D. R. Kothawale, 1988. Regression model for estimation of Indian foodgrain production from summer monsoon rainfall. Agr. Forest Meteorol. 42, 167-182.
Rahmatullah M., 1952. Synoptic aspects of the monsoon circulation and rainfall over Indo-Pakistan. J. Meteorol. 9, 176-179.
Rasmussen K. L., A. J. Hill, V. E. Toma, M. D. Zuluaga, P. J. Webster and R. A. Houze Jr, 2014. Multiscale analy-sis of three consecutive years of anomalous flooding in Pakistan. Q. J. R. Meteorol. Soc, doi:10.1002/qj.2433.

241Atmospheric energy conversion characteristics of heavy rainfall
Rasmusson E. M. and T. H. Carpenter, 1983. The rela-tionship between eastern equatorial Pacific sea surface temperatures and rainfall over India and Sri Lanka. Mon. Weather Rev. 111, 517-528.
Rasul G., Q. Z. Chaudhry, S. X. Zhao and Q. C. Zeng, 2004. A diagnostic study of record heavy rain in twin cities Islamabad-Rawalpindi. Adv. Atmos. Sci. 21, 976-988.
Rasul G., Q. Z. Chaudhry, S. X. Zhao, Q. C. Zeng, L. L. Qi and G. Y. Zhang, 2005. A diagnostic study of heavy rainfall in Karachi due to merging of a mesoscale low and a diffused tropical depression during South Asian summer monsoon. Adv. Atmos. Sci. 22, 375-391.
Rasul G., Q. Z. Chaudhry, Q. C. Zeng, S. X. Zhao and S. T. Gao, 2008. Interaction of a mesoscale low and dif-fused tropical depression during south Asian summer monsoon. Mausam 59, 453-460.
Singh C. V., 2006. Pattern characteristics of Indian monsoon rainfall using principal component analysis (PCA). Atmos. Res. 79, 317-326.
Syed F. S., J. H. Yoo, H. Kornich and F. Kucharski, 2010. Are intraseasonal summer rainfall events micro mon-soon onsets over the western edge of the South-Asian monsoon? Atmos. Res. 98, 341-346.
Xie Y. B., 1978. Weather dynamics problems of moist baroclinic atmosphere. Collection of Heavy Rain (in Chinese). Jilin People Press, Changchun, China.
Yeh T. C., 1949. On energy dispersion in the atmosphere. J. Meteorol. 6, 1-16.
Zeng Q. C., 1983. The evolution of a Rossby-wave packet in a three-dimensional baroclinic atmosphere. J. Atmos. Sci. 40, 73-840.
Zhang L., F. Sielmann, K, Fraedrich, X. H. Zhu and X. F. Zhi, 2015. Variability of winter extreme precipitation in Southeast China: contributions of SST anomalies. Clim. Dynam., doi:10.1007/s00382-015-2492-6.
Zhi X. F., 2001. Interannual variability of the Indian sum-mer monsoon and its modeling with zonally symmetric 2D-model. Shaker Verlag, Germany, 150 pp.
Zimin A. V., I. Szunyogh, D. J. Patil, B. R. Hunt and O. Edward, 2003. Extracting envelopes of Rossby wave packets. Mon. Weather Rev. 131, 1011-1017.