atm performance frameworkatm performance framework · performance review commission atm performance...
TRANSCRIPT

Pe
rfo
rma
nc
e R
ev
iew
Co
mm
iss
ion
Pe
rfo
rma
nc
e R
ev
iew
Co
mm
iss
ion
ATM Performance FrameworkATM Performance Framework
NAS Performance Workshop
5 September 2007
Xavier FRON
Performance Review Unit
EUROCONTROL

2
Performance Review Commissionwww.eurocontrol.int/prc
Role of performance review
• Provide independent advice on ANS/ATM performance to policy makers and relevant information to all stakeholders (e.g. benchmarking and best practice), based on observation of achieved performance, consultation and information provided by relevant parties;
• Performance review closes the performance loop;
• It is the least intrusive form of regulation;
Policy makers
Policy
objectives Achieved
Performance
Legislation
Institutions
Industrial Organisation
Air Navigation
ANS Providers
Supervisory authorities
Common functions
Airspace
users
Airport
operators
PerformanceReview
Advice on
performance
issuesPerformance
information
Consultation
Raw
information

3
Performance Review Commissionwww.eurocontrol.int/prc
Performance Review Commission (PRC)
� Independent advisory role to EUROCONTROL governing bodies
� Twelve commissioners supported by the PRU
Objective“to introduce strong, transparent and independent
performance review and target setting to facilitate more effective management of the European ATM system…”
Annual Performance Review Reports (PRR)– Traffic– Key ATM Performance Areas
• Safety• Cost-effectiveness• Quality of service/ Environment• Capacity
ANSP benchmarking reports (ACE)
Special reports– Evaluation of SES impact on ATM performance– Fragmentation– Punctuality drivers, etc.– US/Europe comparison– Comparison of aeronautical MET costs
37 States9.6 M flights
PRR 2006 just published

4
Performance Review Commissionwww.eurocontrol.int/prc
Overview of ATM performance measurement framework
ENVIRONMENT SECURITYECONOMYSAFETY
Political &Socio-
EconomicExpectations
Airspace user
needs and
requirements
Service ProviderPerspective/
ATM contribution
Safety
Traffic volume, variability,
complexity)
Network effects & fragmentation
WeatherPerformance
affecting
factors
Regulations/ restrictions(Political & Environmental)
Technical innovations
Cost-
effectiveness
User charges
Service Quality•Efficiency•Predictability•Flexibility
CapacitySafety
management
Prevailing
economic
conditions
Security
management
Security
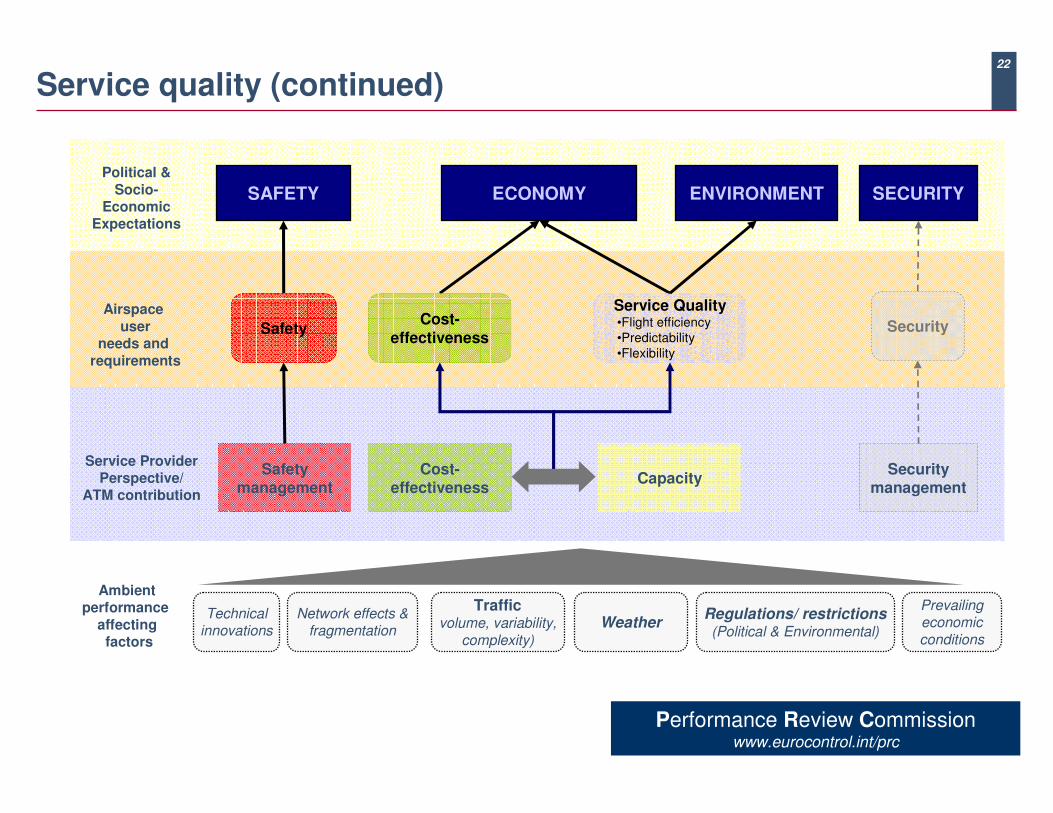
• Various perspectives on ATM performance (Political/ Social, User, Service provider);
• The PRC focuses on: Safety, Cost-effectiveness, Service Quality (Delays, flight efficiency) , Capacityand Environment (Global aspects)
• ATM performance is affected by trade-offs (capacity vs. delay, etc.) and a number of performance affecting factors (weather, complexity, etc.) which need to be captured in a balanced view
Safety
Cost Effectiveness
Capacity
Quality of service
PRC Key performance areas
Environment

5
Performance Review Commissionwww.eurocontrol.int/prc
How the PRC analyses ANS performance
Punctuality & Predictability(Chapter 4)
Productivity
Support Costs
Performance Indicators
Complexity
Fragmentation
PerformanceDrivers
CostEffectiveness(Chapter 8)
ATFMDelays
(Chapter 5)
Safety(Chapter 3)
FlightEfficiency
(Chapter 6)
ANS Key Performance
Areas
ANSPerformance
En-route delays
Airport delays
Air Transport performance
AIS, MET costs
Accidents
Incidents(a/c proximities)
ATCO Unit Costs ANSP costs
EUROCONTROLcosts
Traffic demand(Chapter 2)
Capacity
Airline Performance
Airport Performance
Horizontal Flight efficiency
Vertical FlightEfficiency
Airspace design & use
Civil/Military use of airspace (Chapter 7)
Safety maturityLegislative framework
Culture
Safety Management
Systems
Cost of living

6
Performance Review Commissionwww.eurocontrol.int/prc
Air traffic demand in Europe
8%
4%
5%
4%
13%
2%
4%
6%
4%
1%
19%
3%
2%
3%
9%
5%4%
0%
5%
5%
11%
6%
4%
6%
13%
2%
7%
6%
11%
5%
2%7%
2%
4%
3%
0%
Annual growth in IFR Movements 2006
Pro
du
ce
d b
y t
he
Da
ta I
nfo
rma
tio
n &
An
aly
sis
(D
IA)
Bu
sin
es
s D
ivis
ion
. ©
EU
RO
CO
NT
RO
L 2
00
6.
Below 0%
0% to 3%
3% to 6%
6% to 9%
9% to 12%
Above 12%
5%
Canarias
6%
Azores
data source : EUROCONTROL/STATFOR
Sustained growth continued in 2006
• Average annual growth +4.1%;
• Between 0% and 19% at State level;
• +24% for “low fare” airlines (16% of traffic)
• +11% for business aviation (7% of traffic)
3%3%3%
-2%
2%5%
7%6%2%
6%4%
6%5%6%
5%3%
5% 4%4% 4%3%3%
0%
0
2
4
6
8
10
12
19
90
19
92
19
94
19
96
19
98
20
00
20
02
20
04
20
06
20
08
20
10
20
12
mill
ion
flig
hts
pe
r y
ea
r
Year o n year variatio n
2007 Forecas t
so urce : EUROCONTROL
( before 1997, estimation based on Euro 88 traffic variation)
Traffic

7
Performance Review Commissionwww.eurocontrol.int/prc
Traffic forecasts
• Short, medium , long term forecasts from EUROCONTROL STATFOR
• Challenges to Growth study (2004)being updated
• Suppressed demand due to airport capacity limitations
Heathrow traffichas grown by filling
the gaps
8
Performance Review Commissionwww.eurocontrol.int/prc
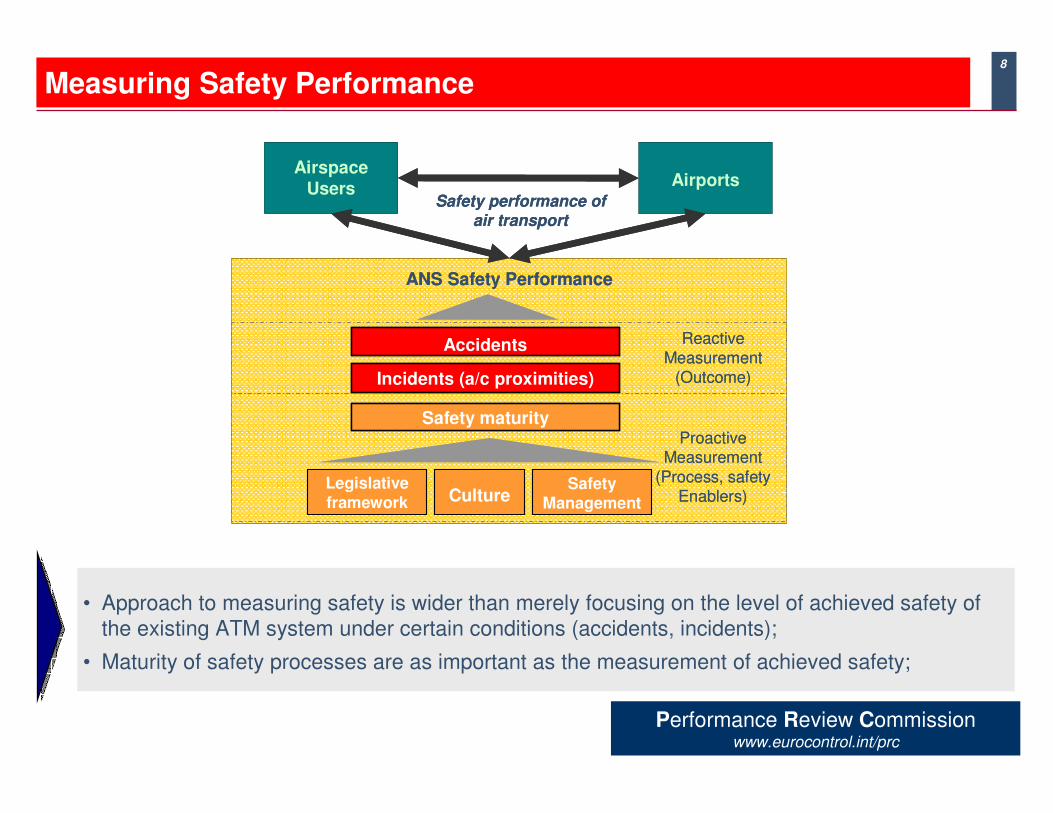
Measuring Safety Performance
• Approach to measuring safety is wider than merely focusing on the level of achieved safety of the existing ATM system under certain conditions (accidents, incidents);
• Maturity of safety processes are as important as the measurement of achieved safety;
ANS Safety Performance
Accidents
Incidents (a/c proximities)
Safety maturity
Legislative framework Culture
Safety Management
ProactiveMeasurement
(Process, safetyEnablers)
ReactiveMeasurement
(Outcome)
AirportsAirspace
UsersSafety performance of
air transport
ANS Safety Performance
Accidents
Incidents (a/c proximities)
Safety maturity
Legislative framework Culture
Safety Management
ProactiveMeasurement
(Process, safetyEnablers)
ReactiveMeasurement
(Outcome)
AirportsAirspace
UsersSafety performance of
air transport

9
Performance Review Commissionwww.eurocontrol.int/prc
Accidents/incidents
0
2
4
6
8
10
12
14
16
18
20
1992 1993 1994 1995 1996 1997 1998 1999 2000 2001 2002 2003 2004 2005 2006
To
tal
nu
mb
er
of
acccid
en
ts
Direct ATM
Accidents
Trend
Data source: Flight Safety Foundation - Aviation Safety Net
ANS Safety Performance
Accidents
Incidents (a/c proximities)
Safety maturity
Legislative framework Culture
Safety Management
ProactiveMeasurement
(Process, safetyEnablers)
ReactiveMeasurement
(Outcome)
AirportsAirspace
UsersSafety performance of
air transport
ANS Safety Performance
Accidents
Incidents (a/c proximities)
Safety maturity
Legislative framework Culture
Safety Management
ProactiveMeasurement
(Process, safetyEnablers)
ReactiveMeasurement
(Outcome)
AirportsAirspace
UsersSafety performance of
air transport
Accidents
A posteriori check
Lagging indicatorIt’s too late!
Leading indicatorInforms safety management
Voluntary reports: Useful, but reliable?Systematic screening
Loss of separation,runway incursions, etc
38% 28% 21% 23%
0
200
400
600
800
1000
1200
1400
2002 2003 2004 2005P
15 States
CL
as
sifi
ed
ev
en
ts
Severity C,D,E
Severity B
Severity A
% :Proportion of Severity A+B
Data source : EUROCONTROL/SRU
Incident reports

10
Performance Review Commissionwww.eurocontrol.int/prc
Safety maturity
ANS Safety Performance
Accidents
Incidents (a/c proximities)
Safety maturity
Legislative framework Culture
Safety Management
ProactiveMeasurement
(Process, safetyEnablers)
ReactiveMeasurement
(Outcome)
AirportsAirspace
UsersSafety performance of
air transport
ANS Safety Performance
Accidents
Incidents (a/c proximities)
Safety maturity
Legislative framework Culture
Safety Management
ProactiveMeasurement
(Process, safetyEnablers)
ReactiveMeasurement
(Outcome)
AirportsAirspace
UsersSafety performance of
air transport
██UK
██Switzerland
██Sweden
██Spain
██Slovenia
██Slovakia
██Romania
██Portugal
██Poland
██Norway
██Netherlands
██Luxembourg
██Italy
██Ireland
██Hungary
██Greece
██Germany
██France
██Finland
██Denmark
██Czech Rep.
██Cyprus
██Bulgaria
██Belgium
██Austria
CultureLegislation
ANSPs
0
10
20
30
40
50
60
70
80
90
100
0 5 10 15 20 25 30 35 40
Ma
turi
ty S
co
re
2002
2004
2006
Are safety processes, legislation, culture in place?
Maturity surveys

11
Performance Review Commissionwww.eurocontrol.int/prc
Safety Performance targets
0
1
2
3
4
8 9 10 11 12 13 14 15 16
Traffic (million flights)
Risk trend Risk target
OUTLOOKSystem riskis quadratic:
Incidents/hour x4when traffic x2
Aircraft riskis linear:Incidents
per flight-hour x2when traffic x2
38% 28% 21% 23%
0
200
400
600
800
1000
1200
1400
2002 2003 2004 2005P
15 States
CL
as
sifi
ed
ev
en
ts
Severity C,D,E
Severity B
Severity A
% :Proportion of Severity A+B
Data source : EUROCONTROL/SRU
Performance to date
• Increasing number of incidents reports:more opportunities for learning, prevention
• Severe incidents (A&B) don’t appear to increase in sample of 15 “mature” European States
Target (s)
• European (ATM 2000+) objective: Number of accidents and serious incidents not to increase: Very challenging!
• Current target: <1.55.10-8 accident per flight hourNo corresponding indicator so far
• PRC proposed interim target (maturity)
Future system
• Safety may be the most challenging
• Safety needs to be engineered in next generation design from the start
TODAY
SESAR target
- System risk does not increase (no more accidents)
- 2020: Traffic: +73% => Safety x3 vs trend
- Later: Traffic x3 => Safety x10 vs trend

12
Performance Review Commissionwww.eurocontrol.int/prc
Service quality
ENVIRONMENT SECURITYECONOMYSAFETY
Political &
Socio-Economic
Expectations
Airspace
userneeds and
requirements
Service ProviderPerspective/
ATM contribution
Safety
Traffic volume, variability,
complexity)
Network effects & fragmentation
Weather
Ambientperformance
affectingfactors
Regulations/ restrictions(Political & Environmental)
Technical innovations
Cost-effectiveness
Cost-effectiveness
Service Quality•Flight efficiency•Predictability•Flexibility
CapacitySafety
management
Prevailing economic
conditions
Securitymanagement
Security

13
Performance Review Commissionwww.eurocontrol.int/prc
Analysis of Air transport delays
Punctuality
% On-time
Schedule
Early arrival
OUT OFF ON IN
Buffer
Late arrival
AirborneTaxi Out Taxi In
Behind schedule
Ahead of schedule
Delay
ON Time
Mean (50%)
Time
80%
StdDev
Predictability
Spread
(Standard deviation)
Time of operation
Nu
mb
er
of
ob
se
rvati
on
s
(2)(2)
(1)(1) (1)(1)
Reduce variability
Closer to optimum
Optimising performanceHigh added-value:
Compressing half of European flight schedules by 5 minutes is worth some €1,000M p.a.
3%
12%
5%
3%1% 1%
11%
18%
22%22%
1%
0%
5%
10%
15%
20%
25%
0-2
2-4
4-6
6-8
8-1
0
10-1
2
12-1
4
14-1
6
16-1
8
18-2
0
20-2
2
22-2
4
24-2
6
26-2
8
28-3
0
>30
Time bands in minutes
% o
f o
per
ated
ser
vic
es (
200
4)
Data source: EUROCONTROL/ eCODA
"Time to Take-off" distribution - Charles de Gaulle Airport

14
Performance Review Commissionwww.eurocontrol.int/prc
Departure punctuality
• 21.4% of flights arrived late in 2006 (23.1% in US)• Departure delays originate principally from turn-around processes (79% of primary dep. delays)
• Reactionary delays are increasing
7.9%5.6% 4.5%
2.1% 1.6% 1.4% 1.5% 1.6%1.1% 1.2% 1.2% 1.1%
10%9% 10%
8% 8% 8% 9% 10%
13%
10% 9%
7% 6%7%
9%10%
0%
5%
10%
15%
20%
25%
30%
35%
1999 2000 2001 2002 2003 2004 2005 2006% o
f flig
hts
with
dep
art
ure
de
lay
> 1
5 m
in.
En-route ATFM regulations due to ATC Airport ATFM regulations (weather, capacity)
Turn around delays (airline, airport, etc.) Reactionary delays
69.0%
Primary delay distribution (2006)
9%
12%79%
74.4% 75.2% 82.5% 83.6% 81.8% 79.8%
source: AEA source: eCODA
Departure Punctuality78.1%
0.50
0.55
0.60
0.65
0.70
0.75
0.80
1999 2000 2001 2002 2003 2004 2005 2006
rati
o r
eac
tio
na
ry t
o p
rim
ary
dela
y
Sensitivity of the European air transport network to primary delays
AEA data eCODA data
Primary delay includes local turn around delays and en-route and airport ATFM delays
Punctuality
Reactionary/primary delays

15
Performance Review Commissionwww.eurocontrol.int/prc
Arrival and departure delays
Arrival delays are mostly driven by departure delaysDeparture delays mostly from airlines/airports processesAmplification of delays at some airports(Departure delays > arrival delays)
20
%
19
%
20
%
18
%
23
%
29
%
20
%
20
%
20
%
25
%
0%
5%
10%
15%
20%
25%
30%D
ep.
toA
rr.
at
De
p.
fro
m
De
p.
toA
rr.
at
De
p.
fro
m
De
p.
toA
rr.
at
De
p.
fro
m
De
p.
toA
rr.
at
De
p.
fro
m
De
p.
toA
rr.
at
De
p.
fro
m
De
p.
toA
rr.
at
De
p.
fro
m
De
p.
toA
rr.
at
De
p.
fro
m
De
p.
toA
rr.
at
De
p.
fro
m
De
p.
toA
rr.
at
De
p.
fro
m
De
p.
toA
rr.
at
De
p.
fro
m
BCN CDG FCO FRA LHR MAD MUC MXP VIE ZRH
En-route ATFM delay Airport ATFM delay
Local turn-around delay (airlines, airport, etc.) Reactionary delay
% of
flig
hts
depa
rtin
g/
arr
ivin
g m
ore
than
15 m
in. b
ehin
d s
chedule
(2005)
Departure punctuality of inbound
flights at departure airports
Departure punctuality of outbound
flights at analysed airports
Arrival punctuality of inbound
flights at arrival airports
FLIGHT PERSPECTIVE
Drivers of departure delay:
source: eCODA

16
Performance Review Commissionwww.eurocontrol.int/prc
• Standard deviations of departure and arrival times reached 18 and 20 minutes respectively
• Pre-departure processes play a main role in this poor predictability, and ATM only a minor role.
• Lower punctuality and predictability negatively impacts the ability of airlines and airports to build and operate reliable and efficient schedules.
Air transport predictability
0.0
2.5
5.0
7.5
10.0
12.5
15.0
17.5
20.0
22.5
25.0
27.5
De
pa
rtu
retim
e
Ta
xi o
ut
+h
old
ing
Flig
ht
time
s
(cru
isin
g +
term
ina
l)
Ta
xi in
+w
aitin
g f
or
ga
te
Arr
iva
l tim
e
2002 2003 2004 2005 2006
0.0
2.5
5.0
7.5
10.0
12.5
15.0
17.5
20.0
22.5
25.0
27.5
De
pa
rtu
retim
e
Ta
xi o
ut
+h
old
ing
Flig
ht
tim
es
(cru
isin
g +
term
ina
l)
Ta
xi in
+
wa
itin
g f
or
ga
te
Arr
iva
l tim
e
Intra European flights (89%) Flights from/to Europe (11%)
Gate-to-gate variability Gate-to-gate variability
Sta
nd
ard
de
via
tion
(m
inute
s)
Time of operation
Nu
mb
er
of
ob
se
rvati
on
s
(2)(2)
(1)(1) (1)(1)
Reduce variability
Closer to optimum

17
Performance Review Commissionwww.eurocontrol.int/prc
• Trade-off airport capacity / airborne delay
• Airport scheduling impacts ATM performance (TMA holding, environmental impact)
• Smoothing arrival flows and landing rates significantly improves the trade-off
Airport capacity/ delay trade-off
0
0.5
1
1.5
2
2.5
3
3.5
4
4.5
5
0.8 0.82 0.84 0.86 0.88 0.9 0.92 0.94 0.96 0.98 1
Runway utilisation ratio
QU
EU
E L
EN
GT
H (
un
its o
f la
nd
ing
in
terv
al)
39 Sec. 30 Sec.
18 Sec. 0 Sec.
Variability of landing interval (std. dev.)
Variability of TMA entry flow (std. dev.) =20 MIN =2 MIN
Reduced variability of
landing interval
Reduced variability of
TMA entry flow

18
Performance Review Commissionwww.eurocontrol.int/prc
• Air transport punctuality and predictability could be improved in several ways:
- Improving adherence to scheduled departure times
- Maximising the use of airport capacity whilst minimising delays.
- Optimising the ground vs. airborne holding trade-off.
• SESAR places emphasis on flexibility (ability to recover from non nominal situations)
• Comparable metrics to be developed and agreed (Punctuality, ATM ground and airborne delay, etc).
Improving air transport network performance
TMA
Arrival airportDeparture airport
En-route
ATFM delays
Airport ATFM delays
Airborne holding
Reactionary
delays
Network delivery
(volume and variability of TMA entry flow)
Airport
scheduling(utilisation ratio)
Management ofarrival flows
Landing interval (actual throughput)
Local
turnaround delays
Arrival time variability
Departure time variability
Pre-departuredelays
19
Performance Review Commissionwww.eurocontrol.int/prc
50
75
100
125
150
175
200
225
250
275
300
1990
1991
1992
1993
1994
1995
1996
1997
1998
1999
2000
2001
2002
2003
2004
2005
2006
2007
2008
2009
2010
km
in
dex 1
99
0=
100
0
5
10
15
20
25
30
mill
ion m
inute
s
Traffic volume (km)
Effective Capacity
En-route ATFM delay
source : EUROCONTROL
Widening
capacity gap
Closing
capacity gap
Closing
capacity gap
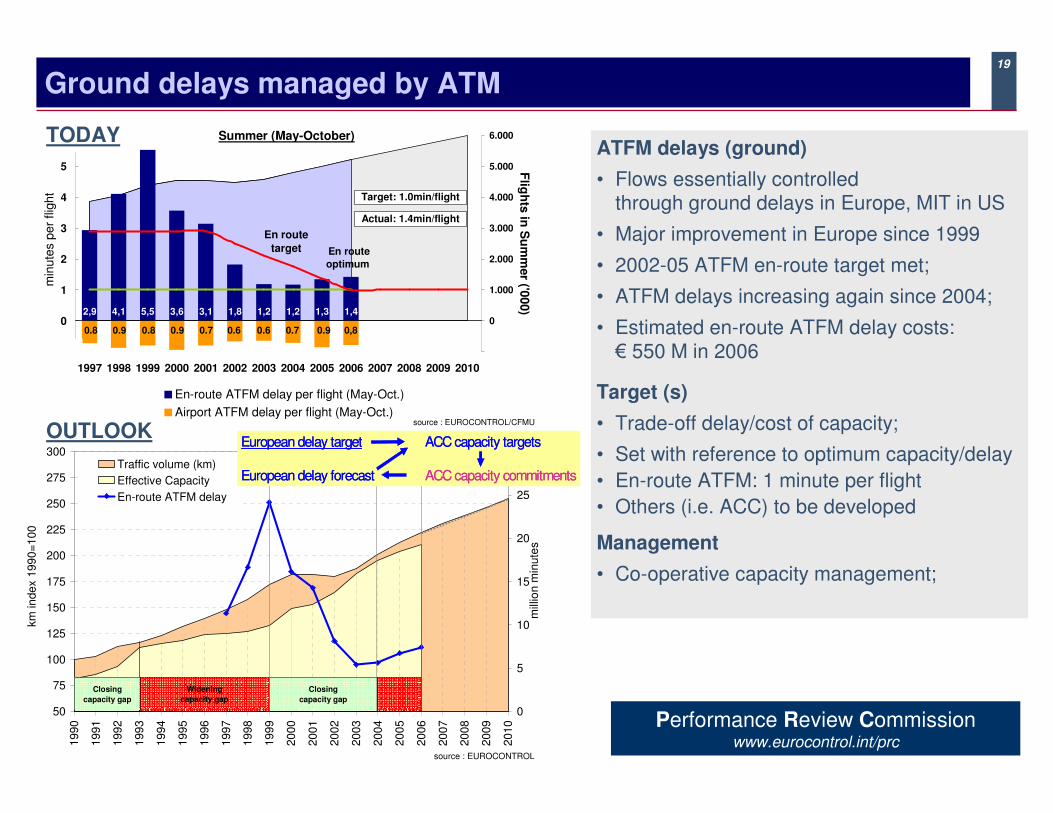
Ground delays managed by ATM
European delay target ACC capacity targets
European delay forecast ACC capacity commitments
European delay target ACC capacity targets
European delay forecast ACC capacity commitments
1,3 1,41,21,83,13,65,54,12,9 1,2
-1
0
1
2
3
4
5
6
1997 1998 1999 2000 2001 2002 2003 2004 2005 2006 2007 2008 2009 2010
min
ute
s p
er
flig
ht
-1.000
0
1.000
2.000
3.000
4.000
5.000
6.000
Flig
hts
in S
um
mer ('0
00)
En-route ATFM delay per flight (May-Oct.)
Airport ATFM delay per flight (May-Oct.)
En route
target En route
optimum
Target: 1.0min/flight
Actual: 1.4min/flight
Summer (May-October)
source : EUROCONTROL/CFMU
0.8 0.9 0.8 0.9 0.7 0.6 0.6 0.7 0.9 0,8
TODAYATFM delays (ground)
• Flows essentially controlled through ground delays in Europe, MIT in US
• Major improvement in Europe since 1999
• 2002-05 ATFM en-route target met;
• ATFM delays increasing again since 2004;
• Estimated en-route ATFM delay costs:€ 550 M in 2006
Target (s)
• Trade-off delay/cost of capacity;
• Set with reference to optimum capacity/delay
• En-route ATFM: 1 minute per flight
• Others (i.e. ACC) to be developed
Management
• Co-operative capacity management;
OUTLOOK

20
Performance Review Commissionwww.eurocontrol.int/prc
ATFM Delays: Target setting
• Trade-off delay/cost of capacity
• Target setting based on understanding of optimum
• Optimum changes with improved cost-effectiveness (dynamic efficiency)
Static economic
optimum
Dynamic
economic
optimum
Delay costs
Cost of capacity
Total economic
costs
Capacity/demand ratio
Yea
rly c
osts

21
Performance Review Commissionwww.eurocontrol.int/prc
ATFM delay causes
0
100
200
300
400
500
600
700
1 2 3 4 5 6 7 8 910
11
12
13
14
15
16
17
18
19
20
21
22
23
24
25
26
27
28
29
30
31
32
33
34
35
36
37
38
39
40
41
42
43
44
45
46
47
48
49
50
51
52
JAN FEB MAR APR MAY JUN JUL AUG SEP OCT NOV DEC
En
-ro
ute
AT
FM
de
lay (
'00
0)
ATC CAPACITY (2006) ATC IND ACTION (2006)
ATC STAFFING (2006) WEATHER (2006)
OTHER (2006) Total en-route ATFM delay (2005)
0
2 000
4 000
6 000
8 000
10 000
12 000
20
04
20
05
20
06
Weekly en-route ATFM delay distribution Annual
source: EUROCONTROL
22
Performance Review Commissionwww.eurocontrol.int/prc
Service quality (continued)
ENVIRONMENT SECURITYECONOMYSAFETY
Political &
Socio-Economic
Expectations
Airspace
userneeds and
requirements
Service ProviderPerspective/
ATM contribution
Safety
Traffic volume, variability,
complexity)
Network effects & fragmentation
Weather
Ambientperformance
affectingfactors
Regulations/ restrictions(Political & Environmental)
Technical innovations
Cost-effectiveness
Cost-effectiveness
Service Quality•Flight efficiency•Predictability•Flexibility
CapacitySafety
management
Prevailing economic
conditions
Securitymanagement
Security

23
Performance Review Commissionwww.eurocontrol.int/prc
Flight Efficiency
PRC uses same framework as ICAO ANSEP
0
10
20
30
40
50
60
2004 2005 2006 2007 2008 2009 2010
rou
te e
xte
ns
ion
(k
m/f
lig
ht)
Direct en route
TMA Interface
Proposed target
- 2 km per f light
Actual Route (A)
Great Circle (G)
Direct route Extension
Direct Course (D)
TMA Interface
Route Extension
A
DG
30 NM
24
Performance Review Commissionwww.eurocontrol.int/prc
data source : U.S. Department of Energy (Rotterdam Jet Fuel Spo t Price)
0
20
40
60
80
100
120
19
87
19
88
19
89
19
90
19
91
19
92
19
93
19
94
19
95
19
96
19
97
19
98
19
99
20
00
20
01
20
02
20
03
20
04
20
05
20
06
US
$ 2
00
6 p
er
barr
el
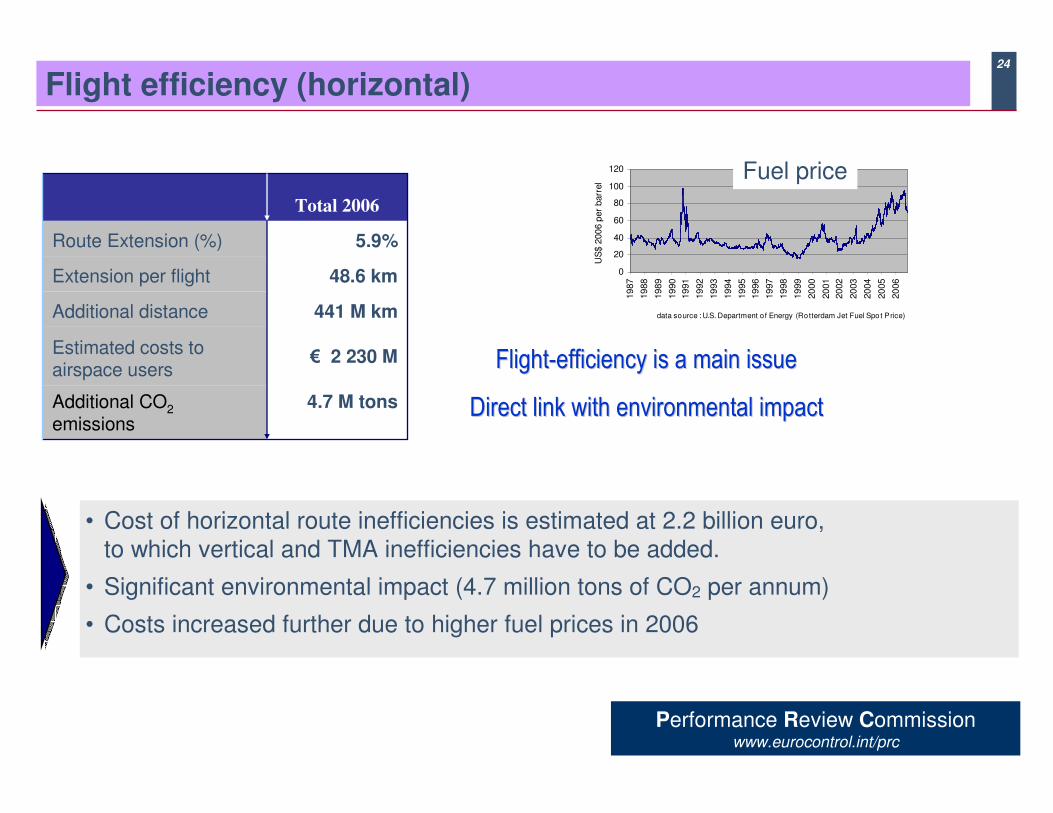
Flight efficiency (horizontal)
• Cost of horizontal route inefficiencies is estimated at 2.2 billion euro, to which vertical and TMA inefficiencies have to be added.
• Significant environmental impact (4.7 million tons of CO2 per annum)
• Costs increased further due to higher fuel prices in 2006
FlightFlight--efficiency is a main issueefficiency is a main issue
Direct link with environmental impactDirect link with environmental impact4.7 M tonsAdditional CO2
emissions
€ 2 230 MEstimated costs to airspace users
441 M kmAdditional distance
48.6 kmExtension per flight
5.9%Route Extension (%)
Total 2006
Fuel price

25
Performance Review Commissionwww.eurocontrol.int/prc
Improving Flight-efficiency
ATC routingRoute selectionEn-route designTotal
ATC routingRoute selectionEn-route designTotal
874.6 km
882.8 km
874.1 km
826.0 km
En-route
Extension
Actual route
(A)
Shortest Route
(S)
Filed Route
(F)
ATC routing
Route selection
En-route design
Great Circle
(G)
-1.0%
1.1%
5.8%
+ 48.6 km
- 8.2 km
+ 8.7 km
+ 48.0 km
5.9%
Strategic design and use of airspace are the main origins of route inefficiencies
26
Performance Review Commissionwww.eurocontrol.int/prc
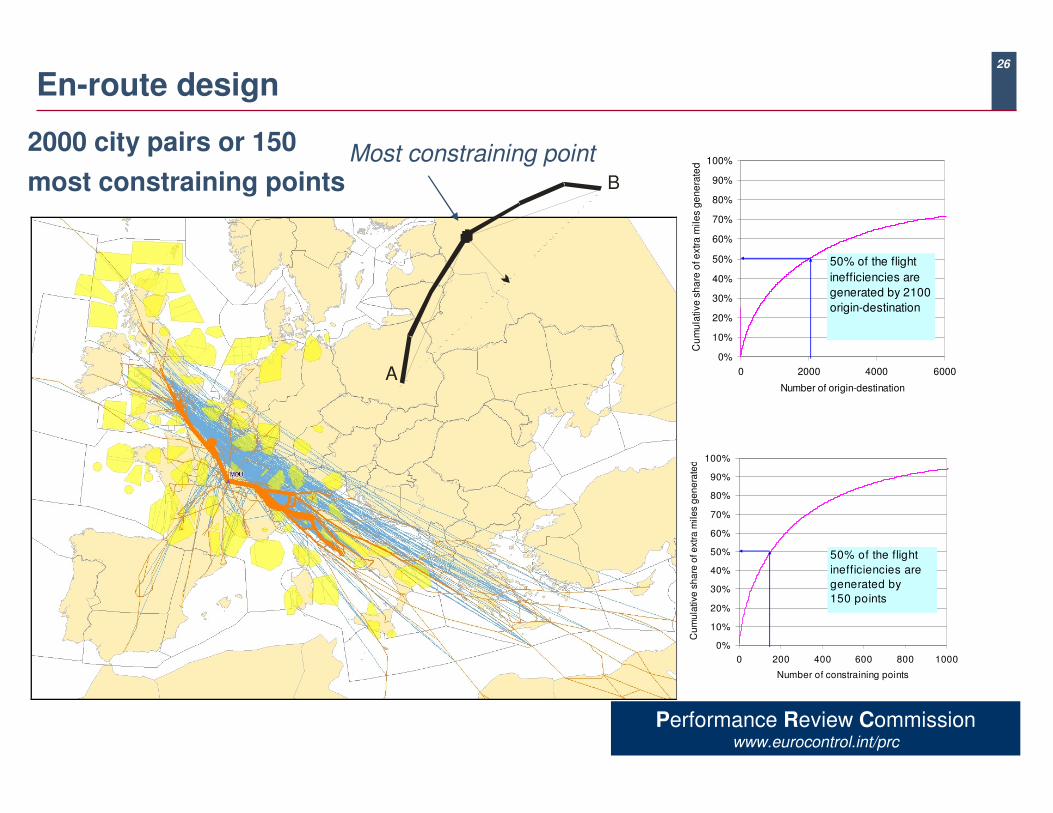
En-route design
2000 city pairs or 150
most constraining points
0%
10%
20%
30%
40%
50%
60%
70%
80%
90%
100%
0 2000 4000 6000
Number of origin-destination
Cu
mu
lative
sh
are
of e
xtr
a m
ile
s g
en
era
ted
50% of the flight
inefficiencies are
generated by 2100
origin-destination
0%
10%
20%
30%
40%
50%
60%
70%
80%
90%
100%
0 200 400 600 800 1000
Number of constraining points
Cu
mu
lative
sh
are
of e
xtr
a m
iles g
en
era
ted
50% of the flight
inefficiencies are
generated by
150 points
Most constraining point
A
B

27
Performance Review Commissionwww.eurocontrol.int/prc
Flight efficiency (horizontal)
4.1%3.8%
4.1%3.8%
0%
1%
2%
3%
4%
5%
Week Days Week End
2005
2006
•Only minimal improvements in flight efficiency during week-ends (essentially no airspace restrictions)
=> 130 million Euro could be saved every year if the route network was one third more efficient during week-ends.
•Intra-European routes are significantly less efficient than domestic routes.
=> If the European route network was as efficient as the domestic networks, as one would expect under the SES, 150 to 300 million Euro could be saved every year.
There appears to be room for significant improvements:
0%
1%
2%
3%
4%
5%
6%
7%
0-400 km 400-800 km 800-1200 km 1200-1600 km 1600 -2000 km >2000 km
Great Circle Distance (between TMA)
Dir
ec
t ro
ute
ex
ten
sio
n (
%)
Domestic Intra-European Domestic-AVG Intra-European-AVG
Direct route efficiency

28
Performance Review Commissionwww.eurocontrol.int/prc
Flight efficiency (horizontal)
• Trade-off capacity – flight-efficiency: don’t jeopardize capacity where little margin
• Objective: a more efficient Trans-European network of upper airways
DemandDemand

29
Performance Review Commissionwww.eurocontrol.int/prc
Flight-efficiency: Route selection
Airspace structure En-route congestion
Route chargedifferentials
Example: Amsterdam to Torino
ATC routingRoute selectionEn-route designTotal
ATC routingRoute selectionEn-route designTotal
874.6 km
882.8 km
874.1 km
826.0 km
En-route
Extension
Actual route
(A)
Shortest Route
(S)
Filed Route
(F)
ATC routing
Route selection
En-route design
Great Circle
(G)
-1.0%
1.1%
5.8%
+ 48.6 km
- 8.2 km
+ 8.7 km
+ 48.0 km
5.9%

30
Performance Review Commissionwww.eurocontrol.int/prc
Flight Efficiency (horizontal): Conclusions
Target Performance to date
• Horizontal en-route flight efficiency is a major ATM performance issue;
• Cost of horizontal en-route route inefficiencies is estimated at 2.2 billion Euro;
• Significant environmental impact (4.7 million tons of CO2 per annum);
• Costs increased further due to higher fuel prices in 2006;
Indicators and trade-offs
• Safety and capacity gains require a certain level of “inefficiency” in the route network;
• Focus has been on safety and capacity so far;
• Need to develop indicators to measure vertical flight efficiency and TMA inefficiencies (airborne holdings);
Target
• Agreed target is to reduce the additional distance flown due to route extension by 2 km per flight each year until 2010
OUTLOOK
0
10
20
30
40
50
60
2004 2005 2006 2007 2008 2009 2010
rou
te e
xte
nsio
n (
km
/flig
ht)
Direct en route
TMA Interface
Proposed target
- 2 km per f light
-2.3-1.0-0.20CO2
savings (million tons)
-1 080-450-1000Cost savings (million euro)
-216-90-200Distance saved (million km)
40.646.648.6Target (km per flight)
11.210.09.6Number of flights (million)
Total201020072006

31
Performance Review Commissionwww.eurocontrol.int/prc
Framework for analysis of ATM performance
ENVIRONMENT SECURITYECONOMYSAFETYPolitical &
Socio-Economic
perspective
Airspace
users
perspective
Service
providerperspective
Safety
Traffic (volume, complexity)
Network effects & fragmentation
Runwayincursions
Safety culture (reporting, etc.)
Airspace events
Safety management
Weather
To be developed
Technical innovations
Quality of
service
Flexibility
Predictability
Strategic costs (buffer)
Costs due to sub-optimal operations
Efficiency
Airport/TMA capacity
ATFM/ Networkcapacity
Capacity management
En-route capacity
Use of
airspace
Cost-effectiveness
ATCO productivity
Employment costs
Support costs
Cost management
MET costs
Eurocontrolcosts
ATM/CNSProvision cost
Reg. costs
ANS provision costs
Ambient
performance affecting
factors
Gaseous
emissions
Flight
efficiency
Grounddelay
Political/ Environ. Regulations/ restrictions