atm forum performance testing specificationsjain/atmf/ftp/atm96-0810r0.pdfintroduction to atm forum...
TRANSCRIPT

Technical Committee
Introduction to ATM ForumPerformance Benchmarking
Testing Specifications
May07/17/96 10:21 AMJune, 1996
96-0810R1

96-0810R1af-test-0022.000Introduction to ATM Forum Performance Test ing Specifications
Page iiii ATM Forum Technical Committee
Introduction to ATM Forum Performance Benchmarking Testing SpecificationsVersion 1.0
May,June 1996
(C) 1996 The ATM Forum. All Rights Reserved. No part of this publication may be reproducedin any form or by any means.
The information in this publication is believed to be accurate at its publication date. Suchinformation is subject to change without notice and the ATM Forum is not responsible for anyerrors. The ATM Forum does not assume any responsibility to update or correct any informationin this publication. Notwithstanding anything to the contrary, neither The ATM Forum nor thepublisher make any representation or warranty, expressed or implied, concerning thecompleteness, accuracy, or applicability of any information contained in this publication. Noliability of any kind shall be assumed by The ATM Forum or the publisher as a result of relianceupon any information contained in this publication.
The receipt or any use of this document or its contents does not in any way create by implicationor otherwise:
� Any express or implied license or right to or under any ATM Forum member company�spatent, copyright, trademark or trade secret rights which are or may be associated with theideas, techniques, concepts or expressions contained herein; nor
� Any warranty or representation that any ATM Forum member companies will announce anyproduct(s) and/or service(s) related thereto, or if such announcements are made, that suchannounced product(s) and/or service(s) embody any or all of the ideas, technologies, orconcepts contained herein; nor
� Any form of relationship between any ATM Forum member companies and the recipient oruser of this document.
Implementation or use of specific ATM recommendations and/or specifications orrecommendations of the ATM Forum or any committee of the ATM Forum will be voluntary, andno company shall agree or be obliged to implement them by virtue of participation in the ATMForum.
The ATM Forum is a non-profit international organization accelerating industry cooperation onATM technology. The ATM Forum does not, expressly or otherwise, endorse or promote anyspecific products or services.

Introduction to ATM Forum Performance Testing Specifications96-0810R1af-test-0022.000
ATM Forum Technical Committee Page iiiiii
Table of Contents
1. INTRODUCTION ............................................................................................................................................ 1
1.1 SCOPE ............................................................................................................................................................... 11.2 GOALS OF PERFORMANCE TESTING .................................................................................................................... 21.3 NON-GOALS OF PERFORMANCE TESTING ............................................................................................................ 31.5 TERMINOLOGY .................................................................................................................................................. 41.6 ABBREVIATIONS ................................................................................................................................................ 4
2. CLASSES OF APPLICATIONS ...................................................................................................................... 4
2.1 PERFORMANCE TESTING ABOVE THE ATM LAYER .............................................................................................. 52.2 PERFORMANCE TESTING AT THE ATM LAYER ..................................................................................................... 5
3. PERFORMANCE METRICS .......................................................................................................................... 7
3.1 THROUGHPUT................................................................................................................................................ 73.1.1 Definitions ............................................................................................................................................... 73.1.2 Units ........................................................................................................................................................ 83.1.3 Statistical Variations ................................................................................................................................ 83.1.4 Traffic Pattern ......................................................................................................................................... 93.1.5 Background Traffic ................................................................................................................................ 10
3.2 FRAME LATENCY ....................................................................................................................................... 103.2.1 Definition ............................................................................................................................................... 103.2.2 Units ...................................................................................................................................................... 113.2.3 Statistical Variations .............................................................................................................................. 113.2.4 Traffic Pattern ....................................................................................................................................... 113.2.5 Background Traffic ................................................................................................................................ 12
3.3 APPLICATION GOODPUT ................................................................................................................................... 123.4 REPORTING RESULTS ................................................................................................................................ 133.5 DEFAULT PARAMETER VALUES .............................................................................................................. 14
APPENDIX A: MIMO LATENCY .................................................................................................................... 15
1. INTRODUCTION ..........................................................................................................................................11
1.1 SCOPE .............................................................................................................................................................111.2 GOALS OF PERFORMANCE TESTING ..................................................................................................................211.3 NON-GOALS OF PERFORMANCE TESTING ..........................................................................................................321.4 STRUCTURE OF DOCUMENT .............................................................................................................................431.5 TERMINOLOGY ................................................................................................................................................431.6 ABBREVIATIONS ..............................................................................................................................................43
2. OBJECTIVES OF PERFORMANCE TESTING .........................................................................................44
3. CLASSES OF APPLICATIONS ....................................................................................................................45
3.1 PERFORMANCE TESTING ABOVE THE ATM LAYER............................................................................................563.2 PERFORMANCE TESTING AT THE ATM LAYER...................................................................................................56
4. PERFORMANCE METRICS ........................................................................................................................78
4.1 THROUGHPUT..............................................................................................................................................784.1.1 Definitions .............................................................................................................................................784.1.2 Units ......................................................................................................................................................894.1.3 Statistical Variations..............................................................................................................................89
96-0810R1af-test-0022.000Introduction to ATM Forum Performance Test ing Specifications
Page ivii ATM Forum Technical Committee
4.1.4 Traffic Pattern ..................................................................................................................................... 9104.1.5 Background Traffic ............................................................................................................................ 1012
4.2 FRAME LATENCY ................................................................................................................................... 10124.2.1 Definition........................................................................................................................................... 10124.2.2 Units .................................................................................................................................................. 11134.2.3 Statistical Variations.......................................................................................................................... 11134.2.4 Traffic Pattern ................................................................................................................................... 11134.2.5 Background Traffic ............................................................................................................................ 1214
4.3 APPLICATION GOODPUT ............................................................................................................................... 12144.4 REPORTING RESULTS ............................................................................................................................ 13154.5 DEFAULT PARAMETER VALUES.......................................................................................................... 1416
APPENDIX A: MIMO LATENCY................................................................................................................ 1517

Introduction to ATM Forum Performance Testing Specifications96-0810R1af-test-0022.000
ATM Forum Technical Committee Page 11
1. IntroductionPerformance testing in ATM deals with the measurement of the level of quality of a SUT or aIUT under well-known conditions. The level of quality can be expressed in the form of metricssuch as latency, end-to-end delay, effective throughput. Performance testing can be carried at theend-user application level (e.g., ftp, nfs) or at or above the ATM layers (e.g., cell switching,signaling, etc.). Performance testing also describes in details the procedures for testing the IUTsin the form of test suites. These procedures are intended to test the SUT or IUT and should notassume or imply any specific implementation or architecture of these systems.
This document contains a proposal for a baseline document for performance testing. It highlightsthe objectives of performance testing and suggests an approach for the development of the testsuites.
Performance testing has been referred to as "performance benchmarking" in other contributionspresented at the ATM Forum. For consistency with reference [1], it is recommended to use theterminology "performance testing" instead.
1.1 Scope
Asynchronous Transfer Mode, as an enabling technology for the integration of services, is gainingan increasing interest and popularity. ATM networks are being progressively deployed and inmost cases a smooth migration to ATM is prescribed. This means that most of the existingapplications can still operate over ATM via service emulation or service interworking along withthe proper adaptation of data formats. At the same time, several new applications are beingdeveloped to take full advantage of the capabilities of the ATM technology through anApplication Protocol Interface (API).
While ATM provides an elegant solution to the integration of services and allows for high levelsof scalability, the performance of a given application may vary substantially with the IUT or theSUT utilized. The variation in the performance is due to the complexity of the dynamicinteraction between the different layers. For example, an application running with TCP/IP stackswill yield different levels of performance depending on the interaction of the TCP window flowcontrol mechanism and the ATM network congestion control mechanism used. Hence, thefollowing points and recommendations are made. First, ATM adopters need guidelines on themeasurement of the performance of user applications under different SUTs. Second, somefunctions above the ATM layer, e.g., adaptation, signaling, constitute applications (i.e. IUTs) andas such should be considered for performance testing. Also, it is essential that these layers beimplemented in compliance with the ATM Forum specifications. Third, performance testing canbe executed at the ATM layer in relation to the QoS provided by the different service categories.Finally, because of the extensive list of available applications, it is preferable to group applicationsin generic classes. Each class of applications requires different testing environment such as

96-0810R1af-test-0022.000Introduction to ATM Forum Performance Test ing Specifications
Page 212 ATM Forum Technical Committee
metrics, test suites and traffic test patterns. It is noted that the same application, e.g., ftp, canyield different performance results depending on the underlying layers used (TCP/IP to ATMversus TCP/IP to MAC layer to ATM). Thus performance results should be compared based onthe utilization of the same protocol stack.
Performance testing benchmarking is related to user perceived performance of ATM technology.For the success of ATM technology, it is important that the performance of existing and newapplications be better than that of other competing networking technologies. In other words,goodness of ATM will not be measured by cell level performance but by frame-level performanceand performance perceived at higher layers.
Most of the quality of Service (QoS) metrics, such as cell transfer delay (CTD), cell delayvariation (CDV), cell loss ratio (CLR), and so on, may or may not be reflected directly in theperformance perceived by the user. For example, while comparing two switches if one gives aCLR of 0.1% and a frame loss ratio of 0.1% while the other gives a CLR 1% but a frame loss of0.05%, the second switch will be considered superior by many users,
ATM Forum and ITU have standardized the definitions of QoS metrics. We need to do the samefor higher level performance metrics. Without a standard definition, each vendor will use theirown definition of common metrics such as throughput and latency resulting in a confusion in themarket place. Avoiding such a confusion will help buyers eventually leading to better salesresulting in the success of the ATM technology.
The initial work at the ATM Forum will be restricted to the native ATM layer and the adaptationlayer. Any work on the performance of the higher layers will be deferred.
1.2 Goals of Performance Benchmarking Testing
The goal of this effort is to enhance the marketability of ATM technology and equipment. Anyadditional criteria that helps in achieving that goal can be added later to this list.
a. The ATM Forum shall define metrics that will help compare various ATM equipment in termsof performance.
b. The metrics shall be such that they are independent of switch or NIC architecture.
(I)1. The same metrics shall apply to all architectures.
c. The metrics can be used to help predict the performance of an application or to design anetwork configuration to meet specific performance objectives.
d. The ATM Forum will develop a precise methodology for measuring these metrics.

Introduction to ATM Forum Performance Testing Specifications96-0810R1af-test-0022.000
ATM Forum Technical Committee Page 31
(i)1. The methodology will include a set of configurations and traffic patterns that will allowvendors as well as users to conduct their own measurements.
e. The benchmarking testing shall cover all classes of service including CBR, VBRRT,VBRNRT, ABR, and UBR.
f. The metrics and methodology for different service classes may be different.
g. The testing shall cover as many protocol stacks and ATM services as possible.
(i)1. As an example, benchmarks for verifying the performance of services such as IP, FrameRelay and SMDS over ATM may be included.
h. The ttesting shall include metrics to measure performance of network management, connectionsetup, and normal data transfer.
I. The following objectives are set for ATM performance testing:
(i) Definition of criteria to be used to distinguish classes of applications.
(ii) Definition of classes of applications, at or above the ATM Layer, for which performancemetrics are to be provided.
(iii) Identification of the functions at or above the ATM Layer which influence the perceivedperformance of a given class of applications. Example of such functions include trafficshaping, quality of service, adaptation, etc. These functions need to be measured in order toassess the performance of the applications within that class.
(iv) Definition of common performance metrics for the assessment of the performance of allapplications within a class. The metrics should reflect the effect of the functions identified in(iii).
(v) Provision of detailed test cases for the measurement of the defined performance metrics.
1.3 Non-Goals of Performance Testing
a. The ATM Forum is not responsible for conducting any measurements.
b. The ATM Forum will not certify measurements.
c. The ATM Forum will not set thresholds such that equipment performing below thosethresholds are called "unsatisfactory."
d. The ATM Forum shall not establish any requirement that dictates a cost versus performanceratio.
96-0810R1af-test-0022.000Introduction to ATM Forum Performance Test ing Specifications
Page 412 ATM Forum Technical Committee
e. The following areas are excluded from the scope of ATM performance testing:
(i) Applications whose performance cannot be assessed by common implementation independentmetrics. In this case the performance is tightly related to the implementation. An exampleof such applications is network management which performance behavior depends on whetherit is a centralized or a distributed implementation.
(ii) Performance metrics which depend on the type of implementation or architecture of the SUTor the IUT.
(iii) Test configurations and methodologies which assume or imply a specific implementation orarchitecture of the SUT or the IUT.
(iv) Evaluation or assessment of results obtained by companies or other bodies.
(v) Certification of conducted measurements or of bodies conducting the measurements.
1.4 Structure of Document
This document is structured as follows:
- Section 1 constitutes the introduction. It describes the scope , goals and non-goals of theATM Forum,. The structure of the document and the terminology are listed.
- Section 2 provides the objective of Performance Testing.
-Section 3 explains the classes of applications. Performance testing is divided intomeasurement above the ATM Layer which includes AAL5 layer and the higher layers andat the ATM Layer.
- Section 4 describes the Living List. Performance Metrics
- Section 5 gives the conclusion.
1.5 Terminology
The following definitions are used in this document. Some of the definitions are taken wholly orpartly from [1].

Introduction to ATM Forum Performance Testing Specifications96-0810R1af-test-0022.000
ATM Forum Technical Committee Page 51
*Implementation Under Test (IUT): The part of the system that is to be tested.
*Metric: a variable or a function that can be measured or evaluated and which reflectsquantitatively the response or the behavior of an IUT or an SUT.
*System Under Test (SUT): The system in which the IUT resides.
*Test Case: A series of test steps needed to put an IUT into a given state to observe and describeits behavior.
*Test Suite: A complete set of test cases, possibly combined into nested test groups, that isnecessary to perform testing for an IUT or a protocol within an IUT.
1.6 Abbreviations
ISO International Organization for StandardizationIUT Implementation Under TestNP Network PerformanceNPC Network Parameter ControlPDU Protocol Data UnitPVC Permanent Virtual CircuitQoS Quality of ServiceSUT System Under TestSWG Sub Working GroupSVC Switched Virtual Circuit
2. Objectives of Performance TestingAsynchronous Transfer Mode, as an enabling technology for the integration of services, isgaining an increasing interest and popularity. ATM networks are being progressively deployedand in most cases a smooth migration to ATM is prescribed. This means that most of the existingapplications can still operate over ATM via service emulation or service interworking along withthe proper adaptation of data formats. At the same time, several new applications are beingdeveloped to take full advantage of the capabilities of the ATM technology through anApplication Protocol Interface (API).
While ATM provides an elegant solution to the integration of services and allows for high levelsof scalability, the performance of a given application may vary substantially with the IUT or theSUT utilized. The variation in the performance is due to the complexity of the dynamicinteraction between the different layers. For example, an application running with TCP/IP stackswill yield different levels of performance depending on the interaction of the TCP window flowcontrol mechanism and the ATM network congestion control mechanism used. Hence, thefollowing points and recommendations are made. First, ATM adopters need guidelines on the
96-0810R1af-test-0022.000Introduction to ATM Forum Performance Test ing Specifications
Page 612 ATM Forum Technical Committee
measurement of the performance of user applications under different SUTs. Second, somefunctions above the ATM layer, e.g., adaptation, signaling, constitute applications (i.e. IUTs)and as such should be considered for performance testing. Also, it is essential that these layers beimplemented in compliance with the ATM Forum specifications. Third, performance testing canbe executed at the ATM layer in relation to the QoS provided by the different service categories.Finally, because of the extensive list of available applications it is preferable to groupapplications in generic classes. Each class of applications requires different testing environmentsuch as metrics, test suites and traffic test patterns. It is noted that the same application, e.g.,ftp, can yield different performance results depending on the underlying layers used (TCP/IP toATM versus TCP/IP to MAC layer to ATM). Thus performance results should be comparedbased on the utilization of the same protocol stack.
The following objectives are set for ATM performance testing:
(I) Definition of criteria to be used to distinguish classes of applications. Example of criteria aregiven in Section 4.
(ii) Definition of classes of applications, at or above the ATM Layer, for which performance metrics are to be provided.
(iii) Identification of the functions at or above the ATM Layer which influence the perceivedperformance of a given class of applications. Example of such functions include trafficshaping, quality of service, adaptation, etc. These functions need to be measured in order toassess the performance of the applications within that class.
(iv) Definition of common performance metrics for the assessment of the performance of allapplications within a class. The metrics should reflect the effect of the functions identified in(iii).
(v) Provision of detailed test cases for the measurement of the defined performance metrics.
The following areas are excluded from the scope of ATM performance testing:
(I) Applications which whose performance cannot be assessed by common implementationindependent metrics. In this case the performance is tightly related to the implementation. An example of such applications is network management whichperformance behavior depends on whether it is a centralized or a distributed implementation.
(ii) Performance metrics which depend on the type of implementation or architecture of the SUTor the IUT.
(iii) Test configurations and methodologies which assume or imply a specific implementation orarchitecture of the SUT or the IUT.
(iv) Evaluation or assessment of results obtained by companies or other bodies.

Introduction to ATM Forum Performance Testing Specifications96-0810R1af-test-0022.000
ATM Forum Technical Committee Page 71
(v) Certification of conducted measurements or of bodies conducting the measurements.
23. Classes of ApplicationsDeveloping a test suite for each existing and new application can prove to be a difficult task.Instead, applications should be grouped into categories or classes. Applications in a given classhave similar performance requirements and can be characterized by common performance metrics.This way, the defined performance metrics and test suites will be valid for a range of applications.Classes of applications can be defined based on one or a combination of criteria. The followingcriteria can be used in the definition of the classes:
(i) Time or delay requirements: real-time versus non real-time applications.
(ii) Distance requirements: LAN versus WAN applications.
(iii) Media type: voice, video, data, or multimedia application.
(iv) Quality level: for example desktop video versus broadcast quality video.
(v) ATM service category used: some applications have stringent performance requirementsand can only run over a given service category. Others can run on several servicecategories. An ATM service category relates application aspects to networkfunctionalities. Examples of user applications for the defined service categories in UNI4.0 are given in [2].
(vi) Others to be determined.
2.3.1 Performance Testing Above the ATM Layer
Performance metrics can be measured at the user application layer, and sometimes at thetransport layer and the network layer, and can give an accurate assessment of the perceivedperformance. Since it is difficult to cover all the existing applications and all the possiblecombinations of applications and underlying protocol stacks, it is desirable to classify theapplications into classes as described in section 4. Performance metrics and performance testsuites can be provided for each class of applications.
The perceived performance of a user application running over an ATM network is dependent onmany parameters. It can vary substantially by changing an underlying protocol stack, the ATMservice category it uses, the congestion control mechanism used in the ATM network, etc.Furthermore, there is no direct and unique relationship between the ATM Layer Quality ofService (QoS) parameters and the perceived application performance. For example, in an ATMnetwork implementing a packet level discard congestion mechanism, applications using TCP as

96-0810R1af-test-0022.000Introduction to ATM Forum Performance Test ing Specifications
Page 812 ATM Forum Technical Committee
the transport protocol may see their effective throughput improved while the measured cell lossratio may be relatively high. In practice, it is difficult to carry measurements in all the layers thatspan the region between the ATM Layer and the user application layer given the inaccessibility oftesting points. More effort needs to be invested to define the performance at these layers. Theselayers include adaptation, signaling, etc
.
2.3.2 Performance Testing at the ATM Layer
The notion of application at the ATM Layer is related to the service categories provided by theATM service architecture. The Traffic Management Specification, version 4.0, specifies five
service categories [2]: CBR, rt-VBR, nrt-VBR, UBR, and ABR. Each service category defines arelation of the traffic characteristics and the Quality of Service (QoS) requirements to networkbehavior. A set of ATM QoS parameters is defined in [2]. There is an assessment criteria of theQoS associated with each of these parameters. These are summarized in Table 26.1.
QoS PERFORMANCE PARAMETER QoS ASSESSMENT CRITERIA
Cell Error Ratio Accuracy
Severely-Errored Cell Block Ratio Accuracy
Cell Misinsertion Rate Accuracy
Cell Loss Rate Dependability
Cell Transfer Delay Speed
Cell Delay Variation Speed

Introduction to ATM Forum Performance Testing Specifications96-0810R1af-test-0022.000
ATM Forum Technical Committee Page 91
Table 26.1: ATM Transfer Performance Parameters.
A few methods for the measurement of the QoS parameters are defined in [2]. However, detailedtest cases and procedures, as well as test configurations are needed for both in-service and out-of-service measurement of QoS parameters. An example of test configuration for the out-of-service measurement of QoS parameters is given in [1].
Performance testing at the ATM Layer covers the following categories:
(i) In-service and out-of-service measurement of the QoS performance parameters for all fiveservice categories (or application classes in the context of performance testing): CBR, rt-VBR, nrt-VBR, UBR, and ABR. The test configurations assume a non-overloaded SUT.
(ii) Performance of the SUT under overload conditions. In this case, the efficiency of thecongestion avoidance and congestion control mechanisms of the SUT are tested.
In order to provide common performance metrics that are applicable to a wide range of SUT'sand that can be uniquely interpreted, the following requirements must be satisfied:
(i) Reference load models for the five service categories CBR, rt-VBR, nrt-VBR, UBR, andABR, are required. Reference load models are to be defined by the Traffic ManagementWorking Group.
(ii) Test cases and configurations must not assume or imply any specific implementation orarchitecture of the SUT.
3.4. Performance MetricsIn the following description System Under Test (SUT) refers to an ATM switch. However, thedefinitions and measurement procedures are general and may be used for other devices or anetwork consisting of multiple switches as well.
3.4.1 THROUGHPUT
3.4.1.1 Definitions
There are three frame-level throughput metrics that are of interest to a user.

96-0810R1af-test-0022.000Introduction to ATM Forum Performance Test ing Specifications
Page 1012 ATM Forum Technical Committee
i. Lossless throughput - It is the maximum rate at which none of the offered frames are droppedby the SUT.
ii. Peak throughput - It is the maximum rate regardless of frames dropped at which the SUToperates. The maximum rate can actually occur when the loss is not zero.
iii. Full-load throughput - Its the rate at which SUT operates when the input links are loaded at100% of their capacity.
A model graph of throughput vs input rate is shown in Figure 1. Level X defines the loss-lessthroughput, level Y defines the peak throughput and level Z defines the full-load throughput.
Load (Input)
Throughput(Output) Lossless
Peak
CBX
YXZ
Full-Load
Figure1: Peak, lossless and full-load throughput
The lossless throughput is the highest load at which the count of the output frames equals thecount of the input frames.
Peak throughput is the maximum throughput that can be achieved in spite of the losses. Full-loadthroughput is the throughput of the system at 100% load on input links. Note that the peakthroughput may equal the lossless throughput in some cases.

Introduction to ATM Forum Performance Testing Specifications96-0810R1af-test-0022.000
ATM Forum Technical Committee Page 111
Only frames that are received completely without errors are included in frame-level throughputcomputation. Partial frames and frames with CRC errors are not included.
3.4.1.2 Units
Throughput should be expressed in bits/sec. This is preferred over specifying it in frames/sec orcells/sec. Frames/sec requires specifying the frame size. The throughput values in frames/sec atvarious frame sizes cannot be compared without first being converted into bits/sec. Cells/sec isnot a good unit for frame-level performance since the cells aren't seen by the user.
3.4.1.3 Statistical Variations
The tests should be run NRT times for TRT seconds each. Here NRT and TRT are parameters.These and other such parameters and their default values are listed later in Table 2.
If Ti is the throughput in ith run, The mean and standard errors of the measurement should becomputed as follows:
Mean throughput = (S Ti)/n
Standard deviation of throughput = (S (Ti-Mean throughput)2)/(n-1)
Standard error = Standard deviation of throughput/√n

96-0810R1af-test-0022.000Introduction to ATM Forum Performance Test ing Specifications
Page 1212 ATM Forum Technical Committee
Given mean and standard errors, the users can compute an 100(1-a)-percent confidence intervalas follows:
100(1-a)-percent confidence interval = (mean - z × std error, mean + z × std error)
Here, z is the (1-a/2)-quantile of the unit normal variate. For commonly used confidence levels,the quantile values are as follows:
Confidence a Quantile
90% 0.1 1.615
99% 0.01 2.346
99.9% 0.001 3.291
3.4.1.4 Traffic Pattern
The input traffic will consist of frames of length FSA bytes each. Before starting the throughputmeasurements, all required VCs will be set up (for an n-port SUT) in one of the following fourconfigurations:
1. n-to-n straight: All frames input from port i exit to port i+1 modulo n. This represents almostno path interference among the VCs. Total n VCs.

Introduction to ATM Forum Performance Testing Specifications96-0810R1af-test-0022.000
ATM Forum Technical Committee Page 131
2. n-to-n cross: Input from port each port is divided equally to exit on each of the n output ports.Total n2 VCs.
3. n-to-1: Input from all ports is destined to one output port. Total n VCs.
3.4. 1-to-n: Input from a port is multicast to all output ports. Total 1 VC.
The frames will be delivered to the layer under test equally spaced at a given input rate. The rateat which the cells reach SUT may vary depending upon the service used. For example, for ABRtraffic, the allowed cell rate may be less than the link rate in some configurations.
At each value of the input rate to the layer under test, the total number of frames sent to SUT andreceived from SUT are recorded. The input rate is computed based on the time from the first bitof first frame enters the SUT to the last bit of the last frame enters the SUT. The throughput(output rate) is computed based on the time from the first bit of the first frame exits the SUT tothe last bit of the last frame exits SUT.
If the input frame count and the output frame count are the same then the input rate is increasedand the test is conducted again. The lossless throughput is the highest throughput at which thecount of the output frames equals the count of the input frames. If the input rate is increased evenfurther, although some frames will be lost, the throughput may increase till it reaches the peakthroughput value after which the further increase in input rate will result in a decrease in thethroughput. The input rate is increased further till 100% load is reached and the full-loadthroughput is recorded.
96-0810R1af-test-0022.000Introduction to ATM Forum Performance Test ing Specifications
Page 1412 ATM Forum Technical Committee
3.4.1.5 Background Traffic
The tests can be conducted under two conditions - with background traffic and withoutbackground traffic.
Higher priority traffic like VBR can act as background traffic for the experiment. Further detailsof measurements with background traffic (multiple service classes simultaneously) are to bespecified. Until then all testing will be done without any background traffic.
3.4.2 FRAME LATENCY
3.4.2.1 Definition
The frame latency for a system under test is measured using a "Message-in Message-out(MIMO)" definition. Succinctly, MIMO latency is defined as follows:
MIMO Latency = Min{First-bit in to last-bit out latency - nominal frame output time, last-bit in tolast-bit out latency}
An explanation of MIMO latency and its justification is presented in Appendix A.

Introduction to ATM Forum Performance Testing Specifications96-0810R1af-test-0022.000
ATM Forum Technical Committee Page 151
To measure MIMO latency, a sequence of equally spaced frames are sent at a particular rate.After the flow has been established, one of the frames in the flow is marked and the time of thefollowing four events is recorded for the marked frame while the flow continues unpurturbed:
1. First-bit of the frame enters into the SUT
2. Last-bit of the frame enters into the SUT
3. First-bit of the frame exits from the SUT
4. Last-bit of the frame exits from the SUT
The time between the first-bit entry and the last bit exit (events 1 and 4 above) is called first-bit into last-bit out (FILO) latency. The time between the last-bit entry to the last-bit exit (events 2 and4 above) is called last-bit in to last-bit out (LILO) latency. Given the frame size and the nominaloutput link rate, the nominal frame output time is computed as follows:
Nominal frame output time = Frame size/Nominal output link rate
Substituting the FILO latency, LILO latency, and Nominal frame output time in the MIMOlatency formula gives the frame level latency of the SUT.
3.4.2.2 Units
The latency should be specified in micro-seconds.
96-0810R1af-test-0022.000Introduction to ATM Forum Performance Test ing Specifications
Page 1612 ATM Forum Technical Committee
3.4.2.3 Statistical Variations
NML samples of the latency are obtained by sending NML marked frames at TTL/(NML + 1)intervals for a total test duration of TTL seconds. Here, NML and TTL are parameters. Theirdefault values are specified in Table 2. The mean and standard errors computed (in a mannersimilar to that explained in Section 1.3 for Throughput) from these samples are reported as thetest results.
3.4.2.4 Traffic Pattern
The input traffic will consist of frames of length FSA bytes. Here, FSA is a parameter. Its defaultvalue is specified in Table 2.
Before starting the throughput measurements, all required VCs will be set up (for an n-port SUT)in one of the following configurations:
1. n-to-n straight: All frames input from port i exit to port i+1 modulo n. This represents almostno path interference among the VCs.
2. n-to-n cross: Input from port each port is divided equally to exit on each of the n output ports.
3. n-to-1 : Input from all ports is destined to one output port.
4. 1-to-n: Input from a port is multicast to all output ports. Total 1 VC.
The frames will be delivered to the layer under test equally spaced at a given input rate. Forlatency measurement, the input rate will be set at the input rate corresponding to the losslessthroughput. This avoids the problem of lost marked cells and missing samples.

Introduction to ATM Forum Performance Testing Specifications96-0810R1af-test-0022.000
ATM Forum Technical Committee Page 171
3.4.2.5 Background Traffic
The tests can be conducted under two conditions - with background traffic and withoutbackground traffic.
Higher priority traffic like VBR can act as background traffic for the experiment. Further detailsof measurements with background traffic (multiple service classes simultaneously) are to bespecified. Initially all tests will be conducted without the background traffic.
3.4.3 Application Goodput
Application-goodput captures the notion of what an application sees as useful data transmission inthe long term. Application-goodput is the ratio of packets(frames) received to packets(frames)transmitted over a measurement interval.
The application-goodput (AG) is defined as:
Frames Received in Measurement Interval AG = ----------------------------------------------------- Frames Transmitted in Measurement Interval
where Measurement Interval is defined as the time interval from when a frame was successfullyreceived to when the frame sequence number has advanced by n.
Note that traditionally goodput is measured in bits per sec. However, we are interested in a non-dimensional metric and are primarily interested in characterizing the useful workderived from the expended effort rather than the actual rate of transmission. While theapplication-goodput is intended to be used in a single-hop mode, it does have meaningfulend-to-end semantics over multiple hops.
Notes:

96-0810R1af-test-0022.000Introduction to ATM Forum Performance Test ing Specifications
Page 1812 ATM Forum Technical Committee
1. This metric is useful when measured at the peak load which is characterized by varying thenumber of transmitted frames must be varied over a useful range from 2000 frames per second(fps) through 10000 fps at a nominal frame size of 64bytes. Frame sizes are also varied through 64 bytes,1518 bytes, and 9188 bytes to represent small,medium, and large frames respectively. Note that the frame sizes specified do not account for theoverhead of accomodating the desired frametransmission rates over the ATM medium.
2. Choose the measurement interval to be large enough to accommodate the transmission of thelargest packet (frame) over the connection and small enough to track short-term excursions of theaverage goodput.
3. It is important to not include network management frames and/or keep alive frames in thecount of received frames.
4. There should be no changes of frame handling buffers during the measurement.
6. The results are to be reported as a table for the three different frame sizes.
3.44.4 REPORTING RESULTS
The throughput and latency results will be reported in a tabular format as follows:
Table 3.1: Tabular format for reporting performance testing benchmarking results
Throughput
Traffic Lossless Peak Full-load Latency
Pattern Mean Std Err Mean Std Err Mean Std Err Mean Std Err

Introduction to ATM Forum Performance Testing Specifications96-0810R1af-test-0022.000
ATM Forum Technical Committee Page 191
n-to-nStraight
n-to-nCross
n-to-1
1-to-n
3.4.5 DEFAULT PARAMETER VALUES
The default values of the parameters used in performance testing benchmarking are listed in Table2.
Table 2: List of Parameters and their default values
Parameter Meaning Default
NRT Number of repetitions of throughput experiments 30
TRT Time of each repetition of throughput experiment 60 sec
FSA Frame Size for AAL performance experiments 9188 Bytes
NML Number of marked frames sent in latency experiments 30
TTL Total time of latency experiments 31 sec

96-0810R1af-test-0022.000Introduction to ATM Forum Performance Test ing Specifications
Page 2012 ATM Forum Technical Committee
5. Status and Conclusion
This document has introduced performance testing, discussed the role of ATM Forum�s goals andnon-goals. Also the testing has been confined to the ATM layer and the AAL-5 layer for thepresent, though higher layer testing will be addressed later. Performance metrics for tnroughputand latency has been provided in detail. The message-in message-out (MIMO) latency is a generaldefinition of latency that applies to a switch or a group of switches and a detailed analysis isprovided in the appendix. Application-goodput captures the notion of what an application sees asuseful data transmission in the long term and the definition is provided.
APPENDIX A: MIMO LATENCY
The message-in message-out (MIMO) latency is a general definition of latency that applies to aswitch or a group of switches when the frames equal to output link rate.
For a single bit, the latency is generally defined as the time from bit in to bit out.
Figure A.1: Latency for single-bit frames

Introduction to ATM Forum Performance Testing Specifications96-0810R1af-test-0022.000
ATM Forum Technical Committee Page 211
For a multi-bit frame, there are several possible definitions. First, consider the case of contiguousframes. All bits of the frames are delivered contiguously without any gap between them. In thiscase, latency can be defined in one of the following four ways:
1. First bit in to first bit out (FIFO)
2. Last bit in to last bit out (LILO)
3. First bit in to last bit out (FILO)
4. Last bit in to first bit out (LIFO)
NFOT
FIFOFILO
LILO
Figure A.2: Latency for multibit Frames
If the input link and the output links are of the same speed and the frames are contiguous, theFIFO and LILO latencies are identical. FILO and LIFO latencies can be computed from FIFO (orLILO) given the frame time:
FILO = FIFO + Nominal frame output time
LIFO = FIFO - Nominal frame output time

96-0810R1af-test-0022.000Introduction to ATM Forum Performance Test ing Specifications
Page 2212 ATM Forum Technical Committee
It is clear that FIFO (or LILO) is a preferred metrics in this case since it may be independent ofthe frame time while FILO and LIFO would be different for each frame size.
Unfortunately, none of the above four metrics apply to an ATM network (or a switch) since theframes are not always delivered contiguously. There may be idle time between cells of a frame.Also, the input and output link may be of different speeds.
In the following we consider twelve different cases. For each case, we compare four possiblemetrics (FIFO, LILO, FILO-nominal frame output time, and MIMO) and show that MIMO is thecorrect metrics in all cases while other metrics apply to some cases but give wrong answers inothers.
The twelve cases and the applicability of the four metrics is shown in Table A.1
Table A.1: Applicability of various latency definitions
No. Case FIFO LILO FILO-NFOT
MIMO
1a Input rate = output rate, contiguous frame,zero-delay switch
√ √ √ √
1b Input rate = output rate, contiguous frame,nonzero-delay switch
√ √ √ √
1c Input rate = output rate, non-contiguous This case is not possible

Introduction to ATM Forum Performance Testing Specifications96-0810R1af-test-0022.000
ATM Forum Technical Committee Page 231
frame, zero-delay switch
1d Input rate = output rate, non-contiguousframe, nonzero-delay switch
× √ √ √
2a Input rate > output rate, contiguous frame,zero-delay switch
√ × √ √
2b Input rate > output rate, contiguous frame,nonzero-delay switch
√ × √ √
2c Input rate > output rate, non-contiguousframe, zero-delay switch
This case is not possible
2d Input rate > output rate, non-contiguousframe, nonzero-delay switch
× × √ √
3a Input rate < output rate, contiguous frame,zero-delay switch
× √ × √
3b Input rate < output rate, contiguous frame,nonzero-delay switch
× √ × √
3c Input rate < output rate, non-contiguousframe, zero-delay switch
× √ × √
3d Input rate < output rate, non-contiguousframe, nonzero-delay switch
× √ × √
NFOT = Nominal frame output time = Frame size/output link rate√ => The metric gives a valid result× => The metric gives an invalid result
CASE 1a: Input Rate = Output Rate, Contiguous Frame, Zero-Delay Switch
One way to verify the validity of a latency definition is to apply it to a single input single outputzero delay switch (basically a very short wire). In this case, the bits appear on the output as soonas they enter on the input. All four metrics give a delay of zero and therefore valid.

96-0810R1af-test-0022.000Introduction to ATM Forum Performance Test ing Specifications
Page 2412 ATM Forum Technical Committee
Figure A.1a: Input Rate = Output Rate, Contiguous Frame, Zero-Delay Switch
Notice that FILO and LIFO will give a non-zero delay equal to frame time. Since we areinterested in only switch delay and know that the switch delay in this case is zero, FILO and LIFOare not good switch delay metrics and will not be considered any further.
The nominal frame output time (NFOT) is computed as the frame size divided by the output linkrate. It indicates how long the it will take to output the frame at the link speed. FILO - NFOTindicates switch's contribution to the latency and is therefore a candidate for further discussion.
CASE 1b: Input Rate = Output Rate, Contiguous frame, non-zero delay switch
Figure A.1b shows the flow in this case.

Introduction to ATM Forum Performance Testing Specifications96-0810R1af-test-0022.000
ATM Forum Technical Committee Page 251
NFOT
Figure A.1b: Input=Output, contiguous frame, nonzero-delay
In this case, the total delay FILO can be divided into two parts: switch latency and frame time:
FILO = Switch latency + Nominal frame output time
Switch latency = FILO - NFOT
LILO = FIFO = FILO-NFOT
MIMO = Min{FILO-NFOT, LILO) = LILO = FILO-NFOT = FIFO
All four metrics again give identical and meaningful result.
CASE 1c: Input Rate = Output Rate, Non-contiguous frame, Zero-delay Switch

96-0810R1af-test-0022.000Introduction to ATM Forum Performance Test ing Specifications
Page 2612 ATM Forum Technical Committee
On a zero-delay switch, the bits will appear on the output as soon as they enter the input. Sincethe input frame is continuos, the output frame will also be contiguous and therefore this case isnot possible.
CASE 1d: Input Rate = Output Rate, Non-contiguous frame, Nonzero-Delay Switch
This case is shown in Figure A.1d. There are several gaps between the cells of the frame at theoutput. FIFO latency does not reflect performance degradation caused by gaps that appear afterthe first cell. It is, therefore, not a good switch latency metrics..
Figure A.1d: Input rate=output rate, non-contiguous frame, nonzero-delay switch
FILO, LILO, and MIMO are related as follows:
FILO - NFOT = LILO = Min{FILO-NFOT, LILO) = MIMO

Introduction to ATM Forum Performance Testing Specifications96-0810R1af-test-0022.000
ATM Forum Technical Committee Page 271
Either one of these three metrics can be used as switch latency.
CASE 2a: Input Rate > Output Rate, Contiguous frame, Zero-delay Switch
In this case, the switch consists of a single-input single-output memory buffer. The frame flow isshown in Figure A.2a.
Figure A.2a: Input Rate > Output Rate, Contiguous frame, Zero-delay Switch
For this case, FIFO, FILO, and MIMO are related as follows:
LILO > FIFO = FILO - NFOT = min{FILO-NFOT, LILO} = MIMO = 0
In this case, FIFO, FILO-NFOT, and MIMO give the correct (zero) latency. LILO will produce anon-zero result. LILO is affected by the output link speed and doest not correctly represent theswitch latency.

96-0810R1af-test-0022.000Introduction to ATM Forum Performance Test ing Specifications
Page 2812 ATM Forum Technical Committee
CASE 2b: Input Rate > Output Rate, Contiguous frame, Nonzero-delay Switch
The frame flow is shown in Figure A.2b.
Figure A.2b: Input Rate > Output Rate, Contiguous frame, Nonzero-delay Switch
Note that the following relationship among various metrics still holds as in case 2a:
LILO > FIFO = FILO - NFOT = min{FILO-NFOT, LILO} = MIMO
Thus, LILO gives incorrect answer. It is affected by the output link speed. While the other threemetrics give the correct answer.
Introduction to ATM Forum Performance Testing Specifications96-0810R1af-test-0022.000
ATM Forum Technical Committee Page 291
CASE 2c: Input Rate > Output Rate, Non-contiguous frame, Zero-delay Switch
A zero-delay switch will not introduce any gaps. Thus, this case is not possible.
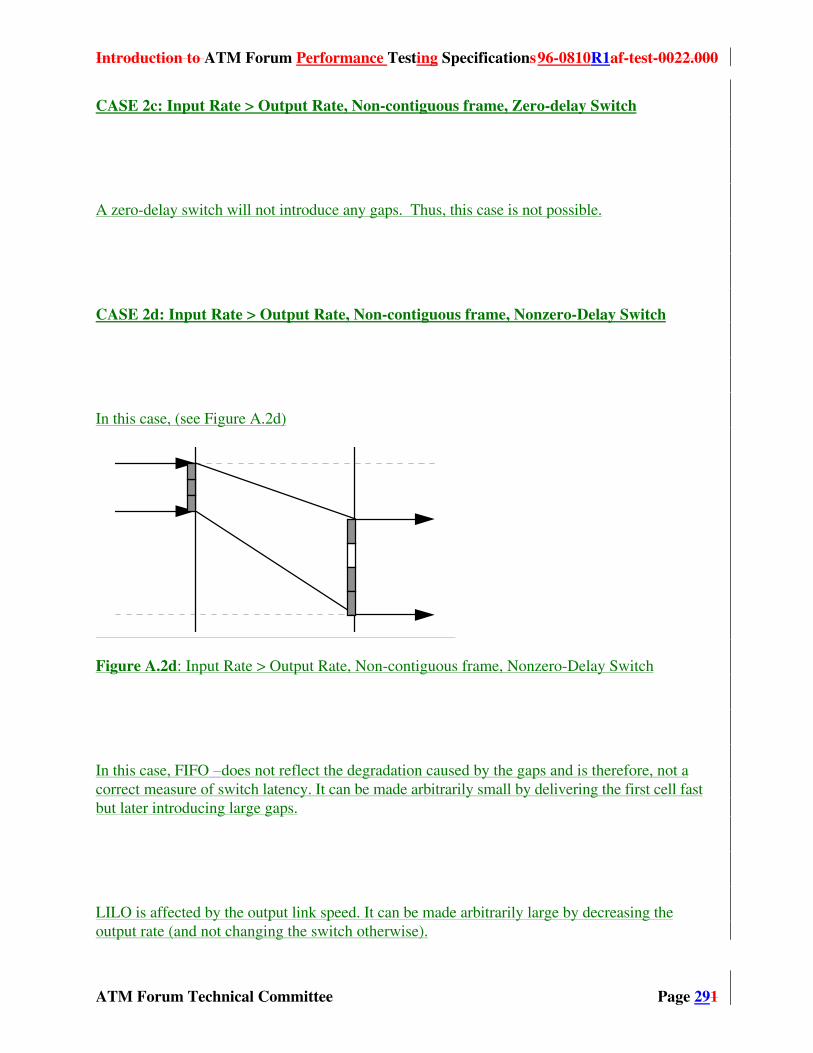
CASE 2d: Input Rate > Output Rate, Non-contiguous frame, Nonzero-Delay Switch
In this case, (see Figure A.2d)
Figure A.2d: Input Rate > Output Rate, Non-contiguous frame, Nonzero-Delay Switch
In this case, FIFO does not reflect the degradation caused by the gaps and is therefore, not acorrect measure of switch latency. It can be made arbitrarily small by delivering the first cell fastbut later introducing large gaps.
LILO is affected by the output link speed. It can be made arbitrarily large by decreasing theoutput rate (and not changing the switch otherwise).

96-0810R1af-test-0022.000Introduction to ATM Forum Performance Test ing Specifications
Page 3012 ATM Forum Technical Committee
Thus, FILO-NFOT and MIMO are the only two metrics that can be considered valid in this case.Both give the same result:
LILO > FILO - NFOT = Min{FILO-NFOT, LILO} = MIMO
CASE 3a: Input Rate < Output Rate, Contiguous frame, Zero-delay Switch
This case is shown in Figure A.3a.
Figure A.3a: Input Rate < Output Rate, Contiguous frame, Zero-delay Switch
Contiguous frames are possible only if the transmission of the first bit is scheduled such that therewill not be any buffer underflow until the last frame. Thus, the FIFO delay dpends upon the frametime. It is non-zero and is incorrect. FILO-NFOT is similarly incorrect.
FILO-NFOT = FIFO >0

Introduction to ATM Forum Performance Testing Specifications96-0810R1af-test-0022.000
ATM Forum Technical Committee Page 311
LILO = min{FILO-NFOT, LILO} = MIMO = 0
Both LILO and MIMO give the correct result of zero.
CASE 3b: Input Rate < Output Rate, Contiguous frame, Nonzero-delay Switch
This case is shown in Figure A.3b.
Figure A.3b: Input Rate < Output Rate, Contiguous frame, Nonzero-delay Switch
As in Case 3a, FIFO latency depends upon the output speed. It can be made arbitrarily large byincreasing the output link rate (and not changing the switch otherwise). FIFO is not a goodindicator of switch latency.
FILO-NFOT is equal to FIFO latency and is also incorrect.
96-0810R1af-test-0022.000Introduction to ATM Forum Performance Test ing Specifications
Page 3212 ATM Forum Technical Committee
LILO is the only metric that can be argued to be the correct measure of latency.
LILO is less than FILO-NFOT. Therefore, LILO = Min{FILO-NFOT, LILO} = MIMO
MIMO is also equal to LILO and is therefore a correct measure.
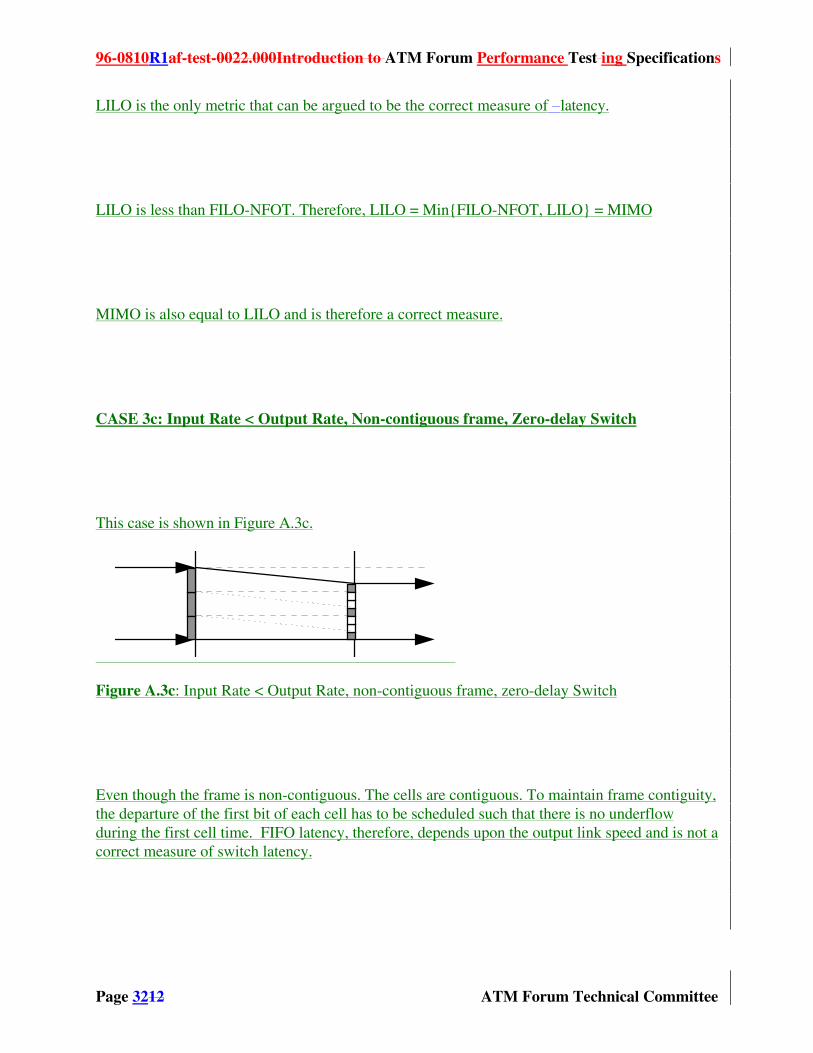
CASE 3c: Input Rate < Output Rate, Non-contiguous frame, Zero-delay Switch
This case is shown in Figure A.3c.
Figure A.3c: Input Rate < Output Rate, non-contiguous frame, zero-delay Switch
Even though the frame is non-contiguous. The cells are contiguous. To maintain frame contiguity,the departure of the first bit of each cell has to be scheduled such that there is no underflowduring the first cell time. FIFO latency, therefore, depends upon the output link speed and is not acorrect measure of switch latency.

Introduction to ATM Forum Performance Testing Specifications96-0810R1af-test-0022.000
ATM Forum Technical Committee Page 331
FILO-NFOT is non-zero and, therefore, incorrect.
LILO = min{FILO-NFOT, LILO} = MIMO = 0
Both LILO and MIMO give the correct result of zero.
CASE 3d: Input Rate < Output Rate, Non-contiguous frame, Nonzero-Delay Switch
Figure A.3d: Input Rate < Output Rate, Non-contiguous frame, Nonzero-Delay Switch
In this case, FIFO can be made small by sending the first cell fast and then introducing large timegaps in the output. FIFO is, therefore, not a valid switch latency metric in this case.
FILO - NFOT > FIFO is similarly incorrect.

96-0810R1af-test-0022.000Introduction to ATM Forum Performance Test ing Specifications
Page 3412 ATM Forum Technical Committee
LILO is the only metric that can be argued to be correct in this case.
Since LILO < FILO-NFOT,
MIMO = Min{FILO-NFOT, LILO} = LILO
MIMO is also a correct measure.
Once again looking at Table A.1, we find that MIMO is the only metric that applies to all inputand output link rates and contiguous and non-contiguous frames.