atlantamdf_091106
TRANSCRIPT

8/6/2019 AtlantaMDF_091106
http://slidepdf.com/reader/full/atlantamdf091106 1/21
Designing a Dimensional Model
Erik Veerman
Atlanta MDF member
SQL Server MVP, Microsoft MCT
Mentor, Solid Quality Learning
• Data Warehousing
A subject-oriented, integrated, time-variant, andnonvolatile collection of data in support of decision-makingprocess.
• Data Marts• R. Kimball - “a data mart is a flexible set of data, ideally
based on the most atomic (granular) data possible to
extract from operational source, and presented in asymmetric (dimensional) model that is resilient when facedwith unexpected user queries”
• “in its most simplistic form a data mart represent datafrom a single business process” Business process = purchase order, store inventory, etc
Definitions

8/6/2019 AtlantaMDF_091106
http://slidepdf.com/reader/full/atlantamdf091106 2/21
• OLAP = On-line Analytical ProcessingA reporting system designed to allow different flexibleanalysis in real time, on-line, with data structures designedfor fast retrieval, with redundancy included to supportperformance. Note: “On-line” doesn’t indicate data fromon-line systems, rather on-the-fly
• OLAP Basics– Drill-down - decreasing the level of aggregation– Drill-up/Roll-up - increasing the level of aggregation– Drill-across - move between different star-join schemas
using conformed dimensions and joins– Slicing and dicing – ability to look at the database from
different views, e.g. one slice shows all sales of producttype within regions, another slice shows all sales by saleschannel within each product type
– Pivoting - e.g. change columns to rows, rows to columns– Ranking - sorting
Definitions
Definitions
Business Intelligence (BI)Forrester definition: A process of transforming data into informationand making it available to users in time to make a difference
Strategic BI (Examples: Balance scorecard, Strategic Planning)• Who: strategic leaders• What: formulate strategy and monitor corporate performance
Operational BI (Examples: Budgeting, Sales forcasting)• Who: operational managers
• What: execution of strategy againts objectives
Analytical BI (Examples: Financial and Sales Analysis, CustomerSegmentation, Clickstream analysis)
• Who: analysts, knowledge worker, controller• What: ad-hoc analysis

8/6/2019 AtlantaMDF_091106
http://slidepdf.com/reader/full/atlantamdf091106 3/21
• Dimensional Modeling
The process and outcome of designinglogical database schemas created tosupport OLAP and Data Warehousingsolutions
THE Definition
• OLTP = On Line Transactional Processing– Each transaction must be written to the database
in real time, i.e. “on line”
Transactional System Emphasis
• Data structuresmust enableconsistent andfast writing– The best
consistency andspeed can beachieved if eachpiece of data iswritten only once
– Normalized(netlike) relationalschema suits theserequests

8/6/2019 AtlantaMDF_091106
http://slidepdf.com/reader/full/atlantamdf091106 4/21
• Schema doesn’t clearly call out subjects,objects, events, states...
• Difficult to prepare reports and analysisviews– Requires multiple joins– Indexes not optimized for reporting
• Models business process, not information• Levels show only current state, history is
not tracked
Reporting Challenges with OLTP
• Schema designed with reporting andanalysis in mind
• With redundant data, specially preparedfor analysis, we can do more:
– Prepare data over time
– Prepare aggregates
– Add data from other sources, not only OLTP– Sales value shows much more if we know
also market capacity and our market share
Data Warehousing, The Solution
8/6/2019 AtlantaMDF_091106
http://slidepdf.com/reader/full/atlantamdf091106 5/21
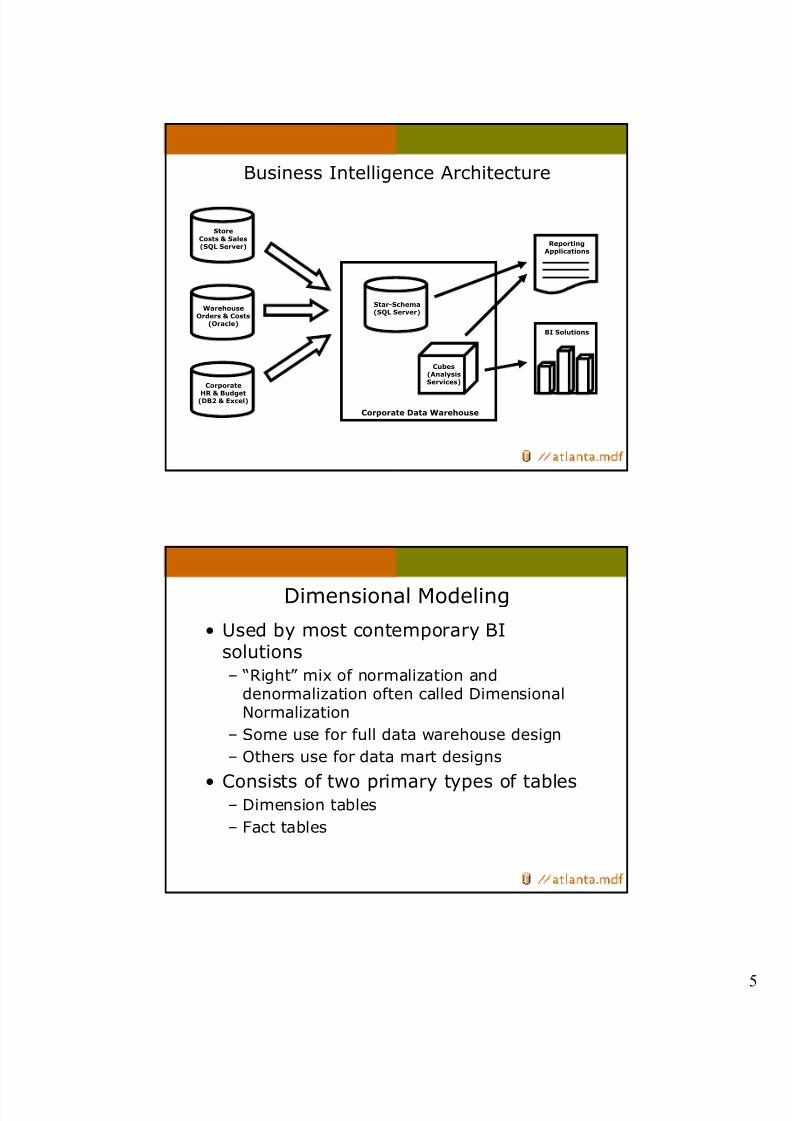
Business Intelligence Architecture
Store
Costs & Sales(SQL Server)
WarehouseOrders & Costs
(Oracle)
Corporate
HR & Budget(DB2 & Excel)
Star-Schema(SQL Server)
Cubes(AnalysisServices)
Corporate Data Warehouse
BI Solutions
ReportingApplications
Dimensional Modeling
• Used by most contemporary BIsolutions
– “Right” mix of normalization anddenormalization often called DimensionalNormalization
– Some use for full data warehouse design
– Others use for data mart designs
• Consists of two primary types of tables– Dimension tables
– Fact tables

8/6/2019 AtlantaMDF_091106
http://slidepdf.com/reader/full/atlantamdf091106 6/21
Dimensional Modeling
• Dimensional normalization– Logical design technique that presents data in an intuitive
way allowing high-performance access
– Targets decision support information
– Focused on easy user navigation and high performancedesign
• (vs.) Transactional normalization– Logical design technique to eliminate data redundancy, to
keep data consistency, and storage efficiency
– Makes transactions simple and deterministic
– ER models for enterprise are usually complex often
containing hundreds, or even thousands, of entities/tables
Dimension Tables
• Contain attributes related to businessentities– Customers, vendors, employees
– Products, materials, even invoices (attributes!)
– Dates and sometimes time (hours, mins, etc.)
• Often employ surrogate keys– Defined within the dimensional model
– Not the same as source system primary,alternate, or business keys
• Not uncommon to have many, manycolumns
• Highly de-normalized to reduce joins

8/6/2019 AtlantaMDF_091106
http://slidepdf.com/reader/full/atlantamdf091106 7/21
Fact Tables
• Contain numbers and other businessmetrics
– Define the basic measures users want to analyze
– Numbers are then aggregated according torelated dimensions
• Fact tables contain dimension keys
– Defines relationship between measures anddimensions using surrogate keys
• Typically narrow tables, but often very large• Highly normalized structure
Dimensional Model Example

8/6/2019 AtlantaMDF_091106
http://slidepdf.com/reader/full/atlantamdf091106 8/21
Why Dimensional Modeling
• Logical model is easy to understand– Standard framework and business model for end user apps– Model can be done (mostly) independent of expected queries– Handle changes easy – such as adding new dimensional
attributes
• Optimized for performance– High performance “browsing” across the attributes– Strategy to handling aggregates, leveraging summary tables or
OLAP aggregation technologies– Logical redundant with base table to enhance query performance– OLAP engines can make strong assumptions on how to optimize
• Historical tracking of information– Strategies for handling changing dimensions– Fact design allows high volume snapshots and transaction
tracking
Dimension Tables!
8/6/2019 AtlantaMDF_091106
http://slidepdf.com/reader/full/atlantamdf091106 9/21
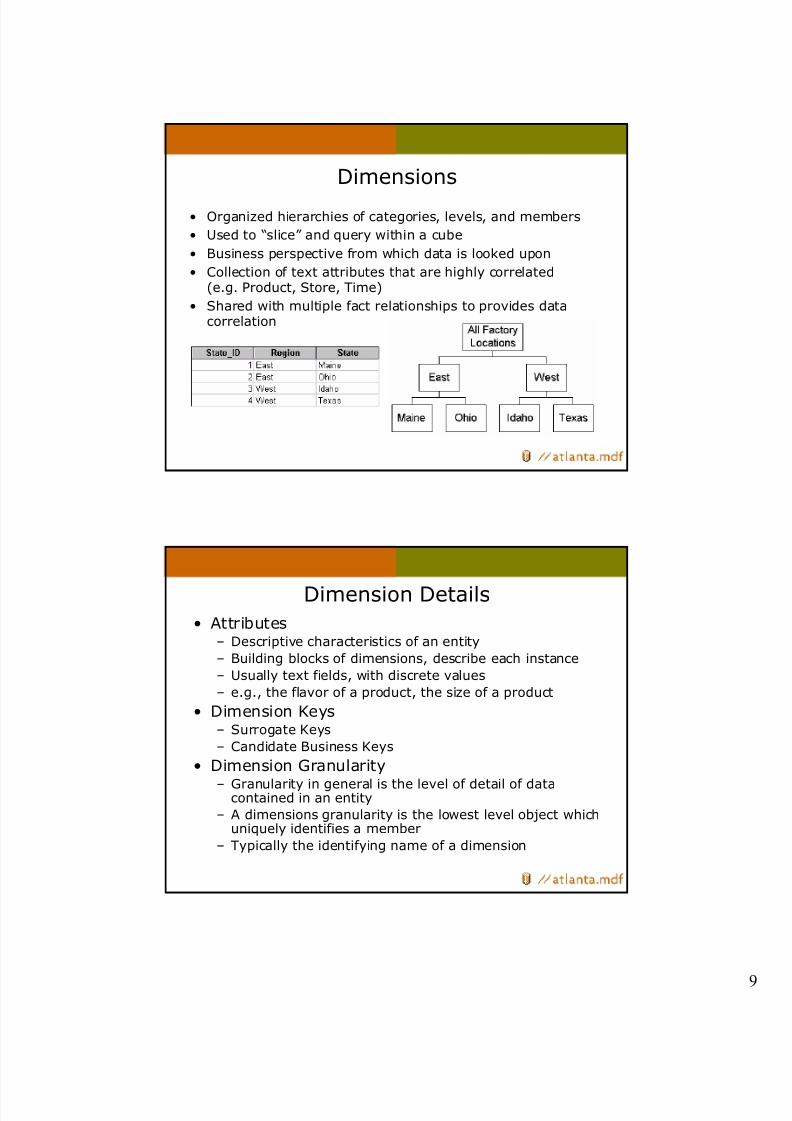
Dimensions
• Organized hierarchies of categories, levels, and members
• Used to “slice” and query within a cube
• Business perspective from which data is looked upon
• Collection of text attributes that are highly correlated(e.g. Product, Store, Time)
• Shared with multiple fact relationships to provides datacorrelation
Dimension Details• Attributes
– Descriptive characteristics of an entity
– Building blocks of dimensions, describe each instance
– Usually text fields, with discrete values
– e.g., the flavor of a product, the size of a product
• Dimension Keys– Surrogate Keys
– Candidate Business Keys
• Dimension Granularity
– Granularity in general is the level of detail of datacontained in an entity
– A dimensions granularity is the lowest level object whichuniquely identifies a member
– Typically the identifying name of a dimension

8/6/2019 AtlantaMDF_091106
http://slidepdf.com/reader/full/atlantamdf091106 10/21
Hierarchies
Dimension Keys
• Dimension Business Key
– Column or columns that identify a uniqueinstance of the business record (not necessarilya unique record in the dimension table)
– Used in the ETL process to tie fact records withdimension members
• Dimension Record Surrogate Key
– Defines the dimension’s primary key– Relates to the fact table foreign key field
– Numeric data type, typically integer (2,4,8byte)

8/6/2019 AtlantaMDF_091106
http://slidepdf.com/reader/full/atlantamdf091106 11/21
Dimension Surrogate Keys
• Surrogate Key Usage
– Consolidates multi-value business keys
– Allows tracking of dimension history
– Standardizes dimension tables
– Limits fact table width for optimization
• Surrogate Key Design Practices
– Avoid smart keys
– Avoid production keys (may change!)
– the company may acquire a competitor and therebychange the key building rules changed record, but
deliberately not changed key– Narrow as possible
Dimensions Types• Basic Dimension Types
– Standard Star dimension
– Snowflake dimension
– Parent-Child dimensions
Snowflake
• Advanced Types
– Degenerate
– Profile or Junk dimensions
– Role-playing and Outriggers
DavidVPaulFle
PaulMaDavidV
PaulMaTodN
SteveBBobMu
SteveBPaulMa
SteveBJimAll
The BoardBillG
The BoardSteveB
<None>The Board
ManagerEmployee
Parent-Child

8/6/2019 AtlantaMDF_091106
http://slidepdf.com/reader/full/atlantamdf091106 12/21
Role-Playing and Time Dimensions
Changing Dimensions
• Problem known as “Slowly ChangingDimensions” (Ralph Kimball)
• Common changing types:0: No change.1: Not interested in the previous
state. Overwrites value.2: Slow changes. Adds new row.
3: Fast changes. Adds new column

8/6/2019 AtlantaMDF_091106
http://slidepdf.com/reader/full/atlantamdf091106 13/21
SCD Type-1 UPDATE
WarehouseResellerType
AW014Customer ID
Population
MountainProduct Line(Type-1)
1996
27
Year Opened
Customer SK
Reseller Dim
Bike Mart
All
• In-Placeupdate
• Restateshistory,
cannot queryold value
• Locking andcontentionpossible
• Simple
Business,Warehouse
CustomerType
AW014CustomerID
CustomerName
AllProductLine
1996YearOpened
Customer Source
Bike Mart
SCD Type-2 UPDATE
Light
Frame
Class
(Type 2)
462Product SK
44Size
BK-M82SProduct ID
YukonSpecial
Name
MountainModel
(Type 2)
1/1/2003NULL
Start TimeEnd Time
Product Dim
Light Frame
477
YukonSpecial
44
All Terrain
6/7/2005NULL
BK-M82S
• Track History (versioning)
• Surrogate Keys required!
1/1/20036/7/2005
LightFrame
Class
44Size
BK-M82SProduct ID
YukonSpecial
Name
All TerrainModel
Product Source

8/6/2019 AtlantaMDF_091106
http://slidepdf.com/reader/full/atlantamdf091106 14/21
Where to Start for Dimensions..
• Understand dimension hierarchies anddrill-paths
• Confirm historically tracked attributerequirements
• Check source data integrity,cleanliness, and completeness
• Review current reports for
summarization, roll-up, and grouping
Fact Tables!

8/6/2019 AtlantaMDF_091106
http://slidepdf.com/reader/full/atlantamdf091106 15/21
Facts
• The fact itself – The “measure” that is being tracked
– Quantity, count, amount, percent
– Mostly numerical, continuous values
– e.g., price of a product, quantity sold, numberof products in inventory, budget value, countof customers, count of sales, account balance
• Facts (or measures) can be classified by…
– Numerical data type
– Aggregation type
– Additive nature
– Granularity
Facts• Fact tables
– Capture measures/facts
– Association with dimensions
– Some tracking informationincluded
• Fact Table Granularity
– The level of detail of data contained in the fact table
– The description of a single instance (a record) of the factTypically includes a time level and a distinctcombinations of other dimensions
• e.g. Daily item totals by product, by store,Weekly snapshot of store inventory by product
• Different types
– Transactional
– Snapshot or inventory
– Factless

8/6/2019 AtlantaMDF_091106
http://slidepdf.com/reader/full/atlantamdf091106 16/21

8/6/2019 AtlantaMDF_091106
http://slidepdf.com/reader/full/atlantamdf091106 17/21
Aggregations (Aggs)
• A summarization of base-level fact table records
• Aggregations need to account for the additivenature of the measures, created on-the-fly or bypre-aggregation
• Common aggregation scenarios
– Category product aggs by store by day
– District store aggs by product by day
– Monthly sales aggs by product by store
– Category product aggs by store district by day
• Common aggregations = Sum, Count, DistinctCount, Max, Min, Average, Semi-additive (LastChild, Last Non-empty Child)
Fact Table Types• Different types of fact tables
–Transactional – Additive factstracking events over time
–Snapshot or inventory – Pictures intime of levels or balances
–Factless – Dimensionality
relationships
–Combinations!

8/6/2019 AtlantaMDF_091106
http://slidepdf.com/reader/full/atlantamdf091106 18/21
Transactional Fact Tables• Most common type of fact table
• Track the occurrence of events, eachdetailed event is captured into a row inthe fact table
• Measures are typically additive across alldimensions
• Common transactional fact table types
– Sales, Visits, Web-page hits, Accounttransactions
Snapshot Fact Tables• Known as inventory level fact tables
• “Snapshot” in time of quantities in stock orbalances of accounts
• Time dimension used to identify grain
• Non additive measures across time, buttypically additive across all other dimensions
• Common transactional fact table types
– Inventory levels, Event booking levels, Chart of account balance levels

8/6/2019 AtlantaMDF_091106
http://slidepdf.com/reader/full/atlantamdf091106 19/21
Factless Fact Tables
• No measured facts!– Are useful to describe events and coverage
– Information that something has or has nothappened
• Often used to represent many-to-manyrelationships
• Contain only dimension keys
• Common factless fact tables:
– Class attendance, Event tracking, Coverage tables,Promotion or campaign facts
Design with Additive in Mind
• Think dimensionally!
• Complex requirements don’t need to bedesigned with complex queries
• Many times new fact tables can bedesigned that can answer specificquestions, such as date attributes and
ranges

8/6/2019 AtlantaMDF_091106
http://slidepdf.com/reader/full/atlantamdf091106 20/21
Where to start with Fact Tables…
• Identify high-value business process to model(orders, invoices, shipments, inventory)
• Identify reporting grain of the business process
• Identify dimensions that apply to each fact table
• Identify measures that will populate the fact tables
Example business questions to listen for:
– How much total business did my newly remodeled storesdo compared with the chain average?
– How did leather goods items costing less than $5 do withmy most frequent shoppers?
– What was the revenue comparison of non-holiday weekenddays to holiday weekend days?
Resources
• The Data Warehouse Toolkit (Kimball)
• The Data Warehouse Lifecycle Toolkit (Kimball)
• The Microsoft Data Warehouse Toolkit (Kimball)
• OLAP Solutions (Thomsen)
• Microsoft OLAP Solutions (Thomsen, Spofford,Chase)

8/6/2019 AtlantaMDF_091106
http://slidepdf.com/reader/full/atlantamdf091106 21/21
Simple as that! ☺ ☺☺ ☺
What we didn’t have time to cover:
Meta Data in Data WarehousesDesigning tables with SSAS in mind
Indexing strategiesDisk optimization for Data Warehouses
Fact table partitioning strategies Aggregation tables
ETL ConsiderationsData Warehouse Project Planning