asymmetric response of predictability of east asian summer
TRANSCRIPT

52 SOLA, 2018, Vol. 14, 52−56, doi:10.2151/sola.2018-009
AbstractThe connection between the predictability of the East Asian
summer monsoon (EASM) and El Niño-Southern Oscillation (ENSO) has recently attracted widespread attention. Of particular importance is the effect of El Niño and La Niña on EASM pre-dictability. In this paper, the signal-to-noise ratio (SNR) method is used to analyze reanalysis data, and the results show that the EASM potential predictability intensity is much stronger under El Niño forcing than that under La Niña forcing. Meanwhile, the asymmetric response of EASM predictability remains within the Community Atmosphere Model (CAM) simulations. The EASM predictability is quantitatively determined using the nonlinear local Lyapunov exponent (NLLE) method. The EASM predict-ability limit under El Niño forcing is longer than that for La Niña forcing. Two monsoon indices are used to measure the EASM, the predictability limits of which perform differently because of their particular definitions. However, the asymmetric response of EASM predictability to El Niño and La Niña can be verified using observational data and model experiments.
(Citation: Li, B., R. Ding, J. Li, Y. Xu, and J. Li, 2018: Asym-metric response of predictability of East Asian summer monsoon to ENSO. SOLA, 14, 52−56, doi:10.2151/sola.2018-009.)
1. Introduction
The East Asian summer monsoon (EASM) dominates the transport of water vapor over East Asia, and has a significant impact on summer precipitation across the Yangtze Basin (Ding et al. 2010a). Thus, accurate prediction of the EASM is vital if we are to generate more reliable forecasts of intense precipitation and the associated flood events across East Asia (Wu et al. 2006, 2009). Numerous studies have shown that the onset and intensity of the EASM are significantly affected by previous El Niño–Southern Oscillation (ENSO) events (e.g., Webster and Yang 1992; Wang et al. 2000). Furthermore, ENSO, the strongest trop-ical Pacific sea surface temperature (SST) signal over interannual timescales, is characterized by warm SST anomalies over the eastern Pacific Ocean. These SST anomalies have a significant effect on a wide range of climatic and weather processes around the world, and in particular on the climate of the East Asian region (e.g., McPhaden et al. 2006; Deser et al. 2010).
Previous studies have demonstrated that ENSO, as a signif-icant external forcing, has a notable effect on climate predict-ability. Palmer et al. (1992) concluded that tropical regions show high predictability during strong ENSO years. Shi et al. (2008) analyzed the results of the SMIP2 model using the signal-to-noise ratio (SNR) method, and pointed out that the Asian summer
monsoon shows high potential predictability in strong El Niño and strong La Niña years. Given the importance of the EASM and its interactions with ENSO, it is of great interest to investigate the response of EASM predictability to ENSO. To date, few studies have considered the response of EASM predictability to El Niño and La Niña, respectively. Therefore, the question remains: what is the difference between the response of EASM predictability to El Niño and La Niña? The goal of this study is to answer that question.
Here, we use the nonlinear local Lyapunov exponent (NLLE) method, which has been widely used in the study of atmospheric and oceanic predictability (Ding and Li, 2009; Li and Ding, 2011, 2013), to investigate EASM predictability in a quantitative manner. Using this method, the EASM predictability limits as-sociated with El Niño and La Niña forcing will be quantitatively determined. However, to apply the NLLE method requires long datasets, and there are only about 10 years of composite observa-tional data available. To address this shortfall in data, we used the SNR method to analyze the observational data, and then ran model experiments to generate the amount of data required for the NLLE method. For this study, we measured the EASM using two types of index, and predictability was explored based on qualitative and quantitative methods. Our aim was to deepen our understanding of the effect of different ENSO events on EASM predictability.
The reminder of this article is arranged as follows. The data and methods used are described in Section 2. Sections 3 and 4 consider the response of EASM predictability to El Niño and La Niña in the observations and models. Finally, a discussion and our conclusions are provided in Section 5.
2. Data and methods
2.1 Reanalysis dataThe SST dataset used in this study was based primarily on the
Extended Reconstructed SST version 3b (ERSSTv3b) obtained from the National Oceanic and Atmospheric Administration (NOAA) with a 2° × 2° horizontal grid resolution and covering the period 1949 to 2015 (Smith et al. 2008). The monthly SST data were used to examine the typical Oceanic Niño Index (ONI). The ONI index is a three-month running mean of SST anomalies in the Niño 3.4 region (5°N–5°S, 120°W–170°W). El Niño and La Niña periods were based on a threshold of ±1.0°C for the ONI in the boreal winter (December–February: DJF).
To analyze the EASM, the daily mean atmospheric fields were taken from the National Centers for Environmental Prediction (NCEP1) reanalysis data, with a horizontal resolution of 2.5° × 2.5°, over the period 1948–2015 (Kalnay et al. 1996; Kistler et al. 2001). In this study, the boreal summer covers the months June–August (JJA).
Given that the EASM has complex spatial and temporal struc-tures (Ding 1992; Wang et al. 2008), two categories of monsoon index were used to verify our results. Li and Zeng (2002, 2003;
Asymmetric Response of Predictability of East Asian Summer Monsoon to ENSO
Baosheng Li1, 2, 3, Ruiqiang Ding1, 2, Jianping Li2, 4, Yidan Xu4, and Jiao Li5
1State Key Laboratory of Numerical Modeling for Atmospheric Sciences and Geophysical Fluid Dynamics (LASG), Institute of Atmospheric Physics, Chinese Academy of Sciences, Beijing, China
2Laboratory for Regional Oceanography and Numerical Modeling, Qingdao National Laboratory for Marine Science and Technology, Qingdao, China
3College of Earth Sciences, University of Chinese Academy of Sciences, Beijing, China4College of Global Change and Earth System Sciences (GCESS), Beijing Normal University, Beijing, China
5Key Laboratory of Meteorological Disasters of the Ministry of Education and Earth System Modeling Center, Nanjing University of Information Science and Technology, Nanjing, Jiangsu, China
Corresponding author: Ruiqiang Ding, Institute of Atmospheric Physics (IAP), Chinese Academy of Sciences (CAS), No. 40, Huayanli, Chaoyang District, Beijing, 100029, China. E-mail: [email protected]©The Author(s) 2018. This is an open access article published by the Meteorological Society of Japan under a Creative Commons Attribution 4.0 International (CC BY 4.0) license (http://creativecommons.org/license/by/4.0).
53Li et al., Response of EASM Predictability to ENSO
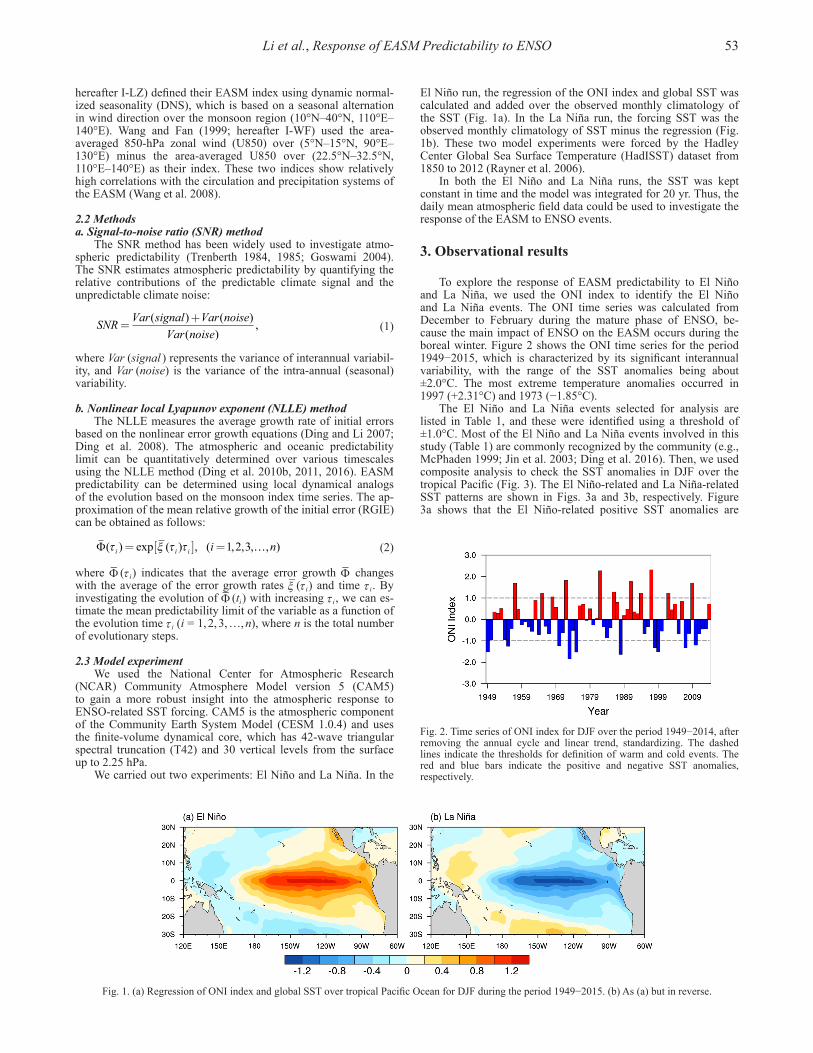
El Niño run, the regression of the ONI index and global SST was calculated and added over the observed monthly climatology of the SST (Fig. 1a). In the La Niña run, the forcing SST was the observed monthly climatology of SST minus the regression (Fig. 1b). These two model experiments were forced by the Hadley Center Global Sea Surface Temperature (HadISST) dataset from 1850 to 2012 (Rayner et al. 2006).
In both the El Niño and La Niña runs, the SST was kept constant in time and the model was integrated for 20 yr. Thus, the daily mean atmospheric field data could be used to investigate the response of the EASM to ENSO events.
3. Observational results
To explore the response of EASM predictability to El Niño and La Niña, we used the ONI index to identify the El Niño and La Niña events. The ONI time series was calculated from December to February during the mature phase of ENSO, be-cause the main impact of ENSO on the EASM occurs during the boreal winter. Figure 2 shows the ONI time series for the period 1949−2015, which is characterized by its significant interannual variability, with the range of the SST anomalies being about ±2.0°C. The most extreme temperature anomalies occurred in 1997 (+2.31°C) and 1973 (−1.85°C).
The El Niño and La Niña events selected for analysis are listed in Table 1, and these were identified using a threshold of ±1.0°C. Most of the El Niño and La Niña events involved in this study (Table 1) are commonly recognized by the community (e.g., McPhaden 1999; Jin et al. 2003; Ding et al. 2016). Then, we used composite analysis to check the SST anomalies in DJF over the tropical Pacific (Fig. 3). The El Niño-related and La Niña-related SST patterns are shown in Figs. 3a and 3b, respectively. Figure 3a shows that the El Niño-related positive SST anomalies are
hereafter I-LZ) defined their EASM index using dynamic normal-ized seasonality (DNS), which is based on a seasonal alternation in wind direction over the monsoon region (10°N–40°N, 110°E– 140°E). Wang and Fan (1999; hereafter I-WF) used the area- averaged 850-hPa zonal wind (U850) over (5°N–15°N, 90°E– 130°E) minus the area-averaged U850 over (22.5°N–32.5°N, 110°E–140°E) as their index. These two indices show relatively high correlations with the circulation and precipitation systems of the EASM (Wang et al. 2008).
2.2 Methodsa. Signal-to-noise ratio (SNR) method
The SNR method has been widely used to investigate atmo-spheric predictability (Trenberth 1984, 1985; Goswami 2004). The SNR estimates atmospheric predictability by quantifying the relative contributions of the predictable climate signal and the unpredictable climate noise:
SNR Var signal Var noiseVar noise
=+( ) ( )( )
, (1)
where Var (signal ) represents the variance of interannual variabil-ity, and Var (noise) is the variance of the intra-annual (seasonal) variability.
b. Nonlinear local Lyapunov exponent (NLLE) methodThe NLLE measures the average growth rate of initial errors
based on the nonlinear error growth equations (Ding and Li 2007; Ding et al. 2008). The atmospheric and oceanic predictability limit can be quantitatively determined over various timescales using the NLLE method (Ding et al. 2010b, 2011, 2016). EASM predictability can be determined using local dynamical analogs of the evolution based on the monsoon index time series. The ap-proximation of the mean relative growth of the initial error (RGIE) can be obtained as follows:
Φ( ) exp ( ) , ( , , , , )τ ξ τ τi i i i n= [ ] =1 2 3 (2)
where Φ− (τ i ) indicates that the average error growth Φ− changes with the average of the error growth rates ξ− (τ i ) and time τ i . By investigating the evolution of Φ− (ti ) with increasing τ i , we can es-timate the mean predictability limit of the variable as a function of the evolution time τ i (i = 1, 2, 3, …, n), where n is the total number of evolutionary steps.
2.3 Model experimentWe used the National Center for Atmospheric Research
(NCAR) Community Atmosphere Model version 5 (CAM5) to gain a more robust insight into the atmospheric response to ENSO-related SST forcing. CAM5 is the atmospheric component of the Community Earth System Model (CESM 1.0.4) and uses the finite-volume dynamical core, which has 42-wave triangular spectral truncation (T42) and 30 vertical levels from the surface up to 2.25 hPa.
We carried out two experiments: El Niño and La Niña. In the
Fig. 1. (a) Regression of ONI index and global SST over tropical Pacific Ocean for DJF during the period 1949−2015. (b) As (a) but in reverse.
Fig. 2. Time series of ONI index for DJF over the period 1949−2014, after removing the annual cycle and linear trend, standardizing. The dashed lines indicate the thresholds for definition of warm and cold events. The red and blue bars indicate the positive and negative SST anomalies, respectively.

54 SOLA, 2018, Vol. 14, 52−56, doi:10.2151/sola.2018-009
concentrated mainly in the central and eastern tropical Pacific, whereas the El Niño-related negative SST anomalies are found in the western Pacific and subtropical ocean. The La Niña-related SST pattern is the reverse of the El Niño-related pattern (Fig. 3b).
We used the SNR method to estimate the potential EASM pre-dictability levels associated with El Niño and La Niña events (Fig. 4). The predictability of the EASM affected by El Niño is up to 12.35, whereas it is 4.19 when affected by La Niña. The results in-dicate the asymmetric response of EASM predictability to ENSO, suggesting that El Niño (La Niña) will lead to a stronger (weaker) predictable intensity for the EASM in the following year.
We also ran model experiments to examine this asymmetric response of EASM predictability to El Niño and La Niña. In addition, the NLLE method was used to determine the predict-ability limit. Compared with the SNR method, which calculates only the potential predictability intensity, the NLLE method can estimate the exact predictability limit. However, due to the lack of observational data, we were unable to use the NLLE method with the observational results. Under our model setup, the position and intensity of the two sets of SST anomalies were the same in both runs, only the sign differed, so that the impact of SST alone was considered and all other factors were ignored. This approach highlights the impacts of El Niño and La Niña.
4. Model results
The mean errors of the EASM initially increase quickly, then slow down, and finally reach saturation (Fig. 5). Figure 5a and 5b shows that the error growth behaves differently to the rate of growth. The error growth associated with the I-LZ index under El Niño forcing becomes much slower than that for the La Niña forcing. Therefore, the error growth of I-LZ forced by El Niño (La Niña) needs more (less) time to reach saturation.
Ding and Li (2007) proposed that for chaotic systems the error growth will eventually reach saturation. As the error growth approaches saturation level, almost all of the information on the initial states is lost and the prediction becomes meaningless. Using the saturation level, this predictability limit can be determined. To reduce the effects of sampling fluctuations, we defined the predictability limit as the point when the error reached 95% of its saturation level. As the moment to saturation, the predictability will be determined (shown in Fig. 6).
The predictability of I-LZ forced by El Niño is up to 32 days, whereas that forced by La Niña is only 22 days. This 10-day difference suggests that El Niño will lead to the EASM having a longer predictability limit than La Niña. We also investigated the error growth associated with the I-WF index forced by El Niño and La Niña (Figs. 5c and 5d, respectively). According to the cri-terion of the 95% saturation level, the predictability limit of I-WF forced by El Niño (La Niña) is approximately 21 days (15 days). As with I-LZ, the error growth of I-WF forced by El Niño (La Niña) appears to be longer (shorter) than the predictability limit. Our analysis of the response of the two EASM indices also reveals that the predictability limit calculated using the NLLE method is based mainly on the respective initial states. Figures 5a and 5c shows that, under El Niño forcing, the error growth of I-LZ fol-lows a slower deceleration process than that of I-WF. Therefore, I-LZ (around 32 days) tends to produce more skillful predictions than I-WF (around 21 days; Fig. 6). As mentioned above, it is evident that El Niño will lead to relatively improved predictability for both EASM indices.
Our simulation results are similar to the observations, which gives us the confidence to conclude that ENSO does influence EASM predictability in the following year. Note that El Niño will lead to relatively high predictability of the EASM. In contrast to previous research (e.g., Palmer et al. 1992; Shi et al. 2008), this work has investigated the response of EASM predictability to El Niño and La Niña. Moreover, our experiments eliminated the impact of other factors, such as the intensity and position of the SST anomalies.
5. Discussion and conclusions
Improving our understanding of the impact of external forcing on climate predictability is vital to the ongoing development of numerical models and improving our forecast skill with respect to the EASM. ENSO is well known to have a significant influence
Fig. 4. The potential predictability of the EASM. The red and blue bars indicate the El Niño and La Niña effect, respectively.
Table 1. Classification of El Niño/La Niña events during the period 1949–2015.
Event Year
El Niño
La Niña
1957, 1965, 1968, 1972, 1982, 1986, 1991, 1994, 1997, 2002, and 20091949, 1955, 1970, 1973, 1975, 1988, 1998, 1999, 2007, and 2010
Fig. 3. Composite anomalies of SST over tropical Pacific Ocean in DJF for selected (a) El Niño and (b) La Niña events during the period 1949−2015. Details of the ENSO change events selected for composite analysis are given in Table 1.

55Li et al., Response of EASM Predictability to ENSO
on the EASM. Thus, in this study, we investigated the effect of ENSO on EASM predictability, and in particular the different effects of El Niño and La Niña. By using reanalysis data and statistical methods, we found that the response of EASM pre-dictability is asymmetrical, and that El Niño leads to stronger predictable intensity than La Niña. In addition, two EASM indices and the quantitative method (NLLE) being used to research the model simulation results, the asymmetric response still exists even though La Niña intensity has been increased.
Although we found an asymmetric response in EASM pre-dictability, how the two different SST anomaly patterns, El Niño and La Niña, affect EASM predictability remains an unanswered question. In a previous study, Li et al. (2017) found that forcing by the positive anomalies leads to a higher predictability limit than forcing by the negative anomalies. They used a simple chaotic model to demonstrate how the different initial conditions drive the nonlinear response, which in turn leads to the different pre-dictability limits, and this provides one possible interpretation of our results. Both the EASM and ENSO are complex and nonlinear climate systems, but in particular, ENSO as an external forcing factor that leads to a nonlinear response requires more research, and this will be the subject of a future paper.
Acknowledgements
This research was jointly supported by the National Natural Science Foundation of China for Excellent Young Scholars (41522502), the National Program on Global Change and Air-Sea Interaction (GASI-IPOVAI-03, GASI-IPOVAI-06), and the Na-tional Key Technology Research and Development Program of the Ministry of Science and Technology of China (2015BAC03B07).
Edited by: H. Mukougawa
References
Deser, C., M. A. Alexander, S. P. Xie, and A. S. Phillips, 2010: Sea surface temperature variability: Patterns and mechanisms. Annual Review of Marine Science, 2, 115−143.
Ding, R. Q, J. P. Li, Y. H. Tseng, C. Sun, and F. Xie, 2017: Joint impact of North and South Pacific extratropical atmospheric variability on the onset of ENSO events. J. Geophys. Res., 122, 279−298.
Ding, R. Q., and J. P. Li, 2007: Nonlinear finite-time Lyapunov exponent and predictability. Phys. Lett. A., 364, 396−400.
Ding, R. Q., and J. P. Li, 2009: Application of nonlinear error growth dynamics in studies of atmospheric predictability. Acta. Meteor. Sin., 67, 241−249.
Ding, R. Q., K. J. Ha, and J. P. Li, 2010a: Interdecadal shift in the relationship between the East Asian summer monsoon and the tropical Indian Ocean. Climate Dyn., 34, 1059−1071.
Ding, R. Q., J. P. Li, and K. J. Ha, 2008: Nonlinear local Lya-punov exponent and quantification of local predictability. Chinese Phys. Lett., 25, 1919−1922.
Ding, R. Q., J. P. Li, and K. H. Seo, 2010b: Predictability of the Madden–Julian oscillation estimated using observational data. Mon. Wea. Rev., 138, 1004−1010.
Ding, R. Q., J. P. Li, and K. H. Seo, 2011: Estimate of the predict-ability of boreal summer and winter interseasonal oscilla-tions from observational data. Mon. Wea. Rev., 139, 2421− 2438.
Fig. 5. Mean error growth of the I-LZ index under (a) El Niño and (b) La Niña forcing. (c) and (d) as (a) and (b), but for the I-WF index. The dashed line represents the 95% level of the saturation value, as obtained by taking the average of the mean error growth after 40 days. The Φ− denotes the mean error of the I-LZ (I-WF) index.
Fig. 6. The predictability limits of the I-LZ and I-WF indices. The red and blue bars indicate the El Niño and La Niña effects, respectively.

56 SOLA, 2018, Vol. 14, 52−56, doi:10.2151/sola.2018-009
Ding, R. Q., J. P. Li, F. Zheng, J. Feng, and D. Q. Liu, 2015: Estimating the limit of decadal-scale climate predictability using observational data. Climate Dyn., 46, 1563−1580.
Ding, Y. H., 1992: Summer monsoon rainfalls in China. J. Meteor. Soc. Japan, 70, 373−396.
Goswami, B., 2004: Inter-decadal change in potential predictabil-ity of the Indian summer monsoon. Geophys. Res. Lett., 31, 371−375.
Jin, F. F., S. I. An, A. Timmermann, and J. Zhao, 2003: Strong El Niño events and nonlinear dynamical heating. Geophys. Res. Lett., 30, 1120.
Kalnay, E., M. Kanamitsu, R. Kistler, and co-authors, 1996: The NCEP/NCAR 40-year reanalysis project. Bull. Amer. Meteor. Soc., 77, 437−471.
Kistler, R., W. Collins, S. Saha, and co-authors, 2001: The NCEP–NCAR 50-year reanalysis: Monthly means CD–ROM and documentation. Bull. Amer. Meteor. Soc., 82, 247−267.
Li, B. S., R. Q. Ding, J. P. Li, and Q. J. Zhong, 2017: Predictabil-ity of forced Lorenz system. Acta Phys. Sin., 66, 060503. doi:10.7498/aps.66.060503.
Li, J. P., and R. Q. Ding, 2011: Temporal–spatial distribution of atmospheric predictability limit by local dynamical ana-logues. Mon. Wea. Rev., 139, 3265−3283.
Li, J. P., and R. Q. Ding, 2013: Temporal–spatial distribution of the predictability limit of monthly sea surface temperature in the global oceans. Int. J. Climatol., 33, 1936−1947.
Li, J. P., and Q. C. Zeng, 2002: A unified monsoon index. Geo-phys. Res. Lett., 29, 1274.
Li, J. P., and Q. C. Zeng, 2003: A new monsoon index and the geographical distribution of the global monsoons. Adv. Atmos. Sci., 20, 299−302.
McPhaden, M. J., 1999: The child prodigy of 1997−1998. Nature, 398, 559−562.
McPhaden, M. J., S. E. Zebiak, and M. H. Glantz, 2006: ENSO as an integrating concept in Earth science. Science, 314, 1740− 1745.
Palmer, T. N., Č. Branković, P. Viterbo, and M. J. Miller, 1992: Modelling interannual variations of summer monsoons. J. Climate, 5, 399−417.
Rayner, N. A., P. Brohan, D. E. Parker, and co-authors, 2006: Improved analyses of changes and uncertainties in sea sur-face temperature measured in situ since the mid-nineteenth century: The HadSST2 dataset. J. Climate, 19, 446−469.
Shi, H. B., T. J. Zhou, H. Wan, B. Wang, and R. Yu, 2008: SIMP2 Experiment-based analysis on the simulation and potential predictability of Asian Summer Monsoon. Chinese J. Atmos. Sci., 32, 36−52.
Smith, T. M., R. W. Reynolds, T. C. Peterson, and J. Lawrimore, 2008: Improvements to NOAA’s historical merged land–ocean surface temperature analysis (1880−2006). J. Climate, 21, 2283−2296.
Trenberth, K. E., 1984: Signal versus noise in the Southern Oscil-lation. Mon. Wea. Rev., 112, 326−332.
Trenberth, K. E., 1985: Potential predictability of geopotential heights over the Southern Hemisphere. Mon. Wea. Rev., 113, 54−64.
Wang, B., and Z. Fan, 1999: Choice of South Asian Summer Monsoon Indices. Bull. Amer. Meteor. Soc., 80, 629−638.
Wang, B., R. G. Wu, and X. H. Fu, 2000: Pacific–East Asian tele-connection: How does ENSO affect East Asian climate? J. Climate, 13, 1517–1536.
Wang, B., Z. W. Wu, J. P. Li, J. Liu, C. P. Chang, Y. Ding, and G. Wu, 2008: How to measure the strength of the East Asian summer monsoon. J. Climate, 21, 4449−4463.
Webster, P. J., and S. Yang, 1992: Monsoon and ENSO: Selec-tively interactive systems. Quart. J. Roy. Meteor. Soc., 118, 877−926.
Wu, Z. W., J. P. Li, J. H. He, and Z. H. Jiang, 2006: Occurrence of droughts and floods during the normal monsoons in the mid- and lower-reaches of the Yangtze River. Geophys. Res. Lett., 33, L05813.
Wu, Z. W., B. Wang, J. P. Li, and F. F. Jin, 2009: An empirical sea-sonal prediction model of the east Asian summer monsoon using ENSO and NAO. J. Geophys. Res., 114, D18120.
Manuscript received 24 January 2018, accepted 3 April 2018SOLA: https://www. jstage. jst.go. jp/browse/sola/