asur 1q19 passenger traffic increased 2.4% yoy in mexico, … · 2019-11-14 · to higher traffic....
TRANSCRIPT

ASUR 1Q19 Page 1 of 24
ASUR 1Q19 Passenger Traffic Increased 2.4% YoY
in Mexico, 23.8% in Puerto Rico and 15.1% in Colombia
Mexico City, April 24, 2019 - Grupo Aeroportuario del Sureste, S.A.B. de C.V. (NYSE: ASR; BMV:
ASUR) (ASUR), a leading international airport group with operations in Mexico, the U.S., and Colombia, today announced results for the three-month period ended March 31, 2019. 1Q19 Highlights1
• Passenger traffic in Mexico increased 2.4% YoY, reflecting increases of 4.4% and 1.0% in domestic and
international traffic, respectively, mainly driven by Cancun Airport.
• Traffic in Puerto Rico (Aerostar) rose 23.8% YoY, driven by increases of 23.2% in domestic traffic and
29.9% in international traffic.
• Traffic in Colombia (Airplan) increased 15.1% YoY, reflecting growth of 16.5% in domestic traffic and 7.7% in international traffic.
• Consolidated commercial revenues per passenger reached Ps.104.6.
• Consolidated EBITDA rose 8.4% YoY, reaching Ps.2,662.9 million.
• Cash position at year-end was Ps.5,853.6 million. Net Debt to LTM EBITDA stood at 0.9x.
1 Unless otherwise stated, all financial figures discussed in this
announcement are unaudited, prepared in accordance with
International Financial Reporting Standards (IFRS), including
application of IFRS 9 and 15 that came into force in 2018, and represent comparisons between the three-month period ended
March 31, 2019, and the equivalent three-month period ended
March 31, 2018. On May 26, 2017, ASUR increased its share
ownership in Aerostar to 60% from its prior 50% ownership.
Accordingly, starting June 1, 2017, ASUR began to fully
consolidate Aerostar results on a line by line basis, while until then, results were accounted for by the equity method.
Furthermore, starting October 19, 2017, ASUR began to
consolidate results of Airplan in Colombia. All figures in this report
are expressed in Mexican pesos, unless otherwise noted. Tables
state figures in thousands of pesos, unless otherwise noted.
Passenger figures for Mexico and Colombia exclude transit and general aviation passengers, unless otherwise noted. Commercial
revenues include revenues from non-permanent ground transportation and parking lots. All U.S. dollar figures are calculated at the exchange rate
of US$1.00 = Mexican Ps.19.3779 (source: Diario Oficial de la Federacion de Mexico) while Colombian peso figures are calculated at the exchange
rate of COL$163.2934 = Ps. 1.00 Mexican pesos (source: Investing). Definitions for EBITDA, Adjusted EBITDA Margin, Majority Net Income can be
found on page 17 of this report.
Table 1: Financial & Operational Highlights 1 First Quarter
% Var 2018 2019
Financial Highlights
Total Revenue 3,916,573 4,101,350 4.7
Mexico 2,597,374 2,792,419 7.5
San Juan 642,548 852,259 32.6
Colombia 676,651 456,672 (32.5)
Commercial Revenues per PAX 99.9 104.6 4.8
Mexico 114.0 122.1 7.2
San Juan 117.5 118.1 0.5
Colombia 36.9 39.1 7.0
EBITDA 2,455,673 2,662,909 8.4
Net Income 1,467,083 1,519,151 3.5
Majority Net Income 1,454,626 1,468,449 1.0
Earnings per Share (in pesos) 4.8488 4.8948 1.0
Earnings per ADS (in US$) 2.5022 2.5260 1.0
Capex 599,245 270,302 (54.9)
Cash & Cash Equivalents 5,725,346 5,853,666 2.2
Net Debt 11,288,269 8,334,128 (26.2)
Net Debt/ LTM EBITDA 1.4 0.9 (37.1)
Operational Highlights
Passenger Traffic
Mexico 8,521,916 8,723,229 2.4
San Juan 1,858,298 2,300,508 23.8
Colombia 2,384,826 2,746,037 15.1
1Q19 Earnings Call
Date & Time: Thursday, April 25, 2019 at 10:00 AM US
ET; 9:00 AM CT
Dial-in: 1-888-394-8218 (Toll-Free) and 1-323-701-
0225 (International & Mexico). Access Code: 5578999.
Replay: Thursday, April 25 at 1:00 PM US ET, ending at
11:59 PM US ET on Thursday, May 2, 2019. Dial-in
number: 1-844-512-2921 Dial-in number: 1-844-512-
2921 (US & Canada) 1-412-317-6671 (International &
Mexico); Access Code 5578999.

ASUR 1Q19 Page 2 of 24
Passenger Traffic
ASUR’s total passenger traffic in 1Q19 rose 7.9% YoY to 13.8 million passengers, reflecting increases of 2.4% in Mexico, 23.8% in Puerto Rico, and 15.1% in Colombia. Passenger traffic growth of 2.4% in Mexico reflects increases of 4.4% and 1.0% in domestic and international traffic, respectively. Cancun was the main driver behind traffic growth, with increases of 3.8% and 0.9% in domestic and international traffic, respectively. The majority of ASUR’s other Mexican airports also contributed
to higher traffic. Note that during 2019, the impact of Holy Week on passenger traffic in Mexico will begin on April 12, while in 2018 it began on March 23. Traffic in Puerto Rico increased 23.8% YoY, recovering following the impact of Hurricane Maria, which hit the island in September 2017. Domestic traffic increased 23.2% YoY while international traffic rose 29.9%.
Colombia reported a 15.1% YoY increase in total traffic driven by growth of 16.5% and 7.7% in domestic and international traffic, respectively.
Tables with detailed passenger traffic information for each airport can be found on page 19 of this report.
Table 2: Passenger Traffic Summary
First Quarter % Chg.
2018 2019 Total Mexico 8,521,916 8,723,229 2.4 - Cancun 6,545,201 6,659,404 1.7 - 8 Other Airports 1,976,715 2,063,825 4.4 Domestic Traffic 3,458,958 3,610,761 4.4
- Cancun 1,829,258 1,899,183 3.8 - 8 Other Airports 1,629,700 1,711,578 5.0 International traffic 5,062,958 5,112,468 1.0
- Cancun 4,715,943 4,760,221 0.9 - 8 Other Airports 347,015 352,247 1.5 Total San Juan, Puerto Rico1 1,858,298 2,300,508 23.8 Domestic Traffic 1,682,957 2,072,825 23.2 International traffic 175,341 227,683 29.9 Total Colombia2 2,384,826 2,746,037 15.1 Domestic Traffic 2,012,117 2,344,772 16.5 International traffic 372,709 401,265 7.7 Total traffic 12,765,040 13,769,774 7.9 Domestic Traffic 7,154,032 8,028,358 12.2 International traffic 5,611,008 5,741,416 2.3
Review of Consolidated Results
In May 2017, ASUR increased its share ownership in Aerostar, operator of LMM Airport in Puerto Rico, to 60% from its prior 50% ownership. Accordingly, until May 31, 2017, ASUR’s ownership in Aerostar was accounted for by the equity method, while starting June 1, 2017, ASUR began to fully consolidate Aerostar results on a line by line basis. In addition, on October 19, 2017, ASUR acquired a 92.42% ownership stake in Airplan, which
operates six airports in Colombia, and starting on that date, ASUR began to fully consolidate Airplan’s operations on a line by line basis. On May 25, 2018, ASUR acquired an addiitional 7.58% ownership stake in
Airplan, bringing its total share ownership in Airplan to 100.0%.

ASUR 1Q19 Page 3 of 24
Table 3: Summary of Consolidated Results
First Quarter % Chg.
2018 2019 Total Revenues 3,916,573 4,101,350 4.7 Aeronautical Services 2,204,696 2,376,142 7.8 Non-Aeronautical Services 1,399,478 1,566,507 11.9 Total Revenues Excluding Construction Revenues 3,604,174 3,942,649 9.4 Construction Revenues 1 312,399 158,701 (49.2) Total Operating Costs & Expenses 1,719,172 1,925,977 12.0 Other Income - 41,444 n/a
Operating Profit 2,197,401 2,216,817 0.9 Operating Margin 56.1% 54.1% (205 bps) Adjusted Operating Margin 2 61.0% 56.2% (474 bps) EBITDA 2,455,673 2,662,909 8.4 EBITDA Margin 62.7% 64.9% 223 bps Adjusted EBITDA Margin 3 68.1% 67.5% (59 bps) Net Income 1,467,083 1,519,151 3.5 Majority Net Income 1,454,626 1,468,449 1.0 Earnings per Share 4.8488 4.8948 1.0 Earnings per ADS in US$ 2.5022 2.5260 1.0
Total Commercial Revenues per Passenger 4 99.9 104.6 4.8 Commercial Revenues 1,283,552 1,451,238 13.1 Commercial Revenues from Direct Operations per Passenger 5
18.2 21.8 19.5
Commercial Revenues Excl. Direct Operations per
Passenger 81.7 82.9 1.5
1 Construction revenues for Airplan in 1Q18 include the actual construction revenues which is equal to the construction cost of Ps.75.9
million and an estimate to the downside of income derived from the valuation of the intangible to present value (construction income) of
Ps.214.8 million, according to IFRIC 12. Construction revenues for Airplan 1Q19 are equal to the construction cost of Ps.22.1 million.
2 Adjusted Operating Margin excludes the effect of IFRIC 12 with respect to the construction or improvements to concessioned assets in
Mexico, and is equal to operating profit divided by total revenues excluding construction services revenues.
3 Adjusted EBITDA Margin excludes the effect of IFRIC 12 with respect to the construction or improvements to concessioned assets in
Mexico, and is calculated by dividing EBITDA by total revenues excluding construction services revenues.
4 Passenger figures include transit and general aviation passengers for Mexico, Puerto Rico, and Colombia.
5 Represents ASUR’s operations in convenience stores.
Consolidated Revenues
Consolidated Revenues for 1Q19 rose 4.7% YoY, or Ps.184.8 million to Ps.4,101.3 million, mainly driven by increases of: • 7.8% in revenues from aeronautical services to Ps.2,376.1 million. Mexico contributed with Ps.1,597.6
million, while Puerto Rico and Colombia contributed with Ps.455.5 million and Ps.323.1 million, respectively; and
• 11.9% in revenues from non-aeronautical services to Ps.1,566.6 million, principally reflecting the 13.1%
increase in commercial revenues. Mexico contributed with Ps.1,180.7 million in revenues from non-
aeronautical services, while Puerto Rico and Colombia contributed with Ps.274.4 million and Ps.111.5 million, respectively.
This was partially offset by a 49.2%, or Ps.153.7 million, decline in revenues from construction services. This was mainly due to a decrease in construction revenues in Mexico, Puerto Rico, and Colombia as a result of
lower capital expenditures and other investments in concessioned assets during the period. Excluding revenues from construction services, which are deducted as costs under IFRS accounting standards, total revenues would have increased 9.4% YoY to Ps.3,942.6 million. Mexico contributed with 70.5% of total revenues excluding revenues from construction services, while Puerto Rico and Colombia represented 18.5% and 11.0%, respectively.
Commercial Revenues in 1Q19 increased 13.1% YoY to Ps.1,451.2 million, mainly reflecting the 7.9% increase in total passenger traffic. Commercial revenues in Mexico rose 9.7% to Ps.1,069.7 million, mainly driven by the opening of new commercial spaces, including duty free, retail, food and beverages, and car

ASUR 1Q19 Page 4 of 24
rentals, among others. Likewise, Puerto Rico reported a YoY increase of 24.4% to Ps.271.6 million in commercial revenues, and Colombia an increase of 22.6% to Ps.110.0 million.
Commercial Revenues per Passenger increased to Ps.104.6 in 1Q19. Mexico contributed with commercial revenues per passenger of Ps.122.1 in 1Q19, Puerto Rico with Ps.118.0, and Colombia with Ps.39.1.
Commercial revenues per passenger increased year-on-year by 7.1% in Mexico, 0.4% in Puerto Rico, and 6.0% in Colombia.
Consolidated Operating Costs and Expenses
Consolidated Operating Costs and Expenses, including construction costs, for 1Q19 increased by 12.0% YoY, or Ps.206.8 million, to Ps.1,926.0 million. Excluding construction costs, operating costs and expenses increased by 9.0% or Ps.145.7 million year-on-year, reflecting the following increases: • 2.9%, or Ps.14.4 million, in Puerto Rico mainly as a result of the 5.5%, or Ps.8.3 million in the amortization
of the intangible asset resulting from the valuation of the investment in Aerostar under IFRS 3.
• 8.3%, or Ps.68.7 million, in Mexico principally as a result of increases in maintenance, energy, and security expenses. Higher technical assistance costs as well as professional fees in connection with diverse projects also contributed to the increase in costs.
• 21.1%, or Ps.62.6 million, in Colombia, composed of: i) a Ps.37.1 million expense in connection with the
early termination of the agreement with the parking lot concessionaire in Rionegro Airport, ii) a Ps.8.6
million provision for doubtful collectible accounts, and iii) a Ps.6.5 million increase in the maintenance provision for the future replacement of fixed assets as of December 31, 2018 as per IFRIC12.
Cost of Services rose by 15.2%, or Ps.119.1 million. In Mexico, cost of services increased 12.6% YoY, or Ps.48.6 million, reflecting higher maintenance expenses, along with increased energy, security, and maintenance expenses. Cost of services in Colombia rose 76.2%, or Ps.69.2 million, reflecting a Ps.37.1 million expense in connection with the early termination of the agreement with the parking lot concessionaire in
Rionegro Airport, an Ps.8.6 million provision for doubtful collectible accounts, and a Ps.6.5 million increase in the maintenance provision for future replacement of assets in line with IFRIC 12. Puerto Rico reported a 0.7%,
or Ps.2.1 million increase in cost of services. Construction Costs increased by 62.6% YoY, or Ps.61.1 million. This was mainly driven by increases of
1,136.7%, or Ps.112.5 million in Puerto Rico and 20.6%, or Ps.2.4 million in Mexico, partially offset by a decline of 70.9%, or Ps.53.8 million in Colombia.
G&A Expenses, which reflect administrative expenses in Mexico, increased 3.5% YoY mainly reflecting higher travel expenses, professional fees and salaries.
Consolidated Technical Assistance increased 5.8% YoY, mainly reflecting EBITDA growth in Mexico, excluding extraordinary items, a factor in the calculation of the fee.
Concession Fees increased 9.6% YoY, principally reflecting higher fees paid to the Mexican government, mainly due to an increase in regulated revenues in Mexico, a factor in the calculation of the fee. Concession
fees for 1Q19 also reflect an increase in Puerto Rico and Colombia. Depreciation and Amortization declined 0.7%, or Ps.3.2 million, principally due to a Ps.14.6 million, or 11.2% decline in Colombia, resulting mainly from the change in the amortization methodology, which as of
January 1, 2019 is on a straight line and not based on progress of works. This was partially offset by the recognition starting March 2018 of the amortization of the concession resulting from the valuation of ASUR’s investment in Airplan under IFRS 3. By contrast, depreciation and amortization in Puerto Rico increased 5.5%, or Ps.8.3 million mainly from the recognition starting March 2018 of the amortization of the intangible asset in Puerto Rico resulting from the valuation of the investment in Aerostar under IFRS 3, while Mexico reported 1.8%, or Ps.3.0 million increase.

ASUR 1Q19 Page 5 of 24
Consolidated Operating Profit and EBITDA In 1Q19, ASUR reported a Consolidated Operating Profit of Ps.2,216.8 million and Operating Margin of
54.1%. This was principally due to increases of 7.8%, or Ps.171.4 million, in aeronautical revenues, and 11.9%, or Ps.167.0 million in non-aeronautical revenues. Mexico reported an operating profit of 1,880.9 million, Puerto Rico of Ps.260.4 million, and Colombia Ps.75.5 million.
Adjusted Operating Margin, which excludes the effect of IFRIC 12 with respect to the construction or improvements to concessioned assets in Mexico, Colombia, and Puerto Rico, and is calculated as operating profit divided by total revenues less construction services revenues, was 56.2% in 1Q19 compared with 61.0% in 1Q19. EBITDA increased 8.4%, or Ps.207.2 million, to Ps.2,662.9 million in 1Q19. EBITDA increased 6.6%, or
Ps.127.6 million in Mexico, 34.7%, or Ps.108.2 million, in Puerto Rico, and declined 13.0%, or Ps.28.5 million in Colombia. 1Q19 EBITDA Margin was 64.9% compared to 62.7% in 1Q18.
Adjusted EBITDA Margin, which excludes the effect of IFRIC 12 with respect to the construction of or
improvements to concessioned assets in Mexico, Puerto Rico, and Colombia was 67.5% in 1Q19 compared to
68.1% in 1Q18.
Consolidated Comprehensive Financing Gain (Loss)
Table 4: Consolidated Comprehensive Financing Gain (Loss)
First Quarter % Chg.
2018 2019 Interest Income 70,246 111,159 58.2 Interest Expense (311,508) (284,404) (8.7) Foreign Exchange Gain (Loss), Net 44,917 (18,099) n/a Total (196,345) (191,344) (2.5)
In 1Q19, ASUR reported a Ps.191.3 million Consolidated Comprehensive Financing Loss, compared to a
Ps.196.3 million loss in 1Q18.
Interest expense declined by Ps.27.1 million during the period, or 8.7%, mainly reflecting a decline of Ps.13.3 million in interest payments in Mexico as the Company paid down loans in June and November 2018. Interest income increased by Ps.40.9 million, or 58.2%, reflecting mainly the recognition of interest income of Ps.33.0 million resulting from a favorable resolution of a legal claim against a contractor, along with a higher cash balance in the quarter. In 1Q19, ASUR reported a foreign exchange loss of Ps.18.1 million, resulting from the 2.2% quarterly average
appreciation of the Mexican peso against the U.S. dollar on ASUR’s foreign currency net asset position. This compares to a Ps.44.9 million foreign exchange gain in 1Q18 resulting from the 4.6% quarterly average Mexican peso appreciation during that period on a lower foreign currency net asset position.
Income Taxes Income Taxes for 1Q19 declined by Ps.27.7 million year-over-year, principally due to the combination of following factors:
• A Ps.74.4 million YoY decline in deferred income taxes, mainly reflecting the reduction in the tax rate used
for the calculation of deferred income taxes ISR from 33% to 30% resulting from the fiscal reform enacted
on December 23, 2018. This was partially offset by a decrease in the tax benefit in Mexico resulting from a change in the tax amortization rate on the concessioned assets starting in the second quarter of 2018, as well as the decline in the inflation rate to 0.4% in 1Q19 from 1.2% in 1Q18.
• A Ps.47.1 million increase in income taxes, reflecting mainly a tax gain in Colombia in 1Q18 resulting from a change in tax legislation according to Decree 2235 published on December 27, 2017. This was partly offset by a lower taxable income base for Cancun Airport and Cancun Airport Services in Mexico.

ASUR 1Q19 Page 6 of 24
Majority Net Income Majority Net Income for 1Q19 increased by 1.0% or Ps.13.8 million, to Ps.1,468.4 million from Ps.1,454.6
million in 1Q18. Earnings per common share for the quarter were Ps.4.8948 and earnings per ADS (EPADS) were US$2.5260 (one ADS represents ten series B common shares). This compares with earnings per share of Ps.4.8488 and earnings per ADS of US$2.5022 for the same period last year.
Net Income Net Income for 1Q19 increased by 3.5%, or Ps.52.1 million, to Ps.1,519.1 million from Ps.1,467.1 million in 1Q19.
Consolidated Financial Position On March 31, 2019, airport concessions represented 85.6% of the Company’s total assets, with current assets
representing 13.5% and other assets representing 0.9%.
As of March 31, 2019, ASUR had cash and cash equivalents of Ps.5,853.7 million, a 27.7% increase from Ps.4,584.5 million at December 31, 2018. Puerto Rico contributed with Ps.748.9 million in cash and cash equivalents in 1Q19 and Colombia with Ps.213.7 million.
As of March 31, 2019, the valuation of ASUR’s investment in Aerostar in accordance with IFRS 3 "Business Combinations" resulted in the following effects in the balance sheet: i) the recognition of a net intangible asset of Ps.5,993.2 million, ii) goodwill of Ps.887.2 (net of an impairment of Ps.4,719.1 million), iii) deferred taxes of Ps.599.3 million, and iv) a minority interest of Ps.5,363.7 million within the stockholders 'equity.
Furthermore, the valuation of ASUR’s investment in Airplan resulted in the following effects in the balance sheet as of March 31, 2019: i) the recognition of a net intangible asset of Ps.1,362.4 million, ii) goodwill of Ps.1,504.9, iii) deferred taxes of Ps.223.1 million, and iv) Ps.619.4 million from the recognition of bank loans at fair value.
On May 25, 2018, ASUR acquired an additional 7.58% of the share ownership of Airplan bringing its ownership stake in the company to 100%. This transaction resulted in the recognition of shareholders’ equity in excess of the Ps.213.5 million (Ps.37.7 million by majority interest and Ps.175.8 by minority interest). Stockholders’ equity at the close of 1Q19 was Ps.38,049.1 million and total liabilities were Ps.19,238.8 million, representing 66.4% and 33.6% of total assets, respectively. Deferred liabilities represented 15.8% of ASUR’s total liabilities.
Total Debt at quarter-end decreased to Ps.14,187.8 million, from Ps.14,500.4 million on December 31, 2018. During 1Q19 ASUR paid down a portion of its U.S. Dollar denominated debt of the Puerto Rico subsidiary totaling Ps.103.2 million. On March 31, 2019, 28.2% of ASUR’s total debt was denominated in Mexican pesos, 49.2% in U.S. Dollars (at Aerostar) and 22.6% in Colombian pesos. Net Debt to LTM EBITDA stood at 0.9x at the close of 1Q19, while the Interest Coverage ratio was 7.4x as of
March 31, 2019. This compares with Net Debt to LTM EBITDA and Interest Coverage Ratios of 1.0x and 8.7x
as of December 31, 2018, respectively.

ASUR 1Q19 Page 7 of 24
Table 5: Consolidated Debt Indicators
March 31,
2018
December 31,
2018
March 31,
2019
Leverage
Total Debt / LTM EBITDA (Times) 1 2.0 1.5 1.5
Total Net Debt / LTM EBITDA (Times) 2 1.4 1.0 0.9
Interest Coverage Ratio 3 16.9 8.7 7.4
Total Debt 17,013,615 14,500,381 14,187,794
Short-term Debt 449,618 500,105 375,609
Long-term Debt 16,563,997 14,000,276 13,812,185
Cash & Cash Equivalents 5,725,346 4,584,507 5,853,666
Total Net Debt 4 11,288,269 9,915,874 8,334,128
1 The Total Debt to EBITDA Ratio is calculated as ASUR’s interest-bearing liabilities divided by its EBITDA.
2 The Total Net Debt to EBITDA Ratio is calculated as ASUR’s interest-bearing liabilities minus Cash & Cash Equivalents, divided by its
EBITDA.
3 The Interest Coverage Ratio is calculated as ASUR’s EBIT divided by its interest expenses.
4 The Total Net Debt is calculated as Total Debt minus Cash & Cash Equivalents.
Table 6: Consolidated Debt Profile
(in millions)
Airport Payment of
principal Currency
Interest
Rate
Amortization Schedule
2019 2020 2021
/23
2024
/35 Total
5 Yr-Syndicated Credit
Facility Cancun
Upon
expiration $PMx
Tiie +
1.25% - - 2,000.0 - 2,000.0
7 Yr-Syndicated Credit
Facility Cancun
Semi-Annual
Amort. $PMx
Tiie +
1.25% - 20.0 1,860.0 120.0 2,000.0
22 Yr-Senior Note
2035 San Juan
Semi-Annual
Amort. $Usd 5.75% - 5.3 17.1 162.9 185.3
20 Yr-Senior Note
2035 San Juan
Semi-Annual
Amort. $Usd 6.75% 5.2 5.3 18.3 153.8 182.6
12 Yr-Syndicated
Credit Facility Colombia Qtly. Amort. $PCol DTF1 + 4 7,125.0 12,000.0 44,250.0 81,000.0 144,375.0
12 Yr-Syndicated
Credit Facility Colombia Qtly. Amort. $PCol DTF1 + 4 4,842.0 8,160.0 30,090.0 55,080.0 98,172.0
12 Yr-Syndicated
Credit Facility Colombia Qtly. Amort. $PCol DTF1 + 4 4,275.0 7,200.0 26,550.0 48,600.0 86,625.0
12 Yr-Syndicated
Credit Facility Colombia Qtly. Amort. $PCol DTF1 + 4 1,757.5 2,960.0 10,915.0 19,980.0 35,612.5
12 Yr-Syndicated
Credit Facility Colombia Qtly. Amort. $PCol DTF1 + 4 1,757.5 2,960.0 10,915.0 19,980.0 35,612.5
12 Yr-Syndicated
Credit Facility Colombia Qtly. Amort. $PCol DTF1 + 4 380.0 640.0 2,360.0 4,320.0 7,700.0
12 Yr-Syndicated
Credit Facility Colombia Qtly. Amort. $PCol DTF1 + 4 380.0 640.0 2,360.0 4,320.0 7,700.0
12 Yr-Syndicated
Credit Facility Colombia Qtly. Amort. $PCol DTF1 + 4 380.0 640.0 2,360.0 4,320.0 7,700.0
1 DTF is an average 90-day rate to which the credit facilities in Colombia are pegged.
Capex During 1Q19, ASUR made capital investments of Ps.270.3 million, of which Ps.149.0 million relate to the Company’s plan to modernize its Mexican airports pursuant to its master development plans. This also includes investments of Ps.121.3 million made by Aerostar at LMM Airport in Puerto Rico. In 1Q18, ASUR made capital
investments of Ps.599.2.

ASUR 1Q19 Page 8 of 24
Review of Mexico Operations
Table 7: Mexico Revenues & Commercial Revenues Per Passenger
(in thousands of Mexican pesos)
First Quarter %
Chg.
2018 2019 Total Passenger 8,561 8,758 2.3 Total Revenues 2,597,374 2,792,419 7.5 Aeronautical Services 1,497,847 1,597,552 6.7 Non-Aeronautical Services 1,087,763 1,180,677 8.5 Construction Revenues 11,764 14,190 20.6 Total Revenues Excluding Construction Revenues 2,585,610 2,778,229 7.4 Total Commercial Revenues 975,531 1,069,709 9.7 Commercial Revenues from Direct Operations 192,538 243,227 26.3 Commercial Revenues Excluding Direct Operations 782,993 826,482 5.6 Total Commercial Revenues per Passenger 114.0 122.1 7.1 Commercial Revenues from Direct Operations per Passenger 22.5 27.8 23.5 Commercial Revenues Excl. Direct Operations per Passenger 91.5 94.4 3.2
Mexico Revenues Mexico Revenues for 1Q19 increased 7.5% YoY to Ps.2,792.4 million. Excluding construction, revenues rose 7.4% YoY, reflecting the following increases: • 6.7% in revenues from aeronautical services, principally due to the 2.4% increase in passenger traffic;
and
• 8.5% in revenues from non-aeronautical services, principally reflecting the 9.7% growth in commercial
revenues. Commercial Revenues rose 9.7% YoY, mainly due to the 2.3% increase in total passenger traffic (including transit and general aviation passengers) and reported increases across all categories as shown on Table 8.
Commercial Revenues per Passenger were up 7.1% in 1Q19 to Ps.122.1, from Ps.114.0 in 1Q18.
ASUR classifies commercial revenues as those derived from the following activities: duty-free stores, car rentals, retail operations, banking and currency exchange services, advertising, teleservices, non-permanent ground transportation, food and beverage operations, and parking lot fees.
As shown in Table 9, during the last 12 months, ASUR opened 3 new commercial spaces at Cancun Airport, and six commercial spaces at its other eight Mexican airports. More details of these openings can be found on page 20 of this report.
Table 8: Mexico Commercial Revenue Performance
Table 9: Mexico Summary Retail and Other Commercial
Space Opened since March 31,2018.
Business Line
YoY
Chg Type of Commercial Space 1
# Of
Spaces
Opened 1Q19
Advertising Revenues 46.5% Cancun 3
Ground Transportation 21.3% Retail Operations 2
Parking Lot Fees 14.9% Food and Beverage Operations 1
Food and Beverage Operations 12.3% 8 Other Airports 6
Other Revenue 12.1% Retail Operations 4
Car Rental Revenues 10.5% Car Rental Revenues 2
Retail Operations 8.1% Mexico 9
Duty Free 7.0% Teleservices (7.0%) Banking and Currency Exchange Services (11.6%)
1 Only includes new stores opened during the period and
excludes remodelings or contract renewals. Total Commercial Revenues 9.7%
ASUR 1Q19 Page 9 of 24
Mexico Operating Costs and Expenses
Table 10: Mexico Operating Costs & Expenses
First Quarter
% Chg. 2018 2019
Cost of Services 385,389 434,022 12.6 Administrative 58,265 60,323 3.5 Technical Assistance 101,245 108,082 6.8 Concession Fees 115,657 123,859 7.1 Depreciation and Amortization 168,078 171,058 1.8 Operating Costs and Expenses Excluding Construction Costs
828,634 897,344 8.3
Construction Costs 11,764 14,190 20.6 Total Operating Costs & Expenses 840,398 911,534 8.5
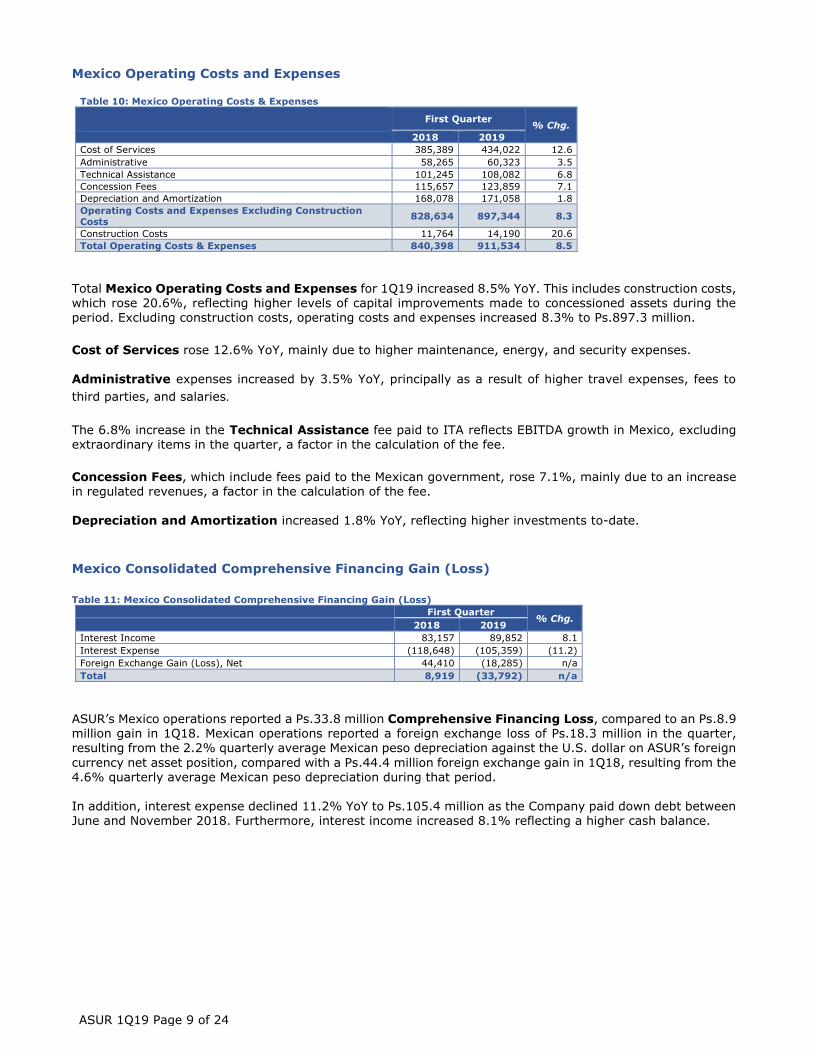
Total Mexico Operating Costs and Expenses for 1Q19 increased 8.5% YoY. This includes construction costs, which rose 20.6%, reflecting higher levels of capital improvements made to concessioned assets during the period. Excluding construction costs, operating costs and expenses increased 8.3% to Ps.897.3 million.
Cost of Services rose 12.6% YoY, mainly due to higher maintenance, energy, and security expenses. Administrative expenses increased by 3.5% YoY, principally as a result of higher travel expenses, fees to
third parties, and salaries.
The 6.8% increase in the Technical Assistance fee paid to ITA reflects EBITDA growth in Mexico, excluding extraordinary items in the quarter, a factor in the calculation of the fee.
Concession Fees, which include fees paid to the Mexican government, rose 7.1%, mainly due to an increase in regulated revenues, a factor in the calculation of the fee.
Depreciation and Amortization increased 1.8% YoY, reflecting higher investments to-date.
Mexico Consolidated Comprehensive Financing Gain (Loss)
Table 11: Mexico Consolidated Comprehensive Financing Gain (Loss)
First Quarter % Chg.
2018 2019 Interest Income 83,157 89,852 8.1 Interest Expense (118,648) (105,359) (11.2) Foreign Exchange Gain (Loss), Net 44,410 (18,285) n/a Total 8,919 (33,792) n/a
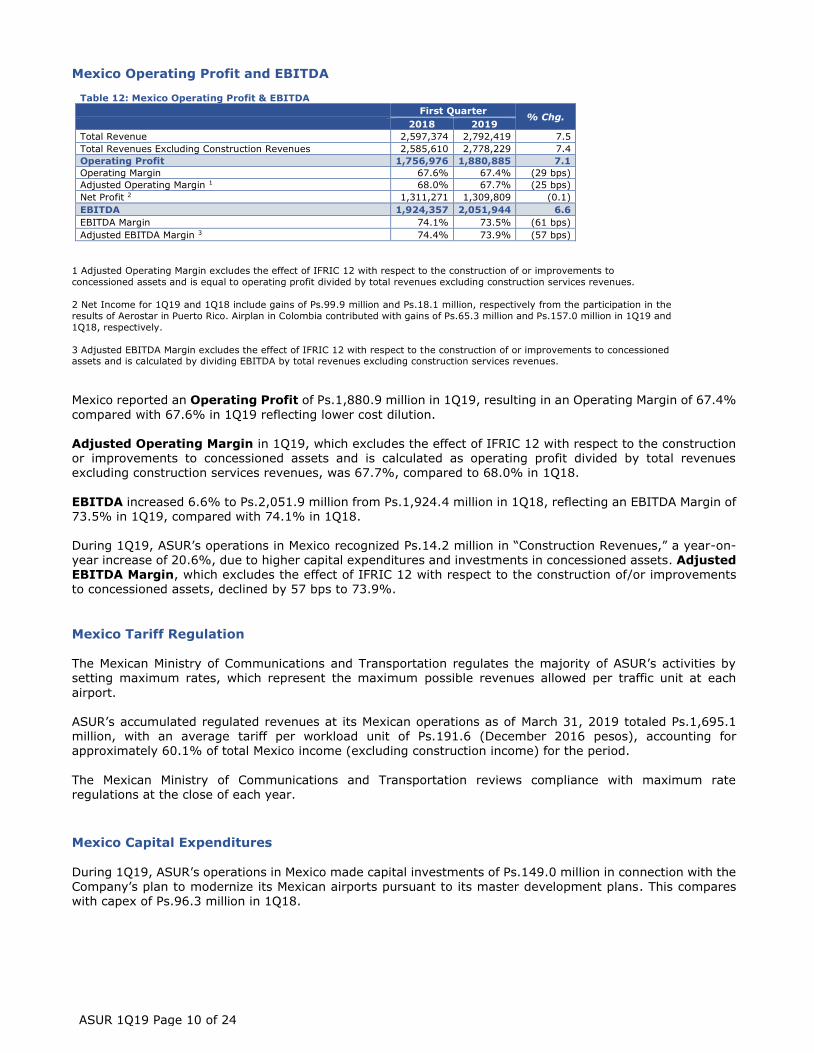
ASUR’s Mexico operations reported a Ps.33.8 million Comprehensive Financing Loss, compared to an Ps.8.9 million gain in 1Q18. Mexican operations reported a foreign exchange loss of Ps.18.3 million in the quarter, resulting from the 2.2% quarterly average Mexican peso depreciation against the U.S. dollar on ASUR’s foreign
currency net asset position, compared with a Ps.44.4 million foreign exchange gain in 1Q18, resulting from the 4.6% quarterly average Mexican peso depreciation during that period. In addition, interest expense declined 11.2% YoY to Ps.105.4 million as the Company paid down debt between June and November 2018. Furthermore, interest income increased 8.1% reflecting a higher cash balance.
ASUR 1Q19 Page 10 of 24
Mexico Operating Profit and EBITDA Table 12: Mexico Operating Profit & EBITDA
First Quarter % Chg.
2018 2019 Total Revenue 2,597,374 2,792,419 7.5 Total Revenues Excluding Construction Revenues 2,585,610 2,778,229 7.4 Operating Profit 1,756,976 1,880,885 7.1 Operating Margin 67.6% 67.4% (29 bps) Adjusted Operating Margin 1 68.0% 67.7% (25 bps) Net Profit 2 1,311,271 1,309,809 (0.1) EBITDA 1,924,357 2,051,944 6.6 EBITDA Margin 74.1% 73.5% (61 bps) Adjusted EBITDA Margin 3 74.4% 73.9% (57 bps)
1 Adjusted Operating Margin excludes the effect of IFRIC 12 with respect to the construction of or improvements to
concessioned assets and is equal to operating profit divided by total revenues excluding construction services revenues.
2 Net Income for 1Q19 and 1Q18 include gains of Ps.99.9 million and Ps.18.1 million, respectively from the participation in the
results of Aerostar in Puerto Rico. Airplan in Colombia contributed with gains of Ps.65.3 million and Ps.157.0 million in 1Q19 and
1Q18, respectively.
3 Adjusted EBITDA Margin excludes the effect of IFRIC 12 with respect to the construction of or improvements to concessioned assets and is calculated by dividing EBITDA by total revenues excluding construction services revenues.
Mexico reported an Operating Profit of Ps.1,880.9 million in 1Q19, resulting in an Operating Margin of 67.4%
compared with 67.6% in 1Q19 reflecting lower cost dilution. Adjusted Operating Margin in 1Q19, which excludes the effect of IFRIC 12 with respect to the construction or improvements to concessioned assets and is calculated as operating profit divided by total revenues excluding construction services revenues, was 67.7%, compared to 68.0% in 1Q18.
EBITDA increased 6.6% to Ps.2,051.9 million from Ps.1,924.4 million in 1Q18, reflecting an EBITDA Margin of 73.5% in 1Q19, compared with 74.1% in 1Q18.
During 1Q19, ASUR’s operations in Mexico recognized Ps.14.2 million in “Construction Revenues,” a year-on-year increase of 20.6%, due to higher capital expenditures and investments in concessioned assets. Adjusted EBITDA Margin, which excludes the effect of IFRIC 12 with respect to the construction of/or improvements to concessioned assets, declined by 57 bps to 73.9%.
Mexico Tariff Regulation The Mexican Ministry of Communications and Transportation regulates the majority of ASUR’s activities by setting maximum rates, which represent the maximum possible revenues allowed per traffic unit at each
airport. ASUR’s accumulated regulated revenues at its Mexican operations as of March 31, 2019 totaled Ps.1,695.1 million, with an average tariff per workload unit of Ps.191.6 (December 2016 pesos), accounting for approximately 60.1% of total Mexico income (excluding construction income) for the period.
The Mexican Ministry of Communications and Transportation reviews compliance with maximum rate regulations at the close of each year.
Mexico Capital Expenditures During 1Q19, ASUR’s operations in Mexico made capital investments of Ps.149.0 million in connection with the Company’s plan to modernize its Mexican airports pursuant to its master development plans. This compares with capex of Ps.96.3 million in 1Q18.

ASUR 1Q19 Page 11 of 24
Review of Puerto Rico Operations
In May 2017, ASUR increased its share ownership in Aerostar to 60% from its prior 50% ownership.
Accordingly, consolidated results as presented in this report reflect line by line consolidation of Aerostar results starting in June 1, 2017, while prior to that, Aerostar’s results were accounted for by the equity method. As of March 31, 2019, the valuation of ASUR’s investment in Aerostar in accordance with IFRS 3 "Business Combinations" resulted in the following effects in the balance sheet: i) the recognition of a net intangible asset of Ps.5,993.2 million, ii) goodwill of Ps.887.2 (net of an impairment of Ps.4,719.1 million), iii) deferred taxes of Ps.599.3 million, and iv) a minority interest of Ps.5,363.7 million within stockholders 'equity.
Table 13: Puerto Rico Revenues & Commercial Revenues Per Passenger
(in thousands of Mexican pesos)
First Quarter
% Chg. 2018 2019
Total Passengers 1,858 2,301 23.8 Total Revenues 642,548 852,259 32.6
Aeronautical Services 412,016 455,516 10.6
Non-Aeronautical Services 220,636 274,360 24.3
Construction Services 9,896 122,383 1,136.7
Total Revenues Excluding Construction Services 632,652 729,876 15.4
Total Commercial Revenues 218,328 271,573 24.4
Commercial Revenues from Direct Operations 1 41,400 58,657 41.7
Commercial Revenues Excluding Direct Operations 176,928 212,916 20.3
Total Commercial Revenues per Passenger 117.5 118.0 0.4
Commercial Revenues from Direct Operations per Passenger 1 22.3 25.5 14.5
Commercial Revenues Excl. Direct Operations per Passenger 95.2 92.6 (2.8)
Note: Figures in pesos at an average exchange rate of Ps.19.2128 1 Represents ASUR’s operation of convenience stores in LMM Airport.
Puerto Rico Revenues Total Puerto Rico Revenues for 1Q19 rose 32.6% YoY to Ps.852.3 million, mainly due to the following increases:
• 10.6% in revenues from aeronautical services; and
• 24.3% in revenues from non-aeronautical services, principally reflecting the 24.4% increase in commercial
revenues. Commercial Revenues per Passenger increased to Ps.118.0 from Ps.117.5 in 1Q18. Nine commercial spaces were opened at LMM Airport over the last 12 months, as shown in Table 15. More details of these openings can be found on page 20 of this report.
ASUR classifies commercial revenues as those derived from the following activities: duty-free stores, car rentals, retail operations, advertising, non-permanent ground transportation, food and beverage operations, and parking lot fees.

ASUR 1Q19 Page 12 of 24
Table 14: San Juan Airport Commercial Revenue
Performance
Table 15: San Juan Airport Summary Retail and Other
Commercial Space Opened since March 31, 2018
Business Line
YoY
Chg Type of Commercial Space 1 # of
Spaces Opened 1Q19
Ground Transportation 360.1% Retail Operations 1
Retail Operations 44.7% Food and Beverage Operations 4
Other Revenue 29.9% Car Rental Revenues 1
Food and Beverage Operations 23.6% Other Revenue 3
Car Rental Revenues 17.8% Total Commercial Spaces 9
Advertising Revenues 14.7% Duty Free 3.9%
Parking Lot Fees 1.9% 1 Only includes new stores opened during the period and
excludes remodelings or contract renewals. Total Commercial Revenues 24.4%
Puerto Rico Operating Costs and Expenses
Table 16: San Juan Airport Operating Costs & Expenses In thousands of Mexican pesos
First Quarter % Chg
2018 2019
Cost of Services 314,075 316,177 0.7
Concession Fees 31,107 35,093 12.8
Depreciation and Amortization 151,319 159,640 5.5
Operating Costs and Expenses Excluding Construction
Costs 496,501 510,910 2.9
Construction Costs 9,896 122,383 1,136.7
Total Operating Costs & Expenses 506,397 633,293 25.1
Note: Figures in pesos at the average exchange rate of Ps.19.2128.
Total Operating Costs and Expenses at LMM Airport in 1Q19, including construction costs, increased 25.1% YoY to Ps.633.3 million. However, excluding construction costs, operating costs and expenses declined
2.9% to Ps.510.9 million. Cost of Services increased marginally 0.7% YoY. Concession Fees paid to the Puerto Rican government increased YoY by Ps.4.0 million, to Ps.35.1 million from Ps.31.1 million in 1Q18. In line with the concession agreement, starting in 2018, the concession fee is 5% based on revenues and impacts results.
Depreciation and Amortization increased by 5.5%, or Ps.8.3 million, mainly reflecting the recognition starting March 2018 of the amortization of the intangible asset resulting from the valuation of the investment in Aerostar under IFRS 3.
During 1Q19, Aerostar reported Construction Costs in Puerto Rico of Ps.122.4 million, reflecting the capital investments in the concessioned assets during the period.
Puerto Rico Comprehensive Financing Gain (Loss)
Table 17: Puerto Rico Comprehensive Financing Gain
(in thousands of Mexican pesos)
First Quarter
% Chg. 2018 2019
Interest Income 9 3,860 42,788.9
Interest Expense (127,800) (128,090) 0.2
Total (127,791) (124,230) (2.8)
Note: Figures in pesos at the average exchange rate of Ps.19.2128.

ASUR 1Q19 Page 13 of 24
During 1Q19, LMM Airport reported a Ps.124.2 million Comprehensive Financing Loss, compared with a
Ps.127.8 million loss in 1Q18, mainly reflecting interest rate movements and the impact from the valuation to present value of future obligations under IFRIC 12 and NIC 37.
On February 22, 2013, and as part of the financing of the concession agreement, Aerostar entered into a subordinated term loan with Cancun Airport in the amount of US$100 million at an annual interest rate of LIBOR plus 2.10%, payable each July 1 and January 1, and with no fixed maturity date. As of March 31, 2019, the remaining balance was US$59.3 million. On March 22, 2013, Aerostar carried out a private bond placement for a total of US$350 million to finance a
portion of the Concession Agreement payment to the Puerto Rican Ports Authority and certain other costs and expenditures associated with it. On June 24, 2015, Aerostar carried out a private bond placement for a total of US$50 million. In December 2015, Aerostar also contracted a line of revolving credit, which, as of March 31, 2019, had not been utilized.
All long-term debt is collateralized by Aerostar’s total assets.
Puerto Rico Operating Profit and EBITDA
Table 18: San Juan Airport Profit & EBITDA In thousands of Mexican pesos
First Quarter % Chg
2018 2019
Total Revenue 642,548 852,259 32.6
Total Revenues Excluding Construction Revenues 632,652 729,876 15.4
Other Revenues - 41,444 n/a
Operating Profit 136,151 260,410 91.3
Operating Margin 21.2% 30.6% 937 bps
Adjusted Operating Margin1 21.5% 35.7% 1416 bps
Net Income 1,994 126,756 6,256.9
EBITDA 311,875 420,050 34.7
EBITDA Margin 48.5% 49.3% 75 bps
Adjusted EBITDA Margin2 49.3% 57.6% 825 bps
Note: Figures in pesos at an average exchange rate of Ps.19.2128.
1 Adjusted Operating Margin excludes the effect of IFRIC 12 with respect to the construction or improvements to
concessioned assets and is equal to operating profit divided by total revenues excluding construction services revenues.
2 Adjusted EBITDA Margin excludes the effect of IFRIC 12 with respect to the construction or improvements to concessioned
assets and is calculated by dividing EBITDA by total revenues excluding construction services revenues.
Operating Profit at Puerto Rico in 1Q19 increased to Ps.260.4 million, with Operating Margin expanding to 30.6% from 21.2% in 1Q18. This was principally due to the 32.6% increase in revenues compared with a 25.1% increase in expenses. Operating profit also benefited from the Ps.41.4 million insurance claim recovery in connection with the loss resulting from Hurricane Maria in 2017.
EBITDA increased 34.7% to Ps.420.0 million from Ps.311.9 million in 1Q18, and EBITDA Margin expanded to
49.3% in 1Q19 from 48.5% in 1Q18. Adjusted EBITDA Margin, excluding IFRIC12, increased to 57.6% in 1Q19 from 49.3% in 1Q18.
Puerto Rico Capital Expenditures During 1Q19, Aerostar invested Ps.121.3 million to modernize LMM Airport, compared with investments of Ps.199.3 million in 1Q18.
Puerto Rico Tariff Regulation The Airport Use Agreement signed by Aerostar, the airlines serving LMM Airport, and the Puerto Rico Ports Authority governs the relationship between Aerostar and the principal airlines serving LMM Airport. The
agreement entitles Aerostar to an annual contribution from the airlines of US$62 million during the first five

ASUR 1Q19 Page 14 of 24
years of the term. From year six onwards, the total annual contribution for the prior year increases in accordance with an adjusted consumer price index factor based on the U.S. non-core consumer price index. The annual fee is divided between the airlines that operate at LMM Airport in accordance with the regulations
and structure defined under the Airport Use Agreement to establish the contribution of each airline for each particular year.
Review of Colombia Operations
On October 19, 2017, ASUR acquired a 92.42% ownership stake in Airplan, which operates six airports in
Colombia. Therefore, ASUR began to consolidate Airplan’s results on a line by line basis as of that date. On May 25, 2018, ASUR acquired an additional 7.58% of the share ownership of Airplan, bringing its ownership stake in the company to 100%. This transaction resulted in the recognition of shareholders’ equity of Ps.213.5 million (Ps.37.7 million at the controlling entity and Ps.175.8 million minority interest).
The following discussion compares Airplan's independent results for the three-month periods ended March 31,
2019 and 2018.
The valuation of ASUR’s investment in Airplan in accordance with IFRS 3 "Business Combinations" resulted in
the following effects on the balance sheet as of March 31, 2019: i) the recognition of a net intangible asset of Ps.1,362.4 million, ii) goodwill of Ps.1,504.9, iii) deferred taxes of Ps.223.1 million, and iv) Ps.619.4 million from the recognition of bank loans at fair value.
Table 19: Airplan, Colombia Revenues & Commercial Revenues Per Passenger
In thousands of Mexican pesos
First Quarter % Chg
2018 2019
Total Passenger 2,433 2,811 15.6
Total Revenues 676,651 456,672 (32.5)
Aeronautical Services 294,833 323,074 9.6
Non-Aeronautical Services 91,079 111,470 22.4
Construction Revenues 1 290,739 22,128 (92.4)
Total Revenues Excluding Construction Revenues 385,912 434,544 12.6
Total Commercial Revenues 89,693 109,956 22.6
Total Commercial Revenues per Passenger 36.9 39.1 6.0
Note: Figures in pesos at an average exchange rate of Ps.163.2943. Note: For purpose of this table, approximately 42.1 and 64.9 thousand transit and general aviation passengers are included in 1Q18
and 1Q19. 1 Construction revenues for Airplan 1Q18 include the actual construction revenues which is equal to the construction cost of Ps.75.9
million and an estimate to the downside of income derived from the valuation of the intangible to present value (construction income)
of Ps.214.8 million, according to IFRIC 12. Construction revenues for Airplan 1Q19 are equal to the construction cost of Ps.22.1
million.
Colombia Revenues
Total Colombia Revenues for 1Q19 declined 32.5% YoY to Ps.456.7 million. Excluding construction services
revenues, revenues rose 12.6% mainly reflecting the following increases:
• 9.6% in revenues from aeronautical services; and
• 22.4% in revenues from non-aeronautical services, mainly due to the 22.6% increase in commercial revenues.
Commercial Revenues per Passenger increased 6.0% year-on-year to Ps.39.1 from 36.9 in 1Q18. As shown in Table 21, during the last twelve months, 39 new commercial spaces were opened in Colombia. More details of these openings can be found on page 20 of this report. ASUR classifies commercial revenues as those derived from the following activities: duty-free stores, car
rentals, retail operations, advertising, non-permanent ground transportation, food and beverage operations, and parking lot fees.

ASUR 1Q19 Page 15 of 24
Table 20: Airplan, Colombia Commercial
Revenue Performance
Table 21: Colombia Summary Retail and Other
Commercial Space Opened since March 31, 2018
Business Line
YoY Chg Type of Commercial Space 1
# of
Spaces
Opened 1Q19
Car Rental Revenues 121.4% Retail Operations 12
Food and Beverage Operations 54.4% Car Rental Revenues 2
Retail Operations 36.6% Banking and Currency Exchange Services 5
Parking Lot Fees 33.9% Other Revenue 19
Banking and Currency Exchange Services 18.9% Food and Beverage Operations 1
Other Revenue 18.7% Total Commercial Spaces 39
Ground Transportation 10.0% Teleservices 7.8%
Duty Free 0.0% 1 Only includes new stores opened during the period and excludes remodelings or contract renewals. Advertising Revenues (4.5%)
Total Commercial Revenues 22.6%
Table 22: Airplan, Colombia Costs & Expenses
In thousands of Mexican pesos
First Quarter
% Chg 2018 2019
Cost of Services 90,763 159,949 76.2
Technical Assistance 2,385 1,354 (43.2)
Concession Fees 73,323 82,325 12.3
Depreciation and Amortization 129,991 115,394 (11.2)
Operating Costs and Expenses Excluding Construction Costs 296,462 359,022 21.1
Construction Costs 75,914 22,128 (70.9)
Total Operating Costs & Expenses 372,376 381,150 2.4
Note: Figures in pesos at an average exchange rate of COL.163.2943 = Ps.1.00 Mexican pesos.
Total Operating Costs and Expenses in Colombia increased 2.4% YoY in 1Q19 to Ps.381.1 million. Excluding
construction costs, operating costs and expenses rose 21.1% to Ps.359.0 million. Cost of Services rose 76.2% YoY, or Ps.69.2 million, mainly reflecting a Ps.37.1 million expense in connection
with the early termination of the agreement with the parking lot concessionaire in Rionegro Airport, a Ps.8.6 million provision for doubtful collectible accounts and a Ps.6.5 million increase in the maintenance provision for future replacement of assets in line with IFRIC 12.
Construction Costs declined 70.9% YoY to Ps.22.1 million, reflecting lower investments in complementary
works to concessioned assets during the period.
Concession Fees, which include fees paid to the Colombian government, increased 12.3% YoY, mainly reflecting higher regulated and non-regulated revenues during the period.
Depreciation and Amortization declined by 11.2%, or Ps.14.6 million, principally reflecting a change in amortization methodology, which starting January 2019 is on a straight-line basis instead of the percentage of
completion method which implied variations in the accumulated amortization rate of the concession. This was partially offset by the recognition in March 2018 of the amortization of the concession resulting from the valuation of ASUR’s investment in Airplan.
Colombia Comprehensive Financing Gain (Loss)
Table 23: Airplan, Colombia, Comprehensive Financing Gain (Loss) In thousands of Mexican pesos
First Quarter % Chg
2018 2019
Interest Income 1,501 34,546 2,201.5
Interest Expense (79,481) (68,054) (14.4)
Foreign Exchange Gain (Loss), Net 507 186 (63.3)
Total (77,473) (33,322) (57.0)
Note: Figures in pesos at an average exchange rate of COL.163.2943 = Ps.1.00 Mexican pesos.

ASUR 1Q19 Page 16 of 24
During 1Q19, Airplan reported a Ps.33.3 million Comprehensive Financing Loss, compared with a Ps.77.5 million loss in 1Q18. This mainly reflects the recognition of interest income for Ps.33.0 million resulting from a
favorable resolution of a legal claim against a contractor. In addition, interest expenses declined reflecting the debt payments in 3Q18 and 4Q18. On June 1, 2015, Airplan entered into a Ps.3,468.7 million, 12-Year Syndicated Loan Facility with eight banks
with a 3-year grace period. Colombia Operating Profit and EBITDA
Tabla 24: Airplan, Colombia Profit & EBITDA In thousands of Mexican pesos
First Quarter % Chg
2018 2019
Total Revenue 676,651 456,672 (32.5)
Total Revenues Excluding Construction Revenues 385,912 434,544 12.6
Operating Profit 304,275 75,522 (75.2)
Operating Margin 45.0% 16.5% (2843 bps)
Adjusted Operating Margin1 78.8% 17.4% (6147 bps)
Net Profit 153,819 82,586 (46.3)
EBITDA 219,441 190,915 (13.0)
EBITDA Margin 32.4% 41.8% 938 bps
Adjusted EBITDA Margin2 56.9% 43.9% (1293 bps)
Note: Figures in pesos at an average exchange rate of COL.163.2943 = Ps.1.00 Mexican pesos.
1 Adjusted Operating Margin excludes the effect of IFRIC12 with respect to the construction or improvements to
concessioned assets, and is equal to operating profit divided by total revenues less construction services revenues.
2 Adjusted EBITDA Margin excludes the effect of IFRIC12 with respect to the construction or improvements to concessioned
assets, and is calculated by dividing EBITDA by total revenues less construction services revenues.
During 1Q19, Airplan reported an Operating Gain of Ps.75.5 million compared with Ps.304.3 million in 1Q19.
Operating Margin expanded to 16.5% in 1Q19 from 45.0% in 1Q18. Adjusted Operating Margin, which excludes
the impact of IFRIC 12 with respect to construction or improvements to concessioned assets, was 17.4% in 1Q19 compared with 78.8% in the same quarter of 2018, reflecting the 32.5% decline in revenues along with higher costs. EBITDA declined 13.0% to Ps.190.9 million from Ps.219.4 million in 1Q18. EBITDA Margin increased to 41.8%
in 1Q19, from 32.4% in 1Q18. Adjusted EBITDA Margin, which excludes the impact of IFRIC 12 with respect to construction or improvements to concessioned assets, declined to 43.9% in 1Q19, from 56.9% in the prior-year quarter. Colombia Capital Expenditures
Airplan did not make any capital expenditures during 1Q19, while in 1Q18 a total of Ps.303.6 million were invested.
Colombia Tariff Regulation Functions of the Special Administrative Unit of Civil Aeronautics include establishing and collecting fees, tariffs,
and rights for the provision of aeronautical and airport services or those that are generated by the concessions, authorizations, licenses, or any other type of income or property. As a result, Resolution 04530, issued on September 21, 2007, establishes the tariffs for the rights and the rates conceded to the concessionaire of the following airports: José María Córdova of Rionegro, Enrique Olaya Herrera of Medellín, Los Garzones of Montería, El Caraño of Quibdó, Antonio Roldán Betancourt of Carepa, and Las Brujas of Corozal. This resolution also established the methodology to update and the mechanisms to collect such fees, tariffs, and rights.
Airplan's regulated revenues for 1Q19 amounted to Ps.323.1 million.
ASUR 1Q19 Page 17 of 24
Definitions
Concession Services Agreements (IFRIC 12 interpretation). In Mexico and Puerto Rico, ASUR is required
by IFRIC 12 to include in its income statement an income line, “Construction Revenues,” reflecting the revenue from construction or improvements to concessioned assets made during the relevant period. The same amount is recognized under the expense line “Construction Costs” because ASUR hires third parties to provide construction services. Because equal amounts of Construction Revenues and Construction Costs have been included in ASUR's income statement as a result of the application of IFRIC 12, the amount of Construction Revenues does not have an impact on EBITDA, but it does have an impact on EBITDA Margin. In Colombia, “Construction Revenues” include the recognition of the revenue to which the concessionaire is entitled for
carrying out the infrastructure works in the development of the concession, while “Construction Costs” represents the actual costs incurred in the execution of such additions or improvements to the concessioned assets. Majority Net Income reflects ASUR’s equity interests in each of its subsidiaries and therefore excludes the 40% interest in Aerostar that is owned by other shareholders. Other than Aerostar, ASUR owns (directly or indirectly) 100% of its subsidiaries.
EBITDA means net income before provision for taxes, deferred taxes, profit sharing, non-ordinary items, participation in the results of associates, comprehensive financing cost, and depreciation and amortization. EBITDA should not be considered as an alternative to net income, as an indicator of our operating performance or as an alternative to cash flow as an indicator of liquidity. Our management believes that EBITDA provides a useful measure that is widely used by investors and analysts to evaluate our performance and compare it with
other companies. EBITDA is not defined under U.S. GAAP or IFRS and may be calculated differently by different companies.
Adjusted EBITDA Margin is calculated by dividing EBITDA by total revenues excluding construction services revenues for Mexico, Puerto Rico, and Colombia and excludes the effect of IFRIC 12 with respect to the construction or improvements to concessioned assets. ASUR is required by IFRIC 12 to include in its income statement an income line reflecting the revenue from construction or improvements to concessioned assets
made during the relevant period. The same amount is recognized under the expense line “Construction Costs” because ASUR hires third parties to provide construction services. In Mexico and Puerto Rico, because equal
amounts of Construction Revenues and Construction Costs have been included in ASUR's income statement as a result of the application of IFRIC 12, the amount of Construction Revenues does not have an impact on EBITDA, but it does have an impact on EBITDA Margin, as the increase in revenues that relates to Construction Revenues does not result in a corresponding increase in EBITDA. In Colombia, construction revenues do have an impact on EBITDA, as construction revenues include a reasonable margin over the actual cost of
construction. Like EBITDA Margin, Adjusted EBITDA Margin should not be considered as an indicator of our operating performance or as an alternative to cash flow as an indicator of liquidity and is not defined under U.S. GAAP or IFRS and may be calculated differently by different companies.
About ASUR Grupo Aeroportuario del Sureste, S.A.B. de C.V. (ASUR) is a leading international airport operator with a
portfolio of concessions to operate, maintain, and develop 16 airports in the Americas. These comprise nine airports in southeast Mexico, including Cancun Airport, the most important tourist destination in Mexico, the Caribbean, and Latin America, and six airports in northern Colombia, including José María Córdova International
Airport (Rionegro), the second busiest airport in Colombia. ASUR is also a 60% JV partner in Aerostar Airport Holdings, LLC, operator of the Luis Muñoz Marín International Airport serving the capital of Puerto Rico, San Juan. San Juan’s Airport is the island’s primary gateway for international and mainland-US destinations and was the first and currently the only major airport in the US to have successfully completed a public–private
partnership under the FAA Pilot Program. Headquartered in Mexico, ASUR is listed both on the Mexican Bolsa, where it trades under the symbol ASUR, and on the NYSE in the U.S., where it trades under the symbol ASR. One ADS represents ten (10) series B shares. For more information, visit www.asur.com.mx Analyst Coverage In accordance with Mexican Stock Exchange Internal Rules Article 4.033.01, ASUR reports that the stock is
covered by the following broker-dealers: Actinver Casa de Bolsa, Barclays, BBVA Bancomer, BofA Merrill Lynch, BX+, Citi Investment Research, Credit Suisse, Goldman Sachs, Grupo Bursatil Mexicano, Grupo Financiero Interacciones, Grupo Financiero Monex, HSBC, Intercam Casa de Bolsa, Insight Investment Research, Itau BBA

ASUR 1Q19 Page 18 of 24
Securities, INVEX, JP Morgan, Morgan Stanley, Morningstar, Nau Securities, Punto Casa de Bolsa, Santander Investment, Scotia Capital, UBS Casa de Bolsa and Vector.
Please note that any opinions, estimates or forecasts regarding the performance of ASUR issued by these analysts reflect their own views, and therefore do not represent the opinions, estimates or forecasts of ASUR or its management. Although ASUR may refer to or distribute such statements, this does not imply that ASUR agrees with or endorses any information, conclusions or recommendations included therein.
Some of the statements contained in this press release discuss future expectations or state other forward-looking information. Those statements are subject to risks identified in this press release and in ASUR’s filings with the SEC. Actual developments could differ significantly from those contemplated in these forward-looking statements. The forward-looking information is based on various factors and was derived using numerous assumptions. Our forward-looking statements speak only as of the date they are made and, except as may be required by applicable law, we do not have an obligation to update or revise them, whether as a result of new
information, future or otherwise. Contacts:
ASUR Adolfo Castro +1-52-55-5284-0408
InspIR Group Susan Borinelli +1-646-330-5907
- SELECTED OPERATING TABLES & FINANCIAL STATEMENTS FOLLOW –

ASUR 1Q19 Page 19 of 24
Mexico Passenger Traffic 1
2018 2019
3,458,958 3,610,761 4.4
CUN Cancun 1,829,258 1,899,183 3.8
CZM Cozumel 36,255 39,988 10.3
HUX Huatulco 161,633 167,564 3.7
MID Merida 509,061 570,684 12.1
MTT Minatitlan 43,662 33,835 (22.5)
OAX Oaxaca 209,887 219,593 4.6
TAP Tapachula 69,994 85,681 22.4
VER Veracruz 318,956 315,362 (1.1)
VSA Villahermosa 280,252 278,871 (0.5)
5,062,958 5,112,468 1.0
CUN Cancun 4,715,943 4,760,221 0.9
CZM Cozumel 141,459 148,659 5.1
HUX Huatulco 84,314 82,612 (2.0)
MID Mérida 63,334 59,574 (5.9)
MTT Minatitlan 1,571 1,774 12.9
OAX Oaxaca 27,381 35,855 30.9
TAP Tapachula 4,295 3,138 (26.9)
VER Veracruz 15,542 15,965 2.7
VSA Villahermosa 9,119 4,670 (48.8)
8,521,916 8,723,229 2.4
CUN Cancun 6,545,201 6,659,404 1.7
CZM Cozumel 177,714 188,647 6.2
HUX Huatulco 245,947 250,176 1.7
MID Merida 572,395 630,258 10.1
MTT Minatitlan 45,233 35,609 (21.3)
OAX Oaxaca 237,268 255,448 7.7
TAP Tapachula 74,289 88,819 19.6
VER Veracruz 334,498 331,327 (0.9)
VSA Villahermosa 289,371 283,541 (2.0)
US Passenger Traffic, San Juan Airport (LMM)
2018 2019
1,858,298 2,300,508 23.8
Domestic Traffic 1,682,957 2,072,825 23.2
International Traffic 175,341 227,683 29.9
Colombia, Passenger Traffic Airplan
2018 2019
2,012,117 2,344,772 16.5
MDE Medellín (Rio Negro) 1,402,237 1,692,587 20.7
EOH Medellín 249,939 257,559 3.0
MTR Montería 208,764 234,111 12.1
APO Carepa 85,487 87,065 1.8
UIB Quibdó 44,920 49,439 10.1
CZU Corozal 20,770 24,011 15.6
372,709 401,265 7.7
MDE Medellín (Rio Negro) 372,709 401,265 7.7
EOH Medellín - -
MTR Montería - -
APO Carepa - -
UIB Quibdó - -
CZU Corozal - -
2,384,826 2,746,037 15.1
MDE Medellín (Rio Negro) 1,774,946 2,093,852 18.0
EOH Medellín 249,939 257,559 3.0
MTR Montería 208,764 234,111 12.1
APO Carepa 85,487 87,065 1.8
UIB Quibdó 44,920 49,439 10.1
CZU Corozal 20,770 24,011 15.6
Passenger Traffic Breakdown by Airport
First Quarter% Chg
Domestic Traffic
1 Passenger figures for Mexico and Colombia exclude transit and general aviation
SJU Total
First Quarter% Chg
Domestic Traffic
International Traffic
Total Traffic México
First Quarter% Chg
International Traffic
Total Traffic Colombia

ASUR 1Q19 Page 20 of 24
ASUR Retail and Other Commercial Space Opened since March 31, 20181
Business Name Type Opening Date
Tiendas Tropicales Retail April 2018
Welcome Bar Food and Beverage September 2018
MINI MARKET (Tienda ODC) Retail March 2019
Cozumel
Tiendas Tropicales Retail September 2018
Turismo Gargo Car Rental September 2018
Oaxaca
ITZIAR PAOLA ARQUIAGA BOLAÑOS CACHO Retail April 2018
AGPCH, SA DE CV Retail May 2018
Ramiro Ocampo Arellano Retail September 2018
Tapachula
Alquiladora de Vehiculos Automotores Car Rental December 2018
SAN JUAN, PUERTO RICO
Ticket 2 PR Other Revenue May 2018
Gustos Café Food and Beverage May 2018
Casa Avila Food and Beverage July 2018
La Fonda Criolla Food and Beverage August 2018
ATM Santander Other Revenue August 2018
Cabrera Car and Truck Rental Car Rental October 2018
Sunny Planet Retail December 2018
VIP Lounge Other Revenue December 2018
Carl's Jr. Food and Beverage January 2019
COLOMBIA
Rionegro
AEROVIAS DEL CONTINENTE AMERICANO S.A. AVIANCA Other Revenue May 2018
AMERICAN AIRLINES INC SUCURSAL COLOMBIA Other Revenue July 2018
SCOTIABANK COLPATRIA S.A Banking and July 2018
SAPIA CI SAS Retail December 2018
SAPIA CI SAS Retail January 2019
Olaya herrera
RENTING COLOMBIA S.A.S Car Rental April 2018
CARIBBEAN SUPPORT AND FLIGHT SERVICE LTDA Other Revenue April 2018
HJONATAN FIGUEROA HERNANDEZ Other Revenue April 2018
SECURITAS COLOMBIA S.A. Other Revenue June 2018
SECURITAS COLOMBIA S.A. Other Revenue June 2018
CENTRAL CHARTER DE COLOMBIA Other Revenue November 2018
ELKIN LEONCIO CASTAÑO CIRO Retail December 2018
Monteria
GLOBAL LOUNGE COLOMBIA SAS Other Revenue June 2018
SAPIA CI SAS Retail December 2018
SAPIA CI SAS Retail December 2018
DAVIVIENDA S.A
Banking and
Currency Exchange
Services February 2019
Quibdo
MARCAPASOS S.A.S Other Revenue April 2018
MARCAPASOS S.A.S Other Revenue April 2018
RED DE SERVICIOS DE OCCIDENTE S.A Other Revenue June 2018
AEROEJECUTIVOS DE ANTIOQUIA S. A Other Revenue September 2018
SATENA Other Revenue October 2018
Carepa
TRUST RENTAL S.A.S Car Rental April 2018
Corozal
FIGUEROA GOMEZ WISTON Other Revenue September 2018
AEROVIAS DEL CONTINENTE AMERICANO S.A. AVIANCA Other Revenue October 2018
AEROVIAS DEL CONTINENTE AMERICANO S.A. AVIANCA Other Revenue October 2018
SECURITAS COLOMBIA S.A. Other Revenue October 2018
SERVICIOS AEROPORTUARIOS INTEGRADOS - SAI LTDA Other Revenue October 2018
CORRESPONSALES COLOMBIA S.A.S Other Revenue May 2018
INVERSIONES ROFI S.A.S. Other Revenue June 2018
OLIMPICA S.A. Other Revenue June 2018
DISTRIBUIDORA PASTEUR S.A Retail July 2018
COMPAÑIA MANUFACTURERA MANISOL S A Retail July 2018
SAFELA GROUP S.A.S. Retail August 2018
RED DE SERVICIOS DE OCCIDENTE S.A
Banking and
Currency Exchange
Services August 2018
OSORIO CARVAJAL DIANA CAROLINA Retail August 2018
NUBIA CORDOBA DE MORENO Retail September 2018
CUEROS VELEZ S.A.S Retail October 2018
COMPAÑIA MANUFACTURERA MANISOL S A Retail February 2018
Centro de Servicios
Grupo Aeroportuario del Sureste, S.A.B. de C.V.
1 Only includes new stores opened during the period and excludes remodelings or contract renewals.
Comercial Spaces
MEXICO
Cancun

ASUR 1Q19 Page 21 of 24
Item1Q
2018
1Q 2018
Per
Workload
Unit
1Q
2019
1Q 2019
Per
Workload
Unit
YoY %
Chg.
Per
Workload
Unit YoY
% Chg.Mexico
Cancun 1
Aeronautical Revenues 1,125,764 170.4 1,184,023 176.2 5.2 3.4
Non-Aeronautical Revenues 1,005,947 152.3 1,093,670 162.7 8.7 6.8
Construction Services Revenues 9,793 1.5 2,997 0.4 (69.4) (73.3)
Total Revenues 2,141,504 324.2 2,280,690 339.3 6.5 4.7
Operating Profit 1,416,473 214.4 1,548,444 230.4 9.3 7.5
EBITDA 1,529,700 231.6 1,663,660 247.5 8.8 6.9
Merida
Aeronautical Revenues 107,197 176.3 130,550 195.1 21.8 10.7
Non-Aeronautical Revenues 24,863 40.9 29,784 44.5 19.8 8.8
Construction Services Revenues 1,340 2.2 8,398 12.6 526.7 472.7
Other 2 15 - 24 - 60.0 n/a
Total Revenues 133,415 219.4 168,756 252.3 26.5 15.0
Operating Profit 74,023 121.7 89,876 134.3 21.4 10.4
EBITDA 85,754 141.0 101,935 152.4 18.9 8.1
Villahermosa
Aeronautical Revenues 45,976 154.8 50,187 171.3 9.2 10.7
Non-Aeronautical Revenues 14,952 50.3 14,430 49.2 (3.5) (2.2)
Construction Services Revenues 4 - 425 1.5 10,525.0 n/a
Other 2 19 0.1 22 0.1 15.8 -
Total Revenues 60,951 205.2 65,064 222.1 6.7 8.2
Operating Profit 27,710 93.3 28,550 97.4 3.0 4.4
EBITDA 35,218 118.6 36,187 123.5 2.8 4.1
Other Airports 3
Aeronautical Revenues 218,910 193.7 232,792 200.2 6.3 3.4
Non-Aeronautical Revenues 42,001 37.2 42,793 36.8 1.9 (1.1)
Construction Services Revenues 627 0.6 2,370 2.0 278.0 233.3
Other 2 44 - 74 0.1 68.2 n/a
Total Revenues 261,582 231.5 278,029 239.1 6.3 3.3
Operating Profit 123,037 108.9 132,719 114.1 7.9 4.8
EBITDA 158,475 140.2 168,729 145.1 6.5 3.5
Holding & Service Companies 4
Construction Services Revenues - n/a - n/a n/a n/a
Other 2 372,797 n/a 360,284 n/a (3.4) n/a
Total Revenues 372,797 n/a 360,284 n/a (3.4) n/a
Operating Profit 115,732 n/a 81,296 n/a (29.8) n/a
EBITDA 115,210 n/a 81,433 n/a (29.3) n/a
Consolidation Adjustment Mexico
Consolidation Adjustment (372,874) n/a (360,404) n/a (3.3) n/a
Total Mexico
Aeronautical Revenues 1,497,847 173.3 1,597,552 180.6 6.7 4.2
Non-Aeronautical Revenues 1,087,763 125.9 1,180,677 133.5 8.5 6.0
Construction Services Revenues 11,764 1.4 14,190 1.6 20.6 14.3
Total Revenues 2,597,374 300.6 2,792,419 315.7 7.5 5.0
Operating Profit 1,756,975 203.3 1,880,885 212.6 7.1 4.6
EBITDA 1,924,357 222.7 2,051,944 232.0 6.6 4.2
San Juan Puerto Rico, US 5
Aeronautical Revenues 412,016 n/a 455,516 n/a 10.6 n/a
Non-Aeronautical Revenues 220,636 n/a 274,360 n/a 24.3 n/a
Construction Services Revenues 9,896 n/a 122,383 n/a 1,136.7 n/a
Total Revenues 642,548 n/a 852,259 n/a 32.6 n/a
Operating Profit 136,151 n/a 260,410 n/a 91.3 n/a
EBITDA 311,874 n/a 420,050 n/a 34.7 n/a
Consolidation Adjustment San Juan
Consolidation Adjustment - - - - - -
Colombia 6
Aeronautical Revenues 294,833 n/a 323,074 n/a 9.6 n/a
Non-Aeronautical Revenues 91,079 n/a 111,470 n/a 22.4 n/a
Construction Services Revenues 290,739 n/a 22,128 n/a (92.4) n/a
Total Revenues 676,651 n/a 456,672 n/a (32.5) n/a
Operating Profit 304,275 n/a 75,522 n/a (75.2) n/a
EBITDA 434,266 n/a 190,915 n/a (56.0) n/a
Consolidation Adjustment Colombia
Consolidation Adjustment - - - - - -
CONSOLIDATED ASUR
Aeronautical Revenues 2,204,696 n/a 2,376,142 n/a 7.8 n/a
Non-Aeronautical Revenues 1,399,478 n/a 1,566,507 n/a 11.9 n/a
Construction Services Revenues 312,399 n/a 158,701 n/a (49.2) n/a
Total Revenues 3,916,573 n/a 4,101,350 n/a 4.7 n/a
Operating Profit 2,197,401 n/a 2,216,817 n/a 0.9 n/a
EBITDA 2,670,497 n/a 2,662,909 n/a (0.3) n/a1 Reflects the results of operations of Cancun Airport and two Cancun Airport Services subsidiaries on a consolidated basis.
2 Reflects revenues under intercompany agreements which are eliminated in the consolidation adjustment.
3 Reflects the results of operations of our airports located in Cozumel, Huatulco, Minatitlan, Oaxaca, Tapachula and Veracruz.
6 Reflects the results of operation of Airplan, Colombia, for 1Q19.
4 Reflects the results of operations of our parent holding company and our services subsidiaries. Because none of these entities hold
the concessions for our airports, we do not report workload unit data for theses entities.5
Reflects the results of operation of San Juan Airport, Puerto Rico, US for 1Q19.
Grupo Aeroportuario del Sureste, S.A.B. de C.V.Operating Results per Airport
Thousands of mexican pesos

ASUR 1Q19 Page 22 of 24
1Q 1Q %
2018 2019 Chg
Revenues
Aeronautical Services 2,204,696 2,376,142 7.8
Non-Aeronautical Services 1,399,478 1,566,507 11.9
Construction Services 312,399 158,701 (49.2)
Total Revenues 3,916,573 4,101,350 4.7
Operating Expenses
Cost of Services 790,227 910,148 15.2
Cost of Construction 97,575 158,701 62.6
General and Administrative Expenses 58,265 60,323 3.5
Technical Assistance 103,630 109,436 5.6
Concession Fee 220,087 241,277 9.6
Depreciation and Amortization 449,388 446,092 (0.7)
Total Operating Expenses 1,719,172 1,925,977 12.0
Other Revenues - 41,444 -
Operating Income 2,197,401 2,216,817 0.9
Comprehensive Financing Cost (196,345) (191,344) (2.5)
Income Before Income Taxes 2,001,056 2,025,473 1.2
Provision for Income Tax 500,207 547,352 9.4
Provision for Asset Tax 233 n/a
Deferred Income Taxes 33,533 (41,030) n/a
Net Income for the Year 1,467,083 1,519,151 3.5
Majority Net Income 1,454,626 1,468,449 1.0
Non- controlling interests 12,457 50,702 307.0
Earning per Share 4.8488 4.8948 1.0
Earning per American Depositary Share (in U.S. Dollars) 2.5022 2.5260 1.0
Average Exchange Rate per Dollar of Ps.19.2128
Item
Grupo Aeroportuario del Sureste, S.A.B. de C.V.
Consolidated Statement of Income from January 1 to March 31, 2019 and 2018
Thousands of mexican pesos

ASUR 1Q19 Page 23 of 24
ItemMarch
2019
December
2018Variation %
Assets
Current Assets
Cash and Cash Equivalents 5,853,666 4,584,507 1,269,159 27.7
Cash and cash equivalents restricted 38,110 47,332 (9,222) (19.5)
Accounts Receivable, net 965,735 793,110 172,625 21.8
Recoverable Taxes and Other Current Assets 864,163 575,963 288,200 50.0
Total Current Assets 7,721,674 6,000,912 1,720,762 28.7
Non Current Assets
Machinery, Furniture and Equipment, net 501,789 558,480 (56,691) (10.2)
Intangible assets, airport concessions and Goodwill-Net 49,031,510 49,586,322 (554,812) (1.1)
Document Receivable 32,921 36,107 (3,186) (8.8)
Total Assets 57,287,894 56,181,821 1,106,073 2.0
Liabilities and Stockholders' Equity
Current Liabilities
Trade Accounts Payable 360,480 313,576 46,904 15.0
Bank Loans and short term debt 375,609 500,105 (124,496) (24.9)
Accrued Expenses and Others Payables 1,653,108 1,594,541 58,567 3.7
Total Current Liabilities 2,389,197 2,408,222 (19,025) (0.8)
Long Term Liabilities
Bank Loans 7,046,098 7,042,598 3,500 0.0
Long Term Debt 6,766,087 6,957,678 (191,591) (2.8)
Deferred Income Taxes 3,026,895 3,081,667 (54,772) (1.8)
Employee Benefits 10,563 10,267 296 2.9
Total Long Term Liabilities 16,849,643 17,092,210 (242,567) (1.4)
Total Liabilities 19,238,840 19,500,432 (261,592) (1.3)
Stockholders' Equity
Capital Stock 7,767,276 7,767,276 - -
Legal Reserve 1,366,867 1,366,867 - -
Net Income for the Period 1,468,448 4,987,601 (3,519,153) (70.6)
Cumulative Effect of Conversion of Foreign Currency 94,406 189,791 (95,385) (50.3)
Retained Earnings 19,781,616 14,794,650 4,986,966 33.7
Non- Controlling interests 7,570,441 7,575,204 (4,763) (0.1)
Total Stockholders' Equity 38,049,054 36,681,389 1,367,665 3.7
Total Liabilities and Stockholders' Equity 57,287,894 56,181,821 1,106,073 2.0
US dollar exchange rate: Ps.19.3779
Grupo Aeroportuario del Sureste, S.A.B. de C.V.Consolidated Balance Sheet as of March 31, 2019 and December 31, 2018
Thousands of mexican pesos

ASUR 1Q19 Page 24 of 24
1Q 1Q %
2018 2019 Chg
Operating Activities
Income Before Income Taxes 2,001,056 2,025,473 1.2
Items Related with Investing Activities:
Depreciation and Amortization 449,388 446,092 (0.7)
Interest Income (70,246) (111,160) 58.2
Interest payables 311,507 284,404 (8.7)
Foreign Exchange Gain (loss), net unearned (116,777) 15,884 n/a
Sub-Total 2,574,928 2,660,693 3.3
Increase in Trade Receivables (155,899) (91,077) (41.6)
Decrease in Recoverable Taxes and other Current Assets (128,147) (122,578) (4.3)
Income Tax Paid (534,110) (676,657) 26.7
Trade Accounts Payable 223,494 131,361 (41.2)
Net Cash Flow Provided by Operating Activities 1,980,266 1,901,742 (4.0)
Investing Activities
Investments in Associates
Loans granted to Associates
Restricted cash 9,143 n/a
Investments in Machinery, Furniture and Equipment, net (599,245) (270,302) (54.9)
Interest Income 68,736 74,050 7.7
Net Cash Flow used by Investing Activities (530,509) (187,109) (64.7)
Excess Cash to Use in Financing Activities 1,449,758 1,708,572 17.9
Bank Loans paid (33,772) n/a
Long term debt paid (317,203) (311,079) (1.9)
Interest paid (84,662) (100,623) 18.9
Dividends Paid
Net Cash Flow used by Financing Activities (401,865) (445,474) 10.9
Net Increase in Cash and Cash Equivalents 1,047,892 1,269,159 21.1
Cash and Cash Equivalents at Beginning of Period 4,677,454 4,584,507 (2.0)
Cash and Cash Equivalents at the End of Period 5,725,346 5,853,666 2.2
Grupo Aeroportuario del Sureste, S.A.B. de C.V.
Consolidated Statement of Cash flow as of March 31, 2019 and 2018
Thousands of Mexican pesos
Item