assured guaranty ltd
TRANSCRIPT

Assured Guaranty Ltd. Equity Investor Presentation
June 30, 2013
Forward-Looking Statements and
Safe Harbor Disclosure
• This presentation contains information that includes or is based upon forward-looking statements within the meaning of the Private Securities Litigation Reform Act
of 1995. Forward-looking statements give the expectations or forecasts of future events of Assured Guaranty Ltd. (“AGL” and, together with its subsidiaries,
“Assured Guaranty” or the “Company”). These statements can be identified by the fact that they do not relate strictly to historical or current facts and relate to
future operating or financial performance. Any or all of Assured Guaranty’s forward looking statements herein are based on current expectations and the current
economic environment and may turn out to be incorrect. Assured Guaranty’s actual results may vary materially. Among factors that could cause actual results to
differ materially are (1) rating agency action, including a ratings downgrade, a change in outlook, the placement of ratings on watch for downgrade, or a change in
rating criteria, at any time, of Assured Guaranty or any of its subsidiaries and/or of transactions that Assured Guaranty’s subsidiaries have insured; (2)
developments in the world’s financial and capital markets, including changes in interest and foreign exchange rates, that adversely affect the demand for the
Company’s insurance, issuers’ payment rates, Assured Guaranty’s loss experience, its exposure to refinancing risk in transactions (which could result in
substantial liquidity claims on its guaranties), its access to capital, its unrealized (losses) gains on derivative financial instruments or its investment returns; (3)
changes in the world’s credit markets, segments thereof or general economic conditions; (4) the impact of rating agency action with respect to sovereign debt and
the resulting effect on the value of securities in the Company's investment portfolio and collateral posted by and to the Company; (5) more severe or frequent
losses impacting the adequacy of Assured Guaranty’s expected loss estimates; (6) the impact of market volatility on the mark-to-market of Assured Guaranty’s
contracts written in credit default swap form; (7) reduction in the amount of insurance opportunities available to Assured Guaranty; (8) deterioration in the financial
condition of Assured Guaranty's reinsurers, the amount and timing of reinsurance recoverables actually received and the risk that reinsurers may dispute amounts
owed to Assured Guaranty under its reinsurance agreements; (9) failure of Assured Guaranty to realize insurance loss recoveries or damages expected from
originators, sellers, sponsors, underwriters or servicers of residential mortgage-backed securities transactions through loan putbacks, settlement negotiations or
litigation; (10) the possibility that budget shortfalls or other factors will result in credit losses or impairments on obligations of state and local governments that the
Company insures or reinsures; (11) increased competition, including from new entrants into the financial guaranty industry; (12) changes in applicable accounting
policies or practices; (13) changes in applicable laws or regulations, including insurance and tax laws; (14) other governmental actions; (15) difficulties with the
execution of Assured Guaranty’s business strategy; (16) contract cancellations; (17) loss of key personnel; (18) adverse technological developments; (19) the
effects of mergers, acquisitions and divestitures; (20) natural or man-made catastrophes; (21) other risks and uncertainties that have not been identified at this
time; (22) management’s response to these factors; and (23) other risk factors identified in Assured Guaranty’s filings with the U.S. Securities and Exchange
Commission (the “SEC”).
• The foregoing review of important factors should not be construed as exhaustive, and should be read in conjunction with the other cautionary statements that are
included in the Company’s Form 10-K and 10-Q filings. The Company undertakes no obligation to update publicly or review any forward-looking statement,
whether as a result of new information, future developments or otherwise, except as required by law. Investors are advised, however, to consult any further
disclosures the Company makes on related subjects in the Company’s periodic reports filed with the SEC.
• If one or more of these or other risks or uncertainties materialize, or if the Company’s underlying assumptions prove to be incorrect, actual results may vary
materially from what the Company projected. Any forward looking statements in the presentation reflect the Company’s current views with respect to future events
and are subject to these and other risks, uncertainties and assumptions relating to its operations, results of operations, growth strategy and liquidity.
• For these statements, the Company claims the protection of the safe harbor for forward-looking statements contained in Section 27A of the Securities Act of 1933,
as amended (the “Securities Act”), and Section 21E of the Securities Exchange Act of 1934, as amended (the “Exchange Act”).
2
Conventions and Non-GAAP Financial
Measures
3
• Unless otherwise noted, the following conventions are used in this presentation:
– Ratings on our insured portfolio and on bonds purchased pursuant to loss mitigation or risk management strategies are Assured Guaranty’s internal
ratings. Although the Company’s ratings scale is similar to that used by the nationally recognized statistical rating organizations, the ratings may not be
the same as ratings assigned by any such rating agency.
– Beginning in the first quarter 2012, the Company decided to classify those portions of risks benefiting from reimbursement obligations collateralized by
eligible assets held in trust in acceptable reimbursement structures as the higher of 'AA' or their current internal rating. As of fourth quarter 2012, the
Company applied this policy to exposures covered by the Bank of America Agreement and the Deutsche Bank Agreement. The Bank of America
Agreement was entered into in April 2011 and the reclassification in the first quarter 2012 resulted in a decrease in BIG net par outstanding as of
December 31, 2011 of $1,452 million from that previously reported. The Company has also reclassified the three transactions under the UBS
agreement that are subject to a loss sharing reinsurance arrangement expected to be put in place by third quarter 2013. The total impact of the
reclassification was a reduction in below investment grade exposure of $2,019 million. Please see page 45 for details.
– Exposures rated below investment grade are designated “BIG”.
– Ratings on the investment portfolios are the lower of the ratings from Moody’s Investors Service, Inc. (“Moody’s”) or Standard & Poor’s Ratings
Services (“S&P”).
– Percentages and totals in tables or graphs may not add due to rounding.
• This presentation references financial measures that are not in accordance with U.S. generally accepted accounting principles (“GAAP”), which management
uses in order to assist analysts and investors in evaluating Assured Guaranty’s financial results. These financial measures not in accordance with GAAP (“non-
GAAP financial measures”) are defined in the appendix. In each case, the most directly comparable GAAP financial measure, if available, is presented, and a
reconciliation of the non-GAAP financial measure and GAAP financial measure is provided. This presentation is consistent with how Assured Guaranty’s
management, analysts and investors evaluate Assured Guaranty’s financial results and is comparable to estimates published by analysts in their research
reports on Assured Guaranty.
4
• Assured Guaranty overview
• Year-to-date activity
• Creating value
– R&W activity
– R&W litigation update
– Track record of value creation
– Simplified corporate structure & dividend limitations
– Servicer replacements
– Bond purchases
– Agreements to terminate guaranties
– New business production
• Underlying value
– Selected company assets and liabilities
– Deleveraging while maintaining total invested assets
– Investment income generates capital
– Historical growth
• Financial results
• Portfolio overview
Table of Contents
Assured Guaranty Overview
5
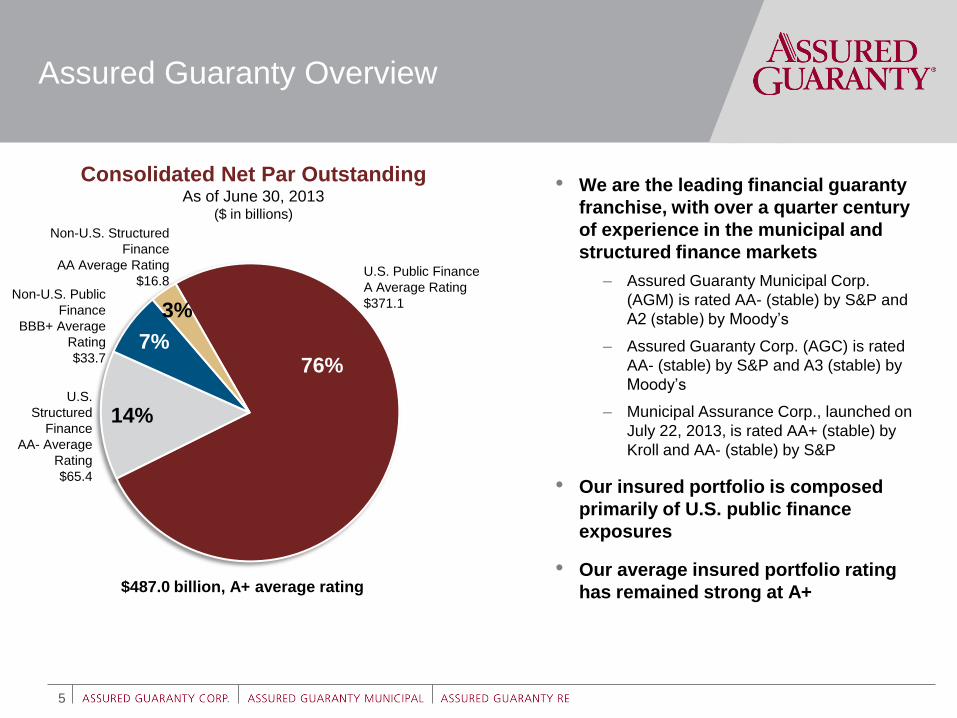
Consolidated Net Par Outstanding
As of June 30, 2013 ($ in billions)
$487.0 billion, A+ average rating
• We are the leading financial guaranty
franchise, with over a quarter century
of experience in the municipal and
structured finance markets
– Assured Guaranty Municipal Corp.
(AGM) is rated AA- (stable) by S&P and
A2 (stable) by Moody’s
– Assured Guaranty Corp. (AGC) is rated
AA- (stable) by S&P and A3 (stable) by
Moody’s
– Municipal Assurance Corp., launched on
July 22, 2013, is rated AA+ (stable) by
Kroll and AA- (stable) by S&P
• Our insured portfolio is composed
primarily of U.S. public finance
exposures
• Our average insured portfolio rating
has remained strong at A+
76%
14%
7%
3%
U.S. Public Finance
A Average Rating
$371.1
U.S.
Structured
Finance
AA- Average
Rating
$65.4
Non-U.S. Public
Finance
BBB+ Average
Rating
$33.7
Non-U.S. Structured
Finance
AA Average Rating
$16.8
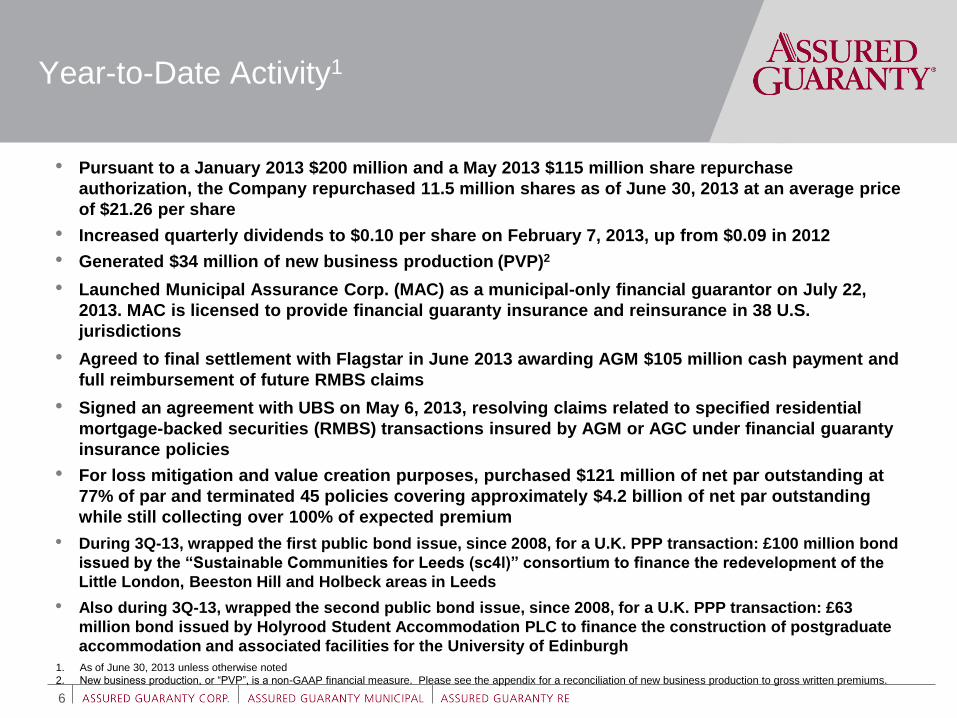
• Pursuant to a January 2013 $200 million and a May 2013 $115 million share repurchase
authorization, the Company repurchased 11.5 million shares as of June 30, 2013 at an average price
of $21.26 per share
• Increased quarterly dividends to $0.10 per share on February 7, 2013, up from $0.09 in 2012
• Generated $34 million of new business production (PVP)2
• Launched Municipal Assurance Corp. (MAC) as a municipal-only financial guarantor on July 22,
2013. MAC is licensed to provide financial guaranty insurance and reinsurance in 38 U.S.
jurisdictions
• Agreed to final settlement with Flagstar in June 2013 awarding AGM $105 million cash payment and
full reimbursement of future RMBS claims
• Signed an agreement with UBS on May 6, 2013, resolving claims related to specified residential
mortgage-backed securities (RMBS) transactions insured by AGM or AGC under financial guaranty
insurance policies
• For loss mitigation and value creation purposes, purchased $121 million of net par outstanding at
77% of par and terminated 45 policies covering approximately $4.2 billion of net par outstanding
while still collecting over 100% of expected premium
• During 3Q-13, wrapped the first public bond issue, since 2008, for a U.K. PPP transaction: £100 million bond
issued by the “Sustainable Communities for Leeds (sc4l)” consortium to finance the redevelopment of the
Little London, Beeston Hill and Holbeck areas in Leeds
• Also during 3Q-13, wrapped the second public bond issue, since 2008, for a U.K. PPP transaction: £63
million bond issued by Holyrood Student Accommodation PLC to finance the construction of postgraduate
accommodation and associated facilities for the University of Edinburgh
1. As of June 30, 2013 unless otherwise noted
2. New business production, or “PVP”, is a non-GAAP financial measure. Please see the appendix for a reconciliation of new business production to gross written premiums.
6
Year-to-Date Activity1
Creating Value R&W Activity
7
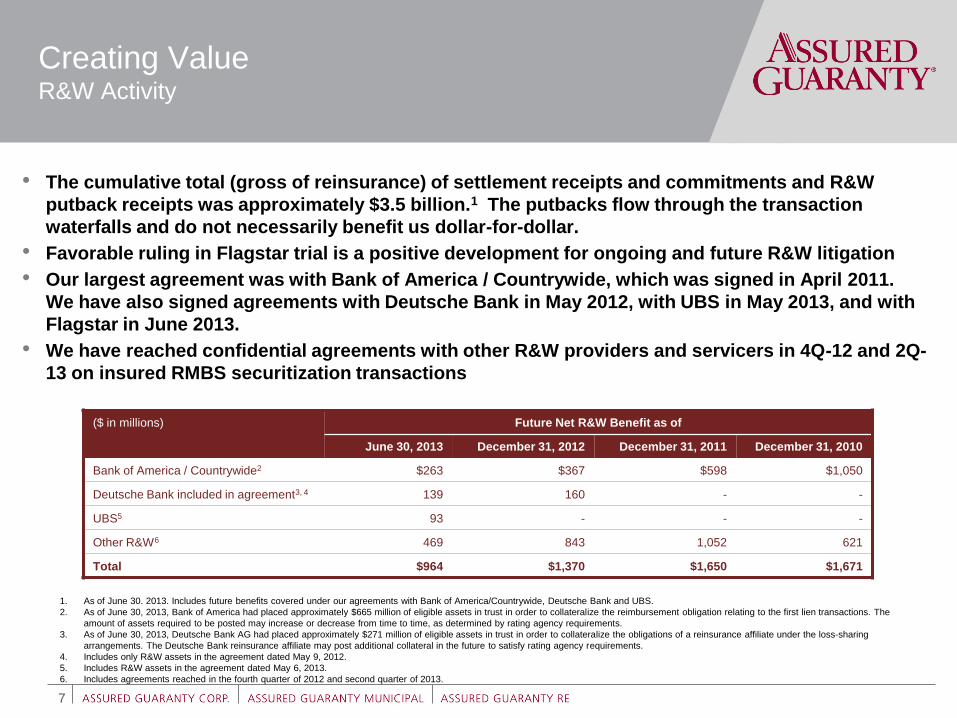
• The cumulative total (gross of reinsurance) of settlement receipts and commitments and R&W
putback receipts was approximately $3.5 billion.1 The putbacks flow through the transaction
waterfalls and do not necessarily benefit us dollar-for-dollar.
• Favorable ruling in Flagstar trial is a positive development for ongoing and future R&W litigation
• Our largest agreement was with Bank of America / Countrywide, which was signed in April 2011.
We have also signed agreements with Deutsche Bank in May 2012, with UBS in May 2013, and with
Flagstar in June 2013.
• We have reached confidential agreements with other R&W providers and servicers in 4Q-12 and 2Q-
13 on insured RMBS securitization transactions
1. As of June 30. 2013. Includes future benefits covered under our agreements with Bank of America/Countrywide, Deutsche Bank and UBS.
2. As of June 30, 2013, Bank of America had placed approximately $665 million of eligible assets in trust in order to collateralize the reimbursement obligation relating to the first lien transactions. The
amount of assets required to be posted may increase or decrease from time to time, as determined by rating agency requirements.
3. As of June 30, 2013, Deutsche Bank AG had placed approximately $271 million of eligible assets in trust in order to collateralize the obligations of a reinsurance affiliate under the loss-sharing
arrangements. The Deutsche Bank reinsurance affiliate may post additional collateral in the future to satisfy rating agency requirements.
4. Includes only R&W assets in the agreement dated May 9, 2012.
5. Includes R&W assets in the agreement dated May 6, 2013.
6. Includes agreements reached in the fourth quarter of 2012 and second quarter of 2013.
($ in millions) Future Net R&W Benefit as of
June 30, 2013 December 31, 2012 December 31, 2011 December 31, 2010
Bank of America / Countrywide2 $263 $367 $598 $1,050
Deutsche Bank included in agreement3, 4 139 160 - -
UBS5 93 - - -
Other R&W6 469 843 1,052 621
Total $964 $1,370 $1,650 $1,671
Creating Value R&W Litigation Update
8
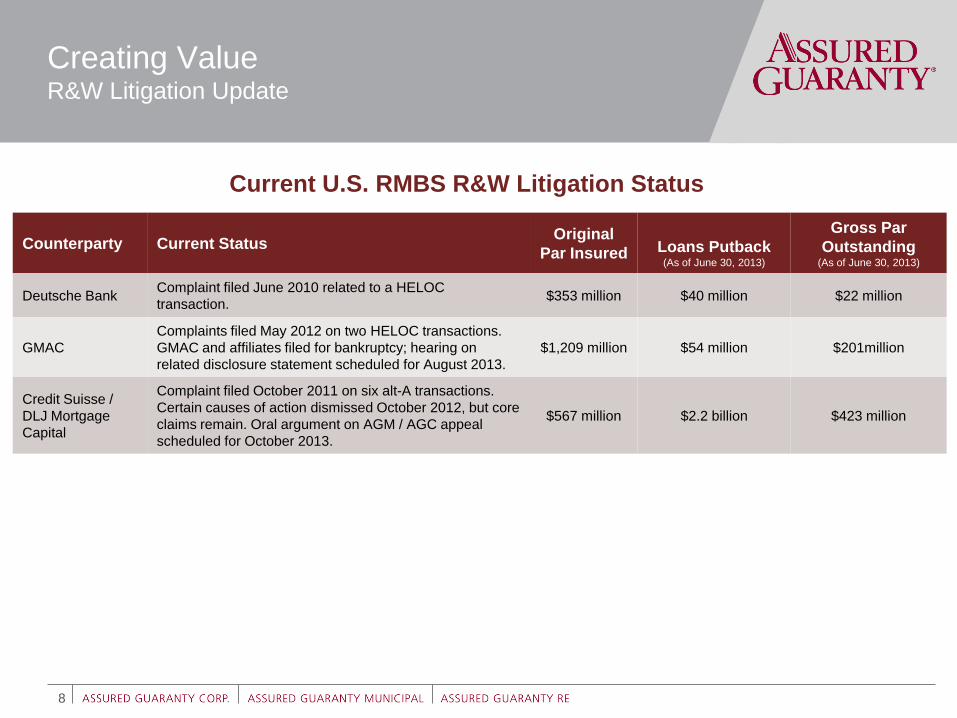
Counterparty Current Status Original
Par Insured Loans Putback (As of June 30, 2013)
Gross Par
Outstanding (As of June 30, 2013)
Deutsche Bank Complaint filed June 2010 related to a HELOC
transaction. $353 million $40 million $22 million
GMAC
Complaints filed May 2012 on two HELOC transactions.
GMAC and affiliates filed for bankruptcy; hearing on
related disclosure statement scheduled for August 2013.
$1,209 million $54 million $201million
Credit Suisse /
DLJ Mortgage
Capital
Complaint filed October 2011 on six alt-A transactions.
Certain causes of action dismissed October 2012, but core
claims remain. Oral argument on AGM / AGC appeal
scheduled for October 2013.
$567 million $2.2 billion $423 million
Current U.S. RMBS R&W Litigation Status
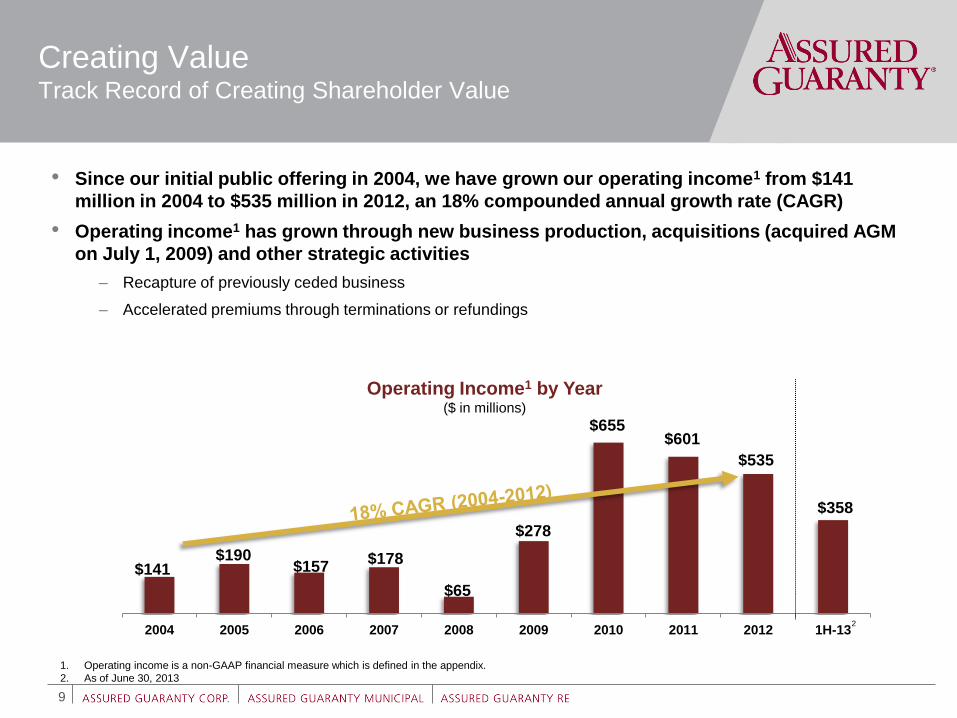
Operating Income1 by Year ($ in millions)
$141 $190
$157 $178
$65
$278
$655 $601
$535
$358
2004 2005 2006 2007 2008 2009 2010 2011 2012 1H-13
Creating Value Track Record of Creating Shareholder Value
9
1. Operating income is a non-GAAP financial measure which is defined in the appendix.
2. As of June 30, 2013
• Since our initial public offering in 2004, we have grown our operating income1 from $141
million in 2004 to $535 million in 2012, an 18% compounded annual growth rate (CAGR)
• Operating income1 has grown through new business production, acquisitions (acquired AGM
on July 1, 2009) and other strategic activities
– Recapture of previously ceded business
– Accelerated premiums through terminations or refundings
2
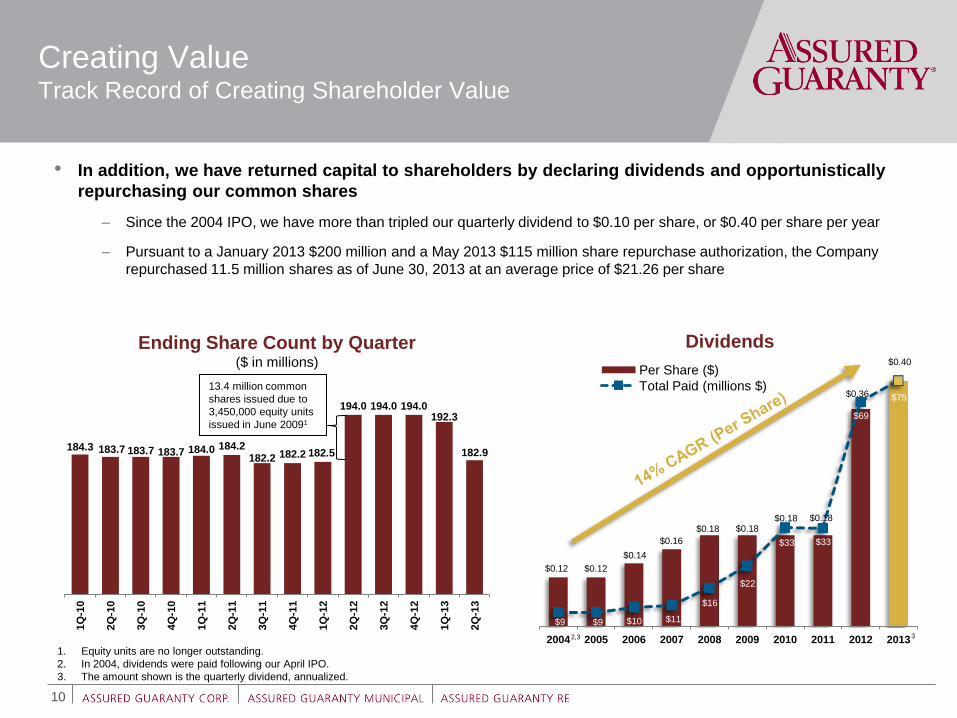
• In addition, we have returned capital to shareholders by declaring dividends and opportunistically
repurchasing our common shares
– Since the 2004 IPO, we have more than tripled our quarterly dividend to $0.10 per share, or $0.40 per share per year
– Pursuant to a January 2013 $200 million and a May 2013 $115 million share repurchase authorization, the Company
repurchased 11.5 million shares as of June 30, 2013 at an average price of $21.26 per share
184.3 183.7 183.7 183.7 184.0 184.2 182.2 182.2 182.5
194.0 194.0 194.0 192.3
182.9
1Q
-10
2Q
-10
3Q
-10
4Q
-10
1Q
-11
2Q
-11
3Q
-11
4Q
-11
1Q
-12
2Q
-12
3Q
-12
4Q
-12
1Q
-13
2Q
-13
Ending Share Count by Quarter ($ in millions)
$0.12 $0.12
$0.14
$0.16
$0.18 $0.18 $0.18 $0.18
$0.36
$0.40
$9 $9 $10 $11
$16
$22
$33 $33
$69
$75
2004 2005 2006 2007 2008 2009 2010 2011 2012 2013
Per Share ($)
Total Paid (millions $)
Creating Value Track Record of Creating Shareholder Value
10
Dividends
1. Equity units are no longer outstanding.
2. In 2004, dividends were paid following our April IPO.
3. The amount shown is the quarterly dividend, annualized.
2,3 3
13.4 million common
shares issued due to
3,450,000 equity units
issued in June 20091
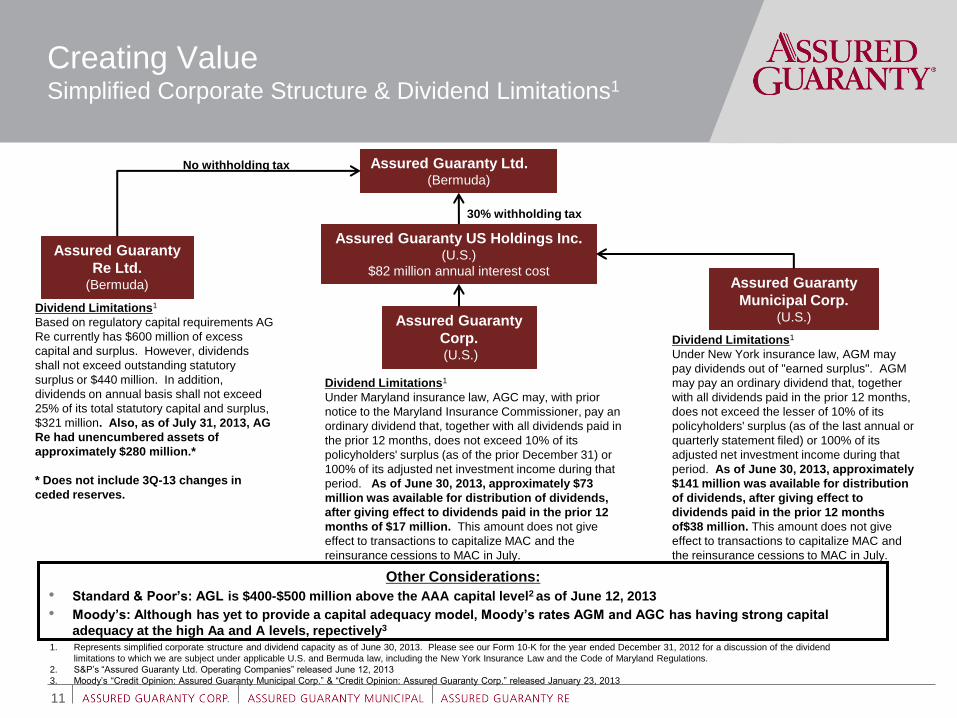
Assured Guaranty US Holdings Inc. (U.S.)
$82 million annual interest cost
Creating Value Simplified Corporate Structure & Dividend Limitations1
11
Assured Guaranty Ltd. (Bermuda)
Assured Guaranty
Re Ltd. (Bermuda)
Assured Guaranty
Corp. (U.S.)
Assured Guaranty
Municipal Corp. (U.S.)
Dividend Limitations1
Based on regulatory capital requirements AG
Re currently has $600 million of excess
capital and surplus. However, dividends
shall not exceed outstanding statutory
surplus or $440 million. In addition,
dividends on annual basis shall not exceed
25% of its total statutory capital and surplus,
$321 million. Also, as of July 31, 2013, AG
Re had unencumbered assets of
approximately $280 million.*
* Does not include 3Q-13 changes in
ceded reserves.
Dividend Limitations1
Under Maryland insurance law, AGC may, with prior
notice to the Maryland Insurance Commissioner, pay an
ordinary dividend that, together with all dividends paid in
the prior 12 months, does not exceed 10% of its
policyholders' surplus (as of the prior December 31) or
100% of its adjusted net investment income during that
period. As of June 30, 2013, approximately $73
million was available for distribution of dividends,
after giving effect to dividends paid in the prior 12
months of $17 million. This amount does not give
effect to transactions to capitalize MAC and the
reinsurance cessions to MAC in July.
Dividend Limitations1
Under New York insurance law, AGM may
pay dividends out of "earned surplus". AGM
may pay an ordinary dividend that, together
with all dividends paid in the prior 12 months,
does not exceed the lesser of 10% of its
policyholders' surplus (as of the last annual or
quarterly statement filed) or 100% of its
adjusted net investment income during that
period. As of June 30, 2013, approximately
$141 million was available for distribution
of dividends, after giving effect to
dividends paid in the prior 12 months
of$38 million. This amount does not give
effect to transactions to capitalize MAC and
the reinsurance cessions to MAC in July.
30% withholding tax
No withholding tax
1. Represents simplified corporate structure and dividend capacity as of June 30, 2013. Please see our Form 10-K for the year ended December 31, 2012 for a discussion of the dividend
limitations to which we are subject under applicable U.S. and Bermuda law, including the New York Insurance Law and the Code of Maryland Regulations.
2. S&P’s “Assured Guaranty Ltd. Operating Companies” released June 12, 2013
3. Moody’s “Credit Opinion: Assured Guaranty Municipal Corp.” & “Credit Opinion: Assured Guaranty Corp.” released January 23, 2013
Other Considerations:
• Standard & Poor’s: AGL is $400-$500 million above the AAA capital level2 as of June 12, 2013
• Moody’s: Although has yet to provide a capital adequacy model, Moody’s rates AGM and AGC has having strong capital
adequacy at the high Aa and A levels, repectively3
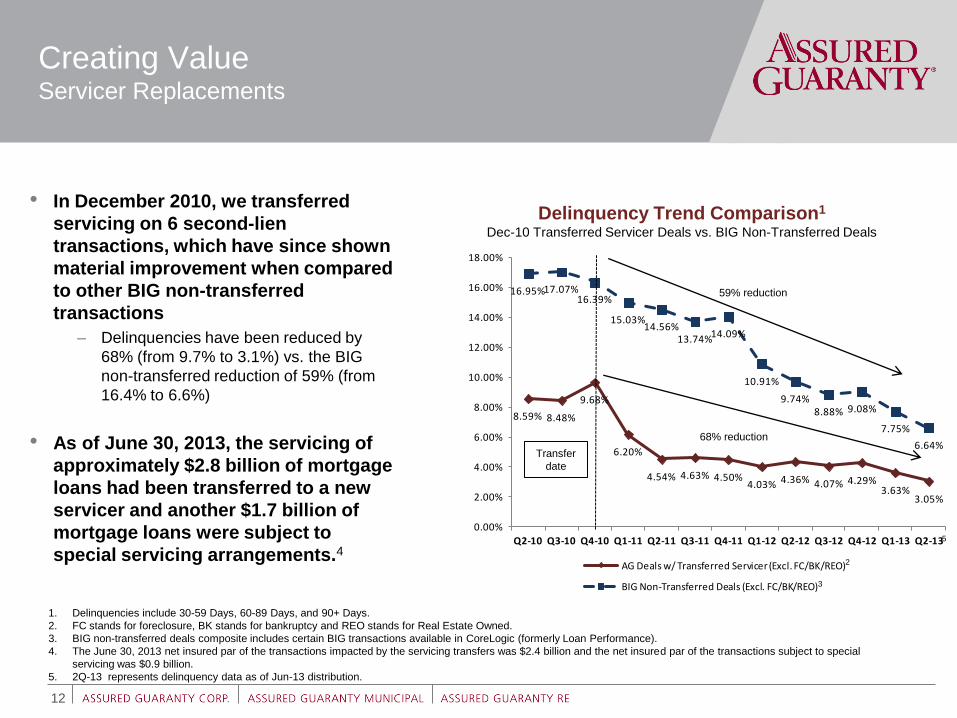
8.59% 8.48%
9.68%
6.20%
4.54% 4.63% 4.50%4.03% 4.36% 4.07% 4.29%
3.63%3.05%
16.95%17.07%16.39%
15.03%14.56%
13.74%14.09%
10.91%
9.74%8.88% 9.08%
7.75%
6.64%
0.00%
2.00%
4.00%
6.00%
8.00%
10.00%
12.00%
14.00%
16.00%
18.00%
Q2-10 Q3-10 Q4-10 Q1-11 Q2-11 Q3-11 Q4-11 Q1-12 Q2-12 Q3-12 Q4-12 Q1-13 Q2-13
AG Deals w/ Transferred Servicer (Excl. FC/BK/REO)
BIG Non-Transferred Deals (Excl. FC/BK/REO)
Creating Value Servicer Replacements
12
Delinquency Trend Comparison1 Dec-10 Transferred Servicer Deals vs. BIG Non-Transferred Deals
1. Delinquencies include 30-59 Days, 60-89 Days, and 90+ Days.
2. FC stands for foreclosure, BK stands for bankruptcy and REO stands for Real Estate Owned.
3. BIG non-transferred deals composite includes certain BIG transactions available in CoreLogic (formerly Loan Performance).
4. The June 30, 2013 net insured par of the transactions impacted by the servicing transfers was $2.4 billion and the net insured par of the transactions subject to special
servicing was $0.9 billion.
5. 2Q-13 represents delinquency data as of Jun-13 distribution.
3
• In December 2010, we transferred
servicing on 6 second-lien
transactions, which have since shown
material improvement when compared
to other BIG non-transferred
transactions
– Delinquencies have been reduced by
68% (from 9.7% to 3.1%) vs. the BIG
non-transferred reduction of 59% (from
16.4% to 6.6%)
• As of June 30, 2013, the servicing of
approximately $2.8 billion of mortgage
loans had been transferred to a new
servicer and another $1.7 billion of
mortgage loans were subject to
special servicing arrangements.4
2
Transfer
date
68% reduction
59% reduction
5
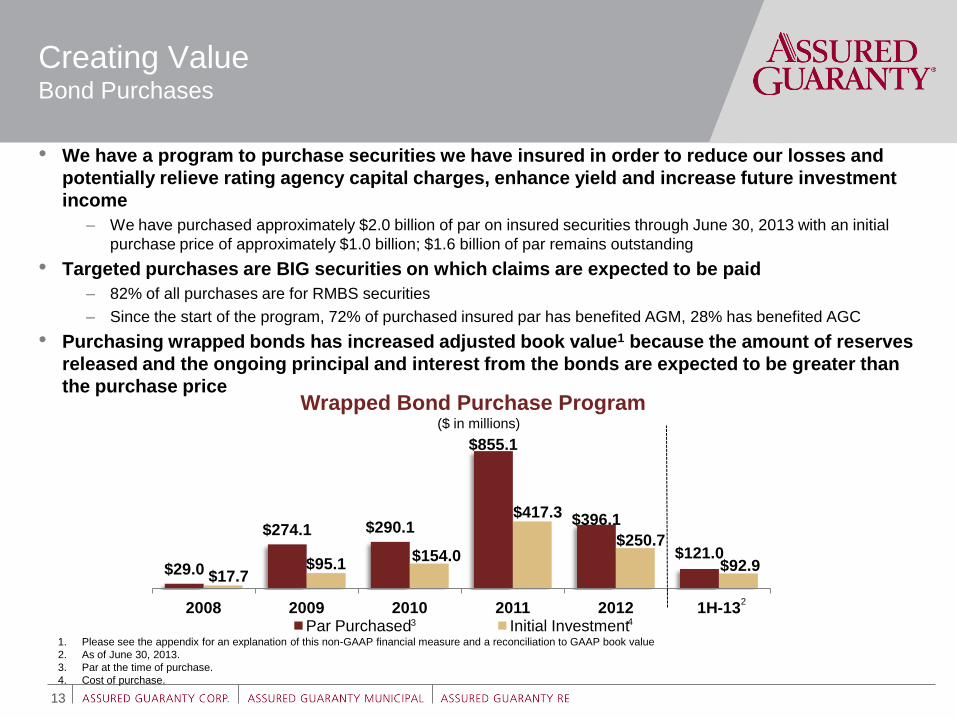
Creating Value Bond Purchases
13
• We have a program to purchase securities we have insured in order to reduce our losses and
potentially relieve rating agency capital charges, enhance yield and increase future investment
income
– We have purchased approximately $2.0 billion of par on insured securities through June 30, 2013 with an initial
purchase price of approximately $1.0 billion; $1.6 billion of par remains outstanding
• Targeted purchases are BIG securities on which claims are expected to be paid
– 82% of all purchases are for RMBS securities
– Since the start of the program, 72% of purchased insured par has benefited AGM, 28% has benefited AGC
• Purchasing wrapped bonds has increased adjusted book value1 because the amount of reserves
released and the ongoing principal and interest from the bonds are expected to be greater than
the purchase price
$29.0
$274.1 $290.1
$855.1
$396.1
$121.0
$17.7 $95.1
$154.0
$417.3
$250.7
$92.9
2008 2009 2010 2011 2012 1H-13 Par Purchased Initial Investment
Wrapped Bond Purchase Program ($ in millions)
1. Please see the appendix for an explanation of this non-GAAP financial measure and a reconciliation to GAAP book value
2. As of June 30, 2013.
3. Par at the time of purchase.
4. Cost of purchase.
3 4
2
Creating Value Agreements to Terminate Guaranties
14
# of Policies Net Par
Estimated Rating
Agencies Model Benefit
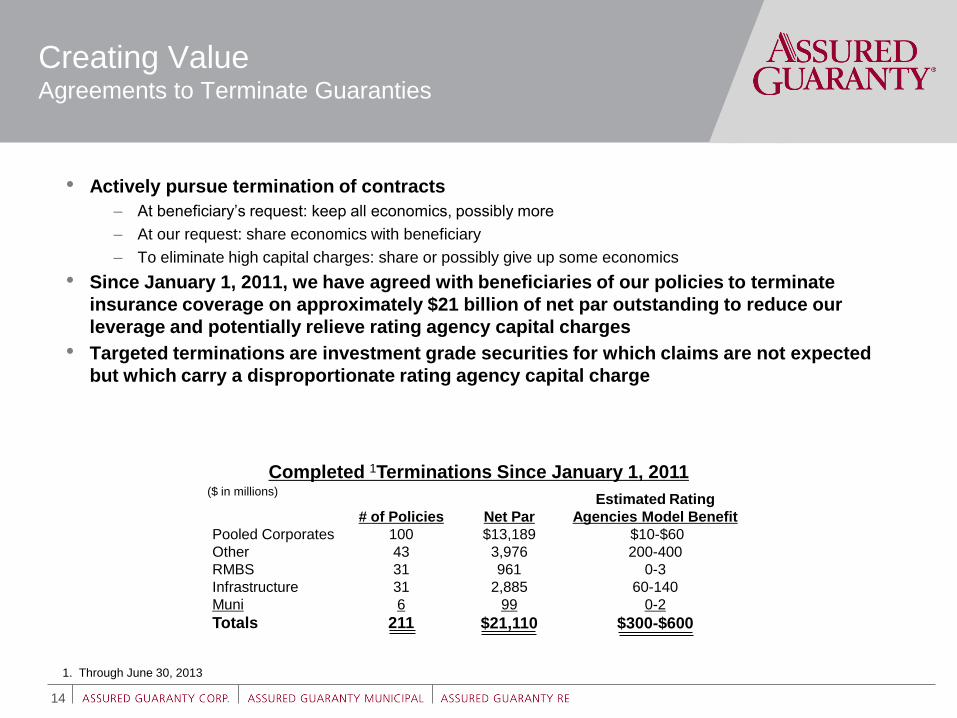
Pooled Corporates 100 $13,189 $10-$60
Other 43 3,976 200-400
RMBS 31 961 0-3
Infrastructure 31 2,885 60-140
Muni 6 99 0-2
Totals 211 $21,110 $300-$600
Completed 1Terminations Since January 1, 2011
• Actively pursue termination of contracts
– At beneficiary’s request: keep all economics, possibly more
– At our request: share economics with beneficiary
– To eliminate high capital charges: share or possibly give up some economics
• Since January 1, 2011, we have agreed with beneficiaries of our policies to terminate
insurance coverage on approximately $21 billion of net par outstanding to reduce our
leverage and potentially relieve rating agency capital charges
• Targeted terminations are investment grade securities for which claims are not expected
but which carry a disproportionate rating agency capital charge
($ in millions)
1. Through June 30, 2013
Creating Value New Business Production
15
• Penetration in the U.S. public finance market
– Municipal Assurance Corp. (“MAC”)
• U.S. structured finance business activity
• International business activity
• Underwriting and pricing discipline
• Reinsurance platform
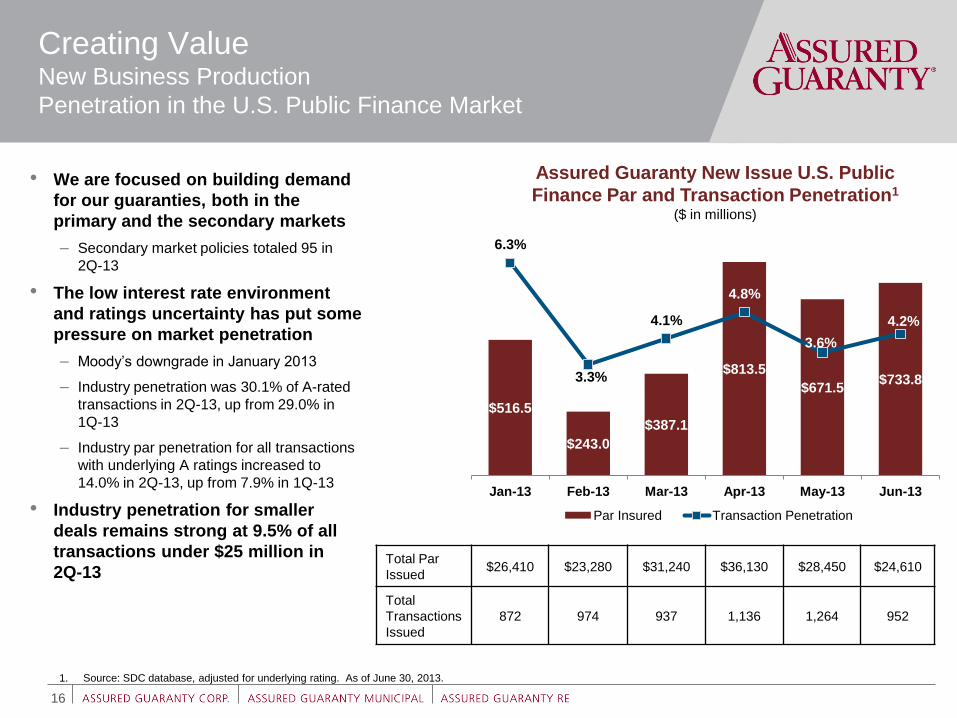
Total Par
Issued $26,410 $23,280 $31,240 $36,130 $28,450 $24,610
Total
Transactions
Issued
872 974 937 1,136 1,264 952
• We are focused on building demand
for our guaranties, both in the
primary and the secondary markets
– Secondary market policies totaled 95 in
2Q-13
• The low interest rate environment
and ratings uncertainty has put some
pressure on market penetration
– Moody’s downgrade in January 2013
– Industry penetration was 30.1% of A-rated
transactions in 2Q-13, up from 29.0% in
1Q-13
– Industry par penetration for all transactions
with underlying A ratings increased to
14.0% in 2Q-13, up from 7.9% in 1Q-13
• Industry penetration for smaller
deals remains strong at 9.5% of all
transactions under $25 million in
2Q-13
Creating Value New Business Production
Penetration in the U.S. Public Finance Market
16
Assured Guaranty New Issue U.S. Public
Finance Par and Transaction Penetration1 ($ in millions)
1. Source: SDC database, adjusted for underlying rating. As of June 30, 2013.
$516.5
$243.0
$387.1
$813.5
$671.5 $733.8
6.3%
3.3%
4.1%
4.8%
3.6%
4.2%
Jan-13 Feb-13 Mar-13 Apr-13 May-13 Jun-13
Par Insured Transaction Penetration
Creating Value New Business Production
Municipal Assurance Corp.
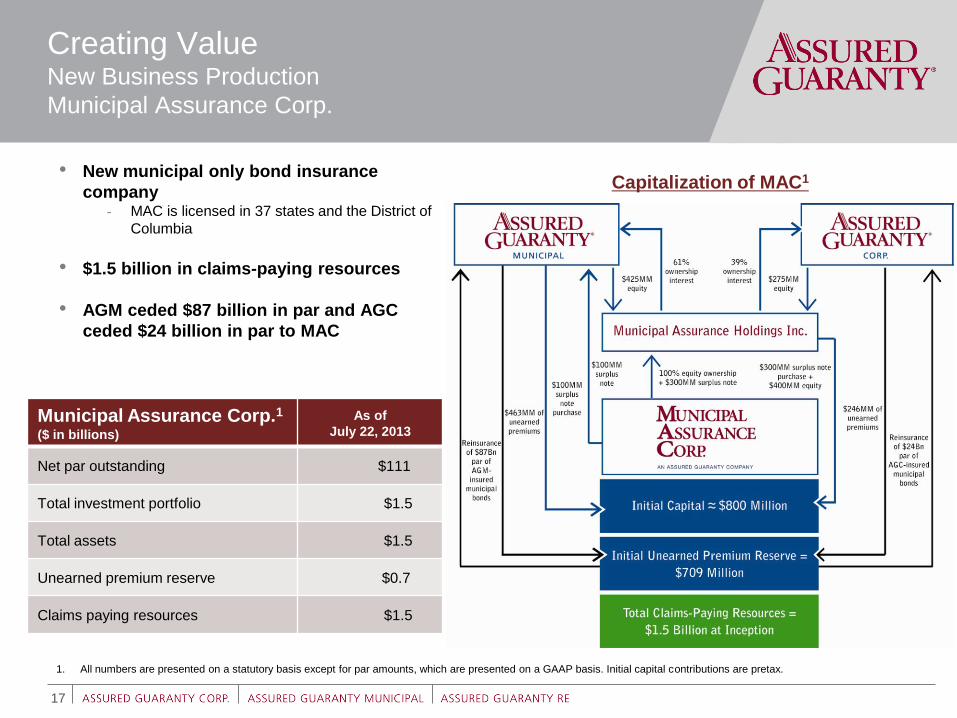
• New municipal only bond insurance
company - MAC is licensed in 37 states and the District of
Columbia
• $1.5 billion in claims-paying resources
• AGM ceded $87 billion in par and AGC
ceded $24 billion in par to MAC
17
44% Municipal Assurance Corp.1
($ in billions)
As of
July 22, 2013
Net par outstanding $111
Total investment portfolio $1.5
Total assets $1.5
Unearned premium reserve $0.7
Claims paying resources $1.5
1. All numbers are presented on a statutory basis except for par amounts, which are presented on a GAAP basis. Initial capital contributions are pretax.
Capitalization of MAC1
Creating Value New Business Production
U.S. Structured Finance Business Activity
18
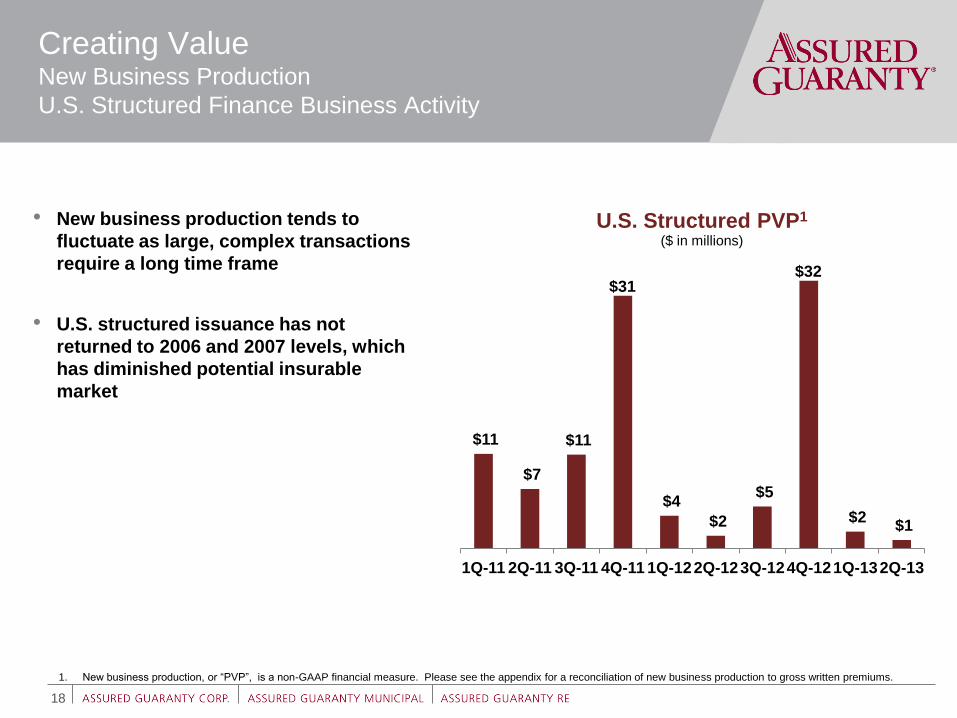
• New business production tends to
fluctuate as large, complex transactions
require a long time frame
• U.S. structured issuance has not
returned to 2006 and 2007 levels, which
has diminished potential insurable
market
1. New business production, or “PVP”, is a non-GAAP financial measure. Please see the appendix for a reconciliation of new business production to gross written premiums.
$11
$7
$11
$31
$4
$2
$5
$32
$2 $1
1Q-11 2Q-11 3Q-11 4Q-11 1Q-12 2Q-12 3Q-12 4Q-12 1Q-13 2Q-13
U.S. Structured PVP1 ($ in millions)
Creating Value New Business Production
International Business Activity
19
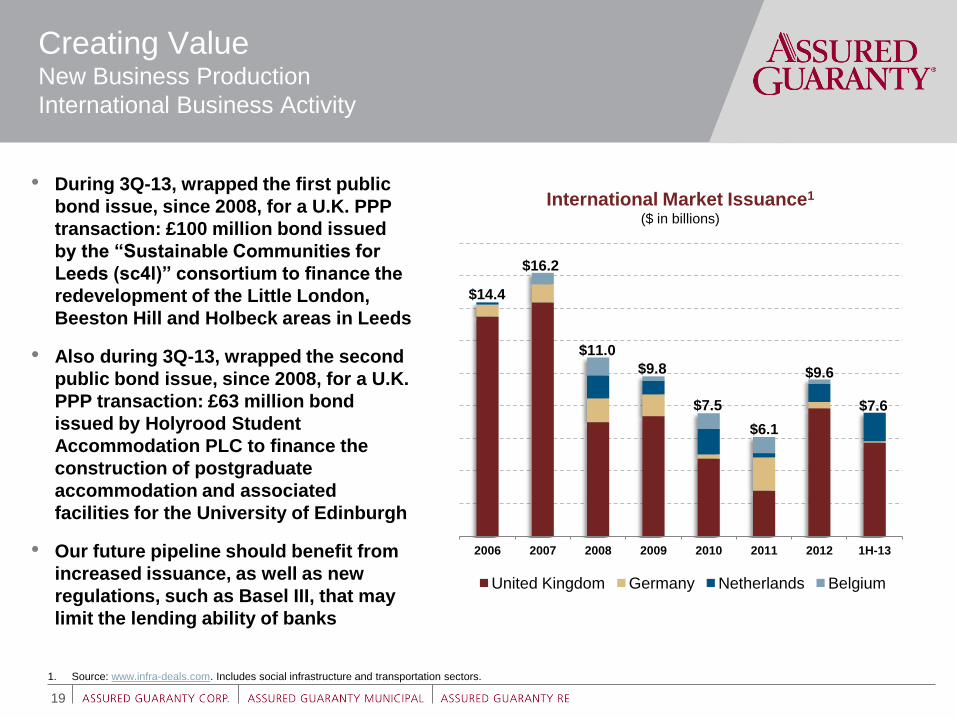
• During 3Q-13, wrapped the first public
bond issue, since 2008, for a U.K. PPP
transaction: £100 million bond issued
by the “Sustainable Communities for
Leeds (sc4l)” consortium to finance the
redevelopment of the Little London,
Beeston Hill and Holbeck areas in Leeds
• Also during 3Q-13, wrapped the second
public bond issue, since 2008, for a U.K.
PPP transaction: £63 million bond
issued by Holyrood Student
Accommodation PLC to finance the
construction of postgraduate
accommodation and associated
facilities for the University of Edinburgh
• Our future pipeline should benefit from
increased issuance, as well as new
regulations, such as Basel III, that may
limit the lending ability of banks
2006 2007 2008 2009 2010 2011 2012 1H-13
United Kingdom Germany Netherlands Belgium
$14.4
$16.2
$11.0
$9.8
$7.5
$6.1
$9.6
International Market Issuance1 ($ in billions)
1. Source: www.infra-deals.com. Includes social infrastructure and transportation sectors.
$7.6
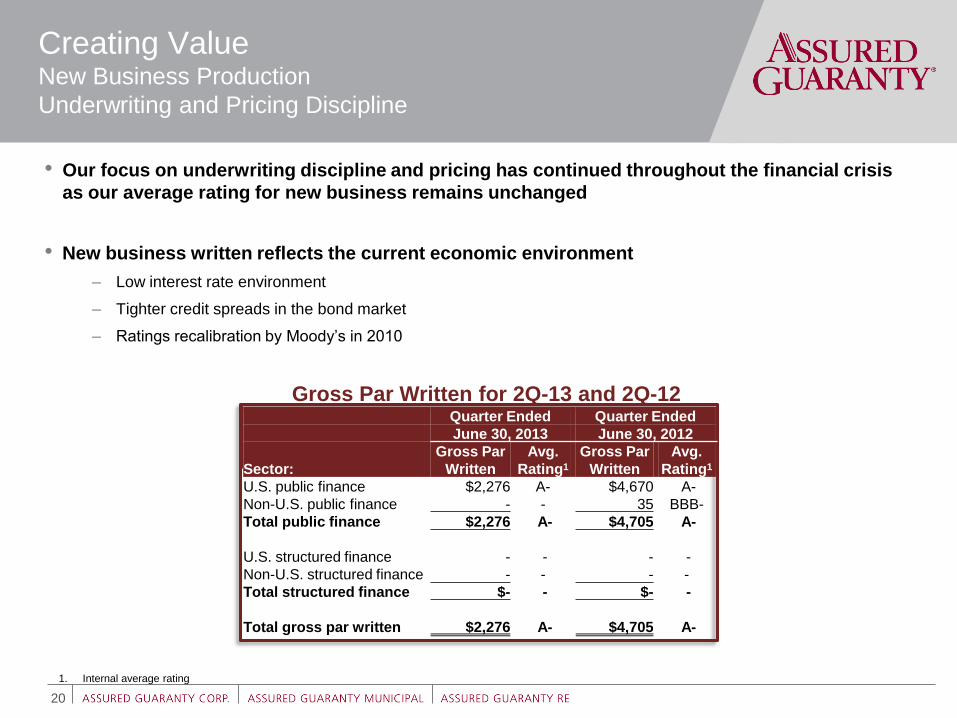
Quarter Ended Quarter Ended
June 30, 2013 June 30, 2012
Sector:
Gross Par
Written
Avg.
Rating1
Gross Par
Written
Avg.
Rating1
U.S. public finance $2,276 A- $4,670 A-
Non-U.S. public finance - - 35 BBB-
Total public finance $2,276 A- $4,705 A-
U.S. structured finance - - - -
Non-U.S. structured finance - - - -
Total structured finance $- - $- -
Total gross par written $2,276 A- $4,705 A-
Creating Value New Business Production
Underwriting and Pricing Discipline
• Our focus on underwriting discipline and pricing has continued throughout the financial crisis
as our average rating for new business remains unchanged
• New business written reflects the current economic environment
– Low interest rate environment
– Tighter credit spreads in the bond market
– Ratings recalibration by Moody’s in 2010
1. Internal average rating
Gross Par Written for 2Q-13 and 2Q-12
20
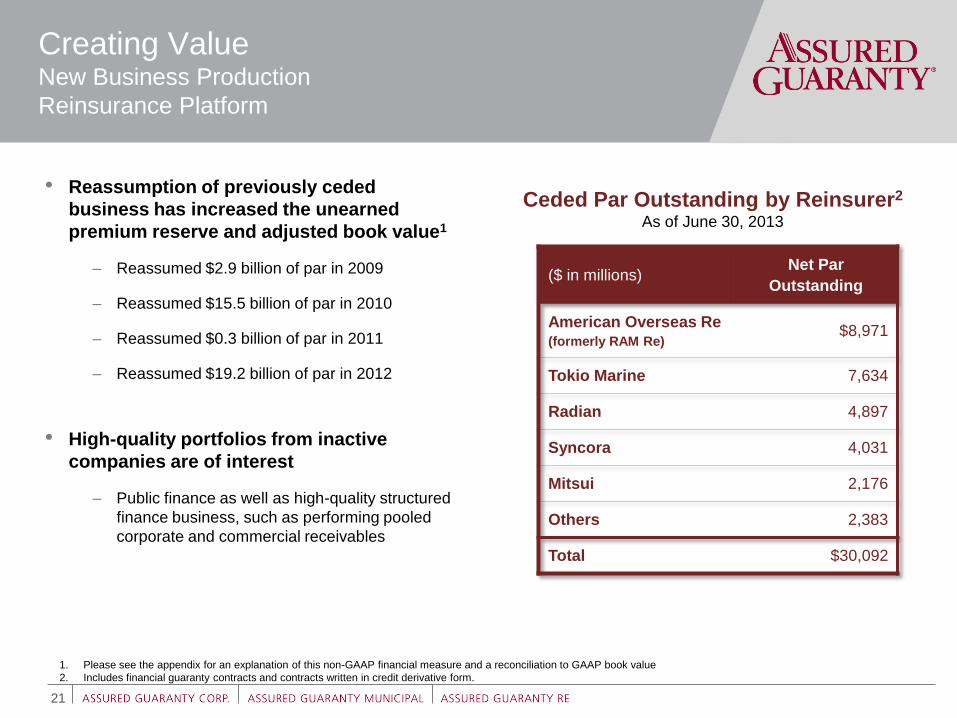
($ in millions) Net Par
Outstanding
American Overseas Re (formerly RAM Re)
$8,971
Tokio Marine 7,634
Radian 4,897
Syncora 4,031
Mitsui 2,176
Others 2,383
Total $30,092
Creating Value New Business Production
Reinsurance Platform
21
• Reassumption of previously ceded
business has increased the unearned
premium reserve and adjusted book value1
– Reassumed $2.9 billion of par in 2009
– Reassumed $15.5 billion of par in 2010
– Reassumed $0.3 billion of par in 2011
– Reassumed $19.2 billion of par in 2012
• High-quality portfolios from inactive
companies are of interest
– Public finance as well as high-quality structured
finance business, such as performing pooled
corporate and commercial receivables
Ceded Par Outstanding by Reinsurer2
As of June 30, 2013
1. Please see the appendix for an explanation of this non-GAAP financial measure and a reconciliation to GAAP book value
2. Includes financial guaranty contracts and contracts written in credit derivative form.
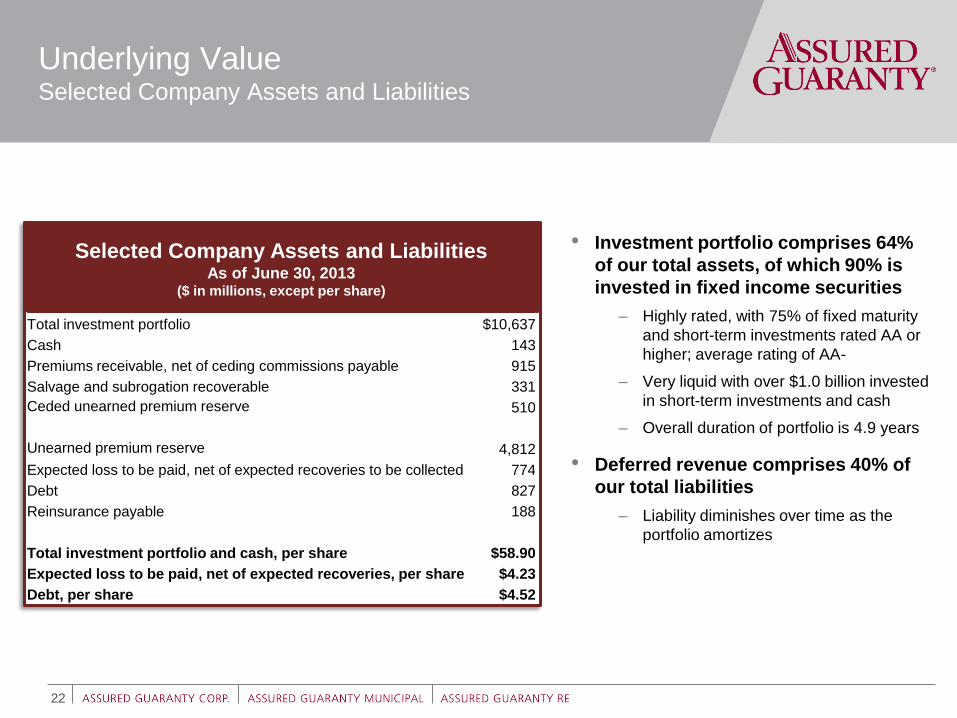
Selected Company Assets and Liabilities As of June 30, 2013
($ in millions, except per share)
Total investment portfolio $10,637
Cash 143
Premiums receivable, net of ceding commissions payable 915
Salvage and subrogation recoverable 331
Ceded unearned premium reserve 510
Unearned premium reserve 4,812
Expected loss to be paid, net of expected recoveries to be collected 774
Debt 827
Reinsurance payable 188
Total investment portfolio and cash, per share $58.90
Expected loss to be paid, net of expected recoveries, per share $4.23
Debt, per share $4.52
Underlying Value Selected Company Assets and Liabilities
22
• Investment portfolio comprises 64%
of our total assets, of which 90% is
invested in fixed income securities
– Highly rated, with 75% of fixed maturity
and short-term investments rated AA or
higher; average rating of AA-
– Very liquid with over $1.0 billion invested
in short-term investments and cash
– Overall duration of portfolio is 4.9 years
• Deferred revenue comprises 40% of
our total liabilities
– Liability diminishes over time as the
portfolio amortizes
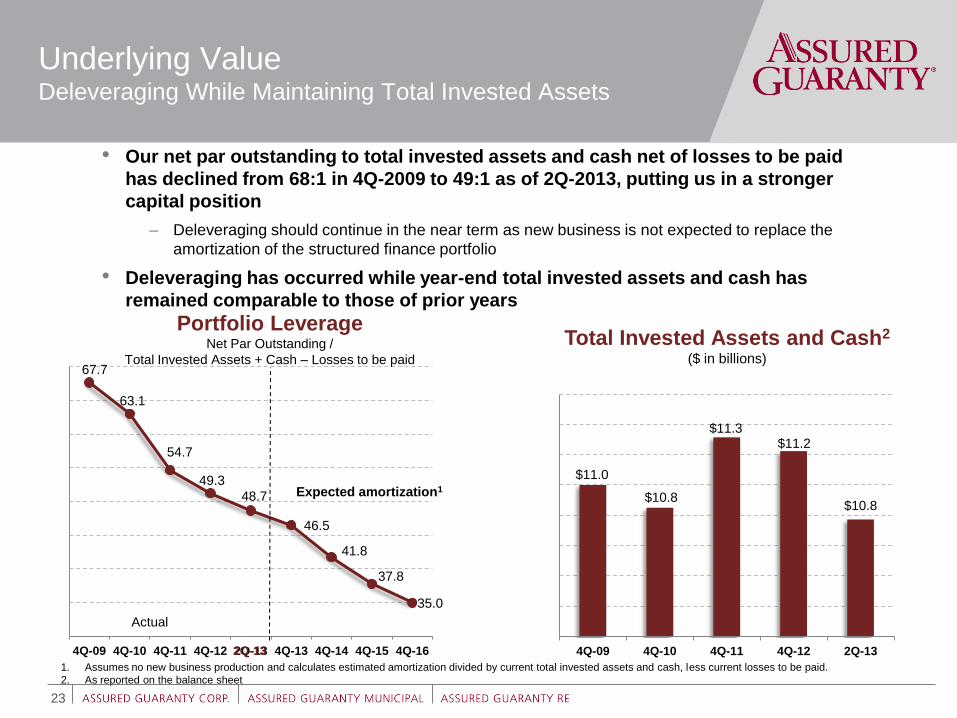
67.7
63.1
54.7
49.3
48.7
46.5
41.8
37.8
35.0
4Q-09 4Q-10 4Q-11 4Q-12 2Q-13 4Q-13 4Q-14 4Q-15 4Q-16
Underlying Value Deleveraging While Maintaining Total Invested Assets
23
• Our net par outstanding to total invested assets and cash net of losses to be paid
has declined from 68:1 in 4Q-2009 to 49:1 as of 2Q-2013, putting us in a stronger
capital position
– Deleveraging should continue in the near term as new business is not expected to replace the
amortization of the structured finance portfolio
• Deleveraging has occurred while year-end total invested assets and cash has
remained comparable to those of prior years
Actual
Total Invested Assets and Cash2
($ in billions)
$11.0
$10.8
$11.3 $11.2
$10.8
4Q-09 4Q-10 4Q-11 4Q-12 2Q-13
Portfolio Leverage Net Par Outstanding /
Total Invested Assets + Cash – Losses to be paid
Expected amortization1
1. Assumes no new business production and calculates estimated amortization divided by current total invested assets and cash, less current losses to be paid.
2. As reported on the balance sheet
2Q-13
24
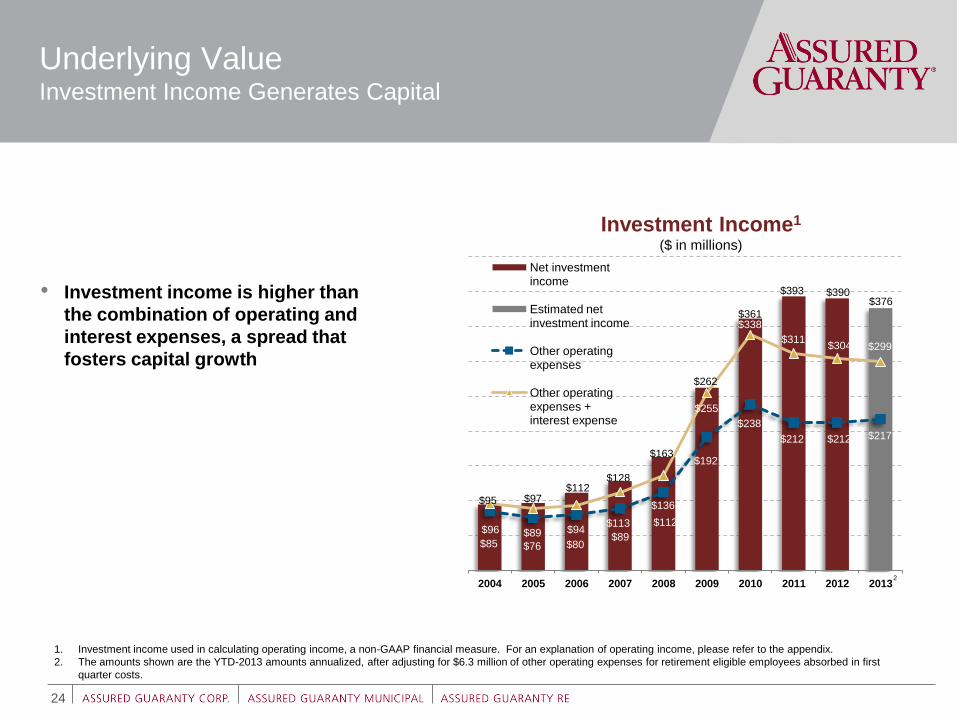
$95 $97 $112
$128
$163
$262
$361
$393 $390 $376
$85 $76 $80 $89
$112
$192
$238
$212 $212 $217
$96 $89 $94 $113
$136
$255
$338
$311 $304 $299
2004 2005 2006 2007 2008 2009 2010 2011 2012 2013
Net investment income
Estimated net investment income
Other operating expenses
Other operating expenses + interest expense
Investment Income1
($ in millions)
Underlying Value Investment Income Generates Capital
1. Investment income used in calculating operating income, a non-GAAP financial measure. For an explanation of operating income, please refer to the appendix.
2. The amounts shown are the YTD-2013 amounts annualized, after adjusting for $6.3 million of other operating expenses for retirement eligible employees absorbed in first
quarter costs.
• Investment income is higher than
the combination of operating and
interest expenses, a spread that
fosters capital growth
2
Underlying Value Historical Growth
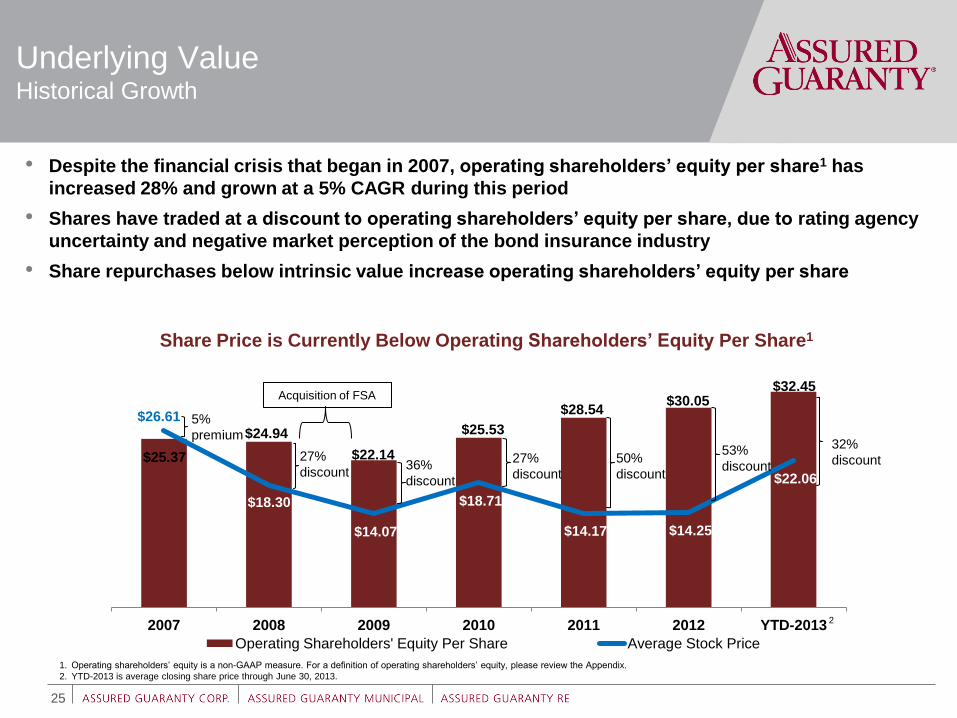
$25.37
$24.94
$22.14
$25.53
$28.54 $30.05
$32.45
$26.61
$18.30
$14.07
$18.71
$14.17 $14.25
$22.06
2007 2008 2009 2010 2011 2012 YTD-2013
Operating Shareholders' Equity Per Share Average Stock Price
25
• Despite the financial crisis that began in 2007, operating shareholders’ equity per share1 has
increased 28% and grown at a 5% CAGR during this period
• Shares have traded at a discount to operating shareholders’ equity per share, due to rating agency
uncertainty and negative market perception of the bond insurance industry
• Share repurchases below intrinsic value increase operating shareholders’ equity per share
Share Price is Currently Below Operating Shareholders’ Equity Per Share1
1. Operating shareholders’ equity is a non-GAAP measure. For a definition of operating shareholders’ equity, please review the Appendix.
2. YTD-2013 is average closing share price through June 30, 2013.
27%
discount 36%
discount
27%
discount
50%
discount
53%
discount
Acquisition of FSA
32%
discount
2
5%
premium
Operating shareholders' equity per share
Net present value of estimated net future credit derivative revenue in force and net unearned revenue on credit derivatives, after tax
Net unearned premium reserve on financial guaranty contracts in excess of net expected loss to be expensed less deferred acquisition costs, after tax
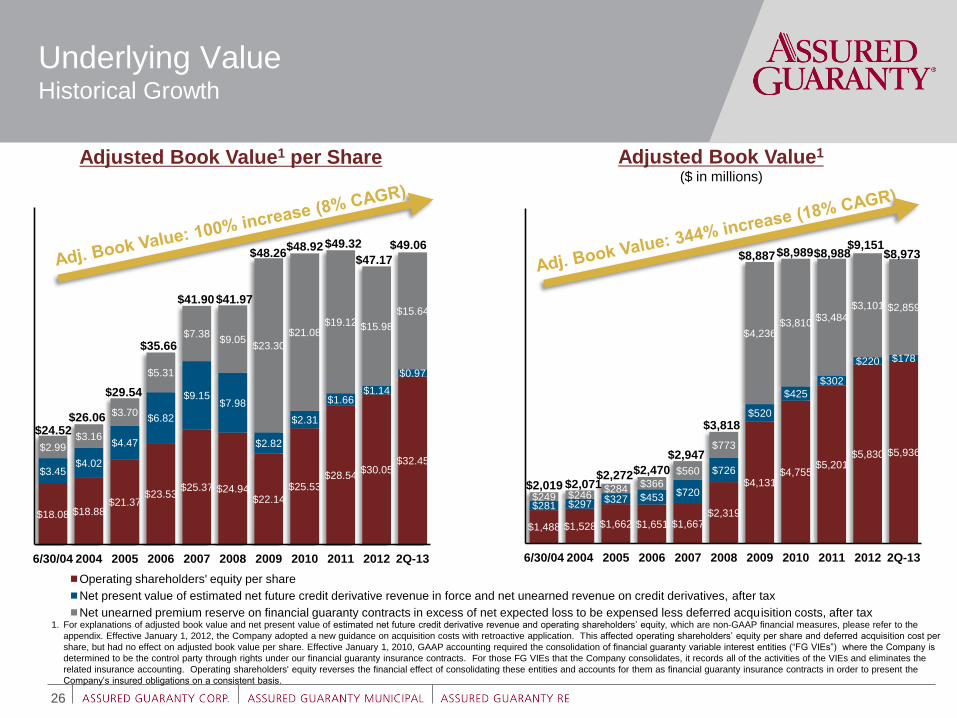
$18.08 $18.88 $21.37
$23.53 $25.37 $24.94
$22.14
$25.53 $28.54
$30.05 $32.45
$3.45 $4.02
$4.47
$6.82
$9.15 $7.98
$2.82
$2.31
$1.66 $1.14
$0.97
$2.99 $3.16
$3.70
$5.31
$7.38 $9.05
$23.30
$21.08 $19.12 $15.98
$15.64
6/30/04 2004 2005 2006 2007 2008 2009 2010 2011 2012 2Q-13
26
Underlying Value Historical Growth
1. For explanations of adjusted book value and net present value of estimated net future credit derivative revenue and operating shareholders’ equity, which are non-GAAP financial measures, please refer to the
appendix. Effective January 1, 2012, the Company adopted a new guidance on acquisition costs with retroactive application. This affected operating shareholders’ equity per share and deferred acquisition cost per
share, but had no effect on adjusted book value per share. Effective January 1, 2010, GAAP accounting required the consolidation of financial guaranty variable interest entities (“FG VIEs”) where the Company is
determined to be the control party through rights under our financial guaranty insurance contracts. For those FG VIEs that the Company consolidates, it records all of the activities of the VIEs and eliminates the
related insurance accounting. Operating shareholders' equity reverses the financial effect of consolidating these entities and accounts for them as financial guaranty insurance contracts in order to present the
Company’s insured obligations on a consistent basis.
Adjusted Book Value1 per Share
26
$24.52 $26.06
$29.54
$35.66
$41.90 $41.97
$48.26 $48.92 $49.32
$47.17
$1,488 $1,528 $1,662 $1,651 $1,667 $2,319
$4,131 $4,755
$5,201 $5,830 $5,936
$281 $297 $327 $453
$720
$726
$520
$425
$302
$220 $178
$249 $246 $284
$366
$560
$773
$4,236 $3,810
$3,484 $3,101 $2,859
6/30/04 2004 2005 2006 2007 2008 2009 2010 2011 2012 2Q-13
Adjusted Book Value1
$2,019 $2,071 $2,272 $2,470
$2,947
$3,818
$8,887 $8,989 $8,988 $9,151
($ in millions)
$49.06 $8,973

Financial Results June 30, 2013
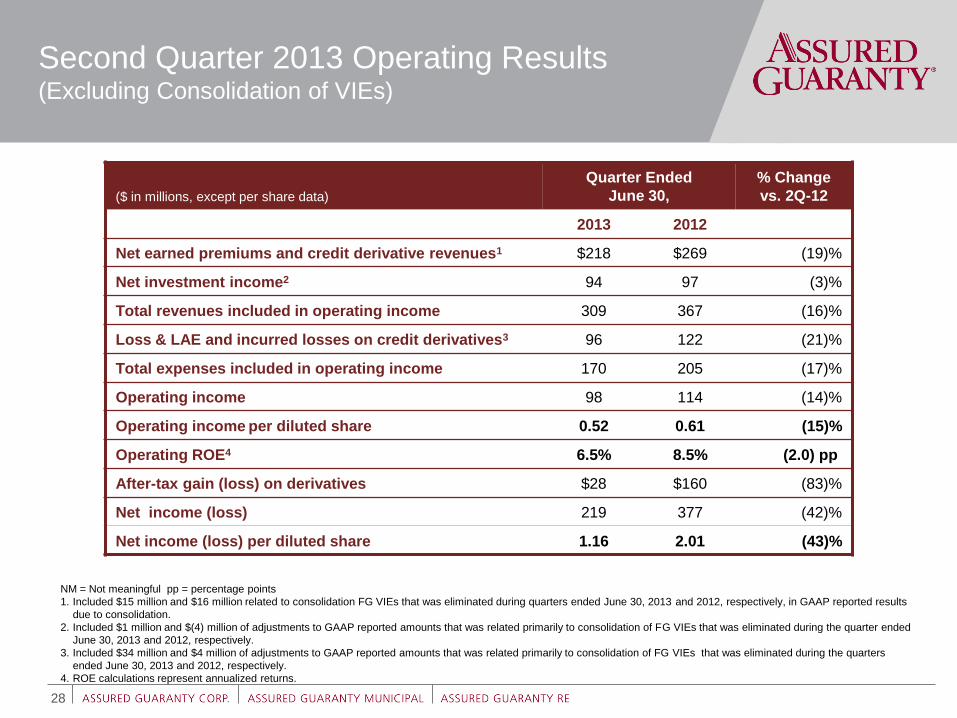
Second Quarter 2013 Operating Results (Excluding Consolidation of VIEs)
28
NM = Not meaningful pp = percentage points
1. Included $15 million and $16 million related to consolidation FG VIEs that was eliminated during quarters ended June 30, 2013 and 2012, respectively, in GAAP reported results
due to consolidation.
2. Included $1 million and $(4) million of adjustments to GAAP reported amounts that was related primarily to consolidation of FG VIEs that was eliminated during the quarter ended
June 30, 2013 and 2012, respectively.
3. Included $34 million and $4 million of adjustments to GAAP reported amounts that was related primarily to consolidation of FG VIEs that was eliminated during the quarters
ended June 30, 2013 and 2012, respectively.
4. ROE calculations represent annualized returns.
($ in millions, except per share data)
Quarter Ended
June 30,
% Change
vs. 2Q-12
2013 2012
Net earned premiums and credit derivative revenues1 $218 $269 (19)%
Net investment income2 94 97 (3)%
Total revenues included in operating income 309 367 (16)%
Loss & LAE and incurred losses on credit derivatives3 96 122 (21)%
Total expenses included in operating income 170 205 (17)%
Operating income 98 114 (14)%
Operating income per diluted share 0.52 0.61 (15)%
Operating ROE4 6.5% 8.5% (2.0) pp
After-tax gain (loss) on derivatives $28 $160 (83)%
Net income (loss) 219 377 (42)%
Net income (loss) per diluted share 1.16 2.01 (43)%
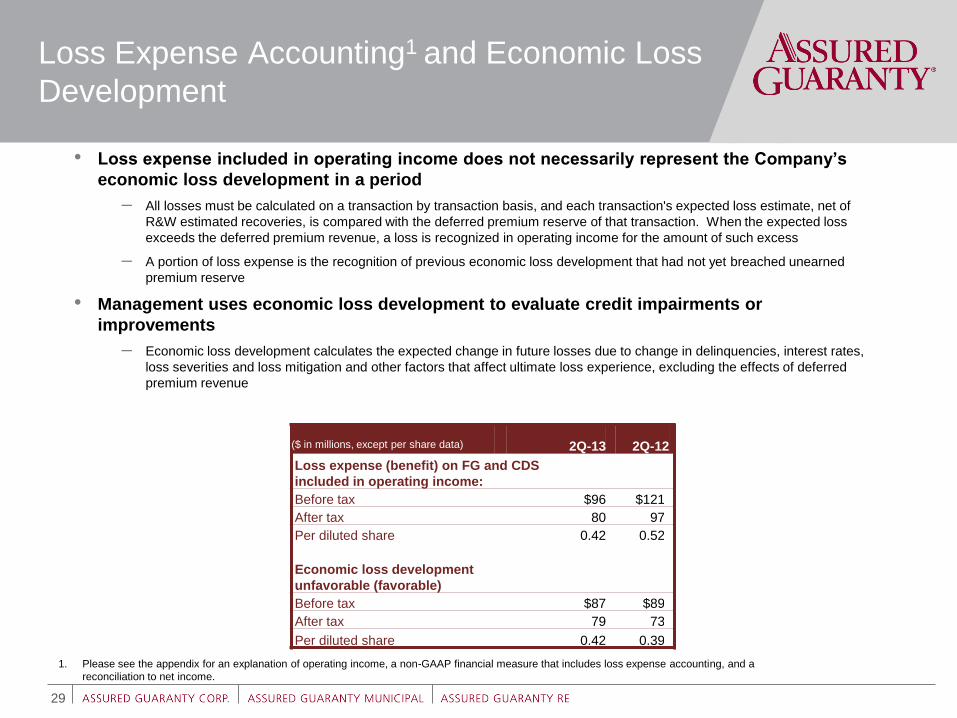
2Q-13 2Q-12
Loss expense (benefit) on FG and CDS
included in operating income:
Before tax $96 $121
After tax 80 97
Per diluted share 0.42 0.52
Economic loss development
unfavorable (favorable)
Before tax $87 $89
After tax 79 73
Per diluted share 0.42 0.39
• Loss expense included in operating income does not necessarily represent the Company’s
economic loss development in a period
– All losses must be calculated on a transaction by transaction basis, and each transaction's expected loss estimate, net of
R&W estimated recoveries, is compared with the deferred premium reserve of that transaction. When the expected loss
exceeds the deferred premium revenue, a loss is recognized in operating income for the amount of such excess
– A portion of loss expense is the recognition of previous economic loss development that had not yet breached unearned
premium reserve
• Management uses economic loss development to evaluate credit impairments or
improvements
– Economic loss development calculates the expected change in future losses due to change in delinquencies, interest rates,
loss severities and loss mitigation and other factors that affect ultimate loss experience, excluding the effects of deferred
premium revenue
Loss Expense Accounting1 and Economic Loss
Development
29
($ in millions, except per share data)
1. Please see the appendix for an explanation of operating income, a non-GAAP financial measure that includes loss expense accounting, and a
reconciliation to net income.

Portfolio Overview June 30, 2013
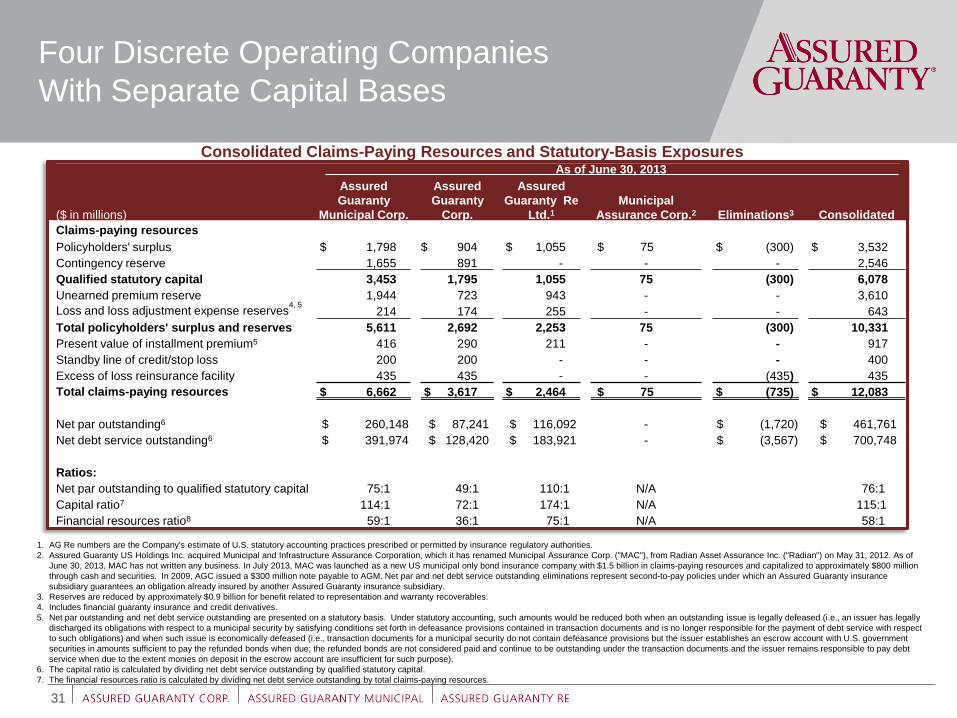
Four Discrete Operating Companies
With Separate Capital Bases
31
Consolidated Claims-Paying Resources and Statutory-Basis Exposures
1. AG Re numbers are the Company's estimate of U.S. statutory accounting practices prescribed or permitted by insurance regulatory authorities.
2. Assured Guaranty US Holdings Inc. acquired Municipal and Infrastructure Assurance Corporation, which it has renamed Municipal Assurance Corp. ("MAC"), from Radian Asset Assurance Inc. ("Radian") on May 31, 2012. As of
June 30, 2013, MAC has not written any business. In July 2013, MAC was launched as a new US municipal only bond insurance company with $1.5 billion in claims-paying resources and capitalized to approximately $800 million
through cash and securities. In 2009, AGC issued a $300 million note payable to AGM. Net par and net debt service outstanding eliminations represent second-to-pay policies under which an Assured Guaranty insurance
subsidiary guarantees an obligation already insured by another Assured Guaranty insurance subsidiary.
3. Reserves are reduced by approximately $0.9 billion for benefit related to representation and warranty recoverables.
4. Includes financial guaranty insurance and credit derivatives.
5. Net par outstanding and net debt service outstanding are presented on a statutory basis. Under statutory accounting, such amounts would be reduced both when an outstanding issue is legally defeased (i.e., an issuer has legally
discharged its obligations with respect to a municipal security by satisfying conditions set forth in defeasance provisions contained in transaction documents and is no longer responsible for the payment of debt service with respect
to such obligations) and when such issue is economically defeased (i.e., transaction documents for a municipal security do not contain defeasance provisions but the issuer establishes an escrow account with U.S. government
securities in amounts sufficient to pay the refunded bonds when due; the refunded bonds are not considered paid and continue to be outstanding under the transaction documents and the issuer remains responsible to pay debt
service when due to the extent monies on deposit in the escrow account are insufficient for such purpose).
6. The capital ratio is calculated by dividing net debt service outstanding by qualified statutory capital.
7. The financial resources ratio is calculated by dividing net debt service outstanding by total claims-paying resources.
As of June 30, 2013
($ in millions)
Assured
Guaranty
Municipal Corp.
Assured
Guaranty
Corp.
Assured
Guaranty Re
Ltd.1
Municipal
Assurance Corp.2 Eliminations3 Consolidated
Claims-paying resources
Policyholders' surplus $ 1,798 $ 904 $ 1,055 $ 75 $ (300) $ 3,532
Contingency reserve 1,655 891 - - - 2,546
Qualified statutory capital 3,453 1,795 1,055 75 (300) 6,078
Unearned premium reserve 1,944 723 943 - - 3,610
Loss and loss adjustment expense reserves4, 5
214 174 255 - - 643
Total policyholders' surplus and reserves 5,611 2,692 2,253 75 (300) 10,331
Present value of installment premium5 416 290 211 - - 917
Standby line of credit/stop loss 200 200 - - - 400
Excess of loss reinsurance facility 435 435 - - (435) 435
Total claims-paying resources $ 6,662 $ 3,617 $ 2,464 $ 75 $ (735) $ 12,083
Net par outstanding6 $ 260,148 $ 87,241 $ 116,092 - $ (1,720) $ 461,761
Net debt service outstanding6 $ 391,974 $ 128,420 $ 183,921 - $ (3,567) $ 700,748
Ratios:
Net par outstanding to qualified statutory capital 75:1 49:1 110:1 N/A 76:1
Capital ratio7 114:1 72:1 174:1 N/A 115:1
Financial resources ratio8 59:1 36:1 75:1 N/A 58:1
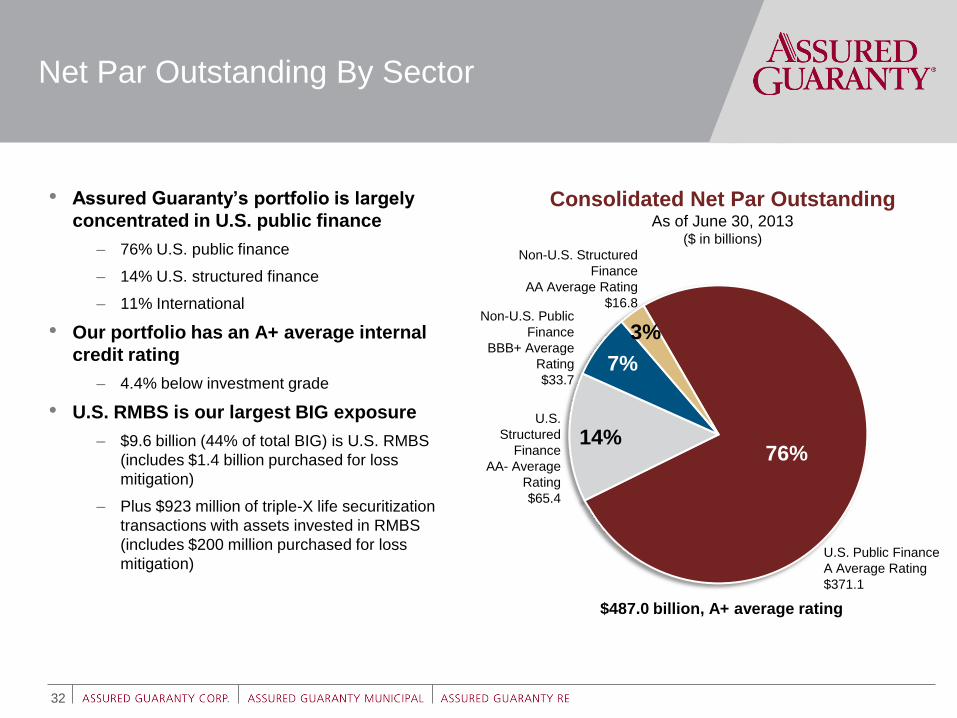
Net Par Outstanding By Sector
32
• Assured Guaranty’s portfolio is largely
concentrated in U.S. public finance
– 76% U.S. public finance
– 14% U.S. structured finance
– 11% International
• Our portfolio has an A+ average internal
credit rating
– 4.4% below investment grade
• U.S. RMBS is our largest BIG exposure
– $9.6 billion (44% of total BIG) is U.S. RMBS
(includes $1.4 billion purchased for loss
mitigation)
– Plus $923 million of triple-X life securitization
transactions with assets invested in RMBS
(includes $200 million purchased for loss
mitigation)
Consolidated Net Par Outstanding
As of June 30, 2013 ($ in billions)
7%
$487.0 billion, A+ average rating
76% 14%
7%
3%
U.S. Public Finance
A Average Rating
$371.1
U.S.
Structured
Finance
AA- Average
Rating
$65.4
Non-U.S. Public
Finance
BBB+ Average
Rating
$33.7
Non-U.S. Structured
Finance
AA Average Rating
$16.8
4Q-09 4Q-10 4Q-11 4Q-12 2Q-13 4Q-13 4Q-14 4Q-15 4Q-16
Public Finance
Structured Finance
$350
Expected
$640
$520
33
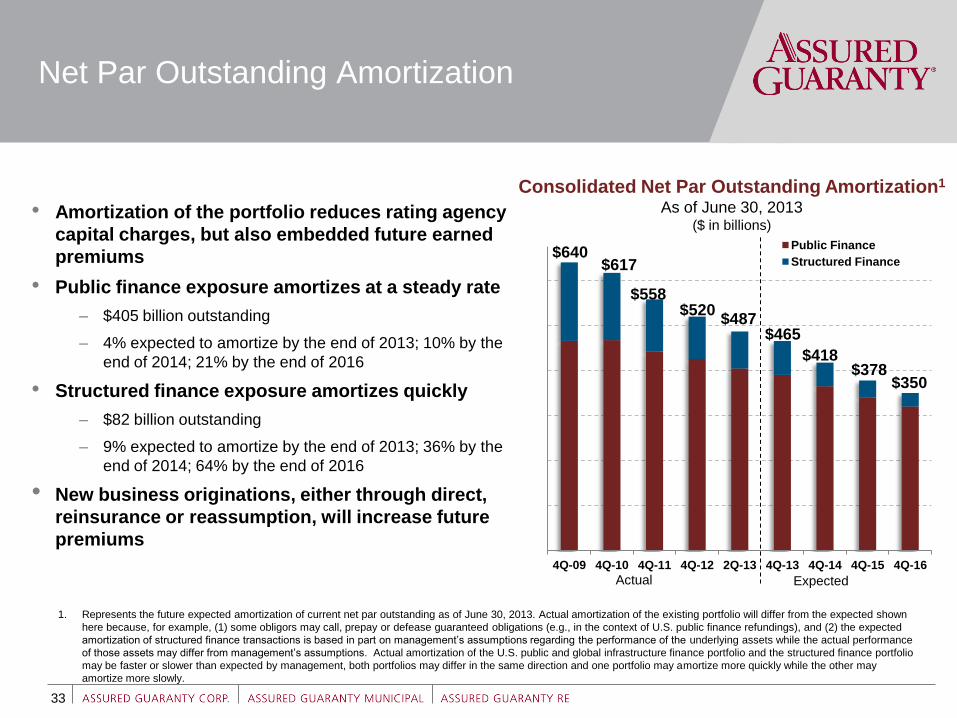
Net Par Outstanding Amortization
1. Represents the future expected amortization of current net par outstanding as of June 30, 2013. Actual amortization of the existing portfolio will differ from the expected shown
here because, for example, (1) some obligors may call, prepay or defease guaranteed obligations (e.g., in the context of U.S. public finance refundings), and (2) the expected
amortization of structured finance transactions is based in part on management’s assumptions regarding the performance of the underlying assets while the actual performance
of those assets may differ from management’s assumptions. Actual amortization of the U.S. public and global infrastructure finance portfolio and the structured finance portfolio
may be faster or slower than expected by management, both portfolios may differ in the same direction and one portfolio may amortize more quickly while the other may
amortize more slowly.
Consolidated Net Par Outstanding Amortization1
As of June 30, 2013 ($ in billions)
$378
$617
$465
$418
Actual
$558
• Amortization of the portfolio reduces rating agency
capital charges, but also embedded future earned
premiums
• Public finance exposure amortizes at a steady rate
– $405 billion outstanding
– 4% expected to amortize by the end of 2013; 10% by the
end of 2014; 21% by the end of 2016
• Structured finance exposure amortizes quickly
– $82 billion outstanding
– 9% expected to amortize by the end of 2013; 36% by the
end of 2014; 64% by the end of 2016
• New business originations, either through direct,
reinsurance or reassumption, will increase future
premiums
$487
34
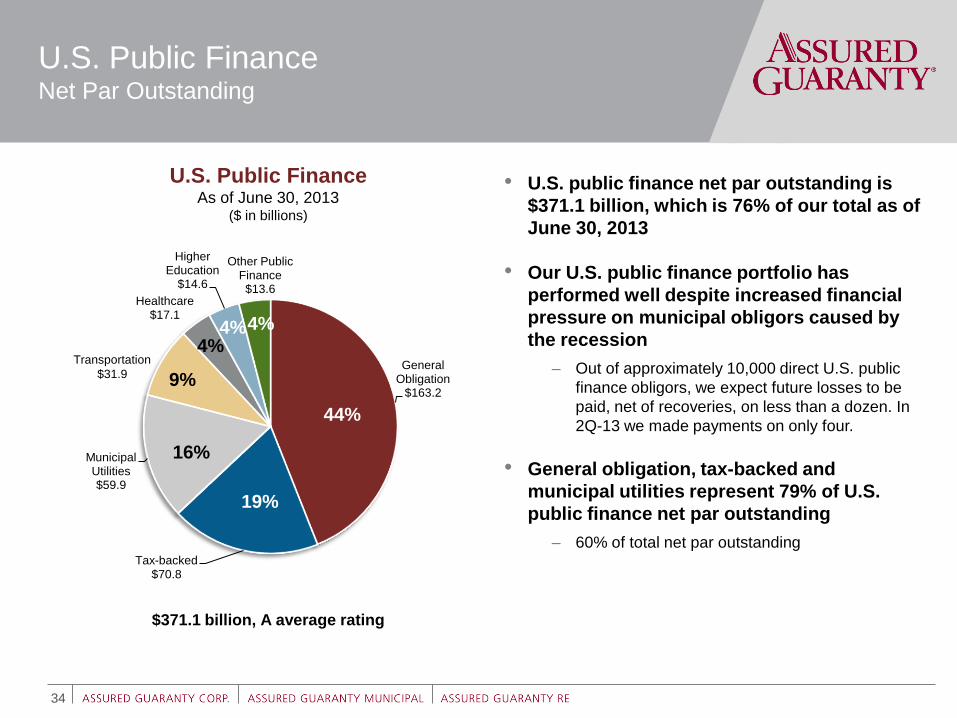
U.S. Public Finance Net Par Outstanding
General Obligation
$163.2
Tax-backed $70.8
Municipal Utilities $59.9
Healthcare $17.1
Higher Education
$14.6
Other Public Finance $13.6
• U.S. public finance net par outstanding is
$371.1 billion, which is 76% of our total as of
June 30, 2013
• Our U.S. public finance portfolio has
performed well despite increased financial
pressure on municipal obligors caused by
the recession
– Out of approximately 10,000 direct U.S. public
finance obligors, we expect future losses to be
paid, net of recoveries, on less than a dozen. In
2Q-13 we made payments on only four.
• General obligation, tax-backed and
municipal utilities represent 79% of U.S.
public finance net par outstanding
– 60% of total net par outstanding
U.S. Public Finance As of June 30, 2013
($ in billions)
$371.1 billion, A average rating
44%
19%
16%
9%
4% 4% 4%
Transportation
$31.9
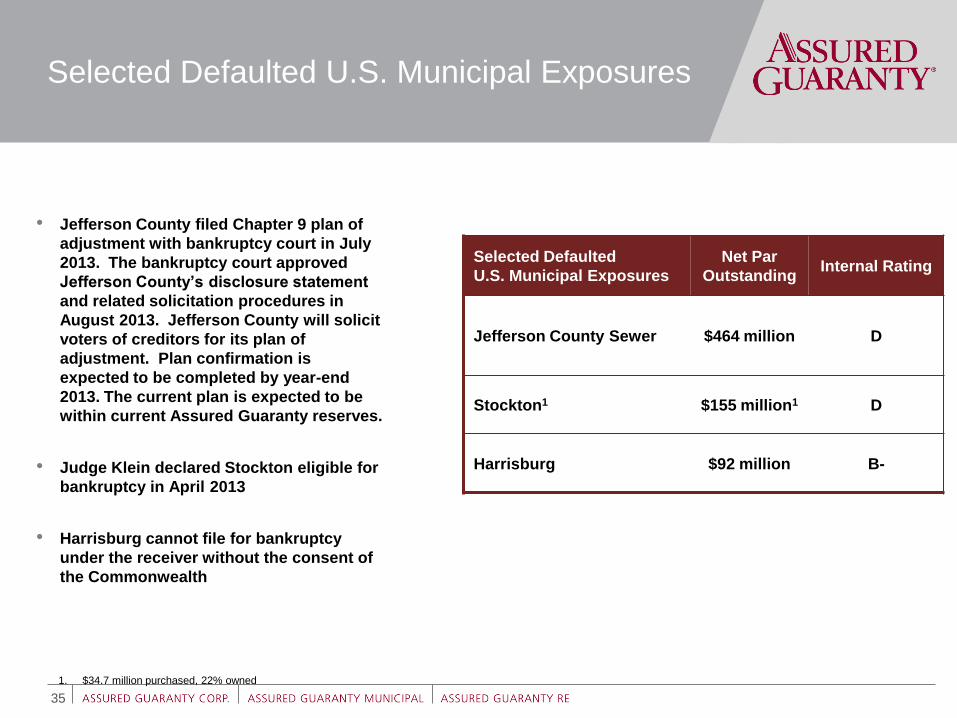
Selected Defaulted U.S. Municipal Exposures
• Jefferson County filed Chapter 9 plan of
adjustment with bankruptcy court in July
2013. The bankruptcy court approved
Jefferson County’s disclosure statement
and related solicitation procedures in
August 2013. Jefferson County will solicit
voters of creditors for its plan of
adjustment. Plan confirmation is
expected to be completed by year-end
2013. The current plan is expected to be
within current Assured Guaranty reserves.
• Judge Klein declared Stockton eligible for
bankruptcy in April 2013
• Harrisburg cannot file for bankruptcy
under the receiver without the consent of
the Commonwealth
35
Selected Defaulted
U.S. Municipal Exposures
Net Par
Outstanding Internal Rating
Jefferson County Sewer $464 million D
Stockton1 $155 million1 D
Harrisburg $92 million B-
1. $34.7 million purchased, 22% owned
Detroit
36
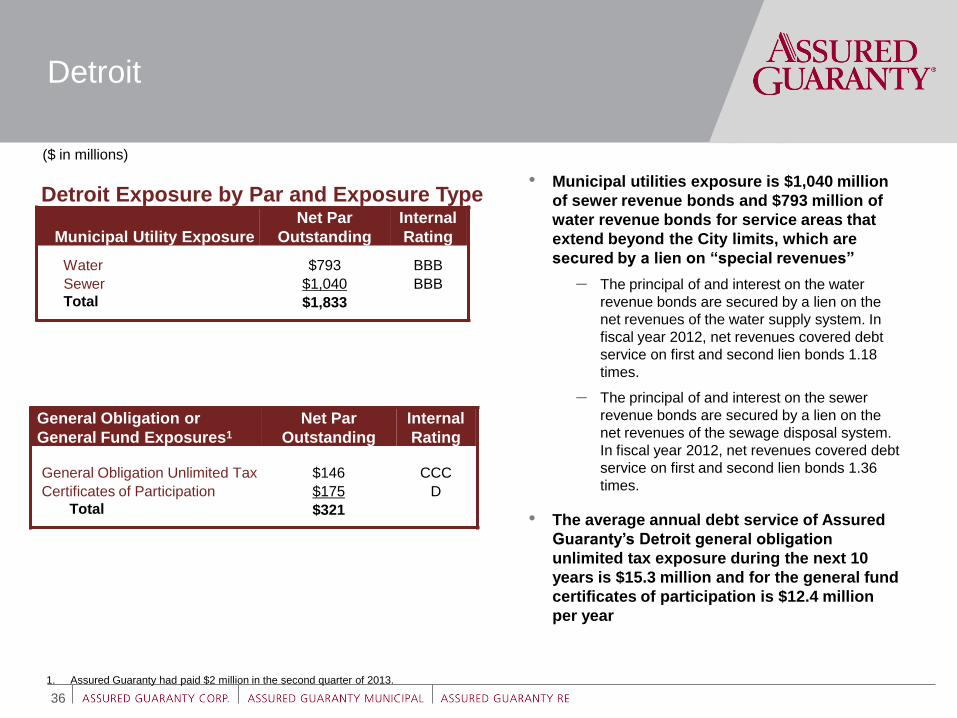
Detroit Exposure by Par and Exposure Type
Municipal Utility Exposure
Net Par
Outstanding
Internal
Rating
Water $793 BBB
Sewer $1,040 BBB
Total $1,833
• Municipal utilities exposure is $1,040 million
of sewer revenue bonds and $793 million of
water revenue bonds for service areas that
extend beyond the City limits, which are
secured by a lien on “special revenues”
– The principal of and interest on the water
revenue bonds are secured by a lien on the
net revenues of the water supply system. In
fiscal year 2012, net revenues covered debt
service on first and second lien bonds 1.18
times.
– The principal of and interest on the sewer
revenue bonds are secured by a lien on the
net revenues of the sewage disposal system.
In fiscal year 2012, net revenues covered debt
service on first and second lien bonds 1.36
times.
• The average annual debt service of Assured
Guaranty’s Detroit general obligation
unlimited tax exposure during the next 10
years is $15.3 million and for the general fund
certificates of participation is $12.4 million
per year
1. Assured Guaranty had paid $2 million in the second quarter of 2013.
General Obligation or
General Fund Exposures1
Net Par
Outstanding
Internal
Rating
General Obligation Unlimited Tax $146 CCC
Certificates of Participation $175 D
Total $321
($ in millions)
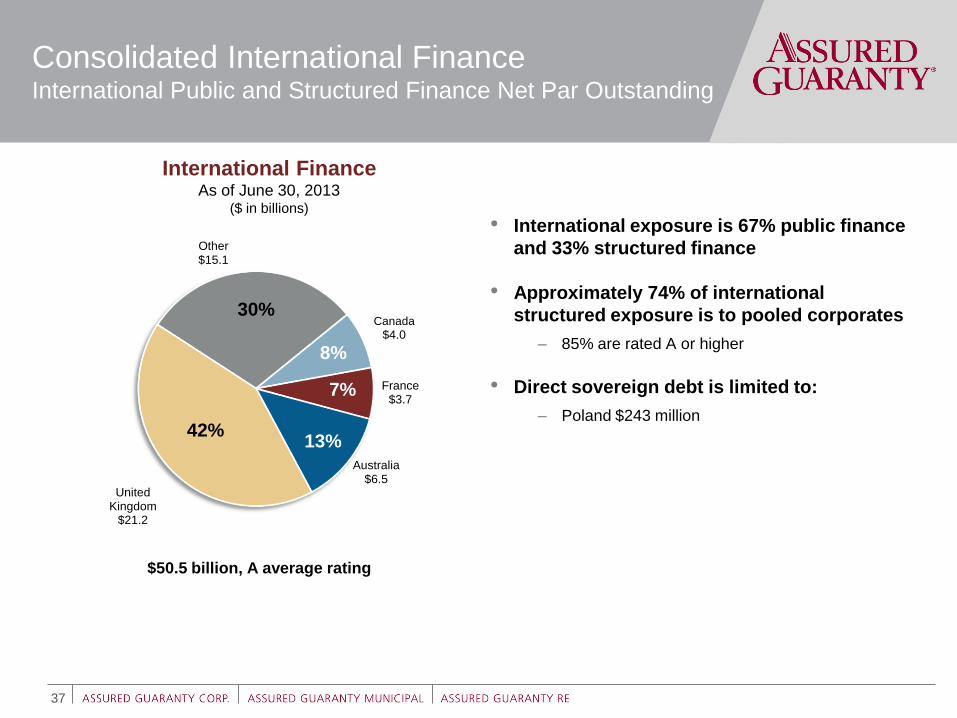
Other $15.1
Canada
$4.0
France $3.7
Australia $6.5
United Kingdom
$21.2
• International exposure is 67% public finance
and 33% structured finance
• Approximately 74% of international
structured exposure is to pooled corporates
– 85% are rated A or higher
• Direct sovereign debt is limited to:
– Poland $243 million
37
Consolidated International Finance International Public and Structured Finance Net Par Outstanding
International Finance As of June 30, 2013
($ in billions)
$50.5 billion, A average rating
30%
8%
13% 42%
7%
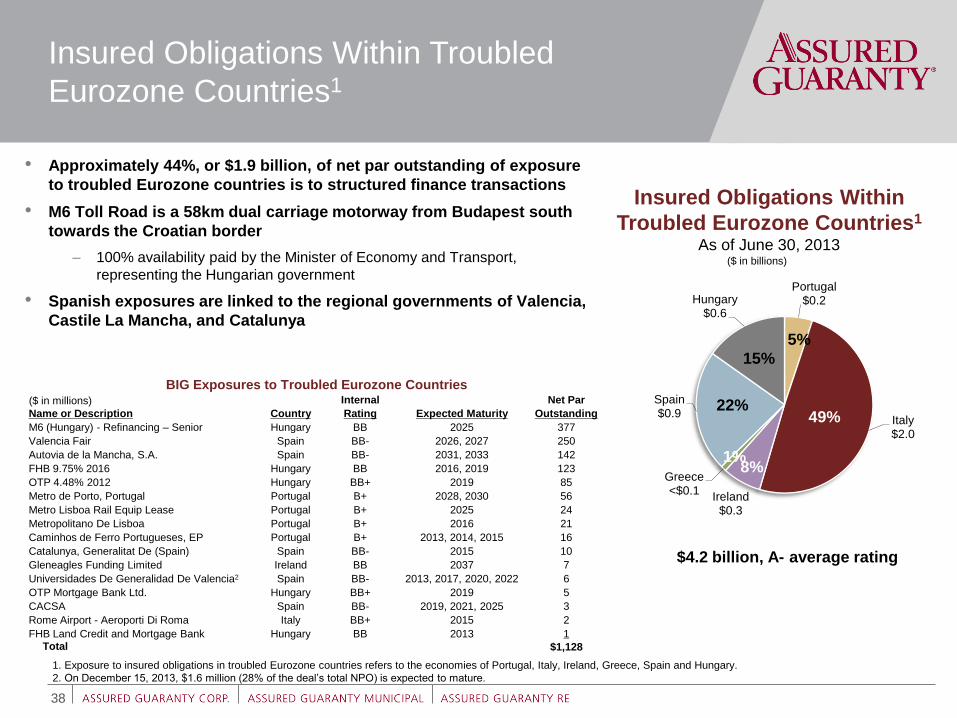
BIG Exposures to Troubled Eurozone Countries
Name or Description Country
Internal
Expected Maturity
Net Par
Rating Outstanding
M6 (Hungary) - Refinancing – Senior Hungary BB 2025 377
Valencia Fair Spain BB- 2026, 2027 250
Autovia de la Mancha, S.A. Spain BB- 2031, 2033 142
FHB 9.75% 2016 Hungary BB 2016, 2019 123
OTP 4.48% 2012 Hungary BB+ 2019 85
Metro de Porto, Portugal Portugal B+ 2028, 2030 56
Metro Lisboa Rail Equip Lease Portugal B+ 2025 24
Metropolitano De Lisboa Portugal B+ 2016 21
Caminhos de Ferro Portugueses, EP Portugal B+ 2013, 2014, 2015 16
Catalunya, Generalitat De (Spain) Spain BB- 2015 10
Gleneagles Funding Limited Ireland BB 2037 7
Universidades De Generalidad De Valencia2 Spain BB- 2013, 2017, 2020, 2022 6
OTP Mortgage Bank Ltd. Hungary BB+ 2019 5
CACSA Spain BB- 2019, 2021, 2025 3
Rome Airport - Aeroporti Di Roma Italy BB+ 2015 2
FHB Land Credit and Mortgage Bank Hungary BB 2013 1 Total $1,128
38
Insured Obligations Within Troubled
Eurozone Countries1
• Approximately 44%, or $1.9 billion, of net par outstanding of exposure
to troubled Eurozone countries is to structured finance transactions
• M6 Toll Road is a 58km dual carriage motorway from Budapest south
towards the Croatian border
– 100% availability paid by the Minister of Economy and Transport,
representing the Hungarian government
• Spanish exposures are linked to the regional governments of Valencia,
Castile La Mancha, and Catalunya
51%
Insured Obligations Within
Troubled Eurozone Countries1
As of June 30, 2013
($ in millions)
($ in billions)
1. Exposure to insured obligations in troubled Eurozone countries refers to the economies of Portugal, Italy, Ireland, Greece, Spain and Hungary.
2. On December 15, 2013, $1.6 million (28% of the deal’s total NPO) is expected to mature.
1%
Portugal $0.2
Italy $2.0
Ireland $0.3
Greece <$0.1
Spain $0.9
Hungary $0.6
5%
$4.2 billion, A- average rating
49% 22%
15%
8% 1%
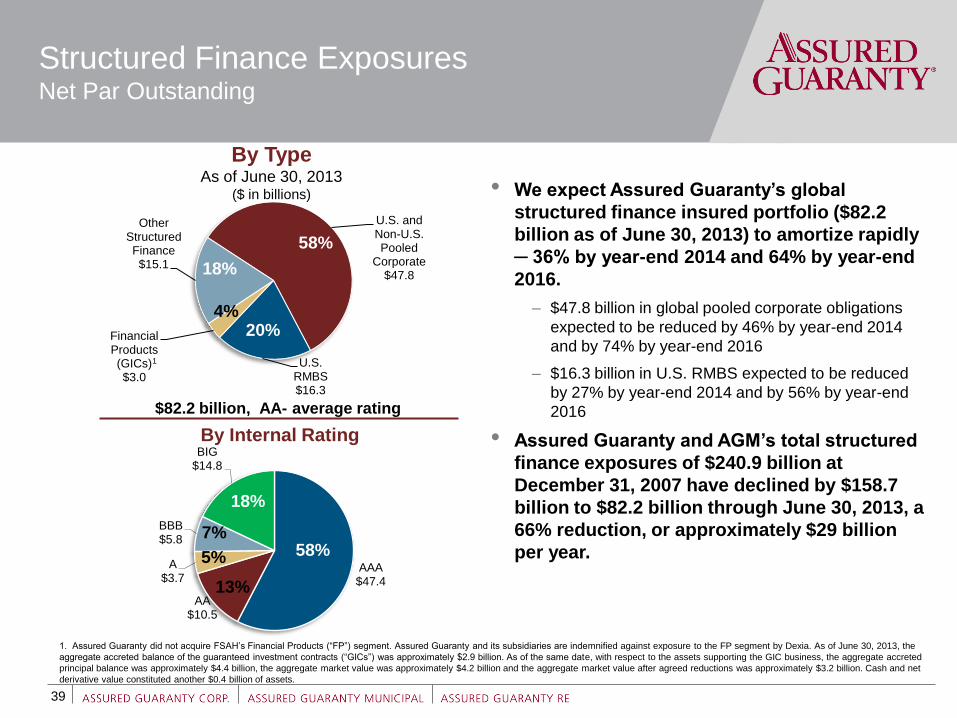
AAA $47.4
AA $10.5
A $3.7
BBB $5.8
BIG $14.8
• We expect Assured Guaranty’s global
structured finance insured portfolio ($82.2
billion as of June 30, 2013) to amortize rapidly
─ 36% by year-end 2014 and 64% by year-end
2016.
– $47.8 billion in global pooled corporate obligations
expected to be reduced by 46% by year-end 2014
and by 74% by year-end 2016
– $16.3 billion in U.S. RMBS expected to be reduced
by 27% by year-end 2014 and by 56% by year-end
2016
• Assured Guaranty and AGM’s total structured
finance exposures of $240.9 billion at
December 31, 2007 have declined by $158.7
billion to $82.2 billion through June 30, 2013, a
66% reduction, or approximately $29 billion
per year.
39
Structured Finance Exposures Net Par Outstanding
U.S. and Non-U.S. Pooled
Corporate $47.8
U.S. RMBS $16.3
Financial Products (GICs) $3.0
Other Structured Finance $15.1
$82.2 billion, AA- average rating
By Type As of June 30, 2013
($ in billions)
By Internal Rating
1. Assured Guaranty did not acquire FSAH’s Financial Products (“FP”) segment. Assured Guaranty and its subsidiaries are indemnified against exposure to the FP segment by Dexia. As of June 30, 2013, the
aggregate accreted balance of the guaranteed investment contracts (“GICs”) was approximately $2.9 billion. As of the same date, with respect to the assets supporting the GIC business, the aggregate accreted
principal balance was approximately $4.4 billion, the aggregate market value was approximately $4.2 billion and the aggregate market value after agreed reductions was approximately $3.2 billion. Cash and net
derivative value constituted another $0.4 billion of assets.
1
58%
20%
18%
4%
58%
18%
13%
5%
7%
$17,124 $16,355 $13,202
$10,605 $9,618
4Q-09 4Q-10 4Q-11 4Q-12 2Q-12
$ in
millio
ns
BIG BBB A AA AAA
$21,567
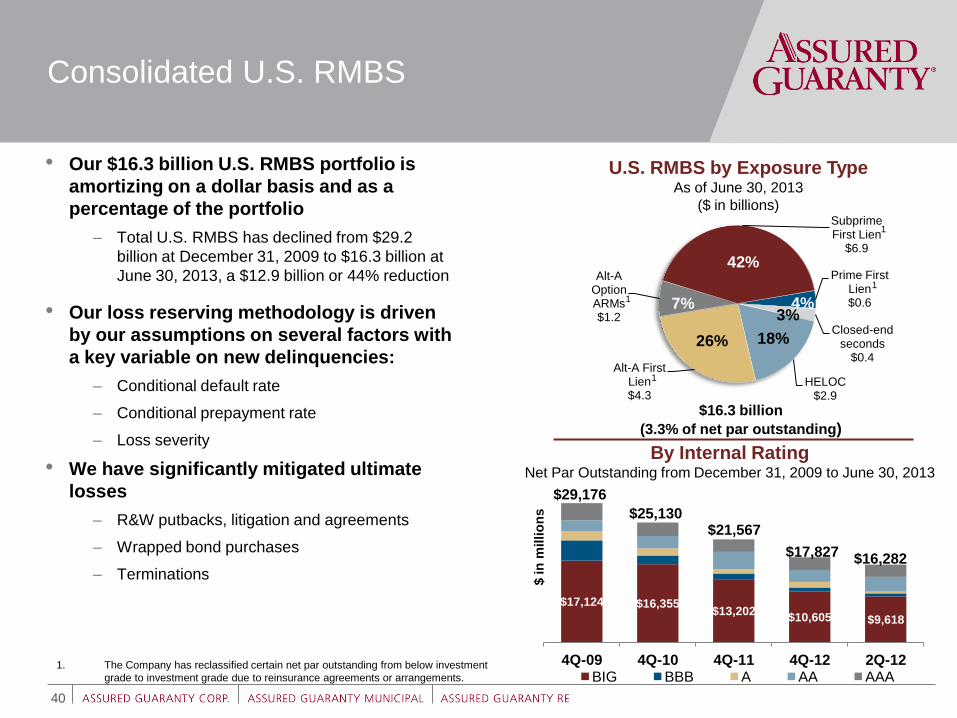
• Our $16.3 billion U.S. RMBS portfolio is
amortizing on a dollar basis and as a
percentage of the portfolio
– Total U.S. RMBS has declined from $29.2
billion at December 31, 2009 to $16.3 billion at
June 30, 2013, a $12.9 billion or 44% reduction
• Our loss reserving methodology is driven
by our assumptions on several factors with
a key variable on new delinquencies:
– Conditional default rate
– Conditional prepayment rate
– Loss severity
• We have significantly mitigated ultimate
losses
– R&W putbacks, litigation and agreements
– Wrapped bond purchases
– Terminations
Consolidated U.S. RMBS
40
Prime First Lien $0.6
Closed-end seconds
$0.4
HELOC $2.9
Alt-A First Lien $4.3
Alt-A Option ARMs $1.2
Subprime First Lien
$6.9
U.S. RMBS by Exposure Type As of June 30, 2013
($ in billions)
$16.3 billion
(3.3% of net par outstanding)
42%
3%
18% 26%
7% 4%
$29,176
$25,130
By Internal Rating Net Par Outstanding from December 31, 2009 to June 30, 2013
$17,827 $16,282
1. The Company has reclassified certain net par outstanding from below investment
grade to investment grade due to reinsurance agreements or arrangements.
1
1
1
1
U.S. RMBS Exposure Loss-sharing
Arrangements
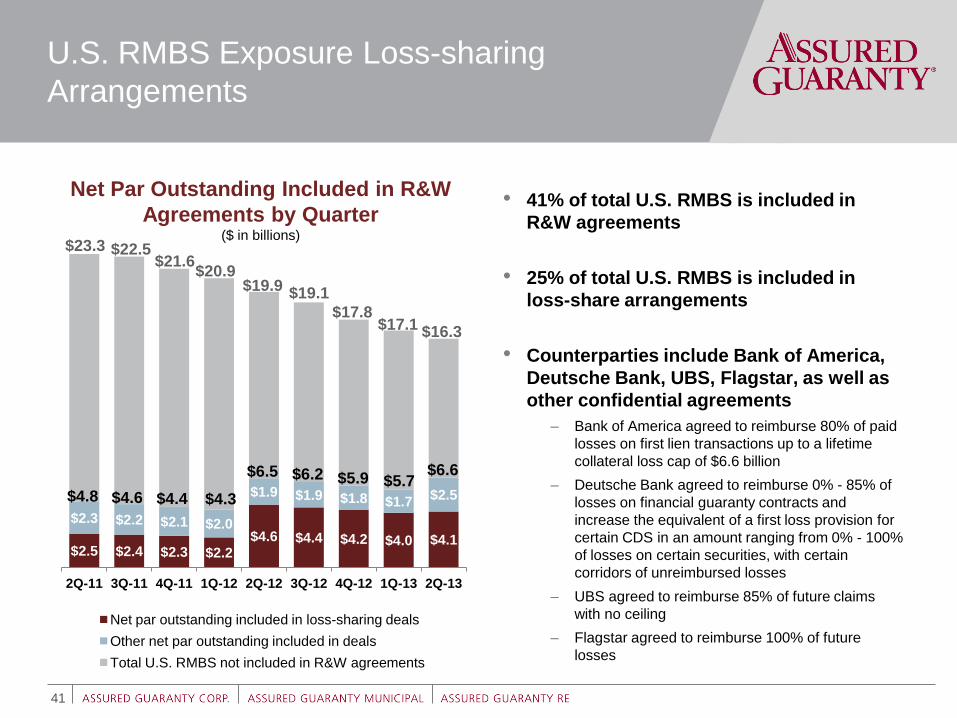
$2.5 $2.4 $2.3 $2.2 $4.6 $4.4 $4.2 $4.0 $4.1
$2.3 $2.2 $2.1 $2.0
$1.9 $1.9 $1.8 $1.7 $2.5
2Q-11 3Q-11 4Q-11 1Q-12 2Q-12 3Q-12 4Q-12 1Q-13 2Q-13
Net par outstanding included in loss-sharing deals
Other net par outstanding included in deals
Total U.S. RMBS not included in R&W agreements
41
Net Par Outstanding Included in R&W
Agreements by Quarter ($ in billions)
$4.8 $4.6 $4.4
$6.5 $6.2 $5.9 $5.7 $4.3
$6.6
• 41% of total U.S. RMBS is included in
R&W agreements
• 25% of total U.S. RMBS is included in
loss-share arrangements
• Counterparties include Bank of America,
Deutsche Bank, UBS, Flagstar, as well as
other confidential agreements
– Bank of America agreed to reimburse 80% of paid
losses on first lien transactions up to a lifetime
collateral loss cap of $6.6 billion
– Deutsche Bank agreed to reimburse 0% - 85% of
losses on financial guaranty contracts and
increase the equivalent of a first loss provision for
certain CDS in an amount ranging from 0% - 100%
of losses on certain securities, with certain
corridors of unreimbursed losses
– UBS agreed to reimburse 85% of future claims
with no ceiling
– Flagstar agreed to reimburse 100% of future
losses
$23.3 $22.5
$20.9 $19.9
$19.1
$17.8
$21.6
$17.1 $16.3
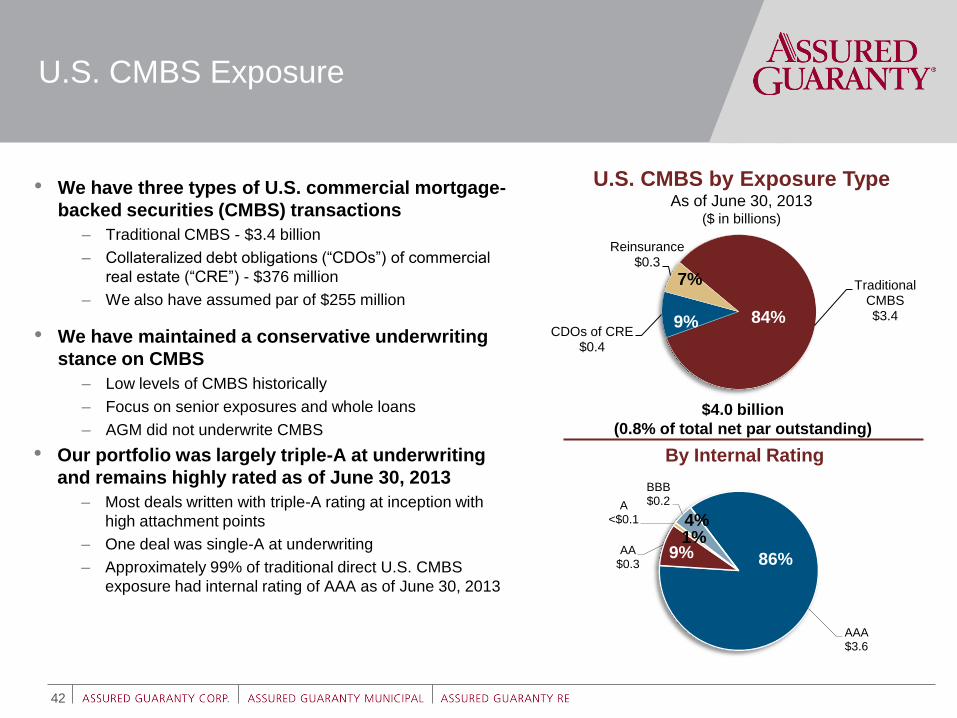
Traditional CMBS $3.4
CDOs of CRE $0.4
Reinsurance $0.3
9%
7%
$4.0 billion
(0.8% of total net par outstanding)
AAA $3.6
AA $0.3
A <$0.1
BBB $0.2
42
U.S. CMBS Exposure
• We have three types of U.S. commercial mortgage-
backed securities (CMBS) transactions
– Traditional CMBS - $3.4 billion
– Collateralized debt obligations (“CDOs”) of commercial
real estate (“CRE”) - $376 million
– We also have assumed par of $255 million
• We have maintained a conservative underwriting
stance on CMBS
– Low levels of CMBS historically
– Focus on senior exposures and whole loans
– AGM did not underwrite CMBS
• Our portfolio was largely triple-A at underwriting
and remains highly rated as of June 30, 2013
– Most deals written with triple-A rating at inception with
high attachment points
– One deal was single-A at underwriting
– Approximately 99% of traditional direct U.S. CMBS
exposure had internal rating of AAA as of June 30, 2013
U.S. CMBS by Exposure Type As of June 30, 2013
($ in billions)
84%
By Internal Rating
86% 9%
4% 1%
Direct Pooled Corporate Obligations
43
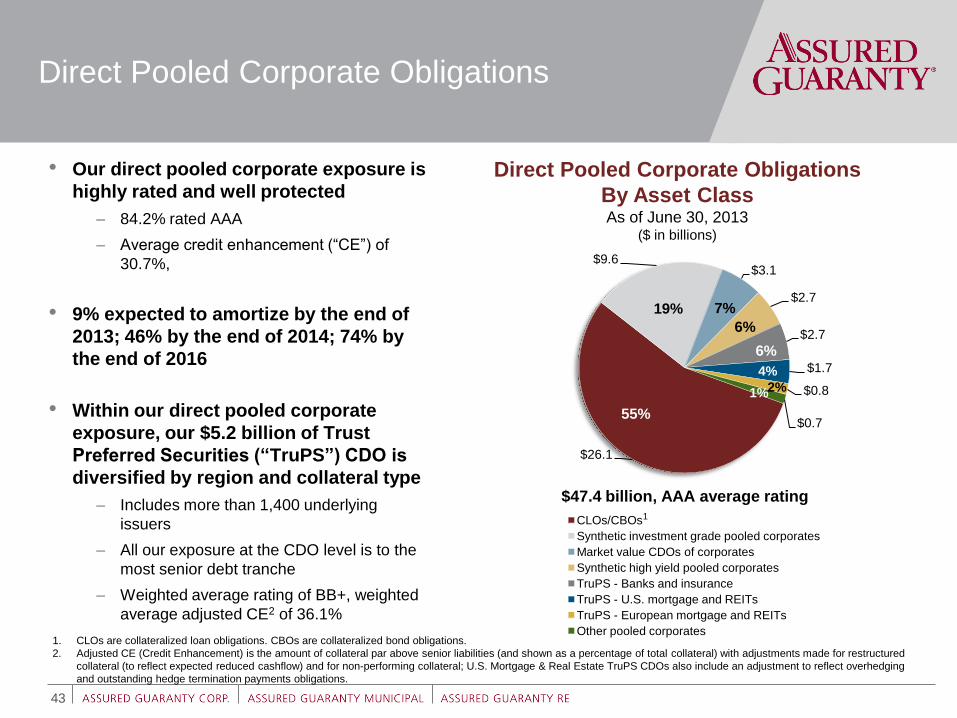
$26.1
$9.6 $3.1
$2.7
$2.7
$1.7
$0.8
$0.7
CLOs/CBOs
Synthetic investment grade pooled corporates
Market value CDOs of corporates
Synthetic high yield pooled corporates
TruPS - Banks and insurance
TruPS - U.S. mortgage and REITs
TruPS - European mortgage and REITs
Other pooled corporates
• Our direct pooled corporate exposure is
highly rated and well protected
– 84.2% rated AAA
– Average credit enhancement (“CE”) of
30.7%,
• 9% expected to amortize by the end of
2013; 46% by the end of 2014; 74% by
the end of 2016
• Within our direct pooled corporate
exposure, our $5.2 billion of Trust
Preferred Securities (“TruPS”) CDO is
diversified by region and collateral type
– Includes more than 1,400 underlying
issuers
– All our exposure at the CDO level is to the
most senior debt tranche
– Weighted average rating of BB+, weighted
average adjusted CE2 of 36.1%
Direct Pooled Corporate Obligations
By Asset Class
As of June 30, 2013 ($ in billions)
$47.4 billion, AAA average rating
55%
6%
19% 7%
6%
4%
2% 1%
1
1. CLOs are collateralized loan obligations. CBOs are collateralized bond obligations.
2. Adjusted CE (Credit Enhancement) is the amount of collateral par above senior liabilities (and shown as a percentage of total collateral) with adjustments made for restructured
collateral (to reflect expected reduced cashflow) and for non-performing collateral; U.S. Mortgage & Real Estate TruPS CDOs also include an adjustment to reflect overhedging
and outstanding hedge termination payments obligations.
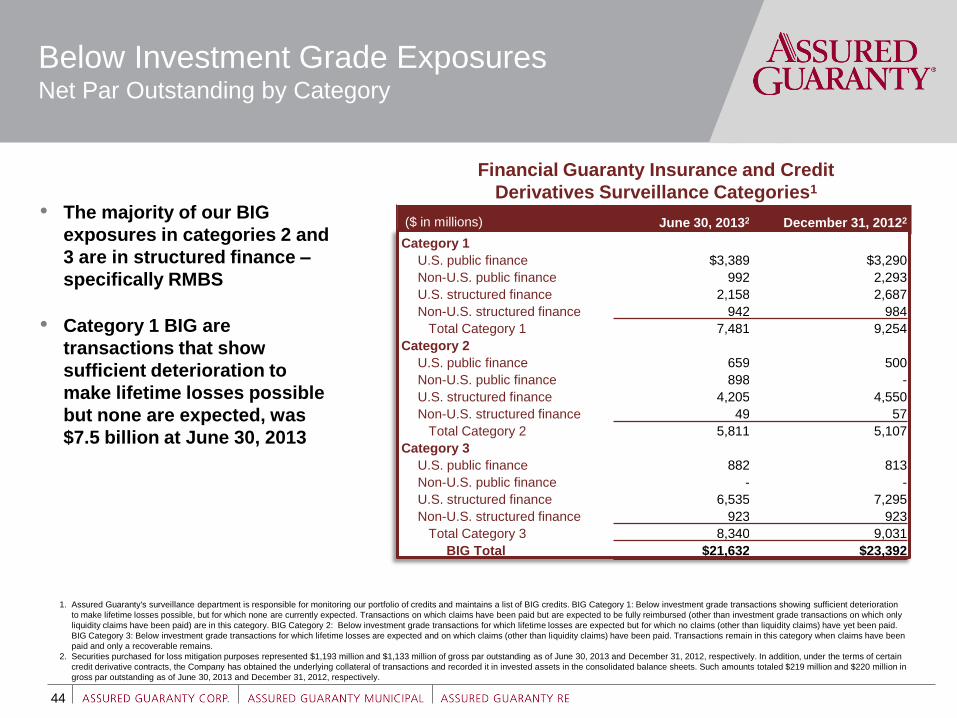
June 30, 20132 December 31, 20122
Category 1
U.S. public finance $3,389 $3,290
Non-U.S. public finance 992 2,293
U.S. structured finance 2,158 2,687
Non-U.S. structured finance 942 984
Total Category 1 7,481 9,254
Category 2
U.S. public finance 659 500
Non-U.S. public finance 898 -
U.S. structured finance 4,205 4,550
Non-U.S. structured finance 49 57
Total Category 2 5,811 5,107
Category 3
U.S. public finance 882 813
Non-U.S. public finance - -
U.S. structured finance 6,535 7,295
Non-U.S. structured finance 923 923
Total Category 3 8,340 9,031
BIG Total $21,632 $23,392
($ in millions)
Below Investment Grade Exposures Net Par Outstanding by Category
44
1. Assured Guaranty's surveillance department is responsible for monitoring our portfolio of credits and maintains a list of BIG credits. BIG Category 1: Below investment grade transactions showing sufficient deterioration
to make lifetime losses possible, but for which none are currently expected. Transactions on which claims have been paid but are expected to be fully reimbursed (other than investment grade transactions on which only
liquidity claims have been paid) are in this category. BIG Category 2: Below investment grade transactions for which lifetime losses are expected but for which no claims (other than liquidity claims) have yet been paid.
BIG Category 3: Below investment grade transactions for which lifetime losses are expected and on which claims (other than liquidity claims) have been paid. Transactions remain in this category when claims have been
paid and only a recoverable remains.
2. Securities purchased for loss mitigation purposes represented $1,193 million and $1,133 million of gross par outstanding as of June 30, 2013 and December 31, 2012, respectively. In addition, under the terms of certain
credit derivative contracts, the Company has obtained the underlying collateral of transactions and recorded it in invested assets in the consolidated balance sheets. Such amounts totaled $219 million and $220 million in
gross par outstanding as of June 30, 2013 and December 31, 2012, respectively.
• The majority of our BIG
exposures in categories 2 and
3 are in structured finance –
specifically RMBS
• Category 1 BIG are
transactions that show
sufficient deterioration to
make lifetime losses possible
but none are expected, was
$7.5 billion at June 30, 2013
Financial Guaranty Insurance and Credit
Derivatives Surveillance Categories1
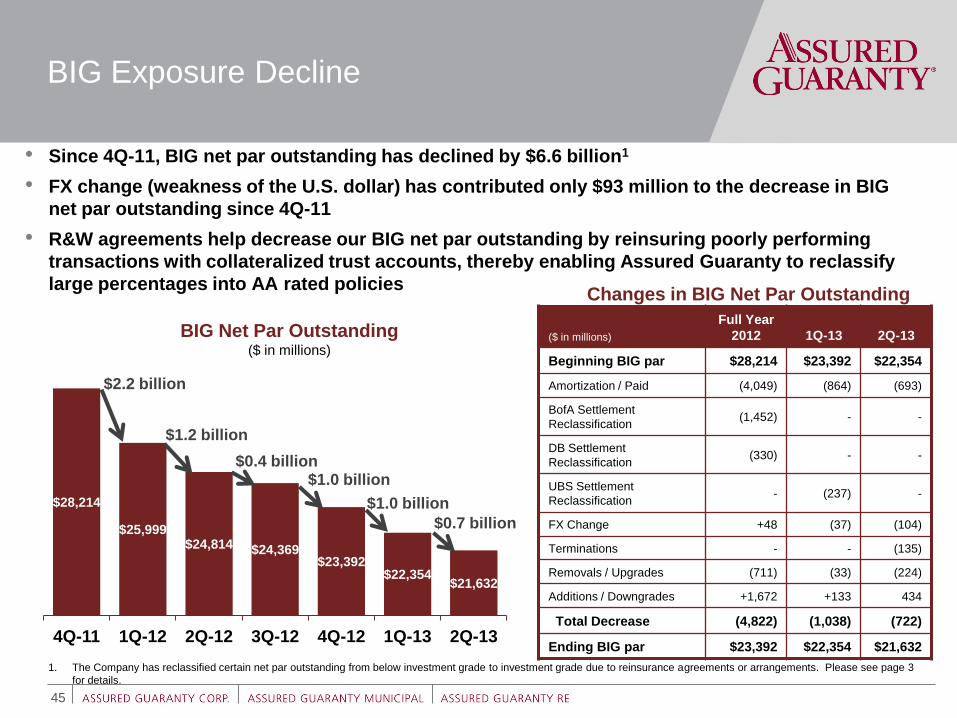
• Since 4Q-11, BIG net par outstanding has declined by $6.6 billion1
• FX change (weakness of the U.S. dollar) has contributed only $93 million to the decrease in BIG
net par outstanding since 4Q-11
• R&W agreements help decrease our BIG net par outstanding by reinsuring poorly performing
transactions with collateralized trust accounts, thereby enabling Assured Guaranty to reclassify
large percentages into AA rated policies
$28,214
$25,999 $24,814 $24,369
$23,392 $22,354
$21,632
4Q-11 1Q-12 2Q-12 3Q-12 4Q-12 1Q-13 2Q-13
BIG Exposure Decline
BIG Net Par Outstanding ($ in millions)
($ in millions)
Full Year
2012 1Q-13 2Q-13
Beginning BIG par $28,214 $23,392 $22,354
Amortization / Paid (4,049) (864) (693)
BofA Settlement
Reclassification (1,452) - -
DB Settlement
Reclassification (330) - -
UBS Settlement
Reclassification - (237) -
FX Change +48 (37) (104)
Terminations - - (135)
Removals / Upgrades (711) (33) (224)
Additions / Downgrades +1,672 +133 434
Total Decrease (4,822) (1,038) (722)
Ending BIG par $23,392 $22,354 $21,632
Changes in BIG Net Par Outstanding
45
$2.2 billion
$1.2 billion
$0.4 billion $1.0 billion
$1.0 billion
1. The Company has reclassified certain net par outstanding from below investment grade to investment grade due to reinsurance agreements or arrangements. Please see page 3
for details.
$0.7 billion
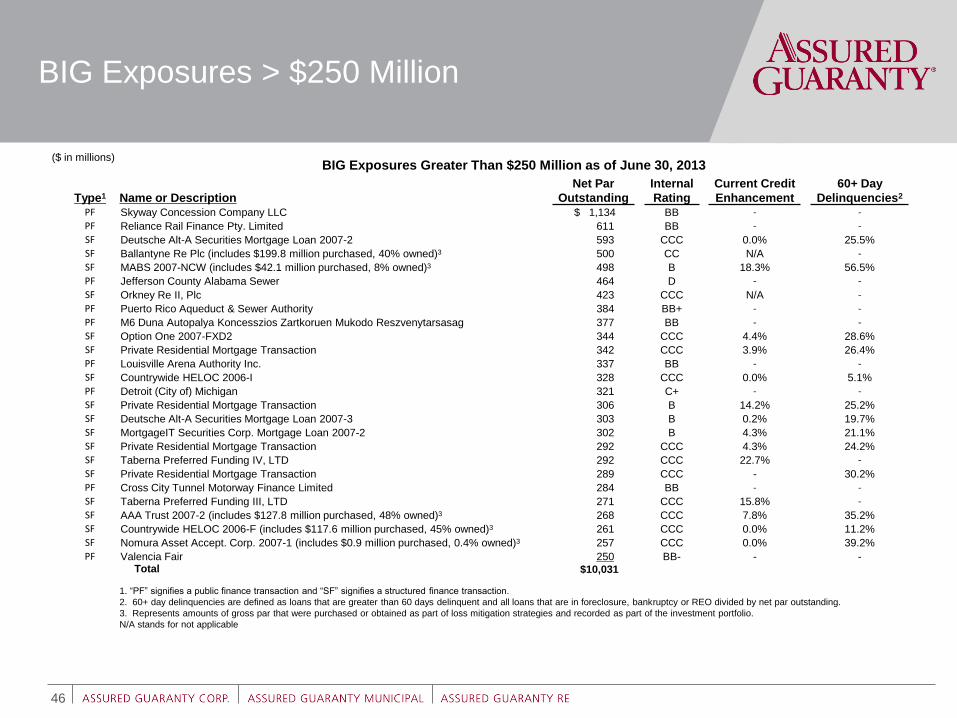
BIG Exposures Greater Than $250 Million as of June 30, 2013
Type1 Name or Description
Net Par
Outstanding
Internal
Rating
Current Credit
Enhancement
60+ Day
Delinquencies2 PF Skyway Concession Company LLC $ 1,134 BB - -
PF Reliance Rail Finance Pty. Limited 611 BB - -
SF Deutsche Alt-A Securities Mortgage Loan 2007-2 593 CCC 0.0% 25.5%
SF Ballantyne Re Plc (includes $199.8 million purchased, 40% owned)3 500 CC N/A -
SF MABS 2007-NCW (includes $42.1 million purchased, 8% owned)3 498 B 18.3% 56.5%
PF Jefferson County Alabama Sewer 464 D - -
SF Orkney Re II, Plc 423 CCC N/A -
PF Puerto Rico Aqueduct & Sewer Authority 384 BB+ - -
PF M6 Duna Autopalya Koncesszios Zartkoruen Mukodo Reszvenytarsasag 377 BB - -
SF Option One 2007-FXD2 344 CCC 4.4% 28.6%
SF Private Residential Mortgage Transaction 342 CCC 3.9% 26.4%
PF Louisville Arena Authority Inc. 337 BB - -
SF Countrywide HELOC 2006-I 328 CCC 0.0% 5.1%
PF Detroit (City of) Michigan 321 C+ - -
SF Private Residential Mortgage Transaction 306 B 14.2% 25.2%
SF Deutsche Alt-A Securities Mortgage Loan 2007-3 303 B 0.2% 19.7%
SF MortgageIT Securities Corp. Mortgage Loan 2007-2 302 B 4.3% 21.1%
SF Private Residential Mortgage Transaction 292 CCC 4.3% 24.2%
SF Taberna Preferred Funding IV, LTD 292 CCC 22.7% -
SF Private Residential Mortgage Transaction 289 CCC - 30.2%
PF Cross City Tunnel Motorway Finance Limited 284 BB - -
SF Taberna Preferred Funding III, LTD 271 CCC 15.8% -
SF AAA Trust 2007-2 (includes $127.8 million purchased, 48% owned)3 268 CCC 7.8% 35.2%
SF Countrywide HELOC 2006-F (includes $117.6 million purchased, 45% owned)3 261 CCC 0.0% 11.2%
SF Nomura Asset Accept. Corp. 2007-1 (includes $0.9 million purchased, 0.4% owned)3 257 CCC 0.0% 39.2%
PF Valencia Fair 250 BB- - - Total $10,031
1. “PF” signifies a public finance transaction and “SF” signifies a structured finance transaction.
2. 60+ day delinquencies are defined as loans that are greater than 60 days delinquent and all loans that are in foreclosure, bankruptcy or REO divided by net par outstanding.
3. Represents amounts of gross par that were purchased or obtained as part of loss mitigation strategies and recorded as part of the investment portfolio.
N/A stands for not applicable
($ in millions)
BIG Exposures > $250 Million
46

Appendix
$1,6
83
$1,6
20
$1,6
00
$1,4
10
$1,2
87
$1,2
47
$1,1
66
$1,1
51
$1,1
35
$1,1
25
$1,0
62
$1,0
74
$1,0
43
$1,0
14
$944
$805
$812
$777
$767
$737
$717
$692
$684
$720
$695
$672
$640
$621
$611
$554
$553
$569
$520
$495
$489
$509
$473
$444
$422
$374
$390
$330
$293
$277
$260
$306
$281
$269
$256
$254
$294
$270
$219
$198
5.6% 5.4% 5.4%
4.8% 4.5% 4.4%
4.2% 4.2% 4.2%
4.2%
4.1%
4.2% 4.2%
4.1% 4.0%
3.4%
3.5%
3.4%
3.5%
3.4%
3.4%
3.3% 3.3%
3.5%
3.4%
3.4%
3.4%
3.3%
3.3%
3.1% 3.1%
3.2%
3.0%
3.0%
3.0%
3.2% 3.0%
2.9% 2.8%
2.7%
2.9%
2.7% 2.6% 2.5%
2.4%
2.8%
2.7% 2.6%
2.5% 2.5%
3.0% 2.8%
2.4% 2.2%
Jan-0
9
Feb
-09
Mar-
09
Apr-
09
May-0
9
Jun-0
9
Jul-09
Aug-0
9
Sep-0
9
Oct-
09
Nov-0
9
Dec-0
9
Jan-1
0
Feb
-10
Mar-
10
Apr-
10
May-1
0
Jun-1
0
Jul-10
Aug-1
0
Sep-1
0
Oct-
10
Nov-1
0
Dec-1
0
Jan-1
1
Feb
-11
Mar-
11
Apr-
11
May-1
1
Jun-1
1
Jul-11
Aug-1
1
Sep-1
1
Oct-
11
Nov-1
1
Dec-1
1
Jan-1
2
Feb
-12
Mar-
12
Apr-
12
May-1
2
Jun-1
2
Jul-12
Aug-1
2
Sep-1
2
Oct-
12
Nov-1
2
Dec-1
2
Jan-1
3
Feb
-13
Mar-
13
Apr-
13
May-1
3
Jun-1
3
Option-ARMs 30-59 Days ($ in millions)
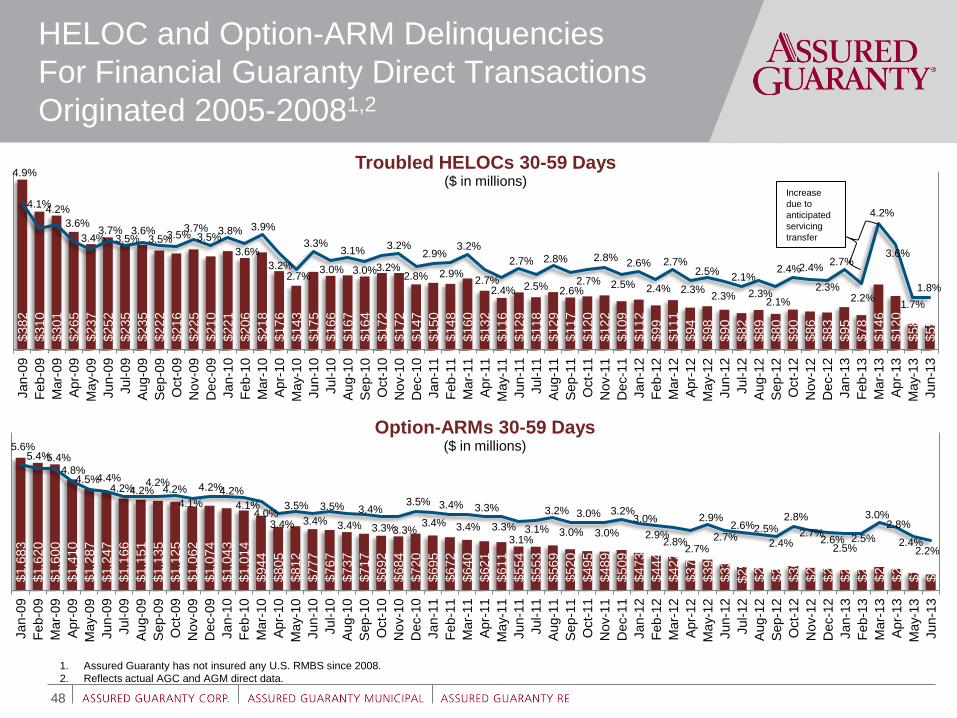
HELOC and Option-ARM Delinquencies
For Financial Guaranty Direct Transactions
Originated 2005-20081,2
48
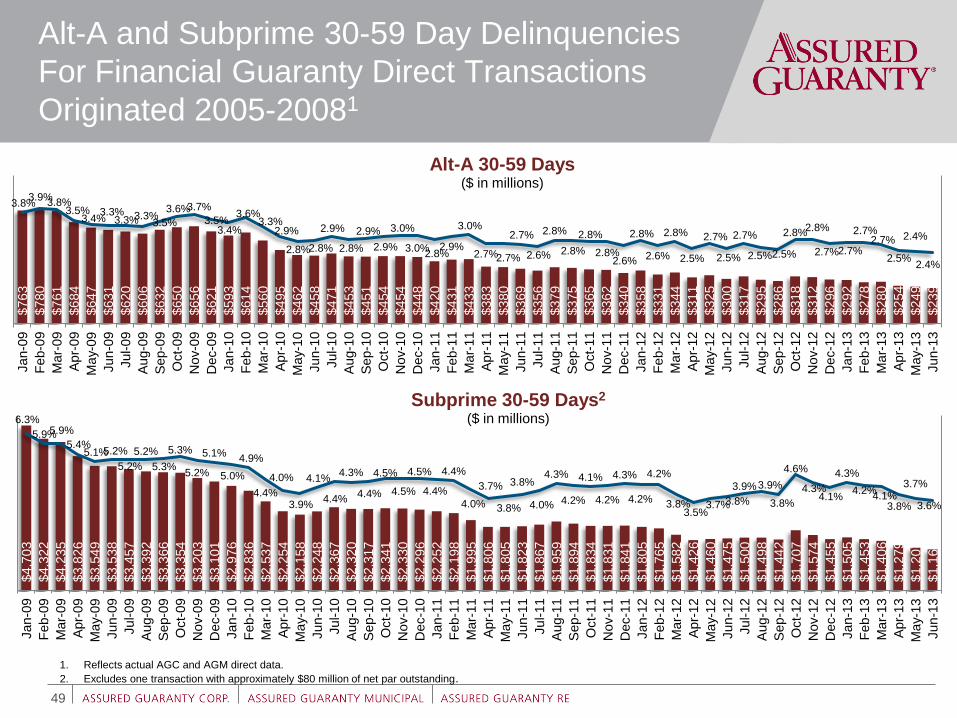
1. Assured Guaranty has not insured any U.S. RMBS since 2008.
2. Reflects actual AGC and AGM direct data.
$382
$310
$301
$265
$237
$252
$235
$235
$222
$216
$225
$210
$221
$206
$218
$176
$143
$175
$166
$167
$164
$172
$172
$147
$150
$148
$160
$132
$116
$129
$118
$129
$117
$120
$122
$109
$112
$99
$111
$94
$98
$90
$82
$89
$80
$90
$86
$83
$95
$78
$146
$120
$58
$55
4.9%
4.1% 4.2%
3.6%
3.4% 3.7%
3.5% 3.6%
3.5% 3.5% 3.7%
3.5% 3.8%
3.6%
3.9%
3.2% 2.7%
3.3%
3.0%
3.1%
3.0% 3.2%
3.2%
2.8%
2.9%
2.9%
3.2%
2.7% 2.4%
2.7%
2.5%
2.8%
2.6% 2.7%
2.8%
2.5%
2.6%
2.4%
2.7%
2.3%
2.5%
2.3%
2.1%
2.3% 2.1%
2.4% 2.4%
2.3%
2.7%
2.2%
4.2%
3.6%
1.7%
1.8%
Jan-0
9
Feb-0
9
Mar-
09
Apr-
09
May-0
9
Jun-0
9
Jul-09
Aug-0
9
Sep-0
9
Oct-
09
Nov-0
9
Dec-0
9
Jan-1
0
Feb-1
0
Mar-
10
Apr-
10
May-1
0
Jun-1
0
Jul-10
Aug-1
0
Sep-1
0
Oct-
10
Nov-1
0
Dec-1
0
Jan-1
1
Feb-1
1
Mar-
11
Apr-
11
May-1
1
Jun-1
1
Jul-11
Aug-1
1
Sep-1
1
Oct-
11
Nov-1
1
Dec-1
1
Jan-1
2
Feb-1
2
Mar-
12
Apr-
12
May-1
2
Jun-1
2
Jul-12
Aug-1
2
Sep-1
2
Oct-
12
Nov-1
2
Dec-1
2
Jan-1
3
Feb-1
3
Mar-
13
Apr-
13
May-1
3
Jun-1
3
Troubled HELOCs 30-59 Days ($ in millions)
Increase
due to
anticipated
servicing
transfer
$4,7
03
$4,3
22
$4,2
35
$3,8
26
$3,5
49
$3,5
38
$3,4
57
$3,3
92
$3,3
66
$3,3
54
$3,2
03
$3,1
01
$2,9
76
$2,8
36
$2,5
37
$2,2
54
$2,1
58
$2,2
48
$2,3
67
$2,3
20
$2,3
17
$2,3
41
$2,3
30
$2,2
96
$2,2
52
$2,1
98
$1,9
95
$1,8
06
$1,8
05
$1,8
23
$1,8
67
$1,9
59
$1,8
94
$1,8
34
$1,8
31
$1,8
41
$1,8
05
$1,7
65
$1,5
82
$1,4
26
$1,4
60
$1,4
75
$1,5
00
$1,4
98
$1,4
42
$1,7
07
$1,5
74
$1,4
55
$1,5
05
$1,4
53
$1,4
06
$1,2
79
$1,2
07
$1,1
62
6.3%
5.9% 5.9%
5.4% 5.1% 5.2%
5.2%
5.2%
5.3%
5.3%
5.2%
5.1%
5.0%
4.9%
4.4%
4.0%
3.9%
4.1%
4.4%
4.3%
4.4%
4.5%
4.5%
4.5%
4.4%
4.4%
4.0%
3.7%
3.8%
3.8%
4.0%
4.3%
4.2%
4.1%
4.2%
4.3%
4.2%
4.2%
3.8% 3.5%
3.7% 3.8%
3.9% 3.9%
3.8%
4.6%
4.3% 4.1%
4.3%
4.2% 4.1%
3.8%
3.7%
3.6%
Jan-0
9
Feb-0
9
Mar-
09
Apr-
09
May-0
9
Jun-0
9
Jul-09
Aug-0
9
Se
p-0
9
Oct-
09
Nov-0
9
Dec-0
9
Jan-1
0
Feb-1
0
Mar-
10
Apr-
10
May-1
0
Jun-1
0
Jul-10
Aug-1
0
Se
p-1
0
Oct-
10
Nov-1
0
Dec-1
0
Jan-1
1
Feb-1
1
Mar-
11
Apr-
11
May-1
1
Jun-1
1
Jul-11
Aug-1
1
Sep-1
1
Oct-
11
Nov-1
1
Dec-1
1
Jan-1
2
Feb-1
2
Mar-
12
Apr-
12
May-1
2
Jun-1
2
Jul-12
Aug-1
2
Sep-1
2
Oct-
12
Nov-1
2
Dec-1
2
Jan-1
3
Feb-1
3
Mar-
13
Apr-
13
May-1
3
Jun-1
3
Subprime 30-59 Days2 ($ in millions)
Alt-A and Subprime 30-59 Day Delinquencies
For Financial Guaranty Direct Transactions
Originated 2005-20081
49
$7
63
$7
80
$7
61
$6
84
$6
47
$6
31
$6
20
$6
06
$6
32
$6
50
$6
56
$6
21
$5
93
$6
14
$560
$4
95
$4
62
$4
58
$4
71
$4
53
$4
51
$4
54
$4
54
$4
48
$4
20
$4
31
$4
33
$3
83
$3
80
$369
$3
56
$3
79
$3
75
$3
65
$3
62
$3
40
$3
58
$3
31
$3
44
$3
11
$3
25
$3
00
$3
17
$2
95
$2
86
$318
$3
12
$2
96
$2
92
$2
78
$2
80
$2
54
$2
49
$2
39
3.8% 3.9%
3.8% 3.5%
3.4% 3.3%
3.3% 3.3% 3.5%
3.6% 3.7%
3.5% 3.4%
3.6% 3.3%
2.9%
2.8% 2.8%
2.9%
2.8%
2.9%
2.9%
3.0%
3.0% 2.8%
2.9%
3.0%
2.7% 2.7%
2.7%
2.6%
2.8%
2.8%
2.8%
2.8% 2.6%
2.8%
2.6%
2.8%
2.5%
2.7%
2.5%
2.7%
2.5% 2.5%
2.8% 2.8%
2.7% 2.7%
2.7% 2.7%
2.5%
2.4%
2.4%
Jan-0
9
Feb-0
9
Mar-
09
Apr-
09
May-0
9
Jun-0
9
Jul-09
Aug-0
9
Sep-0
9
Oct-
09
Nov-0
9
Dec-0
9
Jan-1
0
Feb-1
0
Mar-
10
Apr-
10
May-1
0
Jun-1
0
Jul-10
Aug-1
0
Sep-1
0
Oct-
10
Nov-1
0
Dec-1
0
Jan-1
1
Feb-1
1
Mar-
11
Apr-
11
May-1
1
Jun-1
1
Jul-11
Aug-1
1
Sep-1
1
Oct-
11
Nov-1
1
Dec-1
1
Jan-1
2
Feb-1
2
Mar-
12
Apr-
12
May-1
2
Jun-1
2
Jul-12
Aug-1
2
Sep-1
2
Oct-
12
Nov-1
2
Dec-1
2
Jan-1
3
Feb-1
3
Mar-
13
Apr-
13
May-1
3
Jun-1
3
Alt-A 30-59 Days ($ in millions)
1. Reflects actual AGC and AGM direct data.
2. Excludes one transaction with approximately $80 million of net par outstanding.
Appendix Explanation of Non-GAAP Financial Measures
50
Endnotes related to non-GAAP financial measures discussed in the presentation:
The Company references financial measures that are not in accordance with GAAP. Assured Guaranty’s management and board of directors utilize non-GAAP measures in evaluating
the Company’s financial performance and as a basis for determining senior management incentive compensation. By providing these non-GAAP financial measures, investors,
analysts and financial news reporters have access to the same information that management reviews internally. In addition, Assured Guaranty’s presentation of non-GAAP financial
measures is consistent with how analysts calculate their estimates of Assured Guaranty’s financial results in their research reports on Assured Guaranty and with how investors,
analysts and the financial news media evaluate Assured Guaranty’s financial results.
The following paragraphs define each non-GAAP financial measure and describe why it is useful. A reconciliation of the non-GAAP financial measure and the most directly comparable
GAAP financial measure, if available, is presented within this presentation. Non-GAAP financial measures should not be viewed as substitutes for their most directly comparable GAAP
measures.
Operating Income: Management believes that operating income is a useful measure because it clarifies the understanding of the underwriting results of the Company’s financial
guaranty insurance business, and also includes financing costs and net investment income, and enables investors and analysts to evaluate the Company’s financial results as
compared with the consensus analyst estimates distributed publicly by financial databases. Operating income is defined as net income (loss) attributable to Assured Guaranty Ltd., as
reported under GAAP, adjusted for the following:
1. Elimination of the after-tax realized gains (losses) on the Company’s investments, except for gains and losses on securities classified as trading. The timing of realized gains and
losses, which depends largely on market credit cycles, can vary considerably across periods. The timing of sales is largely subject to the Company’s discretion and influenced by
market opportunities, as well as the Company’s tax and capital profile. Trends in the underlying profitability of the Company’s business can be more clearly identified without the
fluctuating effects of these transactions.
2. Elimination of the after-tax non-credit-impairment unrealized fair value gains (losses) on credit derivatives, which is the amount in excess of the present value of the expected
estimated economic credit losses and non-economic payments. Such fair value adjustments are heavily affected by, and in part fluctuate with, changes in market interest rates,
credit spreads and other market factors and are not expected to result in an economic gain or loss. Additionally, such adjustments present all financial guaranty contracts on a
more consistent basis of accounting, whether or not they are subject to derivative accounting rules.
3. Elimination of the after-tax fair value gains (losses) on the Company’s committed capital securities. Such amounts are heavily affected by, and in part fluctuate with, changes in
market interest rates, credit spreads and other market factors and are not expected to result in an economic gain or loss.
4. Elimination of the after-tax foreign exchange gains (losses) on remeasurement of net premium receivables and loss and LAE reserves. Long-dated receivables constitute a
significant portion of the net premium receivable balance and represent the present value of future contractual or expected collections. Therefore, the current period’s foreign
exchange remeasurement gains (losses) are not necessarily indicative of the total foreign exchange gains (losses) that the Company will ultimately recognize.
5. Elimination of the effects of consolidating FG VIEs in order to present all financial guaranty contracts on a more consistent basis of accounting, whether or not GAAP requires
consolidation. GAAP requires the Company to consolidate certain VIEs that have issued debt obligations insured by the Company even though the Company does not own such
VIEs.
Appendix (Cont’d) Explanation of Non-GAAP Financial Measures
51
Operating Shareholders’ Equity: Management believes that operating shareholders’ equity is a useful measure because it presents the equity of Assured Guaranty Ltd. with all
financial guaranty contracts accounted for on a more consistent basis and excludes fair value adjustments that are not expected to result in economic loss. Many investors, analysts
and financial news reporters use operating shareholders’ equity as the principal financial measure for valuing Assured Guaranty Ltd.’s current share price or projected share price and
also as the basis of their decision to recommend, buy or sell Assured Guaranty Ltd.’s common shares. Many of the Company’s fixed income investors also use operating shareholders’
equity to evaluate the Company’s capital adequacy. Operating shareholders’ equity is the basis of the calculation of adjusted book value (see below). Operating shareholders’ equity is
defined as shareholders’ equity attributable to Assured Guaranty Ltd., as reported under GAAP, adjusted for the following:
1. Elimination of the effects of consolidating FG VIEs in order to present all financial guaranty contracts on a more consistent basis of accounting, whether or not GAAP requires
consolidation. GAAP requires the Company to consolidate certain VIEs that have issued debt obligations insured by the Company even though the Company does not own such
VIEs.
2. Elimination of the after-tax non-credit-impairment unrealized fair value gains (losses) on credit derivatives, which is the amount in excess of the present value of the expected
estimated economic credit losses and non-economic payments. Such fair value adjustments are heavily affected by, and in part fluctuate with, changes in market interest rates,
credit spreads and other market factors and are not expected to result in an economic gain or loss.
3. Elimination of the after-tax fair value gains (losses) on the Company’s committed capital securities. Such amounts are heavily affected by, and in part fluctuate with, changes in
market interest rates, credit spreads and other market factors and are not expected to result in an economic gain or loss.
4. Elimination of the after-tax unrealized gains (losses) on the Company’s investments that are recorded as a component of accumulated other comprehensive income (“AOCI”)
(excluding foreign exchange remeasurement ). The AOCI component of the fair value adjustment on the investment portfolio is not deemed economic because the Company
generally holds these investments to maturity and therefore should not recognize an economic gain or loss.
Operating return on equity (‘‘Operating ROE’’): Operating ROE represents operating income for a specified period divided by the average of operating shareholders’ equity at the
beginning and the end of that period. Management believes that operating ROE is a useful measure to evaluate the Company’s return on invested capital. Many investors, analysts and
members of the financial news media use operating ROE to evaluate Assured Guaranty Ltd.’s share price and as the basis of their decision to recommend, buy or sell the Assured
Guaranty Ltd. common shares. Quarterly and year-to-date operating ROE are calculated on an annualized basis.
Appendix (Cont’d) Explanation of Non-GAAP Financial Measures
52
Adjusted Book Value: Management believes that adjusted book value is a useful measure because it enables an evaluation of the net present value of the Company’s in-force
premiums and revenues in addition to operating shareholders’ equity. The premiums and revenues included in adjusted book value will be earned in future periods, but actual earnings
may differ materially from the estimated amounts used in determining current adjusted book value due to changes in foreign exchange rates, prepayment speeds, terminations, credit
defaults and other factors. Many investors, analysts and financial news reporters use adjusted book value to evaluate Assured Guaranty Ltd.’s share price and as the basis of their
decision to recommend, buy or sell the Assured Guaranty Ltd. common shares. Adjusted book value is operating shareholders’ equity, as defined above, further adjusted for the
following:
1. Elimination of after-tax deferred acquisition costs, net. These amounts represent net deferred expenses that have already been paid or accrued and will be expensed in future
accounting periods.
2. Addition of the after-tax net present value of estimated net future credit derivative revenue. See below.
3. Addition of the after-tax value of the unearned premium reserve on financial guaranty contracts in excess of expected loss to be expensed, net of reinsurance. This amount
represents the expected future net earned premiums, net of expected losses to be expensed. Net expected losses to be expensed are not reflected in GAAP equity.
Net present value of estimated net future credit derivative revenue: Management believes that this amount is a useful measure because it enables an evaluation of the value of
future estimated credit derivative revenue. There is no corresponding GAAP financial measure. This amount represents the present value of estimated future revenue from the
Company’s credit derivative in-force book of business, net of reinsurance, ceding commissions and premium taxes for contracts without expected economic losses, and is discounted
at 6%. Estimated net future credit derivative revenue may change from period to period due to changes in foreign exchange rates, prepayment speeds, terminations, credit defaults or
other factors that affect par outstanding or the ultimate maturity of an obligation.
PVP or present value of new business production: Management believes that PVP is a useful measure because it enables the evaluation of the value of new business production
for Assured Guaranty by taking into account the value of estimated future installment premiums on all new contracts underwritten in a reporting period as well as premium supplements
and additional installment premium on existing contracts as to which the issuer has the right to call the insured obligation but has not exercised such right, whether in insurance or
credit derivative contract form, which GAAP gross premiums written and the net credit derivative premiums received and receivable portion of net realized gains and other settlement
on credit derivatives (“Credit Derivative Revenues”) do not adequately measure. PVP in respect of financial guaranty contracts written in a specified period is defined as gross upfront
and installment premiums received and the present value of gross estimated future installment premiums, in each case, discounted at 6%. For purposes of the PVP calculation,
management discounts estimated future installment premiums on insurance contracts at 6%, while under GAAP, these amounts are discounted at a risk-free rate. Additionally, under
GAAP, management records future installment premiums on financial guaranty insurance contracts covering non-homogeneous pools of assets based on the contractual term of the
transaction, whereas for PVP purposes, management records an estimate of the future installment premiums the Company expects to receive, which may be based upon a shorter
period of time than the contractual term of the transaction. Actual future net earned or written premiums and Credit Derivative Revenues may differ from PVP due to factors including,
but not limited to, changes in foreign exchange rates, prepayment speeds, terminations, credit defaults, or other factors that affect par outstanding or the ultimate maturity of an
obligation.
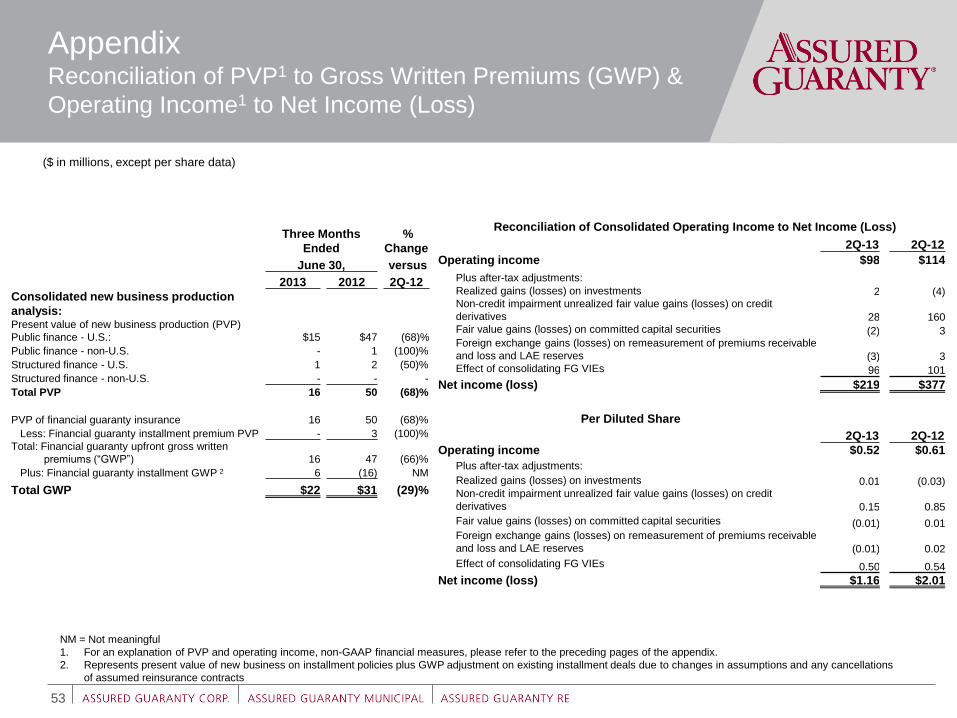
Three Months
Ended
%
Change
June 30, versus
2013 2012 2Q-12
Consolidated new business production
analysis:
Present value of new business production (PVP)
Public finance - U.S.: $15 $47 (68)%
Public finance - non-U.S. - 1 (100)%
Structured finance - U.S. 1 2 (50)%
Structured finance - non-U.S. - - -
Total PVP 16 50 (68)%
PVP of financial guaranty insurance 16 50 (68)%
Less: Financial guaranty installment premium PVP - 3 (100)%
Total: Financial guaranty upfront gross written
premiums (“GWP”) 16 47 (66)%
Plus: Financial guaranty installment GWP 2 6 (16) NM
Total GWP $22 $31 (29)%
53
Appendix Reconciliation of PVP1 to Gross Written Premiums (GWP) &
Operating Income1 to Net Income (Loss)
NM = Not meaningful
1. For an explanation of PVP and operating income, non-GAAP financial measures, please refer to the preceding pages of the appendix.
2. Represents present value of new business on installment policies plus GWP adjustment on existing installment deals due to changes in assumptions and any cancellations
of assumed reinsurance contracts
($ in millions, except per share data)
Reconciliation of Consolidated Operating Income to Net Income (Loss)
2Q-13 2Q-12
Operating income $98 $114
Plus after-tax adjustments:
Realized gains (losses) on investments 2 (4) Non-credit impairment unrealized fair value gains (losses) on credit
derivatives 28 160 Fair value gains (losses) on committed capital securities (2) 3 Foreign exchange gains (losses) on remeasurement of premiums receivable
and loss and LAE reserves (3) 3 Effect of consolidating FG VIEs 96 101
Net income (loss) $219 $377
Per Diluted Share
2Q-13 2Q-12
Operating income $0.52 $0.61
Plus after-tax adjustments:
Realized gains (losses) on investments 0.01 (0.03) Non-credit impairment unrealized fair value gains (losses) on credit
derivatives
0.15
0.85
Fair value gains (losses) on committed capital securities (0.01) 0.01 Foreign exchange gains (losses) on remeasurement of premiums receivable
and loss and LAE reserves (0.01) 0.02
Effect of consolidating FG VIEs 0.50 0.54
Net income (loss) $1.16 $2.01
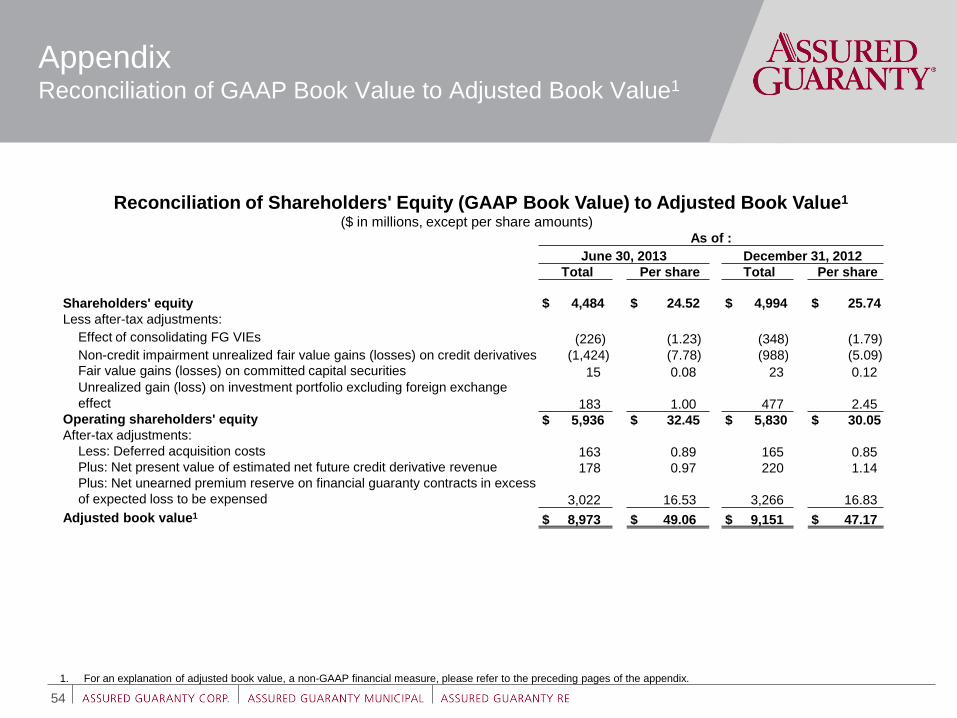
54
Appendix Reconciliation of GAAP Book Value to Adjusted Book Value1
Reconciliation of Shareholders' Equity (GAAP Book Value) to Adjusted Book Value1 ($ in millions, except per share amounts)
As of :
June 30, 2013 December 31, 2012
Total Per share Total Per share
Shareholders' equity $ 4,484 $ 24.52 $ 4,994 $ 25.74
Less after-tax adjustments:
Effect of consolidating FG VIEs (226) (1.23) (348) (1.79)
Non-credit impairment unrealized fair value gains (losses) on credit derivatives (1,424) (7.78) (988) (5.09)
Fair value gains (losses) on committed capital securities 15 0.08 23 0.12 Unrealized gain (loss) on investment portfolio excluding foreign exchange
effect 183 1.00 477 2.45 Operating shareholders' equity $ 5,936 $ 32.45 $ 5,830 $ 30.05 After-tax adjustments:
Less: Deferred acquisition costs 163 0.89 165 0.85 Plus: Net present value of estimated net future credit derivative revenue 178 0.97 220 1.14 Plus: Net unearned premium reserve on financial guaranty contracts in excess
of expected loss to be expensed 3,022 16.53 3,266 16.83
Adjusted book value1 $ 8,973 $ 49.06 $ 9,151 $ 47.17
1. For an explanation of adjusted book value, a non-GAAP financial measure, please refer to the preceding pages of the appendix.

Assured Guaranty Contacts:
Robert Tucker
Managing Director, Investor Relations and Corporate Communications
Direct: 212.339.0861
Ross Aron
Vice President, Equity Investor Relations
Direct: 212.261.5509
Equity Investor Presentation
June 30, 2013