association of kenya insurers...7 foreword matthew koech aki chairman welcome to the 2019 edition of...
TRANSCRIPT

1
Association of Kenya Insurers 2019 Insurance Industry Report
—
日期

2
Protecting, promoting and advancing
the common interests of members of
the Association;
Promoting agreement and co-
operation among its members of
mutual interest and providing
machinery for the examination and
reconciliation of any differences;
General advancement of insurance
business and promoting knowledge
and a clearer understanding of
insurance among all sections of the
community;
Gathering and collating data,
information and market-wide
statistics from members of the
Association and other jurisdictions,
for the purpose of determining
market trends and satisfying any
other requirements set by the Board
from time to time;
Consulting and co-operating with
other associations or similar bodies
within and outside Kenya in regard to
matters of mutual interest and if
deemed necessary obtaining
affiliation with such associations;
Managing assets and funds realized
from contributions by members and
out of investments for the benefit of
the members.
About AKI
AKI’s Vision To be the leader in championing
insurance growth and excellence
in Kenya and beyond.
AKI’s Mission To champion an enabling
environment for our members,
and promote growth and
excellence in the insurance
industry.
Our Values
What we want to be
What we believe in
— Honesty and confidentiality — Professionalism — Flexibility — Creativity — Teamwork
Our purpose
Our Roles

3
Table of Contents 1. Global Economic Overview ....................................................................................... 8
Global Macroeconomic Performance ............................................................................................................................... 9
Global Non-Life Insurance Outlook ................................................................................................................................ 10
Global Life Insurance Outlook ........................................................................................................................................ 11
Global Insurance Trends ................................................................................................................................................ 12
Localising the Global Trends .......................................................................................................................................... 13
IFRS 17 Update ........................................................................................................................................................... 13
COVID-19: The New Reality ........................................................................................................................................... 15
2. Africa’s Economic Overview .................................................................................... 17
Africa’s Macroeconomic Performance ............................................................................................................................ 18
Overview of Africa’s Insurance Market ........................................................................................................................... 20
3. East Africa’s Economic Overview ............................................................................ 21
Overview of East Africa’s Insurance Market ................................................................................................................... 24
Legislative Changes ....................................................................................................................................................... 25
4. Kenya’s Economic Overview ................................................................................... 26
Kenya’s Economic Overview .......................................................................................................................................... 27
Kenya Insurance Outlook ............................................................................................................................................... 28
Legislative Changes 2019 .............................................................................................................................................. 29
5. Kenya’s Insurance Industry Performance ................................................................ 30
Industry Performance – At a Glance .............................................................................................................................. 31
Kenya’s Insurance Market .............................................................................................................................................. 32
Non-Life Insurance ......................................................................................................................................................... 37
Life Insurance ................................................................................................................................................................. 72
Micro Insurance .............................................................................................................................................................. 96
6. Appendixes ............................................................................................................. 98
Appendix I: Detailed Industry Statement of Comprehensive Income, 2019 in KES ‘000 ............................................... 99
Appendix II: Detailed Industry Statement of Financial Position, 2019 in KES ‘000 ...................................................... 103
AKI Members 2019 ...................................................................................................... 104
Associate Members ..................................................................................................... 106
Other Key Stakeholders ............................................................................................... 106
4
List of Figures
Figure 1: Trend of Real GDP Growth (Annual percent change) ................................................................................................ 9 Figure 2: Life and Non-Life Premium Growth Rate, 2019 ......................................................................................................... 9 Figure 3: Africa's Economic Growth ......................................................................................................................................... 18 Figure 4: GDP Growth in East Africa, by Country, 2017- 2021 (Pre-Covid 19) ....................................................................... 22 Figure 5: Penetration Rate 2019 .............................................................................................................................................. 24 Figure 6: Proportion of Life to Non-Life Business, East Africa ................................................................................................. 24 Figure 7: Kenyan Insurers with Presence in other Countries in 2019 ...................................................................................... 32 Figure 8: Gross Written Premium Trend for Life and Non-Life Combined, KES in Billions ..................................................... 33 Figure 9: Insurance Performance Relative to Gross Domestic Product .................................................................................. 34 Figure 10: Industry Statement of Comprehensive Income, KES in Billions: ............................................................................ 35 Figure 11: Industry Statement of Financial Position, KES in Billions ....................................................................................... 36 Figure 12: Non-life GWP Market Share and Percentage Growth ............................................................................................ 39 Figure 13: Gross Premium CAGR Percentage Growth for the Last 5 Years (2015-2019) ...................................................... 40 Figure 14: Motor Gross Written Premium Trend (2015 – 2019), KES ‘000 ............................................................................. 43 Figure 15: Proportion of Fire domestic and Fire industrial GWP ............................................................................................. 46 Figure 16: Fire Insurance Gross Written Premium, 2015-2019 in KES ‘000 ........................................................................... 46 Figure 17: Medical Insurance Gross Written Premium (2015-2019), KES ‘000 ....................................................................... 49 Figure 18: GWP Trend for Aviation Insurance (2015 – 2019), KES ’000 ................................................................................. 50 Figure 19: GWP Trend for Engineering Insurance (2015 – 2019), KES ‘000 .......................................................................... 51 Figure 20: GWP Trend for Public Liability Insurance (2015 – 2019), KES ‘000 ....................................................................... 52 Figure 21: GWP Trend for Marine Insurance (2015 – 2019), KES ‘000 .................................................................................. 53 Figure 22: GWP Trend for Theft Insurance (2015 – 2019), KES ‘000 ..................................................................................... 54 Figure 23: GWP Trend for Personal Accident Insurance (2015 – 2019), KES ‘000 ................................................................ 55 Figure 24: GWP Trend for WIBA (2015 – 2019), KES ‘000 ..................................................................................................... 56 Figure 25: GWP Trend for Miscellaneous Insurance (2015 – 2019), KES ‘000 ...................................................................... 57 Figure 26: 2019 Agriculture GWP and Claims Incurred in KES ............................................................................................... 58 Figure 27: Agriculture Insurance Loss Ratio per Company ..................................................................................................... 58 Figure 28: Net Claims Incurred per Class, 2019 in KES ‘000 .................................................................................................. 60 Figure 29: Non-Life Expenses per Company, 2019 in KES ‘000 ............................................................................................. 62 Figure 30: Underwriting Profit/Loss per Class of Insurance, in KES’000’ ............................................................................... 64 Figure 31: Reinsurance Premium Ceded per Class, 2019 in KES .......................................................................................... 66 Figure 32: Summary of Revenue Growth, 2015-2019 in KES ’Billions .................................................................................... 68 Figure 33: Gross Written Premium Trend, Life Insurance 2015 – 2019, in KES ’000’ ............................................................ 73 Figure 34: Life Insurance Gross Written Premium Distribution, 2019, in KES ’000’ ............................................................... 73 Figure 35: Life Insurance Market Share per Class, 2019 ........................................................................................................ 74 Figure 36: Ordinary Life Gross Written Premiums, 2015-2019, in KES ’000’ .......................................................................... 75 Figure 37: Ordinary Life Gross Written Premium Market Share per Company, 2019 .............................................................. 77 Figure 38: Growth in Investment/United Linked Contracts Contributions, 2015-2019, in KES ’000’ ....................................... 79 Figure 39: Composition of Ordinary Life, 2019 ........................................................................................................................ 81 Figure 40: Gross Written Premium in Group Life, 2015-2019, in KES ’000 ............................................................................. 82 Figure 41: Annual Group Life Premium Growth Rate, 2015-2019 ........................................................................................... 83 Figure 42: Group Life Gross Written Premium and Market Share per Company .................................................................... 84 Figure 43: Composition of Group Life, 2019 ............................................................................................................................ 84 Figure 44: Growth in Deposit Administration Contributions, 2015-2019, in KES ’000’ ............................................................ 86 Figure 45: Deposit Administration/ Pension Gross Premium % Market Share, 2019 ............................................................. 87 Figure 46: Composition of Deposit Administration/ Pension, 2019 .......................................................................................... 88 Figure 47: Deposit Administration Average Net Interest Rates Declared, 2015-2019 ............................................................. 90 Figure 48: Claims and Benefits Paid, 2015-2019, in KES Billions ........................................................................................... 93 Figure 49: Total Expenses for Ordinary and Group Life, 2015-2019, in KES ’000’ ................................................................. 94 Figure 50: Group and Ordinary Life Total Commissions Paid/due, in KES ‘000’ ..................................................................... 95 Figure 51: Micro Insurance GWP Trend Analysis .................................................................................................................... 96 Figure 52: Micro Insurance Premium and Claims per Company, 2019 in KES ....................................................................... 96

5
List of Tables
Table 1: Government Debt in the East Africa Region, by Country 2019 .................................................................................. 23 Table 2: Kenya Insurance Industry Players ............................................................................................................................. 32 Table 3: Insurance Performance Relative to Gross Domestic Product, KES in Billions .......................................................... 33 Table 4: Summary of Industry Statement of Comprehensive Income, KES in Billions ............................................................ 35 Table 5: Summary of Industry Statement of Financial Position, KES in Billions ...................................................................... 36 Table 6: Premium Distribution per Class of Business, KES “000” ........................................................................................... 37 Table 7: Non-Life Insurance Premium Growth and Market Share per Company, 2017-2019 in ‘000’ KES............................. 38 Table 8: Premium Growth per Class for Non-Life Business .................................................................................................... 40 Table 9: Gross Premium Per Company Per Class, ‘000’KES .................................................................................................. 41 Table 10: Performance per Class for Non-Life Business, 2019 in KES ‘000 ........................................................................... 42 Table 11: Motor Commercial Performance Summary, 2019 in ‘000’ KES ............................................................................... 44 Table 12: Motor Private Performance Summary, 2019 in ‘000’ KES ....................................................................................... 45 Table 13: Performance Summary for Fire Domestic Insurance, 2019 in KES ‘000 ................................................................. 47 Table 14: Performance Summary for Fire Industrial Insurance, 2019 in KES ‘000 ................................................................. 48 Table 15: Medical Insurance Performance, 2019 in KES ‘000 ............................................................................................... 49 Table 16: Aviation Insurance Performance, 2019 in KES ‘000 ................................................................................................ 50 Table 17: Engineering Insurance Performance, 2019 in KES ‘000 .......................................................................................... 51 Table 18: Public Liability Insurance Performance, 2019 in KES ‘000 ...................................................................................... 52 Table 19: Marine Insurance Performance, 2019 in KES ‘000 .................................................................................................. 53 Table 20: Theft Insurance Performance, 2019 in KES ‘000 ..................................................................................................... 54 Table 21: Personal Accident Insurance Performance, 2019 in KES ‘000 ................................................................................ 55 Table 22: WIBA Insurance Performance, 2019 in KES ‘000’ ................................................................................................... 56 Table 23: Miscellaneous Insurance Performance, 2019 in KES ‘000 ...................................................................................... 57 Table 24: Agriculture Insurance Statistics per company, 2019 in KES ‘000 ............................................................................ 59 Table 25: Net Claims Incurred per Company per Class, 2019 in KES ‘000’ ............................................................................ 61 Table 26: Expenses per Company per Class, 2019 in KES’000’ ............................................................................................. 63 Table 27: Underwriting Profit/Loss per Class per Company, 2019 in KES’000’ ...................................................................... 65 Table 28: Reinsurance Premium Ceded per Class, 2019 in KES ’000’ .................................................................................. 66 Table 29: Premium Ceded per Company per Class, 2019 in KES’000’ ................................................................................... 67 Table 30: Summary of Revenue Accounts per Class of Insurance, 2019 ............................................................................... 68 Table 31: Technical Loss Ratio per Class, 2019 ..................................................................................................................... 69 Table 32: Expense Ratio per Class, 2019 .............................................................................................................................. 69 Table 33: Combined Ratio per Class of Insurance, 2019 ........................................................................................................ 70 Table 34: Industry Funding Ratio/Surplus Ratio, in’000’ KES.................................................................................................. 70 Table 35: Change in Product Mix per Class, 2019 in KES ‘000 ............................................................................................... 71 Table 36: Gross Written Premium and Growth Rates for Life Insurance, 2015 –2019, in KES ’000’ ...................................... 73 Table 37: Gross Written Premium and Market Share for Life Insurance, 2015- 2019, in KES ’000’ ....................................... 74 Table 38: Ordinary Life GWP and Market Share per Company, 2015-2019, in KES ’000’ ...................................................... 76 Table 39: Ordinary Life Investment Income and Expenses per Company, 2019, in KES ’000’ .............................................. 78 Table 40: Contributions and Market Share per Company, 2015-2019, in KES ’000’ ............................................................... 80 Table 41: Fund Size and Market Share, 2015 – 2019, in KES ’000’........................................................................................ 80 Table 42: Group Life Gross Written Premium and Market Share, 2015-2019, in KES ’000’ ................................................... 83 Table 43: Group Life Investment Income and Expenses, 2019, in KES ’000’ ........................................................................ 85 Table 44: Deposit Admin/Pension Contribution and Market Share per Co., 2015-2019, in KES ’000’ .................................... 87 Table 45: Deposit Admin/Pension: Interest Rates, Fund Size, Surrenders/Annuities Paid, in KES ’000’ ................................ 89 Table 46: Average performance of other investments in the market, 2019 ............................................................................. 90 Table 47: Growth in Fund Size per Company, 2015-2019, in KES ’000’ ................................................................................. 91 Table 48: Loss, expense, combined and operations ratio for Ordinary and Group Life ........................................................... 91 Table 49: Life Insurance Premium Contribution, Investment Income & Market Share, in KES ’000’ ...................................... 92 Table 50: Claims and Benefits Paid, 2015-2019, in KES ’000’ ................................................................................................ 93 Table 51: Total Commissions for Ordinary and Group Life Business per Co, in KES ’000’ ..................................................... 94

6
Glossary
AML Anti-Money Laundering
AKI Association of Kenya Insurers
CAGR Compound Annual Growth Rate
CFT Combating Financing of Terrorism
EAC East African Community
EU European Union
GDP Gross Domestic Product
GWP Gross Written Premium
IFRS International Financial Reporting Standards
KES Kenya Shilling
KRA Kenya Revenue Authority
MOD Motor Own Damage
MTPL Motor Third Party Liability
NHIF National Health Insurance Fund
NSSF National Social Security Fund
RoE Return of Equity
TIRA Tanzania Insurance Regulatory Authority
TZs Tanzanian Shilling
UIA Ugandan Insurance Association
USD United States Dollar
WEO World Economic Outlook
WIBA Workmen Injury Benefit Act

7
Foreword
Matthew Koech AKI CHAIRMAN
Welcome to the 2019 edition of the Association of Kenya Insurers (AKI) Insurance Industry Annual Report. This report provides in-depth analysis of the economic outlook and performance of both life and non-life business in 2019 from a global, African, East African and Kenyan perspective. The report also provides insights into emerging trends that continue to shape and influence the insurance industry. As we have done in the past, we are keen to share concise analysis of how the Kenyan insurance sector performed in the year ended 31 December 2019 based on the data and analysed statistics received from the AKI member companies. This year, we acknowledge the impact of the ongoing COVID-19 global pandemic on the insurance industry and we provide some proposals on how insurers can adapt and remain resilient now and into the future.
In 2019, the global economy grew at 2.9% which was a significant drop from 3.6% growth in 2018 making it the lowest growth rate since the global
financial crisis in 2008-2009. Effects of rising trade barriers, trade wars, geopolitical tensions and structural factors causing macroeconomic strain in
several emerging market economies played a fundamental role in this shift in global GDP. Emerging markets contributed about 80% of the growth
experienced in the global insurance market. Overall, despite the slow pace in global economic growth, the demand for insurance is expected to
increase gradually in 2020 and 2021 with premium growth further supported by positive rate developments.
Africa’s GDP stagnated at 3.4% in 2019. East Africa continues to lead as the continent’s fastest growing region, with an average growth rate of 5.0%
in 2019. The introduction of risk-based capital management schemes and subsequently, higher capital requirements is helping to strengthen risk
management practices and the industry’s overall security in Africa. Major opportunities still lie in the African insurance space mainly as a result of low
insurance penetration, coupled with economic growth as well as a rising awareness of the benefits of insurance powered by technological uptake.
Kenya’s GDP expanded by 5.4% in 2019, a decrease from 6.3% in 2018. Even with this decrease, Kenya is still one of the fastest growing economies in Sub-Saharan Africa fuelled by accelerated growth in financial, insurance (6.6%) and Real Estate activities (5.3%). The Kenyan insurance industry recorded GWP of KES 231.30 billion compared to KES 216.11 billion in 2018; a 7.03% increase. Despite this growth, insurance penetration has declined to 2.37% in 2019 from 2.43% in 2018. GWP for life insurance business stood at KES 97.85 billion compared to KES 87.26 billion in 2018, while for non-life business stood at KES 133.45 billion compared to KES 128.85 billion in 2018. Motor and medical classes continue to be the main contributors of the non-life business. Non-life insurance continues to dominate at 58% of total GWP while life insurance is at 42%. We have witnessed steady growth of life business and it is forecasted to outgrow the non-life segment over the next five years. Profits after tax stood at KES 13.04 billion compared to KES 3.54 billion in 2018. Expenses and commissions stood at KES 76.36 billion up from KES 69.35 billion in 2018.There is need to closely monitor expenses incurred and we remain optimistic that the introduction of risk based pricing approaches will encourage ensure better underwriting and pricing practices going forward.
The legal and regulatory environment remains vibrant and we have seen a number of Acts come into force to address emerging issues such as data protection and ease of doing business. There are vast opportunities for Insurers to utilise online and mobile platforms for insurance distribution, adopt InsurTech, be innovative and develop new non-traditional insurance products that suit customer demands to help expand market reach especially among low income earners and those in less accessible areas. It is my hope that as you read through this report, you will have an appreciation of the larger picture and use this to re-assess your business
priorities.
Happy reading!

8
1. Global Economic
Overview

9
Global Macroeconomic Performance
Real GDP growth (Annual percent change) World 2.9% Advanced economies 1.7% Emerging market and developing economies 3.7%
According to the world economic outlook, the global economy
grew at 2.9% in 2019 which was a significant drop from 2018
where it grew at 3.6% making it the lowest growth rate since the
global financial crisis in 2008-2009. The World Economic Outlook (WEO) 2019 report highlights that the main reasons for the subdued growth is as a result of a combination of factors which include the following: Effects of rising trade barriers Elevated uncertainty surrounding trade and geopolitics Idiosyncratic factors causing macroeconomic strain in several
emerging market economies Structural factors, such as low productivity growth and aging
demographics in advanced economies
WEO also projects that this growth rate will further deteriorate in 2020 to -3% as a result of the COVID 19 pandemic and later experience a growth pickup of about 5.8% in 2021.
Figure 1: Trend of Real GDP Growth (Annual percent change)
Figure 2: Life and Non-Life Premium Growth Rate, 2019
Downside economic risks which increased throughout
2019 negatively affected the insurance and reinsurance
sector.
Some of these risks impacting re/insurers include:
Political risks such as Brexit uncertainties causing serious repercussions for UK and EU
COVID 19 pandemic which started a slump in global demand and disrupted supply chain.
Unsolved US-China tensions continue to cripple growth of insurance sector.
Heightened inflation uncertainty which has heightened re/insurance claims, especially in casualty lines.
Similarly to 2018, emerging markets continue to
dominate and remain the main driver of global premium
growth, expanding by an estimated 7% in 2019 for non-
life insurance and 9% for life insurance in real terms.
China and India remain particularly strong in driving this growth for emerging markets.
Containing inflation and achieving stronger economic growth will be beneficial to the insurance industry as investment yields would improve, premium volumes heightened alongside the economic activity.
Source IMF, World Economic Outlook Dataset and Swiss Re Financial Report 2019

10
Global Non-Life Insurance Outlook
The estimated global non-life gross written premium
2019 USD 2,400 billion a stagnation to that of
2018. About USD 190 million of non-life premiums
was ceded in 2019 which was a rise from USD 180
million ceded in 2018. The estimated global
premium growth also remained constant at 3% in real
terms for primary non-life whereas for reinsurance
non-life, the growth stood at 2%, a decline from the
previous 5% in 2018.
Overall, most countries and regions exhibited a
modest rise in premiums contributed mainly by the
moderate economic growth. Advanced market
premiums grew by around 2% in 2019, while
emerging markets continue to drive the growth with
an estimated 7% in 2019 with China and India leading
having premiums up by 9% and 11% respectively.
Agriculture and health/private medical insurance were
the main drivers of growth. Hard economic
environments in Latin America and Africa crippled
premium growth which was significantly below long-
term trend.
.
In general, lower catastrophe losses and moderately improving underwriting conditions caused the underwriting results in largest non-life markets to improve slightly. In exception, deterioration was noted in Japan where there were high natural catastrophe losses, and Australia, where double-digit claims growth in all major lines of business led to a significant deterioration in underwriting results. Profitability in non-life insurance, as measured by
return on equity (ROE), improved slightly in Europe
and Asia Pacific in the first half of the year compared
to the same period in 2018. In North America, ROE
was boosted by significant equity market gains during
the first months of 2019.
Overall, despite the slow pace in global economic growth, the demand for non-life insurance is expected to increase gradually in 2020 and 2021 with premium growth further supported by positive rate developments. Profitability will depend on underwriting performance, highlighting the need for more rate increases and improved underwriting discipline. Source: Swiss Re 2019 Financial Report

11
Global Life Insurance Outlook
In 2019, the global primary life insurance premium income stood at an estimated USD 2,800 billion, 20% of
which came from emerging markets. This was a significant drop from 2018 where the premium income generated
was USD 2,900 billion. Savings and retirement products contributed about 85% of the premium income similar
to 2018.
In comparison to 2018, the global life reinsurance business improved to an estimated USD 85 billion in 2019
from USD 75 billion. US, Canada, the UK and China accounted for 70% of this which is a boost from 62% the
previous year. Ceding companies from emerging markets contributed 17% of global demand a slight drop from
20% in 2018. Swiss Re estimates that global primary life insurance premium grew by 2% in 2019 in real terms
which is slightly lower than the average annual growth rate for the last five (5) years and a stagnation from 2018. The growth in premiums continued to be sluggish in advanced markets as it remained the same in Europe and advanced Asia Pacific but improved in North America as a result of high annual sales in the US. On average, emerging market premiums grew by about 9% in 2019.China, in particular reported double-digit
growth path with premiums rising by 13% in 2019 mainly driven by protection products. Other emerging markets
in Asia recorded an increase of 7% in premiums.
Life insurance in the Middle East and Africa also remains weak whereas Latin America records a slight growth of 4% in 2019. Overall, profitability measured by RoE of listed life insurance companies remains healthy at 10% in 2019 which is an improvement from 2018.
Source: Swiss Re 2019 Financial Report
Increasing possibility of a deeper global
recession cripples the likelihood of growth for
life insurance
It is particularly as a result of declining sales for savings-related insurance policies arising from persistent low interest rate environment. However, there is expectation of more stability in protection related business such as critical illness, disability, long-term care and unit-linked policies, where the investment risk is borne by the policyholders.

12
Global Insurance Trends
Insurance as a service —
The concept of pay-per-use insurance is
gaining importance due to lower premiums,
simple process and development of
technology.
Claim Processing —
The adoption of new technologies
and innovation has made the
claims handling process easier
and faster.
Automation and digital labour — Insurers are
employing automation technologies to provide
customer service, underwriting services and
claim processing services at faster and more
economical rates.
InsurTechs — Traditional players
are responding to the disruption by
developing or acquiring new
technologies.
Data and Technology —Insurers
are leveraging data analytics
across the insurance value chain
to re-shape their strategy and
improve customer centricity.
Blockchain — Blockchain
technology is expected to transform
the insurance industry through the
use of smart contracts and digital
assets and payments.
Changing business models and ERM
— Significant changes in the
technological, social and economic
environment are likely to change the
needs of insurance buyers.
Increasing customer centricity
— As the bargaining power of
global insurance customers is
increasing at a fast pace, it is
crucial for insurance companies to
bring customer centricity to the
centre of their business model to
standout in the marketplace.
1
2
3
4
5
6 7
8
9
10
11
12
Cyber Insurance —
Increasing rate of attacks,
growing demand and new
regulations provide
insurers the opportunity
to address the risks
present in cyberspace.
Insurance Regulations –
Insurance regulators are
looking to formulate
regulations to govern insurers’
cyber risk handling approach
and address concerns related
to inappropriate usage of big
data.
Digital Transformation —
Digital transformation is
emerging across the value
chain to reshape insurance
products, pricing, marketing
and distribution and claim
settlement.
Insurance products for sharing economy — Insurers are
focusing on offering new insurance products that cater to the
needs emerging from the sharing economy.
Source: Insurance industry Trends 2019 by KPMG

13
Localising the Global Trends
Insurers should be on the lookout for any changes occurring in the technological, social and economic environment so as to strategically evolve their business models and enterprise risk management (ERM) frameworks to suit the changing needs of potential insurance buyers. The changes premised by Covid-19 present a strong case.
Changing business
models and ERM
Insurers should focus on conducting research on customer needs, design and develop products that meet emerging demands of customers. This will also assist to boost the penetration rate and insurance uptake.
Invest in robust data and technology tools to assist in data analytics across the insurance value chain in preparation of IFRS17 implementation and improving customer experience.
Data and
technology
Developing new
products
Adopt new technologies into the business to help hasten and ease the claims handling process.
Claims
processing
Focus on customer needs and make their demands centre of the decision making process. This will help to strategically gain a competitive edge as customers bargaining power continues to heighten.
With the ever changing insurance environment, insurers should embrace digital transformation agendas across the value chain to streamline insurance products, pricing, marketing and distribution and claim settlement and also remain relevant in the market.
Digital
transformations
Customer
centricity
Automation and
digital labour
Insurers to consider automating most of their processes such as customer services, underwriting services and claim processing for better and faster service delivery. Transitioning to digital labour is also a new reality especially in these times of uncertainty crippled by COVID 19 and other unforeseeable
situations.
14
IFRS 17 Update
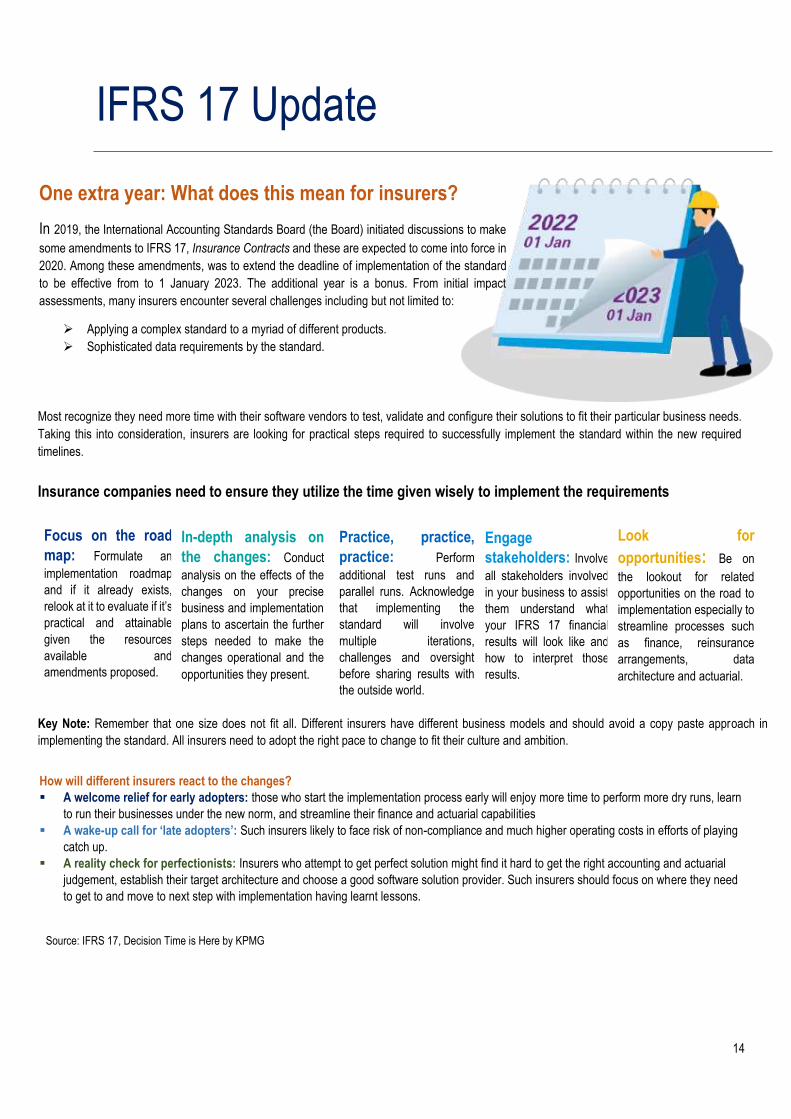
One extra year: What does this mean for insurers?
In 2019, the International Accounting Standards Board (the Board) initiated discussions to make
some amendments to IFRS 17, Insurance Contracts and these are expected to come into force in
2020. Among these amendments, was to extend the deadline of implementation of the standard
to be effective from to 1 January 2023. The additional year is a bonus. From initial impact
assessments, many insurers encounter several challenges including but not limited to:
Applying a complex standard to a myriad of different products.
Sophisticated data requirements by the standard.
Insurance companies need to ensure they utilize the time given wisely to implement the requirements
Focus on the road
map: Formulate an
implementation roadmap
and if it already exists,
relook at it to evaluate if it’s
practical and attainable
given the resources
available and
amendments proposed.
In-depth analysis on
the changes: Conduct
analysis on the effects of the
changes on your precise
business and implementation
plans to ascertain the further
steps needed to make the
changes operational and the
opportunities they present.
Practice, practice,
practice: Perform
additional test runs and
parallel runs. Acknowledge
that implementing the
standard will involve
multiple iterations,
challenges and oversight
before sharing results with
the outside world.
Engage
stakeholders: Involve
all stakeholders involved
in your business to assist
them understand what
your IFRS 17 financial
results will look like and
how to interpret those
results.
Look for
opportunities: Be on
the lookout for related
opportunities on the road to
implementation especially to
streamline processes such
as finance, reinsurance
arrangements, data
architecture and actuarial.
How will different insurers react to the changes?
A welcome relief for early adopters: those who start the implementation process early will enjoy more time to perform more dry runs, learn
to run their businesses under the new norm, and streamline their finance and actuarial capabilities
A wake-up call for ‘late adopters’: Such insurers likely to face risk of non-compliance and much higher operating costs in efforts of playing
catch up.
A reality check for perfectionists: Insurers who attempt to get perfect solution might find it hard to get the right accounting and actuarial
judgement, establish their target architecture and choose a good software solution provider. Such insurers should focus on where they need
to get to and move to next step with implementation having learnt lessons.
Key Note: Remember that one size does not fit all. Different insurers have different business models and should avoid a copy paste approach in
implementing the standard. All insurers need to adopt the right pace to change to fit their culture and ambition.
Most recognize they need more time with their software vendors to test, validate and configure their solutions to fit their particular business needs.
Taking this into consideration, insurers are looking for practical steps required to successfully implement the standard within the new required
timelines.
Source: IFRS 17, Decision Time is Here by KPMG

15
COVID-19: The New Reality
Covid-19: Its effects and how to remain resilient
The ongoing COVID‑19 pandemic, was first identified in December 2019 in Wuhan, China.
The World Health Organization declared the outbreak a Public Health Emergency of
International Concern on 30 January 2020 and a pandemic on 11 March 2020.
Covid-19 has caused massive disruption across the global economy. Many businesses are
facing tough times trying to juggle the cost of running core functions and remaining resilient.
Different (re)insurers are dealing with its effects in different ways with most keen to put
measures to ensure they remain resilient and survive.
The coronavirus pandemic clearly evidences the vulnerability of our globally interconnected
economies. An outbreak in one part of the world has caused significant disruption and
challenges to economies, businesses, communities and people worldwide. The impact of the
virus will change the insurance landscape permanently and redefine how business should
operate across the globe.
Re (insurance) companies must rethink their operating business models and redefine their
strategy to adapt and survive through the pandemic. Most importantly, insurers need to have
a holistic view of costs across the core functions of the business including underwriting,
claims, finance, human resources, IT, marketing, sales and customer service. To achieve
this, - insurers have to effectively rationalize costs during, and post the pandemic balancing
between the need to minimize costs and ensuring there is optimal resources to operate the
business.
The effects of COVID-19 on insurance spans across different business facets as analysed
in detail in the next page.

16
Implications of Covid-19 for Insurers
Workforce Transformation
Adoption of new workforce management
practices and enhanced application of
technology.
Move to remote working as a result of
curfews and lockdowns
Difficulty in supporting staff with
administrative services remotely.
Uptake of technology
Shift towards technology that present
connectivity issues thereby need to
upscale VPN concentrators to handle
traffic.
More IT security and cyber threat
necessitating implementation of robust
security measures
Operational challenges
A spike in customer contacts and
queries
Slowdown in business growth
Possible rise in fraudulent claims,
ransom ware and malware attacks
Dealing with channel overload
More business interruption and
uncertainties
Imposition of additional regulatory
requirements
Insurers to perform and submit to IRA a
stress and scenario testing including
updating of capital adequacy calculations
and liquidity strains as a result of Covid-19
3-month grace period for policyholders
Rise in insurance risk and capital and solvency
Rise in non-financial risks due to uncertainty
and timing of claims.
Threat to solvency due to strain on capacity
to meet short and long term commitments.
Regulator to define new minimum capital
levels and risk based capital.
Embedding resilience and enterprise risk
management transformation
Need to build a safe enterprise to endure
disruption and remain confident of
persevering.
Struggle to act on strategic plans and in
some cases, craft new ones.
Need to respond and adjust fast and
remain agile and resilient.
Four phases that insurers should move through to respond to COVID 19
Source: Shaping the new reality by KPMG
Many insurers first response is to protect themselves against the immediate threats including commercial, operational and financial uncertainties. Insurers need to assess talent risk in all areas of business and its effect on cost, compliance,
connectivity and capacity.
Insurers should ensure their leadership and staff have the necessary skills and tools to manage existing and future uncertainties. Awareness programs with accurate information are key to equip and sustain leaders and staff to pull through the disruption and uncertainty.
Recovery involves accepting that the traditional method of working and operating models are being challenged and thus the need to explore new options to shift to. Human resource in collaboration with other process owners should test possible scenarios to define future workforce.
The scenarios should be specific to the (re) insurers recognizing skills, capabilities and labour sources, and the resulting effect on current roles
and teams.
Reaction Resilience Recovery New reality
New reality involves adapting to the new ways of working. The unprecedented changes will become the new normal. To remain relevant, insurers will need to retain an iterative approach to position its business in order to thrive and remain a going concern amidst these external factors and empower themselves to explore scenarios for new
reality.
04 03 02 01
Navigating through these phases and adapting to the new norm will be crucial for insurers to endure, grow and succeed,
especially with profitability expected to be considerably affected going into and beyond 2020.

17
2. Africa’s Economic
Overview

18
Africa’s Macroeconomic Performance
Stable growth
Economic growth in Africa stagnated at 3.4% for 2019, a marginal change form 3.5% in 2018. East, North and South Africa all registered drops in their growth rates unlike their counterparts in Central and West Africa. East Africa continued to lead as the continent’s fastest growing region in 2019, with an average growth rate of 5.0%. North Africa wasn’t far behind at 4.1 %. West Africa’s growth rose to 3.7% in 2019, from 3.4% in 2018, while Central Africa grew to 3.2% in 2019 from 2.7% in 2018.The devastating natural events of cyclone Idai and Kenneth dragged Southern Africa’s growth rate to 0.7% in 2019 from 1.2% in 2018.The continent’s big five- Algeria, Egypt, Morocco, Nigeria, and South Africa- jointly grew at an average rate of 3.1% compared to the average of 4.0% for the rest of the continent.
Investment and exports are increasingly driving growth
In 2019, investment expenditure accounted for more than half of GDP growth dynamics than consumption, an event not seen over the last decade. Another strong contributor was net exports especially among commodity exporters, as oil prices recovered. Since 2011, and particularly following the end of the commodity price super cycle in 2014, the divergence between gross savings and total investment has been widening for Africa. Majority of the continent is still largely dependent on agriculturally based exports and thus the widening gap in the continent’s average continues to push the current account deficits.
Risks to the outlook skew to the downside
Africa’s growth materialized despite a challenging external environment. Global trade volumes slowed from annual growth of 5.7% in 2017 to 1.1% in 2019, with the slowdown especially acute for metals and food, two of Africa’s major export commodities. Extreme weather events— particularly the type of devastating storms and floods that afflicted Southern Africa in the first half of 2019 and the expected return of El Niño conditions to East Africa— could usher in severe droughts and suppress agricultural output and growth. In countries holding elections in the next two years, there may be socio-political pressures to increase public spending, which could undermine fiscal consolidation plans. And risks associated with terrorism, conflict, insurgency, and social unrest may also weigh on economic activity in some countries.
Source: Africa Development Bank, Africa Economic Outlook 2020
Figure 3: Africa's Economic Growth
19
Overall, macroeconomic stability in Africa improved
Inflation remains persistently high in Africa. The average inflation rate for the continent inched down by 2% points, to 9.2% in 2019 from 11.2 % in 2018, with notable variations across countries and economies. Central banks reacted by adjusting interest rates to manage domestic demand. Downward inflationary pressures however resulted in interest rates reduction to encourage investment and spur growth.
Fiscal balances improved in the past two years, with the weighted average deficit-to-GDP ratio in Africa declining from 5.9% in 2017 to 4.8% in 2019. This resulted mostly from stabilization in commodity prices and higher tax and non-tax revenues for large natural resource exporters. The revenue-to-GDP ratio rose by 0.3% point on average for the 54 African economies, but by more
than 1% point among oil exporters, such as Angola, whose ratio rose 2.2% points.
Debt in Africa, good or bad? Public and publicly guaranteed debt levels are high and rising in most African economies, with the median ratio of government debt-to-GDP climbing over 56% in 2019, up from 38% 10 years earlier. The upward trend in external debt ratios is partly driven by the end of the commodity super cycle and the slowing growth and export revenues, especially among commodity producers. But it also stems from a more stable macroeconomic and governance environment, which allowed more African countries to tap international bond markets for the first time, some with 30-year maturities.
African governments have had a structural shift in the composition of debt. Currently long-term finance from international capital markets, and financing from emerging bilateral creditors, such as China has become the norm. Similarly, higher domestic borrowing (reaching more than 35% of GDP) in part reflects elevated government spending and capital investment to close the infrastructure gap. But it also reflects gradually slowing inflation, greater monetary credibility, and stronger ability to market domestic currency debt to international creditors.

20
Overview of Africa’s Insurance Market
Source: Africa Insurance Barometer 2019
• The introduction of risk-based capital management schemes and subsequently, higher capital requirements, helped to strengthen risk management practices and the industry’s overall security.
• Africa’s strong underlying growth remains consistent supported by its richness in natural resources, its young and growing population and workforce and its need for infrastructure development. It is expected that insurance premiums will outgrow GDP as more insurance assets are created, larger parts of society join the continent’s growing middle class and the need for infrastructure investments remains high.
• Skilled insurance workers are hard to find and are in need when it comes to innovation that aims to differentiate companies from competitors and escape the pervasive price wars pressures.
• Lack of harmonization of regulations hinders regional expansion. In some cases, insurers have noted regulators applying their authority unevenly or shy away from enforcements that might be painful; namely for weakly capitalised domestic players.
• Africa’s markets remain comparably small and undiversified compared to other continents. Most business relates to motor, health and property, where most insurers predominantly compete on
pricing.
• Africa’s low insurance penetration together with economic growth and rising awareness of the benefits of insurance form the basis of the overall growth potential of the continent’s insurance industry.
• Technology continues to help Africa’s insurance markets catapult in its developmental stages. Notably mobile technology has been a blessing for Africa’s insurance industry; reducing production and distribution costs, providing access and big data about entirely new customer segments and in
addition improve efficiency and claims handling.
Opportunities
Weaknesses
• Inflexible regulation might strangle innovation by setting up too many hurdles for new solutions to be introduced to the market. In addition, regulation may also serve to shelter inefficient markets from having to open up and face more effective competition, thus prolonging and protecting market weaknesses.
• Economic downturn due to the sudden drop in demand for commodities coupled with an equally dramatic increase of the US dollar against local currencies, fearing another unexpected economic crisis.
• Political instability that results in considerable amount of uncertainty that usually translates into a slowdown of economic growth as larger investments or projects are frequently stalled or postponed until after election periods.
Strengths
Threats

21
3. East Africa’s Economic
Overview

22
Overview of Economy Introduction
Growth in East Africa was preserved by strong growth in Rwanda, South Sudan, Ethiopia, Tanzania, Uganda,
Kenya and Djibouti. Although the region’s real GDP growth slipped marginally to 5% in 2019 from 5.2% in 2018,
the region’s growth remained stable on the back of strong public spending on infrastructure, rising domestic
demand, the benefits of improved stability, new investment opportunities and incentives for industrial development
across countries. With the outbreak and continuing spread of COVID-19, the projected growth rates in 2020 and
2021 are expected to dampen.
Pre-COVID-19 projections showed the region’s real GDP growth recovering slightly to 5.1% and 5.4% in 2020
and 2021, respectively.
Figure 4: GDP Growth in East Africa, by Country, 2017- 2021 (Pre-Covid 19)
Source: African Development Bank statistics

23
Macroeconomic Developments and challenges
1. Transition from Agriculture to Service
The agriculture sector, which for the longest was been the East Africa’s economic backbone, has been a declining
contributor to GDP. This is mainly as a result of climate change, declining world food prices, and rapidly increasing
urbanization. In contrast, the region has been experiencing a rise in service sector which is increasingly driving
economic growth on the supply side, while on the demand side, growth is driven by private consumption and
investment. In Kenya, Ethiopia, Rwanda, and Eritrea, the service sector contribution to GDP has been increasing
over the last decade, in 2019 it recorded an average of 47%, 41.2%, 60% and 67% in the respective countries.
2. Investments, Public Projects and Infrastructural Development
The economies of East Africa have witnessed mega public projects in energy and infrastructure. Kenya, Tanzania,
Djibouti and Ethiopia have invested in standard gauge railways. Other infrastructural projects include Ethiopia
investing in an oil pipeline and Kenya expanding its investment in energy and road projects.
3. Inflation and Fiscal deficit
4. Debt in East Africa
Source: October 2019 IMF Regional Economic Outlook – Sub-Saharan Africa
Table 1: Government Debt in the East Africa Region, by Country 2019
East Africa’s inflation remains the highest on the continent mostly characterized by the effects of
currency devaluation on domestic prices in Sudan, monetization of fiscal deficits and reduced
agricultural productivity due to poor rainfall. The prevailing COVID-19 pandemic is expected to
continue to raise the inflation rate in 2020.
In 2019, the average fiscal deficit for the region was estimated at 4.9% of GDP driven mainly by huge
infrastructural expenditure and low tax revenue collection. This is the second largest figure in African
regions and exceeds the continental average deficit by 0.1% point. There are however two sides to this
coin; a signal of the region’s inability to meet its financing needs or a signal that the countries’
commitments to expanding their economies.
On average, total debt stock in East
Africa (domestic and external) stands at
62% of the region’s GDP in 2019. It is
driven by attempts to grow the
economies through borrowed funds spent
mainly on infrastructural development
amid revenue shortfalls.
Debt vulnerabilities have increased in
some countries in the region during the
2013-2019 period. Ethiopia went from low
to high levels of debt distress, Kenya from
low to moderate debt distress, South
Sudan from moderate to extreme debt
distress, and Eritrea and Sudan from high
to extreme debt distress.

24
Overview of East Africa’s Insurance
Market East Africa continues to show potential with its growing GDP supported by a young population, a growing middle
class and the growth in financial inclusion as well as awareness of the value of saving. However, despite the
modest increase in premiums within the insurance industry, insurance penetration remains low in the region. This
struggle has been attributed to the effects of macroeconomic factors such as the level of poverty in the region,
inequality in resources distribution
and unemployment which
remains quite high.
Notably, the insurance
companies in the region
continue to grow and aim to
attract different kinds of
consumers by investing in
technology and improving
innovation, maintaining market
visibility and making the
customer the centre of their
strategies. Generally, life
insurance still lags behind non-life insurance but with the increasing demand for life products by the growing
middle class, the momentum has picked up steadily.
From a financial performance perspective, the industry continues to invest in technology and use of big data to
improve their operations and manage their expense as well as claim ratios. In order to remain profitable,
management expenses need to be maintained at a minimal level to complement the growing Gross Written
Premium within the region.
Figure 6: Proportion of Life to Non-Life Business, East Africa
0% 10% 20% 30% 40% 50% 60% 70% 80% 90% 100%
Kenya
Uganda
Rwanda
Tanzania
South Sudan
Ethiopia
General Life
Source: African Development Group, East Africa Economic Outlook
0.53%
0.77% 0.84%
2.43%
0.40%
0.00%
0.50%
1.00%
1.50%
2.00%
2.50%
3.00%
Tanzania Burundi Uganda Kenya Ethiopia
Figure 5: Penetration Rate 2019

25
Legislative Changes
Policyholders in Tanzania will eventually have their
policies in both English and Kiswahili following a
circular effective October 2019. This was initiated to
ensure the policyholders are provided with simplified,
understandable and comprehensible insurance
contracts, as part of the Authority’s statutory
mandate to the consumers.
The Insurance (Bancassurance) Regulations, 2019
paved way for banks or financial institutions carrying
on insurance broking to do so for a period of not more
than two years, unless, on application, an extension
is granted by the Commissioner which shall not
exceed one year.
The National Bank of Rwanda revised and
improved their regulations on licensing requirements
and other conditions for insurance intermediaries.
The changes were aimed at maintaining an efficient,
fair, safe and stable insurance market in the country
and to foster good conduct among insurance
intermediaries. Furthermore, a framework was
established to allow banks and microfinance
institutions within the country to engage in
bancassurance business promoting the financial
inclusion agenda through insurance coverage.
In Kenya, the Data Protection Act was enacted to
govern the processing of personal data. The health
related laws were amended to require doctors take
professional indemnity covers and hospitals to insure
staff against professional indemnity. To allow for the
issue of regulations on index-based insurance and
micro-insurance, the Insurance Act Section 2 was
amended to include definitions of index-based
insurance and micro-insurance. The microinsurance
regulations were also passed on 6th March 2020.
The Insurance Regulatory Authority of Uganda began the year with a few reminders on their payment
processes to avoid any inconveniences to industry
players and improve efficiencies within the sector. This
was subsequently followed by the Health Membership
Organisation, insurance companies and insurance
brokers licensing process requirements from a financial
and operational front for the subsequent years 2020
and 2021.
The year also saw the regulator provide new minimum
premium rate guidelines for motor comprehensive,
accident, fire, engineering, marine cargo and bonds
insurance products. Following a workshop held in June
2019 to finalise the discussions around IFRS 9 and its
implications, the regulator released guidance on IFRS
9 implementation within the Ugandan Insurance
Industry in August 2019.
Tanzania Insurance Regulatory Authority leapt
into digitalisation in February 2019, requiring all existing
and potential registrants to execute their registrations
online. The platform was also provided to enable
applicants for externalization of risks to obtain risk
participation feedback from the market, obtain the
Authority’s approval or disapproval for externalization of
risk, pay statutory levy and other relevant fees prior to
placement with accredited reinsurers and reinsurance
brokers. Foreign reinsurers and reinsurance brokers
also had their applications submitted and processed
online. Sources: Insurance Regulatory Authority of Uganda, Insurance Regulatory
Authority of Kenya, Tanzania Insurance Regulatory Authority and National
Bank of Rwanda

26
4. Kenya’s Economic
Overview

27
Kenya’s Economic Overview GDP Growth
The real Gross Domestic Product (GDP) is estimated to have expanded by 5.4% in 2019, which was lower compared to a growth of 6.3% in 2018. Agriculture, Forestry and Fishing sector accounted for a sizeable proportion of the slowdown, from 6.0% growth in 2018 to 3.6% in 2019. The manufacturing sector grew by 3.2% in 2019 compared to 4.3% growth in 2018. Despite most sectors recording decelerated growth, the economy was supported by accelerated growth in Financial, Insurance (6.6%) and Real Estate activities (5.3%).
Government Borrowing
Total stock of public debt went up by 16.8% to KES 5,301.6 billion at the end of June 2019. External
debt, which accounted for 57.0% of the total debt, grew by 17.7% to stand at KES 3,023.1 billion.
Domestic debt rose by 15.7% to KES 2,278.5 billion, at the end of June 2019. Bilaterally, stock of debt
from Japan increased by 38.4% to stand at KES 135.2 billion. Total revenue targets continue to be
increased by the government, exerting pressure on the domestic borrowing to fill in the deficit gap
that arise.
Exchange Rate and Interest Rates
The Kenyan Shilling gained against currencies of key trading countries with Trade Weighted Index
(TWI) improving from 115.7 in 2018 to 113.0 in 2019. This was mainly occasioned by strengthening
of the Kenyan Shilling against the Euro, Pound Sterling, Chinese Yuan and Indian Rupee by 4.6%,
3.8%, 3.7% and 2.4%, respectively.
The CBK lowered the Central Bank Rate (CBR) to 8.50% in November 2019 from 9.00% in December
2018 to boost economic growth against a backdrop of inflationary expectations. Although the capping
of bank interest rates was removed through the enactment of the Finance Act, 2019, interest on
commercial bank loans and advances reduced to 12.24% as at December 2019 from 12.51% in
December 2018. The loans-deposits interest rate spread reduced to 5.14% at end of December 2019
from 5.09 per cent in December 2018. The cost of borrowing between banks as indicated by the inter-
bank rate fell from a high of 8.15% in December 2018 to 2.98% in June 2019 and rose again to 6.03%
in December 2019.
Inflation
The annual inflation as measured by the Consumer Price Index (CPI) increased from 4.7% in 2018 to
5.2% in 2019. The upsurge in inflation was mainly attributable to rise in transportation, food and
beverage prices arising from constrained domestic supply due to less favourable weather conditions
in first half of 2019. Prudent macroeconomic policies as well as a relatively stable Kenya Shilling
against the major currencies especially the US Dollar also helped in containing the inflation.
Source: Kenya National Bureau of Statistics, Economic Survey 2020

28
Kenya Insurance Outlook
Non-life insurance
Non-life insurance continues to dominate over life
insurance in the Kenya insurance market (57.70% of
GWP make up non-life business) with majority of
insurers still offering almost similar products. Motor
vehicle insurance continue to be the main driver for
the non-life segment with medical and property
insurance following in second and third place and are
all well established.
As at the end of 2019, IRA had listed 37 non-life
insurance companies and 5 reinsurers. The top 10
non-life insurers accounted for more than 56.08% of
the fast-growing gross premium income for the year.
According to AKI, although, the segment is
experiencing growth in terms of premium income,
there is persistent recording of underwriting losses for
the past five years. The segment continues to report
underwriting losses as a result of premium
undercutting in effort by insurers to reserve market
share.
The Deloitte’s 2019/2020 East Africa insurance
outlook highlights that as a safety net to compensate
for underwriting losses, insurers are leveraging on
sub-optimal investment returns on property and equity
markets. The report further highlights that the
entrance of non-traditional insurance products and
uptake of disruptive technologies by insurers is much
slower than expected.
Insurers need to be more innovative and come up with
new products that suit market demand by being more
customer centric and also embrace use of innovative
technologies. Distribution through mobile payments
and development of micro-insurance products will
help expand market reach especially among low
income earners and those in less accessible areas.
Life insurance
Life insurance still lags behind in terms of penetration in
Kenya. Only 42.30% of GWP make up Life business as
compared to Non-Life business which makes up 57.70%
of GWP. As at the end of 2019, the IRA had listed 26 life
insurance underwriters and three (3) reinsurers. The top
five life insurance companies accounted for nearly 63.5%
of the gross premium income over the year.
According to BMI Research report on Kenya insurance
market overview, it is forecasted that life insurance
segment will outgrow the non-life segment as it is
expected to grow by about 12% per annum over the next
five years. To achieve this, insurers will need to reduce
the cost of life cover by introducing products such as
micro insurance solutions to increase penetration rate
and affordability of the life insurance products. The
micro-insurance products target low to medium income
households and over time have increasingly becoming
more popular within the insurance space.
As a result of the increased capital requirements
introduced in 2018 with the aim of ensuring more
financial stability within the sector; expanding the life
insurance segment will also possibly be accompanied by
lots of mergers and acquisition of smaller players in the
sector.
Sources: East Africa Insurance Outlook Report 2019/2020 Deloitte, IRA
Licensed Insurance Companies 2019 and BMI Research Report Q4 2019

29
Legislative Changes 2019
The Health Laws (Amendment) Act 2019
The health related laws were amended through the
Health Laws (Amendment) Act, 2019. In particular,
Section 15 A of the Amendment Act has a requirement
for every doctor to take professional indemnity
insurance cover annually. It also requires that health
institutions insure their staff against professional liability.
The Business Laws (Amendment) Act, 2019
The Business Laws (Amendment) Act, 2019 was
passed into law in March 2020. The law amends sixteen
laws to enhance the ease of doing business in the
country. The following amendments may affect the
insurance industry directly or indirectly;
– Stamp duty Act- through the amendment, stamp
duty can now be effected electronically, this is a
positive amendment especially on insurance
policies.
– The electronic signatures are now recognised, this
will affect contracts (policies).
– Companies Act-seal no longer required for
execution of documents.
Data Protection Act, 2019
The Data Protection Act, 2019 came into force on 25th
November 2019. The object is to regulate and guide the
processing of personal data, protect the privacy of
individuals, establish the legal and institutional
mechanism to protect personal data, and ensure that the
processing of personal data is guided by a set of
principles.
Insurance companies collect, retain and process a lot of
personal data from their customers. The Act now
requires that any organization that collects, records,
organizes, disseminates or processes personal data
must register with the Data Commissioner. The Act also
provides for rights of the members of the public
including:
– Being informed of the use of the data
– Right to access their data
– Right to object to all or part of their data processing,
and consent to their data being collected
– Ability to withdraw the consent that was earlier
granted among others.
Insurance companies have to come up with data policies
that reflect compliance with the Data Protection Act.
For insurance companies that are dealing with European
Union companies or citizens, the General Data
Protection Regulations (GDPR) that came into effect in
May 2018, still apply. These two laws are separate and
must both be complied with. The key objective of the
GDPR is to protect the European Union
Citizens/residence from data privacy breaches.

30
The Health Laws (Amendment) Act 2019
The health related laws were amended through the
Health Laws (Amendment) Act, 2019. In particular,
Section 15 A of the Amendment Act has a requirement
for every doctor to take professional indemnity
insurance cover annually. It also requires that health
institutions insure their staff against professional
liability.
The Business Laws (Amendment) Act, 2019
The Business Laws (Amendment) Act, 2019 was
passed into law in March 2020. The law amends
sixteen laws to enhance the ease of doing business in
the country. The following amendments may affect the
insurance industry directly or indirectly;
– Stamp duty Act- through the amendment, stamp
duty can now be effected electronically, this is a
positive amendment especially on insurance
policies.
– The electronic signatures are now recognised, this
will affect contracts (policies).
– Companies Act-seal no longer required for
execution of documents.
Data Protection Act, 2019
The Data Protection Act, 2019 came into force on 25th
November 2019. The object is to regulate and guide the
processing of personal data, protect the privacy of
individuals, establish the legal and institutional
mechanism to protect personal data, and ensure that the
processing of personal data is guided by a set of
principles.
Insurance companies collect, retain and process a lot of
personal data from their customers. The Act now
requires that any organization that collects, records,
organizes, disseminates or processes personal data
must register with the Data Commissioner. The Act also
provides for rights of the members of the public
including:
– Being informed of the use of the data
– Right to access their data
– Right to object to all or part of their data processing,
and consent to their data being collected
– Ability to withdraw the consent that was earlier
granted among others.
Insurance companies have to come up with data policies
that reflect compliance with the Data Protection Act.
For insurance companies that are dealing with European
Union companies or citizens, the General Data
Protection Regulations (GDPR) that came into effect in
May 2018, still apply. These two laws are separate and
must both be complied with. The key objective of the
GDPR is to protect the European Union
Citizens/residence from data privacy breaches.
5. Kenya’s Insurance
Industry Performance

31
Industry Performance – At a Glance
1 Total Industry Premiums
Stood at KES 231.30 billion in 2019 compared to KES 216.11 billion in 2018, a 7.03%
increase.
2 Gross written premium
Life: KES 97.85 billion, a 12.14% increase from 2018. Non-life: KES 133.45 billion, an
increase of 3.57% from 2018
3 Total investments and other incomes
Total investments and other incomes increased by 39.07% to KES 69.85 billion. Life: KES
48.55 billion and Non-life: KES 21.30 billion respectively.
4 Total commissions and expenses
Stood at KES 76.36 billion in 2019 from KES 69.63 billion in 2018, a 9.66% increase, and
commissions and expenses growing by 4.46% and 12.05% respectively from 2018.
6 Profit after tax
Increased to KES 12.69 billion in 2019 from KES 3.0 billion in 2018. The growth was mainly
attributed to profit recorded by life business which increased to KES 8.09 billion from a loss
of 491.17 million in 2018.
5 Reinsurance Premium Ceded
The total industry’s reinsurance premium ceded grew by 6.10% to KES 46.68 billion up
from KES 43.99 billion.
7 Net Claims Incurred
Stood at KES 117.30 billion in 2019 compared to KES 111.01 billion in 2018; a 5.67%
increase
8 Return on Capital
Grew from 3.68% in 2018 to 15.05% in 2019.
9 Industry total assets
Grew by 8.77% to KES 686.02 billion in 2019 compared to KES 630.72 billion in 2018.

32
Kenya’s Insurance Market In 2019, the number of insurance companies remained 54 similar to 2018. We witnessed the entry of Mauritian company MUA into the Kenyan market after acquiring Phoenix Assurance.
There were 16 Reinsurance brokers in 2019 up two from 14 in 2018. . The number of agents increased from 8,955 in 2018 to 9,262 in 2019. Licensed brokers decreased from 216 in 2018 to 213 in 2019. The number of insurance surveyors and loss adjusters stood at 30 in 2019 compared to 28 in 2018. Table 2: Kenya Insurance Industry Players
2015 2016 2017 2018 2019
Insurance Companies 51 51 52 54 54
Reinsurance brokers 3 3 4 14 16
Agents 6,424 6,481 9,320 8,955 9,262
Brokers 139 186 221 216 213
Investigators 133 123 142 145 131
Medical Insurance Providers (MIPs) 22 29 31 33 31
Insurance Surveyors 30 27 32 36 30
Risk Managers 7 7 9 11 9
Loss Adjusters 27 31 32 31 28
Motor Assessors 114 98 126 123 123
In 2019, Tanzania still had the highest number of Kenyan insurance companies operating in that market with 13 Insurers while Uganda and Rwanda followed with 12 and 5 respectively. Mauritius, Malawi and South Sudan also host three Kenyan Insurance companies each. The ease of doing business in these countries and political stability remain key contributors to presence or lack thereof.
Figure 7: Kenyan Insurers with Presence in other Countries in 2019
APA
GA
JUBILEE
HERITAGE
MAYFAIR
SANLAM
AAR
Burundi Tanzania Uganda Rwanda S/Sudan DRC-Congo
Mauritius Mozambique Malawi Zambia Botswana Seychelles

33
Premium Income
There was an increase in year-on-year growth rate for total gross written premium which grew by 7.03% from KES 216.11 billion in 2018 to KES 231.30 billion in 2019 compared to a growth rate of only 3.05% from 2017 to 2018. Over the last five years (2015 – 2019), the industry recorded a CAGR growth rate of 7.57% in gross premium income. Non-Life insurance continues to take the lion’s share of the total premium income at 57.70% representing KES 133.45 billion, this is a 3.57% growth from 2018 where it stood at KES 128.85 billion. Life insurance made up the remaining 42.30% share of total premium income at KES 97.85 billion in 2019 representing a 12.14% growth rate from 2018. This was a significant increase in the year-on-year growth rate compared to the previous year where life insurance only grew by 4.31% from 2017.
Insurance Performance Relative to the Economy
The performance of the industry relative to the Kenyan Gross Domestic Product for the period 2015 to 2019 is shown below.
Table 3: Insurance Performance Relative to Gross Domestic Product, KES in Billions
2015 2016 2017 2018 2019
Gross Domestic Product (GDP) at Market Prices 6,284 7,194 7,749 8,905 9,740
Life Insurance Premium* 61.86 73.92 83.65 87.26 97.85
Life Insurance Penetration 0.99% 1.03% 1.08% 0.98% 1.00%
Non - Life Insurance Premium 111.93 123.08 126.05 128.85 133.45
Non - Life Insurance Penetration 1.78% 1.71% 1.63% 1.45% 1.37%
Total Premium* 173.84 197.00 209.70 216.11 231.30
Insurance Penetration** 2.79% 2.75% 2.71% 2.43% 2.37%
*Includes deposit administration and unit linked contributions
**Insurance Penetration = Gross Premium * 100
GDP
111.95123.08 126.05 128.85 133.45
60.8173.92
83.65 87.26 97.85
172.76
197.00209.70 216.11
231.30
0
50
100
150
200
250
2015 2016 2017 2018 2019
Non Life Insurance Life Insurance Non Life and Life Insurance
Figure 8: Gross Written Premium Trend for Life and Non-Life Combined, KES in Billions

34
Figure 9: Insurance Performance Relative to Gross Domestic Product
There was a slight improvement in life penetration rate which grew from 0.98% to 1.00% from 2018 to 2019. Non-life penetration rate
dropped to 1.37% in 2019 from the previous 1.45% in 2018. This decline contributed to the decrease in overall industry insurance
penetration rate to stand at 2.37% in 2019 from 2.43% in 2018. Over the past 5 years (2015 – 2019) the insurance penetration rate has
been declining mainly because the Gross Domestic Product (GDP) at Market Prices has been rising at a higher rate compared to the
growth in insurance premium. This is more pronounced in general insurance whose penetration has consistency been on a downward
trend.
0.00%
0.50%
1.00%
1.50%
2.00%
2.50%
3.00%
3.50%
4.00%
-
2,000
4,000
6,000
8,000
10,000
12,000
2012 2013 2014 2015 2016 2017 2018 2019
Gross Domestic Product (GDP) at Markert Prices Life Insurance Penetration
Non - Life Insurance Penetration Insurance Penetration**

35
Statement of Comprehensive Income
Below is the insurance industry’s statement of comprehensive income from 2015 to 2019.
Table 4: Summary of Industry Statement of Comprehensive Income, KES in Billions
2015 2016 2017 2018* 2019 2018 - 2019 Growth, %
2015 -2019 Average growth
Gross Earned Premium 145.27 160.96 178.48 178.80 188.58 5.47% 7.44%
Reinsurance ceded 34.18 37.45 43.22 43.99 46.68 6.10% 8.81%
Net Earned Premium 111.09 123.51 135.27 134.81 141.90 5.26% 7.01%
Investment & Other Income 38.91 41.09 55.28 50.23 69.85 39.07% 10.79%
Net Income 150.00 164.60 190.54 185.04 211.76 14.44% 7.70%
Net Incurred Claims 81.18 85.41 110.00 111.01 117.30 5.67% 8.03%
Total Commissions & Expenses 57.96 64.43 68.53 69.63 76.36 9.66% 8.36%
Profit/(Loss) before Taxation 10.86 14.75 12.01 4.40 18.09 311.69% 47.83%
Provision for Taxation 2.92 5.18 2.66 1.40 5.40 286.17% 45.75%
Profit/(Loss) after Taxation 8.62 9.57 9.35 3.00 12.69 323.59% 48.21%
*Restated In 2019, gross earned premium increased by 5.47% to KES 188.58 billion compared to KES 178.80 billion in 2018. The average growth
rate from 2015 to 2019 stands at 7.44%. Reinsurance ceded also increased by 6.10% in 2019 to KES 46.68 billion which is a significant
rise when compared to 1.78% growth from 2017 to 2018.
The net earned premium also rose by 5.26% from KES 134.81 billion to KES 141.90 billion. Net income increased by 14.83% in 2019 from
KES 185.04 billion to KES 211.76 billion. Profits before taxation stood at KES 18.09 billion from KES 4.40 billion which was a significant
increase of 311.69% compared to 2018.
Figure 10: Industry Statement of Comprehensive Income, KES in Billions:
*Restated
-50.00
0.00
50.00
100.00
150.00
200.00
2015 2015 - 2014Growth, %
2016 2016 - 2015Growth, %
2017 2016 - 2017Growth, %
2018* 2017 - 2018Growth, %
2019
Gross Earned Premium Reinsurance ceded Investment & Other Income Net Incurred Claims Profit/(Loss) after Taxation

36
Statement of Financial Position
The insurance industry’s combined statement of financial position from 2015 to 2019 is shown in the table below
Table 5: Summary of Industry Statement of Financial Position, KES in Billions
2015 2016 2017 2018* 2019 2018-2019 ^Growth,
%
2015-2019 Average Growth,
%
Shareholders Capital, Life Fund & Reserves
95.58 103.88 115.65 119.28 120.25 0.81% 6.80%
Total Assets 466.36 508.95 571.96 630.72 686.02 8.77% 10.42%
Total Liabilities 370.78 456.30 456.30 511.45 565.77 10.62% 11.54%
Net Assets 95.58 103.88 115.65 119.28 120.25 0.82% 6.80%
Profit/(Loss) before Tax 10.86 14.75 12.05 4.40 18.09 311.69% 47.83%
Return on Capital Employed, %
11.37 14.20 10.42 3.68 15.05 308.35% 41.74%
*Restated
In 2019, shareholders capital, life fund and reserves increased to KES 120.25 billion which was a 0.81% increase from KES 119.28 billion
in 2018. The 5-average growth rate from 2015 to 2019 also indicates a 6.80% growth in shareholders capital, life fund and reserves.
Total assets and total liabilities increased by 8.77% and 10.62% respectively compared to 2018 with a 10.42% and 11.54% average growth
rate from 2015 to 2019 respectively. However, with total liabilities growing at a higher rate than total assets (by 1.85% in 2019 from 2018),
there is need to assess how assets are matched to liabilities during asset liability management and closely monitor other contributing
factors. Net assets and profit before tax have also recorded a growth of 0.82% and 311.69% respectively from 2018 to 2019. Return on
capital stood at 15.05% a 308.35% increase from 3.68% in 2018.
Figure 11: Industry Statement of Financial Position, KES in Billions
95.5
8
466.
36
370.
78
95.5
8
10.8
6
11.3
7103.
88
508.
95
456.
30
103.
88
14.7
5
14.2
0
115.
65
571.
96
456.
30
115.
65
12.0
5
10.4
2
119.
28
630.
72
511.
45
119.
27
4.40
3.68
120.
25
686.
02
565.
77
120.
25
18.0
9
15.0
5
S h a r e h o l d e r s C a p i t a l , L i f e F u n d
& R e s e r v e s
T o t a l A s s e t s T o t a l L i a b i l i t i e s N e t A s s e t s P r o f i t / ( L o s s ) b e f o r e T a x
R e t u r n o n C a p i t a l E m p l o y e d , %
2015 2016 2017 2018* 2019
*Reinstated

37
Non-Life Insurance In Kenya, non-life insurance is classified into 14 distinct insurance classes. These are Aviation, Engineering, Fire Domestic and Industrial, Public Liability, Marine, Motor Private and Commercial, Personal Accident, Theft, Work Injury Benefits (WIBA), Medical, Micro Insurance and Miscellaneous insurance. Miscellaneous insurance includes: Agriculture, Golfers, Travel, Bonds, Plate Glass insurances among others.
Table 6: Premium Distribution per Class of Business, KES “000”
Class of Business GWP - 2019 % of Total Premium
Motor Commercial 24,241,888 18.2%
Motor Private 23,598,601 17.7%
Medical 42,417,899 31.8%
Fire 13,066,412 9.8%
Others 30,129,914 22.6%
Total 133,454,717 100.0%
In 2019, total GWP for non-life insurance was KES 133.45 billion mainly driven by the three largest classes led by medical at 31.8%, motor
commercial and motor private at 18.2% and 17.7% respectively. This was a 3.57% growth compared to ( KES 128.9 billion) in 2018 which
can be attributed to three main classes; medical that had an increase of KES 2.13 billion, motor private increased by KES 1.08 billion and
Motor Commercial by KES 0.65 billion.

38
Non-Life Insurance: Premium Growth and Market Share
The table below shows the market share and growth percentages per insurer from 2017 to 2019. In 2019, 38 insurance companies wrote
non-life insurance. Five (5) insurers had a market share exceeding 5%, while 12 out of the 38 companies recorded negative growth in
2019.
Table 7: Non-Life Insurance Premium Growth and Market Share per Company, 2017-2019 in ‘000’ KES
2017 2018 2019
Company Gross Premium
%Growth Market Share
Gross Premium
% Growth Market Share
Gross Premium
% Growth Market Share
AAR 5,799,296 (10.63) 4.60% 5,608,947 (3.28) 4.35% 5,861,920 4.51 4.39%
AIG 3,725,594 1.52 2.96% 3,634,716 (2.44) 2.82% 3,618,271 (0.45) 2.71%
Allianz 346,886 450.09 0.28% 703,858 102.91 0.55% 910,744 29.39 0.68%
Amaco 2,530,083 (9.99) 2.01% 2,179,261 (13.87) 1.69% 1,474,182 (32.35) 1.10%
APA 8,303,076 (7.70) 6.59% 9,558,669 15.12 7.42% 9,337,232 (2.32) 7.00%
Britam General 8,042,402 14.94 6.38% 8,048,802 0.08 6.25% 8,208,739 1.99 6.15%
Cannon 1,283,742 (25.60) 1.02% 1,023,188 (20.30) 0.79% 885,463 (13.46) 0.66%
CIC General 10,141,108 20.62 8.05% 10,210,133 0.68 7.92% 10,654,093 4.35 7.98%
Corporate 353,549 13.09 0.28% 299,160 (15.38) 0.23% 619,311 107.02 0.46%
Directline 3,086,232 (4.30) 2.45% 3,002,685 (2.71) 2.33% 3,353,253 11.68 2.51%
Fidelity Shield 2,389,614 39.15 1.90% 2,273,702 (4.85) 1.76% 2,409,159 5.96 1.81%
First Assurance 2,983,072 (24.11) 2.37% 3,789,808 27.04 2.94% 3,672,369 (3.10) 2.75%
GA Insurance 5,611,152 17.34 4.45% 6,042,556 7.69 4.69% 6,605,860 9.32 4.95%
Geminia 3,411,602 53.46 2.71% 4,518,043 32.43 3.51% 5,183,076 14.72 3.88%
Heritage 5,943,097 11.29 4.71% 5,435,642 (8.54) 4.22% 5,634,335 3.66 4.22%
ICEA LION General 6,103,330 (3.19) 4.84% 5,609,278 (8.09) 4.35% 5,855,812 4.40 4.39%
Intra Africa 1,034,428 1.99 0.82% 1,213,688 17.33 0.94% 1,216,768 0.25 0.91%
Invesco 2,070,194 (10.03) 1.64% 1,531,029 (26.04) 1.19% 1,354,338 (11.54) 1.01%
Jubilee General 11,476,229 (18.55) 9.10% 11,089,507 (3.37) 8.61% 4,341,129 (60.85) 3.25%
Jubilee Health 7,953,848 5.96%
Kenindia 3,014,532 0.62 2.39% 2,854,686 (5.30) 2.22% 2,468,467 (13.53) 1.85%
Kenya Orient General 1,887,710 (25.26) 1.50% 1,446,514 (23.37) 1.12% 1,303,038 (9.92) 0.98%
Kenyan Alliance 1,157,964 5.66 0.92% 1,250,703 8.01 0.97% 1,634,568 30.69 1.22%
Madison 3,930,293 26.68 3.12% 4,480,216 13.99 3.48% 4,211,585 (6.00) 3.16%
Mayfair 2,431,420 5.62 1.93% 3,004,593 23.57 2.33% 3,017,305 0.42 2.26%
Occidental 2,597,392 27.76 2.06% 2,602,359 0.19 2.02% 2,810,253 7.99 2.11%
Pacis 1,217,078 16.79 0.97% 1,307,287 7.41 1.01% 1,480,964 13.29 1.11%
Phoenix 557,913 27.17 0.44% 750,195 34.46 0.58% 796,147 6.13 0.60%
Pioneer 326,297 0.26% 591,857 81.39 0.46% 860,493 45.39 0.64%
Resolution 4,947,645 26.02 3.93% 5,701,730 15.24 4.42% 5,357,624 (6.04) 4.01%
Saham 2,151,195 37.63 1.71% 2,532,957 17.75 1.71% 2,254,014 (11.01) 1.69%
Sanlam General 2,154,916 115.02 1.71% 2,202,960 2.23 1.97% 2,859,045 29.78 2.14%
Takaful 847,828 3.84 0.67% 959,848 13.21 0.74% 1,272,336 32.56 0.95%
Tausi 1,061,069 10.15 0.84% 1,174,177 10.66 0.91% 1,203,620 2.51 0.90%
The Monarch 1,195,339 13.66 0.95% 1,257,635 5.21 0.98% 1,308,997 4.08 0.98%
Trident 1,331,853 5.74 1.06% 537,730 (59.63) 0.42% 653,680 21.56 0.49%
UAP General 9,804,897 (10.72) 7.78% 9,255,348 (5.60) 7.18% 9,371,847 1.26 7.02%
Xplico 804,361 (34.57) 0.64% 1,169,908 45.45 0.91% 1,440,828 23.16 1.08%
Total 126,054,388 2.42 100.00% 128,853,375 2.22 100.00% 133,454,717 3.57 100.00%

39
Non-Life Insurance: Premium Growth and Market Share
The highest market share was 7.98% and the highest premium growth was 107.02%, while the highest decline in growth was -60.85%.
This can be attributed to the split of Jubilee Insurance Company into Jubilee General and Jubilee Health Insurance companies. The figure
below shows the, growth and market share percentage in 2019.
Figure 12: Non-life GWP Market Share and Percentage Growth
-80.00% -60.00% -40.00% -20.00% 0.00% 20.00% 40.00% 60.00% 80.00% 100.00% 120.00%
AAR
AIG
Allianz
Amaco
APA
Britam General
Cannon
CIC General
Corporate
Directline
Fidelity Shield
First Assurance
GA Insurance
Geminia
Heritage
ICEA LION General
Intra Africa
Invesco
Jubilee General
Jubilee Health
Kenindia
Kenya Orient General
Kenyan Alliance
Madison
Mayfair
MUA
Occidental
Pioneer
Resolution
Saham
Sanlam General
Takaful
Tausi
The Monarch
Trident
UAP General
Xplico
%
Market Share Percentage Growth

40
Non-Life Insurance Premium Growth per Class
Public Liability and medical insurance had the highest growth rate of 14.79% and 5.31% respectively. They also recorded the highest five-
year CAGR growth rate of 10.66% and 9.34%, followed by Motor Private (5.53%) and WIBA (5.21%).
Below is a summary of each class with their respective growth rates
Table 8: Premium Growth per Class for Non-Life Business
Class of Business 2018 ‘000’
2019 ‘000’
2019 Growth, % CAGR 2015 – 2019 Growth, %
Aviation 1,871,602 1,855,183 -0.88% 4.76%
Engineering 3,911,664 3,765,734 -3.73% -2.01%
Fire 12,904,889 13,066,412 1.25% 3.35%
Public Liability 2,807,023 3,222,089 14.79% 10.66%
Marine 3,660,055 3,490,217 -4.64% 4.76%
Motor Private 22,513,998 23,598,601 4.82% 5.53%
Motor Commercial 23,589,062 24,241,888 2.77% -0.06%
Personal Accident 3,191,369 3,335,777 4.52% -4.02%
Medical 40,279,263 42,417,899 5.31% 9.34%
Theft 3,900,722 3,870,369 -0.78% 0.30%
WIBA 6,445,578 6,683,448 3.69% 5.21%
Miscellaneous 3,778,151 3,907,098 3.41% 2.08%
Total 128,853,375 133,454,717 3.57% 4.50%
Figure 13: Gross Premium CAGR Percentage Growth for the Last 5 Years (2015-2019)
4.76
%
-2.0
1%
3.97
%
3.27
%
10.6
6%
4.76
%
5.53
%
-0.0
6%
-4.0
2%
9.34
%
0.30
%
5.21
%
2.08
%
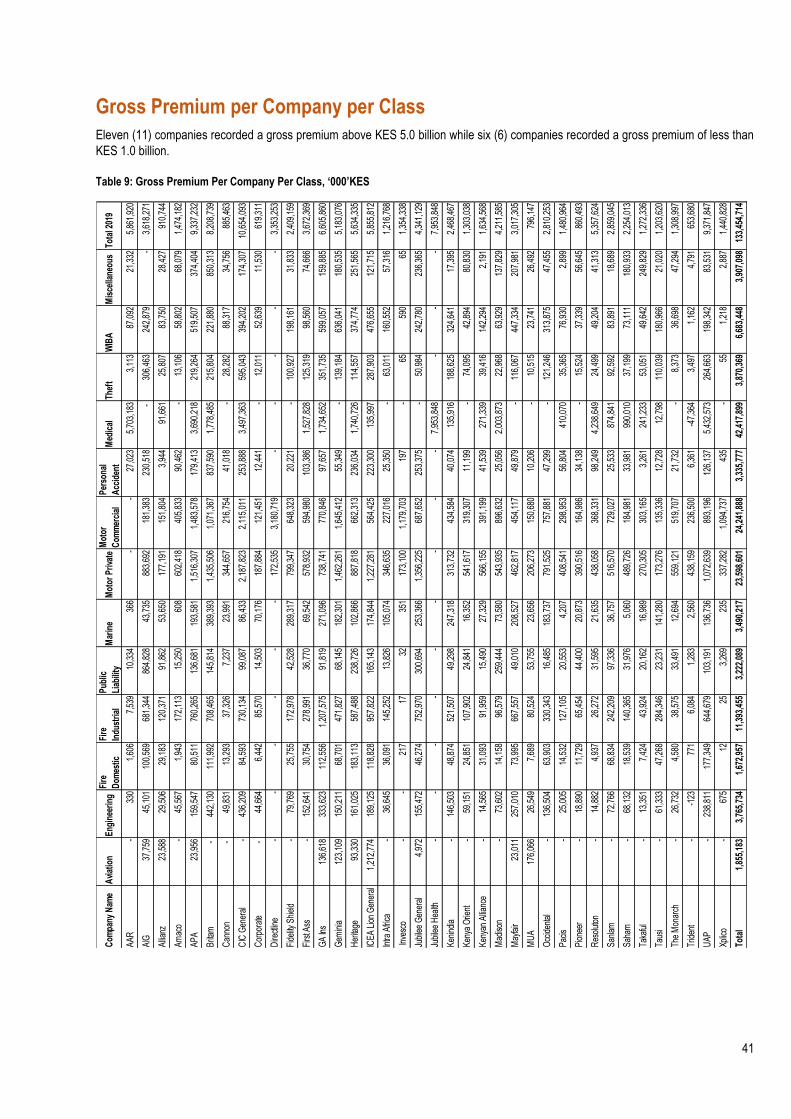
41
Gross Premium per Company per Class
Eleven (11) companies recorded a gross premium above KES 5.0 billion while six (6) companies recorded a gross premium of less than
KES 1.0 billion.
Table 9: Gross Premium Per Company Per Class, ‘000’KES
Com
pany
Nam
eA
viat
ion
Eng
inee
ring
Fire
Dom
estic
Fire
Indu
stri
al
Pub
lic
Liab
ility
Mar
ine
Mot
or P
riva
teM
otor
Com
mer
cial
Per
sona
l
Acc
iden
tM
edic
alTh
eft
WIB
AM
isce
llane
ous
Tota
l 201
9
AA
R-
330
1,60
67,
539
10,3
3436
6-
-27
,023
5,70
3,18
33,
113
87,0
9221
,332
5,86
1,92
0
AIG
37,7
5945
,101
100,
569
681,
344
864,
828
43,7
3588
3,69
218
1,38
323
0,51
8-
306,
463
242,
879
-3,
618,
271
Allia
nz23
,588
29,5
0629
,183
120,
371
91,8
6253
,650
177,
191
151,
804
3,94
491
,661
25,8
0783
,750
28,4
2791
0,74
4
Am
aco
-45
,567
1,94
317
2,11
315
,250
608
602,
418
405,
833
90,4
62-
13,1
0658
,802
68,0
791,
474,
182
AP
A23
,956
159,
547
80,5
1176
0,26
513
6,68
119
3,58
11,
516,
307
1,48
3,57
817
9,41
33,
690,
218
219,
264
519,
507
374,
404
9,33
7,23
2
Brit
am-
442,
130
111,
992
708,
465
145,
814
389,
393
1,43
5,50
61,
071,
367
837,
590
1,77
8,48
521
5,80
422
1,88
085
0,31
38,
208,
739
Can
non
- 49
,831
13,2
9337
,326
7,23
723
,991
344,
657
216,
754
41,0
18-
28,2
8288
,317
34,7
5688
5,46
3
CIC
Gen
eral
-43
6,20
984
,593
730,
134
99,0
8786
,433
2,18
7,82
32,
115,
011
253,
888
3,49
7,36
359
5,04
339
4,20
217
4,30
710
,654
,093
Cor
pora
te-
44,6
646,
442
85,5
7014
,503
70,1
7618
7,88
412
1,45
112
,441
-12
,011
52,6
3911
,530
619,
311
Dire
ctlin
e-
--
--
-17
2,53
53,
180,
719
--
--
-3,
353,
253
Fide
lity S
hiel
d-
79,7
6925
,755
172,
978
42,5
2828
9,31
779
9,34
764
8,32
320
,221
-10
0,92
719
8,16
131
,833
2,40
9,15
9
Firs
t Ass
-15
2,64
130
,754
278,
991
36,7
7069
,542
578,
932
594,
980
103,
386
1,52
7,82
812
5,31
998
,560
74,6
663,
672,
369
GA
Ins
136,
618
333,
623
112,
556
1,20
7,57
591
,819
271,
096
738,
741
770,
846
97,6
571,
734,
652
351,
735
599,
057
159,
885
6,60
5,86
0
Gem
inia
123,
109
150,
211
68,7
0147
1,82
768
,145
182,
301
1,46
2,26
11,
645,
412
55,3
49-
139,
184
636,
041
180,
535
5,18
3,07
6
Her
itage
93,3
3016
1,02
518
3,11
358
7,48
823
8,72
610
2,86
688
7,81
866
2,31
323
6,03
41,
740,
726
114,
557
374,
774
251,
565
5,63
4,33
5
ICE
A L
ion
Gen
eral
1,21
2,77
418
9,12
511
8,82
895
7,82
216
5,14
317
4,84
41,
227,
281
564,
425
223,
300
135,
997
287,
903
476,
655
121,
715
5,85
5,81
2
Intra
Afri
ca-
36,6
4536
,091
145,
252
13,8
2610
5,07
434
6,63
522
7,01
625
,350
-63
,011
160,
552
57,3
161,
216,
768
Inve
sco
--
217
1732
351
173,
100
1,17
9,70
319
7-
6559
065
1,35
4,33
8
Jubi
lee
Gen
eral
4,97
215
5,47
246
,274
752,
970
300,
694
253,
366
1,35
6,22
568
7,65
225
3,37
5-
50,9
8424
2,78
023
6,36
54,
341,
129
Jubi
lee
Hea
lth-
--
--
--
--
7,95
3,84
8-
--
7,95
3,84
8
Ken
indi
a-
146,
503
48,8
7452
1,50
749
,298
247,
318
313,
732
434,
584
40,0
7413
5,91
618
8,62
532
4,64
117
,395
2,46
8,46
7
Ken
ya O
rient
-59
,151
24,8
5110
7,90
224
,841
16,3
5254
1,61
731
9,30
711
,199
-74
,095
42,8
9480
,830
1,30
3,03
8
Ken
yan
Allia
nce
-14
,565
31,0
9391
,959
15,4
9027
,329
566,
155
391,
199
41,5
3927
1,33
939
,416
142,
294
2,19
11,
634,
568
Mad
ison
-73
,602
14,1
5896
,579
259,
444
73,5
8054
3,93
589
6,63
225
,056
2,00
3,87
322
,968
63,9
2913
7,82
94,
211,
585
May
fair
23,0
1125
7,01
073
,995
667,
557
49,0
1020
8,52
746
2,81
745
4,11
749
,879
-11
6,06
744
7,33
420
7,98
13,
017,
305
MU
A17
6,06
626
,549
7,68
980
,524
53,7
5523
,656
206,
273
150,
680
10,2
06-
10,5
1523
,741
26,4
9279
6,14
7
Occ
iden
tal
-13
6,50
463
,903
330,
343
16,4
8518
3,73
779
1,52
575
7,88
147
,299
-12
1,24
631
3,87
547
,455
2,81
0,25
3
Pac
is-
25,0
0514
,532
127,
105
20,5
534,
207
408,
541
298,
953
56,8
0441
0,07
035
,365
76,9
302,
899
1,48
0,96
4
Pio
neer
-18
,890
11,7
2965
,454
44,4
0020
,873
390,
516
164,
986
34,1
38-
15,5
2437
,339
56,6
4586
0,49
3
Res
olut
on-
14,8
824,
937
26,2
7231
,595
21,6
3543
8,05
836
8,33
198
,249
4,23
8,64
924
,499
49,2
0441
,313
5,35
7,62
4
San
lam
-72
,766
68,8
3424
2,20
997
,336
36,7
5751
6,57
072
9,02
725
,533
874,
841
92,5
9283
,891
18,6
892,
859,
045
Sah
am-
68,1
3218
,539
140,
365
31,9
765,
060
489,
726
184,
981
33,9
8199
0,01
037
,199
73,1
1118
0,93
32,
254,
013
Taka
ful
-13
,351
7,42
443
,924
20,1
6216
,989
270,
305
303,
165
3,26
124
1,23
353
,051
49,6
4224
9,82
91,
272,
336
Taus
i-
61,3
3347
,268
284,
346
23,2
3114
1,28
017
3,27
613
5,33
612
,728
12,7
9811
0,03
918
0,96
621
,020
1,20
3,62
0
The
Mon
arch
-26
,732
4,58
038
,575
33,4
9112
,694
559,
121
519,
707
21,7
32-
8,37
336
,698
47,2
941,
308,
997
Trid
ent
--1
2377
16,
084
1,28
32,
560
438,
159
236,
500
6,36
1-4
7,36
43,
497
1,16
24,
791
653,
680
UA
P-
238,
811
177,
349
644,
679
103,
191
136,
736
1,07
2,63
989
3,19
612
6,13
75,
432,
573
264,
663
198,
342
83,5
319,
371,
847
Xplic
o-
675
1225
3,26
923
533
7,28
21,
094,
737
435
-55
1,21
82,
887
1,44
0,82
8
Tota
l1,
855,
183
3,76
5,73
41,
672,
957
11,3
93,4
553,
222,
089
3,49
0,21
723
,598
,601
24,2
41,8
883,
335,
777
42,4
17,8
993,
870,
369
6,68
3,44
83,
907,
098
133,
454,
714
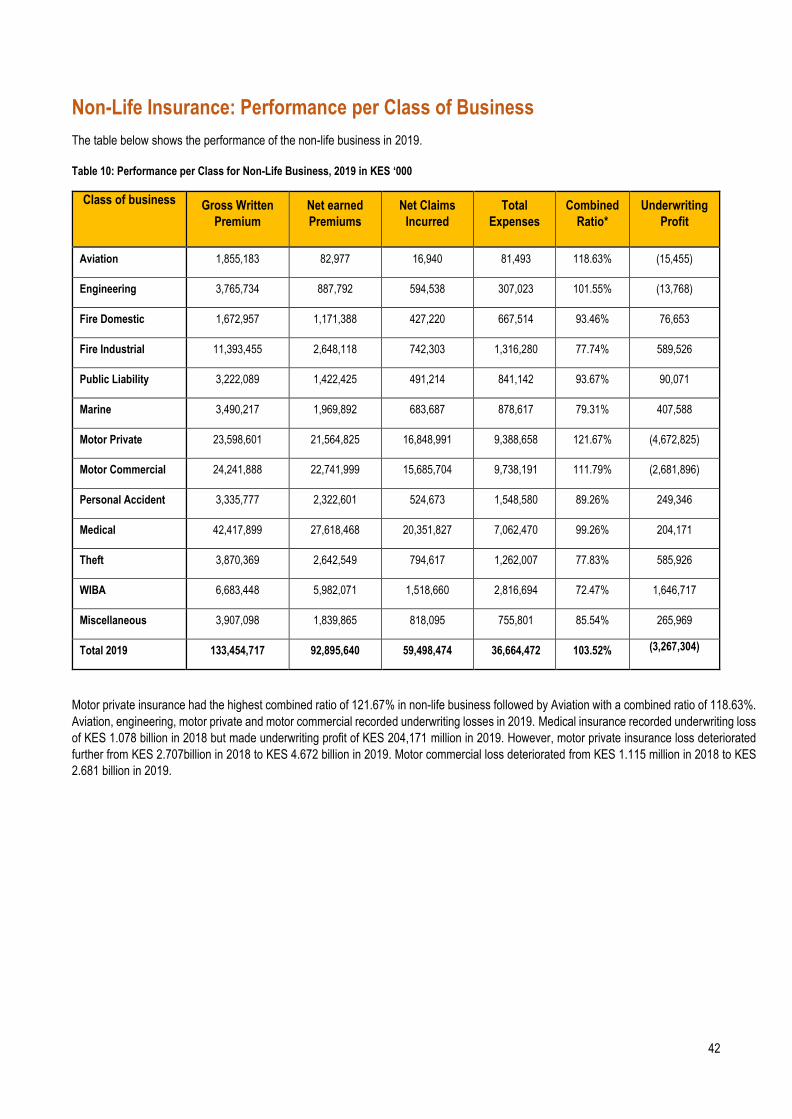
42
Non-Life Insurance: Performance per Class of Business
The table below shows the performance of the non-life business in 2019.
Table 10: Performance per Class for Non-Life Business, 2019 in KES ‘000
Class of business
Gross Written
Premium
Net earned
Premiums
Net Claims
Incurred
Total
Expenses
Combined
Ratio*
Underwriting
Profit
Aviation 1,855,183 82,977 16,940 81,493 118.63% (15,455)
Engineering 3,765,734 887,792 594,538 307,023 101.55% (13,768)
Fire Domestic 1,672,957 1,171,388 427,220 667,514 93.46% 76,653
Fire Industrial 11,393,455 2,648,118 742,303 1,316,280 77.74% 589,526
Public Liability 3,222,089 1,422,425 491,214 841,142 93.67% 90,071
Marine 3,490,217 1,969,892 683,687 878,617 79.31% 407,588
Motor Private 23,598,601 21,564,825 16,848,991 9,388,658 121.67% (4,672,825)
Motor Commercial 24,241,888 22,741,999 15,685,704 9,738,191 111.79% (2,681,896)
Personal Accident 3,335,777 2,322,601 524,673 1,548,580 89.26% 249,346
Medical 42,417,899 27,618,468 20,351,827 7,062,470 99.26% 204,171
Theft 3,870,369 2,642,549 794,617 1,262,007 77.83% 585,926
WIBA 6,683,448 5,982,071 1,518,660 2,816,694 72.47% 1,646,717
Miscellaneous 3,907,098 1,839,865 818,095 755,801 85.54% 265,969
Total 2019 133,454,717 92,895,640 59,498,474 36,664,472 103.52% (3,267,304)
Motor private insurance had the highest combined ratio of 121.67% in non-life business followed by Aviation with a combined ratio of 118.63%.
Aviation, engineering, motor private and motor commercial recorded underwriting losses in 2019. Medical insurance recorded underwriting loss
of KES 1.078 billion in 2018 but made underwriting profit of KES 204,171 million in 2019. However, motor private insurance loss deteriorated
further from KES 2.707billion in 2018 to KES 4.672 billion in 2019. Motor commercial loss deteriorated from KES 1.115 million in 2018 to KES
2.681 billion in 2019.

43
Motor Insurance
Motor insurance comprises motor private and motor commercial. In 2019, the gross written premium for motor insurance was KES 47.84
billion; a 3.77% growth from KES 46.1 billion in 2018. Motor private contributed 49.33% while motor commercial contributed 50.67% of
the motor insurance premium. The contribution of motor insurance premium to the GWP was 35.9%, similar to 2018.
Motor private recorded 4.82% growth from 22.51 billion in 2018 to KES 23.60 billion in 2019. Motor commercial premium on the other
hand increased from KES 23.59 billion in 2018 to KES 24.24 billion in 2019, representing a 2.77% growth.
Figure 14: Motor Gross Written Premium Trend (2015 – 2019), KES ‘000
-
5,000,000
10,000,000
15,000,000
20,000,000
25,000,000
30,000,000
35,000,000
40,000,000
45,000,000
50,000,000
2015 2016 2017 2018 2019
Motor private Motor commercial Motor Combined

44
Motor Commercial Performance Summary
Table 11: Motor Commercial Performance Summary, 2019 in ‘000’ KES
Company Gross Written Premium
Re-insurance Ceded
Net Earned Premium
Net Claims Incurred
Total Expenses
Underwriting Profit/Loss
1 AIG 181,383 106,769 70,864 128,032 47,061 104,229
2 Allianz 151,804 17,195 112,100 45,295 61,172 5,633
3 Amaco 405,833 10,177 395,656 342,686 241,122 (188,152)
4 APA 1,483,578 24,480 1,439,263 1,261,903 432,025 (254,665)
5 Britam 1,071,367 74,309 1,035,338 882,192 638,953 (485,807)
6 Cannon 216,754 3,873 254,945 204,485 96,050 (45,590)
7 CIC General 2,115,011 71,756 2,110,959 1,397,604 879,063 (165,708)
8 Corporate 121,451 3,952 49,751 77,335 49,735 (77,319)
9 Directline 3,180,719 101,324 3,026,410 2,156,369 1,081,375 (211,334)
10 Fidelity Shield 648,323 52,955 660,335 523,638 164,693 (27,996)
11 First Ass. 594,980 16,382 543,836 333,740 310,523 (100,427)
12 GA Ins. 770,846 42,640 706,547 449,867 177,753 78,927
13 Geminia 1,645,412 2,237 1,606,760 1,004,030 541,655 61,075
14 Heritage 662,313 30,517 609,804 328,196 226,506 55,103
15 ICEA Lion Gen 564,425 51,837 475,319 198,557 260,712 16,050
16 Intra Africa 227,016 5,265 233,821 161,551 82,090 (9,820)
17 Invesco 1,179,703 113,369 1,079,838 467,182 630,028 (17,371)
18 Jubilee General 687,652 39,679 635,642 782,609 259,656 (406,623)
19 Kenindia 434,584 16,791 500,620 662,312 153,189 (314,880)
20 Kenya Orient 319,307 8,592 378,402 417,701 228,206 (267,505)
21 Kenyan Alliance 391,199 16,618 342,973 162,120 215,072 (34,218)
22 Madison 896,632 12,512 889,312 550,436 349,501 (10,625)
23 Mayfair 454,117 31,482 409,675 267,211 124,012 18,452
24 MUA 150,680 8,846 102,992 40,426 66,980 (4,413)
25 Occidental 757,881 6,926 743,847 481,796 272,861 (10,811)
26 Pacis 298,953 24,368 289,171 141,510 161,928 (14,267)
27 Pioneer 164,986 1,927 152,221 83,194 60,159 8,868
28 Resolution 368,331 19,153 333,935 318,021 152,958 (137,045)
29 Sanlam 729,027 39,501 530,526 222,853 275,101 32,572
30 Saham 184,981 14,036 168,290 50,403 91,445 26,442
31 Takaful 303,165 115,682 165,930 87,253 98,844 (20,166)
32 Tausi 135,336 4,360 128,451 80,409 64,553 (16,511)
33 The Monarch 519,707 5,443 482,611 255,876 238,478 (11,743)
34 Trident 236,500 9 182,269 143,988 122,916 (84,635)
35 UAP 893,196 14,199 921,039 501,603 322,913 96,523
36 Xplico 1,094,737 18,764 972,545 473,322 558,904 (59,681)
Total 24,241,888 1,127,925 22,741,999 15,685,704 9,738,191 (2,681,896)
Seven (7) companies wrote premiums of KES.1.0 billion and above. Net earned premium was KES.22.74 billion while net claims incurred
was KES 15.69 billion. The total expenses amounted to KES 9.74 billion. The bottom-line in 2019 was a loss of KES 2.68 billion. Out of
the 36 companies that underwrote motor commercial in 2019, 25 companies made losses compared to 21 companies in 2018.

45
Motor Private Performance Summary
Table 12: Motor Private Performance Summary, 2019 in ‘000’ KES
Company Gross Written Premium
Re-insurance Ceded
Net Earned Premium
Net Claims Incurred
Total Expenses
Underwriting Profit/Loss
1 AIG 883,692 669,392 213,872 117,716 42,501 53,655
2 Allianz 177,191 19,976 139,659 120,962 72,712 (54,016)
3 Amaco 602,418 14,636 587,782 329,845 314,525 (56,588)
4 APA 1,516,307 21,964 1,411,350 1,358,561 432,508 (379,719)
5 Britam 1,435,506 71,557 1,324,670 1,181,776 816,546 (673,652)
6 Cannon 344,657 3,267 346,697 241,607 155,667 (50,576)
7 CIC General 2,187,823 73,477 2,120,839 1,953,103 745,817 (578,081)
8 Corporate 187,884 3,952 87,265 98,765 81,892 (93,392)
9 Directline 172,535 5,496 164,164 132,118 66,255 (34,208)
10 Fidelity Shield 799,347 37,372 755,666 649,145 266,620 (160,099)
11 First Ass. 578,932 15,935 575,753 363,751 298,662 (86,660)
12 GA Ins. 738,741 47,826 632,350 473,834 162,900 (4,384)
13 Geminia 1,462,261 5,576 1,394,556 1,448,185 484,302 (537,931)
14 Heritage 887,818 35,448 800,813 483,869 374,995 (58,051)
15 ICEA Lion Gen 1,227,281 73,765 1,041,115 709,380 540,394 (208,659)
16 Intra Africa 346,635 5,265 368,911 252,618 123,881 (7,588)
17 Invesco 173,100 12,372 160,790 65,130 91,944 3,715
18 Jubilee General 1,356,225 50,445 1,190,901 1,231,439 517,160 (557,698)
19 Kenindia 313,732 6,074 322,332 317,694 109,794 (105,156)
20 Kenya Orient 541,617 8,592 537,053 206,871 321,546 8,637
21 Kenyan Alliance 566,155 24,320 536,550 130,674 314,014 91,862
22 Madison 543,935 7,591 647,943 585,971 213,546 (151,575)
23 Mayfair 462,817 28,148 410,971 224,071 175,269 11,631
24 MUA 206,273 8,747 161,423 91,981 92,124 (22,681)
25 Occidental 791,525 7,630 791,397 528,705 289,829 (27,137)
26 Pacis 408,541 28,362 356,961 401,618 219,111 (263,768)
27 Pioneer 390,516 1,559 347,570 242,596 140,562 (35,589)
28 Resolution 438,058 22,903 468,457 349,931 199,579 (81,053)
29 Sanlam 516,570 23,590 433,913 349,683 222,272 (138,042)
30 Saham 489,726 19,407 483,176 329,579 261,169 (107,572)
31 Takaful 270,305 103,144 147,944 77,795 88,131 (17,981)
32 Tausi 173,276 3,145 171,598 57,751 84,290 29,558
33 The Monarch 559,121 7,139 590,820 364,044 267,171 (40,395)
34 Trident 438,159 175 355,503 307,434 191,520 (143,451)
35 UAP 1,072,639 (10,810) 1,202,575 913,387 439,251 (150,063)
36 Xplico 337,282 10,611 281,485 157,404 170,200 (46,118)
Total 23,598,601 1,468,048 21,564,825 16,848,991 9,388,658 (4,672,825)
Seven (7) companies wrote premiums of KES.1.0 billion and above. Net earned premium was KES 21.56 billion, an increase from KES 20.69 billion in 2018. Net claims incurred was KES 16.85 billion in 2019, an increase from KES 14.26 billion in 2018. The total expenses was KES 9.39 billion in 2019, an increase from KES 9.14 billion in 2018. The bottom-line in 2019 was a loss of KES 4.67
billion. 30 companies made losses in 2019 compared to 23 companies in 2018. Four companies made underwriting losses of KES 0.5 billion
and above. Likewise, four companies had total expenses of KES 0.5 billion and above. Further, five companies recorded Net Claims Incurred
of KES 1.0 billion and above.

46
Fire Insurance Performance
Fire insurance is made up of Fire Domestic and Fire Industrial insurance. Fire insurance GWP was KES 13.07 billion in 2019 compared to KES
12.90 billion in 2018, a 1.25% increase. Fire Industrial GWP was KES 11.39 billion (87%) and Fire Domestic was KES 1.67 billion (13%). Total
net earned premium was KES 3.82 billion, net claims incurred KES 1.67 billion, total expenses amounted to KES 1.98 billion while underwriting
profit was KES 666.18 million.
Figure 15: Proportion of Fire domestic and Fire industrial GWP
Figure 16: Fire Insurance Gross Written Premium, 2015-2019 in KES ‘000
11,450,797
12,137,337
13,130,838
12,904,889 13,066,412
10500000
11000000
11500000
12000000
12500000
13000000
13500000
2015 2016 2017 2018 2019
Fire Domestic13%
Fire Industrial87%

47
Fire Domestic Performance Summary
Table 13: Performance Summary for Fire Domestic Insurance, 2019 in KES ‘000
Company Gross Written Premium
Re-insurance Ceded
Net Earned Premium
Net Claims Incurred
Total Expenses
Underwriting Profit/Loss
1 AAR 1,606 1,392 246 117 38 91
2 AIG 100,569 67,190 34,248 7,618 24,057 2,573
3 Allianz 29,183 26,723 1,968 14,557 11,611 (24,200)
4 Amaco 1,943 1,277 666 2,699 554 (2,586)
5 APA 80,511 24,262 55,499 32,733 25,443 (2,677)
6 Britam 111,992 25,195 81,131 17,631 53,024 10,476
7 Cannon 13,293 2,329 8,969 1,837 11,140 (4,009)
8 CIC General 84,593 2,811 86,031 14,584 45,790 25,657
9 Corporate 6,442 3,151 4,245 1,049 2,782 414
10 Fidelity Shield 25,755 11,208 15,711 (2,152) 6,025 11,838
11 First Ass. 30,754 7,719 22,126 4,242 15,166 2,718
12 GA Ins. 112,556 30,426 77,400 45,396 27,863 4,141
13 Geminia 68,701 14,227 55,339 17,683 22,159 15,496
14 Heritage 183,113 31,841 137,517 32,997 95,268 9,252
15 ICEA Lion Gen 118,828 37,056 86,958 14,902 36,235 35,821
16 Intra Africa 36,091 7,912 23,259 32,583 10,483 (19,806)
17 Invesco 217 53 179 1,250 132 (1,202)
18 Jubilee General 46,274 9,343 36,981 21,107 44,911 (29,037)
19 Kenindia 48,874 14,446 36,666 7,653 18,091 10,922
20 Kenya Orient 24,851 5,952 14,991 -6,585 11,025 10,550
21 Kenyan Alliance 31,093 2,862 25,548 6,594 20,330 (1,377)
22 Madison 14,158 2,994 27,214 3,894 6,283 17,038
23 Mayfair 73,995 40,918 34,628 19,353 14,176 1,099
24 MUA 7,689 417 6,591 3,458 3,958 (825)
25 Occidental 63,903 19,128 45,764 77,735 18,990 (50,961)
26 Pacis 14,532 4,121 9,270 1,685 8,283 (698)
27 Pioneer 11,729 2,263 8,532 1,263 3,189 4,079
28 Resolution 4,937 734 4,372 1,031 2,456 884
29 Sanlam 68,834 4,251 55,469 4,147 29,901 21,422
30 Saham 18,539 7,014 13,359 3,699 8,718 941
31 Takaful 7,424 2,833 4,063 2,136 2,421 (494)
32 Tausi 47,268 12,522 34,008 17,013 19,646 (2,650)
33 The Monarch 4,580 24 3,077 531 2,315 231
34 Trident 771 106 672 -839 1,250 261
35 UAP 177,349 34,042 118,686 23,620 63,793 31,273
36 Xplico 12 - 5 0 7 (2)
37 Total 1,672,957 458,742 1,171,388 427,220 667,514 76,653
Six (6) companies underwrote fire domestic premium of KES 100 Million and above with the highest premium being KES 183.11 Million. Total
re-insurance ceded was KES 458.74 Million, while the underwriting profits improved from KES 55,864 in 2018 to KES 76.65 Million in 2019.
Fourteen (14) companies made underwriting losses.

48
Fire Industrial Performance Summary
Table 14: Performance Summary for Fire Industrial Insurance, 2019 in KES ‘000
Company Gross Written Premium
Re-insurance Ceded
Net Earned Premium
Net Claims Incurred
Total Expenses
Underwriting Profit/Loss
1 AAR 7,539 7,312 (306) 1,132 293 (1,732)
2 AIG 681,344 612,432 59,729 29,232 (12,937) 43,434
3 Allianz 120,371 95,175 19,109 14,263 49,189 (44,343)
4 Amaco 172,113 172,948 (835) 4,687 (72,260) 66,739
5 APA 760,265 567,165 200,986 19,077 150,400 31,509
6 Britam 708,465 378,014 157,363 72,847 96,989 (12,473)
7 Cannon 37,326 22,558 14,777 (69,014) 13,152 70,639
8 CIC General 730,134 474,364 248,956 92,206 73,018 83,732
9 Corporate 85,570 21,190 52,746 29,495 55,715 (32,464)
10 Fidelity Shield 172,978 142,629 27,103 11,986 4,985 10,132
11 First Ass. 278,991 185,729 90,169 35,441 51,964 2,764
12 GA Ins. 1,207,575 1,008,604 148,977 60,415 87,877 685
13 Geminia 471,827 290,186 239,727 (18,304) 87,387 170,645
14 Heritage 587,488 423,262 128,926 2,233 95,047 31,646
15 ICEA Lion Gen 957,822 719,905 180,613 42,892 (7,735) 145,456
16 Intra Africa 145,252 41,359 80,046 29,269 41,079 9,698
17 Invesco 17 2,535 (2,423) (1) 41 (2,464)
18 Jubilee General 752,970 572,131 172,797 64,974 130,922 (23,099)
19 Kenindia 521,507 464,287 62,668 97,115 98,516 (132,964)
20 Kenya Orient 107,902 72,754 31,631 (7,779) 13,898 25,512
21 Kenyan Alliance 91,959 15,707 77,842 20,569 40,515 16,758
22 Madison 96,579 53,455 33,939 22,661 36,914 (25,636)
23 Mayfair 667,557 570,672 90,876 53,391 (6,874) 44,359
24 MUA 80,524 59,435 26,827 2,820 30,096 (6,089)
25 Occidental 330,343 264,923 64,506 38,279 6,864 19,363
26 Pacis 127,105 47,374 67,900 21,100 71,545 (24,745)
27 Pioneer 65,454 55,478 11,532 4,037 20,476 (12,981)
28 Resolution 26,272 24,592 4,280 2,567 9,959 (8,246)
29 Sanlam 242,209 230,207 15,032 8,000 (4,918) 11,950
30 Saham 140,365 144,929 15,732 6,637 (3,336) 12,421
31 Takaful 43,924 16,761 24,040 12,641 14,321 (2,922)
32 Tausi 284,346 219,894 62,573 7,142 7,041 48,389
33 The Monarch 38,575 30,327 8,682 538 (4,515) 12,659
34 Trident 6,084 5,847 2,737 (8,882) 159 11,461
35 UAP 644,679 417,422 228,850 38,636 140,476 49,738
36 Xplico 25 1 11 0 16 (5)
Total 11,393,455 8,431,564 2,648,118 742,303 1,316,280 589,526
Only one insurance company underwrote fire industrial insurance premium above one billion. Total re-insurance ceded was KES 8.43 billion
while underwriting profits improved from KES 24,082 in 2018 to KES 589.52million in 2019. Fourteen (14) companies recorded underwriting
losses in 2019.

49
Medical Insurance Performance
The GWP was KES 42.42 billion, a 5.31% increase from KES 40.28 billion in 2018. Net earned premium increased from KES 27.15 billion in
2018 to KES 27.62 billion in 2019. The total expenses decreased marginally from KES 7.70 billion in 2018 to KES 7.06 billion in 2019.
Underwriting profit was KES 204.17 million compared to an underwriting loss of KES 1.08 billion in 2018. Medical insurance made some
underwriting profit after a long period of losses.
Figure 17: Medical Insurance Gross Written Premium (2015-2019), KES ‘000
The table below shows a summary of the performance of medical insurance in 2019.
Table 15: Medical Insurance Performance, 2019 in KES ‘000
Company Gross Written Premium
Re-insurance Ceded
Net Earned Premium
Net Claims Incurred
Total Expenses
Underwriting Profit/Loss
1 AAR 5,703,183 2,920,491 3,015,485 1,656,901 898,908 459,677
2 Allianz 91,661 91,661 61 (1) 18,934 (18,872)
3 APA 3,690,218 1,551,451 2,304,139 2,012,982 475,109 (183,952)
4 Britam 1,778,485 35,850 1,817,640 1,333,922 582,463 (98,745)
5 CIC General 3,497,363 88,981 3,193,026 2,526,840 576,020 90,166
6 First Assurance 1,527,828 916,275 631,462 431,979 127,125 72,358
7 GA Insurance 1,734,652 1,300,989 401,782 282,205 121,625 (2,048)
8 Heritage 1,740,726 1,065,358 696,021 465,512 221,801 8,707
9 ICEA Lion General 135,997 28,581 102,613 87,832 68,909 (54,128)
10 Jubilee Health 7,953,848 2,377,082 5,260,309 3,701,399 1,049,108 509,802
11 Kenindia 135,916 3,311 127,949 131,208 47,238 (50,497)
12 Kenyan Alliance 271,339 52,804 55,787 61,299 107,862 (113,375)
13 Madison 2,003,873 7,875 2,210,035 1,764,703 491,880 (46,548)
14 Pacis 410,070 142,132 213,197 166,052 63,444 (16,299)
15 Resolution 4,238,649 2,860,611 1,560,254 1,067,244 663,969 (170,959)
16 Saham 990,010 747,789 249,263 230,613 41,847 (23,196)
17 Sanlam 874,841 365,019 468,690 405,730 135,710 (72,750)
18 Takaful 241,233 92,050 132,033 69,428 78,651 (16,046)
19 Tausi 12,798 - 12,721 4,420 6,319 1,982
20 Trident (47,364) 33,357 (8,981) (49,084) (22,777) 62,881
21 UAP General 5,432,573 126,984 5,176,427 4,000,948 1,308,325 (132,846)
22 Xplico - - (1,446) (305) - (1,141)
Totals 42,417,899 14,808,649 27,618,468 20,351,827 7,062,470 204,171
Eleven (11) companies underwrote GWP above KES 1.0 Billion. The highest GWP was KES 7.95 billion. Only seven (7) companies out of 22
made underwriting profits.
13,071,119
20,818,967
25,310,200
29,673,519
38,695,334 38,420,038 40,279,263
42,417,899
-
5,000,000
10,000,000
15,000,000
20,000,000
25,000,000
30,000,000
35,000,000
40,000,000
45,000,000
2012 2013 2014 2015 2016 2017 2018 2019

50
Other Classes
Aviation Insurance
Aviation insurance GWP recorded a negative growth rate of -0.88% from KES 1.87 billion in 2018 to KES 1.86 billion in 2019. The overall result
was a loss of KES 15.45 million.
Figure 18: GWP Trend for Aviation Insurance (2015 – 2019), KES ’000
Table 16: Aviation Insurance Performance, 2019 in KES ‘000
2019 2018 % Growth
Gross Written Premium 1,855,183 1,871,602 (0.88)%
Re-insurance Ceded 1,831,973 1,717,061 6.69%
Net Earned Premium 82,977 16,137 414.21%
Net Claims Incurred 16,940 27,376 (38.12)%
Total Expenses 81,493 89,658 (9.11)%
Underwriting Profit/Loss (15,455) (100,895) (84.68)%
Reinsurance ceded increased by 6.69%, net earned premium increased by 414.21%, net claims incurred and total expenses decreased by
38.12% and 9.11% respectively while underwriting loss decreased by 84.68% from KES 100.90 million in 2018 to KES 15.46 million in 2019.
1,542,7811,478,344
1,568,897
1,871,602 1,855,183
2015 2016 2017 2018 2019

51
Engineering Insurance
Engineering insurance GWP was KES 3.77 billion in 2019 compared to KES 3.91 billion in 2018, a 3.7% decrease.
Figure 19: GWP Trend for Engineering Insurance (2015 – 2019), KES ‘000
Table 17: Engineering Insurance Performance, 2019 in KES ‘000
2019 2018 % Growth
Gross Written Premium 3,765,734 3,911,664 (3.7)%
Re-insurance Ceded 2,953,910 3,128,520 (5.6)%
Net Earned Premium 887,792 945,526 (6.1)%
Net Claims Incurred 594,538 419,592 41.7%
Total Expenses 307,023 501,451 (38.8)%
Underwriting Profit/Loss (13,768) 24,487 (156.2)%
Reinsurance ceded, net earned premiums, total expenses decreased by 5.6%, 6.1% and 38.8% respectively. Net claims incurred increased by
41.7% from KES 419.59 million in 2018 to 594.54 million in 2019. Engineering insurance recorded an underwriting loss of KES 13.77 million
down from underwriting profit of KES 24.49 million in 2018; a 156.2% decrease.
4,10
5,73
4
3,73
9,50
0
4,33
1,98
3
3,91
1,66
4
3,76
5,73
4
2 0 1 5 2 0 1 6 2 0 1 7 2 0 1 8 2 0 1 9

52
Public Liability Insurance
Public Liability had the highest GWP growth of 14.8% compared to all other non-life insurances. The GWP grew to KES 3.22 billion in 2019
from KES 2.81 billion in 2018.
Figure 20: GWP Trend for Public Liability Insurance (2015 – 2019), KES ‘000
Table 18: Public Liability Insurance Performance, 2019 in KES ‘000
2019 2018 % Growth
Gross Written Premium 3,222,089 2,807,023 14.8%
Re-insurance Ceded 1,706,030 1,672,033 2.0%
Net Earned Premium 1,422,425 1,295,864 9.8%
Net Claims Incurred 491,214 467,477 5.1%
Total Expenses 841,142 603,860 39.3%
Underwriting Profit/Loss 90,071 224,527 (59.9)%
Reinsurance ceded increased by 2.0% from KES 1,430 in 2018 to KES 1.71 billion in 2019. Net earned premium, net claims incurred and total
expenses increased by 9.8%, 5.1% and 39.3% respectively. Despite the growth in GWP, the underwriting profit decreased from KES 224.53
million in 2018 to KES 90.07 million in 2019, a decline of 59.9%.
2,147,973
2,613,643 2,737,450 2,807,023
3,222,089
-
500,000
1,000,000
1,500,000
2,000,000
2,500,000
3,000,000
3,500,000
2015 2016 2017 2018 2019

53
Marine Insurance
Marine insurance GWP declined from KES 3.66 billion in 2018 to KES 3.49 billion in 2019 ; a 4.6% decline. The decline since 2017 can be
attributed to non- enforcement of the legal requirement to have marine cargo insured locally. Marine insurance had the highest decline in growth
compared to other classes of non-life insurances in 2019.
Figure 21: GWP Trend for Marine Insurance (2015 – 2019), KES ‘000
Table 19: Marine Insurance Performance, 2019 in KES ‘000
2019 2018 % Growth
Gross Written Premium 3,490,217 3,660,055 (4.6)%
Re-insurance Ceded 1,635,876 1,770,523 (7.6)%
Net Earned Premium 1,969,892 2,025,409 (2.7)%
Net Claims Incurred 683,687 665,534 2.7%
Total Expenses 878,617 920,668 (4.6)%
Underwriting Profit/Loss 407,588 439,205 (7.2)%
The reinsurance ceded, net earned premium, and total expenses decreased by 7.6%, 2.7% and 4.6% respectively. Conversely, the net claims
incurred increased from KES 665.53 million in 2018 to KES 683.69 million in 2019; a 2.7% increase. The underwriting profit declined by 7.2%
from KES 439.21 million in 2018 to KES 407.59 million in 2019.
2,900,033
2,648,005
3,748,394 3,660,055 3,490,217
-
500,000
1,000,000
1,500,000
2,000,000
2,500,000
3,000,000
3,500,000
4,000,000
2015 2016 2017 2018 2019

54
Theft Insurance
GWP for theft insurance stood at KES 3.87 billion in 2019 compared to KES 3.90 billion in 2018, a 0.8% decline. Though slight, this is the first
decline in growth recorded since 2015.
Figure 22: GWP Trend for Theft Insurance (2015 – 2019), KES ‘000
Table 20: Theft Insurance Performance, 2019 in KES ‘000
2019 2018 % Growth
Gross Written Premium 3,870,369 3,900,722 -0.8%
Re-insurance Ceded 1,192,875 1,051,296 13.5%
Net Earned Premium 2,642,549 2,807,097 -5.9%
Net Claims Incurred 794,617 1,202,606 -33.9%
Total Expenses 1,262,007 1,251,647 0.8%
Underwriting Profit/Loss 585,926 352,841 66.1%
The reinsurance ceded grew from KES 1.05 million in 2018 to KES 1.19 million in 2019; a 13.5% growth. Net earned premiums and net claims
incurred experienced a decline of growth by 5.9% and 33.9% respectively. Total expenses grew slightly by 0.8% from KES 1.25 billion in 2018
to KES 1.26 billion in 2019. On a positive note, the underwriting profit increased by 66.1% to KES 585.93 million in 2019 up from KES 352.84
million in 2018.
3,458,000
3,810,042 3,814,844
3,900,722 3,870,369
3,200,000
3,300,000
3,400,000
3,500,000
3,600,000
3,700,000
3,800,000
3,900,000
4,000,000
2015 2016 2017 2018 2019

55
Personal Accident Insurance
GWP for personal accident insurance was KES 3.34 billion in 2019 compared to KES 3.19 billion in 2018, a 4.5% increase. This is a positive
shift from the previous decline in growth of 12.3% in 2018.
Figure 23: GWP Trend for Personal Accident Insurance (2015 – 2019), KES ‘000
Table 21: Personal Accident Insurance Performance, 2019 in KES ‘000
2019 2018 % Growth
Gross Written Premium 3,335,777 3,191,369 4.5%
Re-insurance Ceded 1,019,385 1,004,588 1.5%
Net Earned Premium 2,322,601 2,324,082 -0.1%
Net Claims Incurred 524,673 631,827 -17.0%
Total Expenses 1,548,580 1,306,285 18.5%
Underwriting Profit/Loss 249,346 385,967 -35.4%
Besides the increased growth in GWP, reinsurance ceded also experienced an increase in growth by 1.5% in 2019. However, net earned
premium and net claims incurred declined by 0.1% and 17.0% respectively. The total expenses increased by 18.5% up from KES 1.31 billion
in 2018 to KES 1.55 billion in 2019. Underwriting profit decreased by 35.4% from KES 385.97 million in 2018 to KES 249.35 million.
3,941,441 4,003,236
3,639,901
3,191,369 3,335,777
-
500,000
1,000,000
1,500,000
2,000,000
2,500,000
3,000,000
3,500,000
4,000,000
4,500,000
2015 2016 2017 2018 2019
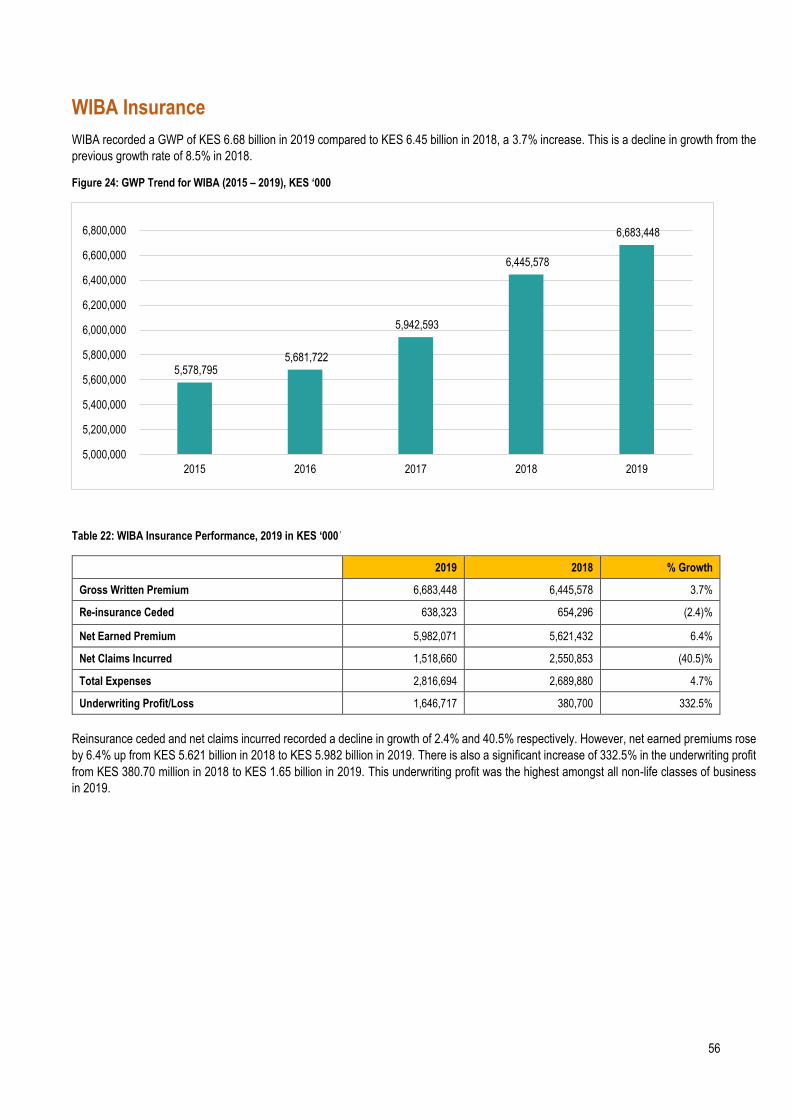
56
WIBA Insurance
WIBA recorded a GWP of KES 6.68 billion in 2019 compared to KES 6.45 billion in 2018, a 3.7% increase. This is a decline in growth from the
previous growth rate of 8.5% in 2018.
Figure 24: GWP Trend for WIBA (2015 – 2019), KES ‘000
Table 22: WIBA Insurance Performance, 2019 in KES ‘000’
2019 2018 % Growth
Gross Written Premium 6,683,448 6,445,578 3.7%
Re-insurance Ceded 638,323 654,296 (2.4)%
Net Earned Premium 5,982,071 5,621,432 6.4%
Net Claims Incurred 1,518,660 2,550,853 (40.5)%
Total Expenses 2,816,694 2,689,880 4.7%
Underwriting Profit/Loss 1,646,717 380,700 332.5%
Reinsurance ceded and net claims incurred recorded a decline in growth of 2.4% and 40.5% respectively. However, net earned premiums rose
by 6.4% up from KES 5.621 billion in 2018 to KES 5.982 billion in 2019. There is also a significant increase of 332.5% in the underwriting profit
from KES 380.70 million in 2018 to KES 1.65 billion in 2019. This underwriting profit was the highest amongst all non-life classes of business
in 2019.
5,578,795 5,681,722
5,942,593
6,445,578
6,683,448
5,000,000
5,200,000
5,400,000
5,600,000
5,800,000
6,000,000
6,200,000
6,400,000
6,600,000
6,800,000
2015 2016 2017 2018 2019

57
Miscellaneous Insurance
Miscellaneous insurance experienced a 3.4% increase in growth from KES 3.78 billion in 2018 to KES 3.91 billion in 2019. This is a positive
shift in growth compared to 2018 where there was a 4.73% decline.
Figure 25: GWP Trend for Miscellaneous Insurance (2015 – 2019), KES ‘000
Table 23: Miscellaneous Insurance Performance, 2019 in KES ‘000
2019 2018 % Growth
Gross Written Premium 3,907,098 3,778,151 3.4%
Re-insurance Ceded 2,142,679 2,146,341 -0.2%
Net Earned Premium 1,839,865 1,610,145 14.3%
Net Claims Incurred 818,095 738,321 10.8%
Total Expenses 755,801 627,631 20.4%
Underwriting Profit/Loss 265,969 244,191 8.9%
Net earned premium, net claims incurred and total expenses increased by 14.35%, 10.8% and 20.4% respectively. However, there was a slight
decline in re-insurance ceded by 0.2% from KES2.146 billion to KES 2.142 billion in 2019. The underwriting profit increased by 8.9% from KES
244.19 million in 2018 to KES 265.97 million in 2019.
3,661,635
3,753,553
3,965,835
3,778,151
3,907,098
3,500,000
3,550,000
3,600,000
3,650,000
3,700,000
3,750,000
3,800,000
3,850,000
3,900,000
3,950,000
4,000,000
2015 2016 2017 2018 2019

58
Agriculture Insurance
In 2019, gross written premium reduced by 8.43% to KES 655.9 Million from KES 716.2 Million in 2018. Crop insurance contributed 46%
of the total agriculture gross premiums whereas livestock insurance contributed 54%. Total claims for agriculture insurance was KES
585.8 Million in 2019 which was a 15.70% reduction from KES 694.8 Million in 2018. The total claims incurred on crop insurance was
30% while that on livestock insurance was 70% of the total agriculture claims in 2019. Overall, technical loss ratio for agriculture was at
89.31%. Crop insurance had 58.61% while livestock insurance had a 115.28% loss ratio.
Figure 26: 2019 Agriculture GWP and Claims Incurred in KES
Figure 27: Agriculture Insurance Loss Ratio per Company
Crops Livestock
Gross premiums 300,490,244 355,389,463
Claims incurred 176,109,748 409,685,197
300,490,244
355,389,463
176,109,748
409,685,197
2.18
%
51.7
5%
0.28
%
147.
70%
0.00
%
52.6
5%
0.00
%
0.00
%
104.
16%
20.0
0%
147.
09%
74.0
1% 87.6
2%
0.00
% 13.5
0%
10.9
0%
124.
00%
163.
25%
Crops Livestock

59
The table below shows the agricultural insurance statistics per company for the year 2019.
Table 24: Agriculture Insurance Statistics per company, 2019 in KES ‘000
Crops Livestock Total 2019 Total 2018 Crops Livestock Total 2019 Total 2018 Crops Livestock Total 2019 Total 2018
Amaco 19,778,271 200,040 19,978,311 6,482,691 431,389 40,000 471,389 1,834,802 2.18% 20.00% 2.36% 28.30%
APA 108,915,501 14,448,840 123,364,341 133,350,692 56,365,535 21,253,363 77,618,899 206,723,720 51.75% 147.09% 62.92% 155.02%
CIC 29,195,376 39,121,365 68,316,741 48,848,893 81,187 28,952,358 29,033,545 40,053,847 0.28% 74.01% 42.50% 82.00%
Heritage 3,270,807 17,540,446 20,811,253 23,683,722 4,831,071 15,368,505 20,199,576 20,645,150 147.70% 87.62% 97.06% 87.17%
ICEA Lion 1,492,750 - 1,492,750 1,260,000 - - - - 0.00% 0.00% 0.00% 0.00%
Jubilee 25,219,330 13,922,298 39,141,628 17,764,823 13,278,566 1,879,250 15,157,816 3,777,130 52.65% 13.50% 38.73% 21.26%
Kenya Orient 15,534,209 958,922 16,493,131 30,004,754 - 104,531 104,531 671,681 0.00% 10.90% 0.63% 2.24%
Madison - - 618,000 - - 540,000 0.00% 0.00% 0.00% 87.38%
Takaful - 248,090,552 248,090,552 251,820,289 - 307,630,190 307,630,190 204,667,083 0.00% 124.00% 124.00% 81.28%
UAP 97,084,000 21,107,000 118,191,000 202,400,015 101,122,000 34,457,000 135,579,000 215,960,050 104.16% 163.25% 114.71% 106.70%
Total 300,490,244 355,389,463 655,879,707 716,233,880 176,109,748 409,685,197 585,794,945 694,873,463 58.61% 115.28% 89.31% 97.02%
CompanyGross Premium Claims Incurred Loss Ratio

60
Net Claims Incurred
Net claims incurred was KES 59.50 billion in 2019 compared to KES 56.95 billion in 2018. Medical insurance had the highest net claims
incurred of KES 20.35 billion followed by motor private at KES 16.85 billion and motor commercial at KES 15.69 billion.
Figure 28: Net Claims Incurred per Class, 2019 in KES ‘000
0 5000000 10000000 15000000 20000000 25000000
Medical
Motor Private
Motor Commercial
WIBA
Personal Accident
Theft
Fire Industrial
Public Liability
Marine
Fire Domestic
Miscelleneous
Engineering
Aviation
2018 2019KES 000

61
Net Claims Incurred per Company per Class
Four (4) insurers recorded net incurred claims of KES 4 billion and above, whereas nine (9) insurers had net incurred claims below KES 500 million.
Table 25: Net Claims Incurred per Company per Class, 2019 in KES ‘000’
Com
pany
Nam
eA
viat
ion
Eng
inee
ring
Fire
Dom
estic
Fire
Indu
stri
alP
ublic
Lia
bilit
yM
arin
eM
otor
Pri
vate
Mot
or C
omm
erci
alP
erso
nal A
ccid
ent
Med
ical
Thef
tW
IBA
Mis
cella
neou
sTo
tal 2
019
AA
R -
31
117
1,13
2 -
38
-
-
6,39
21,
656,
901
1412
,617
5,57
71,
682,
818
AIG
1116
,840
7,61
829
,232
84,3
0075
111
7,71
612
8,03
233
,112
-
2,43
462
,507
-
482,
553
Alli
anz
14,
714
14,5
5714
,263
783,
405
120,
962
45,2
951,
167
-12,
034
12,6
77-3
121
9,12
1
Am
aco
-
-4,8
852,
699
4,68
72,
922
2,76
932
9,84
534
2,68
68,
149
-
4,39
020
,935
20,9
2973
5,12
6
AP
A98
20,5
7432
,733
19,0
77-6
9,75
637
,113
1,35
8,56
11,
261,
903
5,12
52,
012,
982
71,7
75-1
10,2
7610
8,28
54,
748,
194
Brit
am -
-7
,716
17,6
3172
,847
32,1
6736
,724
1,18
1,77
688
2,19
213
8,33
81,
333,
922
96,8
0488
,449
425,
429
4,29
8,56
3
Can
non
-
141,
399
1,83
7-6
9,01
491
3-4
,355
241,
607
204,
485
4,99
9 -
10
,946
4,92
6-5
5953
7,18
3
CIC
Gen
eral
-
27,0
8214
,584
92,2
0657
,441
24,5
271,
953,
103
1,39
7,60
460
,169
2,52
6,84
014
9,13
915
6,29
813
,108
6,47
2,10
1
Cor
pora
te22
4-3
,930
1,04
929
,495
825
9,92
798
,765
77,3
35-2
52 -
4,
186
13,4
0622
123
1,25
0
Dire
ctlin
e -
-
-
-
-
-
13
2,11
82,
156,
369
-
-
-
-
-
2,28
8,48
7
Fide
lity
Shi
eld
-
13,3
63-2
,152
11,9
8613
,320
15,0
5764
9,14
552
3,63
814
,830
-
22,6
2153
,248
562
1,31
5,61
8
Firs
t Ass
uran
ce -
35
,271
4,24
235
,441
18,9
7819
,120
363,
751
333,
740
62,9
5543
1,97
920
,748
-44,
402
310
1,28
2,13
3
GA
Insu
ranc
e71
122
,349
45,3
9660
,415
12,3
1330
,757
473,
834
449,
867
9,30
728
2,20
515
4,92
521
7,61
31,
241
1,76
0,93
3
Gem
inia
7-3
0,31
617
,683
-18,
304
23,7
0814
2,61
61,
448,
185
1,00
4,03
0-2
9,27
9 -
39
,053
125,
590
-76,
156
2,64
6,81
7
Her
itage
3,98
417
,103
32,9
972,
233
37,6
666,
644
483,
869
328,
196
-5,9
0546
5,51
2-6
9,33
478
,823
93,7
871,
475,
576
ICE
A L
ion
Gen
eral
8,61
732
,669
14,9
0242
,892
7,51
612
,854
709,
380
198,
557
41,0
9987
,832
3,06
793
,191
2,80
81,
255,
384
Intra
Afri
ca
-
9,42
732
,583
29,2
6913
,976
3,75
125
2,61
816
1,55
1-3
,218
-
16,9
0171
,609
-3,1
9258
5,27
4
Inve
sco
-
-
1,25
0-1
-5-7
65,1
3046
7,18
2-1
1 -
-6
821
533,
614
Jubi
lee
Gen
eral
528
32,7
7121
,107
64,9
7459
,859
56,1
861,
231,
439
782,
609
102,
969
-
12,1
7493
,167
38,2
142,
495,
997
Jubi
lee
Hea
lth -
-
-
-
-
-
-
-
-
3,
701,
399
-
-
-
3,70
1,39
9
Ken
indi
a -
16
,361
7,65
397
,115
33,8
8510
6,21
531
7,69
466
2,31
2-8
8613
1,20
877
,215
249,
815
1,60
51,
700,
192
Ken
ya O
rient
-
-3,1
05-6
,585
-7,7
79-5
85-1
,332
206,
871
417,
701
8,96
8 -
-9
677,
972
-556
620,
603
Ken
yan
Alli
ance
-
3,56
66,
594
20,5
694,
458
5,74
913
0,67
416
2,12
021
,683
61,2
998,
598
-6,8
1442
,898
461,
394
Mad
ison
-
13,6
523,
894
22,6
6138
,765
6,09
958
5,97
155
0,43
66,
094
1,76
4,70
38,
286
42,0
2817
,553
3,06
0,14
2
May
fair
-38
44,2
8719
,353
53,3
9118
,097
68,5
7922
4,07
126
7,21
13,
256
-
17,4
2820
3,70
521
,837
941,
177
MU
A2,
797
22,9
383,
458
2,82
034
,060
1,29
091
,981
40,4
263,
580
-
-3,5
47-2
,433
-649
196,
721
Occ
iden
tal
-
101,
124
77,7
3538
,279
615
42,7
5852
8,70
548
1,79
64,
121
-
59,7
23-9
,611
2,37
81,
327,
622
Pac
is -
13
,316
1,68
521
,100
13,0
14 -
40
1,61
814
1,51
05,
509
166,
052
1,76
114
,260
5177
9,87
9
Pio
neer
-
-300
1,26
34,
037
4,59
64,
484
242,
596
83,1
944,
231
-
669
13,3
54-2
235
8,10
3
Res
olut
ion
-
808
1,03
12,
567
4,00
9-1
7834
9,93
131
8,02
1-7
461,
067,
244
1,50
023
,095
518
1,76
7,80
1
San
lam
-
7,99
54,
147
8,00
05,
125
7,45
134
9,68
322
2,85
389
040
5,73
08,
574
9,11
6-3
,051
1,02
6,51
3
Sah
am -
4,
005
3,69
96,
637
-650
820
329,
579
50,4
03-2
,730
230,
613
6,39
02,
087
12,4
6764
3,32
1
Taka
ful
-
3,84
32,
136
12,6
415,
803
4,88
977
,795
87,2
5393
969
,428
15,2
6814
,287
71,9
0436
6,18
5
Taus
i -
21
,743
17,0
137,
142
9,68
820
,106
57,7
5180
,409
-27
4,42
036
,642
48,6
35-3
,418
300,
104
The
Mon
arch
-
5053
153
81,
381
-48
364,
044
255,
876
1,81
8 -
45
-192
189
624,
233
Trid
ent
-
-2,1
37-8
39-8
,882
-369
-2,3
7130
7,43
414
3,98
81,
605
-49,
084
-8,5
11-5
,040
6637
5,85
8
UA
P -
-1
,399
23,6
2038
,636
22,9
7721
,698
913,
387
501,
603
16,1
584,
000,
948
23,6
69-3
7,15
924
,561
5,54
8,69
9
Xplic
o -
21
,044
00
125
-398
157,
404
473,
322
265
-305
21,
096
-770
651,
785
Tota
l16
,940
594,
538
427,
220
742,
303
491,
214
683,
687
16,8
48,9
9115
,685
,704
524,
673
20,3
51,8
2779
4,61
71,
518,
660
818,
095
59,4
98,4
74

62
Total Expenses
Total expenses amounted to KES 36.66 billion in 2019 compared to KES 36.85 billion in 2018, a 0.5% decrease. Motor commercial had
the highest expenses at KES 9.74 billion, followed by motor private at KES 9.39 billion and medical at KES 7.06 billion. Total expenses
accounted for 27.47% of the gross written premium.
Figure 29: Non-Life Expenses per Company, 2019 in KES ‘000
81,4
93
307,
023
667,
514
1,31
6,28
0
841,
142
878,
617
9,38
8,65
8
9,73
8,19
1
1,54
8,58
0
7,06
2,47
0
1,26
2,00
7
2,81
6,69
4
755,
801

63
Total Expenses per Company per Class Four (4) insurers recorded total expenses of KES 2 billion and above, whereas 11 insurers had total expenses below KES 500 million.
Table 26: Expenses per Company per Class, 2019 in KES’000’
Com
pany
Nam
eA
viat
ion
Eng
inee
ring
Fire
Dom
estic
Fire
Indu
stri
alP
ublic
Lia
bilit
yM
arin
eM
otor
Pri
vate
Mot
or C
omm
erci
alP
erso
nal A
ccid
ent
Med
ical
Thef
tW
IBA
Mis
cella
neou
sTo
tal 2
019
AA
R -
22
3829
33,
916
120
-
-
10,3
8389
8,90
81,
200
30,5
724,
954
950,
406
AIG
378
25,9
1324
,057
(12,
937)
123,
346
(5,0
73)
42,5
0147
,061
71,2
59 -
30
,644
93,9
63 -
44
1,11
2
Alli
anz
5,58
38,
020
11,6
1149
,189
26,4
8823
,080
72,7
1261
,172
1,85
018
,934
6,19
441
,548
7,06
833
3,44
9
Am
aco
-
17,6
7955
4(7
2,26
0)5,
041
539
314,
525
241,
122
107,
521
-
6,52
87,
658
(20,
959)
607,
948
AP
A(1
,112
)27
,934
25,4
4315
0,40
035
,440
51,1
2643
2,50
843
2,02
570
,493
475,
109
62,0
0020
4,32
258
,986
2,02
4,67
4
Brit
am -
(2
7,95
2)53
,024
96,9
8943
,905
9,31
381
6,54
663
8,95
343
8,07
058
2,46
313
4,36
914
8,07
234
8,05
83,
281,
810
Can
non
-
27,2
6411
,140
13,1
5210
,578
13,0
1515
5,66
796
,050
11,5
15 -
15
,201
52,2
009,
384
415,
165
CIC
Gen
eral
-
2,28
745
,790
73,0
1828
,768
57,7
0874
5,81
787
9,06
314
7,55
057
6,02
025
6,95
915
6,64
816
,985
2,98
6,61
3
Cor
pora
te -
16
,677
2,78
255
,715
4,62
326
,399
81,8
9249
,735
6,02
1 -
18
,399
29,5
181,
666
293,
427
Dire
ctlin
e -
-
-
-
-
-
66
,255
1,08
1,37
5 -
-
-
-
-
1,
147,
630
Fide
lity
Shi
eld
-
(3,8
81)
6,02
54,
985
7,12
828
,951
266,
620
164,
693
5,47
5 -
9,
102
62,7
77(3
,101
)54
8,77
4
Firs
t Ass
uran
ce -
(1
0,42
5)15
,166
51,9
6416
,627
31,6
2029
8,66
231
0,52
348
,073
127,
125
28,1
6561
,416
(25,
754)
953,
162
GA
Insu
ranc
e14
,343
16,8
3927
,863
87,8
7723
,072
53,2
1616
2,90
017
7,75
330
,584
121,
625
92,1
2417
4,90
1(8
,636
)97
4,46
1
Gem
inia
20,4
8624
,099
22,1
5987
,387
26,2
3162
,609
484,
302
541,
655
9,74
6 -
51
,735
182,
704
48,5
221,
561,
635
Her
itage
5,30
548
,062
95,2
6895
,047
96,9
9358
,640
374,
995
226,
506
117,
764
221,
801
74,4
1814
5,85
199
,487
1,66
0,13
7
ICE
A L
ion
Gen
eral
(9,1
67)
22,1
3736
,235
(7,7
35)
22,3
9379
,267
540,
394
260,
712
37,5
5268
,909
94,3
6717
9,04
3(5
,182
)1,
318,
925
Intra
Afri
ca
-
9,12
410
,483
41,0
795,
434
30,4
0812
3,88
182
,090
9,00
9 -
26
,174
70,2
81(2
,625
)40
5,33
8
Inve
sco
-
-
132
4113
237
91,9
4463
0,02
813
6 -
44
383
2172
2,97
9
Jubi
lee
Gen
eral
(876
)(3
,220
)44
,911
130,
922
57,8
1920
,946
517,
160
259,
656
141,
615
-
30,5
3716
8,85
325
,629
1,39
3,95
2
Jubi
lee
Hea
lth -
-
-
-
-
-
-
-
-
1,
049,
108
-
-
-
1,04
9,10
8
Ken
indi
a -
22
,587
18,0
9198
,516
12,1
1590
,068
109,
794
153,
189
7,67
547
,238
30,7
9514
5,58
5(6
,912
)72
8,74
3
Ken
ya O
rient
-
2,22
911
,025
13,8
9815
,845
3,13
832
1,54
622
8,20
66,
957
-
15,8
4728
,513
14,7
4466
1,94
8
Ken
yan
Alli
ance
-
4,63
320
,330
40,5
159,
568
7,44
431
4,01
421
5,07
223
,578
107,
862
23,1
9685
,539
1,31
285
3,06
2
Mad
ison
-
24,4
536,
283
36,9
1488
,090
17,7
1621
3,54
634
9,50
19,
932
491,
880
10,9
0030
,198
45,5
021,
324,
916
May
fair
298
2,82
014
,176
(6,8
74)
12,6
7457
,303
175,
269
124,
012
8,73
8 -
14
,369
150,
878
(42,
126)
511,
537
MU
A46
,515
11,2
123,
958
30,0
9629
,978
9,60
692
,124
66,9
805,
585
-
5,77
111
,955
10,0
2832
3,80
9
Occ
iden
tal
-
(3,2
55)
18,9
906,
864
950
18,3
3128
9,82
927
2,86
13,
909
-
14,6
6912
7,17
3(2
24)
750,
096
Pac
is -
12
,371
8,28
371
,545
12,1
252,
005
219,
111
161,
928
36,3
4463
,444
22,5
0448
,550
1,17
565
9,38
5
Pio
neer
-
4,86
83,
189
20,4
7616
,958
5,31
714
0,56
260
,159
15,2
32 -
8,
062
17,1
773,
114
295,
114
Res
olut
ion
-
2,75
02,
456
9,95
916
,299
11,4
0219
9,57
915
2,95
865
,307
663,
969
10,3
6928
,585
7,96
91,
171,
602
San
lam
-
1,44
129
,901
(4,9
18)
20,4
5011
,463
222,
272
275,
101
(488
)13
5,71
011
,086
47,4
9710
,805
760,
321
Sah
am -
2,
143
8,71
8(3
,336
)(1
,072
)38
126
1,16
991
,445
12,2
7341
,847
14,0
3343
,480
16,0
0048
7,08
2
Taka
ful
-
4,35
32,
421
14,3
216,
574
5,53
988
,131
98,8
441,
063
78,6
5117
,297
16,1
8581
,455
414,
833
Taus
i -
2,
916
19,6
467,
041
11,3
1451
,201
84,2
9064
,553
6,44
26,
319
61,0
5110
3,83
83,
555
422,
166
The
Mon
arch
-
2,39
82,
315
(4,5
15)
13,8
493,
217
267,
171
238,
478
17,4
69 -
3,
662
17,6
3113
,976
575,
651
Trid
ent
(261
)(9
,485
)1,
250
159
481
465
191,
520
122,
916
2,24
2(2
2,77
7)64
6(4
,194
)2,
639
285,
600
UA
P -
17
,602
63,7
9314
0,47
635
,192
41,7
6243
9,25
132
2,91
361
,509
1,30
8,32
559
,565
106,
669
37,0
992,
634,
156
Xplic
o -
40
97
161,
936
140
170,
200
558,
904
199
-
2872
41,
186
733,
748
Tota
l81
,493
307,
023
667,
514
1,31
6,28
084
1,14
287
8,61
79,
388,
658
9,73
8,19
11,
548,
580
7,06
2,47
01,
262,
007
2,81
6,69
475
5,80
136
,664
,472

64
Underwriting Profit/Losses
Non-life insurance recorded an underwriting loss of KES 3.27 billion in 2019 compared to 2.87 billion in 2018. The highest loss was
reported in the motor private sector of KES 4.67 billion followed by motor commercial at KES 2.68 billion. Aviation and Engineering also
made losses during the year. The highest underwriting profit of KES 1.65 billion was reported in WIBA insurance followed by Fire industrial
KES 589.5 million. Medical Insurance reported an underwriting profit of KES 204 million. This was a great improvement from the losses
recorded over the last 2 years (2018:1.08 billion loss, 2017: 514 million loss).
Figure 30: Underwriting Profit/Loss per Class of Insurance, in KES’000’
(5,000,000.00) (4,000,000.00) (3,000,000.00) (2,000,000.00) (1,000,000.00) - 1,000,000.00 2,000,000.00
Theft
Motor Commercial
Marine
Personal Accident
Public Liability
Miscelleneous
Fire Domestic
Engineering
Aviation
Fire Industrial
WIBA
Medical
Motor Private

65
Underwriting Profit/Loss per Company per Class
Two (2) insurers reported an underwriting loss of less than KES 1 billion, whereas two (2) insurers had underwriting profit above KES 500 million.
Table 27: Underwriting Profit/Loss per Class per Company, 2019 in KES’000’
Com
pany
Nam
eAv
iatio
nEn
gine
erin
gFi
re D
omes
ticFi
re In
dust
rial
Publ
ic L
iabi
lity
Mar
ine
Mot
or P
rivat
eM
otor
Com
mer
cial
Pers
onal
Acc
iden
tM
edic
alTh
eft
WIB
AM
isce
llane
ous
Tota
l 201
9
AAR
-
(18)
91(1
,732
)37
31,
059
-
-
9,79
845
9,67
71,
325
30,4
58(2
84)
500,
746
AIG
(16)
1,72
52,
573
43,4
344,
717
6,94
853
,655
(104
,229
)(1
2,41
2) -
54
,925
(52,
946)
-
(1,6
26)
Allia
nz(5
,195
)(6
,516
)(2
4,20
0)(4
4,34
3)(7
,439
)9,
490
(54,
016)
5,63
344
5(1
8,87
2)(5
,735
)7,
228
(4,9
22)
(148
,442
)
Amac
o -
(6
,974
)(2
,586
)66
,739
7,00
5(2
,464
)(5
6,58
8)(1
88,1
52)
(71,
411)
-
(5,1
71)
28,4
9537
,768
(193
,338
)
APA
1,54
12,
276
(2,6
77)
31,5
0910
7,45
880
,103
(379
,719
)(2
54,6
65)
100,
715
(183
,952
)62
,406
417,
156
27,9
2810
,079
Brita
m -
44
,963
10,4
76(1
2,47
3)(8
,147
)44
,038
(673
,652
)(4
85,8
07)
77,7
78(9
8,74
5)(2
3,97
3)(3
2,49
4)3,
102
(1,1
54,9
34)
Cann
on -
(1
45,7
53)
(4,0
09)
70,6
39(4
,704
)11
,719
(50,
576)
(45,
590)
(6,4
56)
-
(5,7
34)
31,5
505,
910
(143
,004
)
CIC
Gen
eral
-
61,4
9225
,657
83,7
32(1
4,50
4)(6
,099
)(5
78,0
81)
(165
,708
)(2
,254
)90
,166
43,2
3048
,688
(44,
518)
(458
,199
)
Corp
orat
e(2
24)
3,67
441
4(3
2,46
4)80
526
,773
(93,
392)
(77,
319)
2,89
8 -
(1
8,02
0)(3
,049
)(3
54)
(190
,258
)
Dire
ctlin
e -
-
-
-
-
-
(3
4,20
8)(2
11,3
34)
-
-
-
-
-
(245
,542
)
Fide
lity S
hiel
d -
3,
807
11,8
3810
,132
11,2
52(1
2,59
5)(1
60,0
99)
(27,
996)
(9,6
63)
-
10,1
8589
,224
14,8
59(5
9,05
6)
Firs
t Ass
uran
ce -
10
,653
2,71
82,
764
(6,9
62)
3,82
3(8
6,66
0)(1
00,4
27)
(27,
337)
72,3
5811
,825
79,7
3319
,991
(17,
521)
GA
Insu
ranc
e(1
1,07
5)9,
341
4,14
168
529
,865
96,8
67(4
,384
)78
,927
24,0
24(2
,048
)80
,638
113,
311
58,9
9047
9,28
2
Gem
inia
46,3
2346
,898
15,4
9617
0,64
55,
799
(22,
435)
(537
,931
)61
,075
42,9
77 -
36
,114
202,
398
64,9
3813
2,29
7
Herit
age
(8,2
53)
(10,
512)
9,25
231
,646
12,5
899,
184
(58,
051)
55,1
0378
,550
8,70
710
6,65
710
1,18
4(6
5,51
8)27
0,53
8
ICEA
Lio
n G
ener
al6,
534
18,0
1735
,821
145,
456
20,1
6219
,129
(208
,659
)16
,050
(11,
139)
(54,
128)
90,8
9216
4,43
024
,107
266,
672
Intra
Afri
ca
-
9,25
8(1
9,80
6)9,
698
(8,7
20)
40,4
89(7
,588
)(9
,820
)12
,760
-
19,4
7110
,331
22,4
8878
,561
Inve
sco
-
-
(1,2
02)
(2,4
64)
(2)
178
3,71
5(1
7,37
1)11
8 -
94
(226
)13
(17,
146)
Jubi
lee
Gen
eral
317
1,57
1(2
9,03
7)(2
3,09
9)(1
9,47
8)2,
065
(557
,698
)(4
06,6
23)
(39,
828)
-
20,9
93(8
,291
)16
,918
(1,0
42,1
90)
Jubi
lee
Heal
th -
-
-
-
-
-
-
-
-
50
9,80
2 -
-
-
50
9,80
2
Keni
ndia
1(1
7,64
4)10
,922
(132
,964
)(2
7,34
8)16
,873
(105
,156
)(3
14,8
80)
4,90
6(5
0,49
7)(2
5,62
4)(5
3,44
0)13
,331
(681
,519
)
Keny
a O
rient
-
19,1
0710
,550
25,5
127,
838
6,48
38,
637
(267
,505
)(6
,778
) -
21
,263
2,22
610
,663
(161
,338
)
Keny
an A
llianc
e -
2,
028
(1,3
77)
16,7
58(5
,170
)(5
,020
)91
,862
(34,
218)
(27,
640)
(113
,375
)2,
372
50,0
79(3
8,34
8)(6
2,04
7)
Mad
ison
-
(21,
318)
17,0
38(2
5,63
6)(1
9,80
3)(2
0,71
4)(1
51,5
75)
(10,
625)
3,77
9(4
6,54
8)1,
550
(14,
016)
22,3
86(2
65,4
83)
May
fair
432
29,8
711,
099
44,3
596,
868
44,5
8411
,631
18,4
5217
,465
-
1,70
944
,201
49,3
5527
0,02
6
MUA
(46,
101)
3,42
8(8
25)
(6,0
89)
(15,
477)
2,14
0(2
2,68
1)(4
,413
)76
7 -
9,
236
11,1
44(1
,961
)(7
0,83
1)
Occ
iden
tal
-
(75,
909)
(50,
961)
19,3
632,
104
592
(27,
137)
(10,
811)
7,18
5 -
(1
6,17
4)15
9,78
711
,113
19,1
53
Paci
s -
(1
5,87
8)(6
98)
(24,
745)
(14,
239)
(351
)(2
63,7
68)
(14,
267)
8,63
3(1
6,29
9)8,
462
434
284
(332
,435
)
Pion
eer
-
4,64
64,
079
(12,
981)
5,93
8(1
,460
)(3
5,58
9)8,
868
(10,
473)
-
11,5
304,
430
617
(20,
396)
Reso
lutio
n -
1,
904
884
(8,2
46)
9,32
711
,350
(81,
053)
(137
,045
)42
,573
(170
,959
)8,
519
(151
)(2
,256
)(3
25,1
51)
Sanl
am -
(7
70)
21,4
2211
,950
10,8
246,
055
(138
,042
)32
,572
8,00
5(7
2,75
0)11
,881
13,1
084,
004
(91,
744)
Saha
m -
(2
,324
)94
112
,421
5,49
3(7
6)(1
07,5
72)
26,4
4213
,489
(23,
196)
5,61
320
,544
20,0
07(2
8,20
8)
Taka
ful
-
(889
)(4
94)
(2,9
22)
(1,3
41)
(1,1
30)
(17,
981)
(20,
166)
(217
)(1
6,04
6)(3
,529
)(3
,302
)(1
6,62
1)(8
4,63
8)
Taus
i -
(8
,777
)(2
,650
)48
,389
(2,6
31)
28,3
6629
,558
(16,
511)
4,43
51,
982
4,32
919
,611
12,2
9611
8,39
7
The
Mon
arch
-
7,19
023
112
,659
(1,2
71)
1,90
8(4
0,39
5)(1
1,74
3)8,
142
-
792
13,7
5029
,439
20,7
02
Trid
ent
261
11,7
3326
111
,461
(11,
913)
3,92
9(1
43,4
51)
(84,
635)
(7,3
22)
62,8
819,
704
5,52
62,
358
(139
,208
)
UAP
-
27,5
5131
,273
49,7
3810
,127
5,43
2(1
50,0
63)
96,5
2313
,115
(132
,846
)54
,178
146,
871
(38,
079)
113,
820
Xplic
o -
(2
1,62
0)(2
)(5
)67
635
5(4
6,11
8)(5
9,68
1)(2
80)
(1,1
41)
(7)
(1,2
65)
5,96
3(1
23,1
25)
Tota
l(1
5,45
5)(1
3,76
8)76
,653
589,
526
90,0
7140
7,58
8(4
,672
,825
)(2
,681
,896
)24
9,34
620
4,17
158
5,92
61,
646,
717
265,
969
(3,2
67,3
04)

66
Reinsurance
Total reinsurance ceded was KES 39.42 billion in 2019 compared to KES 36.87 billion in 2018; a 1.73% increase. Medical insurance had
the highest reinsurance ceded at KES 14.81 billion followed by fire industrial at KES 8.43 billion which is consistent with 2018 and 2017.
Figure 31: Reinsurance Premium Ceded per Class, 2019 in KES
Table 28: Reinsurance Premium Ceded per Class, 2019 in KES ’000’
Company Name Total reinsurance premiums ceded in KES % of total reinsurance premium ceded
Aviation 1,831,973 4.65%
Engineering 2,953,910 7.49%
Fire Domestic 458,742 1.16%
Fire Industrial 8,431,564 21.39%
Public Liability 1,706,030 4.33%
Marine 1,635,876 4.15%
Motor Private 1,468,048 3.72%
Motor Commercial 1,127,925 2.86%
Personal Accident 1,019,385 2.59%
Medical 14,808,649 37.57%
Theft 1,192,875 3.03%
WIBA 638,323 1.62%
Miscellaneous 2,142,679 5.44%
Total 39,415,978 100%
1,83
1,97
2,54
0
2,95
3,90
9,90
9
458,
742,
045
8,43
1,56
3,61
1
1,70
6,02
9,98
8
1,63
5,87
5,96
3
1,46
8,04
8,06
3
1,12
7,92
4,92
5
1,01
9,38
4,87
7
14,8
08,6
49,3
55
1,19
2,87
5,16
3
638,
323,
488
2,14
2,67
8,79
8

67
Premium Ceded per Company per Class
Eight (8) insurers reported premium ceded of KES 2 billion and above, whereas 18 insurers had premium ceded below KES 500 million.
Table 29: Premium Ceded per Company per Class, 2019 in KES’000’
Com
pany
Nam
eAv
iatio
nEn
gine
erin
gFi
re D
omes
ticFi
re In
dust
rial
Publ
ic L
iabi
lity
Mar
ine
Mot
or P
rivat
eM
otor
Com
mer
cial
Pers
onal
Acc
iden
tM
edic
alTh
eft
WIB
AM
isce
llane
ous
Tota
l 201
9
AAR
-
263
1,39
27,
312
-
47 -
-
-
2,
920,
491
-
-
12,5
782,
942,
083
AIG
37,4
1762
167
,190
612,
432
663,
517
41,5
4566
9,39
210
6,76
913
3,83
4 -
22
3,76
913
7,34
0 -
2,
693,
826
Allia
nz23
,243
22,7
7526
,723
95,1
7575
,018
20,2
4519
,976
17,1
9544
391
,661
23,2
649,
402
26,5
2845
1,64
9
Amac
o -
39
,747
1,27
717
2,94
828
2(2
36)
14,6
3610
,177
46,2
03 -
7,
359
1,71
330
,341
324,
446
APA
30,9
6411
7,46
024
,262
567,
165
62,0
8556
,528
21,9
6424
,480
3,49
71,
551,
451
29,7
1727
,666
168,
779
2,68
6,01
8
Brita
m -
41
8,30
025
,195
378,
014
75,4
5530
3,53
571
,557
74,3
0918
2,51
335
,850
4,17
224
,263
22,3
351,
615,
498
Cann
on -
37
,886
2,32
922
,558
560
8,98
43,
267
3,87
329
,913
-
2,62
7 -
22
,022
134,
018
CIC
Gen
eral
-
291,
682
2,81
147
4,36
419
,530
22,7
6473
,477
71,7
5656
,355
88,9
8111
7,96
143
,320
202,
445
1,46
5,44
6
Corp
orat
e -
19
,817
3,15
121
,190
1,29
61,
614
3,95
23,
952
173
-
2,41
9 -
9,
688
67,2
53
Dire
ctlin
e -
-
-
-
-
-
5,
496
101,
324
-
-
-
-
-
106,
820
Fide
lity S
hiel
d -
61
,695
11,2
0814
2,62
914
,192
244,
782
37,3
7252
,955
7,12
3 -
59
,609
4,75
524
,893
661,
213
Firs
t Ass
. -
12
7,27
17,
719
185,
729
9,59
817
,052
15,9
3516
,382
27,3
7791
6,27
569
,697
2,70
792
,205
1,48
7,94
7
GA
Ins.
132,
236
283,
976
30,4
261,
008,
604
28,6
2598
,635
47,8
2642
,640
31,7
781,
300,
989
27,2
9479
,190
102,
418
3,21
4,63
7
Gem
inia
53,1
2510
6,58
914
,227
290,
186
6,71
836
,665
5,57
62,
237
30,9
05 -
18
,974
112,
557
137,
469
815,
227
Herit
age
45,0
8320
7,10
231
,841
423,
262
78,8
3329
,570
35,4
4830
,517
38,7
881,
065,
358
2,73
923
,601
167,
520
2,17
9,66
1
ICEA
Lio
n G
en1,
316,
074
101,
442
37,0
5671
9,90
511
4,44
068
,393
73,7
6551
,837
148,
878
28,5
8162
,456
18,1
6896
,241
2,83
7,23
6
Intra
Afri
ca
-
14,5
587,
912
41,3
595,
265
31,0
985,
265
5,26
51,
351
-
2,44
1 -
40
,501
155,
016
Inve
sco
-
-
532,
535
2759
12,3
7211
3,36
91
-
1840
244
128,
879
Jubi
lee
Gen
eral
4,97
212
5,92
79,
343
572,
131
191,
866
166,
173
50,4
4539
,679
53,5
33 -
2,
480
(4,7
56)
155,
301
1,36
7,09
4
Jubi
lee
Heal
th -
-
-
-
-
-
-
-
-
2,
377,
082
-
-
-
2,37
7,08
2
Keni
ndia
-
122,
320
14,4
4646
4,28
732
,320
49,5
766,
074
16,7
9128
,852
3,31
111
0,13
95,
203
10,3
9386
3,71
1
Keny
a O
rient
-
39,9
025,
952
72,7
541,
490
5,62
88,
592
8,59
21,
825
-
31,9
203,
375
47,2
2022
7,25
0
Keny
an A
llianc
e -
5,
222
2,86
215
,707
3,01
18,
645
24,3
2016
,618
3,30
552
,804
4,54
69,
519
666
147,
226
Mad
ison
-
51,3
842,
994
53,4
5513
3,37
069
,869
7,59
112
,512
4,66
77,
875
1,15
092
670
,245
416,
038
May
fair
22,9
0218
0,02
740
,918
570,
672
12,3
0643
,358
28,1
4831
,482
25,8
06 -
10
5,41
518
,315
182,
729
1,26
2,07
8
MUA
165,
957
9,78
341
759
,435
3,25
09,
814
8,74
78,
846
101
-
-
-
19,2
9528
5,64
4
Occ
iden
tal
-
109,
472
19,1
2826
4,92
312
,430
122,
231
7,63
06,
926
31,9
95 -
63
,398
56,1
5831
,446
725,
738
Paci
s -
7,
318
4,12
147
,374
1,29
73,
515
28,3
6224
,368
7,02
514
2,13
22,
579
6,77
81,
355
276,
223
Pion
eer
-
8,93
72,
263
55,4
7813
,932
11,5
011,
559
1,92
719
,091
-
319
5252
,005
167,
064
Reso
lutio
n -
6,
597
734
24,5
921,
510
1,27
522
,903
19,1
5319
,462
2,86
0,61
11,
091
2,59
628
,957
2,98
9,48
2
Sanl
am -
60
,025
4,25
123
0,20
759
,058
18,0
8423
,590
39,5
0117
,742
365,
019
57,3
5017
,166
17,2
1290
9,20
5
Saha
m -
10
6,92
27,
014
144,
929
32,1
2622
,797
19,4
0714
,036
11,3
9474
7,78
911
,468
4,98
313
5,60
71,
258,
471
Taka
ful
-
5,09
52,
833
16,7
617,
693
6,48
310
3,14
411
5,68
21,
244
92,0
5020
,243
18,9
4395
,330
485,
501
Taus
i -
47
,523
12,5
2221
9,89
44,
122
42,8
683,
145
4,36
02,
744
-
8,66
87,
149
10,4
6036
3,45
5
The
Mon
arch
-
16,7
4224
30,3
271,
152
4,47
57,
139
5,44
342
8 -
11
650
19,
814
76,1
60
Trid
ent
-
216
106
5,84
7 -
-
17
59
333
,357
-
-
2,25
041
,963
UAP
-
199,
292
34,0
4241
7,42
239
,552
68,2
97(1
0,81
0)14
,199
51,0
2212
6,98
411
7,47
66,
293
113,
823
1,17
7,59
2
Xplic
o -
21
01
103
710
,611
18,7
6414
-
238
2,56
632
,127
Tota
l1,
831,
973
2,95
3,91
045
8,74
28,
431,
564
1,70
6,03
01,
635,
876
1,46
8,04
81,
127,
925
1,01
9,38
514
,808
,649
1,19
2,87
563
8,32
32,
142,
679
39,4
15,9
78

68
Revenue Accounts
Revenues (GWP) amounted to KES 133.5 billion in 2019 compared to KES 128.9 billion in 2018, a 3.57% increase. Average growth rate
for the last five years (2015 – 2019) was 5.97%. Underwriting loss was KES 3.3 billion in 2019 compared to KES 2.9 billion in 2018, a
13.90% drop.
Figure 32: Summary of Revenue Growth, 2015-2019 in KES ’Billions
Table 30: Summary of Revenue Accounts per Class of Insurance, 2019
Company Gross Written Premium
Re-insurance Ceded
Net Earned Premium
Net Claims Incurred
Total Expenses
Underwriting Profit/Loss
Aviation 1,855,183,344 1,831,972,540 82,977,398 16,940,367 81,492,679 (15,454,649)
Engineering 3,765,734,344 2,953,909,909 887,792,496 594,537,635 307,022,849 (13,767,989)
Fire Domestic 1,672,957,487 458,742,045 1,171,387,648 427,219,997 667,513,716 76,652,934
Fire Industrial 11,393,454,895 8,431,563,611 2,648,117,867 742,302,511 1,316,279,978 589,526,378
Public Liability 3,222,088,502 1,706,029,988 1,422,425,001 491,213,733 841,141,763 90,070,506
Marine 3,490,217,045 1,635,875,963 1,969,892,400 683,686,713 878,617,473 407,588,213
Motor Private 23,598,600,562 1,468,048,063 21,564,825,429 16,848,991,266 9,388,658,142 (4,672,824,977)
Motor Commercial 24,241,887,915 1,127,924,925 22,741,999,298 15,685,704,371 9,738,190,890 (2,681,895,961)
Personal Accident 3,335,776,855 1,019,384,877 2,322,601,077 524,673,413 1,548,579,987 249,345,676
Medical 42,417,899,128 14,808,649,355 27,618,467,922 20,351,827,327 7,062,470,124 204,171,470
Theft 3,870,368,602 1,192,875,163 2,642,549,348 794,616,876 1,262,007,015 585,926,456
WIBA 6,683,447,689 638,323,488 5,982,070,985 1,518,660,341 2,816,694,205 1,646,717,439
Miscellaneous 3,907,097,735 2,142,678,798 1,839,864,935 818,095,165 755,800,726 265,969,045
Total 2019 133,454,717,104 39,415,977,724 92,895,640,440 59,498,473,719 36,664,471,542 (3,267,303,822)
111.9123.1 126.1 128.9 133.5
80.187.4 91.3 90.9 92.9
49.154.9 56.2 56.9 59.5
31.0 34.7 36.1 36.8 36.7
-0.02 -2.1 -1.0 -2.9 -3.3
-20.0
0.0
20.0
40.0
60.0
80.0
100.0
120.0
140.0
160.0
2015 2016 2017 2018 2019
Gross Written Premium Net Earned Premium Net Claims Incurred
Total Expenses Underwriting Profit/Loss

69
Non-Life Insurance Industry Ratios
Technical loss ratio
Technical loss ratio is the net claims incurred expressed as a fraction of the net earned premium. In 2019, motor private had the highest
technical loss ratio of 78.13%, medical followed at 73.69% then motor commercial at 68.97%. Aviation had the lowest technical loss ratio
of 20.42% in 2019 which is contrary to 2018 where aviation had the highest technical ratio of 169.64 %.
Table 31: Technical Loss Ratio per Class, 2019
Class Net Earned Premiums Net Claims Incurred Technical Loss Ratios,
2019 Technical Loss Ratios,
2018
Aviation 82,977,398 16,940,367 20.42% 169.64%
Engineering 887,792,496 594,537,635 66.97% 44.38%
Fire Domestic 1,171,387,648 427,219,997 36.47% 43.43%
Fire Commercial 2,648,117,867 742,302,511 28.03% 45.21%
Public Liability 1,422,425,001 491,213,733 34.53% 36.07%
Marine 1,969,892,400 683,686,713 34.71% 32.86%
Motor Private 21,564,825,429 16,848,991,266 78.13% 68.92%
Motor Commercial 22,741,999,298 15,685,704,371 68.97% 60.76%
Personal Accident 2,322,601,077 524,673,413 22.59% 27.19%
Medical 27,618,467,922 20,351,827,327 73.69% 75.62%
Theft 2,642,549,348 794,616,876 30.07% 42.84%
WIBA 5,982,070,985 1,518,660,341 25.39% 45.38%
Miscellaneous 1,839,864,935 818,095,165 44.46% 45.85%
Expense Ratio
Expense ratio is a measure of profitability calculated by dividing the expenses associated with acquiring, underwriting and servicing the
business by the net earned premium of the insurance company.
In 2019, aviation had the highest expense ratio of 98.21% which was also the case in 2018 where aviation was leading at 555.59%.
Medical had the lowest expense ratio of 25.57% retaining the same ranking as that of 2018.
Table 32: Expense Ratio per Class, 2019
Class Total Expenses Net Premium Earned Expense Ratio,2019 Expense Ratio,2018
Aviation 81,492,679 82,977,398 98.21% 555.59%
Engineering 307,022,849 887,792,496 34.58% 53.03%
Fire Domestic 667,513,716 1,171,387,648 56.98% 51.56%
Fire Commercial 1,316,279,978 2,648,117,867 49.71% 53.90%
Public Liability 841,141,763 1,422,425,001 59.13% 46.60%
Marine 878,617,473 1,969,892,400 44.60% 45.46%
Motor Private 9,388,658,142 21,564,825,429 43.54% 44.16%
Motor Commercial 9,738,190,890 22,741,999,298 42.82% 44.17%
Personal Accident 1,548,579,987 2,322,601,077 66.67% 56.21%
Medical 7,062,470,124 27,618,467,922 25.57% 28.35%
Theft 1,262,007,015 2,642,549,348 47.76% 44.59%
WIBA 2,816,694,205 5,982,070,985 47.09% 47.85%
Miscellaneous 755,800,726 1,839,864,935 41.08% 38.98%

70
Combined Ratio
Combined ratio is the summation of the technical loss ratio and the expense ratio. It is a measure of profitability used by an insurance
company to indicate how well it is performing in its daily operations.
In 2019, motor private had the highest combined ratio of 121.67% followed by aviation at 118.63%. Aviation was leading in 2018 ranking
at 725.22%. WIBA had the lowest combined ratio of 72.47% an improvement from 93.23% in 2018.
Table 33: Combined Ratio per Class of Insurance, 2019
Year 2019 Year 2018
Class Loss Ratio Expense Ratio Combined Ratio Loss Ratio Expense Ratio Combined Ratio
Aviation 20.42% 98.21% 118.63% 169.64% 555.59% 725.22%
Engineering 66.97% 34.58% 101.55% 44.38% 53.03% 97.41%
Fire Domestic 36.47% 56.98% 93.46% 43.43% 51.56% 94.99%
Fire Commercial 28.03% 49.71% 77.74% 45.21% 53.90% 99.11%
Public Liability 34.53% 59.13% 93.67% 36.07% 46.60% 82.67%
Marine 34.71% 44.60% 79.31% 32.86% 45.46% 78.32%
Motor Private 78.13% 43.54% 121.67% 68.92% 44.16% 113.08%
Motor Commercial 68.97% 42.82% 111.79% 60.76% 44.17% 104.94%
Personal Accident 22.59% 66.67% 89.26% 27.19% 56.21% 83.39%
Medical 73.69% 25.57% 99.26% 75.62% 28.35% 103.97%
Theft 30.07% 47.76% 77.83% 42.84% 44.59% 87.43%
WIBA 25.39% 47.09% 72.47% 45.38% 47.85% 93.23%
Miscellaneous 44.46% 41.08% 85.54% 45.85% 38.98% 84.83%
Funding Ratio
The industry funding ratio is a ratio of the insurance industry’s assets to its liabilities. A funding ratio of above 1.0 indicates that the
industry’s assets are able to cover all liabilities that the industry is obligated to.
In 2019, the surplus ratio stood at (0.45) from (0.50) in 2018 while funding ratio in 2019 was recorded at 1.45 from 1.50 in 2018. Since the
funding ratio is above 1.0, there is an indication that the industry’s assets are able to cover all liabilities that the industry is obligated to.
Table 34: Industry Funding Ratio/Surplus Ratio, in’000’ KES
Total Assets Total Liabilities Funding ratio Surplus ratio
2019 231,411,917 159,837,943 1.45 (0.45)
2018 207,608,360 138,399,747 1.50 (0.50)

71
Product Mix Ratio
Product mix ratio is the gross written premium per class divided by the overall gross written premium for the year, expressed as a
percentage.
Below is the table comparing 2019 and 2018 product mix ratio. Similar to 2018, medical insurance retained the highest product mix ratio
of 31.78% in 2019, while fire domestic had the lowest at 1.25% similar to 2018 where it stood at 1.24%.
Table 35: Change in Product Mix per Class, 2019 in KES ‘000
Class Current Year - 2019 CY % of Total Prior Year - 2018 PY % of Total CY% - PY %
Aviation 1,855,183 1.39% 1,871,602 1.45% -0.06%
Engineering 3,765,734 2.82% 3,911,664 3.04% -0.21%
Fire Domestic 1,672,957 1.25% 1,595,921 1.24% 0.02%
Fire Commercial 11,393,455 8.54% 11,308,968 8.78% -0.24%
Public Liability 3,222,089 2.41% 2,807,023 2.18% 0.24%
Marine 3,490,217 2.62% 3,660,055 2.84% -0.23%
Motor Private 23,598,601 17.68% 22,513,998 17.47% 0.21%
Motor Commercial 24,241,888 18.16% 23,589,062 18.31% -0.14%
Personal Accident 3,335,777 2.50% 3,191,369 2.48% 0.02%
Medical 42,417,899 31.78% 40,279,263 31.26% 0.52%
Theft 3,870,369 2.90% 3,900,722 3.03% -0.13%
WIBA 6,683,448 5.01% 6,445,578 5.00% 0.01%
Miscellaneous 3,907,098 2.93% 3,778,151 2.93% 0.00%
Total 133,454,717
128,853,376
KEY:
CY – Current Year
PY – Previous Year

72
Life Insurance Life insurance is a long-term contract between a policy holder and an insurer and facilitates long-term savings. Regular savings
over a long period ensure that a decent amount is accumulated to meet the policy holder’s financial needs at various stages in life.
In the event of death of the policyholder, life insurance ensures that their loved ones continue to enjoy quality life. There are other
events in life that may trigger payment depending on the terms of the contract including critical illness, terminal illness, temporary
or permanent disability. Other expenses such as funeral expenses may also be covered.
Life insurance provides financial support in the event of untimely demise and it also acts as a long-term investment. This cover
enables a policy holder to meet his/her goals such as children’s education, marriage, building homes or planning for relaxed retired
life. Life insurance policies comprise protection policies designed to provide benefit in the happening of insured event and
investment policies whose main objective is to facilitate the growth of capital or a combination of both. The categories of Life
insurance are outlined below.
a) Ordinary Life Assurance comprises all individual life policies categorized as Term Assurance policies; Endowment policies;
Investment policies and Whole life policies.
b) Group Life Assurance comprises Group Life schemes mainly organized by employers on behalf of their employees; Group
Credit/Group Mortgage Schemes which are loan protection schemes organized by financiers like banks, co-operative societies,
microfinance institutions, etc.; and last expense schemes which are many a time given as a rider to the group life schemes.
Nevertheless, Last expense covers can also be arranged on standalone basis.
c) Deposit Administration/Pension Business – These are Pension Plans / schemes whereby the Insurance Company gives a
contractual guarantee on all the capital paid into the scheme and in addition a guarantee on minimum annual rate of return. This
ensures that the retirement funds are secure and available when required by retiring members because the insurance company
bears the investment risk.
d) Investment/Unit Linked Contracts – These products give investors both insurance and investment under a single integrated
plan. The main objective is to facilitate the growth of capital invested by the client.
Life Insurance Gross Written Premium
There were 26 life insurance companies in 2019. Gross Written Premium was KES 97.85 billion in 2019 compared to KES 87 billion in 2018, an increase of 12.14%. Life insurance penetration rate increased slightly in 2019 to 1.00 % compared to 0.98% in 2018. Basing on the trend analysis below, the average growth rate from 2015 to 2019 stands at 11.54%. The rising income levels and also the low level of penetration of life insurers in Kenya continue to create an attractive environment for both local and international insurance market to expand and tap the huge uninsured population.
26 insurance companies
underwrote life business.
Life business penetration
increased in 2019 to 1.00%
compared to 0.98% in 2018.
Total GWP for life insurance
was KES 97.85 billion in
2019 which was a 12.14%
increase from 2018.
On average, life insurance
premiums have grown by
11.54% from 2015 to 2019.

73
Figure 33: Gross Written Premium Trend, Life Insurance 2015 – 2019, in KES ’000’
Figure 34: Life Insurance Gross Written Premium Distribution, 2019, in KES ’000’
Table 36: Gross Written Premium and Growth Rates for Life Insurance, 2015 –2019, in KES ’000’
2015 2016 2017 2018 2019
Gross Premium
Growth %
Gross Premium
Growth %
Gross Premium
Growth %
Gross Premium
Growth %
Gross Premium
Growth %
Average Growth,
% 2015-2019
Deposit Administration
21,756,555 19.69
28,380,518 30.45
29,363,388 3.46
33,260,652 13.27
36,917,072 10.99 15.57
Ordinary Life 20,017,441 11.02 22,478,620 12.30 24,882,108 10.69 26,607,010 6.93 32,718,330 22.97 12.78
Group Life 17,606,427 -3.95 20,914,576 18.79 25,240,520 20.68 23,167,731 -8.21 25,109,989 8.38 7.14
Investment / Unit Linked
2,476,923 2.03
2,148,390 -13.26
4,164,268 93.83
4,221,907 1.38
3,107,048 -26.41 11.52
Total 61,857,346 8.58 73,922,104 19.50 83,650,284 13.16 87,257,300 4.31 97,852,439 12.14 11.54
Life insurance premium and contributions growth rate was 12.14% in 2019, while in 2018 the growth rate was 4.31%. On average,
life insurance premium has grown by 11.54% between 2015 and 2019.
61,857,346
73,922,104
83,650,284 87,257,300
97,852,439
2015 2016 2017 2018 2019
36,917,072
32,718,330
25,109,989
3,107,048
Deposit Administration Ordinary Life Group Life Investment / Unit Linked

74
Table 37: Gross Written Premium and Market Share for Life Insurance, 2015- 2019, in KES ’000’
2015 2016 2017 2018 2019
Gross Premium
Market Share
%
Gross Premium
Market Share
%
Gross Premium
Market Share
%
Gross Premium
Market Share
%
Gross Premium
Market Share
%
Deposit Administration 21,756,555 35.17 28,380,518 38.39 29,363,388 35.10 33,260,652 38.12 36,917,072 37.73
Ordinary Life 20,017,441 32.36 22,478,620 30.41 24,882,108 29.75 26,607,010 30.49 32,718,330 33.44
Group Life 17,606,427 28.46 20,914,576 28.29 25,240,520 30.17 23,167,731 26.55 25,109,989 25.66
Investment / Unit Linked
2,476,923 4.01
2,148,390 2.91
4,164,268 4.98
4,221,907 4.84
3,107,048 3.18
Total 61,857,346 100 73,922,104 100 83,650,284 100 87,257,300 100 97,852,439 100
The life insurance gross written premium in 2019 was KES 97.85 billion. Deposit administration had a share of 37.73%, ordinary
life 33.44%, group life 25.66% and investment/unit linked 3.18%.
Figure 35: Life Insurance Market Share per Class, 2019
38%
33%
26%
3%
Deposit Administration
Ordinary Life
Group Life
Investment / Unit Linked
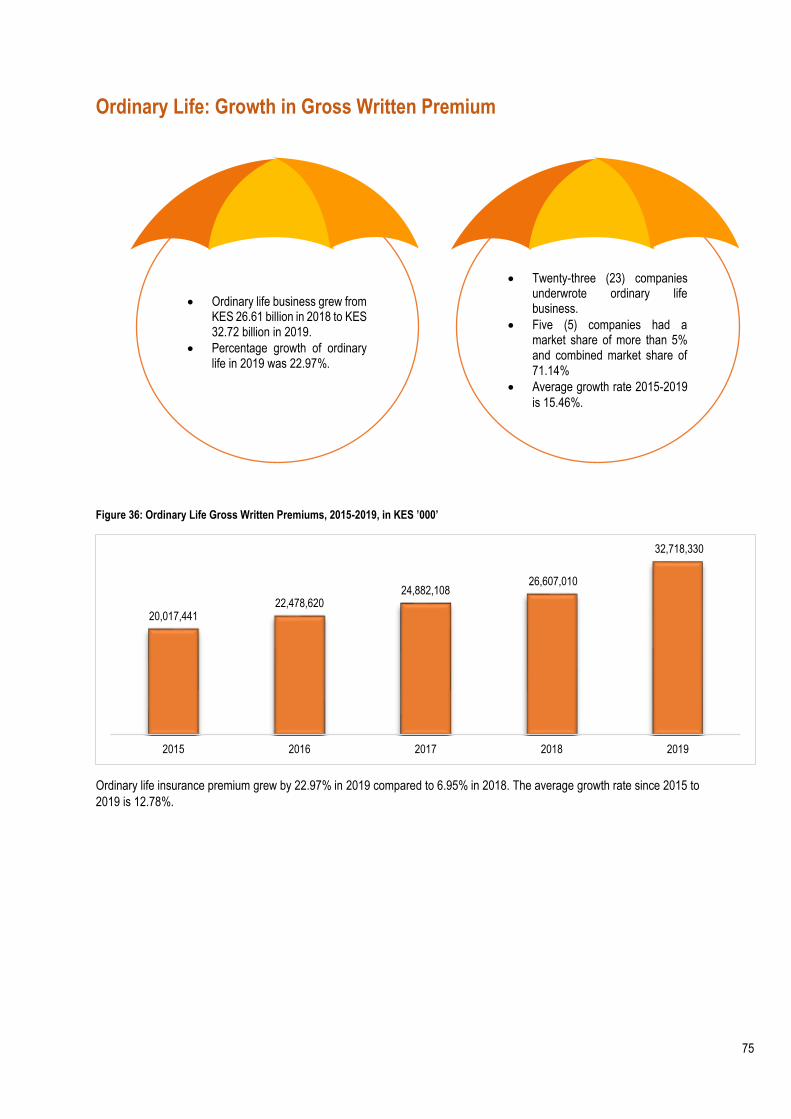
75
Ordinary Life: Growth in Gross Written Premium
Figure 36: Ordinary Life Gross Written Premiums, 2015-2019, in KES ’000’
Ordinary life insurance premium grew by 22.97% in 2019 compared to 6.95% in 2018. The average growth rate since 2015 to
2019 is 12.78%.
20,017,44122,478,620
24,882,10826,607,010
32,718,330
2015 2016 2017 2018 2019
Twenty-three (23) companies underwrote ordinary life business.
Five (5) companies had a market share of more than 5% and combined market share of 71.14%
Average growth rate 2015-2019
is 15.46%.
Ordinary life business grew from KES 26.61 billion in 2018 to KES 32.72 billion in 2019.
Percentage growth of ordinary life in 2019 was 22.97%.

76
Table 38: Ordinary Life GWP and Market Share per Company, 2015-2019, in KES ’000’
Company 2015 2016 2017 2018 2019
Gross
Premium Market Share
Gross Premium
Market Share
Gross Premium
Market Share
Gross Premium
Market Share
Gross Premium
Market Share
APA Life 40,436 0.20% 63,476 28.24% 77,583 0.31 125,301 0.47% 148,664 0.45%
Barclays Life - - - - - 0.83 374,550 1.41% 662,445 2.02%
Britam Life 6,008,220 30.01% 7,102,247 3159.56% 9,470,201 38.06 9,526,975 35.81% 11,802,637 36.07%
Cannon 99,674 0.50% 97,648 43.44% 82,280 0.33 - - - 0.00%
Capex 13,117 0.07% 7,519 3.34% 261,151 1.05 162,775 0.61% 136,055 0.42%
CIC Life 886,412 4.43% 975,654 434.04% 1,086,076 4.36 1,818,897 6.84% 1,438,123 4.40%
Corporate 267,651 1.34% 287,686 127.98% 278,415 1.12 269,037 1.01% 280,275 0.86%
GA Life - - - - - - - - 313,330 0.96%
Geminia 28,604 0.14% 238,317 106.02% 45,875 0.18 90,276 0.34% 56,083 0.17%
ICEA Lion Life 2,124,583 10.61% 1,981,769 881.62% 2,686,935 10.80 2,506,223 9.42% 3,302,679 10.09%
Jubilee Life 2,078,368 10.38% 2,802,794 1246.87% 3,001,737 12.06 3,427,373 12.88% 3,685,536 11.26%
Kenindia 1,001,162 5.00% 1,026,561 456.68% 1,235,077 4.96 1,448,127 5.44% 1,614,208 4.93%
Kenya Orient Life 7,946 0.04% 61,688 27.44% 161,470 0.65 41,953 0.16% 47,666 0.15%
Kenyan Alliance 32,248 0.16% 14,504 6.45% 15,247 0.06 28,703 0.11% 52,975 0.16%
Liberty Life 2,275,249 11.37% 2,278,050 1013.43% 1,321,127 5.31 1,370,033 5.15% 2,422,562 7.40%
Madison Life 912,087 4.56% 924,183 411.14% 1,033,987 4.16 1,033,987 3.89% 1,451,627 4.44%
Metropolitan Cannon Life 20,843 0.10% 16,185 7.20% 40,048 0.16 98,225 0.37% 96,000 0.29%
Monarch 8,745 0.04% 18,090 8.05% 22,729 0.09 23,314 0.09% 24,122 0.07%
Old Mutual Life 476,579 2.38% 698,891 310.91% 766,625 3.08 895,654 3.37% 981,472 3.00%
Sanlam Life 2,591,505 12.95% 2,507,245 1115.39% 1,643,646 6.61 1,758,859 6.61% 2,063,121 6.31%
Pioneer Life 581,622 2.91% 660,591 293.88% 717,432 2.88 723,457 2.72% 968,911 2.96%
Prudential Life 132,702 0.66% 138,739 61.72% 137,920 0.55 177,227 0.67% 251,490 0.77%
Saham Assurance 43,110 0.22% 41,445 18.44% 44,016 0.18 37,106 0.14% 29,649 0.09%
UAP Life Assurance 371,541 1.86% 399,601 177.77% 547,014 2.20 668,957 2.51% 888,700 2.72%
Total 20,017,441 100% 22,478,620 100% 24,882,108 100% 26,607,010 100% 32,718,330 100%
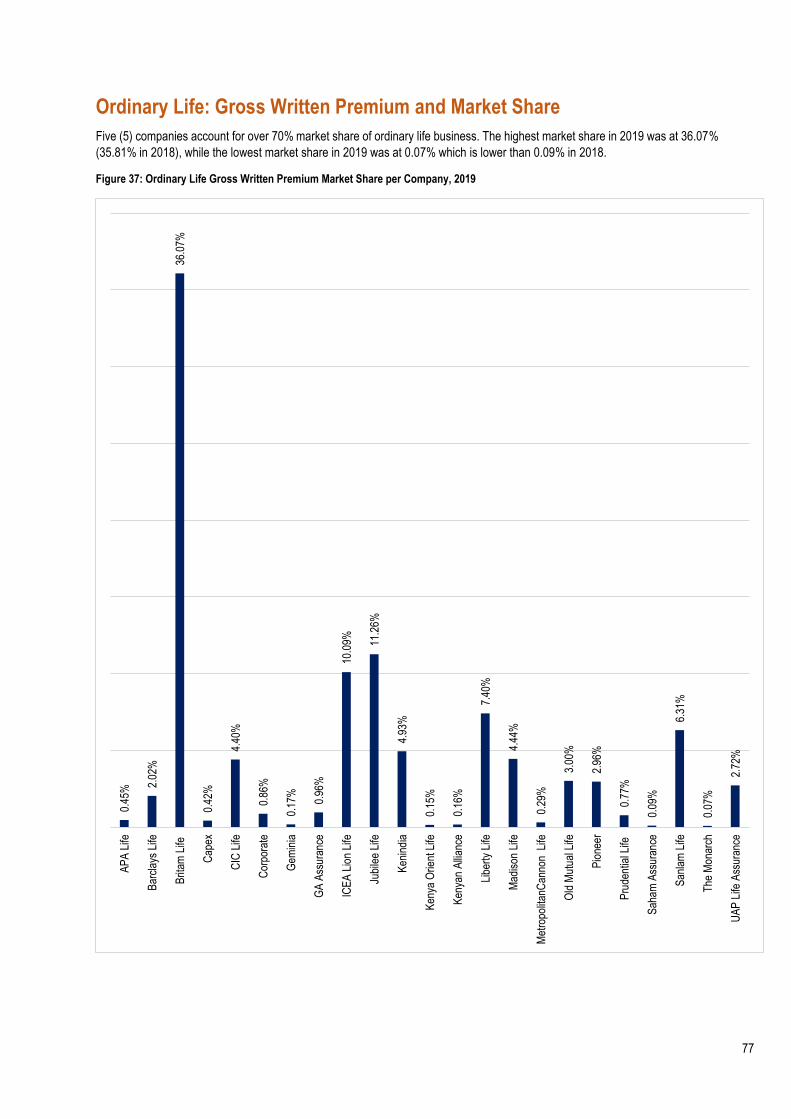
77
Ordinary Life: Gross Written Premium and Market Share
Five (5) companies account for over 70% market share of ordinary life business. The highest market share in 2019 was at 36.07%
(35.81% in 2018), while the lowest market share in 2019 was at 0.07% which is lower than 0.09% in 2018.
Figure 37: Ordinary Life Gross Written Premium Market Share per Company, 2019
0.45
% 2.02
%
36.0
7%
0.42
%
4.40
%
0.86
%
0.17
%
0.96
%
10.0
9% 11.2
6%
4.93
%
0.15
%
0.16
%
7.40
%
4.44
%
0.29
%
3.00
%
2.96
%
0.77
%
0.09
%
6.31
%
0.07
%
2.72
%
AP
A L
ife
Bar
clay
s Li
fe
Brit
am L
ife
Cap
ex
CIC
Life
Cor
pora
te
Gem
inia
GA
Ass
uran
ce
ICE
A L
ion
Life
Jubi
lee
Life
Ken
indi
a
Ken
ya O
rient
Life
Ken
yan
Alli
ance
Libe
rty
Life
Mad
ison
Life
Met
ropo
litan
Can
non
Life
Old
Mut
ual L
ife
Pio
neer
Pru
dent
ial L
ife
Sah
am A
ssur
ance
San
lam
Life
The
Mon
arch
UA
P L
ife A
ssur
ance

78
Table 39: Ordinary Life Investment Income and Expenses per Company, 2019, in KES ’000’
Company Gross
Premiums Reinsurance
Net Premium
Investment Income + Other
Income
Claims + Benefits
Commissions Operating &
Other Expenses
Total Expenses
APA Life 148,664 8,922 139,742 45,142 102,777 66,856 102,808 169,664
Absa Life 662,445 0 662,445 159,795 60,296 130,282 391,257 521,539
Britam Life 11,802,637 5,686 11,796,951 2,484,800 4,195,080 1,311,546 2,214,313 3,525,859
Capex 136,055 0 136,055 11,567 203,749 1,632 106,815 108,447
CIC Life Assurance 1,438,123 16,519 1,421,604 317,803 1,264,487 120,685 307,949 428,634
Corporate 280,275 2,973 277,302 117,257 378,425 60,803 97,509 158,312
Geminia 56,083 0 56,083 123,487 35,396 7,133 146,560 153,693
GA Life 313,330 0 313,330 30,753 17,459 6,266 11 6,277
ICEA Lion Life 3,302,679 44,930 3,257,749 1,366,509 2,184,040 594,756 765,008 1,359,764
Jubilee Life 3,685,536 8,689 3,676,847 1,101,116 1,950,573 688,290 542,962 1,231,252
Kenindia 1,614,208 8,472 1,605,736 1,160,401 746,007 100,187 274,811 374,998
Kenya Orient Life 47,666 22 47,644 3,966 9,333 9,214 74,881 84,095
Kenyan Alliance 52,975 0 52,975 8,446 4,465 12,180 7,264 19,444
Liberty 2,422,562 4,027 2,418,535 1,404,471 2,984,767 195,449 561,993 757,442
Madison Life 1,451,627 0 1,451,627 218,145 1,096,078 246,657 606,657 853,314
Metropolitan Cannon Life 96,000 1,134 94,866 98,603 133,729 1,141 75,245 76,386
Old Mutual Life 981,472 88,131 893,341 1,211,490 978,051 306,192 715,253 1,021,445
Pioneer Life 968,911 1,968 966,943 207,092 647,244 283,866 201,070 484,936
Prudential Life Assurance 251,490 0 251,490 67,798 109,848 59,775 161,404 221,179
Saham Assurance 29,649 6,268 23,381 60,868 37,024 2,074 20,981 23,055
Sanlam Life 2,063,121 30,891 2,032,230 325,296 299,204 267,242 745,516 1,012,758
The Monarch 24,122 169 23,953 5,994 8,142 3,520 23,051 26,571
UAP Life Assurance 888,700 1,834 886,866 295,113 142,780 47,336 302,236 349,572
Total 2019 32,718,330 230,635 32,487,695 10,825,912 17,588,954 4,523,082 8,445,554 12,968,636

79
Investment/Unit Linked Contracts
Figure 38: Growth in Investment/United Linked Contracts Contributions, 2015-2019, in KES ’000’
On average, the growth in investment/Unit linked contracts since 2015 was 11.48%. 2017 had the highest growth rate of 93.49%,
2018 had 1% while 2019 had a decline of (26.41) %.
2,448,086
2,148,390
4,164,268 4,221,907
3,107,048
2015 2016 2017 2018 2019
Thirteen (13) companies wrote this class of business in 2019.
Three (3) companies had a market share of more than 10% each and contributed 86.17% of the total market share.
Contributions for Investment /
Unit linked contracts
decreased to KES 3.11 billion
in 2019, a 26.41% decline
compared to 4.22 billion in
2018.
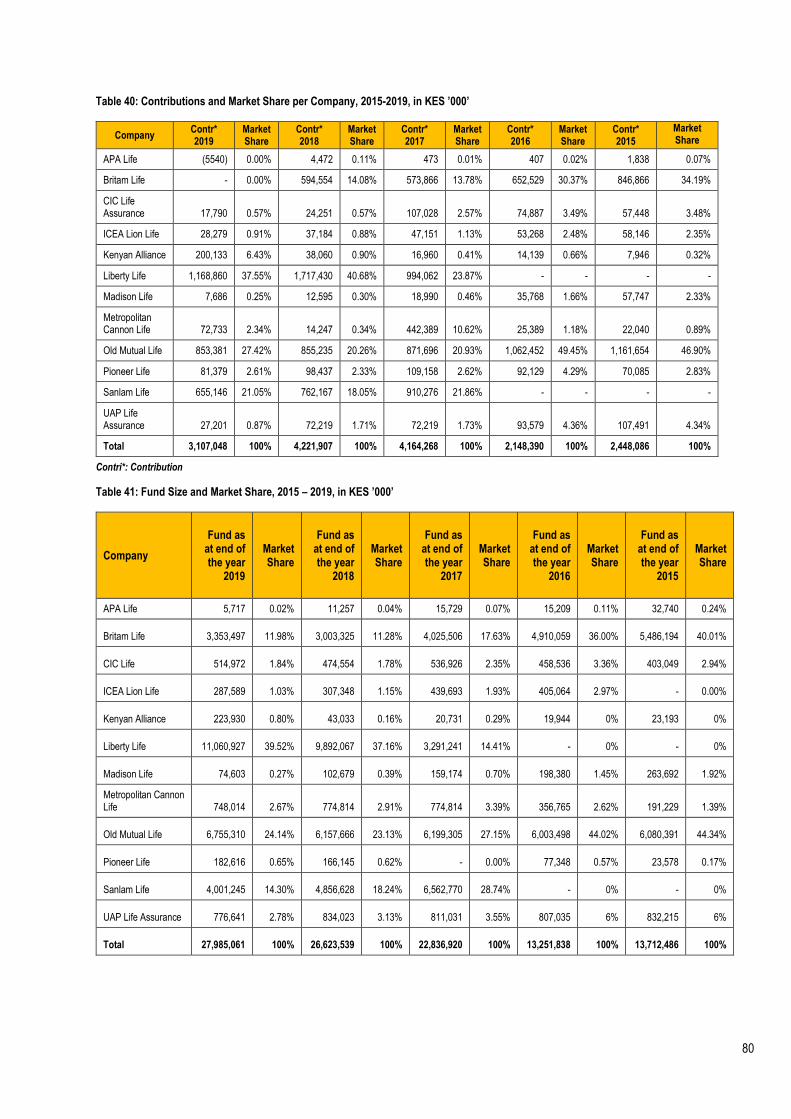
80
Table 40: Contributions and Market Share per Company, 2015-2019, in KES ’000’
Company Contr* 2019
Market Share
Contr* 2018
Market Share
Contr* 2017
Market Share
Contr* 2016
Market Share
Contr* 2015
Market Share
APA Life (5540) 0.00% 4,472 0.11% 473 0.01% 407 0.02% 1,838 0.07%
Britam Life - 0.00% 594,554 14.08% 573,866 13.78% 652,529 30.37% 846,866 34.19%
CIC Life Assurance 17,790 0.57% 24,251 0.57% 107,028 2.57% 74,887 3.49% 57,448 3.48%
ICEA Lion Life 28,279 0.91% 37,184 0.88% 47,151 1.13% 53,268 2.48% 58,146 2.35%
Kenyan Alliance 200,133 6.43% 38,060 0.90% 16,960 0.41% 14,139 0.66% 7,946 0.32%
Liberty Life 1,168,860 37.55% 1,717,430 40.68% 994,062 23.87% - - - -
Madison Life 7,686 0.25% 12,595 0.30% 18,990 0.46% 35,768 1.66% 57,747 2.33%
Metropolitan Cannon Life 72,733 2.34% 14,247 0.34% 442,389 10.62% 25,389 1.18% 22,040 0.89%
Old Mutual Life 853,381 27.42% 855,235 20.26% 871,696 20.93% 1,062,452 49.45% 1,161,654 46.90%
Pioneer Life 81,379 2.61% 98,437 2.33% 109,158 2.62% 92,129 4.29% 70,085 2.83%
Sanlam Life 655,146 21.05% 762,167 18.05% 910,276 21.86% - - - -
UAP Life Assurance 27,201 0.87% 72,219 1.71% 72,219 1.73% 93,579 4.36% 107,491 4.34%
Total 3,107,048 100% 4,221,907 100% 4,164,268 100% 2,148,390 100% 2,448,086 100%
Contri*: Contribution
Table 41: Fund Size and Market Share, 2015 – 2019, in KES ’000’
Company
Fund as at end of the year
2019
Market Share
Fund as at end of the year
2018
Market Share
Fund as at end of the year
2017
Market Share
Fund as at end of the year
2016
Market Share
Fund as at end of the year
2015
Market Share
APA Life 5,717 0.02% 11,257 0.04% 15,729 0.07% 15,209 0.11% 32,740 0.24%
Britam Life 3,353,497 11.98% 3,003,325 11.28% 4,025,506 17.63% 4,910,059 36.00% 5,486,194 40.01%
CIC Life 514,972 1.84% 474,554 1.78% 536,926 2.35% 458,536 3.36% 403,049 2.94%
ICEA Lion Life 287,589 1.03% 307,348 1.15% 439,693 1.93% 405,064 2.97% - 0.00%
Kenyan Alliance 223,930 0.80% 43,033 0.16% 20,731 0.29% 19,944 0% 23,193 0%
Liberty Life 11,060,927 39.52% 9,892,067 37.16% 3,291,241 14.41% - 0% - 0%
Madison Life 74,603 0.27% 102,679 0.39% 159,174 0.70% 198,380 1.45% 263,692 1.92%
Metropolitan Cannon Life 748,014 2.67% 774,814 2.91% 774,814 3.39% 356,765 2.62% 191,229 1.39%
Old Mutual Life 6,755,310 24.14% 6,157,666 23.13% 6,199,305 27.15% 6,003,498 44.02% 6,080,391 44.34%
Pioneer Life 182,616 0.65% 166,145 0.62% - 0.00% 77,348 0.57% 23,578 0.17%
Sanlam Life 4,001,245 14.30% 4,856,628 18.24% 6,562,770 28.74% - 0% - 0%
UAP Life Assurance 776,641 2.78% 834,023 3.13% 811,031 3.55% 807,035 6% 832,215 6%
Total 27,985,061 100% 26,623,539 100% 22,836,920 100% 13,251,838 100% 13,712,486 100%

81
Figure 39: Composition of Ordinary Life, 2019
The main product sold under ordinary life in 2019 was endowment which comprised 71.0%; a decrease from 74.83% in 2018. Unit
linked contracts were second at 11.5%, a decline from 12.88% in 2018.
71.0
%
11.5
%
11.7
%
2.0%
1.9%
1.0%
0.9%
En
do
wm
en
t
Un
it L
ink
ed
An
nu
ity
Wh
ole
Lif
e
Te
rm A
ss
ura
nc
e
La
st
Ex
pe
ns
e
Cre
dit
Lif
e

82
Group Life: Growth in Gross Written Premium
* Change in growth rate approach from point in time growth rate to obtaining year on year growth rates then finding the average for the past five years.
Figure 40: Gross Written Premium in Group Life, 2015-2019, in KES ’000
17,606,427
25,914,576 25,240,520
23,167,731
25,109,989
2015 2016 2017 2018 2019
Average year on year growth rate since 2015 is 8.16 %.*
The number of companies underwriting group life was 26.
Two (2) companies had a market share of more than 10% each and contributed 30.34% of the total market share.
Group life premiums increased to KES 25.11 billion in 2019 from KES 23.17 billion in 2018.
Percentage growth of group life
premiums in 2019 was 8.38%.

83
Figure 41: Annual Group Life Premium Growth Rate, 2015-2019
Table 42: Group Life Gross Written Premium and Market Share, 2015-2019, in KES ’000’
Company
2015 2016 2017 2018 2019
Gross Premium
Market Share
Gross Premium
Market Share
Gross Premium
Market Share
Gross Premium
Market Share
Gross Premium
Market Share
APA Life 542,982 3.08% 661,787 3.16% 829,996 3.29% 837,511 3.61% 759,906 3.03%
Barclays Life 502,807 2.86% 1,117,081 5.34% 1,174,813 4.65% 1,402,192 6.05% 2,133,696 8.50%
Britam Life 1,374,337 7.81% 1,711,811 8.18% 1,657,389 6.57% 2,306,431 9.96% 2,039,140 8.12%
Capex 17,938 0.10% 49,128 0.23% 52,189 0.21% 171,137 0.74% 174,456 0.69%
CIC Life 2,575,133 14.63% 2,811,475 13.44% 3,048,775 12.08% 3,274,256 14.13% 3,559,770 14.18%
Corporate 115 0.00% 8,080 0.04% 534 0.00% 1,605 0.01% 14,044 0.06%
First Assurance 81,246 0.46% 103,450 0.49% 168,783 0.67% 109,189 0.47% 93,236 0.37%
GA Life 24,080 0.14% 30,391 0.15% 33,088 0.13% 37,014 0.16% 37,012 0.15%
Geminia 63,927 0.36% 49,698 0.24% 132,261 0.52% 481,835 2.08% 940,474 3.75%
ICEA Lion Life 1,319,705 7.50% 1,610,412 7.70% 3,736,775 14.80% 1,327,933 5.73% 1,049,198 4.18%
Jubilee Life 1,117,136 6.35% 1,661,458 7.94% 2,959,992 11.73% 1,583,574 6.84% 2,170,317 8.64%
Kenindia 43,860 0.25% 403,374 1.93% 451,631 1.79% 519,848 2.24% 462,770 1.84%
Kenya Orient Life 481,388 2.73% 222,270 1.06% 200,579 0.79% 484,725 2.09% 549,930 2.19%
Kenyan Alliance 146,394 0.83% 576,677 2.76% 579,712 2.30% 198,833 0.86% 251,021 1.00%
KUSSCO Mutual
0.00%
0.00%
0.00%
0.00% 449,631 1.79%
Liberty Life 803,012 4.56% 698,567 3.34% 856,690 3.39% 920,991 3.98% 1,115,520 4.44%
Madison Life 1,178,063 6.69% 1,151,006 5.50% 1,269,548 5.03% 1,751,370 7.56% 1,889,420 7.52%
Metropolitan Cannon Life 350,635 1.99% 352,290 1.68% 569,909 2.26% 146,416 0.63% 172,312 0.69%
Old Mutual Life 366,304 2.08% 277,020 1.32% 281,315 1.11% 273,728 1.18% 328,287 1.31%
Pioneer Life 3,497,884 19.87% 4,477,353 21.41% 4,266,197 16.90% 4,504,432 19.44% 4,059,402 16.17%
Prudential Life 1,931 0.01% 20,042 0.10% 180,269 0.71% 223,646 0.97% 365,504 1.46%
Saham Assurance 112,478 0.64% 60,635 0.29% 19,606 0.08% 6,484 0.03% 2,953 0.01%
Sanlam Life 2,051,535 11.65% 1,889,094 9.03% 1,773,010 7.02% 1,789,899 7.73% 1,669,025 6.65%
Takaful 872,971 4.96% 874,145 4.18% 58,896 0.23% 60,262 0.26% 8,561 0.03%
The Monarch 14,085 0.08% 25,605 0.12% 23,778 0.09% 50,788 0.22% 47,185 0.19%
UAP Life Assurance 28,049 0.16% 52,657 0.25% 915,335 3.63% 703,633 3.04% 767,219 3.06%
Total 17,606,427 100% 20,914,576 100% 25,240,520 100% 23,167,731 100% 25,109,989 100%
-3.95%
47.19%
-2.60%-8.21%
8.38%
-20.00%
-10.00%
0.00%
10.00%
20.00%
30.00%
40.00%
50.00%
2015 2016 2017 2018 2019

84
Figure 42: Group Life Gross Written Premium and Market Share per Company
In 2019, only two (2) insurers had a market share of more than 10% each and contributed to 30.34% of the total market share.
Figure 43: Composition of Group Life, 2019
The share of Group Life Schemes remained at 47% same as in 2018. The share of Group Mortgage/Credit increased to 39%
compared to 33% in 2018, while that of Annuity business decreased to 12% in 2019 compared to 19% in 2018.
3.03
%
8.50
%
8.12
%
0.69
%
14.1
8%
0.06
%
0.37
%
0.15
%
3.75
%
4.18
%
8.64
%
1.84
%
2.19
%
1.00
%
1.79
% 4.44
%
7.52
%
0.69
%
1.31
%
16.1
7%
1.46
%
0.01
%
6.65
%
0.19
%
0.03
% 3.06
%
0.00%
2.00%
4.00%
6.00%
8.00%
10.00%
12.00%
14.00%
16.00%
18.00%
AP
A L
ife
Abs
a Li
fe
Brit
am L
ife
Cap
ex
CIC
Life
Ass
uran
ce
Cor
pora
te
Firs
t Ass
uran
ce
GA
Life
Gem
inia
ICE
A L
ion
Life
Jubi
lee
Life
Ken
indi
a
Ken
ya O
rient
Life
Ken
yan
Alli
ance
KU
SS
CO
Mut
ual
Libe
rty
Life
Mad
ison
Life
Met
ropo
litan
Can
non
Life
Old
Mut
ual L
ife
Pio
neer
Ass
uran
ce
Pru
dent
ial L
ife A
ssur
ance
Sah
am A
ssur
ance
San
lam
Life
The
Mon
arch
Tak
aful
Insu
ranc
e
UA
P L
ife A
ssur
ance
Group Life Schemes
47%Group Mortgage / Credit
39%
Annuities12%
Last Expense2%

85
Group Life: Investment Income and Expenses Table 43: Group Life Investment Income and Expenses, 2019, in KES ’000’
Company Gross Premiums
Reinsurance Net Premium
Claims + Benefits
Investment Income + Other Income
Commissions Net
Operating & Other Expenses
Total Expenses
APA Life 759,906 409,145 350,761 226,857 160,973 107,784 110,451 218,235
Absa Life 2,133,696 965,694 1,168,002 838,661 197,464 426,714 192,708 619,422
Britam Life 2,039,140 248,950 1,790,190 447,557 522,262 128,404 816,124 944,528
Capex 174,456 29,925 144,531 68,343 10,373 6,529 26,704 33,233
CIC Life Assurance 3,559,770 951,794 2,607,976 1,623,302 286,181 27,380 1,185,854 1,158,474
Corporate 14,044 1,618 12,426 5,939 6,205 0 4,886 4,886
First Assurance 93,236 83,247 9,989 152,455 46,752 7,385 8,433 15,818
GA Life 37,012 34,461 2,552 1,800 2,167 18,262 9,266 27,528
Geminia 940,474 481,603 458,871 486,036 0 88,224 16,765 104,989
ICEA Lion Life 1,049,198 238,651 810,547 109,451 1,806,195 34,404 102,906 137,310
Jubilee Life 2,170,317 585,205 1,585,112 242,815 6,584,016 204,038 548,583 752,621
Kenindia 462,770 24,963 437,807 146,523 178,426 12,302 2,758 15,060
Kenya Orient Life 549,930 34,046 515,884 305,266 45,634 35,439 151,342 186,781
Kenyan Alliance 251,021 87,911 163,110 252,613 40,947 15,414 35,364 50,778
KUSSCO Mutual 449,631 126,028 323,603 210,917 35,444 30,959 105,043 136,002
Liberty Life 1,115,520 208,833 906,687 401,816 60,580 150,415 196,718 347,133
Madison Life 1,889,420 84,708 1,804,712 2,173,093 311,286 67,681 155,547 223,228
Metropolitan Cannon Life 172,312 68,676 103,636 165,579 86,674 17,852 99,743 117,595
Old Mutual Life 328,287 104,276 224,011 138,196 89,566 27,228 94,883 122,110
Pioneer Life 4,059,402 1,818,970 2,240,432 2,060,675 2,708,465 281,472 335,116 616,588
Prudential Life Assurance 365,504 56,099 309,405 82,279 27,207 41,660 159,388 201,048
Saham Assurance 2,953 1,563 1,390 4,496 3,413 307 0 307
Sanlam Life 1,669,025 404,946 1,264,079 1,712,092 1,304,732 83,771 259,334 343,105
Takaful Insurance 8,561 5,037 3,524 4,511 0 0 39,060 39,060
The Monarch 47,185 26,393 20,792 4,442 17,382 5,545 36,379 41,924
UAP Life Assurance 767,219 293,830 473,389 244,292 82,857 7,224 148,075 155,299
Total 25,109,989 7,376,572 17,733,417 12,110,006 14,615,201 1,826,393 4,841,430 6,667,823

86
Growth in Deposit Administration/ Pension
Figure 44: Growth in Deposit Administration Contributions, 2015-2019, in KES ’000’
22,221,801
28,380,518 29,363,388
33,260,652
36,917,072
0
5,000,000
10,000,000
15,000,000
20,000,000
25,000,000
30,000,000
35,000,000
40,000,000
2015 2016 2017 2018 2019
Average growth rate since
2015 was 15.54%, with 18
insurance companies
underwriting deposit
administration / pension.
Three (3) companies had a
market share of more than
20% and contributed 71.38%
of the total market share.
Deposit Administration/
Pension rose to KES 36.92
billion in 2019 from KES
33.26 billion in 2018.
Percentage growth was
10.99% in 2019 compared to
a growth rate of 13.27% in
2018.

87
Deposit Administration /Pensions Market Share Table 44: Deposit Admin/Pension Contribution and Market Share per Co., 2015-2019, in KES ’000’
Company
2015 2016 2017 2018 2019
Gross Premium
Market Share
Gross Premium
Market Share
Gross Premium
Market Share
Gross Premium
Market Share
Gross Premium
Market Share
APA Life 453,630 2.04% 498,176 1.76% 585,374 1.99% 530,487 1.59% 609,152 1.65%
Britam Life 3,929,719 17.68% 7,712,732 27.18% 6,596,029 22.46% 8,190,708 24.63% 9,413,229 25.50%
CIC Life 807,047 3.63% 565,718 1.99% 760,324 2.59% 981,143 2.95% 1,074,234 2.91%
GA Life 697,424 3.14% 1,494,913 5.27% 1,585,354 5.40% 1,634,869 4.92% 2,573,677 6.97%
Geminia - 0.00% - 0.00% - 0.00% - 0.00% 132,377 0.36%
ICEA LION Life 4,741,207 21.34% 5,880,157 20.72% 6,544,852 22.29% 8,242,547 24.78% 8,660,745 23.46%
Jubilee Life 5,783,860 26.03% 5,896,593 20.78% 6,681,994 22.76% 7,642,301 22.98% 8,277,933 22.42%
Kenindia 2,238,915 10.08% 2,517,094 8.87% 2,954,607 10.06% 3,578,788 10.76% 3,535,194 9.58%
Kenya Orient Life 6,065 0.02% 61,490 0.21% 71,179 0.21% 100,344 0.27%
Kenyan Alliance 407,597 1.83% 610,562 2.15% 447,248 1.52% 225,461 0.68% 362,589 0.98%
Liberty Life 1,652,286 7.44% 1,276,993 4.50% 1,330,920 4.53% 503,298 1.51% 395,740 1.07%
Madison Life 260,907 1.17% 270,211 0.95% 281,723 0.96% 365,967 1.10% 334,285 0.91%
Pioneer Life 32,644 0.15% 62,042 0.22% 121,136 0.41% 242,662 0.73% 369,793 1.00%
Prudential Assurance - 0.00% - 0.00% - 0.00% - 0.00% 21,252 0.06%
Saham Assurance 141,638 0.64% 148,514 0.52% 157,921 0.54% 17,978 0.05% 25,632 0.07%
Sanlam Life 260,671 1.17% 273,305 0.96% 411,797 1.40% 210,414 0.63% 192,425 0.52%
The Monarch 9,567 0.04% 8,812 0.03% 11,568 0.04% 39,905 0.12% 121,961 0.33%
UAP Life Assurance 804,689 3.62% 1,158,631 4.08% 831,051 2.83% 782,945 2.35% 716,510 1.94%
Total 22,221,801 100% 28,380,518 100% 29,363,388 100% 33,260,652 100% 36,917,072 100%
Figure 45: Deposit Administration/ Pension Gross Premium % Market Share, 2019
1.65
%
25.5
0%
2.91
%
6.97
%
0.36
%
23.4
6%
22.4
2%
9.58
%
0.27
%
0.98
%
1.07
%
0.91
%
1.00
%
0.06
%
0.07
%
0.52
%
0.33
% 1.94
%
AP
A L
ife
Brit
am L
ife
CIC
Life
GA
Life
Gem
inia
ICE
A L
ion
Life
Jubi
lee
Life
Ken
indi
a
Ken
ya O
rient
Life
Ken
yan
Alli
ance
Libe
rty
Life
Mad
ison
Life
Pio
neer
Life
Pru
dent
ial A
ssur
ance
Sah
am A
ssur
ance
San
lam
Life
The
Mon
arch
UA
P L
ife A
ssur
ance

88
Figure 46: Composition of Deposit Administration/ Pension, 2019
In 2019, the share of Group Schemes decreased to 50% from 52% in 2018. The share of Personal Pension Plans increased to
31% in 2019 from 28% in 2018, while that of Umbrella Schemes dropped to 19% in 2019 from 20% in 2018.
Group Schemes50%
Umbrella Schemes
19%
Personal Pension31%

89
Deposit Administration / Pension: Declared Interest Rates, Fund Size,
Surrenders and Annuities Paid Table 45: Deposit Admin/Pension: Interest Rates, Fund Size, Surrenders/Annuities Paid, in KES ’000’
Fu
nd
Mar
ket
Sh
are
(%)
2018
1.91
%
18.6
4%
1.70
%
4.05
%
-
26.0
7%
25.4
6%
12.6
7%
0.06
%
1.28
%
3.20
%
1.54
%
0.29
%
-
0.35
%
0.60
%
0.06
%
2.11
%
100.
00%
Fu
nd
Mar
ket
Sh
are
(%)
2019
1.90
%
19.7
1%
1.94
%
4.78
%
0.08
%
26.0
1%
25.0
6%
12.4
3%
0.08
%
1.18
%
2.27
%
1.47
%
0.42
%
0.01
%
0.07
%
0.52
%
0.09
%
1.98
%
100.
00%
Fu
nd
as
at e
nd
of
th
e Y
ear
31/1
2/20
18
3,49
7,31
4
34,1
74,9
11
3,12
4,11
6
7,42
3,93
1 -
47,8
12,6
62
46,6
99,8
24
23,2
38,2
28
111,
982
2,35
1,83
0
5,86
0,97
7
2,82
6,00
8
527,
382 -
650,
086
1,10
7,37
2
116,
878
3,87
6,33
1
183,
399,
832
Fu
nd
as
at
end
of
th
e Y
ear
31/1
2/20
19
4,09
9,59
4
42,5
15,9
54
4,19
0,01
3
10,3
20,3
00
164,
104
56,1
11,1
16
54,0
66,6
18
26,8
13,5
64
173,
296
2,54
9,19
3
4,88
9,65
8
3,17
9,68
1
897,
997
21,7
81
140,
686
1,13
1,71
8
199,
972
4,26
9,90
5
215,
735,
150
Inte
rest
Pay
able
To
Po
licy
Ho
lder
s
2018
314,
662
1,83
1,85
3
253,
827
653,
960 -
3,81
5,01
4
3,86
5,40
9
2,56
2,56
9
6,21
8
134,
770
381,
716
232,
562
41,8
03
-
52,6
02
48,6
43
9,53
9
86,3
09
14,2
91,4
56
Inte
rest
Pay
able
To
P
olic
y
Ho
lder
s 20
19
377,
324
3,61
1,05
0
417,
614
917,
682
8,96
2
5,07
6,53
5
4,72
2,72
2
2,87
4,83
8
14,0
63
119,
610
403,
829
262,
854
72,4
17
529
30,2
67
167,
983
19,9
60
495,
288
19,5
93,5
27
Su
rren
der
s
and
A
nn
uit
ies
Pai
d 2
018
463,
174
3,86
5,31
2
180,
032
497,
402 -
4,81
3,57
3
5,67
6,43
2
4,40
0,43
4
30,7
49
232,
715
2,31
5,74
6
196,
243
28,5
18.0
0 -
286,
543
543,
060
8,28
3.00
970,
936
24,5
09,1
52
Su
rren
der
s
and
An
nu
itie
s
Pai
d 2
019
384,
196
4,68
3,23
6
425,
951
594,
990 -
5,22
3,17
3
5,63
3,91
2
2,63
3,23
6
53,0
92
335,
844
1,62
9,60
3
243,
466
65,6
64
-
565,
299
309,
183
47,1
78
818,
224
23,6
46,2
47
Inte
rest
Rat
e
2018
10.2
5%
6.00
%
9.50
%
10.5
0%
9.00
%
8.00
%
11.7
5%
7.00
%
9.00
%
4% &
2%
10.0
0%
11.5
0% -
7.00
%
5.00
%
12.0
0%
6.00
%
8.83
%
Inte
rest
R
ate
2019
10.5
0%
10.0
0%
10.0
0%
11.2
5%
8.00
%
10.2
5%
10.0
0%
11.0
0%
10.0
0%
9.00
%
8.00
%
10.0
0%
11.0
0%
8.00
%
12.0
0%
11.0
0%
10.0
0%
9.00
%
9.94
%
Mar
ket
Sh
are-
2018
1.59
%
24.6
3%
2.95
%
4.92
%
-
24.7
8%
22.9
8%
10.7
6%
0.21
%
0.68
%
1.51
%
1.10
%
0.73
%
0.00
%
0.05
%
0.63
%
0.12
%
2.35
%
100.
00%
Pen
sio
ns
Co
ntr
ibu
tio
n
s 20
18 53
0,48
7
8,19
0,70
8
981,
143
1,63
4,86
9 -
8,24
2,54
7
7,64
2,30
1
3,57
8,78
8
71,1
79
225,
461
503,
298
365,
967
242,
662 -
17,9
78
210,
414
39,9
05
782,
945
33,2
60,6
52
Mar
ket
Sh
are
2019
1.65
%
25.5
0%
2.91
%
6.97
%
0.36
%
23.4
6%
22.4
2%
9.58
%
0.27
%
0.98
%
1.07
%
0.91
%
1.00
%
0.06
%
0.07
%
0.52
%
0.33
%
1.94
%
100.
00%
Pen
sio
ns
Co
ntr
ibu
tio
n
2019
609,
152
9,41
3,22
9
1,07
4,23
4
2,57
3,67
7
132,
377
8,66
0,74
5
8,27
7,93
3
3,53
5,19
4
100,
344
362,
589
395,
740
334,
285
369,
793
21,2
52
25,6
32
192,
425
121,
961
716,
510
36,9
17,0
72
Co
mp
any
AP
A L
ife
Brit
am L
ife
CIC
Life
GA
Life
Gem
inia
ICE
A L
ION
Life
Jubi
lee
Life
Ken
indi
a
Ken
ya O
rient
Life
Ken
yan
Alli
ance
Libe
rty
Life
Mad
ison
Life
Pio
neer
Life
Pru
dent
ial A
ssur
ance
Sah
am A
ssur
ance
San
lam
Life
The
Mon
arch
UA
P L
ife
To
tal

90
Deposit Administration Average Net Interest Rates Declared
Figure 47: Deposit Administration Average Net Interest Rates Declared, 2015-2019
Table 46: Average performance of other investments in the market, 2019
December 2019 Rate
NSE All Share Index 166.41 points
91-day T-Bill Rates 7.20%
Central Bank Rate 8.25%
Interbank Rate 5.45%
Average lending rate (commercial banks) 12.47%
Average deposit rate (commercial banks) 6.98%
Source: Capital Markets Authority quarterly statistical bulletin Q1, 2020
Central Bank of Kenya Website Statistics, https://www.centralbank.go.ke/bills-bonds/treasury-bills/
In 2019, the average net interest rate for deposit administration was 9.94% which was higher than the average interest rates for
91-day Treasury bill (7.20%), the Central Bank Rate (8.25%), average deposits rates for commercial banks (6.98%) and the
interbank rate (5.45%).
7.90%8.55%
9.50%8.83%
9.94%
0%
2%
4%
6%
8%
10%
12%
2015 2016 2017 2018 2019

91
Deposit Administration
In 2019 deposit administration fund size grew by 17.63% from 11.88% in 2018.
Table 47: Growth in Fund Size per Company, 2015-2019, in KES ’000’
Company Fund size Growth Rate
2019 2018 2017 2016 2015 2019 2018 2017 2016 2015
APA Life 4,099,594 3,497,314 3,115,339 2,601,453 2,247,114 17% 12% 20% 16% 15%
Britam Life 42,515,954 34,174,911 28,017,662 21,839,735 14,964,027 24% 22% 28% 46% 34%
CIC Life 4,190,013 3,124,116 2,113,915 1,279,674 756,097 34% 48% 65% 69%
GA Life 10,320,300 7,423,931 5,632,504 3,862,368 2,311,650 39% 32% 46% 67% 49%
Geminia 164,104
ICEA Lion Life 56,111,116 47,812,662 40,786,023 35,031,026 31,006,565 17% 15% 16% 13% 15%
Jubilee Life 54,066,618 46,699,824 41,262,186 35,101,532 30,162,584 16% 13% 18% 16% 14%
Kenindia 26,813,564 23,238,228 21,760,403 19,152,949 16,990,526 15% 7% 14% 13% 22%
Kenya Orient Life 173,296 111,982 65,333 6,065 - 55% 71% 977% 0% 0%
Kenyan Alliance 2,549,193 2,351,830 2,177,493 1,783,209 1,197,916 8% 8% 22% 49% 59%
Liberty Life 4,889,658 5,860,977 9,956,754 10,367,517 11,463,105 -17% -41% -4% -10% -5%
Madison Life 3,179,681 2,826,008 2,423,272 2,417,934 2,196,077 13% 17% 0% 10% -21%
Pioneer Life 897,997 527,382 272,667 145,366 77,908 70% 93% 88% 87% 66%
Saham Assurance 140,686 650,086 849,874 849,874 743,400 -78% -25% 0% 14% 11%
Sanlam Life 1,131,718 1,107,372 1,433,027 1,489,407 1,583,895 2% -23% -4% -6% -3%
The Monarch 199,972 116,878 75,717 64,620 59,111 71% 54% 17% 9% 24%
UAP Life Assurance 4,269,905 3,876,331 3,978,013 4,959,457 320,261 10% -3% -20% 1449% -91%
Total 215,735,150 183,399,832 163,920,182 140,952,186 116,080,236 17.53% 11.88% 16.29% 21.43% 12.07%
Table 48: Loss, expense, combined and operations ratio for Ordinary and Group Life
Ratio Loss Ratio Expense Ratio Combined Ratio Operations Ratio
Class 2019 2018 2019 2018 2019 2018 2019 2018
Ordinary Life 54.14% 38.87% 39.92% 41.84% 94.06% 80.71% 60.74% 58.65%
Group Life 68.29% 68.28% 37.60% 34.47% 105.89% 102.75% 23.47% 58.51%
Loss ratio
The increase in 2019 for the ordinary life ratio can be attributed to an increase in maturity of the life insurance terms therefore more
claims and benefits were paid in 2019 across the industry.
Expense ratio
The increase in the group life expense ratio indicates that expenses incurred relative to the premiums written were higher in the
year 2019 compared to 2018.
Combined ratio
The increased combined ratio for ordinary life is as a result of the rise in the loss ratio in 2019. This translates to a decrease in the
underwriting profit as insurers paid out more claims in 2019 as compared to 2018.
On the other hand, the increase in the ratio for group life can be attributed to a rise in both the loss and expense ratios which
indicates that generally the net claims and benefits paid were higher compared to the net premiums collected.
Operations ratio
The increase in operating ratio for ordinary life can be attributed to the increase in overall operating expenses relative to gross
written premiums for life insurance in 2019 as compared to 2018.

92
Table 49: Life Insurance Premium Contribution, Investment Income & Market Share, in KES ’000’
Inve
stm
ent
in
com
e
Oth
er
Inco
mes
730,
951
689,
260
8,76
3,13
3
101,
940
909,
355
123,
462
36,7
63
1,19
5,89
4
244,
490
10,8
89,0
74
9,15
8,68
8
4,21
3,66
5
70,8
37
148,
883
35,4
47
3,01
4,41
8
906,
651
185,
277
1,58
0,54
1
675,
127
208,
199
101,
901
2,85
2,20
9
38,9
67 -
1,67
9,14
1
48,5
54,2
73
To
tal
Co
mm
issi
on
s
& E
xpen
ses
435,
507
1,14
0,96
2
8,90
1,72
8
141,
681
1,88
3,66
3
163,
198
15,8
18
103,
340
267,
650
2,04
0,57
5
2,21
4,86
6
601,
511
235,
695
135,
459
136,
005
1,68
0,70
9
1,12
0,60
2
193,
981
1,29
3,37
3
1,10
1,52
8
660,
600
34,6
60
2,02
9,67
8
70,3
80
39,0
60
1,35
0,38
2
27,9
92,6
11
Op
erat
ing
+
Oth
er
Exp
ense
s
249,
680
583,
965
7,39
9,39
7
133,
519
1,48
4,98
7
102,
395
8,43
3
77,4
17
172,
293
1,29
6,33
4
1,24
7,57
8
447,
856
191,
042
109,
084
105,
045
1,24
4,06
9
805,
355
174,
988
949,
228
536,
188
499,
780
32,2
78
1,35
6,08
3
60,6
54
39,0
60
1,23
2,41
5
20,5
39,1
23
Co
mm
issi
on s
185,
827
556,
997
1,50
2,33
1
8,16
2
398,
676
60,8
03
7,38
5
25,9
23
95,3
57
744,
241
967,
288
153,
655
44,6
53
26,3
75
30,9
60
436,
640
315,
247
18,9
93
344,
145
565,
340
160,
820
2,38
2
673,
595
9,72
6 -
117,
967
7,45
3,48
8
Cla
ims+
Ben
efit
s+
Su
rren
der
s
706,
958
890,
294
9,79
4,55
5
272,
092
2,88
7,78
9
384,
364
13,7
61
939,
139
450,
640
8,69
1,50
3
10,2
14,2
29
4,96
1,50
1
328,
663
271,
899
210,
916
3,47
8,24
2
3,55
3,55
6
299,
308
1,11
6,24
7
2,70
7,91
9
249,
758
67,8
43
3,80
9,91
0
12,5
84
4,51
1
1,51
6,42
2
57,8
34,6
03
Net
Pre
miu
m
1,09
4,11
5
1,83
0,44
7
23,0
00,3
70
280,
586
5,12
1,60
4
289,
728
9,98
9
2,88
9,55
8
647,
331
12,7
57,3
20
13,5
39,8
92
5,57
8,73
7
663,
872
778,
807
323,
603
4,89
7,61
2
3,59
8,31
0
271,
235
1,97
0,73
3
3,65
8,54
6
582,
147
50,4
04
4,14
3,88
0
166,
706
3,52
4
1,40
7,37
1
89,5
56,4
27
Rei
nsu
ran
ce
418,
067
965,
694
254,
636
29,9
25
968,
313
4,59
1
83,2
47
34,4
61
481,
603
283,
581
593,
894
33,4
35
34,0
68
87,9
11
126,
028
205,
070
84,7
08
69,8
10
192,
407
1,82
0,93
9
56,0
99
7,83
0
435,
837
26,5
62
5,03
7
295,
664
7,59
9,41
7
Mar
ket
shar
e (%
)
1.55
%
2.86
%
23.7
7%
0.32
%
6.22
%
0.30
%
0.10
%
2.
99%
1.15
%
13
.33%
14.4
4%
5.
74%
0.71
%
0.
89%
0.46
%
5.
21%
3.76
%
0.
35%
2.21
%
5.
60%
0.65
%
0.06
%
4.68
%
0.20
%
0.01
%
2.45
%
100.
00%
2.86
%
23.7
7%
0.32
%
6.22
%
0.30
%
0.10
%
2.99
%
1.15
%
13.3
3%
14.4
4%
5.74
%
0.71
%
0.89
%
0.46
%
5.21
%
3.76
%
0.35
%
2.21
%
5.60
%
0.65
%
0.06
%
4.68
%
0.20
%
0.01
%
2.45
%
100.
00%
Gro
ss
Pre
miu
ms+
Pre
miu
m
Co
ntr
ibu
tio
ns
1,51
2,18
2
2,79
6,14
1
23,2
55,0
06
310,
511
6,08
9,91
7
294,
319
93,2
36
2,92
4,01
9
1,12
8,93
4
13,0
40,9
01
14,1
33,7
86
5,61
2,17
2
697,
940
866,
718
449,
631
5,10
2,68
2
3,68
3,01
8
341,
045
2,16
3,14
0
5,47
9,48
5
638,
246
58,2
34
4,57
9,71
7
193,
268
8,56
1
2,39
9,63
0
97,8
52,4
39
Inve
stm
ent/
U
nit
Lin
ked
Co
ntr
ibu
tio ns
-554
0 - - -
17,7
90 - - - -
28,2
79 - - -
200,
133 -
1,16
8,86
0
7,68
6
72,7
33
853,
381
81,3
79 - -
655,
146 - -
27,2
01
3,10
7,04
8
Pen
sio
ns
609,
152 -
9,41
3,22
9 -
1,07
4,23
4 - -
2,57
3,67
7
132,
377
8,66
0,74
5
8,27
7,93
3
3,53
5,19
4
100,
344
362,
589 -
395,
740
334,
285 - -
369,
793
21,2
52
25,6
32
192,
425
121,
961 -
716,
510
36,9
17,0
72
Gro
up
Lif
e
759,
906
2,13
3,69
6
2,03
9,14
0
174,
456
3,55
9,77
0
14,0
44
93,2
36
37,0
12
940,
474
1,04
9,19
8
2,17
0,31
7
462,
770
549,
930
251,
021
449,
631
1,11
5,52
0
1,88
9,42
0
172,
312
328,
287
4,05
9,40
2
365,
504
2,95
3
1,66
9,02
5
47,1
85
8,56
1
767,
219
25,1
09,9
89
Ord
inar
y
Lif
e
148,
664
662,
445
11,8
02,6
37
136,
055
1,43
8,12
3
280,
275 -
313,
330
56,0
83
3,30
2,67
9
3,68
5,53
6
1,61
4,20
8
47,6
66
52,9
75 -
2,42
2,56
2
1,45
1,62
7
96,0
00
981,
472
968,
911
251,
490
29,6
49
2063
121
24,1
22 -
888,
700
32,7
18,3
30
Co
mp
any
AP
A L
ife
Bar
clay
s Li
fe
Brit
am L
ife
Cap
ex L
ife
CIC
Life
Cor
pora
te
Firs
t Ass
uran
ce
GA
Life
Gem
inia
ICE
A L
ION
Life
Jubi
lee
Life
I
Ken
indi
a
Ken
ya O
rient
Life
Ken
yan
Alli
ance
KU
SC
O M
utua
l Ass
uran
ce
Libe
rty
Life
Mad
ison
Life
Met
ropo
litan
Can
non
Life
Old
Mut
ual L
ife
Pio
neer
Life
Pru
dent
ial L
ife
Sah
am A
ssur
ance
San
lam
Life
The
Mon
arch
Tak
aful
UA
P L
ife
To
tals

93
Claims and Benefits
Life insurance claims and benefits have been slowly increasing over the last five years from KES 34.23 billion in 2015 to KES
53.35 billion in 2019.Ordinary life claims contributed 32.97%, group life 22.70% while pensions contributed the biggest share of
44.33%. Ordinary life claims increased by 10.70% in 2019 compared to 2018. Group life claims decreased by 1.62% compared to
2018 while pensions claims decreased by 9.08%.
Table 50: Claims and Benefits Paid, 2015-2019, in KES ’000’
Class
2015 2016 2017 2018 2019
Gross Claims Paid
% Share
Gross Claims Paid
% Share Gross Claims
Paid % Share
Gross Claims
Paid % Share
Gross Claims
Paid % Share
Ordinary Life 9,706,756 28.36% 11,330,787 28.62% 10,600,782 24.70% 10,221,060 22.27% 17,588,954 32.97%
Group Life 10,715,136 31.30% 10,500,798 26.53% 11,554,533 26.92% 11,163,494 24.32% 12,110,006 22.70%
Pensions 13,808,641 40.34% 17,754,842 44.85% 20,770,872 48.39% 24,509,152 53.40% 23,646,247 44.33%
Total 34,230,533 100% 39,586,427 100.00% 42,926,187 100.00% 45,893,705 100.00% 53,345,207 100.00%
Figure 48: Claims and Benefits Paid, 2015-2019, in KES Billions
Total claims and benefits paid on average increased by 9.83% from 2015 to 2019.
34.23
39.59 42.93
45.89
53.35
2015 2016 2017 2018 2019

94
Expenses
Total expenses for ordinary and group life increased by 8.55% over the five (5) year period, 2015 to 2019.
Figure 49: Total Expenses for Ordinary and Group Life, 2015-2019, in KES ’000’
Commissions Table 51: Total Commissions for Ordinary and Group Life Business per Co, in KES ’000’
Company Commission Ordinary Life
Commission Group Life
Total Commissions 2019
Total Commissions 2018
APA Life 66,856 107,784 174,640 164,863
Absa Life 130,282 426,714 556,996 471,948
Britam Life 1,311,546 128,404 1,439,950 1,470,972
Capex 1,632 6,529 8,161 28,940
CIC Life Assurance 120,685 27,380 148,065 403,280
Corporate 60,803 0 60,803 68,891
First Assurance 0 7,385 7,385 8,497
GA Life 6,266 18,262 24,528 1,889
Geminia 7,133 88,224 95,357 66,173
ICEA Lion Life 594,756 34,404 629,160 526,880
Jubilee Life 688,290 204,038 892,328 766,186
Kenindia 100,187 12,302 112,489 97,156
Kenya Orient Life 9,214 35,439 44,653 37,886
Kenyan Alliance 12,180 15,414 27,594 38,145
KUSSCO Mutual 0 30,959 30,959
Liberty Life 195,449 150,415 345,864 342,149
Madison Life 246,657 67,681 314,338 197,609
Metropolitan Cannon Life 1,141 17,852 18,993 29,551
Old Mutual Life 306,192 27,228 333,420 223,248
Pioneer Life 283,866 281,472 565,338 425,361
Prudential Life Assurance 59,775 41,660 101,435 108,894
Saham Assurance 2,074 307 3,766
Sanlam Life 267,242 83,771 351,013 308,255
The Monarch 3,520 5,545 9,065 5,832
UAP Life Assurance 47,336 7,224 54,560 31,183
Total 4,523,082 1,826,393 6,349,475 5,289,980
14,955,231
16,734,907 16,080,084 16,638,347
19,636,459
2015 2016 2017 2018 2019
Total expense in 2019 was
19.64 billion; a sharp
increase of 18.03% from
3.48% recorded in 2018.

95
Group and Ordinary Life Total Commissions
Total commissions paid/due in 2019 was KES 6.35 billion compared to KES 5.29 billion paid in 2018, an increase of 20.03%. Ordinary life commissions increased by 12.62% in 2019 compared to 2018, while group life commissions increased by 43.40% in 2019 compared to 2018. Figure 50: Group and Ordinary Life Total Commissions Paid/due, in KES ‘000’
174,
640
556,
996
1,43
9,95
0
8,16
1
148,
065
60,8
03
7,38
5
24,5
28
95,3
57
629,
160
892,
328
112,
489
44,6
53
27,5
94
30,9
59
345,
864
314,
338
18,9
93
333,
420
565,
338
101,
435
351,
013
9,06
5
54,5
60
-
200,000
400,000
600,000
800,000
1,000,000
1,200,000
1,400,000
1,600,000
AP
A L
ife
Abs
a Li
fe
Brit
am L
ife
Cap
ex
CIC
Life
Ass
uran
ce
Cor
pora
te
Firs
t Ass
uran
ce
GA
Life
Gem
inia
ICE
A L
ion
Life
Jubi
lee
Life
Ken
indi
a
Ken
ya O
rient
Life
Ken
yan
Alli
ance
KU
SS
CO
Mut
ual
Libe
rty
Life
Mad
ison
Life
Met
ropo
litan
Can
non
Life
Old
Mut
ual L
ife
Pio
neer
Ass
uran
ce
Pru
dent
ial L
ife A
ssur
ance
San
lam
Life
The
Mon
arch
UA
P L
ife A
ssur
ance
The total commissions
paid in 2019 were KES
6.35 billion where
ordinary contributed to
71% and group life
contributed 29%.
di

96
Micro Insurance Micro insurance was introduced in 2013 and its uptake remains very low with only 8 companies underwriting it as at 2019 with a gross written premium of KES 1.39 billion. Total claims paid and outstanding amounted to KES 0.68 billion and the overall loss ratio was 48.83%.
Figure 51: Micro Insurance GWP Trend Analysis
Figure 52: Micro Insurance Premium and Claims per Company, 2019 in KES
1,55
9,36
0,86
9
1,38
1,45
8,00
1
1,59
1,79
6,23
6
1,64
2,86
7,11
5
1,39
0,83
9,03
9 2015 2016 2017 2018 2019
-
100,000,000
200,000,000
300,000,000
400,000,000
500,000,000
600,000,000
700,000,000
800,000,000
900,000,000
AAR APA Britam CIC Jubilee Kenya Orient Madison UAP OldMutual
PREMIUMS
CLAIMS

97
Micro Insurance Premiums, Claims and Loss Ratios
Below is a summary of premiums, claims and loss ratios per company.
Company Premiums Claims Loss Ratios
AAR 4,800,683 1,541,986 32.12%
APA 270,003,000 98,218,000 36.38%
Britam 813,832,000 424,506,000 52.16%
CIC 8,076,000 11,117,000 137.65%
Jubilee 48,462,748 20,586,256 42.48%
Kenya Orient 7,668,653 2,006,475 26.16%
Madison 178,587,855 17,452,161 9.77%
UAP Old Mutual 59,408,100 103,718,806 174.59%
TOTAL 1,390,839,039 679,146,684 48.83%
In 2019, gross written premiums was KES 1.39 billion compared to KES 1.64 billion in 2018, a decline of 15.34%. Total claims incurred was KES 0.68 billion in 2019 compared to KES 1.11 billion in 2018, a decrease of 38.66%. The overall loss ratio was 48.83% in 2019 compared to 67.39% in 2018.

98
6. Appendixes

99
Appendix I: Detailed Industry Statement of Comprehensive Income, 2019 in KES ‘000
To
tal 2
01
8
4,3
07
,60
6
83
7,2
84
24
9,9
56
1,7
10
,08
3
6,4
98
,95
6
46
6,9
99
1,0
91
,41
0
6,7
01
,15
4
11
,60
5,3
90
31
5,2
57
9,1
36
,87
4
4,1
61
,37
9
53
0,6
03
3,0
11
,16
8
1,7
38
,99
0
2,0
55
,79
7
3,0
72
,67
3
3,3
89
3,5
99
,51
4
3,1
46
,20
4
3,0
36
,03
3
3,5
53
,28
9
1,0
35
,53
7
1,5
47
,12
3
2,8
68
,23
2
4,6
35
,01
6
4,5
53
,64
5
3,3
76
,31
3
1,5
12
,76
9
48
7,8
13
1,1
67
,83
8
0
2,6
01
,34
0
4,0
00
,68
0
2,9
53
,29
8
1,4
06
,31
6
90
4,6
78
17
3,0
31
33
3,2
38
1,9
93
,33
6
94
9,1
88
97
6,5
21
31
9,5
10
3,2
26
,07
4
37
4,1
41
2,6
99
,34
0
1,0
69
,65
1
1,4
35
,30
7
3,9
36
,50
1
55
4,2
68
80
1,8
00
1,1
53
,72
8
51
2,3
72
8,1
40
,78
2
1,1
66
,48
1
1,1
13
,58
2
13
4,8
09
,45
7
Ge
ne
ral
4,3
07
,60
6
83
7,2
84
24
9,9
56
1,7
10
,08
3
6,4
98
,95
6
- -
6,7
01
,15
4
- -
9,1
36
,87
4
-
26
2,3
65
3,0
11
,16
8
1,7
38
,99
0
2,0
35
,28
1
3,0
72
,67
3
-
3,3
88
,43
4
3,1
46
,20
4
3,0
36
,03
3
-
1,0
35
,53
7
1,5
47
,12
3
2,8
68
,23
2
4,6
35
,01
6
-
1,9
25
,47
8
1,5
12
,76
9
-
1,0
24
,56
8
- -
4,0
00
,68
0
-
1,4
06
,31
6
90
4,6
78
-
33
3,2
38
1,9
93
,33
6
-
97
6,5
21
31
9,5
10
- -
2,6
99
,34
0
1,0
36
,67
8
1,4
35
,30
7
-
55
4,2
68
80
1,8
00
1,1
17
,54
6
51
2,3
72
8,1
40
,78
2
-
1,1
13
,58
2
91
,02
7,7
38
Lif
e
- - - - -
46
6,9
99
1,0
91
,41
0
-
11
,60
5,3
90
31
5,2
57
-
4,1
61
,37
9
26
8,2
38
- -
20
,51
6
-
3,3
89
21
1,0
80
- -
3,5
53
,28
9
- - - -
4,5
53
,64
5
1,4
50
,83
5
-
48
7,8
13
14
3,2
70
-
2,6
01
,34
0
-
2,9
53
,29
8
- -
17
3,0
31
- -
94
9,1
88
- -
3,2
26
,07
4
37
4,1
41
-
32
,97
3
-
3,9
36
,50
1
- -
36
,18
2
- -
1,1
66
,48
1
-
43
,78
1,7
19
To
tal 2
01
9
3,1
33
,97
1
92
2,0
39
40
4,1
27
1,3
40
,19
4
6,7
82
,94
9
49
0,5
03
1,4
10
,01
8
6,4
25
,43
9
13
,58
7,1
41
28
0,5
86
9,0
00
,51
0
4,0
29
,58
0
62
4,1
47
3,1
90
,57
5
1,8
05
,33
7
2,2
27
,76
3
3,3
91
,22
3
3,4
79
4,8
55
,70
3
3,4
06
,25
1
2,8
40
,98
1
4,0
68
,29
6
1,0
61
,75
2
1,2
39
,44
8
2,8
47
,75
7
5,2
60
,31
1
5,2
61
,95
9
3,3
78
,47
1
1,1
21
,21
3
56
3,5
29
1,4
05
,52
7
32
3,6
04
2,6
23
,14
6
4,1
19
,57
5
3,2
56
,33
9
1,7
22
,74
0
80
9,3
43
18
3,9
46
44
9,6
99
2,0
96
,87
1
1,1
17
,35
2
1,1
06
,82
9
63
2,8
21
3,2
07
,37
5
56
0,8
96
2,2
64
,80
0
1,1
26
,96
8
1,6
95
,09
0
3,9
51
,45
6
69
9,9
04
84
0,6
67
1,2
65
,33
1
52
2,2
50
8,2
96
,67
5
1,4
07
,37
1
1,2
62
,40
9
14
1,9
04
,23
6
Ge
ne
ral
3,1
33
,97
1
92
2,0
39
40
4,1
27
1,3
40
,19
4
6,7
82
,94
9
- -
6,4
25
,43
9
- -
9,0
00
,51
0
-
33
4,4
19
3,1
90
,57
5
1,8
05
,33
7
2,2
17
,77
4
3,3
91
,22
3
-
4,3
40
,74
9
3,4
06
,25
1
2,8
40
,98
1
-
1,0
61
,75
2
1,2
39
,44
8
2,8
47
,75
7
5,2
60
,31
1
-
1,7
47
,41
5
1,1
21
,21
3
-
1,2
52
,40
9
- -
4,1
19
,57
5
-
1,7
22
,74
0
80
9,3
43
-
44
9,6
99
2,0
96
,87
1
-
1,1
06
,82
9
63
2,8
21
- -
2,2
64
,80
0
1,1
02
,19
6
1,6
95
,09
0
-
69
9,9
04
84
0,6
67
1,2
20
,58
6
52
2,2
50
8,2
96
,67
5
-
1,2
62
,40
9
92
,90
9,2
98
Lif
e
- - - - -
49
0,5
03
1,4
10
,01
8
-
13
,58
7,1
41
28
0,5
86
-
4,0
29
,58
0
28
9,7
28
- -
9,9
89
-
3,4
79
51
4,9
54
- -
4,0
68
,29
6
- - - -
5,2
61
,95
9
1,6
31
,05
6
-
56
3,5
29
15
3,1
18
32
3,6
04
2,6
23
,14
6
-
3,2
56
,33
9
- -
18
3,9
46
- -
1,1
17
,35
2
- -
3,2
07
,37
5
56
0,8
96
-
24
,77
2
-
3,9
51
,45
6
- -
44
,74
5
- -
1,4
07
,37
1
-
48
,99
4,9
38
To
tal 2
01
8
1,2
51
,79
6
2,7
92
,73
7
32
4,9
10
56
9,9
70
2,7
15
,29
2
49
5,8
13
68
5,3
32
1,4
89
,70
8
22
8,0
15
18
,65
5
1,5
34
,14
4
93
1,7
56
31
,82
7
93
,78
0
61
5,6
66
1,6
95
,97
9
2,9
69
,88
3
33
,62
5
95
3,0
22
2,3
82
,05
2
2,5
94
,02
3
28
0,8
67
17
8,1
50
49
,87
2
1,5
21
,73
2
1,9
80
,94
6
45
7,3
03
1,0
36
,49
7
20
5,6
64
38
,86
4
29
0,3
92
-
19
2,9
52
26
2,6
36
55
,53
4
1,4
56
,92
2
21
3,4
57
57
,36
3
33
2,2
73
64
0,6
12
22
0,1
94
33
3,0
93
13
6,0
17
2,0
01
,81
5
26
,73
3
3,0
02
,39
0
1,1
93
,61
3
59
9,5
90
37
4,4
27
42
2,5
30
35
6,8
66
10
1,4
11
11
3,5
05
1,1
41
,37
9
27
3,1
87
36
,51
7
43
,99
3,2
88
Ge
ne
ral
1,2
51
,79
6
2,7
92
,73
7
32
4,9
10
56
9,9
70
2,7
15
,29
2
- -
1,4
89
,70
8
- -
1,5
34
,14
4
-
29
,42
3
93
,78
0
61
5,6
66
1,6
07
,30
6
2,9
69
,88
3
-
59
1,9
90
2,3
82
,05
2
2,5
94
,02
3
-
17
8,1
50
49
,87
2
1,5
21
,73
2
1,9
80
,94
6
99
1,4
18
20
5,6
64
-
20
0,8
94
- -
26
2,6
36
-
1,4
56
,92
2
21
3,4
57
-
33
2,2
73
64
0,6
12
-
33
3,0
93
13
6,0
17
- -
3,0
02
,39
0
1,1
82
,99
6
59
9,5
90
-
42
2,5
30
35
6,8
66
63
,49
1
11
3,5
05
1,1
41
,37
9
-
36
,51
7
36
,98
5,6
30
Lif
e
- - - - -
49
5,8
13
68
5,3
32
-
22
8,0
15
18
,65
5
-
93
1,7
56
2,4
04
- -
88
,67
3
-
33
,62
5
36
1,0
32
- -
28
0,8
67
- -
45
7,3
03
45
,07
9
-
38
,86
4
89
,49
8
-
19
2,9
52
-
55
,53
4
- -
57
,36
3
- -
22
0,1
94
- -
2,0
01
,81
5
26
,73
3
-
10
,61
7
-
37
4,4
27
- -
37
,92
0
- -
27
3,1
87
-
7,0
07
,65
8
To
tal 2
01
9
2,5
45
,91
9
2,6
93
,82
6
44
5,5
38
32
4,4
46
2,6
86
,01
8
41
8,0
67
96
5,6
94
1,6
15
,49
8
25
4,6
36
29
,92
5
1,4
65
,44
6
96
8,3
13
71
,84
4
10
6,8
20
66
1,2
12
1,5
71
,19
5
3,2
14
,63
7
34
,46
1
1,2
96
,83
0
2,1
79
,66
1
2,8
37
,23
6
28
3,5
81
15
5,0
16
12
8,8
79
1,3
70
,81
1
2,2
52
,84
8
59
3,8
94
94
6,5
23
22
7,2
50
34
,06
8
23
5,1
37
12
6,0
28
20
5,0
70
41
6,0
38
84
,70
8
1,2
62
,07
8
13
4,0
19
69
,81
0
31
8,8
70
72
5,7
38
19
2,4
07
27
6,2
23
16
7,0
64
1,8
20
,93
9
56
,09
9
3,0
92
,82
5
1,2
66
,30
1
90
9,2
05
43
5,8
37
49
0,5
38
36
3,4
55
10
2,7
22
41
,96
3
1,1
77
,59
2
29
5,6
64
32
,12
7
46
,67
8,5
49
Ge
ne
ral
2,5
45
,91
9
2,6
93
,82
6
44
5,5
38
32
4,4
46
2,6
86
,01
8
-
1,6
15
,49
8
1,4
65
,44
6
67
,25
3
10
6,8
20
66
1,2
12
1,4
87
,94
8
3,2
14
,63
7
81
5,2
27
2,1
79
,66
1
2,8
37
,23
6
15
5,0
16
12
8,8
79
1,3
70
,81
1
2,2
52
,84
8
91
3,0
88
22
7,2
50
14
7,2
26
-
41
6,0
38
1,2
62
,07
8
13
4,0
19
-
31
8,8
70
72
5,7
38
27
6,2
23
16
7,0
64
-
3,0
92
,82
5
1,2
58
,47
1
90
9,2
05
49
0,5
38
36
3,4
55
76
,16
0
41
,96
3
1,1
77
,59
2
32
,12
7
39
,08
4,1
69
Lif
e
41
8,0
67
96
5,6
94
25
4,6
36
29
,92
5
96
8,3
13
4,5
91
83
,24
7
34
,46
1
48
1,6
03
28
3,5
81
59
3,8
94
33
,43
5
34
,06
8
87
,91
1
12
6,0
28
20
5,0
70
84
,70
8
69
,81
0
19
2,4
07
1,8
20
,93
9
56
,09
9
7,8
30
43
5,8
37
26
,56
2
29
5,6
64
7,5
94
,38
0
To
tal 2
01
8
5,5
59
,40
2
3,6
30
,02
1
57
4,8
66
2,2
80
,05
3
9,2
14
,24
8
96
2,8
12
1,7
76
,74
2
8,1
90
,86
2
11
,83
3,4
05
33
3,9
13
10
,67
1,0
18
5,0
93
,13
5
56
2,4
30
3,1
04
,94
8
2,3
54
,65
6
3,7
51
,77
6
6,0
42
,55
6
37
,01
4
4,5
52
,53
6
5,5
28
,25
6
5,6
30
,05
6
3,8
34
,15
6
1,2
13
,68
7
1,5
96
,99
5
4,3
89
,96
4
6,6
15
,96
2
5,0
10
,94
8
4,4
12
,81
0
1,7
18
,43
3
52
6,6
77
1,4
58
,23
0
-
2,7
94
,29
2
4,2
63
,31
6
3,0
08
,83
2
2,8
63
,23
8
1,1
18
,13
5
23
0,3
94
66
5,5
11
2,6
33
,94
8
1,1
69
,38
2
1,3
09
,61
4
45
5,5
27
5,2
27
,88
9
40
0,8
74
5,7
01
,73
0
2,2
63
,26
4
2,0
34
,89
7
4,3
10
,92
8
97
6,7
98
1,1
58
,66
6
1,2
55
,13
9
62
5,8
77
9,2
82
,16
1
1,4
39
,66
8
1,1
50
,09
9
17
8,8
02
,74
6
Ge
ne
ral
5,5
59
,40
2
3,6
30
,02
1
57
4,8
66
2,2
80
,05
3
9,2
14
,24
8
- -
8,1
90
,86
2
- -
10
,67
1,0
18
-
29
1,7
88
3,1
04
,94
8
2,3
54
,65
6
3,6
42
,58
7
6,0
42
,55
6
-
3,9
80
,42
4
5,5
28
,25
6
5,6
30
,05
6
-
1,2
13
,68
7
1,5
96
,99
5
4,3
89
,96
4
6,6
15
,96
2
2,9
16
,89
6
1,7
18
,43
3
-
1,2
25
,46
2
- -
4,2
63
,31
6
-
2,8
63
,23
8
1,1
18
,13
5
-
66
5,5
11
2,6
33
,94
8
-
1,3
09
,61
4
45
5,5
27
- -
5,7
01
,73
0
2,2
19
,67
4
2,0
34
,89
7
-
97
6,7
98
1,1
58
,66
6
1,1
81
,03
7
62
5,8
77
9,2
82
,16
1
-
1,1
50
,09
9
12
8,0
13
,36
8
Lif
e
- - - - -
96
2,8
12
1,7
76
,74
2
-
11
,83
3,4
05
33
3,9
13
-
5,0
93
,13
5
27
0,6
42
- -
10
9,1
89
-
37
,01
4
57
2,1
12
- -
3,8
34
,15
6
- -
5,0
10
,94
8
1,4
95
,91
4
-
52
6,6
77
23
2,7
68
-
2,7
94
,29
2
-
3,0
08
,83
2
- -
23
0,3
94
- -
1,1
69
,38
2
- -
5,2
27
,88
9
40
0,8
74
-
43
,59
0
-
4,3
10
,92
8
- -
74
,10
2
- -
1,4
39
,66
8
-
50
,78
9,3
78
To
tal 2
01
9
5,6
79
,89
0
3,6
15
,86
5
84
9,6
65
1,6
64
,64
0
9,4
68
,96
7
90
8,5
70
2,3
75
,71
2
8,0
40
,93
7
13
,84
1,7
77
31
0,5
11
10
,46
5,9
56
4,9
97
,89
3
69
5,9
91
3,2
97
,39
5
2,4
66
,54
9
3,7
98
,95
8
6,6
05
,86
0
37
,94
0
6,1
52
,53
3
5,5
85
,91
2
5,6
78
,21
7
4,3
51
,87
7
1,2
16
,76
8
1,3
68
,32
7
4,2
18
,56
8
7,5
13
,15
9
5,8
55
,85
3
4,3
24
,99
4
1,3
48
,46
3
59
7,5
97
1,6
40
,66
4
44
9,6
32
2,8
28
,21
6
4,5
35
,61
3
3,3
41
,04
7
2,9
84
,81
8
94
3,3
62
25
3,7
56
76
8,5
69
2,8
22
,60
9
1,3
09
,75
9
1,3
83
,05
2
79
9,8
85
5,0
28
,31
4
61
6,9
95
5,3
57
,62
5
2,3
93
,26
9
2,6
04
,29
5
4,3
87
,29
3
1,1
90
,44
2
1,2
04
,12
2
1,3
68
,05
3
56
4,2
13
9,4
74
,26
7
1,7
03
,03
5
1,2
94
,53
6
18
8,5
82
,78
5
Ge
ne
ral
5,6
79
,89
0
3,6
15
,86
5
84
9,6
65
1,6
64
,64
0
9,4
68
,96
7
8,0
40
,93
7
10
,46
5,9
56
40
1,6
72
3,2
97
,39
5
2,4
66
,54
9
3,7
05
,72
2
6,6
05
,86
0
5,1
55
,97
6
5,5
85
,91
2
5,6
78
,21
7
1,2
16
,76
8
1,3
68
,32
7
4,2
18
,56
8
7,5
13
,15
9
2,6
60
,50
3
1,3
48
,46
3
1,3
99
,63
5
-
4,5
35
,61
3
2,9
84
,81
8
94
3,3
62
0
76
8,5
69
2,8
22
,60
9
1,3
83
,05
2
79
9,8
85
5,3
57
,62
5
2,3
60
,66
7
2,6
04
,29
5
1,1
90
,44
2
1,2
04
,12
2
1,2
96
,74
6
56
4,2
13
9,4
74
,26
7
1,2
94
,53
6
13
1,9
93
,46
7
Lif
e
90
8,5
70
2,3
75
,71
2
13
,84
1,7
77
31
0,5
11
4,9
97
,89
3
29
4,3
19
93
,23
6
37
,94
0
99
6,5
57
4,3
51
,87
7
5,8
55
,85
3
1,6
64
,49
1
59
7,5
97
24
1,0
29
44
9,6
32
2,8
28
,21
6
3,3
41
,04
7
25
3,7
56
1,3
09
,75
9
5,0
28
,31
4
61
6,9
95
32
,60
2
4,3
87
,29
3
71
,30
7
1,7
03
,03
5
56
,58
9,3
18
Co
mp
an
ies
AA
R
AIG
Alli
an
z
Am
aco
AP
A In
su
ran
ce
AP
A L
ife
Ba
rcla
ys L
ife
Bri
tam
Ge
ne
ral
Bri
tam
Life
Ca
pe
x L
ife
CIC
Ge
ne
ral
CIC
Life
Co
rpo
rate
Dir
ectli
ne
Fid
elit
y S
hie
ld
Fir
st A
ssu
ran
ce
GA
In
su
ran
ce
GA
Life
Ge
min
ia
He
rita
ge
ICE
A L
ION
Ge
ne
ral
ICE
A L
ION
Life
Intr
a A
fric
a
Inve
sco
Ju
bile
e G
en
era
l
Ju
bile
e H
ea
lth
Ju
bile
e L
ife
Ke
nin
dia
Ke
nya
Ori
en
t G
en
era
l
Ke
nya
Ori
en
t L
ife
Ke
nya
n A
llia
nce
KU
SC
O M
utu
al A
ssu
ran
ce
Lib
ert
y L
ife
Ma
dis
on
Ge
ne
ral
Ma
dis
on
Life
Ma
yfa
ir
Me
tro
po
lita
n C
an
no
n G
en
era
l
Me
tro
po
lita
n C
an
no
n L
ife
MU
A (
Fo
rme
ly P
ho
en
ix o
f E
.A.)
Occid
en
tal
Old
Mu
tua
l Life
Pa
cis
Pio
ne
er
Ge
ne
ral
Pio
ne
er
Life
Pru
de
ntia
l Life
Re
so
lutio
n
Sa
ha
m
Sa
nla
m G
en
era
l
Sa
nla
m L
ife
Ta
ka
ful
Ta
usi
Th
e M
on
arc
h
Tri
de
nt
UA
P G
en
era
l
UA
P L
ife
Xp
lico
TO
TA
L
Gro
ss
Pre
miu
m E
arn
ed
R
ein
su
ran
ce
Pre
miu
m C
ed
ed
& O
the
r A
dju
stm
en
ts
Ne
t E
arn
ed
Pre
miu
m

100
To
tal 2
01
8
3
,30
4,5
47
41
0,6
90
16
4,2
83
85
7,0
95
4
,30
7,0
12
62
6,0
56
64
2,6
13
4
,03
7,5
68
9
,07
1,9
38
23
7,5
34
6
,02
3,4
59
2
,94
0,9
11
46
7,4
74
1
,97
3,2
00
1
,09
6,2
18
1
,52
1,2
83
1
,75
7,9
71
65
5,4
48
2
,34
5,2
43
1
,67
3,6
85
1
,64
2,0
77
1
0,1
00
,71
8
52
7,3
34
88
3,5
11
1
,76
4,3
94
3
,11
9,8
17
8
,11
4,7
15
5
,83
6,6
55
1
,22
9,2
24
30
4,0
74
84
9,7
76
-
2
,30
2,0
53
3
,15
8,2
70
3
,87
9,4
27
71
7,8
53
53
9,0
13
25
3,7
42
15
0,9
24
1
,22
4,3
17
90
8,2
01
40
3,7
84
19
9,6
33
2
,40
4,4
26
23
4,4
05
1
,91
6,2
71
65
0,7
23
73
3,1
39
4
,39
1,0
43
26
8,7
10
21
9,1
25
63
2,4
87
36
1,8
16
5
,39
6,1
51
98
7,2
33
58
9,2
84
11
1,0
08
,55
3
Ge
ne
ral
3
,30
4,5
47
41
0,6
90
16
4,2
83
85
7,0
95
4
,30
7,0
12
-
-
4
,03
7,5
68
-
-
6
,02
3,4
59
-
19
9,1
48
1
,97
3,2
00
1
,09
6,2
18
1
,49
6,9
47
1
,75
7,9
71
-
2
,07
5,9
70
1
,67
3,6
85
1
,64
2,0
77
-
52
7,3
34
88
3,5
11
1
,76
4,3
94
3
,11
9,8
17
1
,36
4,8
37
1
,22
9,2
24
-
53
9,9
60
-
-
3
,15
8,2
70
-
71
7,8
53
53
9,0
13
-
15
0,9
24
1
,22
4,3
17
-
40
3,7
84
19
9,6
33
-
-
1
,91
6,2
71
54
9,4
12
73
3,1
39
-
26
8,7
10
21
9,1
25
56
7,2
91
36
1,8
16
5
,39
6,1
51
-
58
9,2
84
57
,44
3,9
40
Life
-
-
-
-
-
62
6,0
56
64
2,6
13
-
9
,07
1,9
38
23
7,5
34
-
2
,94
0,9
11
26
8,3
26
-
-
24
,33
6
-
65
5,4
48
26
9,2
73
-
-
10
,10
0,7
18
-
-
8
,11
4,7
15
4
,47
1,8
18
-
30
4,0
74
30
9,8
16
-
2
,30
2,0
53
-
3
,87
9,4
27
-
-
25
3,7
42
-
-
90
8,2
01
-
-
2
,40
4,4
26
23
4,4
05
-
10
1,3
11
-
4
,39
1,0
43
-
-
65
,19
6
-
-
98
7,2
33
-
53
,56
4,6
13
To
tal 2
01
9
1
,68
2,8
18
48
2,5
53
21
9,1
21
73
5,1
25
4
,74
8,1
94
70
6,9
58
89
0,2
94
4
,29
8,5
63
9
,79
4,5
55
27
2,0
92
6
,47
2,1
00
2
,88
7,7
89
61
5,6
14
2
,28
8,4
87
1
,31
5,6
19
1
,29
5,8
94
1
,76
0,9
33
93
9,1
39
3
,09
7,4
57
1
,47
5,5
75
1
,25
5,3
84
8
,69
1,5
03
58
5,2
74
53
3,6
14
2
,49
5,9
99
3
,70
1,4
00
1
0,2
14
,22
9
6
,66
1,6
93
62
0,6
03
32
8,6
63
73
3,2
93
21
0,9
16
3
,47
8,2
42
3
,06
0,1
41
3
,55
3,5
56
94
1,1
77
53
7,1
83
29
9,3
08
19
6,7
21
1
,32
7,6
22
1
,11
6,2
47
77
9,8
79
35
8,1
03
2
,70
7,9
19
24
9,7
58
1
,76
8,1
99
71
1,1
65
1
,02
6,5
13
3
,80
9,9
10
33
9,9
97
30
0,1
04
63
6,8
17
37
5,8
58
5
,54
8,6
99
1
,51
6,4
22
65
1,7
85
11
7,3
02
,77
6
Ge
ne
ral
1
,68
2,8
18
48
2,5
53
21
9,1
21
73
5,1
25
4
,74
8,1
94
4
,29
8,5
63
6
,47
2,1
00
23
1,2
50
2
,28
8,4
87
1
,31
5,6
19
1
,28
2,1
33
1
,76
0,9
33
2
,64
6,8
17
1
,47
5,5
75
1
,25
5,3
84
58
5,2
74
53
3,6
14
2
,49
5,9
99
3
,70
1,4
00
1
,70
0,1
92
62
0,6
03
46
1,3
94
-
3
,06
0,1
41
94
1,1
77
53
7,1
83
-
19
6,7
21
1
,32
7,6
22
77
9,8
79
35
8,1
03
1
,76
8,1
99
64
3,3
22
1
,02
6,5
13
33
9,9
97
30
0,1
04
62
4,2
33
37
5,8
58
5
,54
8,6
99
65
1,7
85
59
,47
2,6
84
Life
70
6,9
58
89
0,2
94
9
,79
4,5
55
27
2,0
92
2
,88
7,7
89
38
4,3
64
13
,76
1
93
9,1
39
45
0,6
40
8
,69
1,5
03
10
,21
4,2
29
4
,96
1,5
01
32
8,6
63
27
1,8
99
21
0,9
16
3
,47
8,2
42
3
,55
3,5
56
29
9,3
08
1
,11
6,2
47
2
,70
7,9
19
24
9,7
58
67
,84
3
3
,80
9,9
10
12
,58
4
1
,51
6,4
22
57
,83
0,0
92
To
tal 2
01
8
4
,58
8,9
40
2
,23
0,7
74
34
1,3
38
2
,04
3,1
26
7
,92
3,1
24
1
,05
3,3
13
1
,62
0,3
57
7
,64
9,0
36
1
4,8
00
,20
9
37
8,3
58
1
0,0
87
,66
6
4
,76
1,3
09
65
7,2
97
3
,30
4,0
50
1
,97
4,0
08
2
,65
8,6
54
4
,69
6,6
18
80
3,4
59
4
,28
2,8
39
4
,20
8,4
58
4
,16
6,3
62
1
1,1
91
,83
4
1
,11
3,0
21
1
,56
8,7
41
3
,50
9,6
50
5
,55
7,1
46
1
1,3
76
,67
6
7
,97
0,7
75
1
,61
1,0
66
55
3,2
49
1
,58
1,1
63
-
4
,28
7,6
09
4
,33
8,7
90
4
,00
0,5
25
2
,06
4,7
88
1
,14
4,5
05
44
1,1
64
48
0,0
79
2
,53
1,6
22
1
,84
9,3
92
1
,11
4,7
42
44
4,9
65
3
,88
6,0
91
55
7,8
97
3
,35
3,8
38
1
,58
1,5
85
1
,74
2,9
26
5
,02
3,0
63
76
1,0
77
1
,08
9,4
00
1
,51
0,5
47
56
2,6
65
8
,76
6,4
09
2
,09
0,7
30
1
,15
0,0
73
18
5,0
37
,09
8
Ge
ne
ral
4
,58
8,9
40
2
,23
0,7
74
34
1,3
38
2
,04
3,1
26
7
,92
3,1
24
-
-
7
,64
9,0
36
-
-
1
0,0
87
,66
6
-
31
3,7
40
3
,30
4,0
50
1
,97
4,0
08
2
,57
4,2
47
4
,69
6,6
18
-
3
,88
3,4
26
4
,20
8,4
58
4
,16
6,3
62
-
1
,11
3,0
21
1
,56
8,7
41
3
,50
9,6
50
5
,55
7,1
46
-
2
,72
8,1
17
1
,61
1,0
66
-
1
,26
7,2
53
-
-
4
,33
8,7
90
-
2
,06
4,7
88
1
,14
4,5
05
-
48
0,0
79
2
,53
1,6
22
-
1
,11
4,7
42
44
4,9
65
-
-
3
,35
3,8
38
1
,43
7,3
22
1
,74
2,9
26
-
76
1,0
77
1
,08
9,4
00
1
,33
5,0
00
56
2,6
65
8
,76
6,4
09
-
1
,15
0,0
73
10
9,6
58
,10
8
Life
-
-
-
-
-
1
,05
3,3
13
1
,62
0,3
57
-
14
,80
0,2
09
37
8,3
58
-
4
,76
1,3
09
34
3,5
57
-
-
84
,40
7
-
80
3,4
59
39
9,4
13
-
-
11
,19
1,8
34
-
-
-
-
11
,37
6,6
76
5
,24
2,6
58
-
55
3,2
49
31
3,9
10
-
4
,28
7,6
09
-
4
,00
0,5
25
-
-
44
1,1
64
-
-
1
,84
9,3
92
-
-
3
,88
6,0
91
55
7,8
97
-
14
4,2
63
-
5
,02
3,0
63
-
-
17
5,5
47
-
-
2
,09
0,7
30
-
75
,37
8,9
90
To
tal 2
01
9
3
,97
6,1
52
2
,42
1,5
68
55
0,0
70
1
,55
7,3
29
8
,50
4,2
67
1
,22
1,4
54
2
,09
9,2
78
7
,66
9,8
97
2
2,3
50
,27
4
38
2,5
26
1
0,2
43
,71
1
4
,93
8,9
35
86
9,1
74
3
,27
3,9
53
2
,11
7,2
69
2
,77
6,1
28
5
,09
3,9
02
1
,19
9,3
73
5
,64
9,7
61
4
,45
2,7
22
4
,31
9,1
99
1
4,9
57
,37
0
1
,17
2,3
94
1
,25
7,6
43
3
,45
9,7
30
6
,16
2,6
52
1
4,4
20
,64
7
8
,30
2,6
54
1
,14
3,9
26
63
4,3
66
1
,78
3,8
75
35
9,0
51
5
,63
7,5
64
4
,48
1,6
42
4
,16
2,9
90
2
,43
5,3
22
1
,06
1,7
84
36
9,2
23
59
9,9
40
2
,68
3,3
15
2
,69
7,8
93
1
,26
8,0
57
73
5,8
97
3
,88
2,5
02
76
9,0
95
2
,97
9,6
43
1
,58
2,6
42
2
,00
2,1
38
6
,80
3,6
65
93
6,3
79
1
,18
1,5
35
1
,37
7,0
74
62
6,8
63
9
,74
6,2
47
3
,08
6,5
12
1
,32
7,6
13
21
1,7
56
,78
5
Ge
ne
ral
3
,97
6,1
52
2
,42
1,5
68
55
0,0
70
1
,55
7,3
29
8
,50
4,2
67
-
-
7
,66
9,8
97
-
-
1
0,2
43
,71
1
-
45
5,9
84
3
,27
3,9
53
2
,11
7,2
69
2
,72
9,3
76
5
,09
3,9
02
-
4
,89
0,3
17
4
,45
2,7
22
4
,31
9,1
99
-
1
,17
2,3
94
1
,25
7,6
43
3
,45
9,7
30
6
,16
2,6
52
-
2
,45
7,9
33
1
,14
3,9
26
-
1
,48
1,8
74
-
-
4
,48
1,6
42
-
2
,43
5,3
22
1
,06
1,7
84
-
59
9,9
40
2
,68
3,3
15
-
1
,26
8,0
57
73
5,8
97
-
-
2
,97
9,6
43
1
,45
5,9
69
2
,00
2,1
38
-
93
6,3
79
1
,18
1,5
35
1
,29
3,3
62
62
6,8
63
9
,74
6,2
47
-
1
,32
7,6
13
11
4,2
07
,57
4
Life
-
-
-
-
-
1
,22
1,4
54
2
,09
9,2
78
-
22
,35
0,2
74
38
2,5
26
-
4
,93
8,9
35
41
3,1
90
-
-
46
,75
2
-
1
,19
9,3
73
75
9,4
44
-
-
14
,95
7,3
70
-
-
-
-
14
,42
0,6
47
5
,84
4,7
21
-
63
4,3
66
30
2,0
01
35
9,0
51
5
,63
7,5
64
-
4
,16
2,9
90
-
-
36
9,2
23
-
-
2
,69
7,8
93
-
-
3
,88
2,5
02
76
9,0
95
-
12
6,6
73
-
6
,80
3,6
65
-
-
83
,71
2
-
-
3
,08
6,5
12
-
97
,54
9,2
11
To
tal 2
01
8
28
1,3
34
1
,39
3,4
90
91
,38
2
33
3,0
43
1
,42
4,1
68
58
6,3
14
52
8,9
47
94
7,8
82
3
,19
4,8
19
63
,10
1
95
0,7
92
59
9,9
30
12
6,6
94
29
2,8
82
23
5,0
18
60
2,8
57
1
,62
3,9
45
80
0,0
70
68
3,3
25
1
,06
2,2
54
1
,13
0,3
29
7
,63
8,5
45
77
,48
4
21
,61
8
64
1,4
18
92
2,1
30
6
,82
3,0
31
4
,59
4,4
62
98
,29
7
65
,43
6
41
3,3
25
-
1
,68
6,2
69
33
8,1
10
1
,04
7,2
27
65
8,4
72
23
9,8
27
26
8,1
33
14
6,8
41
53
8,2
86
90
0,2
04
13
8,2
21
12
5,4
55
66
0,0
17
18
3,7
56
65
4,4
98
51
1,9
34
30
7,6
19
1
,08
6,5
62
20
6,8
09
28
7,6
00
35
6,8
19
50
,29
3
62
5,6
27
92
4,2
49
36
,49
1
50
,22
7,6
41
Ge
ne
ral
28
1,3
34
1
,39
3,4
90
91
,38
2
33
3,0
43
1
,42
4,1
68
-
-
94
7,8
82
-
-
95
0,7
92
-
51
,37
5
29
2,8
82
23
5,0
18
53
8,9
66
1
,62
3,9
45
49
4,9
92
1
,06
2,2
54
1
,13
0,3
29
-
77
,48
4
21
,61
8
64
1,4
18
92
2,1
30
80
2,6
39
98
,29
7
24
2,6
85
-
-
33
8,1
10
65
8,4
72
23
9,8
27
-
14
6,8
41
53
8,2
86
-
13
8,2
21
12
5,4
55
-
-
65
4,4
98
40
0,6
44
30
7,6
19
-
20
6,8
09
28
7,6
00
21
7,4
54
50
,29
3
62
5,6
27
-
36
,49
1
18
,63
0,3
70
Life
-
-
-
-
-
58
6,3
14
52
8,9
47
-
3
,19
4,8
19
63
,10
1
-
59
9,9
30
75
,31
9
-
-
63
,89
1
80
0,0
70
18
8,3
33
-
-
7
,63
8,5
45
-
6
,82
3,0
31
3
,79
1,8
23
65
,43
6
17
0,6
40
-
1
,68
6,2
69
1
,04
7,2
27
-
26
8,1
33
-
90
0,2
04
66
0,0
17
18
3,7
56
-
11
1,2
90
-
1
,08
6,5
62
-
13
9,3
65
-
92
4,2
49
31
,59
7,2
71
To
tal 2
01
9
84
2,1
81
1
,49
9,5
29
14
5,9
43
21
7,1
35
1
,72
1,3
18
73
0,9
51
68
9,2
60
1
,24
4,4
58
8
,76
3,1
33
10
1,9
40
1
,24
3,2
01
90
9,3
55
24
5,0
27
83
,37
8
31
1,9
32
54
8,3
65
1
,70
2,6
79
1
,19
5,8
94
79
4,0
58
1
,04
6,4
71
1
,47
8,2
18
10
,88
9,0
74
11
0,6
42
18
,19
5
61
1,9
73
90
2,3
41
9
,15
8,6
88
4
,92
4,1
83
22
,71
3
70
,83
7
37
8,3
48
35
,44
7
3
,01
4,4
18
36
2,0
67
90
6,6
51
71
2,5
82
25
2,4
41
18
5,2
77
15
0,2
41
58
6,4
44
1
,58
0,5
41
16
1,2
28
10
3,0
76
67
5,1
27
20
8,1
99
71
4,8
43
45
5,6
74
30
7,0
48
2
,85
2,2
09
23
6,4
75
34
0,8
68
11
1,7
43
10
4,6
13
1
,44
9,5
72
1
,67
9,1
41
65
,20
4
69
,85
2,5
49
Ge
ne
ral
84
2,1
81
1
,49
9,5
29
14
5,9
43
21
7,1
35
1
,72
1,3
18
1
,24
4,4
58
1
,24
3,2
01
12
1,5
65
83
,37
8
31
1,9
32
51
1,6
02
1
,70
2,6
79
54
9,5
68
1
,04
6,4
71
1
,47
8,2
18
11
0,6
42
18
,19
5
61
1,9
73
90
2,3
41
71
0,5
18
22
,71
3
22
9,4
65
-
36
2,0
67
71
2,5
82
25
2,4
41
15
0,2
41
58
6,4
44
16
1,2
28
10
3,0
76
-
71
4,8
43
35
3,7
73
30
7,0
48
23
6,4
75
34
0,8
68
72
,77
6
10
4,6
13
1
,44
9,5
72
65
,20
4
21
,29
8,2
76
Life
73
0,9
51
68
9,2
60
8
,76
3,1
33
10
1,9
40
90
9,3
55
12
3,4
62
36
,76
3
1
,19
5,8
94
24
4,4
90
10
,88
9,0
74
9
,15
8,6
88
4
,21
3,6
65
70
,83
7
14
8,8
83
35
,44
7
3
,01
4,4
18
90
6,6
51
18
5,2
77
1
,58
0,5
41
67
5,1
27
20
8,1
99
10
1,9
01
2
,85
2,2
09
38
,96
7
1
,67
9,1
41
48
,55
4,2
73
Co
mp
an
ies
AA
R
AIG
Alli
an
z
Am
aco
AP
A In
sura
nce
AP
A L
ife
Ba
rcla
ys L
ife
Bri
tam
Ge
ne
ral
Bri
tam
Life
Ca
pe
x L
ife
CIC
Ge
ne
ral
CIC
Life
Co
rpo
rate
Dir
ect
line
Fid
elit
y S
hie
ld
Fir
st A
ssu
ran
ce
GA
Insu
ran
ce
GA
Life
Ge
min
ia
He
rita
ge
ICE
A L
ION
Ge
ne
ral
ICE
A L
ION
Life
Intr
a A
fric
a
Inve
sco
Ju
bile
e G
en
era
l In
sura
nce
Ju
bile
e H
ea
lth In
sura
nce
Ju
bile
e L
ife In
sura
nce
Ke
nin
dia
Ke
nya
Ori
en
t Ge
ne
ral
Ke
nya
Ori
en
t Life
Ke
nya
n A
llia
nce
KU
SC
O M
utu
al A
ssu
ran
ce
Lib
ert
y L
ife
Ma
dis
on
Ge
ne
ral
Ma
dis
on
Life
Ma
yfa
ir
Me
tro
po
lita
nC
an
no
n G
en
era
l
Me
tro
po
lita
nC
an
no
n L
ife
MU
A (
Fo
rme
ly P
ho
en
ix o
f E.A
.)
Occ
ide
nta
l
Old
Mu
tua
l Life
Pa
cis
Pio
ne
er
Ge
ne
ral
Pio
ne
er
Life
Pru
de
ntia
l Life
Re
solu
tion
Sa
ha
m
Sa
nla
m G
en
era
l
Sa
nla
m L
ife
Ta
kafu
l
Ta
usi
Th
e M
on
arc
h
Tri
de
nt
UA
P G
en
era
l
UA
P L
ife
Xp
lico
TO
TA
L
No
1 2 3 4 5 6 7 8 9 10
11
12
13
14
15
16
17
18
19
20
21
22
23
24
25
26
27
28
29
30
31
32
33
34
35
36
37
38
39
40
41
42
43
44
45
46
47
48
49
50
51
52
53
54
55
56
Ne
t C
laim
s In
cu
rre
d
Ne
t In
co
me
In
ve
stm
en
t in
co
me
& O
the
r In
co
me
s
Appendix I: Detailed Industry Statement of Comprehensive Income, 2019 in KES ‘000 (continued)
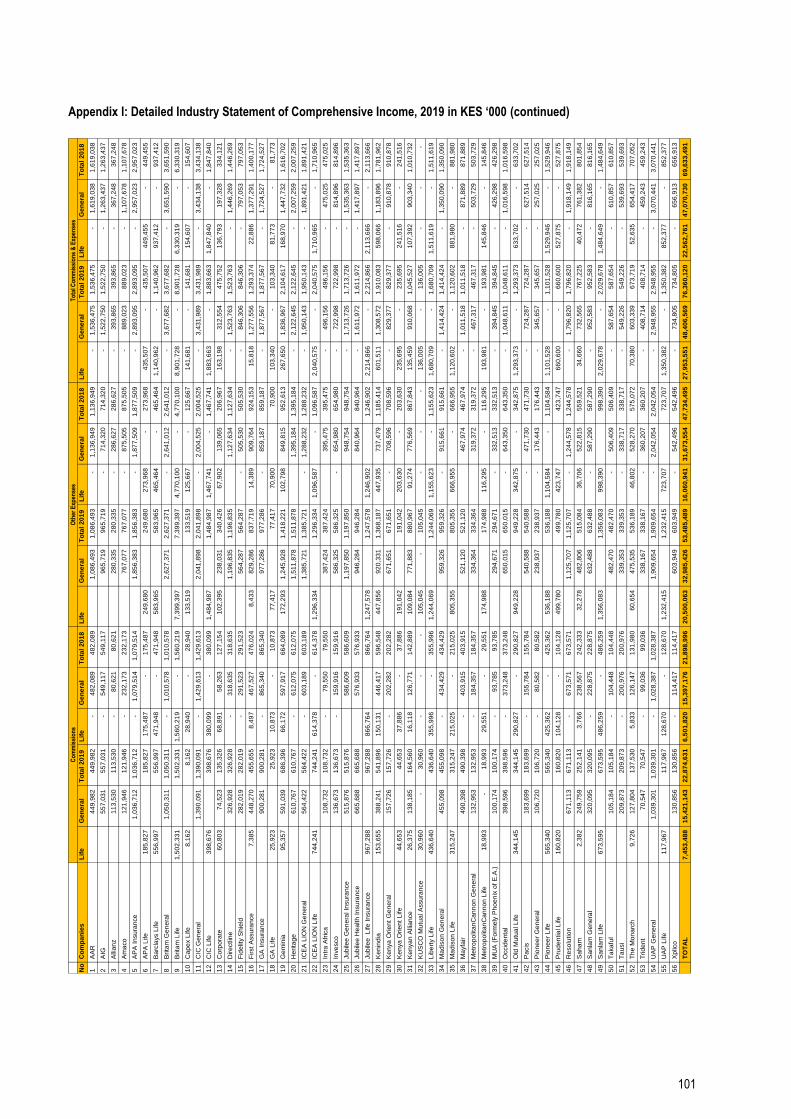
101
To
tal
20
18
1
,61
9,0
38
1
,26
3,4
37
3
67
,24
8
1
,10
7,6
78
2
,95
7,0
23
4
49
,45
5
9
37
,41
2
3
,65
1,5
90
6
,33
0,3
19
1
54
,60
7
3
,43
4,1
38
1
,84
7,8
40
3
34
,12
1
1
,44
6,2
69
7
97
,05
3
1
,40
0,1
77
1
,72
4,5
27
81
,77
3
1
,61
6,7
02
2
,00
7,2
59
1
,89
1,4
21
1
,71
0,9
65
4
75
,02
5
8
14
,89
6
1
,53
5,3
63
1
,41
7,8
97
2
,11
3,6
66
1
,78
1,9
62
9
10
,87
8
2
41
,51
6
1
,01
0,7
32
-
1
,51
1,6
19
1
,35
0,0
90
8
81
,98
0
8
71
,88
9
5
03
,72
9
1
45
,84
6
4
26
,29
8
1
,01
6,5
98
6
33
,70
2
6
27
,51
4
2
57
,02
5
1
,52
9,9
46
5
27
,87
5
1
,91
8,1
49
8
01
,85
4
8
16
,16
5
1
,48
4,6
49
6
10
,85
7
5
39
,69
3
7
07
,05
2
4
59
,24
3
3
,07
0,4
41
8
52
,37
7
6
56
,91
3
69
,63
3,4
91
Ge
ne
ral
1
,61
9,0
38
1
,26
3,4
37
3
67
,24
8
1
,10
7,6
78
2
,95
7,0
23
-
-
3
,65
1,5
90
-
-
3
,43
4,1
38
-
1
97
,32
8
1
,44
6,2
69
7
97
,05
3
1
,37
7,2
91
1
,72
4,5
27
-
1
,44
7,7
32
2
,00
7,2
59
1
,89
1,4
21
-
4
75
,02
5
8
14
,89
6
1
,53
5,3
63
1
,41
7,8
97
-
1
,18
3,8
96
9
10
,87
8
-
9
03
,34
0
-
-
1
,35
0,0
90
-
8
71
,88
9
5
03
,72
9
-
4
26
,29
8
1
,01
6,5
98
-
6
27
,51
4
2
57
,02
5
-
-
1
,91
8,1
49
7
61
,38
2
8
16
,16
5
-
6
10
,85
7
5
39
,69
3
6
54
,41
7
4
59
,24
3
3
,07
0,4
41
-
6
56
,91
3
47
,07
0,7
30
Lif
e
-
-
-
-
-
4
49
,45
5
9
37
,41
2
-
6
,33
0,3
19
1
54
,60
7
-
1
,84
7,8
40
1
36
,79
3
-
-
22
,88
6
-
81
,77
3
1
68
,97
0
-
-
1
,71
0,9
65
-
-
-
-
2
,11
3,6
66
5
98
,06
6
-
2
41
,51
6
1
07
,39
2
-
1
,51
1,6
19
-
8
81
,98
0
-
-
1
45
,84
6
-
-
6
33
,70
2
-
-
1
,52
9,9
46
5
27
,87
5
-
40
,47
2
-
1
,48
4,6
49
-
-
52
,63
5
-
-
8
52
,37
7
-
22
,56
2,7
61
To
tal
20
19
1
,53
6,4
75
1
,52
2,7
50
3
93
,86
5
8
89
,02
3
2
,89
3,0
95
4
35
,50
7
1
,14
0,9
62
3
,67
7,6
82
8
,90
1,7
28
1
41
,68
1
3
,43
1,9
89
1
,88
3,6
63
4
75
,75
2
1
,52
3,7
63
8
46
,30
6
1
,29
3,3
74
1
,87
7,5
67
1
03
,34
0
2
,10
4,6
17
2
,12
2,6
45
1
,95
0,1
43
2
,04
0,5
75
4
96
,15
6
7
22
,99
8
1
,71
3,7
26
1
,61
1,9
72
2
,21
4,8
66
1
,91
0,0
83
8
29
,37
7
2
35
,69
5
1
,04
5,5
27
1
36
,00
5
1
,68
0,7
09
1
,41
4,4
24
1
,12
0,6
02
1
,01
1,5
18
4
67
,31
7
1
93
,98
1
3
94
,84
5
1
,04
8,6
11
1
,29
3,3
73
7
24
,28
7
3
45
,65
7
1
,10
1,5
28
6
60
,60
0
1
,79
6,8
20
7
67
,22
5
9
52
,58
3
2
,02
9,6
78
5
87
,65
4
5
49
,22
6
6
73
,71
9
4
08
,71
4
2
,94
8,9
55
1
,35
0,3
82
7
34
,80
5
76
,36
0,1
20
Ge
ne
ral
1
,53
6,4
75
1
,52
2,7
50
3
93
,86
5
8
89
,02
3
2
,89
3,0
95
-
-
3
,67
7,6
82
-
-
3
,43
1,9
89
-
3
12
,55
4
1
,52
3,7
63
8
46
,30
6
1
,27
7,5
56
1
,87
7,5
67
-
1
,83
6,9
67
2
,12
2,6
45
1
,95
0,1
43
-
4
96
,15
6
7
22
,99
8
1
,71
3,7
26
1
,61
1,9
72
-
1
,30
8,5
72
8
29
,37
7
-
9
10
,06
8
-
-
1
,41
4,4
24
-
1
,01
1,5
18
4
67
,31
7
-
3
94
,84
5
1
,04
8,6
11
-
7
24
,28
7
3
45
,65
7
-
-
1
,79
6,8
20
7
32
,56
5
9
52
,58
3
-
5
87
,65
4
5
49
,22
6
6
03
,33
9
4
08
,71
4
2
,94
8,9
55
-
7
34
,80
5
48
,40
6,5
69
Lif
e
-
-
-
-
-
4
35
,50
7
1
,14
0,9
62
-
8
,90
1,7
28
1
41
,68
1
-
1
,88
3,6
63
1
63
,19
8
-
-
15
,81
8
-
1
03
,34
0
2
67
,65
0
-
-
2
,04
0,5
75
-
-
-
-
2
,21
4,8
66
6
01
,51
1
-
2
35
,69
5
1
35
,45
9
1
36
,00
5
1
,68
0,7
09
-
1
,12
0,6
02
-
-
1
93
,98
1
-
-
1
,29
3,3
73
-
-
1
,10
1,5
28
6
60
,60
0
-
34
,66
0
-
2
,02
9,6
78
-
-
70
,38
0
-
-
1
,35
0,3
82
-
27
,95
3,5
51
To
tal
20
18
1
,13
6,9
49
7
14
,32
0
2
86
,62
7
8
75
,50
5
1
,87
7,5
09
2
73
,96
8
4
65
,46
4
2
,64
1,0
12
4
,77
0,1
00
1
25
,66
7
2
,00
4,5
25
1
,46
7,7
41
2
06
,96
7
1
,12
7,6
34
5
05
,53
0
9
24
,15
3
8
59
,18
7
70
,90
0
9
52
,61
3
1
,39
5,1
84
1
,28
8,2
32
1
,09
6,5
87
3
95
,47
5
6
54
,98
0
9
48
,75
4
8
40
,96
4
1
,24
6,9
02
1
,18
5,4
14
7
08
,59
6
2
03
,63
0
8
67
,84
3
-
1
,15
5,6
23
9
15
,66
1
6
66
,95
5
4
67
,97
4
3
19
,37
2
1
16
,29
5
3
32
,51
3
6
43
,35
0
3
42
,87
5
4
71
,73
0
1
76
,44
3
1
,10
4,5
84
4
23
,74
7
1
,24
4,5
78
5
59
,52
1
5
87
,29
0
9
98
,39
0
5
06
,40
9
3
38
,71
7
5
75
,07
2
3
60
,20
7
2
,04
2,0
54
7
23
,70
7
5
42
,49
6
47
,73
4,4
95
Ge
ne
ral
1
,13
6,9
49
7
14
,32
0
2
86
,62
7
8
75
,50
5
1
,87
7,5
09
-
-
2
,64
1,0
12
-
-
2
,00
4,5
25
-
1
39
,06
5
1
,12
7,6
34
5
05
,53
0
9
09
,76
4
8
59
,18
7
8
49
,81
5
1
,39
5,1
84
1
,28
8,2
32
-
3
95
,47
5
6
54
,98
0
9
48
,75
4
8
40
,96
4
7
37
,47
9
7
08
,59
6
-
7
76
,56
9
-
-
9
15
,66
1
-
4
67
,97
4
3
19
,37
2
-
3
32
,51
3
6
43
,35
0
-
4
71
,73
0
1
76
,44
3
-
1
,24
4,5
78
5
22
,81
5
5
87
,29
0
5
06
,40
9
3
38
,71
7
5
28
,27
0
3
60
,20
7
2
,04
2,0
54
5
42
,49
6
31
,67
3,5
54
Lif
e
-
-
-
-
-
2
73
,96
8
4
65
,46
4
-
4
,77
0,1
00
1
25
,66
7
-
1
,46
7,7
41
67
,90
2
-
14
,38
9
-
70
,90
0
1
02
,79
8
-
1
,09
6,5
87
-
1
,24
6,9
02
4
47
,93
5
-
2
03
,63
0
91
,27
4
-
1
,15
5,6
23
-
6
66
,95
5
1
16
,29
5
-
-
3
42
,87
5
-
-
1
,10
4,5
84
4
23
,74
7
-
36
,70
6
-
9
98
,39
0
-
-
46
,80
2
-
-
7
23
,70
7
-
16
,06
0,9
41
To
tal
20
19
1
,08
6,4
93
9
65
,71
9
2
80
,33
5
7
67
,07
7
1
,85
6,3
83
2
49
,68
0
5
83
,96
5
2
,62
7,3
71
7
,39
9,3
97
1
33
,51
9
2
,04
1,8
98
1
,48
4,9
87
3
40
,42
6
1
,19
6,8
35
5
64
,28
7
8
37
,71
9
9
77
,28
6
77
,41
7
1
,41
8,2
21
1
,51
1,8
78
1
,38
5,7
21
1
,29
6,3
34
3
87
,42
4
5
86
,32
5
1
,19
7,8
50
9
46
,28
4
1
,24
7,5
78
1
,36
8,1
87
6
71
,65
1
1
91
,04
2
8
80
,96
7
1
05
,04
5
1
,24
4,0
69
9
59
,32
6
8
05
,35
5
5
21
,12
0
3
34
,36
4
1
74
,98
8
2
94
,67
1
6
50
,01
5
9
49
,22
8
5
40
,58
8
2
38
,93
7
5
36
,18
8
4
99
,78
0
1
,12
5,7
07
5
15
,08
4
6
32
,48
8
1
,35
6,0
83
4
82
,47
0
3
39
,35
3
5
36
,18
9
3
38
,16
7
1
,90
9,6
54
1
,23
2,4
15
6
03
,94
9
53
,48
5,4
89
Ge
ne
ral
1
,08
6,4
93
9
65
,71
9
2
80
,33
5
7
67
,07
7
1
,85
6,3
83
2
,62
7,3
71
2
,04
1,8
98
2
38
,03
1
1
,19
6,8
35
5
64
,28
7
8
29
,28
6
9
77
,28
6
1
,24
5,9
28
1
,51
1,8
78
1
,38
5,7
21
3
87
,42
4
5
86
,32
5
1
,19
7,8
50
9
46
,28
4
9
20
,33
1
6
71
,65
1
7
71
,88
3
-
9
59
,32
6
5
21
,12
0
3
34
,36
4
2
94
,67
1
6
50
,01
5
5
40
,58
8
2
38
,93
7
1
,12
5,7
07
4
82
,80
6
6
32
,48
8
4
82
,47
0
3
39
,35
3
4
75
,53
5
3
38
,16
7
1
,90
9,6
54
6
03
,94
9
32
,98
5,4
26
Lif
e
2
49
,68
0
5
83
,96
5
7
,39
9,3
97
1
33
,51
9
1
,48
4,9
87
1
02
,39
5
8
,43
3
77
,41
7
1
72
,29
3
1
,29
6,3
34
1
,24
7,5
78
4
47
,85
6
1
91
,04
2
1
09
,08
4
1
05
,04
5
1
,24
4,0
69
8
05
,35
5
1
74
,98
8
9
49
,22
8
5
36
,18
8
4
99
,78
0
32
,27
8
1
,35
6,0
83
60
,65
4
1
,23
2,4
15
20
,50
0,0
63
To
tal
20
18
4
82
,08
9
5
49
,11
7
80
,62
1
2
32
,17
3
1
,07
9,5
14
1
75
,48
7
4
71
,94
8
1
,01
0,5
78
1
,56
0,2
19
28
,94
0
1
,42
9,6
13
3
80
,09
9
1
27
,15
4
3
18
,63
5
2
91
,52
3
4
76
,02
4
8
65
,34
0
10
,87
3
6
64
,08
9
6
12
,07
5
6
03
,18
9
6
14
,37
8
79
,55
0
1
59
,91
6
5
86
,60
9
5
76
,93
3
8
66
,76
4
5
96
,54
8
2
02
,28
2
37
,88
6
1
42
,88
9
-
3
55
,99
6
4
34
,42
9
2
15
,02
5
4
03
,91
5
1
84
,35
7
29
,55
1
93
,78
5
3
73
,24
8
2
90
,82
7
1
55
,78
4
80
,58
2
4
25
,36
2
1
04
,12
8
6
73
,57
1
2
42
,33
3
2
28
,87
5
4
86
,25
9
1
04
,44
8
2
00
,97
6
1
31
,98
0
99
,03
6
1
,02
8,3
87
1
28
,67
0
1
14
,41
7
21
,89
8,9
96
Ge
ne
ral
4
82
,08
9
5
49
,11
7
80
,62
1
2
32
,17
3
1
,07
9,5
14
-
-
1
,01
0,5
78
-
-
1
,42
9,6
13
-
58
,26
3
3
18
,63
5
2
91
,52
3
4
67
,52
7
8
65
,34
0
-
5
97
,91
7
6
12
,07
5
6
03
,18
9
-
79
,55
0
1
59
,91
6
5
86
,60
9
5
76
,93
3
4
46
,41
7
2
02
,28
2
-
1
26
,77
1
-
-
4
34
,42
9
-
4
03
,91
5
1
84
,35
7
-
93
,78
5
3
73
,24
8
-
1
55
,78
4
80
,58
2
-
-
6
73
,57
1
2
38
,56
7
2
28
,87
5
-
1
04
,44
8
2
00
,97
6
1
26
,14
7
99
,03
6
1
,02
8,3
87
-
1
14
,41
7
15
,39
7,1
76
Lif
e
-
-
-
-
-
17
5,4
87
47
1,9
48
-
1,5
60
,21
9
2
8,9
40
-
38
0,0
99
6
8,8
91
-
-
8,4
97
-
1
0,8
73
6
6,1
72
-
-
61
4,3
78
-
-
86
6,7
64
15
0,1
31
-
3
7,8
86
1
6,1
18
-
35
5,9
96
-
21
5,0
25
-
-
2
9,5
51
-
-
29
0,8
27
-
-
42
5,3
62
10
4,1
28
-
3,7
66
-
48
6,2
59
-
-
5,8
33
-
-
12
8,6
70
-
6,5
01
,82
0
To
tal
20
19
4
49
,98
2
5
57
,03
1
1
13
,53
0
1
21
,94
6
1
,03
6,7
12
1
85
,82
7
5
56
,99
7
1
,05
0,3
11
1
,50
2,3
31
8
,16
2
1
,39
0,0
91
3
98
,67
6
1
35
,32
6
3
26
,92
8
2
82
,01
9
4
55
,65
5
9
00
,28
1
25
,92
3
6
86
,39
6
6
10
,76
7
5
64
,42
2
7
44
,24
1
1
08
,73
2
1
36
,67
3
5
15
,87
6
6
65
,68
8
9
67
,28
8
5
41
,89
6
1
57
,72
6
44
,65
3
1
64
,56
0
30
,96
0
4
36
,64
0
4
55
,09
8
3
15
,24
7
4
90
,39
8
1
32
,95
3
18
,99
3
1
00
,17
4
3
98
,59
6
3
44
,14
5
1
83
,69
9
1
06
,72
0
5
65
,34
0
1
60
,82
0
6
71
,11
3
2
52
,14
1
3
20
,09
5
6
73
,59
5
1
05
,18
4
2
09
,87
3
1
37
,53
0
70
,54
7
1
,03
9,3
01
1
17
,96
7
1
30
,85
6
22
,87
4,6
31
Ge
ne
ral
4
49
,98
2
5
57
,03
1
1
13
,53
0
1
21
,94
6
1
,03
6,7
12
1
,05
0,3
11
1
,39
0,0
91
74
,52
3
3
26
,92
8
2
82
,01
9
4
48
,27
0
9
00
,28
1
5
91
,03
9
6
10
,76
7
5
64
,42
2
1
08
,73
2
1
36
,67
3
5
15
,87
6
6
65
,68
8
3
88
,24
1
1
57
,72
6
1
38
,18
5
-
4
55
,09
8
4
90
,39
8
1
32
,95
3
-
1
00
,17
4
3
98
,59
6
1
83
,69
9
1
06
,72
0
6
71
,11
3
2
49
,75
9
3
20
,09
5
1
05
,18
4
2
09
,87
3
1
27
,80
4
70
,54
7
1
,03
9,3
01
1
30
,85
6
15
,42
1,1
43
Lif
e
18
5,8
27
55
6,9
97
1,5
02
,33
1
8,1
62
39
8,6
76
6
0,8
03
7,3
85
2
5,9
23
9
5,3
57
74
4,2
41
96
7,2
88
15
3,6
55
4
4,6
53
2
6,3
75
3
0,9
60
43
6,6
40
31
5,2
47
1
8,9
93
34
4,1
45
56
5,3
40
16
0,8
20
2,3
82
67
3,5
95
9,7
26
11
7,9
67
7,4
53
,48
8
Co
mp
an
ies
AA
R
AIG
Alli
an
z
Am
aco
AP
A I
nsu
ran
ce
AP
A L
ife
Ba
rcla
ys L
ife
Brita
m G
en
era
l
Brita
m L
ife
Ca
pe
x L
ife
CIC
Ge
ne
ral
CIC
Life
Co
rpo
rate
Dire
ctlin
e
Fid
elit
y S
hie
ld
First
Assu
ran
ce
GA
In
su
ran
ce
GA
Life
Ge
min
ia
He
rita
ge
IC
EA
LIO
N G
en
era
l
IC
EA
LIO
N L
ife
In
tra
Afr
ica
In
ve
sco
Ju
bile
e G
en
era
l In
su
ran
ce
Ju
bile
e H
ea
lth
In
su
ran
ce
Ju
bile
e
Life
In
su
ran
ce
Ke
nin
dia
Ke
nya
Orie
nt
Ge
ne
ral
Ke
nya
Orie
nt
Life
Ke
nya
n A
llia
nce
KU
SC
O M
utu
al A
ssu
ran
ce
Lib
ert
y L
ife
Ma
dis
on
Ge
ne
ral
Ma
dis
on
Life
Ma
yfa
ir
Me
tro
po
lita
nC
an
no
n G
en
era
l
Me
tro
po
lita
nC
an
no
n L
ife
MU
A (
Fo
rme
ly P
ho
en
ix o
f E
.A.)
Occid
en
tal
Old
Mu
tua
l L
ife
Pa
cis
Pio
ne
er
Ge
ne
ral
Pio
ne
er
Life
Pru
de
ntia
l L
ife
Re
so
lutio
n
Sa
ha
m
Sa
nla
m G
en
era
l
Sa
nla
m L
ife
Ta
ka
ful
Ta
usi
Th
e M
on
arc
h
Trid
en
t
UA
P G
en
era
l
UA
P L
ife
Xp
lico
TO
TA
L
No
1 2 3 4 5 6 7 8 9 10
11
12
13
14
15
16
17
18
19
20
21
22
23
24
25
26
27
28
29
30
31
32
33
34
35
36
37
38
39
40
41
42
43
44
45
46
47
48
49
50
51
52
53
54
55
56
To
tal C
om
mis
sio
ns
& E
xpen
ses
Oth
er E
xpen
ses
Co
mm
issi
on
s
Appendix I: Detailed Industry Statement of Comprehensive Income, 2019 in KES ‘000 (continued)

102
To
tal 2
018
(2
52,5
48)
377,
753
(1
35,0
87)
39,
599
493,
247
(30,
596)
40,
332
(52,
033)
(3
94,5
03)
(13,
783)
380,
290
12,
437
(1
02,9
84)
(87,
052)
57,
009
(1
75,5
90)
983,
607
50,
260
193,
131
380,
648
442,
589
(3
10,9
98)
99,
667
(93,
254)
144,
059
689,
727
799,
581
329,
157
(5
06,5
39)
(12
)
(2
28,1
39)
-
308,
469
(1
06,7
09)
(5
10,6
80)
328,
528
81,
072
28,
336
(97,
143)
244,
880
277,
797
45,
357
(8
,657
)
(70,
817)
(2
39,8
85)
(3
34,3
33)
95,
653
115,
667
(6
26,6
60)
(1
00,0
92)
252,
729
170,
651
(2
56,8
66)
171,
615
175,
783
(78,
051)
2,
996,
619
Gen
eral
(
252,
548)
377
,753
(
135,
087)
39
,599
493
,247
-
-
(52,
033)
-
-
380
,290
-
(54,
239)
(87,
052)
57
,009
(
199,
667)
983
,607
-
263
,237
380
,648
442
,589
-
99
,667
(93,
254)
144
,059
689
,727
-
187
,241
(
506,
539)
-
(
142,
890)
-
-
(
106,
709)
-
328
,528
81
,072
-
(97,
143)
244
,880
-
45
,357
(8
,657
)
-
-
(
334,
333)
95
,653
115
,667
-
(
100,
092)
252
,729
118
,774
(
256,
866)
171
,615
-
(78,
051)
3,
487,
788
Life
-
-
-
-
-
(
30,5
96)
40,
332
-
(3
94,5
03)
(
13,7
83)
-
12,
437
(
48,7
45)
-
-
24,
077
-
50,
260
(
70,1
06)
-
-
(3
10,9
98)
-
-
-
-
7
99,5
81
1
41,9
16
-
(12)
(
85,2
49)
-
3
08,4
69
-
(5
10,6
80)
-
-
28,
336
-
-
2
77,7
97
-
-
(
70,8
17)
(2
39,8
85)
-
-
-
(6
26,6
60)
-
-
51,
877
-
-
1
75,7
83
-
(4
91,1
69)
To
tal 2
019
517
,230
269
,721
(48
,193
)
(76
,217
)
734
,820
6
8,86
5
7
6,88
3
(185
,400
)
2
,561
,924
(48
,102
)
278
,110
118
,599
(317
,512
)
(270
,698
)
(33
,748
)
121
,114
1
,118
,379
114
,208
281
,539
609
,133
894
,322
2
,962
,499
5
9,75
5
72
2
(652
,473
)
624
,421
1
,407
,208
(190
,387
)
(305
,340
)
6
1,87
2
(42
,790
)
5,96
0
320
,089
1
4,36
7
(386
,273
)
332
,688
4
9,55
8
(137
,038
)
8,37
4
248
,118
247
,065
(253
,163
)
2
1,10
2
142
,489
(183
,261
)
(523
,133
)
7
5,62
8
4,41
8
635
,564
(4
,103
)
272
,617
8
5,29
0
(71
,604
)
970
,443
166
,823
(58
,977
)
12,
693,
505
Gen
eral
5
17,2
30
2
69,7
21
(
48,1
93)
(
76,2
17)
7
34,8
20
-
-
(18
5,40
0)
-
-
2
78,1
10
-
(13
6,94
9)
(27
0,69
8)
(
33,7
48)
1
09,6
43
1,1
18,3
79
-
2
60,0
50
6
09,1
33
8
94,3
22
-
59,7
55
722
(65
2,47
3)
6
24,4
21
-
(38
7,58
3)
(30
5,34
0)
-
62,5
67
-
-
14,3
67
-
3
32,6
88
49,5
58
-
8,3
74
2
48,1
18
-
(25
3,16
3)
21,1
02
-
-
(52
3,13
3)
60,1
56
4,4
18
-
(4,1
03)
2
72,6
17
89,2
85
(
71,6
04)
9
70,4
43
-
(
58,9
77)
4,6
02,4
18
Life
-
-
-
-
-
68,
865
76,
883
-
2,5
61,9
24
(
48,1
02)
-
1
18,5
99
(1
80,5
63)
-
-
11,
471
-
1
14,2
08
21,
489
-
-
2,9
62,4
99
-
-
-
-
1,4
07,2
08
1
97,1
96
-
61,
872
(1
05,3
57)
5,
960
3
20,0
89
-
(3
86,2
73)
-
-
(1
37,0
38)
-
-
2
47,0
65
-
-
1
42,4
89
(1
83,2
61)
-
15,
472
-
6
35,5
64
-
-
(3,
995)
-
-
1
66,8
23
-
8,0
91,0
87
Tota
l 2018
(82,0
97)
178,8
94
(55,1
06)
38,7
54
165,8
42
8,3
98
-
11,9
11
(
207,5
45)
-
249,7
79
(39,8
79)
(41,3
14)
(28,3
67)
23,7
28
(87,2
16)
230,5
13
15,9
78
127,7
63
146,8
66
190,2
75
(
308,8
51)
10,9
95
(36,4
12)
65,8
34
329,7
05
348,7
14
23,0
01
(22,4
97)
7,6
71
(51,2
06)
-
165,4
68
(62,8
61)
(
250,2
02)
146,5
18
20,6
91
13,2
40
-
45,8
27
29,6
92
38,0
87
(3
,036)
22,5
36
35,5
02
(
146,2
49)
33,3
55
77,9
55
(
225,9
69)
(18,3
98)
77,8
53
357
(1
,528)
128,2
02
75,3
37
(18,0
73)
1,3
98,4
35
Genera
l
(82,0
97)
178,8
94
(55,1
06)
3
8,7
54
165,8
42
-
-
1
1,9
11
-
-
249,7
79
-
(28,4
97)
(28,3
67)
2
3,7
28
(100,3
24)
230,5
13
-
9
6,4
87
146,8
66
190,2
75
1
0,9
95
(36,4
12)
6
5,8
34
329,7
05
(
7,8
57)
(22,4
97)
-
(33,1
57)
-
-
(62,8
61)
-
146,5
18
2
0,6
91
-
-
4
5,8
27
-
3
8,0
87
(
3,0
36)
-
-
(146,2
49)
3
0,8
75
7
7,9
55
(18,3
98)
7
7,8
53
(
5,4
82)
(
1,5
28)
128,2
02
-
(18,0
73)
1,6
55,6
50
Life
-
-
-
-
-
8,3
98
-
-
(207,5
45)
-
-
(3
9,8
79)
(1
2,8
17)
-
-
1
3,1
08
-
1
5,9
78
3
1,2
76
-
-
(308,8
51)
-
-
348,7
14
3
0,8
58
-
7,6
71
(1
8,0
49)
-
165,4
68
-
(250,2
02)
-
-
1
3,2
40
-
-
2
9,6
92
-
-
2
2,5
36
3
5,5
02
-
2,4
80
-
(225,9
69)
-
-
5,8
39
-
-
7
5,3
37
-
(2
57,2
15)
Tota
l 2019
239,6
29
146,5
44
(14,7
23)
9,3
98
128,1
58
10,1
24
(8
,861)
(
120,9
48)
1,0
92,0
67
16,8
55
61,5
12
48,8
84
95,3
20
(
267,5
99)
(10,9
08)
65,7
46
337,0
23
42,6
86
166,1
48
245,3
69
219,3
50
1,2
62,7
93
31,2
09
309
(97,5
22)
224,8
59
584,3
44
(78,7
35)
(714)
8,1
36
47,8
45
6,1
70
158,5
24
(7
,290)
(
124,8
95)
149,9
39
7,7
26
12,9
72
-
58,9
64
41,2
08
17,0
54
11,0
35
(69,4
34)
41,9
98
(62,2
43)
28,6
24
18,6
24
328,5
13
12,8
31
59,5
88
(18,7
52)
(86,1
05)
278,1
50
52,8
85
-
5,4
00,3
84
Genera
l
239,6
29
146,5
44
(14,7
23)
9,3
98
128,1
58
(
120,9
48)
61,5
12
49,1
29
(
267,5
99)
(10,9
08)
60,0
44
337,0
23
146,4
83
245,3
69
219,3
50
31,2
09
309
(97,5
22)
224,8
59
(
163,2
48)
(714)
47,8
45
-
(7
,290)
149,9
39
7,7
26
-
58,9
64
17,0
54
11,0
35
(62,2
43)
19,9
26
18,6
24
12,8
31
59,5
88
(23,4
95)
(86,1
05)
278,1
50
-
1,7
25,9
03
Life
1
0,1
24
(
8,8
61)
1
,092,0
67
1
6,8
55
4
8,8
84
4
6,1
91
5,7
02
4
2,6
86
1
9,6
65
1
,262,7
93
584,3
44
8
4,5
13
8,1
36
-
6,1
70
158,5
24
(124,8
95)
1
2,9
72
4
1,2
08
(6
9,4
34)
4
1,9
98
8,6
98
328,5
13
4,7
43
5
2,8
85
3,6
74,4
81
Tota
l 2018
(
334,6
45)
556,6
47
(
190,1
93)
78,3
53
659,0
89
(22,1
98)
40,3
32
(40,1
22)
(
602,0
48)
(13,7
83)
630,0
69
(27,4
42)
(
144,2
98)
(
115,4
19)
80,7
37
(
262,8
06)
1,2
14,1
20
66,2
38
320,8
94
527,5
14
632,8
64
(
619,8
49)
110,6
62
(
129,6
66)
209,8
93
1,0
19,4
32
1,1
48,2
95
352,1
58
(
529,0
36)
7,6
59
(
279,3
45)
-
473,9
37
(
169,5
70)
(
760,8
82)
475,0
46
101,7
63
41,5
76
(97,1
43)
290,7
07
307,4
89
83,4
44
(11,6
93)
(48,2
81)
(
204,3
83)
(
480,5
82)
129,0
08
193,6
22
(
852,6
29)
(
118,4
90)
330,5
82
171,0
08
(
258,3
94)
299,8
17
251,1
20
(96,1
24)
4,3
95,0
54
Genera
l
(334,6
45)
556,6
47
(190,1
93)
78,3
53
659,0
89
-
-
(4
0,1
22)
-
-
630,0
69
-
(8
2,7
36)
(115,4
19)
80,7
37
(299,9
91)
1
,214,1
20
-
359,7
24
527,5
14
632,8
64
-
110,6
62
(129,6
66)
209,8
93
1
,019,4
32
-
179,3
84
(529,0
36)
-
(176,0
47)
-
-
(169,5
70)
-
475,0
46
101,7
63
-
(9
7,1
43)
290,7
07
-
83,4
44
(1
1,6
93)
-
-
(480,5
82)
126,5
28
193,6
22
-
(118,4
90)
330,5
82
113,2
92
(258,3
94)
299,8
17
-
(9
6,1
24)
5,
143,
438
Life
-
-
-
-
-
(2
2,1
98)
40,3
32
-
(602,0
48)
(1
3,7
83)
-
(2
7,4
42)
(6
1,5
62)
-
-
37,1
85
-
66,2
38
(3
8,8
30)
-
-
(619,8
49)
-
-
-
-
1,1
48,2
95
172,7
74
-
7,6
59
(103,2
98)
-
473,9
37
-
(760,8
82)
-
-
41,5
76
-
-
307,4
89
-
-
(4
8,2
81)
(204,3
83)
-
2,4
80
-
(852,6
29)
-
-
57,7
16
-
-
251,1
20
-
(
748,
384)
Tota
l 2019
756,8
59
416,2
65
(62,9
16)
(66,8
19)
862,9
78
78,9
89
68,0
22
(
306,3
48)
3,6
53,9
91
(31,2
47)
339,6
22
167,4
83
(
222,1
92)
(
538,2
97)
(44,6
56)
186,8
60
1,4
55,4
02
156,8
94
447,6
87
854,5
02
1,1
13,6
72
4,2
25,2
92
90,9
64
1,0
31
(
749,9
95)
849,2
80
1,9
91,5
52
(
269,1
22)
(
306,0
54)
70,0
08
5,0
55
12,1
30
478,6
13
7,0
77
(
511,1
68)
482,6
27
57,2
84
(
124,0
66)
8,3
74
307,0
82
288,2
73
(
236,1
09)
32,1
37
73,0
55
(
141,2
63)
(
585,3
76)
104,2
52
23,0
42
964,0
77
8,7
28
332,2
05
66,5
38
(
157,7
09)
1,2
48,5
93
219,7
08
(58,9
77)
1
8,09
3,88
9
Genera
l
756,8
59
416,2
65
(62,9
16)
(66,8
19)
862,9
78
-
-
(306,3
48)
-
-
339,6
22
-
(87,8
20)
(538,2
97)
(44,6
56)
169,6
87
1
,455,4
02
-
406,5
33
854,5
02
1
,113,6
72
-
9
0,9
64
1,0
31
(749,9
95)
849,2
80
-
(550,8
31)
(306,0
54)
-
110,4
12
-
-
7,0
77
-
482,6
27
5
7,2
84
-
8,3
74
307,0
82
-
(236,1
09)
3
2,1
37
-
-
(585,3
76)
8
0,0
82
2
3,0
42
-
8,7
28
332,2
05
6
5,7
90
(157,7
09)
1
,248,5
93
-
(58,9
77)
6,3
28,3
21
Life
-
-
-
-
-
7
8,9
89
6
8,0
22
-
3,6
53,9
91
(31,2
47)
-
167,4
83
(134,3
72)
-
-
1
7,1
73
-
156,8
94
4
1,1
54
-
-
4,2
25,2
92
-
-
-
-
1,9
91,5
52
281,7
09
-
7
0,0
08
(105,3
57)
1
2,1
30
478,6
13
-
(511,1
68)
-
-
(124,0
66)
-
-
288,2
73
-
-
7
3,0
55
(141,2
63)
-
2
4,1
70
-
964,0
77
-
-
7
48
-
-
219,7
08
-
1
1,76
5,56
8
Com
panie
s
AAR
AIG
Alli
anz
Am
aco
APA I
nsu
rance
APA L
ife
Barc
lays
Life
Brita
m G
enera
l
Brita
m L
ife
Capex
Life
CIC
Genera
l
CIC
Life
Corp
ora
te
Direct
line
Fid
elit
y Shie
ld
First
Ass
ura
nce
GA I
nsu
rance
GA L
ife
Gem
inia
Herita
ge
ICEA L
ION
Genera
l
ICEA L
ION
Life
Intr
a A
fric
a
Inve
sco
Jubile
e G
enera
l In
sura
nce
Jubile
e H
ealth I
nsu
rance
Jubile
e
Life
Insu
rance
Kenin
dia
Kenya
Orient
Genera
l
Kenya
Orient
Life
Kenya
n A
lliance
KU
SCO
Mutu
al Ass
ura
nce
Lib
ert
y Li
fe
Madis
on G
enera
l
Madis
on L
ife
Mayf
air
Metr
opolit
anCannon G
enera
l
Metr
opolit
anCannon L
ife
MU
A (
Form
ely
Phoenix
of
E.A
.)
Occ
identa
l
Old
Mutu
al Li
fe
Paci
s
Pio
neer
Genera
l
Pio
neer
Life
Pru
dential Li
fe
Reso
lution
Saham
Sanla
m G
enera
l
Sanla
m L
ife
Taka
ful
Tausi
The M
onarc
h
Trident
UAP G
enera
l
UAP L
ife
Xplic
o
TO
TA
L
No
1 2 3 4 5 6 7 8 9 10
11
12
13
14
15
16
17
18
19
20
21
22
23
24
25
26
27
28
29
30
31
32
33
34
35
36
37
38
39
40
41
42
43
44
45
46
47
48
49
50
51
52
53
54
55
56
Pro
vis
ion
fo
r T
ax
P
rofi
t(Lo
ss)
Be
fore
Ta
x
Pro
fit/(
Lo
ss) A
fter
Tax
Appendix I: Detailed Industry Statement of Comprehensive Income, 2019 in KES ‘000 (continued)

103
2018
(%)
-59.
43
25.5
6
-26.
78
5.06
13.4
4
-4.0
5
7.43
-1.3
4
-8.2
8
-3.7
7
15.2
0
-1.4
3
-13.
85
-12.
07
6.53
-14.
32
28.6
3
21.8
4
14.3
5
17.1
0
14.3
1
-6.4
4
12.6
5
-40.
38
7.09
25.2
2
9.58
8.23
-172
.95
3.58
-16.
20
0.00
17.2
7
-12.
80
-50.
17
17.5
9
12.0
5
13.1
8
-11.
62
22.0
1
14.7
5
8.47
-2.0
3
-5.5
6
-26.
53
285.
81
16.3
0
18.6
2
-40.
40
-22.
91
22.2
0
20.4
9
-14.
40
4.03
13.3
9
-7.5
6
3.68
2019
(%)
70.6
2
19.9
7
-6.2
8
-4.5
4
16.9
9
12.8
0
7.10
-11.
28
37.2
6
-9.9
1
8.04
8.32
-24.
32
-79.
23
-3.8
3
11.1
7
29.0
9
41.5
7
17.4
2
24.6
1
22.4
7
34.5
9
9.69
0.32
-32.
51
30.7
3
30.2
0
-6.7
2
-643
.39
31.6
5
0.30
2.98
17.1
4
0.60
-46.
79
16.6
1
6.41
-69.
55
0.97
19.6
9
12.3
6
-32.
21
4.61
7.23
-15.
92
133.
83
12.2
4
2.21
35.1
1
1.75
18.9
6
7.43
-9.1
6
17.5
4
10.7
6
-4.8
6
15.0
5
2018
(33
4,64
5)
5
56,6
47
(19
0,19
3)
78,3
53
6
59,0
89
(
22,1
98)
40,3
32
(
40,1
22)
(60
2,04
8)
(
13,7
83)
6
30,0
69
(
27,4
42)
(14
4,29
8)
(11
5,41
9)
80,7
37
(26
2,80
6)
1,2
14,1
20
66,2
38
3
20,8
94
5
27,5
14
6
32,8
64
(61
9,84
9)
1
10,6
62
(12
9,66
6)
2
09,8
93
1,0
19,4
32
1,1
48,2
95
3
52,1
58
(52
9,03
6)
7,6
59
(27
9,34
5)
-
4
73,9
37
(16
9,57
0)
(76
0,88
2)
4
75,0
46
1
01,7
63
41,5
76
(
97,1
43)
2
90,7
07
3
07,4
89
83,4
44
(
11,6
93)
(
48,2
81)
(20
4,38
3)
(48
0,58
2)
1
29,0
08
1
93,6
22
(85
2,62
9)
(11
8,49
0)
3
30,5
82
1
71,0
08
(25
8,39
4)
2
99,8
17
2
51,1
20
(
96,1
24)
4,3
95,0
54
2019
756,
859
416,
265
(62,
916)
(66,
819)
862,
978
78,
989
68,
022
(
306,
348)
3,
653,
991
(31,
247)
339,
622
167,
483
(
222,
192)
(
538,
297)
(44,
656)
186,
860
1,
455,
402
156,
894
447,
687
854,
502
1,
113,
672
4,
225,
292
90,
964
1
,031
(
749,
995)
849,
280
1,
991,
552
(
269,
122)
(
306,
054)
70,
008
5
,055
12,
130
478,
613
7
,077
(
511,
168)
482,
627
57,
284
(
124,
066)
8
,374
307,
082
288,
273
(
236,
109)
32,
137
73,
055
(
141,
263)
(
585,
376)
104,
252
23,
042
964,
077
8
,728
332,
205
66,
538
(
157,
709)
1,
248,
593
219,
708
(58,
977)
18,
093,
889
Tot
al 2
018
(Res
tate
d)
563
,138
2
,177
,641
710
,249
1
,549
,444
4
,902
,587
548
,499
542
,537
3
,000
,937
7
,271
,949
365
,873
4
,144
,220
1
,915
,541
1
,041
,704
956
,221
1
,235
,941
1
,835
,486
4
,241
,112
303
,247
2
,236
,627
3
,085
,766
4
,421
,791
9
,627
,077
875
,098
321
,105
2
,959
,473
4
,042
,589
11
,982
,962
4
,281
,490
305
,883
213
,890
1
,724
,805
-
2
,743
,660
1
,324
,952
1
,516
,633
2
,700
,638
844
,375
315
,411
836
,096
1
,320
,839
2
,084
,947
985
,608
576
,489
868
,007
770
,291
-
168
,148
791
,456
1
,040
,114
2
,110
,371
517
,244
1
,488
,851
834
,470
1
,793
,961
7
,443
,356
1
,875
,093
1
,272
,240
119
,271
,836
Tot
al 2
019
1
,071
,798
2
,084
,843
1
,002
,348
1
,472
,899
5
,077
,852
616
,917
957
,704
2
,715
,537
9
,808
,044
315
,422
4
,223
,471
2
,012
,883
913
,739
679
,396
1
,166
,784
1
,673
,380
5
,002
,609
377
,455
2
,570
,383
3
,471
,899
4
,956
,320
12
,216
,581
938
,828
321
,618
2
,307
,000
2
,763
,720
6
,594
,830
4
,002
,177
4
7,56
9
221
,203
1
,686
,723
407
,460
2
,792
,769
1
,170
,601
1
,092
,462
2
,906
,185
893
,932
178
,373
863
,816
1
,559
,905
2
,332
,012
733
,070
697
,589
1
,010
,495
887
,395
-
437
,400
851
,706
1
,044
,532
2
,745
,935
498
,433
1
,752
,540
894
,948
1
,722
,367
7
,119
,001
2
,041
,916
1
,213
,263
120
,245
,237
Gen
eral
1,
071,
798
2,
084,
843
1,
002,
348
1,
472,
899
5,
077,
852
-
-
2,
715,
537
-
-
4,
223,
471
-
713,
690
679,
396
1,
166,
784
1,
673,
380
5,
002,
609
-
2,
226,
387
3,
471,
899
4,
956,
320
-
938,
828
321,
618
2,
307,
000
2,
763,
720
-
3,
222,
416
47,
569
-
1,
308,
497
-
-
1,
170,
601
-
2,
906,
185
893,
932
-
863,
816
1,
559,
905
-
733,
070
697,
589
-
-
-
437,
400
698,
232
1,
044,
532
-
498,
433
1,
752,
540
689,
072
1,
722,
367
7,
119,
001
-
1,
213,
263
71,
573,
999
Life
-
-
-
-
-
616,
917
957,
704
-
9,
808,
044
315,
422
-
2,
012,
883
200,
049
-
-
-
-
377,
455
343,
996
-
-
12,
216,
581
-
-
-
-
6,
594,
830
779,
761
-
221,
203
378,
226
407,
460
2,
792,
769
-
1,
092,
462
-
-
178,
373
-
-
2,
332,
012
-
-
1,
010,
495
887,
395
-
153,
474
-
2,
745,
935
-
-
205,
876
-
-
2,
041,
916
-
48,
671,
238
Tot
al 2
018
(Res
tate
d)
3
,295
,705
5
,976
,941
941
,983
2
,538
,413
10
,367
,778
4
,766
,545
2
,791
,316
9
,064
,394
63
,543
,674
439
,787
8
,704
,619
10
,340
,680
1
,342
,147
4
,610
,648
2
,197
,997
5
,149
,982
8
,188
,726
7
,496
,290
5
,919
,150
6
,114
,567
7
,574
,280
70
,385
,820
1
,028
,972
3
,654
,202
4
,872
,218
4
,441
,846
76
,206
,527
42
,023
,716
2
,412
,103
782
,670
5
,013
,290
-
20
,959
,275
3
,585
,272
11
,148
,390
3
,642
,796
2
,309
,863
2
,107
,663
911
,434
2
,622
,178
11
,910
,249
1
,491
,831
604
,298
6
,139
,852
712
,506
6
,481
,200
3
,245
,690
2
,488
,592
22
,213
,804
1
,586
,806
1
,162
,884
1
,687
,007
3
,523
,591
8
,197
,219
9
,389
,322
1
,139
,863
511
,448
,571
Tot
al 2
019
3
,715
,470
5
,772
,090
1
,255
,273
2
,527
,363
10
,175
,555
5
,332
,951
3
,705
,516
9
,399
,436
77
,938
,579
563
,507
9
,394
,874
12
,566
,608
1
,831
,127
5
,000
,388
2
,316
,994
4
,421
,409
8
,663
,201
10
,747
,634
6
,549
,105
5
,959
,406
8
,113
,323
81
,286
,780
1
,144
,855
3
,789
,864
5
,928
,672
4
,250
,129
76
,768
,877
47
,934
,900
2
,517
,492
1
,065
,136
6
,702
,536
392
,538
21
,788
,441
3
,696
,588
13
,225
,921
3
,924
,991
2
,310
,820
2
,023
,643
922
,471
2
,754
,849
12
,990
,655
2
,046
,594
707
,531
6
,608
,278
905
,071
7
,391
,372
2
,838
,705
2
,469
,094
21
,981
,116
1
,941
,758
1
,240
,160
1
,897
,357
3
,327
,839
8
,795
,357
10
,679
,283
1
,570
,962
565
,770
,444
Gen
eral
3
,715
,470
5
,772
,090
1
,255
,273
2
,527
,363
10
,175
,555
-
-
9
,399
,436
-
-
9
,394
,874
-
1
,063
,948
5
,000
,388
2
,316
,994
4
,421
,409
8
,663
,201
-
4
,788
,258
5
,959
,406
8
,113
,323
-
1
,144
,855
3
,789
,864
5
,928
,672
4
,250
,129
-
9
,035
,963
2
,517
,492
-
3
,642
,282
-
-
3
,696
,588
-
3
,924
,991
2
,310
,820
-
922
,471
2
,754
,849
-
2
,046
,594
707
,531
-
-
7
,391
,372
2
,396
,607
2
,469
,094
-
1
,941
,758
1
,240
,160
1
,464
,681
3
,327
,839
8
,795
,357
-
1
,570
,962
159
,837
,919
Life
-
-
-
-
-
5
,332
,951
3
,705
,516
-
77
,938
,579
563
,507
-
12
,566
,608
767
,179
-
-
-
-
10
,747
,634
1
,760
,847
-
-
81
,286
,780
-
-
-
-
76
,768
,877
38
,898
,937
-
1
,065
,136
3
,060
,254
392
,538
21
,788
,441
-
13
,225
,921
-
-
2
,023
,643
-
-
12
,990
,655
-
-
6
,608
,278
905
,071
-
442
,098
-
21
,981
,116
-
-
432
,676
-
-
10
,679
,283
-
405
,932
,525
Tot
al 2
018
(Res
tate
d)
3
,858
,843
8
,154
,582
1
,652
,232
4
,087
,857
15
,270
,365
5
,315
,044
3
,333
,853
12
,065
,331
70
,815
,623
805
,660
12
,848
,839
12
,256
,221
2
,383
,851
5
,566
,869
3
,433
,938
6
,985
,468
12
,429
,838
7
,799
,537
8
,155
,777
9
,200
,333
11
,996
,071
80
,012
,897
1
,904
,070
3
,975
,307
7
,831
,691
8
,484
,435
88
,189
,489
46
,305
,206
2
,717
,986
996
,560
6
,738
,095
-
23
,702
,935
4
,910
,224
12
,665
,023
6
,343
,434
3
,154
,238
2
,423
,074
1
,747
,530
3
,943
,017
13
,995
,196
2
,477
,439
1
,180
,787
7
,007
,859
1
,482
,797
6
,313
,052
4
,037
,146
3
,528
,706
24
,324
,175
2
,104
,050
2
,651
,735
2
,521
,477
5
,317
,552
15
,640
,575
11
,264
,415
2
,412
,103
630
,720
,407
Tot
al 2
019
4
,787
,268
7
,856
,933
2
,257
,622
4
,000
,262
15
,253
,407
5
,949
,868
4
,663
,220
12
,114
,973
87
,746
,623
878
,928
13
,618
,345
14
,579
,491
2
,744
,866
5
,679
,784
3
,483
,778
6
,094
,789
13
,665
,810
11
,125
,089
9
,119
,488
9
,431
,305
13
,069
,643
93
,503
,361
2
,083
,684
4
,111
,482
8
,235
,672
7
,013
,849
83
,363
,707
51
,937
,077
2
,565
,060
1
,286
,340
8
,389
,259
799
,998
24
,581
,210
4
,867
,189
14
,318
,383
6
,831
,176
3
,204
,752
2
,202
,016
1
,786
,287
4
,314
,754
15
,322
,667
2
,779
,664
1
,405
,120
7
,618
,773
1
,792
,466
6
,953
,972
3
,690
,411
3
,513
,626
24
,727
,051
2
,440
,191
2
,992
,699
2
,792
,305
5
,050
,206
15
,914
,358
12
,721
,199
2
,784
,224
686
,015
,680
Gen
eral
4
,787
,268
7
,856
,933
2
,257
,622
4
,000
,262
15
,253
,407
-
-
12
,114
,973
-
-
13
,618
,345
-
1
,777
,638
5
,679
,784
3
,483
,778
6
,094
,789
13
,665
,810
-
7
,014
,645
9
,431
,305
13
,069
,643
-
2
,083
,684
4
,111
,482
8
,235
,672
7
,013
,849
-
12
,258
,379
2
,565
,060
-
4
,950
,779
-
-
4
,867
,189
-
6
,831
,176
3
,204
,752
-
1
,786
,287
4
,314
,754
-
2
,779
,664
1
,405
,120
-
-
6
,953
,972
3
,094
,839
3
,513
,626
-
2
,440
,191
2
,992
,699
2
,153
,753
5
,050
,206
15
,914
,358
-
2
,784
,224
231
,411
,917
Life
-
-
-
-
-
5
,949
,868
4
,663
,220
-
87
,746
,623
878
,928
-
14
,579
,491
967
,228
-
-
-
-
11
,125
,089
2
,104
,843
-
-
93
,503
,361
-
-
-
-
83
,363
,707
39
,678
,698
-
1
,286
,340
3
,438
,480
799
,998
24
,581
,210
-
14
,318
,383
-
-
2
,202
,016
-
-
15
,322
,667
-
-
7
,618
,773
1
,792
,466
-
595
,572
-
24
,727
,051
-
-
638
,552
-
-
12
,721
,199
-
454
,603
,763
Tot
al 2
018
(Res
tate
d)
563
,138
2
,177
,641
710
,249
1
,549
,444
4
,902
,587
548
,499
542
,537
3
,000
,937
7
,271
,949
365
,873
4
,144
,220
1
,915
,541
1
,041
,703
956
,221
1
,242
,834
1
,835
,486
4
,241
,112
303
,247
2
,236
,625
3
,085
,766
4
,421
,791
9
,627
,077
875
,098
321
,106
2
,959
,473
4
,042
,589
11
,982
,262
4
,281
,490
305
,884
213
,889
1
,724
,805
-
2
,743
,660
1
,324
,952
1
,516
,633
2
,700
,638
844
,374
315
,411
836
,096
1
,320
,839
2
,084
,947
985
,608
576
,487
868
,007
770
,291
(168
,148
)
791
,456
1
,040
,114
2
,110
,371
517
,244
1
,488
,851
834
,470
1
,793
,961
7
,443
,356
1
,875
,093
1
,272
,240
119
,278
,024
Tot
al 2
019
1
,071
,798
2
,084
,843
1
,002
,348
1
,472
,899
5
,077
,852
616
,917
957
,704
2
,715
,537
9
,808
,044
315
,422
4
,223
,471
2
,012
,883
913
,739
679
,396
1
,166
,784
1
,673
,380
5
,002
,609
377
,455
2
,570
,383
3
,471
,899
4
,956
,320
12
,216
,581
938
,828
321
,618
2
,307
,000
2
,763
,720
6
,594
,830
4
,002
,177
4
7,56
9
221
,203
1
,686
,723
407
,460
2
,792
,769
1
,170
,601
1
,092
,462
2
,906
,185
893
,932
178
,373
863
,816
1
,559
,905
2
,332
,012
733
,070
697
,589
1
,010
,495
887
,395
(437
,400
)
851
,706
1
,044
,532
2
,745
,935
498
,433
1
,752
,540
894
,948
1
,722
,367
7
,119
,001
2
,041
,916
1
,213
,263
120
,245
,237
Gen
eral
1,
071,
798
2,
084,
843
1,
002,
348
1,
472,
899
5,
077,
852
-
-
2,
715,
537
-
-
4,
223,
471
-
713,
690
679,
396
-
1,
673,
380
5,
002,
609
-
2,
226,
387
3,
471,
899
4,
956,
320
-
938,
828
321,
618
2,
307,
000
2,
763,
720
-
3,
222,
416
47,
569
-
1,
308,
497
-
-
1,
170,
601
-
2,
906,
185
893,
932
-
863,
816
1,
559,
905
-
733,
070
697,
589
-
-
-
698,
232
1,
044,
532
-
498,
433
1,
752,
540
689,
072
1,
722,
367
7,
119,
001
-
1,
213,
263
70,
844,
615
Life
-
-
-
-
-
616,
917
957,
704
-
9,
808,
044
315,
422
-
2,
012,
883
200,
049
-
1,
166,
784
-
-
377,
455
343,
996
-
-
12,
216,
581
-
-
-
-
6,
594,
830
779,
761
-
221,
203
378,
226
407,
460
2,
792,
769
-
1,
092,
462
-
-
178,
373
-
-
2,
332,
012
-
-
1,
010,
495
887,
395
(
437,
400)
153,
474
-
2,
745,
935
-
-
205,
876
-
-
2,
041,
916
-
49,
400,
622
Com
pani
es
AA
R
AIG
Alli
anz
Am
aco
AP
A In
sura
nce
AP
A L
ife
Bar
clay
s Li
fe
Brit
am G
ener
al
Brit
am L
ife
Cap
ex L
ife
CIC
Gen
eral
CIC
Life
Cor
pora
te
Dire
ctlin
e
Fid
elity
Shi
eld
Firs
t Ass
uran
ce
GA
Gen
eral
GA
Life
Gem
inia
Her
itage
ICE
A L
ION
Gen
eral
ICE
A L
ION
Life
Intra
Afri
ca
Inve
sco
Jub
ilee
Gen
eral
Insu
ranc
e
Jub
ilee
Hea
lth In
sura
nce
Jub
ilee
Life
Insu
ranc
e
Ken
indi
a
Ken
ya O
rient
Gen
eral
Ken
ya O
rient
Life
Ken
yan
Alli
ance
KU
SC
O M
utua
l Ass
uran
ce
Lib
erty
Life
Mad
ison
Gen
eral
Mad
ison
Life
May
fair
Met
ropo
litan
Can
non
Gen
eral
Met
ropo
litan
Can
non
Life
MU
A (F
orm
ely
Pho
enix
of E
.A.)
Occ
iden
tal
Old
Mut
ual L
ife
Pac
is
Pio
neer
Gen
eral
Pio
neer
Life
Pru
dent
ial L
ife
Res
olut
ion
Sah
am
San
lam
Gen
eral
San
lam
Life
Tak
aful
Tau
si
The
Mon
arch
Trid
ent
UA
P G
ener
al
UA
P L
ife
Xpl
ico
No
1 2 3 4 5 6 7 8 9 10 11 12 13 14 15 16 17 18 19 20 21 22 23 24 25 26 27 28 29 30 31 32 33 34 35 36 37 38 39 40 41 42 43 44 45 46 47 48 49 50 51 52 53 54 55 56 TO
TAL
Ret
urn
on C
apita
l
Em
ploy
edP
rofit
/Los
s be
fore
Tax
Net
Ass
ets
Tota
l Lia
bilit
ies
Tota
l Ass
ets
Sha
re H
olde
rs C
apita
l, Li
fe F
und
& R
eser
ves
Appendix II: Detailed Industry Statement of Financial Position, 2019 in KES ‘000

104
AKI Members 2019 No Name Of Company Type Of Company Physical Address Tel. Number Email Address
1. AAR Insurance Company Ltd General Insurance Real Towers , Box 41766, Nairobi 2895000 [email protected]
2. Absa Life Assurance Kenya Ltd Life Insurance Acacia Building Westlands Office Park Of Waiyaki way Box 1140 00100 4209000 [email protected]
3. Africa Merchant Assurance Ltd General Insurance 4th Nextgen Mall Mombasa Rd, Box 61599-00200, Nairobi 2204000 [email protected]
4. AIG Kenya Insurance Company Ltd General Insurance AIG House, Eden Square Complex, Chiromo road, Box 49460-00100, Nairobi 3676000 [email protected]
5. Allianz Insurance Co of Kenya Ltd General Insurance Cavendish Block -96 Riverside 204231400 [email protected]
6. APA Insurance Company Ltd General Insurance Apollo Centre, Ring Road, Box 30389-0100, Nairobi 2862000 [email protected]
7. APA Life Assurance Ltd Life Insurance Apollo Canter, Ring Road, Box 30065-0100, Nairobi 3641000 [email protected]
8. Britam General Insurance Kenya Ltd General Insurance Renaissance Corporate Park Elgon Rd Britam, 30375-00100, Nairobi 4904000 [email protected]
9. Britam Life Assurance Kenya Ltd Life Insurance Britam Centre, Mara/Ragati Road, 30375-00100, Nairobi 2833000 [email protected]
10. Capex Life Assurance Company Ltd Life Insurance Galana Plaza,Kilimani Box 12043-00400, Nairobi 2712384/5 [email protected]
11. CIC General Insurance Company Ltd General Insurance CIC Plaza, Mara Road, Box 59485-00200, Nairobi 2823000 [email protected]
12. CIC Life Assurance Company Ltd Life Insurance CIC Plaza, Mara Road, Box 59485-00100, Nairobi 2823000 [email protected]
13. Corporate Insurance Company Ltd Composite International House , Mama Ngina St, Box 34172-00100, Nairobi 2717617 [email protected]
14. Directline Assurance Company Ltd General Insurance Hazina Towers ,17th Floor, Monrovia Street, Box 40863-00100, Nairobi 3250000 [email protected]
15. Fidelity Shield Insurance Company Ltd General Insurance Equatorial Fidelity centre Waridi line, Box 47435-00100, Nairobi 4225000 [email protected]
16. First Assurance Company Ltd General Insurance First Assurance House, Gitanga Road, 30064-00100, Nairobi 2692250 [email protected]
17. GA Insurance Company Ltd General Insurance GA Insurance House, Ralph Bunche Road, Box 42166-00100, Nairobi 2711633 [email protected]
18. Geminia Insurance Company Ltd Composite LE’MAC 5th Floor, Church Roar, Box 61316-00200, Nairobi 2782000 [email protected]
19. Heritage Insurance Company Ltd General Insurance Liberty House, Mamlaka Road, Box 30390-00100, Nairobi 2783000 [email protected]
20. ICEA LION General Insurance Co Ltd General Insurance ICEA LION Centre, Riverside Park, Chiromo Road, Westlands, Box 30190-00100, Nairobi 2750000 [email protected]
21. ICEA LION Life Assurance Co Ltd Life Insurance ICEA LION Centre, Riverside Park, Chiromo Road, Westlands, Box 46143-00100, Nairobi 2750000 [email protected]
22. Intra Africa Assurance Company Ltd General Insurance Laxcom Plaza, 9th Floor, Narayan Road, Parklands , Box 43241-00100, Nairobi 2712610 [email protected]
23. Invesco Assurance Company Ltd General Insurance Bishop Magua Center, 3rd Floor, George Padmore Lane, off Ngong Road, Box 52964-00200, Nairobi
2605220 [email protected]
Jubilee General Insurance Company Ltd General Insurance Jubilee Insurance House, 6th Floor, Mama Ngina Street, Box 30376-00100, Nairobi 0709949000 [email protected]
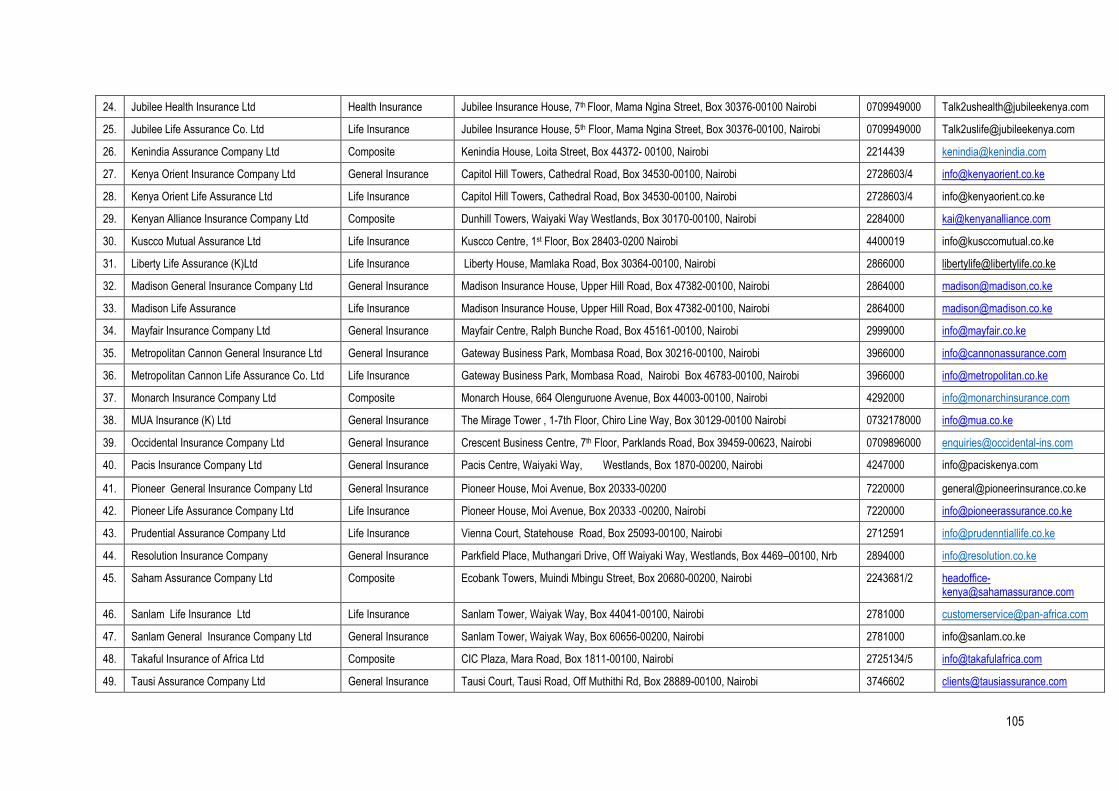
105
24. Jubilee Health Insurance Ltd Health Insurance Jubilee Insurance House, 7th Floor, Mama Ngina Street, Box 30376-00100 Nairobi 0709949000 [email protected]
25. Jubilee Life Assurance Co. Ltd Life Insurance Jubilee Insurance House, 5th Floor, Mama Ngina Street, Box 30376-00100, Nairobi 0709949000 [email protected]
26. Kenindia Assurance Company Ltd Composite Kenindia House, Loita Street, Box 44372- 00100, Nairobi 2214439 [email protected]
27. Kenya Orient Insurance Company Ltd General Insurance Capitol Hill Towers, Cathedral Road, Box 34530-00100, Nairobi 2728603/4 [email protected]
28. Kenya Orient Life Assurance Ltd Life Insurance Capitol Hill Towers, Cathedral Road, Box 34530-00100, Nairobi 2728603/4 [email protected]
29. Kenyan Alliance Insurance Company Ltd Composite Dunhill Towers, Waiyaki Way Westlands, Box 30170-00100, Nairobi 2284000 [email protected]
30. Kuscco Mutual Assurance Ltd Life Insurance Kuscco Centre, 1st Floor, Box 28403-0200 Nairobi 4400019 [email protected]
31. Liberty Life Assurance (K)Ltd Life Insurance Liberty House, Mamlaka Road, Box 30364-00100, Nairobi 2866000 [email protected]
32. Madison General Insurance Company Ltd General Insurance Madison Insurance House, Upper Hill Road, Box 47382-00100, Nairobi 2864000 [email protected]
33. Madison Life Assurance Life Insurance Madison Insurance House, Upper Hill Road, Box 47382-00100, Nairobi 2864000 [email protected]
34. Mayfair Insurance Company Ltd General Insurance Mayfair Centre, Ralph Bunche Road, Box 45161-00100, Nairobi 2999000 [email protected]
35. Metropolitan Cannon General Insurance Ltd General Insurance Gateway Business Park, Mombasa Road, Box 30216-00100, Nairobi 3966000 [email protected]
36. Metropolitan Cannon Life Assurance Co. Ltd Life Insurance Gateway Business Park, Mombasa Road, Nairobi Box 46783-00100, Nairobi 3966000 [email protected]
37. Monarch Insurance Company Ltd Composite Monarch House, 664 Olenguruone Avenue, Box 44003-00100, Nairobi 4292000 [email protected]
38. MUA Insurance (K) Ltd General Insurance The Mirage Tower , 1-7th Floor, Chiro Line Way, Box 30129-00100 Nairobi 0732178000 [email protected]
39. Occidental Insurance Company Ltd General Insurance Crescent Business Centre, 7th Floor, Parklands Road, Box 39459-00623, Nairobi 0709896000 [email protected]
40. Pacis Insurance Company Ltd General Insurance Pacis Centre, Waiyaki Way, Westlands, Box 1870-00200, Nairobi 4247000 [email protected]
41. Pioneer General Insurance Company Ltd General Insurance Pioneer House, Moi Avenue, Box 20333-00200 7220000 [email protected]
42. Pioneer Life Assurance Company Ltd Life Insurance Pioneer House, Moi Avenue, Box 20333 -00200, Nairobi 7220000 [email protected]
43. Prudential Assurance Company Ltd Life Insurance Vienna Court, Statehouse Road, Box 25093-00100, Nairobi 2712591 [email protected]
44. Resolution Insurance Company General Insurance Parkfield Place, Muthangari Drive, Off Waiyaki Way, Westlands, Box 4469–00100, Nrb 2894000 [email protected]
45. Saham Assurance Company Ltd Composite Ecobank Towers, Muindi Mbingu Street, Box 20680-00200, Nairobi 2243681/2 [email protected]
46. Sanlam Life Insurance Ltd Life Insurance Sanlam Tower, Waiyak Way, Box 44041-00100, Nairobi 2781000 [email protected]
47. Sanlam General Insurance Company Ltd General Insurance Sanlam Tower, Waiyak Way, Box 60656-00200, Nairobi 2781000 [email protected]
48. Takaful Insurance of Africa Ltd Composite CIC Plaza, Mara Road, Box 1811-00100, Nairobi 2725134/5 [email protected]
49. Tausi Assurance Company Ltd General Insurance Tausi Court, Tausi Road, Off Muthithi Rd, Box 28889-00100, Nairobi 3746602 [email protected]

106
50. Trident Insurance Company Ltd General Insurance Capitol Hill Towers, Cathedral Road, Box 55651-00200, Nairobi 2721710 [email protected]
51. UAP Insurance Company Ltd General Insurance UAP Old Mutual Towers, Upper Hill Road, Box 43013-00100, Nairobi 2850000 [email protected]
52. UAP Life Assurance Company Ltd Life Insurance UAP Old Mutual Towers, Upper Hill Road, Box 43013-00100, Nairobi 2850000 [email protected]
53. UAP Old Mutual Life Assurance Company Ltd Life Insurance UAP Old Mutual Towers, Upper Hill road Box 30059-00100, Nairobi 2829000 [email protected]
54. Xplico Insurance Company Ltd General Insurance Park Place 5th Floor, Limuru Road, Box 38106-00623, Nairobi 3642000 [email protected]
Associate Members 1 Africa Reinsurance Corporation Ltd Africa Re Centre, Upper hill, Nairobi, Box 62328-00200, Nairobi 297000 [email protected]
2 East Africa Reinsurance EARe House, 98 Riverside Drive, Box 20196-00200 Nairobi 4084000 [email protected]
3 Kenya Reinsurance Corporation Ltd Reinsurance Plaza, Box 30271-00100 2202000 [email protected]
4 ZEP-RE (PTA) Reinsurance Co ZEP-Re Place Longon0t Road, Box 42678-00100, Nairobi 4973000 [email protected]
Other Key Stakeholders 1 Insurance Regulatory Authority (IRA) Zep-Re Place, Upper hill, Nairobi, Box 43505-00100, Nairobi 4996000 [email protected]
2 Regulatory Benefits Authority (RBA) Rahimtulla Tower, 13th Floor, Upper Hill Road, Opp UK High Commission. P.O. Box 57733 – 00200 Nairobi, Kenya.
2809000 [email protected]
3 Association of Insurance Brokers of Kenya AIBK) College of Insurance, Off Mombasa Road, South C, Box 56928-00200, Nairobi 0707209856 [email protected]
4 College of Insurance (COI) College of Insurance, Off Mombasa Road, South C, Box 56928-00200, Nairobi 0722509759 [email protected]
5 Insurance Institute of Kenya (IIK) College of Insurance, Off Mombasa Road, South C, Box 1200-00200, Nairobi 2106898 [email protected]