association of hla-drb1*1501 tagging rs3135388 gene
TRANSCRIPT

i
ASSOCIATION OF HLA-DRB1*1501 TAGGING rs3135388
GENE POLYMORPHISM WITH MULTIPLE SCLEROSIS
SUSCEPTIBILITY
Thesis submitted for the partial fulfilment for the requirement of
the degree of DM Neurology
DR. ARUN. K
DM NEUROLOGY RESIDENT
2014–2016
DEPARTMENT OF NEUROLOGY
SREE CHITRA TIRUNAL INSTITUTE FOR MEDICAL
SCIENCES AND TECHNOLOGY, TRIVANDRUM, KERALA 695011

ii
DECLARATION
I, Dr. Arun K hereby declare that the thesis “ASSOCIATION OF
HLADRB1*1501 TAGGING rs3135388 GENE POLYMORPHISM WITH
MULTIPLE SCLEROSIS SUSCEPTIBILITY” was undertaken by me under the
guidance and supervision of Dr C. Sarada, Professor, Department of Neurology at
the Sree Chitra Tirunal Institute for Medical Sciences and Technology,
Thiruvananthapuram.
Dr.Arun K
Thiruvananthapuram Senior Resident
Date: Dept. of Neurology
SCTIMST
Thiruvananthapuram

iii
CERTIFICATE
This is to certify that the thesis titled “ASSOCIATION OF HLA-
DRB1 *1501 TAGGING rs3135388 GENE POLYMORPHISM
WITH MULTIPLE SCLEROSIS SUSCEPTIBILITY”, is the
bonafide work of Dr Arun K, Senior Resident, DM Neurology and has
been done under my direct guidance and supervision at the Sree Chitra
Tirunal Institute for Medical Sciences and Technology,
Thiruvananthapuram. He has shown keen interest in the research project
and actively participated in all its phases.
Thiruvananthapuram Dr. C. Sarada (Guide)
Date: Professor,
Department of Neurology,
SCTIMST. Thiruvananthapuram
Dr.Moinak Banerjie, (Co-guide)
Human Molecular Genetics Laboratory
Rajiv Gandhi Centre for Biotechnology,
Thiruvananthapuram

iv
CERTIFICATE
This is to certify that the thesis titled “ASSOCIATION OF
HLA-DRB1*1501 TAGGING rs3135388 GENE POLYMORPHISM
WITH MULTIPLE SCLEROSIS SUSCEPTIBILITY”, has been
prepared by Dr. Arun K, Senior Resident, DM Neurology under the
direct guidance and supervision of Dr C. Sarada,, Professor, Department
of Neurology, Sree Chitra Tirunal Institute for Medical Sciences and
Technology, Thiruvananthapuram. She has shown keen interest in
preparing this thesis.
Thiruvananthapuram Dr.Muralidharan Nair,
Date: 03/10/2015 Professor and Head,
Department of Neurology, SCTIMST

v
ACKNOWLEDGEMENT
I take this opportunity to express my sincere gratitude to Dr. Sarada, Professor
of Neurology SCTIMST, my guide for the study, for her expert guidance, constant
review, kind help and keen interest at each and every step of the study .
I express my sincere gratitude to Dr. Moinak Banerjie, Molecular human genetics
Scientist, Rajiv Gandhi Center for Biotechnology, co-guide for my study for expert
advice and review, encouragement and support for the study.
I express my sincere gratitude to Dr.Muralidharan Nair, Senior Professor and Head,
Department of Neurology for his guidance, encouragement and valuable suggestions
during the period of the study.
I express my sincere thanks to Dr. Sruthi S Nair, Assistant Professor, Department of
Neurology for her constant help and assistance in evaluating the thesis till the final step.
I extend my thanks to Mr. Shafeeque, PhD Student Rajiv Gandhi Centre for
Biotechnology, my colleagues and also the staff at the Medical records department, my
parents and my wife for their valuable input and assistance to the study.
I also extend my gratitude to all our patients and their caregivers
Dr Arun K
Senior Resident
Department of Neurology
SCTIMST

vi
CONTENTS
Sl. No. Title Page No.
1 Introduction
2 Review of Literature 3
3 Aim of The Study 27
4 Materials And Methods 28
5 Results 35
6 Discussion 56
7 Conclusion 67
8 Limitations 69
9 References 70
10 Annexures
IEC Approval
Proforma
Consent Form
Master Chart

Introduction
1
INTRODUCTION
Multiple sclerosis (MS) is an autoimmune disease of the central nervous
system characterized by chronic inflammation, demyelination, gliosis, and neuronal
loss. The course of the disease can be relapsing-remitting or progressive. Lesions of
MS typically develop at different times and in different central nervous system
locations. Majority of the patients are unemployed and disabled within 15 years of
diagnosis of the disease and rates of depression, suicide, and divorce are
substantially increased compared with the healthy population. About 50% of all
patients need assistance for activities of daily living within 20 years of diagnosis,
and approximately 50% of patients eventually develop substantial cognitive deficits.
The disease often starts between 20 and 40 years of age, and affects women more
frequently than men. According to the MS database, worldwide about 2·5 million
people have MS, and figures from the MS International Federation states that in
Europe alone the disease costs more than €15 billion / year in terms of direct health-
care costs and lost productivity.
Although the precise etiology of MS remains unknown, in the recent years
the data on the genetic variants affecting the development of the disease has grown
substantially. Association with the human leukocyte antigen (HLA) genes has been
confirmed in virtually all populations studied and the DRB1*1501 allele has been
established as the main risk factor. In a collaborative GWAS it was proven that
HLA-DRB1* 1501 has the strongest association with MS, with a consistent
influence within the cohort (P=1×10-320
, OR=3. 1)3. Stratification for this known risk
factor is expected to aid in the identification of additional susceptibility factors and

Introduction
2
to help discover their interactions. It is therefore reasoned that a simple and
straightforward assay to establish DRB1*1501 genotype without the need for more
elaborate classical HLA-DRB1 typing would be of immense value. Major efforts
addressing the genetic variation across the major histocompatibility complex have
confirmed the extremely polymorphic nature of the HLA-DRB1 gene. This
exceptional degree of polymorphism contributes to the high failure rate of
genotyping assays in this region. Zivkovic et al (2009) 18
found significantly higher
frequency of rs3135388 A allele carriers in MS patients than in control group.
Similar studies by Alcinia (2012)30
et al and Benesova et al (2013)6 also reported
that rs3135388 gene polymorphism is a strong risk factor for MS susceptibility.
Typing this SNP, they found a correlation coefficient (r2) of 0. 97 between
rs3135388*A and HLADRB1*1501. Aiming to reduce time and expenses in HLA
MS risk allele genotyping, the present study has been designed for detection of HLA
rs3135388 SNP and its association with MS susceptibility in South Indian
population.

Review of Literature
3
REVIEW OF LITERATURE
Introduction
Multiple sclerosis (MS) was initially described as a demyelinating disorder
that predominantly affects the white matter tracts within the central nervous system.
However the diagnosis, categorization, and treatment of multiple sclerosis (MS) and
other demyelinating diseases have shifted over the past decade, and many of the
fundamental principles of MS pathogenesis and clinical course are being rewritten.
MS is no longer considered intrinsically a “white matter disease,” as it is now
recognized to be a disease affecting gray matter as pervasively as white. Indeed,
gray matter involvement is likely a better predictor of clinical course and disability
than the white matter lesions that have long been considered the imaging hallmark
of this disease31
. MS is no longer thought to be a purely T-cell driven disease, as
both pathologic and clinical trial data implicate B-cell involvement in MS
pathogenesis and as an apt therapeutic target. And MS is now understood to be a
disease affecting cognition often and early in the course, rather than rarely and as a
late consequence of disease. MS has been a treatable disease since the regulatory
approval of disease-modifying therapies in the 1990s, but the explosion of
therapeutics in the past 10 years is unprecedented and has brought with it both great
opportunities and great challenges for optimal patient outcomes7.
The variability in clinical presentation is well known in patients with MS.
Lesions of MS typically develop at different times and in different central nervous
system (CNS) locations (i. e., MS is said to be disseminated in time and space).
Approximately 350,000 individuals in the United States and 2. 5 million individuals
worldwide are affected with MS31
.

Review of Literature
4
Clinical Manifestations of MS
The clinical course can be extremely variable, ranging from a benign
condition to a rapidly evolving and incapacitating disease requiring profound
lifestyle adjustments. MS is approximately threefold more common inwomen. The
age of onset is typically between 20 and 40 years, but the disease can presentacross
the lifespan. Approximately 10% of cases begin before age18 years, and a small
percentage of cases begin before10 years of age31.
Acute demyelinating optic neuritis is the presenting symptom in about 20%
of MS patients. Weakness affects up to 80-90% of MS patients in the disease course.
The brainstem is commonly affected in MS. The clinical syndromes produced by
brainstem involvement in MS include: double vision, internuclear ophthalmoplegia,
facial weakness or myokymia, vertigo or bulbar symptoms and facial sensory
impairment. Involvement of cerebellar networks that connectwith the brainstem can
lead to unilateral ataxia, dysmetria or dysdiadochokinesia. Acquired pendular
nystagmus in MS is believed to be caused by a disruption of the cerebellopontine
networks. The myelitis that occurs in MS is typically partial and usually presents sub
acutely7. Tonic spasms are also seen in association with spinal cord and brainstem
lesions. Numbness and paresthesias are common sensory symptoms experienced by
patients with multiple sclerosis. Sensory complaints affect 80-90% of MS patients at
some point in the course of disease and can be presenting syndrome in 30-40%. Pain
and other unpleasant sensations were reported as troubling symptoms by 50-55% of
MS patients with Lhermitte‟s symptom occurring in up to one-third. Subtle
cognitive impairment can occur in 40–70% of MS patients. The most commonly
affected cognitive domains are slowed information processing, executive

Review of Literature
5
dysfunction, and impairment of long-term verbal and visual memory. Major
depression occurs in about 30–45% of MS patients during the disease course.
Fatigue is one of the most debilitating symptoms in MS and has been reported as a
current symptom in 80-85% of patients. Neurogenic bladder and lower urinary tract
impairment is an important cause of disability in MS. One of the most common
manifestations of neurogenic bladder in MS is detrusor hyperreflexia which is
present in about two-thirds of MS patients and about 20–25% exhibit symptoms of
urinary frequency and incomplete emptying. The most difficult urinary condition to
manage in MS is that of detrusor-sphincter dyssynergia. Bowel dysfunction in MS is
less common and constipation is the most frequent manifestation. Sexual
dysfunction is reported to affect up to one third of patients and up to 75-80% of men
and 50–70% of women which include erectile dysfunction in men and loss of libido
and/or fatigue in women. Heat characteristically aggravates MS symptoms. About
two-thirds of MS patients complain of headaches and are attributable to migraine.
Transient worsening of MS symptoms can occur in the context of infection and
stressors31
.

Review of Literature
7
1. Relapsing-remitting (RR) MS: Clearly defined relapses with full recovery or with
sequelae and residual deficit on recovery. The periods between disease relapses are
characterized by a lack of disease progression.
2. Secondary progressive (SP) MS: Initial relapsing-remitting disease course
followed by progression with or without occasional relapses, minor remissions, and
plateaus.
3. Primary progressive (PP) MS: Disease progression from onset, with occasional
plateaus and temporary minor improvements allowed.
4. Progressive relapsing (PR) MS: Progressive disease from onset, with clear acute
relapses with or without full recovery. The periods between relapses are
characterized by continuing progression. 31
Pathophysiology of MS
The symptoms and signs of MS are the manifestations of the pathological
process seen in the CNS, namely demyelination and a moderate degree of axonal
loss. Demyelination interrupts current flow by removing the insulator of internodal
axon current flow. Long segments of demyelination can result in interruption of
current flow. The low density of internodal Na+ channels, at least in the early stages
of demyelination, inhibits impulse propagation. If conduction does occur, it is at a
much reduced speed (5% to 10% of normal). The refractory period of demyelinated
axons is prolonged, and repetitive volleys may be blocked when encountering an
axon segment in arefractory period. 31
Persistent neurological deficits or negative
symptoms of MS are caused by regions in which conduction block persists, such as
in regions of large plaques, whereas transient worsening of function reflects a drop
below the safety threshold for conduction because of physiological changes

Review of Literature
8
involving the partially demyelinated axon (Uhthoff phenomenon, worsening with
increased body temperature). Symptoms or signs may also arise from slowed
conduction, producing temporal dispersion at time-critical synapses. Conduction
block is absolute in transected axons. Mechanical stimulation of demyelinated axons
can generate de novo action potentials in the axon and may explain the Lhermitte‟s
sign, electric shock like sensations on flexing the neck. Spontaneous action
potentials have been recorded from demyelinated axons and, if present in the CNS,
could explain paroxysmal-positive symptoms of MS31
.
Pathology
The pathological hallmark of MS is the cerebral or spinal plaque, which
consists of a discrete region of demyelination with relative preservation of axons,
although spectroscopic and pathological studies suggest some axonal loss may be an
integral part of the disease process. Plaques may be visible on the surface of the
spinal cord on inspection. The cut surface of the brain reveals the plaques, which
when active, appear whitish yellow or pink with somewhat indistinct borders. Older
plaques appear translucent with a blue-gray discoloration and sharply demarcated
margins. Plaques develop in a perivenular distribution and are seen most frequently
in the periventricular white matter, brainstem, and spinal cord. One of the earliest
features of acute MS lesions is a disruption of the blood–brain barrier (BBB). It can
carry water, proteins, antibodies, and cytokines (and gadolinium) into the brain. The
fate of oligodendroglia in MS lesions is disputed. Consensus is that oligodendroglia
numbers are reduced proportionate to myelin loss in the plaque center, whereas at
the plaque edge, oligodendroglia are preserved or even increased, suggesting an
attempt at remyelination. Activated T cells and the microglia-macrophages can

Review of Literature
9
contribute to tissue injury via non-antigen-restricted mechanisms. Each of these cell
types releases an array of soluble factors that can contribute to tissue injury,
including oligodendroglia. B cells and Ig are also found in MS lesions. To date, no
specific antibody has been identified in MS, but antimyelin antibodies have been
shown to enhance disease severity in the experimental allergic encephalomyelitis
(EAE) model, suggesting that both cellular and humoral mechanisms may be needed
for full expression of immune injury. Histological examination of active plaques
reveals perivascular infiltration of lymphocytes (predominantly T cells) and
macrophages, with occasional plasma cells. In the plaque, myelin is disrupted,
resulting in myelin debris found in clumps or within lipid-laden macrophages.
Macrophages appear to have an integral role in stripping myelin lamellae from
axons. Reactive astrocytes are prominent in plaques. Immunohistochemical studies
have found increased levels of cytokines in active plaques, indicative of on going
immunore activity. Chronic inactive plaques are hypocellular and show astrocytic
proliferation with denuded axons and an absence of oligodendroglia. Axonal loss of
variable degree may be detected. Recent pathological studies have focused on the
gray matter in MS and have found a lesion load within the cortex and deep gray
structures. The nature of the intracortical plaques differs from those seen in white
matter because there is less inflammation but considerable reactive microgliosis31
.
Risk factors for MS
Several viral and bacterial peptides share structural similarities with
important proteins of myelin, and a few of them are able to activate specific T-cell
clones derived from patients with MS. Myelin basic protein (MBP) has long been
considered one of the primary candidates for an autoimmune attack. Several other

Review of Literature
10
myelin proteins are also candidates for an autoimmune attack. Proteolipid protein
accounts for 50% of CNS myelin protein and is an integral membrane protein of the
myelin leaflets. Myelin-associated glycoprotein, myelin oligodendrocyte
glycoprotein, and cyclic nucleotide phosphodiesterase are proteins that account for a
few percent of myelin7. Although the possibility of autoimmunity as the causal
mechanism for MS exists, the issue is not proven. The evidence for MS being a
dysimmune condition is more compelling, with alterations in immune cell repertoire
and activation state both in blood and CSF of MS patients compared to others. In
recent decades pathogens such as human herpesvirus 6 (HHV6), Epstein–Barr virus
(EBV), and Chlamydia pneumoniae have been the focus of interest as potential
triggers for MS. Potential mechanisms invoking EBV in the development of MS
include an inappropriate autoreactive immune response as the result of molecular
mimicry or a more direct role of the EBV promoting persistent inflammation in the
central nervous system. Although there is no definitive evidence for vitamin D
deficiency as a causative factor in the pathogenesis of multiple sclerosis, low levels
of vitamin D have now been associated with an increased risk for MS in many
different studies. This led to the hypothesis that decreasing levels of vitamin D,
related to lower levels of sun exposure, could explain this phenomenon. The
association between smoking and an increased risk for MS has been established with
evidence from multiple case control studies. There is also evidence, that smokers
have a more severe course than nonsmokers. Smoking is thought to be a direct
neurotoxin, but also may bring about immunomodulatory changes that promote
inflammation31
.

Review of Literature
11
Genetics of Multiple sclerosis
The Major Histocompatibility complex
Although associations between multiple sclerosis and variation in the genes
encoding human leucocyte antigens (HLAs) contained within the major
histocompatibility complex have been recognized for several decades, the extreme
polymorphism and extensive linkage disequilibrium that characterize this region
make the identification of these associations difficult. However, in the recent years
the advent of high-throughput typing for single-nucleotide polymorphisms (SNPs),
have enabled the study of several individuals, which in turn has allowed substantial
progress to be made in this field. It is now established that the association with the
haplotype exerting the greatest effect on risk is driven by the HLA-DRB1*15:01
allele, and that association with the other alleles of this haplotype is secondary only
to their linkage disequilibrium with HLA-DRB1*15:01. Although these SNP-based
studies have not yet provided convincing data to support the existence of complex
interactions between these alleles and haplotypes, such interactions have been
proposed in many studies. Such interactions almost does occur, but theoretical
calculations points that very large sample sizes will be needed to reliably identify
their nature and establish the alleles involved.
A large GWAS was conducted as part of the Wellcome Trust Case Control
Consortium 2 (WTCCC2) project, cases recruited through the International Multiple
Sclerosis Genetics Consortium (IMSGC) and they found that DRB1*15:01 has the
strongest association with multiple sclerosis amongst all classical and SNP alleles (p
<1×10‾³²º). Conditioning on DRB1*15:01, they confirmed the presence of
aprotective Class I allele and identified the signal as being driven by HLA-A*02:01

Review of Literature
12
(p = 9. 1×10‾²³) and conditioning on both DRB1*15:01 and A*02:01 disclosed
additional risk associated with the strongly linked alleles DRB1*03:01 and
DQB1*02:01 (p = 3. 6×10‾¹°)3.
Studies in Lithuanian population, showed that HLA DRB1*1501 allele were
frequently associated in patients with progressive MS, with the beginning of the
disease, female gender and a very bad prognosis2. Smestad et al. (2007)
34, Hensiek
et al (2002)12
, Van der Walt et al (2011)2, , Wu et al. (2010)
36 have previously
proposed that this allele may be strongly associated with the disease, its first
symptoms in younger individuals and more aggressive manifestations. However,
Romero-Pinel et al (2011)33
haven‟t found any significant association between age
of MS development and the different HLA alleles in the Spanish population. On the
contrary, studies conducted by Masterman et al, 200051
; Smestad et al. , 200734
;
Hensiek et al. , 200212
found a significant association between a lower age at onset
and the HLA-DR15 haplotype.
Balnyte et al. (2013)2 published that, in more than 80% of Lithuanian
patients with MS, oligo clonal Bands (OCBs) were detected in their cerebrospinal
fluid (CSF). Other studies in Australia (Wu et al. , 2011)36
, Turkey (Idiman et al. ,
2009)38
, and Spain (Romero-Pinel et al. , 2011)33
also reported similar conclusions.
OCBs were more frequently found in those patients with HLA DRB1*15 allele. The
study of Romero-Pinel et al. (2011)33
also showed the association between HLA
DRB1*15 and oligoclonal bands in MS, in the Spanish population - as the reports of
Kikuchi et al. (2003)39
, Wu et al. (2010)36
, Imrel et al. (2006)42
.
In Sardinia, where MS have a high incidence, a genomic association study of
the Inter- national Multiple Sclerosis Genetic Consortium, in 2011, confirmed that

Review of Literature
13
DRB1*1501 is the most significant genetic factor for developing MS. Subsequently
small number of studies in non-European populations, reported lower prevalence of
DRB1*1501 allele in MS patients. On contarary, studies conducted by Masterman et
al. , 200051
; Barcellos et al. , 20064; Hensiek et al. , 2002
12; Weinshenker et al.
37,
1998and Runmarker et al. ,52
1994 haven‟t found any association between DRB1*15
allele and the severity of the disease. Meanwhile, and Wu et al. (2010)36
, in dis-
agreement have reported that patients with positive HLA DRB1*15 were related to a
worst prognosis, not a better one. In Irish patients, HLA-DR15 positivity were
associated with earlier beginning of MS and to female gender. Irizar et al. (2012)54
,
studying the Japanese population, reported that HLA DRB1*15 allele confers
greater risk of MS only for women.
Kollaee et al. (2012)32
compared the alleles of HLA-DRB1*15 in the Iranian
population, and reported that this allele is associated with relapsing–remitting
multiple sclerosis (RRMS), compared to the control group. This findings were
consistent with some other reports in Iranian relapsing–remitting and primary
progressive MS patients (Kalanie et al. , 200058
), but it is inconsistent with the study
conducted by Amir-Zargar et al. (199859
).
Kollae et al. (2012)32
, also pointed that the HLA DRB1*1501 allele is not the
only predisposing factor to MS. In MS patients, the odds ratio (OR = 7. 792) for the
DRB1*1501-DQB1*0602 haplotype have shown to be more significant in the
patients that present the DRB1*1501 allele alone (OR = 3. 203). Studies conducted
by Cocco et al (2012)43
in the Sardinian population have confirmed that a higher MS
susceptibility is associated with the*13:03-*03:01 (OR = 2. 9), *04:05- *03:01 (OR
= 2. 4) and *03:01-*02:01 (OR = 2. 1) haplotypes. The *16:01-*05:02 haplotype,

Review of Literature
14
presenting in its recessive form in Sardinian population besides the *15:02-*06:01
haplotype, are negatively associated to MS susceptibility. Jones et al. (2006)
suggested that the associations between the DRB1 and DQB1 alleles may influence
the severity of the disease through unknown mechanisms. Dyment et al. (2005)10
,
Ramagopalan et al. (2007)25
, Barcellos et al. (2003)4and Barcellos et al. (2006)
5
reported that some alleles influence the effect of *1501 in MS susceptibility. The
presence of two copies of *1501 represents a higher risk of MS. Link et al. (2012),
proposed that groups of Class I HLA alleles may interact with Class II HLA-
DRB1*15, neutralizing its negative effect as a predisposing factor of MS. The
conclusions of Irizar et al. (2012)14
have indicated that the DRB1, DRB5 and DQA1
genes are expressed significantly in the samples positives for DRB1*1501 in their
genotypes. The expression of DRB5 gene have been shown to be specific of the
DRB1*1501 allele, once the super expression of that gene have demonstrated to be
significantly higher in the individuals with positive allele.
Zivkovic et al. (2009)18
and Benesova et al. (2012)6, De Bakker et al
19. have
reported an association between DRB1*15 and the rs3135388 polymorphism. The
rs3135388 is useful marker for the DRB1*1501 allele, helping in the detection of
this polymorphism in clinical tests. SNP rs3135388 is located 197 base pairs
downstream of the terminal exon of the HLA-DRA gene. The very high degree of
correlation observed between SNP rs3135388 and HLADRB1 is remarkable. They
are separated by a distance of nearly 120 kb. This fragment is located within a 158-
kb highly conserved segment that is most extensively preserved on the HLA-DR15
haplotype.
Review of Literature
15
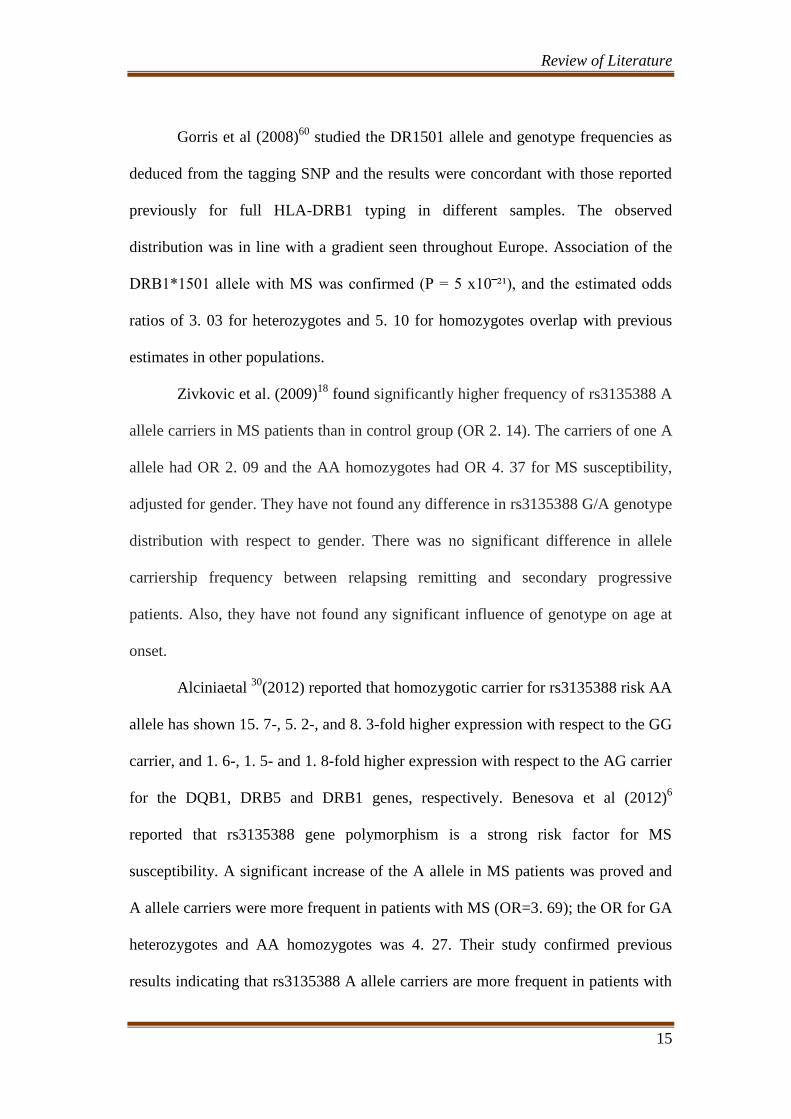
Gorris et al (2008)60
studied the DR1501 allele and genotype frequencies as
deduced from the tagging SNP and the results were concordant with those reported
previously for full HLA-DRB1 typing in different samples. The observed
distribution was in line with a gradient seen throughout Europe. Association of the
DRB1*1501 allele with MS was confirmed (P = 5 x10‾²¹), and the estimated odds
ratios of 3. 03 for heterozygotes and 5. 10 for homozygotes overlap with previous
estimates in other populations.
Zivkovic et al. (2009)18
found significantly higher frequency of rs3135388 A
allele carriers in MS patients than in control group (OR 2. 14). The carriers of one A
allele had OR 2. 09 and the AA homozygotes had OR 4. 37 for MS susceptibility,
adjusted for gender. They have not found any difference in rs3135388 G/A genotype
distribution with respect to gender. There was no significant difference in allele
carriership frequency between relapsing remitting and secondary progressive
patients. Also, they have not found any significant influence of genotype on age at
onset.
Alciniaetal 30
(2012) reported that homozygotic carrier for rs3135388 risk AA
allele has shown 15. 7-, 5. 2-, and 8. 3-fold higher expression with respect to the GG
carrier, and 1. 6-, 1. 5- and 1. 8-fold higher expression with respect to the AG carrier
for the DQB1, DRB5 and DRB1 genes, respectively. Benesova et al (2012)6
reported that rs3135388 gene polymorphism is a strong risk factor for MS
susceptibility. A significant increase of the A allele in MS patients was proved and
A allele carriers were more frequent in patients with MS (OR=3. 69); the OR for GA
heterozygotes and AA homozygotes was 4. 27. Their study confirmed previous
results indicating that rs3135388 A allele carriers are more frequent in patients with

Review of Literature
16
MS. They demonstrated that the A allele carriers were more frequent in female
patients with MS. Their study did not reveal any significant association of genotypes
with disability and disease severity in the whole study group and when separated by
gender. After stratification of the patient group with MS according to disease type,
only marginally significant associations of genotypes with disability in female
RRMS were found. However studies conducted by Sombekke et al. , 200949
;
provided some evidence that HLA DRBl*1501 might also be associated with a more
severe course of the disease.
Modifying effects of HLA-DRB1 allele interactions on age at onset
of multiple sclerosis
The study conducted by Wu et al (2010)36
in a cohort of 461 multiple
sclerosis patients from the Perth Demyelinating Diseases Database showed that
carriage of the HLA-DRB1*1501 risk allele was not significantly associated with
age at onset but HLA-DRB1*0801 was associated with a later onset of the disease.
The HLA-DRB1*0401 allele was associated with a reduced age at onset when
combined with DRB1*1501 but may delay age at onset when combined with
DRB1*0801. These findings indicate that epistatic interactions at the HLA-DRB1
locus have significant modifying effects on age at onset of multiple sclerosis and
demonstrate the value of high-resolution genotyping in detecting such associations.
The biological mechanisms which underlie these interactive effects of HLA-DRB1
alleles remain speculative. In view of the known role of the MHC Class II alleles in
antigen presentation and the fact that the two alleles at the DRB1 locus are co-
dominant and are both expressed, it might be hypothesized that the combination of

Review of Literature
17
certain alleles, such as DRB1*1501/*0401, has a more permissive effect on the
induction of an immune response in the face of an appropriate environmental
triggering agent, while other combinations such as DRB1*1501/ *0801 have a less
permissive effect. These postulated effects could be mediated through differential
binding and presentation of antigenic epitopes by the two DRB1 proteins. In other
words, as has been postulated in type 1 diabetes, one allele may be involved in
presentation of the disease-specific antigenic epitope while the other may act
through its linkage disequilibrium with polymorphisms in other MHC genes which
may act by modifying the immune response through other mechanisms such as
cytokine networks. Similar results were obtained by Balnyte et al (2013)2 from
Lithuanian population, Lima et al (2015)26
from Scopus database. Hensiek et al
(2002)12
, Romero-Pinel et al (2001)33
, noted that positive DR15 were associated
with earlier beginning of MS and to female gender. Irizar et al. (2012)14
, studying
the Japanese population, suggested that DRB1*15 allele confers greater risk of MS
only for women.
Associations of multiple sclerosis susceptibility genes with brain
magnetic resonance imaging
There are several studies that have explored whether susceptibility genes can
explain differences in disease severity in multiple sclerosis. Large variation can be
found between patients with MS with regard to the number and volume of T2
lesions in the brain. An association between HLA-DRB1*1501, and T2 lesion
volume was found by Okuda and colleagues (2009)44
. However, this association was
not confirmed in other studies. Likewise, although some studies by Zivadinov et al45

Review of Literature
18
have reported associations between susceptibility genes with T1 black holes (BH), in
other studies conducted by Kalincik et46
al no significant relations could be found. In
patients with CIS, associations between HLA status and number and volume of
gadolinium enhancing lesions were found by Horakova et al46
. However, in a
longitudinal study by the same group with 179 patients with CIS and 16
susceptibility SNPs, including HLA-DRB1, no relations with T2 lesion load (T2LL)
or BV (brain volume) were found. In majority of the studies using BV as an
outcome measure, no associations with known susceptibility genes have been
found46
.
In addition to the large range of number and volume of lesions in patients
with MS, anatomic location of lesions within the brain varies widely among patients
with multiple sclerosis. This differences in involvement of the cerebrum, brainstem,
and cerebellum may partly be explained by genetic differences. This possibility was
investigated by Sombekke et al (2011)49
by examining the effect of 69 candidate
SNPs on a lesion probability map of 208 patients with MS, showing increased
probability for lesions in certain brain areas for 5 SNPs and decreased probability
for lesions in 6 SNPs. The most statistically robust finding was the increased
probability of having a lesion in the cerebral white matter against the frontal and
occipital horn of the left lateral ventricle, for the heterozygous genotype of
rs2227139, located within the MHC class II region. In another study comparing
T1BH and T2 lesion probability maps between 50 patients with MS with negative
and positive HLA-DR2 status (determined by the presence of the HLA-DRB1*1501
allele, present in 30% of patients),by Sepulcre et al50
no significant differences in
lesion distribution were found, and neither did gray or white matter atrophy differ. A

Review of Literature
19
GWAS conducted by Gourraud et al (2013) found several SNPs associated with one
of the lesion distribution patterns found in a group of 284 patients with MS. The
genes involved have immunity-related but also neural functions3.
Association between spinal MRI lesions and rs3135388
polymorphism
In a study conducted by Madelaine et al (2009), they noted that five single-
nucleotide polymorphisms within the major histocompatibility complex region were
associated with the number of focal abnormalities in the spinal cord. The most
significant was rs3135388 (surrogate marker for the HLA-DRB1*1501 allele).
Carriers of HLA-DRB1*1501 had a median of 4 spinal cord lesions compared with
2 lesions for non-carriers (P<. 001). No significant association was noted between
the single nucleotide polymorphisms and T2-weighted lesion load in the brain. Some
other studies gave inconsistent results. More research is warranted in this area,
especially because spinal cord pathology in MS are strongly associated with clinical
disability.
Association between HLA DR B1*15 01 and CSF oligo clonal bands
Balnyte et al (2011)2 noted that 55% were positive for OCBs and 56% for
HLA DRB1*1501. OCB positive patients with multiple sclerosis had higher EDSS
scores than their OCB-negative counterparts at onset of the disease (P=0. 02) and
during the last visit (P=0. 009). The mean relapse rate was higher in the OCB-
positive group compared with OCB-negative group (P=0. 001). OCB-positive
patients had higher IgG index compared with OCB-negative patients (P=0. 0001).
Review of Literature
20
However no relationship was found between HLA DRB1*1501 antigen status and
the clinical features or EDSS score, and presence or absence of OCB.
In a meta-analysis conducted by Maurizio et al53
among Italian,
Scandinavian and Belgian population, HLA-DRB1*15 is associated with OCB
positivity (p = 0. 03). None of the 52 non-HLA MS susceptibility loci was
associated with OCB, except one SNP (rs2546890) near IL12B gene. The weighted
Genetic Risk Score mean was significantly (p = 0. 0008) higher in OCB positive (7.
668) than in OCB negative (7. 412) patients. After meta-analysis on the three
datasets for the best associated signals resulted from the Italian GWAS, the strongest
signal was a SNP (rs9320598) on chromosome 6q (p = 9. 4×10⁻⁷
) outside the HLA
region (65 Mb) which points to the fact that genetic factors predispose to the
development of OCB positivity3.
Diagnostic tests in MS
MRI has revolutionized the diagnosis and management of MS. The
characteristic abnormalities are found in >95% of patients, although > 90% of the
lesions seen in MRI are asymptomatic. Lesions are mostly oriented perpendicular to
the ventricular surface, corresponding to the pathologic pattern of perivenous
demyelination. Lesions are multifocal within the brain, brainstem, and spinal cord.
Lesions larger than 6 mm located in the corpus callosum, periventricular white
matter, brainstem, cerebellum, or spinal cord are particularly useful for diagnostic
purposes. The total volume of T2-weighted signal abnormality – i. e., “burden of
disease” shows a significant correlation with clinical disability, as do measures of
brain atrophy. Black holes are considered as markers of irreversible demyelination
and axonal loss, although even this measure depends on the timing of the image

Review of Literature
21
acquisition. CSF abnormalities found in MS include a mononuclear cell pleocytosis
and an increased intrathecal synthesized IgG levels. A mild CSF pleocytosis (>5
cells/μL) is present in up to approximately 25% of cases. The total CSF protein is
usually normal. The measurement of oligo clonal bands (OCBs) in the CSF assesses
intrathecal production of IgG. OCBs may be absent at the onset of MS. In individual
patients, the number of bands may increase with time. An abnormal visual EP would
permit a diagnosis of clinically definite MS. Abnormalities on one or more
electrophysiological modalities occur in 80–90% of MS patients which are not
specific to MS31
.
Multiple sclerosis in India
In India, multiple sclerosis was recognized only in the 1960s when
physicians who received training in Neurology in the West, returned to India.
Baldev Singh, Bharucha and Ramamurthy28
were the pioneers who first described
the manifestations of multiple sclerosis in the Indian context. Statistics based on the
hospital data in the 1970s suggested an approximate prevalence rate of 0. 17 to 1.
33/100,000 in various parts of India. With advanced awareness about the disease, a
significant increase in the number of trained neurologists and relatively easy
availability of magnetic resonance imaging (MRI) the current estimate stands at
about 7 to 10/100,000. This figure may still be higher as major sections of the Indian
population still have only limited access to adequate medical facilities particularly in
the rural areas. No large epidemiological studies have been reported from India so
far. In a small Parsi population of approximately 70,000, Bharucha et al28
. , reported
a higher prevalence of approximately 21/100,000. Another study from the same
Parsi community by Wadia etal21
reported a similar higher incidence of

Review of Literature
22
approximately 26/100,000. In a recent epidemiological survey, from urban
Mangalore the prevalence of 8/100,000 was noted.
There are limited reports of HLA linkage among Indian population.
Kankonkar et al15
, in a small study from Mumbai demonstrated the association
between DRB1*1501 allele and multiple sclerosis susceptibility and also suggested
association for two novel DRB1*15 alleles, DRB1*1506 and DRB1*1508. In a
more recent study, Pandit et al22
, concluded that the risk, attributable to the HLA-
DRB1*1501 seen in Europeans are also seen in Indian population.
The first Indian article using international criteria of Schumacher was
published by Mathew et al. , from Vellore, subsequently by Singhal and Wadia21
describing the clinical features in multiple sclerosis. Subsequently, several papers
from other parts of India were published, describing the clinical features and
demographic data. Singhal et al16
. , Jain and Maheshwari reviewed the published
cases from India till 1985 summed up and commented on the higher frequency of
optic nerve involvement and low yield of oligo clonal bands in Indian multiple
sclerosis patients. The demographic features in the Indian population were similar to
those seen in the West. The average age of onset was 25 to 35 years with females
about two times more affected than men.
To study the differences in the clinical presentations of multiple sclerosis in
the Asian patients as compared to that of West, Professor Kuroiwa28
organized
meetings in Japan with delegates from Asian countries. These discussions were
concluded in two publications titled: Multiple Sclerosis in Asia and Multiple
Sclerosis East and West. The essential differences noted were:

Review of Literature
23
1) Frequent initial clinical presentation with optic nerve or spinal cord
involvement
2) Often bilateral optic nerve affection
3) Severe myelopathy with sensory level
4) Less frequent clinical presentation to suggest cerebral or cerebellar
involvement
5) More frequent painful tonic spasms.
The term optico-spinal multiple sclerosis (OS-MS) was used to highlight the
clinical features in Asian multiple sclerosis. The term OS-MS continues to be used
even today, though many of these patients are now diagnosed as cases of
Neuromyelitis optica (NMO)28
.
The disease course of multiple sclerosis in Indian subcontinent is largely
similar to that seen in the West though there has been no well-defined study reported
from India on this subject. In Indian patients with „Radiologically Isolated
Syndrome‟, „Clinically Isolated syndrome‟, a large majority having „Remitting
Relapsing (RR) course‟ has been reported. In some RR MS patients, phase of
„Secondary Progressive MS‟ sets in, during the course of disease. Though the
precise statistics are not known there are reports of „Primary Progressive MS‟
(PPMS) in Indian population28
.
Gradients in Distribution of DRB1* Alleles in Castes and Tribes of
South India
Populations from Kerala:
Studies conducted by Balakrishnan et al 57
revealed, among Nairs, the most
common allele was DRB1*15 (28. 57%) followed by DRB1*13 (16. 07%),
Review of Literature
24
DRB1*10 (13. 39%), DRB1*04 (10. 71%), DRB1*14 (10. 71%), DRB1*07 (7.
14%), DRB1*03 (5. 35%) and DRB1*01 (3. 57%). In the same study alleles
DRB1* 11 and DRB1*12 (both sub-types of DR5) were observed in lower
frequencies with DRB1*08, DRB1*09 and DRB1*16 were completely absent. They
also reported that among Namboothiris the commonest allele was DRB1*10 (18.
57%) followed by alleles DRB1*15 (17. 14%), DRB1*01 (12. 85%), DRB1*13 (11.
42%), DRB1*11 (10%), DRB1* 07 (8. 57%), DRB1*03 (7. 14%). Moderate
frequencies were detected for DRB1*04 and DRB1*14 (each 5. 71%). DRB1*08
and DRB1* 09 were observed in lower frequencies with DRB1*16 and DRB1*12
were completely absent.
Populations of Tamil Nadu:
Epidemiological studies conducted by Balakrishnan et al57
reported that
among Iyers, the most frequent alleles were DRB1*10 (19. 32%), DRB1*07 and
DRB1*15 (18. 18% each). In Kallars, the most frequently observed alleles were
DRB1* 07 (23. 58%), DRB1*15 (18. 86%), DRB1*04 (12. 26%), DRB1*14 (10.
37%), DRB1*08 (6. 60%) and DRB1*12 (5. 66%). Among Vanniyars the most
common allele was DRB1*03 (36. 27%) followed by DRB1*15 and DRB1*10
(each 21. 56%). In Sourashtrans, the predominant alleles reported were DRB1*15
(30. 76%), DRB1*07 (19. 23%), DRB1*10 (11. 53%) and DRB1*03 (6. 41%). In
Pallars, the most common allele observed was DRB1*15 (43%) followed by alleles
DRB1*07 (11%), DRB1*04 (10%), DRB1*10 (7%), DRB1*11 (7%), DRB1* 16
(6%). Among Narikuravars, the most frequent allele was DRB1*04 (41. 46%)
followed by alleles DRB1*03 (14. 63%), DRB1*07 (12. 19%), DRB1*11 (9. 75%),
DRB1*01 (8. 53%) and DRB1*13 (7. 31%).

Review of Literature
25
Research Needs in the Indian context
There is no large scale data of the usage of disease modifying agents from
India. We cannot as yet accurately predict the course of events in a given patient and
the search for biomarkers still continues. The entity of benign multiple sclerosis is
still remaining a matter of debate. We do not have data to guide patients who remain
free of illness for two to three years, who enquire if they can discontinue the costly
drugs. Although we are diagnosing more patients with multiple sclerosis today,
much effort need to be done in the Indian context. We need greater awareness
programs, more infrastructure especially for rehabilitation, specialized multiple
sclerosis clinics, multiple sclerosis registry, government support, insurance coverage
and availability of effective and affordable disease modifying agents. Multiple
sclerosis Society has been in existence for over 25 years in India to provide support
for the patients and their caregivers.
Recent discovery of a high-resolution HLAand SNP map have thrown hopes
in the field of multiple sclerosis genetics. The analysis provided informative tag
SNPs, capturing much of the common variation in the MHC region. This concept
enabled detection SNPs, making it “surrogate” markers for haplotype associated
with certain disease, particularly MS. The SNP rs3135388 was proposed as a
tagging SNP for DRB1*1501/DQB1*0602 alleles. The presence of this SNP has
predicts a relative risk of 4 for MS and coefficient (r 2) of determination between
identified HLA predictor and the HLA risk allele of 0. 97, which was confirmed
through MS GWAS study. Aiming to reduce time and expenses in HLAMS risk
allele genotyping, a dozen of study were done worldwide. No data is available from
the south Indian population regarding such an association and we designeda study

Review of Literature
26
for high throughput detection of HLA rs3135388 SNP genotypes and investigated its
association with MS in patients from South India.

Aim of the Study
27
AIM OF THE STUDY
To determine the association of HLA-DRB1*1501 tagging rs3135388 gene
polymorphism with multiple sclerosis susceptibility.

Materials and Methods
28
MATERIALS AND METHODS
Subjects of the study were those diagnosed with relapsing and remitting Multiple
sclerosis (RRMS) according to the Mc Donald‟s criteria with the age more than >13
years. Minor, pregnant woman, neonates, person incompetent to give informed
consent, prisoners were not included in the study. Controls were healthy volunteers
> 13 years of age. Relatives of patients were not included among controls. Controls
were selected by small advertisements/ fliers which were attached on various places
in the hospital. Separate consent forms were prepared for cases and controls and
informed consent was obtained from both.
The objectives of the study, study methods and the likely benefits were
discussed with the patient in detail by the principal investigator. Strict
confidentiality was assured and adequate time was given to the patient to decide on
participation in the study. The patients were made to understand that they do not
have to participate if they are unwilling and this will not influence their further
treatment in the hospital in any way. No incentives was offered to participate in the
study. The study was conducted during the routine review of the patients and they
were not asked to visit the hospital for the sole purpose of the study. The expense for
the investigations for the patients was met by the investigator.
INCLUSION CRITERIA:
1. All patient with relapsing and remitting multiple sclerosis according to the
Mc Donald‟s criteria (Poser et al 2011) with age >13 years. Patient or legally
authorized representative willing to sign consent form.

Materials and Methods
29
2. Controls were healthy volunteers > 13 years of age. Relatives of patients
were not included among controls.
EXCLUSION CRITERIA:
1. Patients with Progressive forms of multiple sclerosis were excluded.
2. Patients younger than 13 years, pregnant ladies and those not able to give an
informed consent.
3. Subject diagnosed with another etiology causing white matter disease
RECRUITMENT
The subjects were recruited from the OP and IP of Department of Neurology,
Sree Chitra Tirunal Institute for Medical sciences and Technology, Trivandrum by
the principal investigator.
DATA COLLECTION PROCEDURES
30 consecutive patients with relapsing and remitting multiple sclerosis more
than 13 years, who are on regular follow up in the neuromuscular disorders clinic of
SCTIMST participated in the study, looking for genetic polymorphisms in them. 60
normal controls who were friends of the patients or other normal healthy volunteers
who are willing to participate in the study and can provide informed consent were
included to assess the frequency of the polymorphisms in the healthy population.
Consecutive relapsing and remitting multiple sclerosis (RRMS) patients
attending neuromuscular disorders clinic and IP satisfying the inclusion and
exclusion criteria, were screened by the principal investigator for eligibility for
participation in the study. Voluntary informed consent were obtained from each
Materials and Methods
30
subject prior to enrolling to the study. Each subject were given both verbal and
written information describing the nature of the study, need for participating in the
study and potential benefits of the study. The informed consent process was done in
a place where the subject has ample time to consider the risks and benefits
associated with his/her participation in the study. He/she was informed that the
participation in the study is voluntary and that he/she may refuse to participate or
withdraw from the trial, at any time. Subjects were not allowed to participate in the
study until the subject has signed an approved informed consent written in a
language that is understandable to the subject.
The IEC approved informed consent form was signed and personally dated by
the subject and the person who conducts the informed consent discussion. The
informed consent procedure was done according to the guidelines provided in the
Declaration of Helsinki and the ICH E6 Guideline for Good Clinical Practice. The
original informed consent was retained in the Investigator‟s file. The blood sample
collection was done after taking informed written consent from the patient and
ensuring confidentiality.
BLOOD SAMPLE COLLECTION AND ISOLATION OF GENOMIC DNA
The SNP analysis was done in 25 patients only due to technical reasons.
Peripheral blood (10ml) was collected from all the individuals in EDTA vials and
stored at 4°C and for later DNA isolation. Clinical data from the patients were
collected in specific data sheets. DNA was isolated from lymphocytes obtained from
anticoagulated blood. A modified standard organic extraction method was used for
DNA extraction (Sambrook and Russell, 2006). Equal volume of RBC lysis buffer
Materials and Methods
31
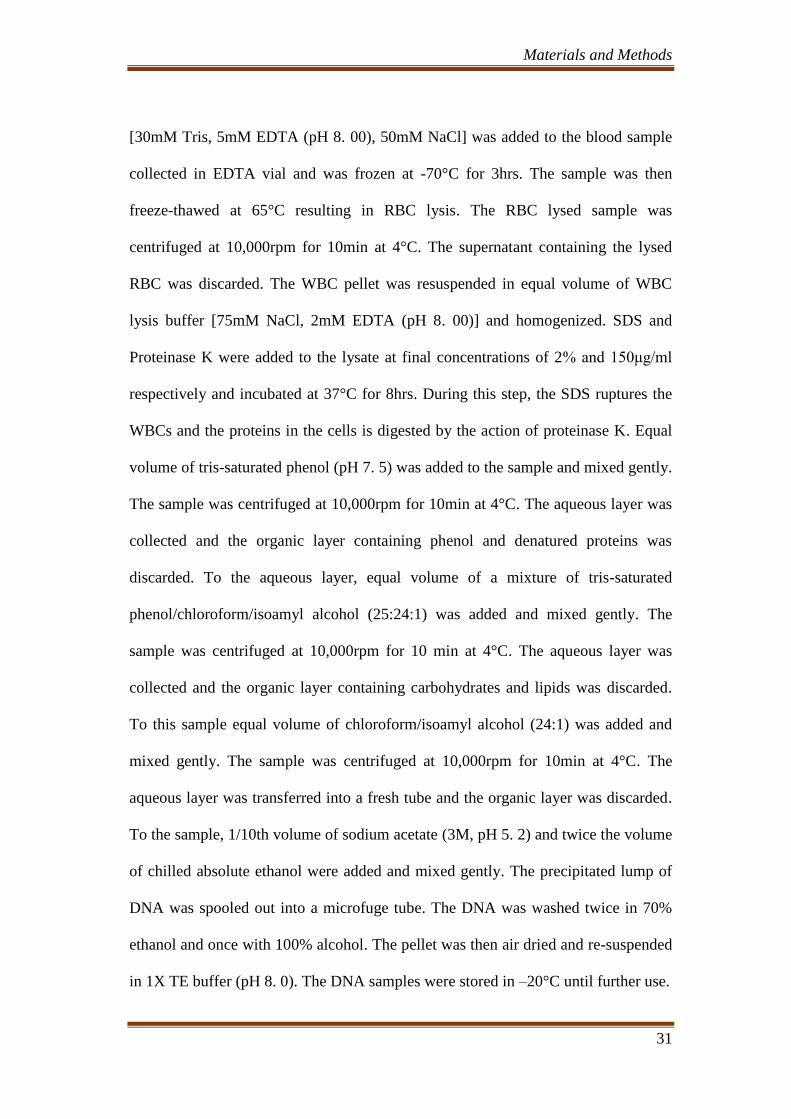
[30mM Tris, 5mM EDTA (pH 8. 00), 50mM NaCl] was added to the blood sample
collected in EDTA vial and was frozen at -70°C for 3hrs. The sample was then
freeze-thawed at 65°C resulting in RBC lysis. The RBC lysed sample was
centrifuged at 10,000rpm for 10min at 4°C. The supernatant containing the lysed
RBC was discarded. The WBC pellet was resuspended in equal volume of WBC
lysis buffer [75mM NaCl, 2mM EDTA (pH 8. 00)] and homogenized. SDS and
Proteinase K were added to the lysate at final concentrations of 2% and 150μg/ml
respectively and incubated at 37°C for 8hrs. During this step, the SDS ruptures the
WBCs and the proteins in the cells is digested by the action of proteinase K. Equal
volume of tris-saturated phenol (pH 7. 5) was added to the sample and mixed gently.
The sample was centrifuged at 10,000rpm for 10min at 4°C. The aqueous layer was
collected and the organic layer containing phenol and denatured proteins was
discarded. To the aqueous layer, equal volume of a mixture of tris-saturated
phenol/chloroform/isoamyl alcohol (25:24:1) was added and mixed gently. The
sample was centrifuged at 10,000rpm for 10 min at 4°C. The aqueous layer was
collected and the organic layer containing carbohydrates and lipids was discarded.
To this sample equal volume of chloroform/isoamyl alcohol (24:1) was added and
mixed gently. The sample was centrifuged at 10,000rpm for 10min at 4°C. The
aqueous layer was transferred into a fresh tube and the organic layer was discarded.
To the sample, 1/10th volume of sodium acetate (3M, pH 5. 2) and twice the volume
of chilled absolute ethanol were added and mixed gently. The precipitated lump of
DNA was spooled out into a microfuge tube. The DNA was washed twice in 70%
ethanol and once with 100% alcohol. The pellet was then air dried and re-suspended
in 1X TE buffer (pH 8. 0). The DNA samples were stored in –20°C until further use.

Materials and Methods
32
DNA QUANTIFICATION
The quality and quantity of genomic DNA was analyzed in a
spectrophotometer (BioSpec-1601, Shimadzu). The ratio of absorbance at 260 nm
and 280 nm (A260/A280) was used to estimate the purity of the DNA. A ratio
between 1. 7-1. 9 was considered as good quality DNA without protein
contamination. The absorption of 1 OD (A260) is equivalent to approximately
50μg/ml of double stranded DNA. Hence the concentration of DNA in each blood
sample was calculated using the following formula: Concentration of DNA (mg/ml
or ng/ul) = 50mg/ml × OD A260 × Dilution Factor. Using the calculated DNA
concentration, working stocks of DNA samples for PCR amplifications were made
to final concentration of 20ng/ul.
SNP SELECTION
The SNP for genotyping was selected based on the functionality (cSNP, SNP
in promoter region, splice sites, 3‟UTR), tagging status, extent of Linkage
Disequilibrium (LD), minor allele frequency > 0. 10 in other populations.
GENOTYPING BY SEQUENCING
Genotyping was performed by direct sequencing for SNP where the variant
was amplified by PCR amplifying. The sequencing primers were purchased as crude
oligonucleotides from Sigma-Genosys and the sequences are shown. All primers
were resuspended in sterile nuclease free water at stock concentrations of
100pmol/μl and stored at –20°C. The primers were diluted to working
concentrations of 20pmol/μl. PCR was carried out for all the samples in Eppendorf

Materials and Methods
33
mastercycler (EP Gradient) and Applied Biosystems Veriti Thermal cycler. The final
volume of each PCR reaction was 10μl. Around 50-100ng of genomic DNA was
used for each PCR reaction. The PCR reaction mixture consisted of 1X PCR buffer
(NEB, Inc. , USA), 200μM of each deoxynucleoside triphosphate (dNTP), 2pmol of
each primer, and 0. 5 Units of Taq Polymerase (NEB, Inc. , USA). This PCR
product was further used for sequencing reaction using Applied Biosystems PRISM
Big Dye Terminator v3. 1 cycle sequencing kit. The 10μl reaction was carried out
with 50-100ng PCR product, 0. 5μl of the ready reaction mix, 20pmol of the forward
or the reverse primer and 1X reaction Buffer (Applied Biosystems). The
thermocycling conditions were 25 cycles of 96°C for 30sec and 60°C for 4min with
a thermal ramp rate of 1°/second
SEQUENCING CLEANUP
The post sequencing PCR reaction product was transferred to a 1. 5ml
microfuge tube. To the sample 10μl of sterile distilled water and 2μl of 125mM
EDTA, 2μl NaOAc (3M) and 50μl absolute ethanol were added. The tubes were
mixed on a vortex mixer briefly. The tubes were incubated at room temperature for
15min to precipitate the extension products. The samples were centrifuged at
12,000rpm for 20min at room temperature. The supernatant was carefully aspirated.
To the pellet 300μl of 70% ethanol was added, and vortexed briefly. The samples
were then centrifuged at 10,000rpm for 10min at room temperature and the
supernatant was aspirated. The above step with 70% ethanol was repeated. The
pellet was then air-dried.

Materials and Methods
34
ELECTROPHORESIS OF THE SEQUENCING SAMPLE
Formamide (10μl) was added to the dried pellet, mixed well, denatured at
95ºC for 10min and snap chilled. The samples were then loaded in the 3730 Applied
Biosystems PRISM DNA analyzer. The sample was resolved through the POP 7
polymer and the sequencing data normalized using the matrix standard. Sequence
analysis was done using the Applied Biosystems sequence scanner V. 1. 1.
STATISTICAL ANALYSIS
Genotype and allelic frequencies were computed and were checked for
deviation from Hardy-Weinberg equilibrium (http://ihg2. helmholtzmuenchen.
de/cgi-bin/hw/ hwa1. pl). Case-control genetic comparisons were performed using
the chi-square test and allelic odds ratios (OR), and 95% confidence intervals (CI)
were calculated by Fisher‟s exact test (two-tailed). All statistical analyses were
performed using the Graph Pad Prism 5. 01, San Diego, CA, USA. We considered p
value of <0. 05 as significant.

Results
35
RESULTS
The study population were those diagnosed with relapsing and remitting
multiple sclerosis (RRMS) fulfilling the Mc Donald‟s criteria, attending the
neuromuscular and Multiple sclerosis clinic and those receiving the in-patient
services of SCTIMST, Trivandrum. A total of 31subjects satisfied the criteria and
were included in the study. Sixty healthy individuals who were not the relatives of
the study subjects were taken as controls. The study was conducted between January
2015 and December 2015. The results of the descriptive analysis of the subjects are
as follows: Demographic data
The age-wise distribution of the subjects showed a predominant clustering
between 15-45 year age group with the highest number in the 15-25 age group
(38%) followed by 36-45 age group (35. 5%). The mean age of the study population
was 31. 1 years. The mean age for males and females were 32. 43 and 30. 7(+/-11.
4) years respectively.
Fig: 1 Age wise distribution of the patients
0
2
4
6
8
10
12
15-25 26-35 36-45 46-55
12
6
11
1 Nu
mb
er
of
pat
ien
ts
Age group
Age distribution

Results
36
The sex-wise distribution showed 77. 4% of the study population to be
females. Females between the age group 15-25 years has the maximum prevalence
of the disease constituting approximately one third of the study population.
However, among the males the maximum prevalence was observed between 36-45
years which constituted around 13% of the study population.
Fig: 2 Sex wise distribution of patients
Table: 1 Age and sex wise distribution
Age group
(years)
Male
N (%)
Female
N (%)
Total
16-25 2(6. 4) 10(32. 2) 12(38. 7)
26-35 1(3. 2) 5(16. 1) 6(19. 4)
36-45 4(12. 9) 7(22. 5) 11(35. 5)
46-55 0 1(3. 2) 1(3. 2)
56-65 0 1(3. 2) 1(3. 2)
Total 7(22. 5) 24(77. 4) 31(100)
Male 23%
Female 77%
Sex wise distribution

Results
37
Clinical Characteristics of the study population
The clinical details analyzed included the first clinical event, number of relapses in
the first year, total number of relapses, the site of involvement in the neuraxis and the EDSS
score.
The most common site of involvement of the neuraxis was spinal cord occurring in 38% of
the patients. The other sites involved were brainstem, cerebellum and optic nerve which
constituted 32%, 16% and 10% respectively. None of the patients had relapses with overt
cognitive presentation in the study.
Fig: 3 Distribution based on first clinical event
The total number of neurological events ranged from one event to as many as
8 events. The mean number of total attacks in the study was 3. 87.
0
2
4
6
8
10
12
Spinal cord Brain stem Cerebellar Optic nerve
12 10
5 3
Freq
uen
cy
Clinical event
Distribution of first clinical event

Results
38
Table: 2 Total number of attacks
Events
Minimum
Maximum
Mean
Standard
deviation
Total
number of
attacks
1 8 3. 87 2. 277
Following the index event 23(75%) did not experience a second event within
the first year. However 4 patients (13%) had a second attack in the same year itself
and 2 patients (6. 4%) reported more than 4 events in the first year.
Fig: 4 Number of clinical events in first year
It was observed that spinal cord involvement constituted 43% which was the most
frequent clinical manifestation in the study followed by brain stem and cerebellar symptoms
which constituted 14 and 7 percent respectively. Optic nerve involvement (6%) was also
observed in the study. However involvement of other areas neuraxis was not observed in the
study.
23
4 2 2
1 2 3 >4
Fre
qu
en
cy
Clinical event in first year
Results
39
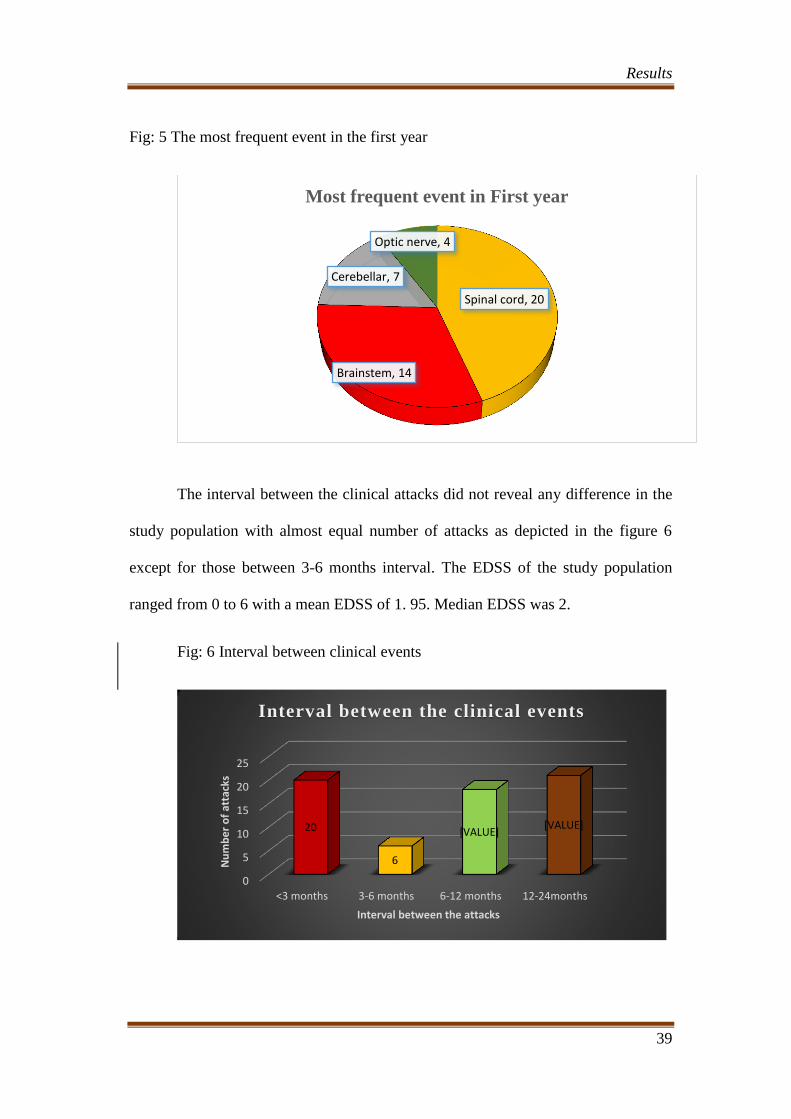
Fig: 5 The most frequent event in the first year
The interval between the clinical attacks did not reveal any difference in the
study population with almost equal number of attacks as depicted in the figure 6
except for those between 3-6 months interval. The EDSS of the study population
ranged from 0 to 6 with a mean EDSS of 1. 95. Median EDSS was 2.
Fig: 6 Interval between clinical events
Spinal cord, 20
Brainstem, 14
Cerebellar, 7
Optic nerve, 4
Most frequent event in First year
0
5
10
15
20
25
<3 months 3-6 months 6-12 months 12-24months
20
6
[VALUE] [VALUE]
Nu
mb
er
of
atta
cks
Interval between the attacks
Interval between the clinical events

Results
40
Table: 3 EDSS Score of the patients
Minimum Maximum Mean SD
EDSS
Score
0 6 1. 95 1. 792
The distribution of MS lesions on MR images was studied and all patients
in the study demonstrated a lesion in the MR images. Periventricular lesions of
more than 10 numbers was observed in 60% of the patients and 35% was found to
have 1-5 lesions in the periventricular region typical of MS. Juxta cortical lesions
were observed in 87%. Brain stem lesions were noted in 68% of all the MRI which
constituted the in MRI. Cerebellar lesions were noted in 11 (35. 5%) and optic nerve
lesions in 4 (13%) patients. T1 black holes were observed in 25% of the MRIs
studied. Cerebral atrophy was documented in 58%. Confluent spinal cord hyper
intensity involving the cervico-thoracic region was the most common spinal imaging
finding noted 38. 7% in the study population and 25% of the MRI did not reveal any
lesion in the spinal cord.
Fig: 7 MRI distribution of lesions
4
19
10
27
10 11
0
5
10
15
20
25
30
Optic Nerve Brain stem Cerebellum
Les
ion f
req
uen
cy
Site of lesion
MR distribution of lesions
Present Absent

Results
41
Fig: 8 Distribution of Spinal cord lesions
Fig: 9 Distribution of Periventricular lesions
0
2
4
6
8
10
12
Confluent 4 Lesions 3 Lesions 2 Lesions
12
4 3 2
Fre
qu
en
cy
Spinal cord lesions
Distribution of sp inal cord les ions
0 5 10 15 20
0-1lesion
1-5 lesions
6-10 lesions
>10 lesions
0
11
1
19
Frequency
Pe
rive
ntr
icu
lar
lesi
on
s
Distribution of Periventricular lesions

Results
42
Fig: 10 Juxta cortical lesions
Fig. 11 Atrophy and Black holes:
0
5
10
15
20
25
30
Absent 1 lesion >1 lesions
1 3
27
Fre
qu
en
cy
Juxta cortical lesions
Distribution of Juxtacortical lesions
8
18
23
13
0
5
10
15
20
25
Black holes Atrophy
Les
ion f
req
uen
cy
Type of lesions
Distribution of black holes and cerebral atrophy
Present Absent

Results
43
Fig: 12 CSF OCB status of the patients
CSF OCB positivity was observed in 71% of the subjects diagnosed with
MS. CSF Ig G index was increased in only 16 % of the subjects. However CSF
study was not done in one patient.
Fig: 13 CSF IgG Index
73%
27%
CSF OCB Status
Positive
16 14
1
CSF IgG index
Increased
Normal
Not done

Results
44
Fig: 14 Electrophysiological profile
Electrophysiological data revealed prolonged VEP and BAEP in 61% and 29%
respectively.
Table: 4 Case control Association
SNP CC CT TT p-value C T p-value
rs3135388
Cases 24 0 0
0. 43
48 0
0. 47 1 0 0 1 0
Controls 56 4 0 116 4
0. 94 0. 06 0 0. 97 0. 03
Out of 60 controls sequenced for genotyping, we could find out 56 patients
homozygous for C allele and four were heterozygous for CT and none were
homozygous for T allele. All 24 MS patients screened were homozygous for C
allele.
0
10
20
30
40
VEP BAEP
19 9
12 22
Fre
qu
en
cy
Electrophysiology
Electrophysiology(VEP/BAEP)
Prolonged Normal

Results
45
Functional Prediction score for rs3135388
Functional
Category
Prediction
Tool
Predicti
on
Result
Prediction Detail FS score
rs3135388.
C
rs3135388.
T
Transcriptio
nal
regulation
TFSearch Changed
ADR1
P
AML-1a
NF-Y
GATA-1
GATA-2
0. 5
The functional prediction score for rs3135388 in the study was 0. 5 Functional
prediction for SNP (rs3135388) is done with in silico database F-SNP, which
provides integrated information about the deleterious effects of SNPs with respect to
functional category i. e., protein coding, splicing regulation, transcriptional
regulation, and post-translation. Prediction details exposed entirely different
transcription factor binding for respective alleles as shown in table above.

Results
46
Fig: 15 Genotype analysis:
Fig 16. Depicting CC genotype

Results
47
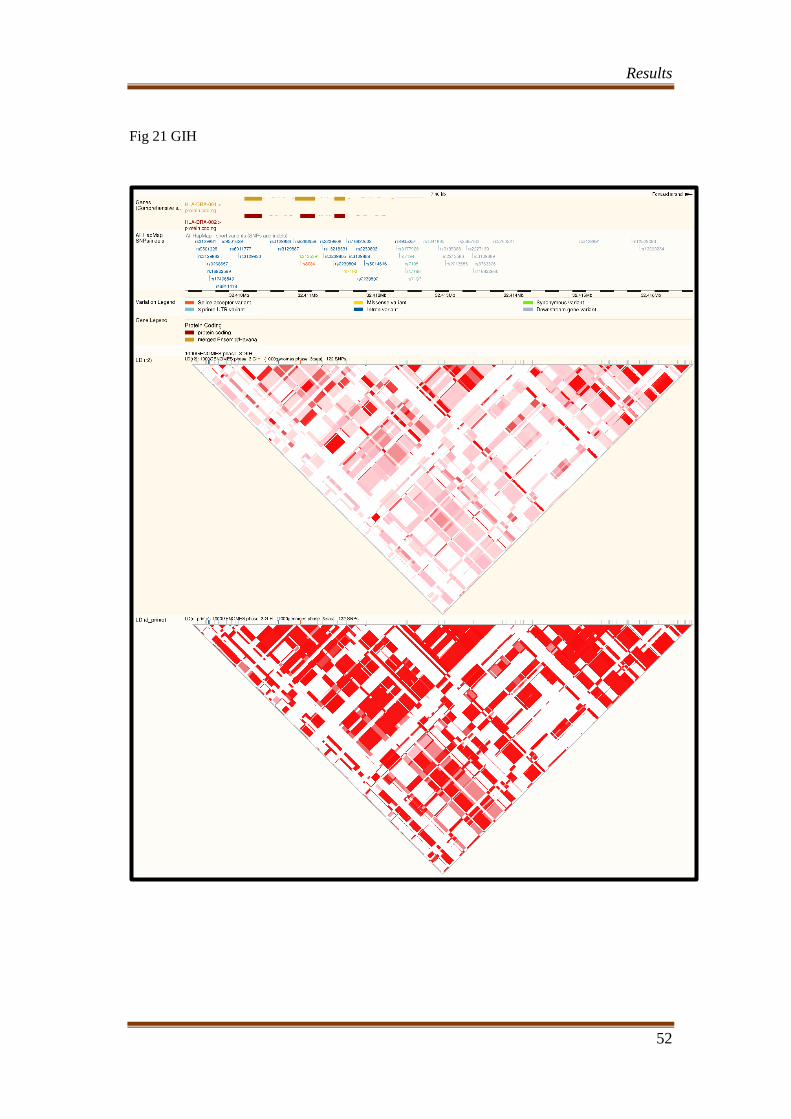
Fig: 17 Allele frequency of different population
The A and G allele frequency of the study population was compared with that of the
other global population and it was observed that Caucasians had high allele frequency so
also the the SNP polymorphism. The study population was compared with the Guajarati
Indians and was observed that allele frequency was low in them also. Similar results were
observed when genotype analysis was done. This can be interpreted in such a way that the
genetics of Caucasians differ from that of south Indian population. The linkage
disequilibrium of the South Indians were compared with that of the Caucasians and that also
showed significant difference between the populations (Fig 19-24).
CHD Chinese in Metropolitan Denver, Colorado
GIH Gujarati Indians in Houston, Texas
MKK Maasai in Kinyawa, Kenya
YRI Yoruba in Ibadan, Nigeria
LWK Luhya in Webuye, Kenya
ASW African ancestry in Southwest USA
CHB
Han Chinese in Beijing,
China
MXL Mexican ancestry in Los Angeles, California
TSI Toscani in Italia
CEU Utah residents with Northern and Western European ancestry from the CEPH collection
0
0.2
0.4
0.6
0.8
1
1.2
CHD GIH MKK KER YRI LWK ASW CHB MEX TSI CEU
Allele A Allele G

Results
48
Population Allele A Allele G
CHD 0. 006 0. 994
GIH 0. 017 0. 983
MKK 0. 018 0. 982
KER 0. 029 0. 971
YRI 0. 031 0. 969
LWK 0. 039 0. 961
ASW 0. 041 0. 959
CHB 0. 049 0. 951
MEX 0. 05 0. 95
TSI 0. 08 0. 92
CEU 0. 19 0. 81
Fig: 18 Genotype Frequency of different world populations
0
0.2
0.4
0.6
0.8
1
1.2
CHD GIH MKK KER ASW LWK YRI CHB MEX TSI CEU
Genotype A/G
Genotype G/G
Genotype A/A

Results
49
Population Genotype A/G Genotype G/G Genotype A/A
CHD 0. 012 0. 988 0
GIH 0. 034 0. 966 0
MKK 0. 035 0. 965 0
KER 0. 058 0. 942 0
ASW 0. 075 0. 925 0
LWK 0. 078 0. 922 0
YRI 0. 078 0. 922 0
CHB 0. 098 0. 902 0
MEX 0. 104 0. 896 0
TSI 0. 011 0. 852 0. 137
CEU 0. 044 0. 664 0. 292

Results
50
Fig. 19 CEU

Results
51
Fig 20 CHB
Results
52
Fig 21 GIH

Results
53
Fig 22 ITU

Results
54
Fig 23 TSI

Results
55
Fig 24 YRI

Discussion
56
DISCUSSION
The present study looked at the genetic polymorphisms in RRMS patients
compared to healthy controls in a south Indian cohort from January 2015 to
December 2015. In the study we did not find an association between rs3135388 SNP
polymorphism in any of the MS susceptibility.
The detailed demographic profile of the subjects revealed that there was
clustering of cases between the ages 15- 45 years with the highest number of MS
cases in the age group 15 – 25 years. The mean age of the study population was 31
years. The mean age in males and females were 32 years and 30 years respectively.
The median age for males and females were 37 years and 26 years respectively. The
lowest age of onset in the study population was 15years and the highest age of onset
was 65 years. The female: male ratio was 3. 3, indicating that the females had 3
times higher risk for MS than males. The decade wise sex distribution revealed that
between the age group 15 – 25 years this ratio was 5, indicating that at younger ages,
the female predisposition for the disease is higher.
The demographic data observed in the study is comparable to the studies
conducted worldwide. Majority of the studies conducted worldwide observed that
the mean age of onset of RRMS is between 29 – 32 years. Along the same lines, a
study of 940 patients in the Montreal Neurological Institute showed a mean age of
onset of 30. 6 years and peak incidence at 25 years. It is also recognized that the
onset can be well outside the mean age and as much as 5% of the MS cases can have
their onset before the age of 18 years31
. Tremlett et al 200663
reported that

Discussion
57
approximately 3 – 12 % of incident cases can have their first symptom after the age
of 50 years.
Sex and sex hormones affect the central nervous system and immune system
differently and it is gauged that sexual dimorphism has a significant impact on the
broad aspects of MS, such as susceptibility, disease course and radiological
phenotypes. The current data reveals that women are more likely than men to get
MS with a female to male ratio of 3. 3. The pooled data from Orton et al (2006)64
,
Alonso et al (2008)65
and Sudovnik et al (2009)66
demonstrated a sex ratio of 3. 2: 1
with a clear female preponderance. Literature review reveals a dramatic shift in
male: female ratio from the early 20th
century to the present time which may be
multifactorial. It can be postulated that women utilize health care more frequently
now than in the early 20th
century. The advent of MRI, drastically improved the
ability to identify more cases with resultant improvement in case detection rates.
The ability to detect the characteristic neurological changes and the ability to reach a
diagnosis earlier in the disease course might have also influenced a higher detection
rate.
There is a notion that overall women carry a more favorable prognosis than
men which is supported by many clinical trials61
. Beck et al 200367
in the optic
neuritis treatment trial (ONTT) noted that female sex is a risk factor for conversion
of clinically isolated syndrome to clinically definite MS (CDMS). Since MS is often
diagnosed during the reproductive years, issues such as menstruation, fertility,
pregnancy and breast feeding need to be clearly dealt with.

Discussion
58
In the current study it was observed that the most common site of clinical
presentation was spinal cord which accounted for 38% of the events, followed by
brainstem, cerebellar and optic nerve involvement. The total number of neurological
events ranged from one to as many as eight events in a single patient and mean
number of total attacks in the study ranged between 3 and 4. Interval between
clinical events did not reveal any significant association with what in the present
study. Previous studies revealed that patients presenting with acute complete
transverse myelitis(TM) have risk of 5 – 10% for progression to CDMS, though
partial myelitis is a much more common clinical entity and attains more relevance
with MS. Various studies have evaluated this issue of acute TM (partial) as an initial
presentation in MS, and it was observed that 57 – 72% have cranial MRI consistent
with MS. Subsequent follow up for 3 – 6 years revealed that 60 – 90 % of these
patients developed MS. In patients with chronic progressive myelopathy, 60 – 70 %
have cranial MRI consistent with MS in the absence of any clinical evidence of
disease above the cord. What needs to be clarified is whether the remaining 30%
have a disease other than MS or whether MS can manifest as a pure spinal cord
syndrome alone (Morrissey et al 1993)68
.
Optic nerve is the most common site of involvement in the visual pathway.
Bilateral simultaneous optic nerve involvement is rare in MS. It usually begins
asymmetrically and is more severe in one eye. In the current study optic nerve
involvement accounted to be approximately 10% which was asymmetric in
presentation and this correlates well with the standard global statistics31
. In the
ONTT trial, 15% developed recurrent optic nerve involvement, either ipsilateral or

Discussion
59
contralateral, within 6 – 24 months after the initial attack. Homonymous field
defects can be seen in MS due to involvement of optic radiation though it is
uncommon. The reported risk of progression to CDMS ranges from 15 – 75% in
patients with initial presentation as optic neuritis. In a large population study
(Rodriguez et al 1995)69
, 39% with isolated optic nerve involvement progressed to
CDMS by 10 years of follow up, 49% by 20 years and 54 % by 30 years.
In this study, pyramidal involvement was noted in 70% of the cases.
Corticospinal tract involvement in MS can manifest with different presentations.
Paraparesis occurs most frequently, the next common presentation being
hemiparesis occasionally sparing the face. Compared to the Western statistics the
data in the south Indian population is comparable. Cerebellar involvement accounted
for approximately 16% in the present study and cerebellar pathway impairment lead
to gait imbalance, limb incoordination and slurred speech in the current study
population. Bladder dysfunction was noted in approximately 50% of the patients in
the study and it is comparable with studies conducted elsewhere in India and
globally. The extent of sphincter dysfunction correlates with the degree of motor
impairment in lower extremities. The most common urinary complaint reported in
the study was urinary urgency. Constipation is a common feature which may be due
to spinal cord involvement, decreased motility and dietary issues and has been
reported in 50% of the study population31
. No sexual dysfunction was reported in the
present study population though the global data reveals it to be approximately 40-
80% and it is a frequently overlooked problem. Cognitive problems also affect
patients with MS31
. Neuropsychological testing have demonstrated, approximately
Discussion
60
34-65% of patients with MS having cognitive impairment. A longitudinal study by
Penny et al 201070
, reported 29% of early PPMS are cognitively impaired. In the
current study none of the patients reported any cognitive impairment. It has been
recognized that low physical disability can co-exist with significant cognitive
impairment.
The median EDSS of the subjects in this study was 2. All the subjects were
ambulant and independent of activities of daily living which could partially explain
the preserved cognitive domains in the study patients. However in early MS,
cognitive impairment is an infrequent symptom and subtle impairment can be
detected only by sensitive cognitive batteries such as minimal assessment of
cognition in multiple scleorosis (MACFIMS)62
. There were two patients who
reported paroxysmal symptoms which is characteristic of demyelinating disorders.
There were no reports of Lhermitte‟s phenomenon, Uhthoff‟s phenomenon in the
present study.
Overall, it can be summed that the clinical presentation in the study
population were largely similar to those in the West. It was observed
previously that the most frequent initial clinical presentation in the South Indian
population is a severe myelopathy. Optic nerve involvement was also noted, but less
frequent, though it has been reported that opticospinal form of MS is more common
in Asian population. Cerebellar and brain stem involvement seem to be more
frequent than optic nerve involvement31
. Another observation was less cerebral
involvement. It has been frequently observed that among initial symptoms,
impairment in sensory pathway or cranial nerve dysfunction (optic nerve) have a

Discussion
61
favorable prognosis, whereas pyramidal, brainstem and cerebellar involvement carry
a bad prognosis31
.
The rate of clinical progression of MS is variable and the most commonly
used index of clinical disability is the EDSS. It uses numbers ranging from 0, for
normal examination to 10, for death. This scale is nonlinear with extreme emphasis
on the ambulatory capacity of the patient with score above 431
. In the current study
the mean EDSS was 2. Although the scale takes account of disability associated with
advanced MS, most people will never reach the advanced scores. A large study that
looked at MS patients at a clinic in Ontario found that 51% people had an EDSS
score of ≤5 and 88% had score < 7 after a mean duration of follow up of 5 years72
.
Most of the population have bimodal distribution of EDSS score with peak at values
1 and 6. In the present study the bimodal distribution was not demonstrated.
Runmaker et al (1993)71
observed in a cohort of 308 MS patients followed up for 25
years, 80% evolved into progressive phase by 25 years,65% reached EDSS 6 and
50% reached EDSS 6 within 16 years of onset and 11% died. Although universally
used in clinical trial, EDSS has numerous serious limitations. Interrater and
intrarater variation is high while using EDSS. EDSS ≥ 4 depends entirely on ability
to walk but dementia, visual loss and hand weakness may pass undetected. An
important implication of these facts is that other outcome measures should be used
as well and minor changes in EDSS alone should not be overinterpreted. MS
functional composite scale (MSFC) is a more recent tool to avoid the issues
encountered with EDSS. MSFC consists of 3 parts. 1) PASAT (Paced auditory serial
addition test) 2) 9-Hole peg test 3) Timed 25 foot walk. These 3 parameters take into

Discussion
62
account cognition, upper extremity movements and lower extremity function in a
given individual. A large database of 1844 MS cases were analyzed to evaluate the
predictors of disability and it was concluded that it takes longer to reach landmarks
of irreversible disability in younger females with RRMS, patients presenting with
optic neuritis and patients with fewer relapses in first year of disease onset. They
also stressed that these good prognostic variables held true for patients up to EDSS
of 4. It did not seem to remain predictive of disability in patients past 4 to landmarks
6 and 7. Another large study (1976, 1987) conducted in Norway verified these
results and concluded that probability of being alive after 15 years was 94. 5%. The
probability of managing without a wheelchair was75. 8% and of walking without
assistance was 60. 3%. They also showed that patients with PPMS had more than 7.
5 times higher risk of reaching EDSS of 6 than with RRMS patients31
.
In the present study the CSF OCB positivity was observed in 71% and Ig G
index was elevated in approximately 50% of the patients. CSF alone neither makes
nor excludes the diagnosis of MS. Determining the presence or absence of OCB is a
valuable diagnostic test. Isoelectric focusing followed by immune blot is the
preferred test representing excess antibody produced by one or more clones of
plasma cells. OCB positivity has been demonstrated in 85-95% of clinically definite
MS31
. In the present study it is only 71%. The low value may be due to the small
sample size selected. Increased IgG index also has a sensitivity of 70-90% which
was found to be low in the present study. Presence of OCB in a patient with
clinically isolated syndrome seems to confer a higher rate of conversion to clinically
definite MS (CDMS)(Ferraro et al 2013)73
.

Discussion
63
Evoked potentials (EPs) are central nervous system electrical events
generated by peripheral stimulation of a sensory organ. Three most commonly used
EPs are VEP, SSEP and BAEP. In the current study VEP P100 prolongation was
detected in 61 % of the patients and BAEP was abnormal only in approximately 30
% of the patients31
. From the study it can be pointed out that VEP is a better EP tool
for the evaluation in MS than BAEP. In a review by Gronseth and Ashman 200074
,
for the evaluation of role of EPs in MS, it was revealed that only VEP can be
considered as a useful tool to determine increased risk for MS. They noted that P100
prolongation was detected in over 90% of the patients even in the setting of
complete restoration of vision. Likewise in a case of CDMS, BAEP was abnormal in
50-65% of patients. In our study also similar results were obtained.
MRI is the preferred imaging modality for making the diagnosis as well as
for the longitudinal follow up of MS patients. More than 95% of patients with MS
demonstrated FLAIR/ T2 abnormalities31
. In brain typical MS lesions are located in
periventricular white matter, near corpus callosum, deep white matter, cortical and
gray matter structures along with and involvement of juxta cortical U fibers,
cerebellum, middle cerebellar peduncle, posterior optic radiations31
. The presence of
periventricular lesions has been considered as a hallmark of MS based on the
observations of Swanton et al75
and has been included in the Mc Donald‟s MS
criteria. The volume of periventricular lesions adjacent to posterior horn and body of
lateral ventricle in FLAIR sequence are significantly associated with RRMS and
CIS. In the present study periventricular lesions of more than 10 numbers was
observed in approximately 60% of the patients and 35% was found to have 1-5

Discussion
64
lesions in the periventricular region typical of MS. A recent study to assess the
association between MR and pathologic findings from MS patients has confirmed
that the amount of lesions located in the subcortical white matter and within the
cortex is not negligible. Since these lesions often involve the U fibers and other
intra- and interhemispheric associative pathways, their load significantly contribute
to the presence and severity of cognitive impairment. Miki et al76
, using
conventional T2-weighted MR imaging, studied 53 MS patients and observed one or
more U fiber lesions in 53% of the MS cases. Approximately two thirds of these
lesions were located in the frontal white matter and memory and executive functions
were significantly more compromised in patients with multiple U fiber lesions.
Moriarty et al77
also observed that impaired ability on delayed memory retrieval
tests correlated well with juxtacortical lesion load in 20 patients with MS. Our study
confirms that cortical/subcortical lesions can be detected in the majority of MS
patients (about 87% has more than one lesion in our series). It has been noted that
the load of MS lesions located in the cortical/subcortical areas was more than 10
times higher in the cognitively impaired patients, indicating that the presence and
extent of cortical/subcortical lesions are major contributing factors to cognitive
impairment in MS31
.
MS lesions that appear hypointense on T1-weighted images are commonly
known as T1 black holes. With greater recognition of the role of neurodegeneration
in MS in recent years, more interest has developed in evaluating the formation and
possible evolution of persistent black holes as a marker of axonal loss and tissue
destruction31
. T1-weighted black holes have been shown to correlate with disability

Discussion
65
in some studies. Recent evidence proposes that assessing correlations between
clinical disability and a combined measure of T2 and T1 lesion volume and brain
atrophy such as the magnetic resonance disease severity scale may be more
meaningful than correlating individual measures of MRI lesion activity alone. The
relationship between T1 hypointensities and relapse rates is also consistent31
.
Another study demonstrated a lack of positive predictive value of subsequent
relapses and occurrence of new black holes in RRMS patients. In another study Cid
et al pointed out a correlation between T1 lesion hypointensity and poor recovery
from exacerbations.
There are several studies that focused on brain atrophy showing its relevant
clinical impact not only in the diagnostic phase but also in predicting subsequent
disability prognosis. A recent study by MAGNIMS group with 261 MS with MR
imaging at baseline and after 1-2 years and EDSS score at baseline and after 10
years, the whole brain and central atrophy were good predictors of EDSS at 10
years78
. Jasperse and colleagues pointed out that central atrophy is related to a
declinein ambulatory function but central and peripheral atrophy is associated with
decline in more neurologically demanding tasks79
.
Several voxel based and surface based MR studies revealed strong
relationship between gray matter involvement, but not with white matter
involvement in the disability progression. The regional analysis of grey matter
atrophy revealed that the thalamus and cerebellum were consistently related to
clinical disability31
. Thalamus is the earliest structure involved in the pathological
process and thalamic atrophy correlates with changes in EDSS. In a recent study

Discussion
66
conducted by Calabrese et al80
, cerebellar cortical atrophy with age and cortical
lesion load was indicated among the predictive parameters of progression. In the
same study they have pointed out that high cortical lesion load at baseline showed
the worse clinical evolution and subsequently progression of cortical atrophy after 5
years80
.
The rs3135388 was screened in 60 healthy controls and 25 patients. The
allele and genotype frequencies were assessed and no association was observed. The
mutant allele frequency was very low in healthy control while it was completely
absent in the patients. The risk allele seems to be functionally relevant as evident
from the F-SNP score which indicates its role in transcriptional regulation.
The sample size of the present study is small. However, this seems sufficient for
interpretation, as evident by the population frequency from the control data. The
control data frequency compares with Gujarati Indians extracted from 1000 genome
data. While comparing the allele and genotype frequencies in south Indian
population with other global populations, it was observed that both allele and
genotype frequencies significantly differed with Caucasian population. The risk
allele was seen to be increased in the Caucasian population. This is further evident
from the LD map view spanning 7. 6 kb region flanked with multiple SNPs in the
region. The pattern of LD differs in Caucasians and Indian population. Therefore,
we need to identify the SNPs that could be tagged with the risk SNP in our
population to identify probable SNP marker for the DRB1 locus that could
predispose to MS.

Conclusion
67
CONCLUSION
1. Relapsing remitting multiple sclerosis is three times more common in
females with young females having maximum predisposition to the disease.
2. The most common clinical manifestation was myelopathy which occurred in
43% patients followed by brain stem, cerebellar and optic nerve dysfunction
in 14, 7 and 6 percent respectively.
3. Pyramidal signs were observed in 70% and bladder dysfunction in 50%.
4. Median EDSS of this study group was 2.
5. Unmatched CSF oligo clonal bands were detected in 71% and Ig G index
was elevated in approximately 50% of the patients
6. VEP P100 prolongation was detected in 61 % of the patients and BAEP was
abnormal in approximately 30 % of the patients.
7. Periventricular lesions of more than 10 numbers was observed in
approximately 60% of the patients and 35% were found to have 1-5 lesions
in the periventricular region typical of MS. T1 black holes were seen in 25%,
cerebral atrophy in 58%, confluent spinal cord lesions in 38% of the study
population.
8. The clinical presentation and investigations in the study population were
largely similar to that in the western population.
9. None of the RRMS patients or healthy controls in this study exhibited the
rs3135388 gene polymorphism.

Conclusion
68
10. Both allele and genotype frequencies of tag SNP, rs3135388 significantly
differed with Caucasian population with the risk allele increased in the
Caucasian population.
11. The linkage disequilibrium map view spanning 7. 6 kb region flanked with
multiple SNPs in the region demonstrate that both allele and genotype
frequencies of tag SNP, rs3135388 in Indian population significantly differed
with Caucasian population.
12. We need to identify the SNPs that could be tagged with the risk SNP in our
population to identify probable SNP marker for the DRB1 locus that could
predispose to multiple sclerosis.

Limitations
69
LIMITATIONS
1. The sample size of the study was small. A larger sample size may give more
information regarding the MS genotype and its susceptibility.
2. In HLA sequencing, only one tag SNP was included. A study may conducted
including more SNPs to through light into the association between other SNP
and MS susceptibility.
3. A follow up study may be more meaningful to assess the tag SNP in Indian
population.
References
70
REFERENCES
1. Diagnostic Criteria for Multiple Sclerosis: 2010 Revisions to the McDonald
Criteria: Chris H. Polman, MD et al: Annals of Neurology 2011; 69: 292–
302
2. The importance of HLA DRB1 gene allele to clinical features and disability
in patients with multiple sclerosis in Lithuania: Renata Balnyte et al: Bio
Medical Central Neurology 2013; 13:77
3. Genome-wide association analysis of susceptibility and clinical phenotype in
multiple sclerosis: Sergio E. Baranzini, Joanne Wang et al: Human
Molecular Genetics 2009; 18: 767–778
4. HLA-DR2 Dose Effect on Susceptibility to Multiple Sclerosis and Influence
on Disease Course: L. F. Barcellos et al for the Multiple Sclerosis Genetics
Group: American Journal for Human Genetics 2003; 72: 710–716
5. Heterogeneity at the HLA-DRB1 locus and risk for multiple sclerosis: Lisa
F. Barcellos et al: Human Molecular Genetics 2006; 15: 2813–2824
6. Association of HLA-DRB1*1501 tagging rs3135388 gene polymorphism
with multiple sclerosis: Y. Benešová et al : Journal of Neuroimmunology
2013; 255: 92–96
7. Harrisons‟ Principal of Internal Medicine- 19th
Edition: 2661-2673
8. A method for simple and accurate identification of the multiple sclerosis
associated allele HLA-DRB1*1501 in neuroscience research laboratories: E.
Cisneros et al :Journal of Neuroimmunology 2010; 255:143–148
9. Genetics of multiple sclerosis: I. A. Hoppen brouwers, R. Q. Hintzen:
Biochimica et Biophysica Acta 2011; 1812: 194–201

References
71
10. Complex interactions among MHC haplotypes in multiple sclerosis:
Susceptibility and resistance: David A. Dyment et al: The Wellcome Trust
Centre for Human Genetics, University of Oxford, Oxford, UK, Department
of Medical Genetics and Faculty of Medicine, Division of Neurology,
University of British Columbia, Vancouver, Canada and Department of
Genetics, Stanford University, California, USA: Human Molecular Genetics
2005;14: 2019–2026
11. A Taqman assay for high-throughput genotyping of the multiple sclerosis-
associated HLA-DRB1*1501 allele: A. Goris et al: Tissue Antigens 2008;
72: 401–403
12. HLA-DR 15 is associated with female sex and younger age at diagnosis in
multiple sclerosis: A E Hensiek : Journal of Neurology Neurosurgery
Psychiatry 2002; 72: 184–187
13. Genome-wide association study of severity in multiple sclerosis:
International Multiple Sclerosis Genetics Consortium: Dr PL De Jager et al:
Genes and Immunity 2011; 12(8): 615–625.
14. HLA-DRB1*15:01 and multiple sclerosis: a female association? Haritz Irizar
et. al: Multiple Sclerosis Journal 2011; 18(5): 569 –577
15. HLA A, B, Cw. DRB1 and DQB1 alleles in Multiple Sclerosis Patients in
India: S. Kankonkar , B. S. Singhal and U. Shankarkumar: International
Journal of Human Genetics 2012; 12(1): 37-40
16. Evidence for Novel DRB1*15 allele association among clinically definite
multiple sclerosis patients from Mumbai, India: Sharada Kankonkar, G.

References
72
Jeyanti, B. S. Singhal, and Umapathy Shankarkumar: Human Immunology
2003; 64: 478–482
17. Rating neurologic impairment in multiple sclerosis: An expanded disability
status scale (EDSS) John F. Kurtzke: Neurology (Cleveland) 1983; 33: 1444-
52
18. The tag SNP for HLA-DRB1*1501, rs3135388, is significantly associated
with multiple sclerosis susceptibility: Cost-effective high-throughput
detection by real-time PCR: Maja Živković et al: Clinica Chimica Acta
2009; 406: 27–30
19. A high resolution HLA and SNP haplotype map for disease association
studies in the extended human MHC: Paul I. W. de Bakker et al: Nature
Genetics 2006; 38(10): 1166–1172.
20. SNP-based analysis of the HLA locus in Japanese multiple sclerosis patients:
JP. McElroy et al: Genes and Immunity 2011; 12(7): 523–530.
21. HLA antigens in multiple sclerosis amongst Indians: NH Wadia, VS
Trikannad, PR Krishnaswamy : Journal of Neurology, Neurosurgery, and
Psychiatry 1981; 44: 849-851
22. HLA associations in South Asian multiple sclerosis: Lekha Pandit et al:
Multiple Sclerosis Journal; 2015: 1-6
23. Prevalence and patterns of demyelinating central nervous system disorders in
urban Mangalore, South India: Lekha Pandit and Rashmi Kundapur :
Multiple Sclerosis Journal 2014; 20(12): 1651-1653
References
73
24. Genome wide meta-analysis identifies novel multiple sclerosis susceptibility
loci: Nikolaos A. Patsopoulos et al: Annals of Neurology 2011; 70(6): 897–
912.
25. An extension to a statistical approach for family based association studies
provides insights into genetic risk factors for multiple sclerosis in the HLA-
DRB1 gene: Sreeram V Ramagopalan et al: Bio Medical Central, Medical
Genetics 2009; 10: 10
26. The HLA-DRB1 Alleles Effects on Multiple Sclerosis: a Systematic Review:
Thayane Furtado Rolim Lima: International Archives of Medicine 2015;
8(88): 1-17
27. Multiple sclerosis genetics Stephen: Sawcer, Robin J M Franklin, Maria Ban:
Lancet Neurology 2014; 13: 700–09
28. Multiple sclerosis in India: An overview: Bhim S. Singhal, Hemali Advani :
Annals of Indian Academy Neurology 2015; 18 (Supplement 1): S2-S5
29. HLA-DRB1 associations with disease susceptibility and clinical course in
Australians with multiple sclerosis: J. Stankovich et al: Tissue Antigens
2009; 74: 17–21
30. Multiple sclerosis risk variant HLA-DRB1*1501 associates with high
expression of DRB1 gene in different human populations. Alcina A et al,
PLoS One. 2012;7(1)
31. Bradley Neurology in clinical practice 7th
edition, 1160-1175.
32. The influence of the HLA-DRB1 and HLA-DQB1 allele heterogeneity on
disease risk and severity in Iranian patients with multiple sclerosis.
References
74
International Journal of Immunogenetics, Kollaee A et al, October 2012;
39(5): 414-422.
33. HLA-DRB1: genetic susceptibility and disability progression in a Spanish
multiple sclerosis population. Romero Pinel et al, European Journal
Neurology, February 2001; 18(2): 337–342.
34. The impact of the HLA-A and –DRB1 on age at onset, disease course and
severity in Scandinavian multiple sclerosis patients. Smestad et al European
Journal Neurology. August 2007; 14(8): 835–840.
35. HLA-DR15 is associated with female sex and younger age at diagnosis in
multiple sclerosis. J Neurol Neurosurg Psychiatry. Hensiek etal, February
2002; 72(2): 184–187.
36. Modifying effects of HLADRB1 allele interactions on age at onset of
multiple sclerosis in Western Australia. Wu et al, Multiple Sclerosis. January
2010; 16(1): 15–20.
37. Major histocompatibility complex class II alleles and the course and outcome
of MS: a population-based study. Weinshenker et al, Neurology. September
1998; 51(3): 742-747.
38. The significance of oligoclonical bands in multiple sclerosis: relevance of
demographic and clinical features, and immunogenetic backgrounds. Idiman
et al, Journal of Neuroimmunology. 2009; 212(1-2): 121–124.
39. Association of HLA DRB1*15 allele and CSF oligoclonal bands in a
Spanish multiple sclerosis cohort. Kikuchi et al, Romero-Pinel et al,
European Journal of Neurology. 2011; 18(10): 1258–1262.

References
75
40. HLA-related subpopulations of MS in Japanese with and without oligoclonal
IgG bands. Yélamos-Martínez S et al, Neurology. February 2003; 60(4):
647–651.
41. Presence of CSF oligoclonal bands (OCB) is associated with the HLA-DRB1
genotype in a West Australia multiple sclerosis cohort. Wu et al, Journal
Neurological Sciences. January 2010; 288(1-2): 63–67.
42. Multiple sclerosis with and without CSF bands: clinically indistinguishable
but immunogenetically distinct. Imrell et al, Neurology. September 2006;
67(6): 1062–1064.
43. Epidemiology of multiple sclerosis in south-western Sardinia. Coco et al
Multiple sclerosis, November 2011; 17(11): 1282–1289.
44. Genotype-Phenotype correlations in multiple sclerosis: HLA genes influence
disease severity inferred by 1HMR spectroscopy and MRI measures. Okuda
DT et al, Brain. 2009 Jan;132(Pt 1):250-9
45. A longitudinal study of brain atrophy and cognitive disturbances in the early
phase of relapsing-remitting multiple sclerosis. Zivadinov et al, Journal of
Neurology Neurosurgery Psychiatry 2001;70: 773-780
46. Clinical correlates of grey matter pathology in multiple sclerosis.
Dana Horakova, BMC Neurology 2012, 12:10
47. An investigation of HLA encoded genetic susceptibility to multiple sclerosis
in subjects of Asian Indian and Afro-Caribbean ethnic origin. Kelly et al,
Tissue Antigens. March 1995; 45(3): 197–202.

References
76
48. DQB1*0602 confers genetic susceptibility to multiple sclerosis in Afro-
Brazilians. Caballero A et al, Tissue Antigens. November 1999; 54(5): 524–
526.
49. Genetic correlations of brain lesion distribution in multiple sclerosis: an
exploratory study. Sombekke MH, AJNR Am J Neuroradiol. 2011
Apr;32(4):695-703.
50. HLA DR2 and white matter distribution in MS. Sepulcre et al, Journal of
Neuroimmunology, 2008,18: 228-231.
51. HLA-DR15 is associated with lower age at onset in multiple sclerosis.
Masterman et al, Annals of Neurology. August 2000; 48(2): 211-219.
52. HLA and prognosis in multiple sclerosis. Runmarker et al, Journal of
Neurology. May 1994; 241(6): 385- 390.
53. Association of genetic markers with CSF oligoclonal bands in Multiple
sclerosis patients. Maurizio et al, Plos one, June 2013
54. HLA-DRB1*15:01 and multiple sclerosis: a female association? Irizar et al,
Multiple Sclerosis Journal. May 2012; 18(5): 569–577
55. Genetic susceptibility to multiple sclerosis in a Shanghai Chinese population.
The role of the HLA class II genes. Kelly et al, Human Immunology. March
1995; 42(3): 203-208.
56. Mapping multiple sclerosis susceptibility to the HLA-DR locus in African
Americans. Kelly et al, American Journal of Human Genetics. January 2004;
74(1): 160–167

References
77
57. Gradients in Distribution of HLA – DRB1* Alleles in Castes and Tribes of
South India K. Balakrishnan et al, International of Human Genetics, 2012,
12(1): 45-55
58. Multiple sclerosis: report on 200 cases from Iran. Kalanie, Multiple
Sclerosis. 2003 Feb;9 (1): 36-8.
59. Profile of cytokine gene polymorphisms in Iranian multiple sclerosis
patients. Amir Zargar, Multiple Sclerosis. 2007 March;13(2):253-5.
60. Progress in Multiple Sclerosis Genetics. Goris et al, Current Genomics. 2012
Dec; 13(8): 646–663.
61. Severe, highly active, or aggressive multiple sclerosis. Freedman et al,
Continuum (Minneap Minn) 2016;22(3):761–784.
62. Cognitive impairment in multiple sclerosis. Chiaravalloti ND et al, Lancet
Neurol 2008; 7: 1139–51
63. Disability progression in multiple sclerosis is slower than previously
reported. Helen Tremlett et al, Neurology January 24, 2006 vol. 66 no.
2 172-177
64. Sex ratio of multiple sclerosis in Canada: a longitudinal study, Sarah-
Michelle Orton et al, The Lancet Neurology, November 2006, 5(11) 932–
936
65. Temporal trends in the incidence of multiple sclerosis, Alonso et al,
Neurology July 8, 2008,71(2):129-135
66. Sex ratio of multiple sclerosis and clinical phenotype, Sudovnik et al,
European Journal of Neurology, April 2010, 17(4): 634–637

References
78
67. High- and low-risk profiles for the development of multiple sclerosis within
10 years after optic neuritis: experience of the optic neuritis treatment trial.
Beck et al, Archives of Ophthalmology, July 2003;121(7):944-9.
68. Defining the clinical course of multiple sclerosis. Morrissey et al, Neurology.
2014 Jul 15; 83(3): 278–286
69. Multiple sclerosis. Noseworthy JH1, Lucchinetti C, Rodriguez
M, Weinshenker BG, New England Journal Medicine. 2000 Sep
28;343(13):938-52
70. Early imaging predicts later cognitive impairment in primary progressive
multiple sclerosis. S. Penny, Neurology February 16, 2010 74 (7) 545-552
71. Predictor of outcome in multiple sclerosis based on multivariate models.
Runmaker et al Journal of Neurology, 1994, 241:597–604
72. The natural history of multiple sclerosis: a geographically based study.
Ontario et al, Brain. 1991 April;114 :1057-67
73. Cerebrospinal fluid oligoclonal IgM bands predict early conversion to
clinically definite multiple sclerosis in patients with clinically isolated
syndrome. Ferraro D et al Neurology. 2000 May 9; 54 (9):1720-5.
74. Practice parameter: the usefulness of evoked potentials in identifying
clinically silent lesions in patients with suspected multiple sclerosis (an
evidence-based review): Report of the Quality Standards Subcommittee of
the American Academy of Neurology. Gronseth GS1, Ashman EJ,
Neurology. 2000 May 9; 54 (9):1720-5.

~ fil?n ktti~l~ -'3=uqffiS11'1 ~ si~Eilfltetl ~ kt6q'1~'j~l"l - 695 011' ~' ~
SREE CHITRA TIRUNAL INSTITUTE FOR MEDICAL SCIENCES AND TECHNOLOGY THIRUVANANTHAPURAM - 695 011, INDIA
(An Institute of National importance under Govt. of India)
SCT/IEC/732/FEBRUARY -2015
Dr. Arun Senior Resident
~~·~ r~ff\.' ~·W.·:;;.
""'- w
Institutional Ethics Committee (IEC Regn No. ECR/189/Inst/KL/2013)
Department of Neurology SCTIMST, Thiruvananthapuram
Dear Dr. Arun,
20-04-2015
The Institutional Ethics Committee reviewed and discussed your application to conduct the study entitled
"ASSOCIATION OF HLA-DRB1 *1501 TAGGING RS3135388 GENE POLYMORPHISM WITH MULTIPLE SCLEROSIS
SUSCEPTIBILITY (IEC/732)" on 21 st February, 2015.
The following documents were reviewed:
Original submission
1. Covering letter addressed to the Chairperson, IEC, SCT/MST dated 27.01.2015. 2. TAC Clearance letter. 3. IEC Application Form. 4. Proposal. 5. Proforma. 6. Consent form in English and Malayalam. 7. CVs of the PI and Co-P/.
Revised submission
8. Covering letter addressed to the Chairman, IEC, SCT/MST dated 17.04.2015. 9. Modified IEC Application Form is submitted.
1:fiF. Grams : Chitramet Phone : 2443152
'QJTCR1
Fax : (91 )471-2446433 2550728
Page 1 of 2
{-~ E-mail : set. @ sctimst.ker.nic.in

The following members of the Ethics Committee were present at the meeting held on 21st February, 2015 at G. Parthasarathi Board Room, AMCHSS, SCTIMST.
SL. Member Name Highest Gender Scientific /Non Scientific Affiliation No. Degree with
lnstitution(s)
1. Justice Gopinathan. P.S BSc. Male Legal Expert (Chairperson) No LLB
2. Dr. J. M. Tharakan MD Male Clinician (Cardiologist) Yes
3. Shri. O.S. Neelakandan Nair BE Male Engineer Yes
4. Dr. Meenu Hariharan OM Female Clinician (Gastro- No Enterologist)
5. Dr. R V G Menon PhD Male Lay Person No
6. Dr. Rema M. N MD Female Pharmacologist No
7. Dr. Kala Kesavan. P MD Female Pharmacologist No
8. Dr. Mala Ramanathan MSc, Female Ethicist/Social Scientist Yes PhD, (Member Secretary) MA
IEC Decision
The IEC approved the conduct of the study in the present form.
Remarks:
The Institutional Ethics Committee expects to be informed about the progress of the study, any SAE occurring in the course of the study, any changes in the protocol and patient information/informed consent and asks to be provided a copy of the final report.
There was no member of the study team who participated in voting I decision making process. The ethics committee is organized and operated according to the requirements of Good Clinical Practice and the requirements of the Indian Council of Medical Research (ICMR).
Sincerely,
Mala Ramanathan Member Secretary, IEC
Page 2 of2
References
79
75. MRI criteria for multiple sclerosis in patients presenting with clinically
isolated syndromes: a multicenter retrospective study. Swanton JK, Lancet
Neurology. 2007 Aug;6(8):677-86
76. Differences between Relapsing-Remitting and Chronic Progressive
Multiple Sclerosis as Determined with Quantitative MR Imaging.
Yukio Miki et al, Radiology, Mar 1999, 210: 769–774
77. Histopathologic correlates of hypo intense lesions on T1-weighted spin-echo
MRI in multiple sclerosis. Moriarty et al, Neurology 1998;50: 1282–88
78. Brain atrophy and lesion load predict long term disability in multiple
sclerosis. MAGNIMS group, Journal of Neurology Neurosurgery Psychiatry,
2013 October 84(10)1082-91
79. Regional brain atrophy development is related to specific aspects of clinical
dysfunction in multiple sclerosis. Jasperse B et al, Neuroimage. 2007 Nov
15;38(3):529-37
80. Magnetic resonance evidence of cerebellar cortical pathology in multiple
sclerosis. Massimiliano Calabrese et al, Journal of Neurology Neurosurgery
Psychiatry 2010;81:401-404

1
1 Association of HLA-DRB1*1501 tagging rs3135388 gene polymorphism with multiple sclerosis susceptibility
Proforma to the study of association of HLA-DRB1*1501 tagging
rs3135388 gene polymorphism with multiple sclerosis
1. PATIENT DETAILS
1.1 Name of the patient ____________
1.2 Hospital Number_______________
1.3 Age of the patient ________________
1.4 Sex________1.Male 2.Female
1.5 Occupation_____________
1.6 If outpatient or inpatient -------------- ---------If outpatient date seen in OPD--------------
1.7 If inpatient, date of admission. ------------------
1.8 Phone No 1:---------------------------
1.9 Phone No 2:--------------------------
2. CLINICAL EVALUATION
2.1. Clinical Data:
2.1.a Age of onset of the symptom_________
2.1.b First clinical symptom____________
2.1.c Number of attacks_____________
2.1.d Interval between the attacks__________
2.1.e Current attack_________If yes, details of the attack_______
1.Pyramidal 2.Cerebellar 3.Brain stem 4.sensory 5.Bladder/bowel 6.Visual 7.Cerebral
2.1.f Details of previous attacks_________
Attacks
(month
and
year)
Pyra
midal
Cerebe
llar
Brain
stem
Sensory Bladder/
bowel
Visual Cerebral Treat
ment
give
Resolved
/not

2
2 Association of HLA-DRB1*1501 tagging rs3135388 gene polymorphism with multiple sclerosis susceptibility
2.1.g Family History:
2.2. FUNCTIONAL STATUS SCORE:
A. Pyramidal Functions:
0 = Normal
1 = Abnormal signs without disability
2 = Minimal disability
3 = Mild or moderate paraparesis or hemiparesis, or severe monoparesis
4 = Marked paraparesis or hemiparesis, moderate quadriparesis, or monoplegia
5 = Paraplegia, hemiplegia, or marked quadriparesis
6 = Quadriplegia
B. Cerebellar Functions:
0 = Normal
1 = Abnormal signs without disability
2 = Mild ataxia
3 = Moderate truncal or limb ataxia
4 = Severe ataxia all limbs
5 = Unable to perform coordinated movements due to ataxia
C. Brainstem functions
0 = Normal
1 = Signs only
2 = Moderate nystagmus or other mild disability
3 = Severe nystagmus, marked extra ocular weakness, or moderate disability of
other cranial nerves
4 = Marked dysarthria or other marked disability
5 = Inability to swallow or speak
D. Sensory functions
0 = Normal
1 = Vibration or figure-writing decrease only, in 1 or 2 limbs

3
3 Association of HLA-DRB1*1501 tagging rs3135388 gene polymorphism with multiple sclerosis susceptibility
2 = Mild decrease in touch or pain or position sense, and/or moderate decrease in
vibration in 1 or 2 limbs, or vibratory decrease alone in 3 or 4 limbs
3 = Moderate decrease in touch or pain or position sense, and/or essentially lost
vibration in 1 or 2 limbs, or mild decrease in touch or pain, and/or moderate
decrease in all proprioceptive tests in 3 or 4 limbs
4 = Marked decrease in touch or pain or loss of proprioception, alone or
combined, in 1 or 2 limbs or moderate decrease in touch or pain and/or severe
proprioceptive decrease in more than 2 limbs
5 = Loss (essentially) of sensation in 1 or 2 limbs or moderate decrease in touch or
pain and/or loss of proprioception for most of the body below the head
6 = Sensation essentially lost below the head
E. Bowel and bladder functions
0 = Normal
1 = Mild urinary hesitancy, urgency, or retention
2 = Moderate hesitancy, urgency, retention of bowel or bladder, or rare urinary
incontinence
3 = Frequent urinary incontinence
4 = In need of almost constant catheterization
5 = Loss of bladder function
6 = Loss of bowel and bladder function
F. Visual (or optic) functions
0 = Normal
1 = Scotoma with visual acuity (corrected) better than 20/30
2 = Worse eye with scotoma with maximal visual acuity (corrected) of 20/30 to
20/59 3 = Worse eye with large scotoma, or moderate decrease in fields, but with
maximal visual acuity (corrected) of 20/60 to 20/99
4 = Worse eye with marked decrease of fields and maximal acuity (corrected) of
20/100 to 20/200; grade 3 plus maximal acuity of better eye of 20/60 or less
5 = Worse eye with maximal visual acuity (corrected) less than 20/200; grade 4
plus maximal acuity of better eye of 20/60 or less
6 = Grade 5 plus maximal visual acuity of better eye of 20/60 or less
G. Cerebral (or mental) functions
0 = Normal
1 = Mood alteration only (does not affect EDSS score)

4
4 Association of HLA-DRB1*1501 tagging rs3135388 gene polymorphism with multiple sclerosis susceptibility
2 = Mild decrease in mentation
3 = Moderate decrease in mentation
4 = Marked decrease in mentation
5 = Chronic brain syndrome—severe or incompetent
Functional Status (FS) Score
0 1 2 3 4 5 6
A Pyramidal functions
B Cerebellar functions -
C Brainstem functions -
D Sensory functions
E Bowel and bladder
functions
F Visual functions
G Cerebral functions -
2.3. Cognitive Function Assessment:
2.2. a PASAT:
2.4. Kurtzke Expanded Disability Status Score (EDSS)
0.0 = Normal neurologic exam [all grade 0 in functional status (FS)]
1.0 = No disability, minimal signs in one FS (i.e., grade 1)
1.5 = No disability, minimal signs in more than one FS (more than one grade 1)
2.0 = Minimal disability in one FS (one FS grade 2, others 0 or 1)
2.5 = Minimal disability in two FS (two FS grade 2, others 0 or 1)
3.0 = Moderate disability in one FS (one FS grade 3, others 0 or 1) or mild disability in three
or four FS (three/four FS grade 2, others 0 or 1) though fully ambulatory
3.5 = Fully ambulatory but with moderate disability in one FS (one grade 3) and one or two
FS grade 2; or two FS grade 3; or five FS grade 2 (others 0 or 1)
4.0 = Ambulatory without aid or rest for 500 m
4.5 = Ambulatory without aid or rest for 300 m
5.0 = Ambulatory without aid or rest for 200 m
5.5 = Ambulatory without aid or rest for 100 m

5
5 Association of HLA-DRB1*1501 tagging rs3135388 gene polymorphism with multiple sclerosis susceptibility
6.0 = Unilateral assistance required to walk about 100 m with or without resting
6.5 = Constant bilateral assistance required to walk about 20 m without resting
7.0 = Unable to walk beyond about 5 m even with aid; essentially restricted to wheelchair;
wheels self and transfers alone
7.5 = Unable to take more than a few steps; restricted to wheelchair; may need aid to transfer
8.0 = Essentially restricted to bed or chair or perambulated in wheelchair, but out of bed most
of day; retains many self-care functions; generally has effective use of arms
8.5 = Essentially restricted to bed much of the day; has some effective use of arm(s); retains
some self-care functions
9.0 = Helpless bed patient; can communicate and eat
9.5 = Totally helpless bed patient; unable to communicate or eat
10.0 = Death due to MS
3. INVESTIGATIONS:
3.1. MRI Brain (Mac Donald’s Criteria)
Dissemination in Space:
>/= 1 T2 Lesions in at least 2 of 4 Areas of the CNS:
1. Periventricular
2. Juxtacortical
3. Infratentorial
4. Spinal cord
Dissemination in time:
1. A new T2 and/or gadolinium-enhancing lesion(s) on follow-up MRI, with reference to a
baseline scan, irrespective of the timing of the baseline MRI.
2. Simultaneous presence of asymptomatic gadolinium-enhancing and non enhancing lesions
at any time.
3.1.e MRI based Severity Scale:
3.2. CSF Study:
Total cells Sugar Protein OCBs
Ig G Index
3.3. VEP: P100 Wave prolongation-_____________1.Present 2.Absent.

6
6 Association of HLA-DRB1*1501 tagging rs3135388 gene polymorphism with multiple sclerosis susceptibility
3.4. BAEP:
3.5. SNP analysis:
4. TREATMENT AT DISCHARGE:
4.1 Current disease modifying agent patient is using-______1.Interferon beta-1a 2.Interferon
beta-1b 3.Glatiramer acetate 4.Natalizumab 5. Mitoxantrone 6.Fingolimod 7.Diethyl
fumarate 8. Teriflunamide
4.2 Previously tried disease modifying agents________1.Interferon beta-1a 2.Interferon beta-
1b 3.Glatiramer acetate 4.Natalizumab 5. Mitoxantrone 6.Fingolimod 7.Diethyl fumarate 8.
Teriflunamide.
5. OUTCOME:
5.1 Date of discharge________
5.2 Condition at discharge_______
5.3 Date of new event_____________
5.4 Final diagnosis_______________
5.5 Complications in the Hospital: __________ 1. Pneumonia 2. MI 3. DVT 4. UTI 5. Bedsore 6.
Pulmonary embolism 7. LVF 8.None
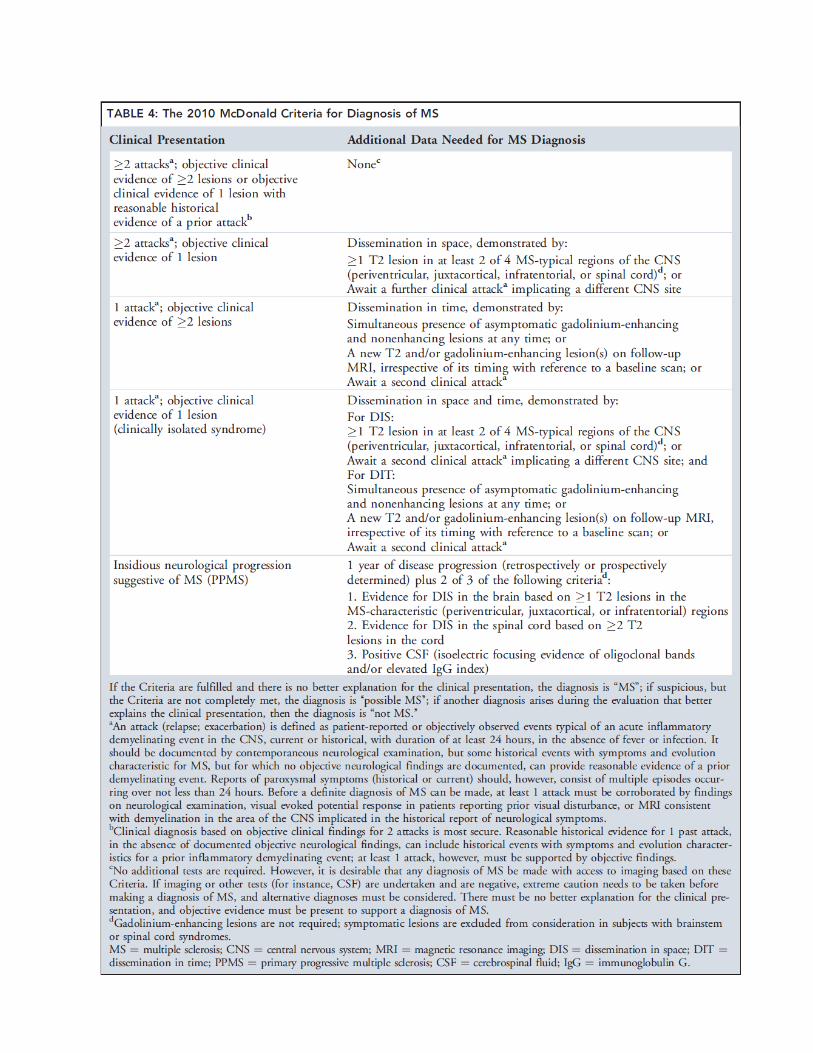
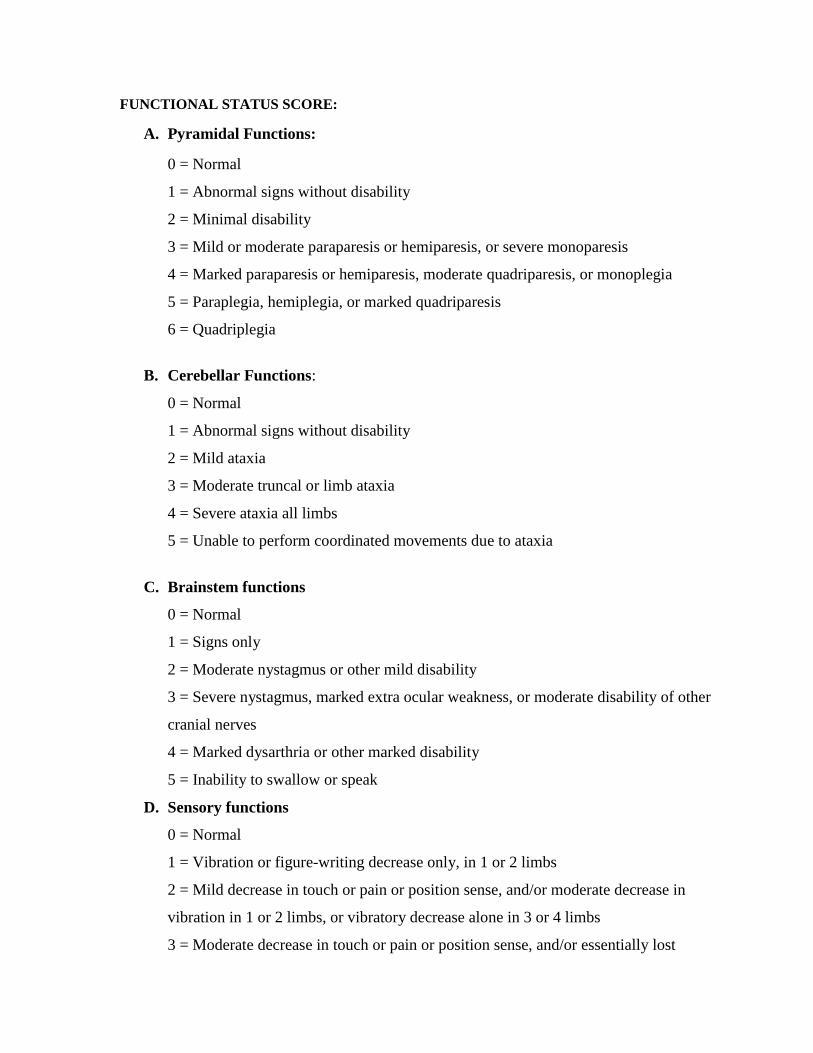
FUNCTIONAL STATUS SCORE:
A. Pyramidal Functions:
0 = Normal
1 = Abnormal signs without disability
2 = Minimal disability
3 = Mild or moderate paraparesis or hemiparesis, or severe monoparesis
4 = Marked paraparesis or hemiparesis, moderate quadriparesis, or monoplegia
5 = Paraplegia, hemiplegia, or marked quadriparesis
6 = Quadriplegia
B. Cerebellar Functions:
0 = Normal
1 = Abnormal signs without disability
2 = Mild ataxia
3 = Moderate truncal or limb ataxia
4 = Severe ataxia all limbs
5 = Unable to perform coordinated movements due to ataxia
C. Brainstem functions
0 = Normal
1 = Signs only
2 = Moderate nystagmus or other mild disability
3 = Severe nystagmus, marked extra ocular weakness, or moderate disability of other
cranial nerves
4 = Marked dysarthria or other marked disability
5 = Inability to swallow or speak
D. Sensory functions
0 = Normal
1 = Vibration or figure-writing decrease only, in 1 or 2 limbs
2 = Mild decrease in touch or pain or position sense, and/or moderate decrease in
vibration in 1 or 2 limbs, or vibratory decrease alone in 3 or 4 limbs
3 = Moderate decrease in touch or pain or position sense, and/or essentially lost

vibration in 1 or 2 limbs, or mild decrease in touch or pain, and/or moderate decrease
in all proprioceptive tests in 3 or 4 limbs
4 = Marked decrease in touch or pain or loss of proprioception, alone or combined, in
1 or 2 limbs or moderate decrease in touch or pain and/or severe proprioceptive
decrease in more than 2 limbs
5 = Loss (essentially) of sensation in 1 or 2 limbs or moderate decrease in touch or
pain and/or loss of proprioception for most of the body below the head
6 = Sensation essentially lost below the head
E. Bowel and bladder functions
0 = Normal
1 = Mild urinary hesitancy, urgency, or retention
2 = Moderate hesitancy, urgency, retention of bowel or bladder, or rare urinary
incontinence
3 = Frequent urinary incontinence
4 = In need of almost constant catheterization
5 = Loss of bladder function
6 = Loss of bowel and bladder function
F. Visual (or optic) functions
0 = Normal
1 = Scotoma with visual acuity (corrected) better than 20/30
2 = Worse eye with scotoma with maximal visual acuity (corrected) of 20/30 to 20/59
3 = Worse eye with large scotoma, or moderate decrease in fields, but with maximal
visual acuity (corrected) of 20/60 to 20/99
4 = Worse eye with marked decrease of fields and maximal acuity (corrected) of
20/100 to 20/200; grade 3 plus maximal acuity of better eye of 20/60 or less
5 = Worse eye with maximal visual acuity (corrected) less than 20/200; grade 4 plus
maximal acuity of better eye of 20/60 or less
6 = Grade 5 plus maximal visual acuity of better eye of 20/60 or less
G. Cerebral (or mental) functions
0 = Normal
1 = Mood alteration only (does not affect EDSS score)

2 = Mild decrease in mentation
3 = Moderate decrease in mentation
4 = Marked decrease in mentation
5 = Chronic brain syndrome—severe or incompetent
Functional Status (FS) Score
0 1 2 3 4 5 6
A Pyramidal functions
B Cerebellar functions -
C Brainstem functions -
D Sensory functions
E Bowel and bladder
functions
F Visual functions
G Cerebral functions -

Kurtzke Expanded Disability Status Score (EDSS)
0.0 = Normal neurologic exam [all grade 0 in functional status (FS)]
1.0 = No disability, minimal signs in one FS (i.e., grade 1)
1.5 = No disability, minimal signs in more than one FS (more than one grade 1)
2.0 = Minimal disability in one FS (one FS grade 2, others 0 or 1)
2.5 = Minimal disability in two FS (two FS grade 2, others 0 or 1)
3.0 = Moderate disability in one FS (one FS grade 3, others 0 or 1) or mild disability in three or
four FS (three/four FS grade 2, others 0 or 1) though fully ambulatory
3.5 = Fully ambulatory but with moderate disability in one FS (one grade 3) and one or two FS
grade 2; or two FS grade 3; or five FS grade 2 (others 0 or 1)
4.0 = Ambulatory without aid or rest for 500 m
4.5 = Ambulatory without aid or rest for 300 m
5.0 = Ambulatory without aid or rest for 200 m
5.5 = Ambulatory without aid or rest for 100 m
6.0 = Unilateral assistance required to walk about 100 m with or without resting
6.5 = Constant bilateral assistance required to walk about 20 m without resting
7.0 = Unable to walk beyond about 5 m even with aid; essentially restricted to wheelchair;
wheels self and transfers alone
7.5 = Unable to take more than a few steps; restricted to wheelchair; may need aid to transfer
8.0 = Essentially restricted to bed or chair or perambulated in wheelchair, but out of bed most of
day; retains many self-care functions; generally has effective use of arms
8.5 = Essentially restricted to bed much of the day; has some effective use of arm(s); retains
some self-care functions
9.0 = Helpless bed patient; can communicate and eat
9.5 = Totally helpless bed patient; unable to communicate or eat
10.0 = Death due to MS

1
Association of HLA-DRB1*1501 tagging rs3135388 gene polymorphism with multiple sclerosis susceptibility
CONSENT FORM (Subjects)
Inform Sree Chitra Tirunal Institute of Medical Science and Technology Thiruvananthapuram,
Kerala-695011
TITLE OF STUDY: “Association of HLA-DRB1*1501 tagging rs3135388 gene
polymorphism with multiple sclerosis. ̋
Principal investigator: Dr. Arun K
Principal Co-investigators: Dr C. Sarada
Dr Moinak Banerjee
Introduction:
This is an important form. Please read it carefully. It tells you what you need to know
about this study. If you agree to take part in this research study, you need to sign this form.
Your signature means that you have been told about study and what the risks are. Your
signature on this form also means that you want to take part in this study.
Why is this study being done?
Multiple sclerosis (MS) is an autoimmune disease of the central nervous system
(CNS) leading to demyelination, axonal damage, and progressive neurological disability. It
has been proved that HLA-DRB1*1501 has the strongest association with MS, with a
consistent influence within the cohort. Within the HLA-DRB1 gene, the rs3135388 SNPs
have been demonstrated as the most strongly associated with MS. Only a few genetic
association studies have been published that address this gene polymorphism in relation to
MS. In the present study, the HLA-DRB1*1501 allele rs3135388 gene polymorphism will be
investigated in relation to MS susceptibility, disability and potential gender differences in the
South Indian population.
You are invited to participate in this study as a subject if you are having relapsing and
remitting Multiple sclerosis.
How many people will take part in the study?
The plan is to include 160 patients with relapsing and remitting Multiple sclerosis

2
Association of HLA-DRB1*1501 tagging rs3135388 gene polymorphism with multiple sclerosis susceptibility
based on the Mc Donald’s criteria and 160 healthy volunteers.
What will happen in the study?
Your participation will require:
Donation of about 10 cc of blood to be drawn from a vein in your arm. The procedure
will take about 15 minutes.
Blood samples will be sent to Rajiv Gandhi Centre for Biotechnology, Trivandrum for
genetic analysis. Because the genetic tests in this study are not used for regular
medical care, you will not be told about the results of the test(s). The test results will
not be put in your medical record either.
How long will I be in the study?
You will be in the study for a minimum of 2 years though blood donation is a one time event.
Will any biological sample(s) be stored and used in the future by Rajiv
Gandhi Centre for Biotechnology, Trivandrum?
No
What are the risks of the study?
There may be the minor pain associated with the needle stick required during blood
drawing. There is also light chance of bruising at the site of needle puncture.
Are there benefits to taking part in this study?
You will receive no direct benefit from participation in this study.
What other choices do I have if I don’t take part in this study?

3
Association of HLA-DRB1*1501 tagging rs3135388 gene polymorphism with multiple sclerosis susceptibility
The study is only being done to gather scientific information. You may choose not to
take part in this study.
What are the costs of the tests and the procedures?
You will not need to pay for any tests or procedures, which are done just as a part of
the research study.
Who can answer my questions?
You may talk to Dr. Arun K at any time about any question you have on this study.
You may contact Dr. Arun K by calling him at the phone number: 08281232084.
Will I lose my rights if I do not take part in this study?
Taking part in this research study is your decision. You do not have to take part in this
study if you are unwilling. Your medical care in SCTIMST now or in the future will not be
affected whether or not you take part in this study.
You will be told of important new findings that may happen, if you choose to have
that information.
You do not give up any of your rights by taking part in this study.
What about confidentiality?
Data from this study may be published. However, your name and other identifying
information will not be sent outside of SCTIMST.

4
Association of HLA-DRB1*1501 tagging rs3135388 gene polymorphism with multiple sclerosis susceptibility
Declaration
I had an opportunity to have my questions answered. I have been given a
copy of this form. I agree to take part in this study.
_____________ __________________________________ ___________
(Date) (Signed and printed name of Participant) (Clinic)
number)
_____________ ____________________________________________________
(Date) (Signed and printed name of Individual obtaining consent)
_____________ _______________________________________
(Date) (Signed and printed name of witness)

1
Association of HLA-DRB1*1501 tagging rs3135388 gene polymorphism with multiple sclerosis
susceptibility
CONSENT FORM (CONTROLS)
Principle Investigator: - Dr. Arun K
Principle Co-Investigator:- Dr.C.Sarada,
Dr.Moinak Banerjee
Hospital: Sree Chitra Tirunal Institute for Medical sciences and Technology
Title of the Study:
Association of HLA-DRB1*1501 tagging rs3135388 gene polymorphism with
multiple sclerosis.
Introduction:
You are being requested to participate in a study on " Association of HLA-
DRB1*1501 tagging rs3135388 and gene polymorphism with multiple sclerosis".
This study aims to have 160 number of patients with multiple sclerosis and equal
number healthy control individuals.
If you take part what will you have to do?
The study will require consent only at the time of enrolment. You will be
subjected to withdraw about 10 ml of blood for detection of HLA-DRB1*1501
tagging rs3135388 gene polymorphism in the blood. The participation in the study is
purely voluntary. These results appear to be very promising in future applications in
clinical tests, to complement or replace classical HLA typing.
Will you have to pay for the investigations?
All the investigations done for the purpose of the study will be done free of
cost. No additional follow up visits are required.
Will your personal details be kept confidential?
The results of this study will be published in a medical journal but you will not
be identified by name in any publication or presentation of results. However, your
medical notes may be reviewed by people associated with the study, without your
additional permission.

2
Association of HLA-DRB1*1501 tagging rs3135388 gene polymorphism with multiple sclerosis
susceptibility
If you have any further questions, please ask Dr.Arun K (Tel: 08281232084)
email: [email protected]
This test for detection of SNP is not currently included in the diagnostic test
for multiple sclerosis but only for research purpose.
Participant’s name:
Date of Birth / Age (in years):
Declaration:
I_________________________________________________, Son/daughter
of _____________ declare that I have read the above information provided to me
regarding the study: “Association of HLA-DRB1*1501 tagging rs3135388 and
rs3135391 gene polymorphism with multiple sclerosis". and have clarified any doubts
that I had. [ ]
• I also understand that participation in this study is entirely voluntary and that I am
free to withdraw permission to continue to participate at any time without affecting
my usual treatment or my legal rights [ ]
• I understand that the study staff and institutional ethics committee members will not
need permission to look at health records even if I withdraw from the trial. I agree to
this access [ ]
• I understand that the participant’s identity will not be revealed in any information
released to third parties or published [ ]
• I received a copy of this signed consent form [ ]
Name:
Signature:
Date:
Name of witness:
Signature:
Date:

3
Association of HLA-DRB1*1501 tagging rs3135388 gene polymorphism with multiple sclerosis
susceptibility
I attest that the requirements for informed consent for the medical research
project described in this form have been satisfied. I have discussed the research
project with the participant and explained to him or her in non-technical terms all of
the information contained in this informed consent form, including any risks and
adverse reactions that may reasonably be expected to occur. I further certify that I
encouraged the participant to ask questions and that all questions asked were
answered.
________________________________ ___________________
Name and Signature of Person Obtaining Consent

kzta[-bm-bpÅ k½-X-]{Xw (k-_vP-IvSvkv)
{ioNn¯ncXncp-\mÄ C³Ìn-äyq«v t^mÀ saUn-¡Â kb³kv Bâv sSIvt\m-f-Pn, Xncp-
h-\- -́]pcw , tIcfw þ695011.
]T\ hnjbw :
aÄ«n-¸nÄ kv¢o-tdm-knkpw HLA –DRB1 *1501 sâ kqN-I-amb rs 3135388Dw X½n-
epÅ _Ôw .
{][m\ Kth-j-I³: tUm.-A-cp¬.sI
CXv Hcp {][m-\-s¸« t^mdw BWv . Zb-hmbn CXv {i²tbmsS hmbn-¡pI .Cu
]T-\-s¯¡pdn¨v \n§Ä Adn-tb-−-sXÃmw CXp shfn-s¸-Sp-¯p-¶p. Cu Kth-jW ]T-
\-̄ n ]¦p-tN-cp-hm³ \n§Ä¡v k½-X-am-sW-¦n Cu t^md-¯n \n§Ä H¸n-
tS−XmWv. Cu ]Ts¯¸änbpw CXn-ep-−m-Ip¶ dnkv¡p-Isf¸änbpw \n§Ä¡p
]dªp X¶n-cn-¡p¶p F¶-XmWv \n§-fpsS H¸v hyà-am-¡p-¶Xv . \n-§Ä Cu ]T-\-
¯n ]s¦-Sp-¡p-hm³ B{K-ln-¡p-¶p F¶pw Cu t^md-̄ n-epÅ \n§-fpsS H¸v
AÀ°-am-¡p-¶p.
Cu ]T-\w F´n\p th−n-bmWv \S-̄ p-¶Xv ?
aÄ«n-¸nÄ kv¢o-tdm-knkv tI{µ \mUohyh-Ø-bpsS Hcp kz{]Xn-tcm-[-tcm-K-am-
Wv. CXv ssaen³ Bh-cWw {Zhn¨p t]mIÂ, BIvtkm¬ \miw , `b-¦-c-amb \mUo-
ssh-Ieyw F¶n-hbv¡p Imc-W-am-Ip-¶p. aÄ«n-¸nÄ kv¢o-tdm-knkv tcmKn-Isf \Ã-
t]mse kzm[o-\n-¡p¶ HLA –DRB1 *1501 aÄ«n-̧ nÄ kv¢o-tdm-knkpambn ià-
ambn _Ô-s¸-«n-cn-¡p-¶p-sh¶v sXfn-bn-¡-s¸-«n-«p−v. HLA –DRB1 Po\n¬ Xs∂
rs3135388 aÄ«n-̧ nÄ kv¢o-tdm-kpambn ià-ambn _Ô-s¸-«n-cn¡p¶sX¶v hyà-am-bn-
«p−v. aÄ«n-̧ nÄ kv¢otdm-kn-kp-ambn _Ô-s¸« Cu Po³ t]mfn-tamÀ^n-k-s¯-̧ än
hfsc Ipd¨p P\n-XI ]T-\Ipdn¸p-Isf {]kn-²o-I-cn-̈ n-«p-Åp. Ct¸m-gs¯ Cu ]T-\-
¯n Z£n-tW´ybnse aÄ«n-¸nÄ kv¢otdm-kn-kv hcm³ km[y-X-bp-ÅXpw, sshI-ey-
ap-Å-Xp-ambtcmKn-I-fn HLA –DRB1 *1501 sâ kqN-I-amb rs 3135388sâ ]¦v
F´v F¶v Is−-¯p-¶-XmWv . ]pcp-j-\n-em-tWm, kv{Xobn-emtWm CXpIqSp-X-se¶p
sXfn-bn-¡p-¶-Xm-Wv.

\n§Ä¡v h¶pw t]mbpw sIm−n-cn-¡p¶ aÄ«n-̧ nÄ kv¢o-tdm-knkv Ds−-¦nÂ
\n§sf Cu ]T-\-¯n Hcp ]T-\-hnj-b-hp-ambn ]s¦-Sp-¡p-hm-\mbn £Wn¨psImÅp-
¶p.
Cu ]T-\-̄ n F{X t]À ]s¦-Sp¡pw?
saIvsUmWmÄUnsâ am\-ZWvU{]Im-capÅ CS-hn«p hcp¶ aÄ«n-̧ nÄ
kv¢otdm-kn-kpÅ 160 tcmKn-I-sfbpw, 160 Btcm-Ky-hm-\m-am-cmb hf-−n-bÀam-scbpw
DÄs¡m-Ån-¡p-hm-\mWv Dt±-in-¡p-¶Xv.
Cu ]T-\-̄ n F´mWv \S-¡p-¶Xv ?
\n§Ä ]s¦-Sp-¡p-I-bm-sW-¦n sN¿p-¶Xv
• ssIbnseshbn-\n \n¶pw GI-tZiw 10cc càwZm\w sN¿Ww. CXn\v GI-
tZiw 15 an\p«v ka-b-sa-Sp-¡pw.
càkm¼n-fpIÄ P\n-XI ]cn-tim-[-\bv¡mbn Xncp-h-́ -]p-cs¯ cmPo-hv
KmÔnskâvÀ t^mÀ _tbm-sS-¡vt\m-f-Pn-bn-te-¡-b¡pw Fs´-¶m Cu ]T-\-̄ n-\m-
h-iy-amb P\n-XI ]cn-tim-[-\-IÄ km[m-cWsaUn-¡Â sSkväpIfn sN¿m-dn-Ã. B
sSkväp-I-fpsS dnk«v \n§sf Adn-bn¡pIbn-Ã. sSÌnsâ ^e-§Ä \n§-fpsS saUn-
¡Â sdt¡mÀUp-I-fnepw hbv¡p-¶Xv AÃ.
Cu ]T-\-̄ n F{X-Imew Rm³ D−m-bn-cn-¡Ww ?
cà-Zm\w Hscmä XhW sNbvXm aXn-sb-¦nepw \n§Ä Cu ]T-\-̄ n Ipd-
ªv 2 hÀj-sa-¦nepw D−m-bn-cn-t¡-−-Xm-Wv.
Xncp-h- -́]p-cs¯ cmPohvKmÔn skâÀ t^mÀ _tbm-sS-Ivt\m-f-Pn-bn GsX-
¦nepw ssPho-I-km-¼n-fp-IÄ kq£n-¡p-Itbm `mhn-bn D]-tbm-Kn-¡p-Itbm
sN¿ptam ?
CÃ.
Cu ]T-\-̄ nse dnkv¡p-IÄ Fs´m-s¡-bmWv ?
càw FSp-¡p-hm-\mbn kqNn-Ip-¯p-t¼mÄ Hcp sNdnb thZ\ A\p-̀ -h-s¸-¶-Xm-
bn-cn-¡pw. kqNnIp¯nb CS¯v \ndhy-Xymkw D−m-Im³ t\cnb km[y-X-bp-−v.

Cu ]T-\-̄ n ]s¦-Sp-¡p-¶-Xp-sIm−v Fs -́¦nepw em`-apt−m?
Cu ]T-\-̄ n ]s¦-Sp-¡p-¶-Xp-sIm−v {]Xy-£-amb Hcp em`hpw \n§Ä¡v e`n-¡p-
¶-X-Ã.
Cu ]T-\-¯n ]s¦-Sp-¡p-¶-Xp-sIm−v aä vF´v tNmbvkv BWv F\n¡p e`n-
¡pI ?
imkv{Xobhnh-c-§Ä tiJ-cn-¡p-hm³ am{X-am-bmWv Cu ]T\w \S-̄ p¶Xv.
\n§Ä¡v Cu ]T-\-¯n ]s¦-Sp-¡mXncn¡mw F¶p Xocp-am-\n-¡mw.
]cn-tim-[-\-IÄ¡pw aäpw F´p Nne-hp-h-cpw?
\n§Ä ]cn-tim-[-\-IÄ¡pw aäpw H¶pw Nne-hm-t¡-−-Xnà Fs -́¶m CsXÃmw
Kth-jW ]T-\-¯nsâ `mK-ambn sN¿p-¶-XmWv. Hcp \mUn-]-cn-tim-[-\-bpw, cà-sa-Sp-
¡epw cà-km-¼n-fnsâ P\n-X-I-]-cn-tim-[-\-bp-amWv CXn DÄs¸-Sp-¶-Xv.
Fsâ tNmZy-¯n-\pÅ D¯cw Bcp \evIpw ?
Cu ]T-\-hp-ambn _Ô-s¸« GXv tNmZyhpw \n§Ä¡v Ft¸mÄ thWsa-¦nepw tUm.
Acp¬. sI tbmSp- tNm-Zn-¡mw.08281232084 F¶ t^m¬ \¼-dn hnfn¨v \n§Ä¡v
tUm. Acp¬.sI sb _Ô-s¸-Smw.
Cu ]T-\-¯n ]s¦-Sp-¡p-¶n-sÃ-¦n Fsâ Ah-Im-i-§Ä F\n¡p \jvS-am-
Iptam ?
Cu Kth-jW]T-\-¯n ]s¦-Sp-¡pI F¶Xv \n§-fpsS Xocp-am\am-Wv.
\n§Ä¡v CjvSansÃ-¦n Cu ]T-\-¯n ]s¦-Sp-¡m-Xn-cn-¡mw. Cu ]T-\-¯nÂ
\n§Ä ]s¦-Sp-¯mepw CsÃ-¦nepw Fkv.- kn. -Sn. sF. Fw. Fkv. -Sn.-bnse NnInÕ
Ct¸mtgm hcpw Ime-§-fntem Hcp hn[-̄ n\pw _m[n-¡-s¸-Sp-I-bn-Ã.
\n§Ä¡v Cu ]T-\-hp-ambn _Ô-s¸«v In«m-\n-S-bpÅ {][m-\-s¸« ]pXnb
Is−-¯-ep-I-sf-̧ än Adn-bp-hm³ B{K-l-aps−-¦n Adnbn-¡p-¶-Xm-Wv.
Cu ]T-\-¯n ]s¦-Sp-¡m-¯-Xp-sIm−v \n§-fpsS Ah-Im-i-§-sfm¶pw Dt]-
£n-t¡−n hcn-I-bnÃ

hnizm-kyX F{Xt¯m-f-aq−m-bn-cn¡pw ?
Cu ]T-\-¯n \n¶pw e`n-¡p¶ Ipdn-̧ p-IÄ {]kn-²o-I-cn-¡p-hm³ km[y-X-bp-−v.
F¶n-Xp-¶mepw \n§-fpsS t]tcm aäp Xncn-̈ -dn-b hnh-c-§tfm Fkv. kn. -Sn.- sF.-
Fw. Fkv. Sn. -bn \n¶pw ]pd-t¯¡p t]mIp-¶-X-Ã.
{]Jym-]\w
Fsâ tNmZy-§Ä¡v D¯cwe`n-¡p-hm-\pÅ Hcp Ah-kcw F\n-¡p-−m-bn. Cu
t^md-¯nsâ Hcp tIm¸n F\n¡p \evIn-bn-«p-−v. Cu ]T-\-¯n ]s¦-Sp-¡p-hm³
F\p-¡p-k-½-X-am-Wv.
(Xn¿Xn) (]-s¦-Sp-¡p¶ Bfnsâ t]cpw H¸pw) (¢n-\n-¡v)
(Xn¿Xn) (k-½-X-]{Xw hm§¶ Bfnsâ t]cpw H¸pw)
(Xn-¿-Xn) (km-£n-bpsS t]cpw H¸pw)

14%SIMILARITY INDEX
1
2
3
4
5
6
7
8
Arun_Thesis.docxORIGINALITY REPORT
PRIMARY SOURCES
www.ajnr.orgInternet
Houtchens, Maria K., Fred D. Lublin, Aaron E. Miller,and Samia J. Khoury. "Multiple Sclerosis and OtherInflammatory Demyelinating Diseases of the Central NervousSystem", Neurology in Clinical Practice, 2012.Crossref
M. A. Sahraian. "Black holes in multiple sclerosis:definition, evolution, and clinical correlations : Blackholes in MS", Acta Neurologica Scandinavica, 12/2009Crossref
Sawcer, Stephen, Robin J M Franklin, and Maria Ban."Multiple sclerosis genetics", The Lancet Neurology,2014.Crossref
A. Goris. "A Taqman assay for high-throughputgenotyping of the multiple sclerosis-associated HLA-DRB1*1501 allele", Tissue Antigens, 10/2008Crossref
www.mstrust.org.ukInternet
www.msoz.org.auInternet
K M Myhr. "Disability and prognosis in multiplesclerosis: demographic and clinical variablesimportant for the ability to walk and awarding of disability
170 words — 3%
168 words — 3%
143 words — 3%
108 words — 2%
50 words — 1%
40 words — 1%
19 words — < 1%
16 words — < 1%

9
EXCLUDE QUOTES ON
EXCLUDE BIBLIOGRAPHY ON
EXCLUDE MATCHES OFF
pension", Multiple Sclerosis, 02/01/2001Crossref
Narapureddy, Bayapareddy, Naveen KH, PallaviMadithati, Rajiv Singh, and Pirabu RA. "Socio-demographic profile and health care seeking behaviour of ruralgeriatric population of Allahabad district of UP: A cross sectionalstudy", International Journal of Medical Science and PublicHealth, 2012.Crossref
15 words — < 1%

sl. NoHospital
numberAge Sex
Age of
onset of
the
symptom
First
clinical
symptom
Number of
attacksInterval between the attacks
Current
attack
1 373814 24 2 20 6 4june 2012,august 2012,
august 2013, nov 2013nil
2 294591 18 2 14 7 5April 2009,nov 2011,nov
2013,april 2014, april 20167
3 391631 21 1 20 6 2 6 months 8
4 404935 27 2 12 4 72001, 2004, 2006, 2007,
2009, 2010,20156
5 245906 36 2 20 7 8
sept2005, dec 2005, june
2006, feb 2007, 2010,feb
2011,dec 2014
nil
6 387450 45 2 43 7 4May 2014, july 2014, oct
2014, nov 2014 nil
7 186205 34 2 32 6 4July 2000, 2002, April 2003,
jan 2014 nil
8 375621 26 2 20 6 2 August 2011, Feb 2014 7
9 299688 46 2 46 7 1 0 7
10 411655 37 1 29 7 3 2008, 2011, 2015 7
11 412404 22 2 21 7 3Jan 2015, March 2016, May
20167
12 412405 18 2 18 6 1 0 6
13 412052 40 2 29 7 3 2005,2013, 2016 6
14 301422 24 2 17 6 8
2009, 2009, 2009,2009,
2009, 2009, Dec2014, Aug
2015
6
15 390396 26 2 15 5 7
2007, 2010, 2011, 2012,
2014 (may and aug), dec
2015
7
16 391157 40 1 35 7 3 2010, 2012, 2014 6
17 197969 31 1 20 7 7
Nov 2001, Oct 2002, jan
2010, july 2010, nov 2010,
feb 2011, may 2013
7
18 389527 21 2 18 7 1 Nov-14 7
19 350988 17 2 13 5 6
Aug 2011, Sept 2011, Aug
2012, Sept 2012, Oct 2012,
feb 2013
6
20 404327 41 1 41 6 1 Jan-15 6
21 415541 44 2 38 4 4March 2010, 2012, 2014,
20167
22 415905 38 2 34 8 3 2012, 2014, April 2016 7
23 394889 23 2 20 6 4Dec2013, Jan 2014, March
2015, Feb 20164

24 404587 65 2 65 5 2 July 2015, Oct 2015 7
25 371112 37 2 29 5 6
June 2005, May 2006,August
2007, Dec2009, Aug 2012,
May 2013
8
26 352423 16 2 16 5 1 2012
27 400231 42 1 30 6 4 2004, 2006,2012, 2014 NIL
28 312671 28 2 28 7 1 0 7
29 239382 39 2 46 6 7
April 2005, December 2005,
2006, December 2008, July
2012, October 2012
4
30 326783 15 1 14 4 2 May 2010, March 2011 nil
31 378112 25 2 23 7 6
Aug 2013, Oct 2013,Nov
2013, Nov 2014, Dec 2014,
April 2015
NIL

1
2
3
4
5
6
7
8
Genotype and alleles in MS carriers and controls. AA homo/
hetero,GA/ GG- Also the gender distribution with genotype?
Genotype and age of onset of first symptom?
Genotype and number of relapses?
Genotype and site predeliction in brain?
Genotype and the functional disability by EDSS?
Genotype and MRI Brain T2 load?
MMF-M
REBIFF-R
DIMETHYL FUMARATE-DMF
CORELATIONS TO BE STATISTICALLY EVALUATED:
Age of onset of the disease?
Mean disease duration?
IgG INDEX DECREASED-13
VEP PROLONGED-14
BAEP PROLONGED 15
AVONEX-A
GLATIRAMER-G
IVMP-MP
SPINAL CORD-7
COGNITIVE -9
CSF OCB POSITIVE- 10
CSF OCB NEGATIVE- 11
IgG INDEX INCREASED-12
MALE-1
FEMALE-2
CEREBRAL-3
OPTIC NERVE-4
CEREBELLAR-5
BRAINSTEM-6

9
10
11
12
13
14
15
Black Holes- pesent, absent
Brainstem lesions-present, Absent
Cerebellar lesions- Present, Absent
Spinal cord lesions-1, >1, Confluent
DRB1 association with MS susceptibility?
EDSS and number of spinal cord focal lesions?
Normal IgG Index-0.3-0.7 , Increased-1
Juxtacortical-1, >1-->2
Optic nerve lesions-1,>1
Genotype and MRI Spine T2 load and number of segments
affected?
Genotype and CSF Protein levels?
Genotype and OCB Positivity?
Genotype and elevated IgG index?
Genotype and electrophysiological corelation(VEP)?
SNP and MS severity- any association?ie EDSS

sl. No
1
2
3
4
5
6
7
8
9
10
11
12
13
14
15
16
17
18
19
20
21
22
23
Details of previous
attacksEDSS
Periventri
cular
JUXTACOR
TICAL
optic
nerve
lesions
Black holes AtrophyCerebellar
lesions
Brainstem
lesions
june & aug 2012-5+6,
AUG 2013-4, Nov 2013-
5+7
3 19 2 Absent Present Present present present
7,4,4,5+7 3.5 16 Absent Absent Present Absent Absent
6 0 19 2 Absent Absent Absent Absent Absent
2001-4, 2004-7, 2006-
7, 2007-4+5, 2009-7,
2010-7,2015-6
2 19 2 Absent Absent Absent present present
2005-7, 2005-7, 2006-
7, 2007-7, 2010-4,
2011- 4, 2014-7
1 19 2 Present Absent Present present present
May 2014-7, july 2014-
8, oct 2014-6, nov
2014-6
1.5 17 2 Absent Absent Absent present present
July 2000- 5+6, 2002-4,
April 2003-4, jan 2014-
6
0 17 1 Present Absent Present Absent present
Aug2012-6, 2014-7 2.5 19 2 Present Absent Present present present
7 2 19 2 Absent Present Absent Absent present
2008-7, 2011-7, 2015-7 3.5 17 2 Absent Present Present present present
jan 2015-7, March
2016-7, May 2016-71 17 2 Absent Absent Absent present present
6 0 19 2 Absent Absent Present Absent present
2005-7, 2013-7, 2016-6 3 19 2 Absent Absent Absent Absent Absent
2009-6, 2009-7, 2009-
5,2009-7, 2009-6, 2009-
4, Dec2014-7, Aug
2015-6
3 19 2 Absent Absent Absent present present
2007-5, 2010-7, 2011-
4, 2012-4, 2014(May)-
7, 2014(Aug)- 3 , Dec
2015- 7
2 19 2 Absent Present Absent Absent Absent
2010-7, 2012-4, 2014-6 0 17 2 Absent Absent Absent Absent present
Nov 2001-7, Oct 2002-
7, Jan 2010-4+5, July
2010-5, Nov 2010-9,
Feb 2011-5, May 2013-
5 19 2 Present Absent present present present
7 0 17 2 Absent Present Present Absent Absent
Aug 2011-5+6, Sept
2011-6, Aug 2012-6,
Sept 2012-6, Oct 2012-
2.5 19 2 Absent Absent Present Absent Absent
jan 2015-6 0 17 1 Absent Absent Present Absent Absent
March 2010-4,2012-4,
2014-6, 2016-7 5 18 2 Absent Present Present Absent present
2012-8, 2014, April
2016-71.5 19 2 Absent Absent Absent Absent present
Dec2013-6, Jan 2014-7,
March 2015-6, Feb
2016-4
17 2 Absent Absent Absent Absent present

24
25
26
27
28
29
30
31
July 2015-5, Oct 2015-
70 19 2 Absent Absent Present Absent Absent
June 2005-5, May 2006-
5,August 2007-7,
Dec2009-8, Aug 2012-
8, May 2013-8
6 19 2 Absent Present Present Absent Absent
2012-5 0 17 1 Absent Absent Absent Absent Absent
2004-6, 2006-5,2012-6,
2014-2 GTCS4.5 19 2 Absent Present Present Absent present
7 0 19 2 Absent Absent Absent Absent Present
April 2005-6,Dec 2005-
7, 2006-4, Dec 2008-6,
July 2012-7, Oct 2012-
4
0 19 2 Absent Absent Present present present
May 2010- 4, March
2011-60 19 2 Absent Absent present Present Present
Aug 2013-7, Oct 2013-
7,Nov 2013-7, Nov
2014-7, Dec 2014-6,
April 2015-7
2 17 2 Absent Absent Present Absent present

1
2
3
4
5
6
7
8

9
10
11
12
13
14
15

sl. No
1
2
3
4
5
6
7
8
9
10
11
12
13
14
15
16
17
18
19
20
21
22
23
spinal
cord
lesions
4
Absent
2+
CONFLUE
NT
CONFLUE
NT
CONFLUE
NT
CONFLUE
NT
Absent
CONFLUE
NT
CONFLUE
NT
CONFLUE
NT
3
Absent
CONFLUE
NT
CONFLUE
NT
1
2
CONFLUE
NT
4
Absent
1
CONFLUE
NT
4
3

24
25
26
27
28
29
30
31
1
Absent
CONFLUE
NT
Absent
CONFLUE
NT
Absent
3
4

1
2
3
4
5
6
7
8

9
10
11
12
13
14
15

sl. No
1
2
3
4
5
6
7
8
9
10
11
12
13
14
15
16
17
18
19
20
21
22
23
CSF
ProteinCSF Sugar OCB IgG Index VEP BAEP SNP
Current
disease
modifyin
g agent
patient is
Previousl
y tried
disease
modifyin
g agents
58 63 10 1 14 15 G A
28.4 71 11 1 14 NORMAL R A
83 68 10 1 14 15 DMF A
42 61 10 1 NORMAL NORMAL A MP
42 71 10 1 NORMAL NORMAL G G
68 123 10 NORMAL NORMAL A A
39 43 11 14 15 A A
32 `122 10 1 14 15 A MP
38 66 10 14 15 MP nil
40 77 10 NORMAL NORMAL G G
18 102 10 NORMAL NORMAL MP MP
21 82 10 1 NORMAL NORMAL A MP
34 86 11 NORMAL NORMAL MP MP
56 51 11 14 15 A
54 61 10 14 NORMAL G MP
36 127 10 NORMAL NORMAL MP A
34 65 11 1 14 NORMAL R
MP,
METHOTR
EXATE
34 104 10 1 14 15 G A
45 76 10 1 14 NORMAL G MP
41 64 10 1 NORMAL NORMAL A MP
58 108 10 1 14 NORMAL A
Unsuccess
ful CSFNORMAL NORMAL A
21 59 10 1 14 NORMAL R R,MP