asset/liability management pensions and other post employment benefits
DESCRIPTION
Asset/Liability Management Pensions and Other Post Employment Benefits. State Association of County Retirement Systems (SACRS) February 6, 2007 Navigating Public Pensions & OPEB with Liability Driven Investments Ryan Labs (www.ryanlabs.com) Sean McShea [email protected] - PowerPoint PPT PresentationTRANSCRIPT
1Ryan Labs Asset Management Asset/Liability Management
Asset/Liability Management Pensions and Other Post Employment Benefits
State Association of County Retirement Systems (SACRS)February 6, 2007
Navigating Public Pensions & OPEBwith Liability Driven Investments
Ryan Labs (www.ryanlabs.com)
Sean McShea [email protected] Adair [email protected] Johnson [email protected]

2Ryan Labs Asset Management Asset/Liability Management
Pension & OPEB: Problems
Problems:
1. Under Funding
2. Higher Net Costs (Accrued Liabilities)
3. Higher Contributions
4. Compounding in reverse (Negative Leverage)
5. CPI & COLA inflation < Medical inflation
6. Demographics
7. Mortality tables
8. Sunset communities vs. Sunrise communities

3Ryan Labs Asset Management Asset/Liability Management
Pension & OPEB: Crisis In Public Plans
Causes:
1. Silo effect (optimization in isolation)
2. Agency problem (no one in charge)
3. Morality issues (wealth transfer)
4. Asset Only Framework (mean variance models)
5. Actuarial Smoothing (No economic content)
6. Pro forma Accounting Return Assumptions
7. Lack of Financial Economics in pension practices
8. Peer Group (Beauty Contest)

4Ryan Labs Asset Management Asset/Liability Management
Solution Framework
Objectives Fund liabilities at lowest relative cost
Fund liabilities at lowest relative risk
Enhance Financial Statements
Enhance Credit Rating
Rules GASB 25, GASB 45
Teams Assets v. Liabilities
Playing field Present Value
Time Annual Financial Statements
Scoreboard Custom Liability Index
5Ryan Labs Asset Management Asset/Liability Management
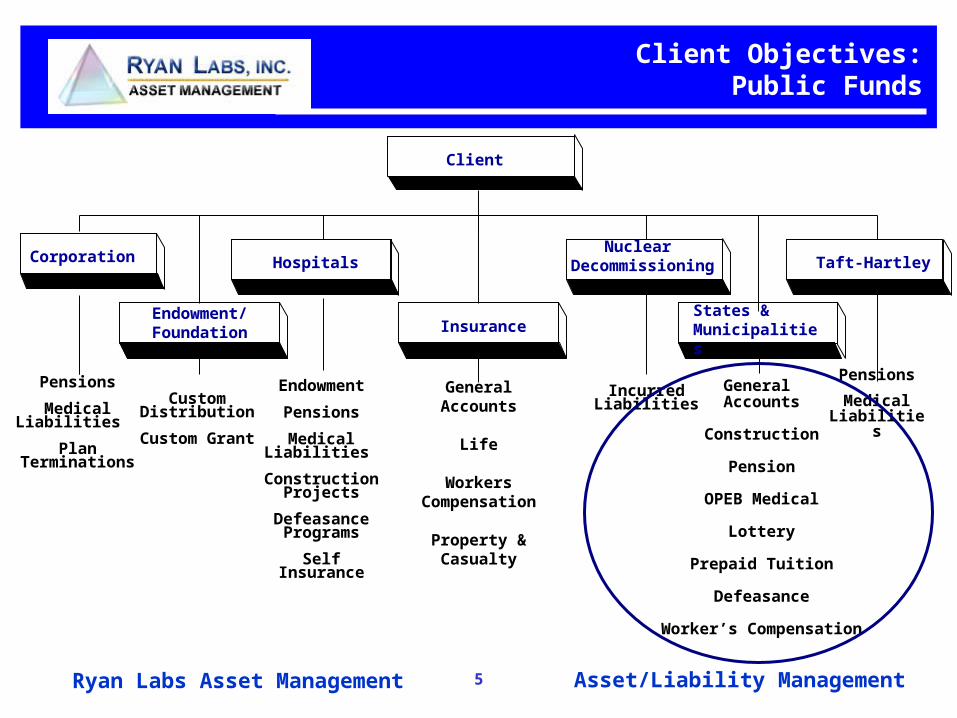
Client Objectives:Public Funds
Endowment
Pensions
Medical Liabilities
Construction Projects
Defeasance Programs
Self Insurance
Client
Pensions
Medical Liabilities
Pensions
Medical Liabilities
Plan Terminations
General Accounts
Life
Workers Compensatio
n
Property & Casualty
Custom Distribution
Custom Grant
General Accounts
Construction
Pension
OPEB Medical
Lottery
Prepaid Tuition
Defeasance
Worker’s Compensation
Incurred Liabilities
Nuclear Decommissioning
States &Municipalities
Taft-HartleyHospitals
InsuranceEndowment/Foundation
Corporation

6Ryan Labs Asset Management Asset/Liability Management
Government will not default on it promise
Prefunding ensures intergenerational fairness
Current stakeholder pays fair share current cost
Future stakeholder pays only for future cost
Minimize current costs by capturing equity risk premium
Protect the municipal bond rating and bonding capacity
Participants exchange direct for deferred compensation
Stakeholders own the pro rata share of balance sheet
Public Plans:Assumptions

7Ryan Labs Asset Management Asset/Liability Management
1. Benefit Management
Current benefits, Benefit enhancements
2. Contribution strategy
% of active payroll
Constrained by budget
3. Asset Allocation
Capture equity risk premium (Reduce cost)
Avoid risk
Public Plans:Three Key Levers

8Ryan Labs Asset Management Asset/Liability Management
Teams: Asset/Liability Watch (December 2006)
2006: Good year !!

9Ryan Labs Asset Management Asset/Liability Management
Assets vs. Liabilities Funding Volatility (December 2006)

10Ryan Labs Asset Management Asset/Liability Management
Risk: Risk is Based on the Objective
Risk is best defined as NOT meeting the client objective:
No Risk = Assets Match Liabilities
High Risk = Assets Don’t Match Liabilities
(Surplus Volatility)
Low Risk = Assets Behave Like Liabilities
Return of Portfolio – Return
of ObjectiveNew Sharpe Ratio =
STD (Portfolio Return – Objective Return)

11Ryan Labs Asset Management Asset/Liability Management
GASB 25 versus FASB 87/158(Difference between Public & Private)
Private versus Public
Authority FASB (Norwalk, CT) GASB (Norwalk, CT)
Inception 1973 1984
Mission Financial reporting
Output Useful, transparent information
Focus Point in time snapshotsOngoing
View in perpetuity
Bankruptcy Settlement focus Remote
Solvency Increased focus Not reported
Users Shareholders Stakeholders
12Ryan Labs Asset Management Asset/Liability Management
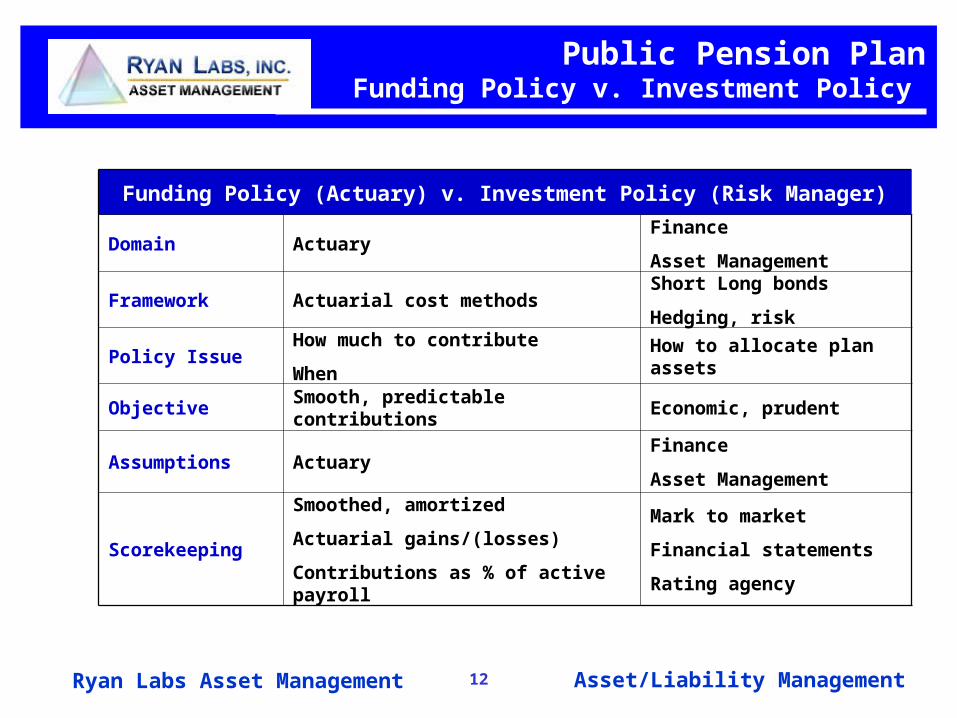
Public Pension PlanFunding Policy v. Investment Policy
Funding Policy (Actuary) v. Investment Policy (Risk Manager)
Domain ActuaryFinance
Asset Management
Framework Actuarial cost methodsShort Long bonds
Hedging, risk
Policy IssueHow much to contribute
When
How to allocate plan assets
ObjectiveSmooth, predictable contributions
Economic, prudent
Assumptions ActuaryFinance
Asset Management
Scorekeeping
Smoothed, amortized
Actuarial gains/(losses)
Contributions as % of active payroll
Mark to market
Financial statements
Rating agency
13Ryan Labs Asset Management Asset/Liability Management
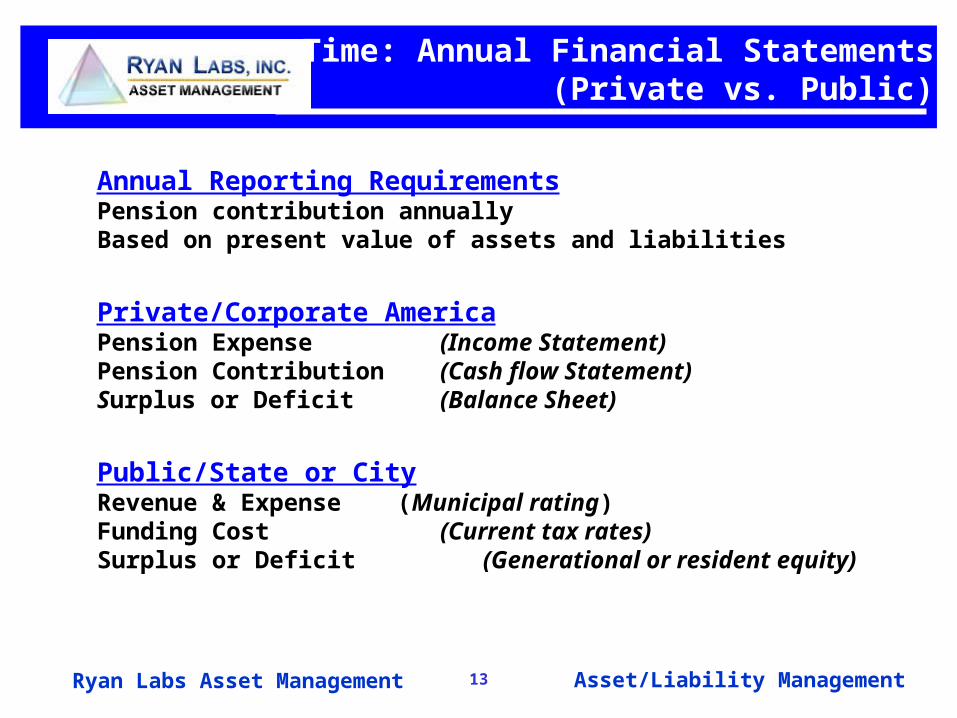
Time: Annual Financial Statements(Private vs. Public)
Annual Reporting RequirementsPension contribution annuallyBased on present value of assets and liabilities
Private/Corporate AmericaPension Expense (Income Statement) Pension Contribution (Cash flow Statement)Surplus or Deficit (Balance Sheet)
Public/State or CityRevenue & Expense (Municipal rating)Funding Cost (Current tax rates)Surplus or Deficit (Generational or resident equity)

14Ryan Labs Asset Management Asset/Liability Management
Rules: GASB 43 & 45(Non Pension Related Liabilities)
OPEB Other post employment benefits
GASB 43 Financial Reporting for Post Employment Benefit Plans Other Than pension plans
Requires accrual of liabilitiesReplaces pay-as-you go basis
GASB 45 Requires accrual of OPEB expense

15Ryan Labs Asset Management Asset/Liability Management
Playing Field: Time FrameLong Term Horizon v. Solvency
Public Plans : Horizon (10 to 20 year horizons)Prevailing Pension practiceSmoothing Assets (5, 10, 15 years)Amortization of Liabilities (15 to 30 years)Fully funding (assumes asset allocation return of 8%)Assumes Sponsorship Longevity
Private : Economic SolvencyBest Practice methodologyFair Value of Assets and Liabilities (Basel II)No smoothing100% interest rate drivenMark to Mark Valuation on Assets vs. Liabilities

16Ryan Labs Asset Management Asset/Liability Management
Playing Field: Solvency / Present Value $
Future value (Projected benefit payments)Inflation, COLAS, MortalityLabor costs/demographicsPlan designDon't know the future value of assets
Present valueDetermines funding adequacyRequired by SEC/FASB/PPA 2006100% interest rate drivenPriced using yield curve

17Ryan Labs Asset Management Asset/Liability Management
Public Fund Risk: Unpleasant Issues
Public Pension & OPEB PlansBankruptcy Taxpayer will pay
Stakeholders Taxpayers may escape deficits
Long Term FocusIntergenerational risk sharing
LT focus captures rewards without commensurate risks
Risk (Traditional)Annual contributions as a percent of active payroll or tax revenue
Smoothing Smoothing masks risk

18Ryan Labs Asset Management Asset/Liability Management
Problem: Investment ProcessPrevailing Practice vs. Best Practice
Current Actuarial Models and Methods
Current practice is not best practice
Financial Economic models expose flaws in standard modes
Calls for revision of actuarial training and practice
Financial Economics and Actuarial PracticeTony Day
Presented at The Great Controversy: Current Pension Actuarial Practice in Light of Financial Economics Symposium
Sponsored by the Society of ActuariesVancouverJune 2003

19Ryan Labs Asset Management Asset/Liability Management
Problem: Pro Forma ReturnsRisk Premium Review
75 Years, Starting Dec.
1925
Prospects January
2006 Starting Dividend Yield 5.40% (a) 1.94%
Growth in Real Dividends 1.00% 1.00%
Change in Valuation Levels* 1.70% ?????
Cumulative Real Return 8.10% 2.94%±
Less Starting Bond Real Yield 3.70% (b) 2.10% (c)
Less Bond Valuation Change**
-0.40% ?????
Cumulative Risk Premium 4.70% 0.84%
(a) Dividend Yield of S&P 500 Index(b) 3.7% yield, less an assumed 1926 inflation expectation of zero(c) The yield on US government inflation-indexed bonds
Based on Ibbotson data and First Quadrant research

20Ryan Labs Asset Management Asset/Liability Management
Generational Equality (Fair share of costs)
Pro Forma mechanism transfers risk ($1 equity > $1 bonds)
Reward is captured today, risk is transferred to the future
Smoothing feels good but contains no “economic” content
Current practice favors current management, taxpayers, plan participants, politicians, at the expense of future shareholders and stakeholders (taxpayers).
Source: Risk Transfer in Public Pension Plans, Jeremy Gold, PRC WP 2002-18, 2002, Pension Research CouncilThe Wharton School, University of Pennsylvania
Problem: StakeholderCurrent vs. Future

21Ryan Labs Asset Management Asset/Liability Management
Sub Optimal Decision Making
Benefit leakage (wage / pension negotiation)
Asset Allocation focused on asset only framework
Granting of valuable options (DROPS, skim funds)
Costly financing options (i.e. Pension Obligation Bonds)
Wealth transfer devices (i.e. Infrastructure Securitization)
Source: Risk Transfer in Public Pension Plans, Jeremy Gold, PRC WP 2002-18, 2002, Pension Research CouncilThe Wharton School, University of Pennsylvania
Problem for StakeholdersExpected Returns

22Ryan Labs Asset Management Asset/Liability Management
Actuarial Flaw: (Benefit Management & Funding)
Single Discount Rate
(Assumes “horizontal” term structure)
Not fully determined by market interest rates
(Usually 100 to 400 plus basis points too high)
Present Value calculation performed annually
(Usually the month plus delinquent)
Liability Term Structure not visible
(Short, Intermediate, Long, Very Long)
Problem: Actuarial Valuations (Mispricing Liabilities)

23Ryan Labs Asset Management Asset/Liability Management
Robert North, Chief Actuary of New York City
Actuarial methods based on actuarial interest rate (AIR)
Ignores financial economics
North ratio: NYCRS 70% Funded ($14 B deficit)
2005 CAFR : NYCRS 99% Funded (No deficit)
Source: Life & Pensions magazine, March 2006
Problem: DisclosureA New York City Pension Story

24Ryan Labs Asset Management Asset/Liability Management
Problem : Generic Indexes(Mean Variance Models)
Mean Variance Models based on Generic Indexes
Represent the market (Lehman Aggregate, S&P 500)(Subjective methodology)(Potential bias = Investment Banking, Trading)
NOT based on client liability schedule(Unique to each client)
Does NOT represent clients’ true objective

25Ryan Labs Asset Management Asset/Liability Management
Scoreboard: Custom Liability Index
Goal Measure growth, size, shape of liabilities
Features Market value, yield, duration, returns
Return Total return, index levels
Performance Money management index
Quantifies asset allocation

26Ryan Labs Asset Management Asset/Liability Management
Solutions: Adopt Liability Benchmark

27Ryan Labs Asset Management Asset/Liability Management
Structure Difference Liabilities vs. LB Aggregate
Duration Cell Port (% ) YTW MDUR Port (% ) YTW MDUR Port (% ) YTW MDURSHORT (0.00 - 0.50) 1.8 5.0 0.2 0.4 2.3 0.3 1.3 2.6 0.00.5 - 1.5 4.3 4.9 0.9 7.4 5.1 1.2 -3.1 -0.2 -0.21.51 - 2.5 4.4 4.7 1.9 10.9 4.9 1.9 -6.5 -0.2 0.02.51 - 3.5 4.4 4.6 2.9 9.1 5.0 2.9 -4.7 -0.4 -0.13.51 - 4.5 4.5 4.5 3.9 19.1 5.2 4.0 -14.6 -0.7 -0.14.51 - 5.5 4.5 4.4 4.9 18.8 5.5 5.0 -14.3 -1.1 -0.2LMTD (0.51 - 5.50) 22.0 4.6 2.9 65.3 5.2 3.5 -43.2 -0.6 -0.65.51 - 6.5 4.4 4.5 5.8 15.1 5.3 5.8 -10.7 -0.8 0.06.51 - 7.5 4.4 4.6 6.8 5.5 5.1 6.9 -1.1 -0.5 -0.17.51 - 8.5 4.3 4.6 7.8 2.5 5.0 7.6 1.8 -0.4 0.18.51 - 9.5 4.3 4.7 8.8 1.9 5.0 8.8 2.3 -0.4 0.09.51 - 10.5 4.2 4.7 9.7 1.2 5.1 9.6 2.9 -0.4 0.1INTER (5.51 - 10.50) 21.6 4.6 7.7 26.3 5.2 6.6 -4.7 -0.6 1.110.51 - 11.5 4.0 4.7 10.7 1.5 5.4 10.7 2.5 -0.6 0.011.51 - 12.5 3.9 4.8 11.7 2.5 5.6 11.7 1.4 -0.8 0.012.51 - 13.5 3.7 4.8 12.6 2.2 5.4 12.7 1.5 -0.5 0.013.51 - 14.5 3.6 4.9 13.6 1.2 5.5 13.5 2.4 -0.6 0.114.51 - 15.5 3.4 4.9 14.6 0.2 5.6 14.4 3.2 -0.7 0.215.51 - 16.5 3.3 4.9 15.6 0.3 4.9 15.8 3.0 0.0 -0.216.51 - 17.5 3.1 4.9 16.5 0.0 0.0 0.0 3.1 4.9 16.517.51 - 18.5 3.0 4.9 17.5 0.0 5.1 17.6 3.0 -0.2 -0.118.51 - 19.5 2.8 4.9 18.5 0.0 0.0 0.0 2.8 4.9 18.519.51 - 20.5 2.7 4.9 19.5 0.0 0.0 0.0 2.7 4.9 19.5LONG (10.51 - 20.50) 33.5 4.8 14.7 8.0 5.4 12.3 25.5 -0.6 2.420.51 - 21.5 2.5 4.8 20.5 0.0 0.0 0.0 2.5 4.8 20.521.51 - 22.5 2.4 4.8 21.4 0.0 0.0 0.0 2.4 4.8 21.422.51 - 23.5 2.3 4.8 22.4 0.0 0.0 0.0 2.3 4.8 22.423.51 - 24.5 2.1 4.8 23.4 0.0 0.0 0.0 2.1 4.8 23.424.51 - 25.5 2.0 4.8 24.4 0.0 0.0 0.0 2.0 4.8 24.425.51 - 26.5 1.8 4.8 25.3 0.0 0.0 0.0 1.8 4.8 25.326.51 - 27.5 1.7 4.7 26.3 0.0 0.0 0.0 1.7 4.7 26.327.51 - 28.5 1.6 4.7 27.3 0.0 0.0 0.0 1.6 4.7 27.328.51 - 29.5 0.8 4.7 28.2 0.0 0.0 0.0 0.8 4.7 28.229.51 - 30.5 0.5 4.7 29.3 0.0 0.0 0.0 0.5 4.7 29.3VLONG (20.51 - 30.50) 17.6 4.8 23.9 0.0 0.0 0.0 17.6 4.8 23.9ULTRA (30.51+) 3.5 4.7 36.2 0.0 0.0 0.0 3.5 4.7 36.2TOTAL 100.0 4.7 12.7 100.0 5.2 5.0 0.0 -0.5 7.7
Note: YTW = Yield To WorstMdur = Modified Duration
DifferenceLehman AggregateTotal Lives

28Ryan Labs Asset Management Asset/Liability Management
Solution:First Steps
Reduce Risk, Protect Expected ROA
29Ryan Labs Asset Management Asset/Liability Management
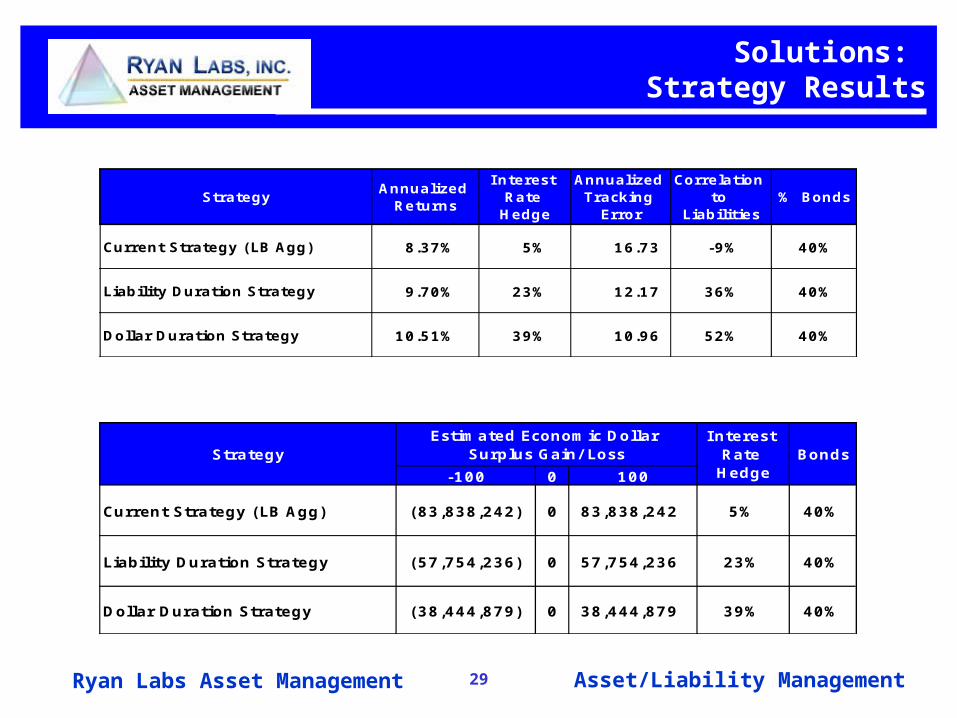
Solutions: Strategy Results
1 8.37% 5% 16.73 -9% 40%
2 9.70% 23% 12.17 36% 40%
3 10.51% 39% 10.96 52% 40%Dollar Duration Strategy
Current Strategy (LB Agg)
Annualized Returns
Liability Duration Strategy
% BondsCorrelation
to Liabilities
StrategyAnnualized Tracking
Error
Interest Rate Hedge
-100 0 100
0 Current Strategy (LB Agg) (83,838,242) 0 83,838,242 5% 40%
1 Liability Duration Strategy (57,754,236) 0 57,754,236 23% 40%
2 Dollar Duration Strategy (38,444,879) 0 38,444,879 39% 40%
Estimated Economic Dollar Surplus Gain/ LossStrategy
I nterest Rate Hedge
Bonds

30Ryan Labs Asset Management Asset/Liability Management
Scoreboard: Custom Liability Index
Goal Measure growth, size, shape of liabilities
Features Market value, yield, duration, returns
Return Total return, index levels
Performance Money management index
Quantifies asset allocation

31Ryan Labs Asset Management Asset/Liability Management
Benefits
Represents client objective (funding target)
Supports strategic & tactical asset allocation
Benchmark for asset management
Benchmark for performance measurement
Benchmark for risk management control
Foundation for risk budgeting
Solution: Custom Liability Index
32Ryan Labs Asset Management Asset/Liability Management
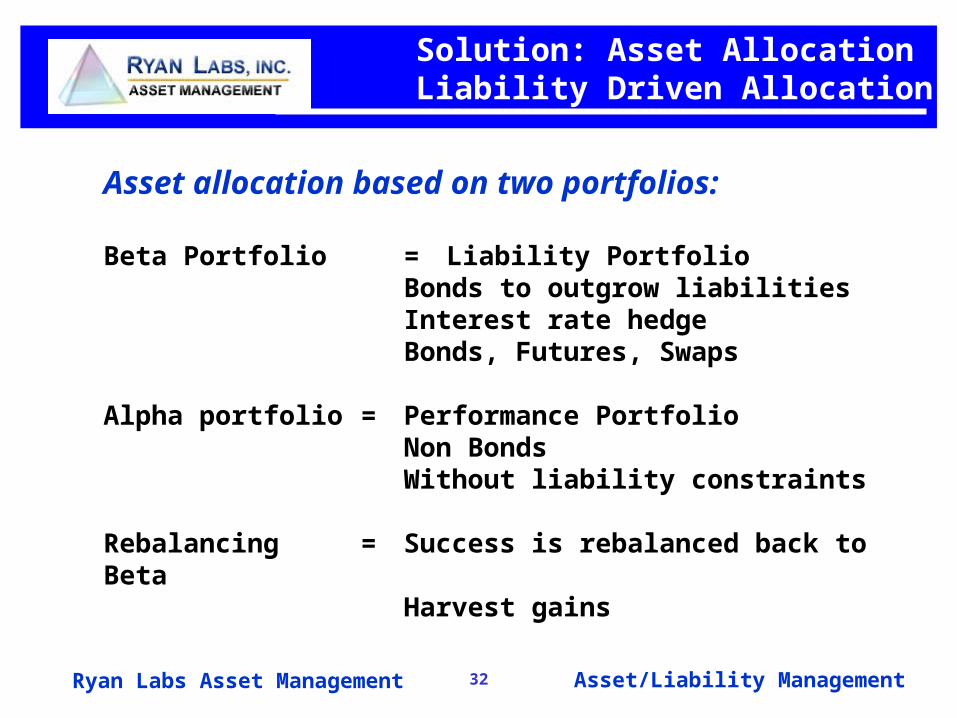
Asset allocation based on two portfolios:
Beta Portfolio = Liability PortfolioBonds to outgrow liabilitiesInterest rate hedgeBonds, Futures, Swaps
Alpha portfolio = Performance PortfolioNon BondsWithout liability constraints
Rebalancing = Success is rebalanced back to BetaHarvest gains
Solution: Asset Allocation Liability Driven Allocation
33Ryan Labs Asset Management Asset/Liability Management
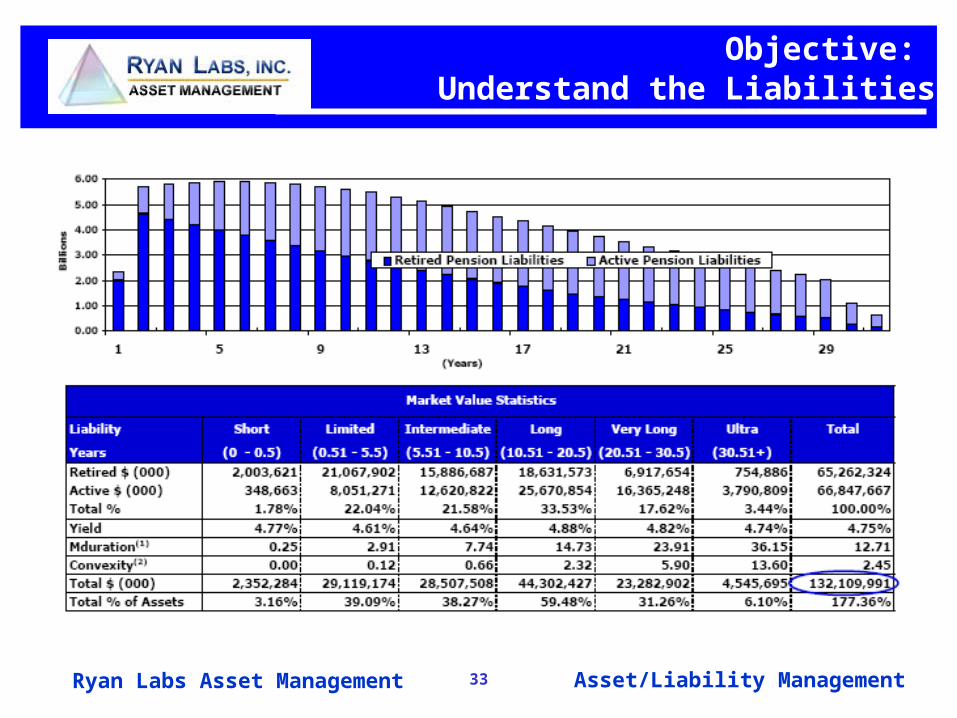
Objective: Understand the Liabilities

34Ryan Labs Asset Management Asset/Liability Management
Problem: Negative Leverage

35Ryan Labs Asset Management Asset/Liability Management
Solution: New Approach(New methodologies)
Transparency
Fair Value Accounting
Asset/Liability Management
Focus on Asset Allocation (Strategic/Tactical)
Alternative Asset Classes (Low correlation)

36Ryan Labs Asset Management Asset/Liability Management
Liability Risk
Asset Mix Risk
Active Risk
Traditional Approach LDI Approach
Source: Leo de Bever, Ontario Teachers' Pension
Solution: New Approach(New methodologies)

37Ryan Labs Asset Management Asset/Liability Management
Solution: Move Away From Single Focused Strategies
Source: First Quadrant/Research Affiliates

38Ryan Labs Asset Management Asset/Liability Management
Ryan Labs: Assets vs. Liabilities Monitor
The information presented herein was compiled from sources believed to be reliable. It is intended for illustrative purposes only, and is furnished without responsibility for completeness or accuracy.Past performance does not guarantee future results.
••
• ••
• •• •
••
• • • • • • • •• • • • •
•
6%
8%
10%
12%
14%
16%
6%
8%
10%
12%
14%
16%
0 2 4 6 8 10 12 14 16 18 20 22 24Volatility of Total Return (STD)
Twenty Year Returns - Period ending 12/31/05
Sources: Ryan Labs, Inc.- Standard & Poor's Corporation - Lehman Brothers - Merrill Lynch - Morgan Stanley Capital International - Frank Russell Company - Financial Times - Wilshire Asset Management - Crandall, Pierce & Company
AnnualizedReturn
•
••
••
••
•
•
•
•
• •
•
••
•
AnnualizedReturn
Ryan Labs5yr. Treasury
6.95%
Short Intermediate Long Very Long
Ryan Labs2yr. Treasury
6.16%
LehmanAggregate
7.88%
Ryan LabsLiability11.07%
Ryan Labs LiabilityIndex is represented by
the Treasury STRIPcurve (1 thru 25 years)
Merrill LynchYankee8.63%
Ryan Labs10yr. Treasury
7.58%
Ryan Labs6 mo. Bill 5.24%
FInancial TimesEquity Pacific
7.30%
Wilshire SmallCap Growth
12.00%
Ryan Labs3yr. GIC
6.75%
Merrill LynchHigh Yield
9.26%
Wilshire LargeCap Value
12.15%
S&P 50011.93%
P&I Asset10.61%
MSCI EAFE10.00%
Russell 200011.17%
Ryan Labs30yr. Treasury
8.79%
Assets vs. Liabilities Monitor(Last 20 years ending 2005)

39Ryan Labs Asset Management Asset/Liability Management
••
••
••
•••
••
••••• • • •
• • • • • •
-6%
-4%
-2%
0%
2%
4%
-6%
-4%
-2%
0%
2%
4%
0 2 4 6 8 10 12 14 16 18 20 22 24 26
Ann
ualiz
ed E
xces
s R
etur
ns v
s. R
yan
Labs
Lia
bilit
y In
dex
(%) A
nnualized Excess R
eturns vs. Ryan Labs Liability Index (%
)
Ryan Labs3yr. GIC
••
••
•
•
•
••
•
•
•
•
••
•
•
Ryan Labs5yr. Treasury
Merrill LynchHigh Yield
Merrill LynchConvertible
FInancial TimesEquity Pacific
LehmanAggregate
Ryan LabsLiability Index
P&I Asset
Ryan Labs LiabilityIndex is a proxy
for pension plans
Merrill LynchYankee
Wilshire LargeCap Growth
Ryan Labs10yr. Treasury
Wilshire LargeCap Value
MSCI EAFE
Russell 2000
Ryan Labs6 mo. Bill
Ryan Labs2yr. Treasury
Ryan Labs30yr. Treasury
LehmanGC Long
S&P 500
Annualized Tracking Error (TE) vs. Ryan Labs Liability Index (%)
Asset/Liability Return DifferenceAnd Tracking Error (Last 20 years)
Asset/Liability Return Difference

40Ryan Labs Asset Management Asset/Liability Management
Solution: Equity Correlation to Liabilities
Equity Correlations to Liabilities
Time HorizonAnnualized
Return on S&P 500
Annualized Return on
Liabilities (1)
Correlation
(S&P v. Liabilities)
1950 to 1960 16.16 1.54 (0.20)
1960 to 1970 8.18 1.47 0.21
1970 to 1980 8.44 4.73 0.25
1980 to 1990 13.94 13.69 0.40
1990 to 2000 17.44 11.24 0.26
2000 to 2002 (17.12) 10.71 (0.60)
2002 to 2004 19.45 6.17 0.02
2004 to 2006 10.21 5.95 (0.19)
(1) RL Treasury Long Index from 1949 to 1990, RL Liability Index from1991 to 2006,

41Ryan Labs Asset Management Asset/Liability Management
Solution: Next Steps
1. Adopt Liability Driven Investment strategy
2. Design Custom Liability Index
3. Document economic solvency
4. Document cash flow budgeting
5. Segregate Liability portfolio
6. Segregate performance portfolio
7. Reduce deficit, harvest gains back to liabilities
8. Grow surplus
9. Monitor risk
10. Document, Document, Document

42Ryan Labs Asset Management Asset/Liability Management
Solution: Small Steps
1. Move from prevailing practice to best practice
2. Create economic and actuarial reporting
3. Replace Policy benchmark with Liability benchmark
4. Understand limitations of peer group analysis
5. Structure fixed income to liabilities
6. Segregate Surplus (performance portfolio)
7. Positive story to trustees and rating agencies
8. Protect defined benefit pension plans