asset management peer...
TRANSCRIPT

Asset Management Peer Exchange
Rollout & Implementation of the Transportation Asset Management Guide Volume 2
NCHRP Project 0869
AASHTO Spring Meeting: Natchez, Mississippi
May 19, 2010 Spy Pond Partners

Welcome
Michael Bridges: Undersecretary of Transportation, Louisiana DOT, and Chair of NCHRP Panel for Project 0869
Neil Pederson: AASHTO Subcommittee on Asset Management
Page 2

Research team members presenting today
Paul D Thompson, Colorado
George JasonSmith, AECOM, NZ
Mark Gordon, AECOM, NZ
Hyun-A ParkSpy Pond Partners, Boston
Spy Pond PartnersPage 3

Workshop Agenda
Introduction and TAM Guide Overview Mark Gordon
Session 1: Why Transportation Asset Management Mark Gordon
Session 2: Getting Started Hyun-A Park
Session 3: Transportation Asset Management Plan George JasonSmith
Session 4: Putting TAM into practice Paul Thompson
Group Discussion FHWA
Wrap up and next steps Michael Bridges
Page 4

INTRODUCTION AND TAM GUIDE OVERVIEW
Page 5

Project NCHRP 0869 objectives
• Supplement AASHTO’s TAM Guide Vol.1 with a second volume that focuses on establishing and executing TAM programs in transportation agencies, with particular attention to highway assets.
• Document the benefits of TAM.
• Provide additional guidance for implementing asset management concepts, principles, performance targets, strategies, tools, analysis methods, data collection, and application of management system information based on the framework presented in Vol. 1.
Include examples of:
• Use of tools for evaluating return on investment and improving economic efficiency, resource allocation, and budgeting decisions;
• Strategies for enhancing communication and information sharing among decision-makers and elected officials; and
• Ways that ERP systems can effectively support TAM.Page 6

Intended audience for TAM Guide
User groups:
• Federal Highways Administration
• State Departments of Transportation
• Local planning organizations, and transportation practitioners
• Decision makers
Other potential users:
• Consultants
• Software and tool developers
• Educators
• Researchers
Page 7

Today’s Workshop
First steps in rolling out the TAM Guide – raise the profile at management level
Peer exchange – what DOTs are currently doing, and how the Guide could be used for the next steps
Recognize the role of executive leadership in implementing TAM agency-wide
Recognize that TAM implementation is a “journey” – the destination may be clear but the road can twist and turn
Page 8

Perspectives on TAM
Transportation Asset Management is a strategic and systematic process of operating, maintaining, upgrading and expanding physical assets effectively throughout their lifecycle. It focuses on business and engineering practices for resource allocation and utilization, with the objective of better decision-making based upon quality information and well defined objectives.(NCHRP Report 632)
Page 9
Management
Engineering
Economics
Finance
MarketingLeadership
Culture
…the business of infrastructure …

The importance of infrastructure
• Infrastructure underpins national economies and supports lifestyles
• It’s often taken for granted by the community until it fails• It represents a major investment by communities
progressively built up over a long period• It provides a platform for economic growth and social
development
Page 10

The Guide is intended to stimulate strategic thinking about transportation infrastructure
• What do we want to accomplish, and why?
• Do we need to change the current business model to achieve these objectives?
• What resources are available to succeed in this mission?
• How do we measure success?
Page 11

TAM Business Model – Five Core Questions
• What is the current state of my assets?
• What are my required levels of service and performance delivery?
• Which assets are critical to sustained performance delivery?
• What are my best investment strategies for operations, maintenance, replacements and improvement?
• What is my best long-term funding strategy?FHWA Multisector Asset Management brochure
Page 12

How can the Guide be used?
• As a modular, resource document
• As a sequence of implementation steps
• For knowledge transfer and bridging the gaps
Page 13

AASHTO TAM Guide Volumes 1 and 2 are interlinked
Page 14

TAM Guide 2 road map – 14 steps to implementation …
Page 15
Part One Part Two

… plus case studies
Page 16

TAM is not a part of the business, it is the business
WHY TRANSPORTATION ASSET MANAGEMENT
Segment 1
Page 18

Segment OverviewWhy Transportation Asset Management
1. Provides a key link to performance management
2. Improves service levels
3. Documents agency approach to addressing needs
4. Helps explain why funds are needed and provides accountability for effective use of funds
Page 19

1. Link to performance management
Page 20
Purpose of asset management:
To meet a required level of service, in the most cost effective manner, through the management of assets for present and future customers.(International Infrastructure Management Manual, NAMS, 2006)

Today’s Challenges
Growing Travel
Volume and Congestion
Aging Infrastructure
Networks
Increasing Use of
Technology to Solve Problems
Limited Financial
Resources
Growing Pressure Nationally and Locally for Performance
and Accountability

The TAM Guide will assist agencies meet the challenges
• Greater accountability to the public and funding agencies.
• Maximizing use of resources within a highly constrained funding environment.
• Linking investment levels to infrastructure condition and transportation system performance.
• Preserving assets and improving safety in the face of growing impacts and costs of asset deterioration.
• Public expectations for more sustainable transportation solutions.
Page 22

Evolution of TAM in the US
Pavement Management Systems used in some agencies
Initiation of Pontis BMS effort by FHWA
A few custom bridge management systems in place
Program management approaches used by a few agencies
ISTEA, federal transportation authorization requires six management systems
FHWA creates Office of AM, AASHTO creates subcommittee on AMMany agencies initiate management system efforts – most with limited success
Interest in AM grows in state DOTs as they face growing needs and limited resources
AM Guide Vol. 1 project initiated
Performance management growing in importance – federal reauthorization, AASHTO SCOPM
ERP implemented with TAM integrated or at least architectedAM Guide Vol. 2 project initiated
Greater use of AM principles in everyday DOT activities – policy link to decisions, PMs, data mgtGreater use of pavement and bridge management systems in state DOTs
1980
’s19
90’s
2000
’s
Page 23

Surface Transportation Authorization Act is coming
• Achieve national objectives
• Establish local transportation plans
• Improve project delivery
• Greater transparency, accountability, oversight, and performance measures
Page 24

The TAM Guide is a resource for responding
• Clear federal role and national objectives
• Consolidate and simplify programs
• Performance standards and accountability measures
• Expand mobility and access for people and goods
• Improve livability and environmental sustainability of communities
• Improve efficiency of federal programs and delivery of projects
From the June 18 2009 Committee Blueprint
Page 25

Linking strategic direction to performance management
Page 26

2. Improves service levels
Page 27

TAM Guide shows how to link outcomes to levels of service• A “bumpy road”?
• What mix do our customers want?
• What are they willing to pay for?
• What do we need to deliver to achieve them?
• How long will it take?
ConnectingN
etworks
Today
JourneyTim
e
Carrying m
oreFreight
Custom
erC
ost
Custom
erEngagem
ent
TravelInform
ation
Freight Ride
Com
fort
Environment
Aesthetics
Urban
Reliability
Safety
Neighborliness
Value forM
oney
Where to tomorrow??
Performance outcomesEfficient journey Enjoyable journey Safe journey
Page 28

Some LOS examples
Customer Level of ServiceState Highways will:
Link to Customer Outcomes
Technical Identifier
Technical Levels of Service Performance Targets
Provide appropriate bridge side protection including approaches.
CV 3.1 Safety
Crash hazard protection
Compliant barriers on all bridge approaches and bridges and at other locations as detailed in the SH SMS Manual Edition 4 - March 2007 section 6..4 Barriers
Reducing trend in crashes where inadequate protection was a factorSide protection – number of non-compliant bridges, bridge approaches and other sites
Have at least two lanes and be two way in all but the most exceptional circumstances
CV 1.2 Journey timeCV 1.3 Carrying more freightCV 3.1Safety
Bridge width Two-lane two-way unless:Multi-lane approachAADT <1000 and two-lane bridge is uneconomic
Number of single lane two-way bridges. Target compliance level to be confirmed.
Page 29

Some more LOS examples
Customer Level of Service
State Highways will:
Link to Customer Outcomes
Technical Identifier
Technical Levels of Service Performance Targets
Not have water pondingon the road making it unsafe for road users after rain
CV 3.1 Safety
Rutting Rut depth <=20mm 99% of network with rut depth less than 20mm
Have marked centre-lines, edge-lines, no-passing lines, edge marker posts and reflective raised pavement markers.
CV 3.1. Safety
Delineation Comply with Manual Of Traffic Signs and Markings, Traffic Control Devices Manual, and NZTA Specifications
Install audio-tactile profile markings where justified
100% compliance with MOTSAM, TCDM, and NZTA Specs
% of highway carriageway-sections with deficient delineation.
Target for profile markings to be developed
Page 30

Customer research a starting point for levels of service
Levels of Service(Demand for quality, quantity etc)
Customer Values
Legislative Standards
Strategic Drivers
Customer ResearchOngoing review and
management of assetperformance and realization of
value deliveredAssess affordabilityand funding
options
Currentresourcecapability
Requiredresource
availabilityand
technology
Asset improvement
Assess Life -CycleAsset management Solutions to deliver
Operate & maintain
Replace / refurbish
Dispose
Non-asset solutions
value propositions
Page 31

3. Documents agency approach to addressing needs, &4. Helps explain why funds are needed and provides accountability for effective use of funds
Page 32

TAM covers a wide portfolio of assets
• Pavements• Bridges• Tunnels• Other structures such as retaining walls, culverts, sign structures, etc• Curbs, channels, dams, and drainage facilities• Barriers, railings, and medians• Road signs• Pavement markings• Traffic signals and control equipment• Intelligent transportation systems (ITS)• Street lighting• Sidewalks• Bicycle lanes and paths on the right of way• Parking facilities such as pay and display machines, parking meters • Rest areas• Maintenance buildings and equipment• Landscaping
Page 33

TAM Guide shows how to tie funding to performance based outcomes
• TAM helps move away from formula based funding allocation to performance based
• TAM ties performance based levels of service to agency objectives- Define performance outcomes- Set LOS- Make program decisions- Optimize use of funds to achieve performance objectives
• Measurable outcomes that can be tied to the delivery of annual plans and programs
Page 34

Funding and asset performance
Page 35
0
200
400
600
800
1,000
1,200
Chip AC Pavement
Annu
al a
vera
ge (1
0yr)
leng
th tr
eate
d (k
m)
Treatment Type
Analysis A Analysis B Existing Programme
Recommended Level
0
1
2
3
4
5
2009 2010 2011 2012 2013 2014 2015 2016 2017 2018
Perc
enta
ge o
f ne
twor
k w
ith
mea
n ru
t de
pth
> 10
mm
Year
Percentage of network with mean rut depth > 10mm
Scenario A Existing Programme
0
200
400
600
800
2002 2004 2006 2008 2010 2012 2014 2016 2018 2020
Def
erre
d Le
ngth
(km
)
Year
Deferred length of pavement renewal(Since 2003, and against Valuation Useful Life (50yrs)
renewal rate scenarios, km per annum Current 210 225 240 265 280

TAM Guide describes economic principles
• TAM recognizes the economic value of assets, economic consumption over time and intergenerational equity considerations.
• TAM targets economic efficiency using economic analysis techniques to optimize asset expenditure over the asset’s lifecycle.
• The agency plays a long-term role as “steward” of the assets
Page 36

Financial stewardship: understanding the economic value of your assets
Page 37
0
20
40
60
80
100
120
140
160
Pave
men
tSur
face
Traf
fic
Facu
lties
Pave
men
tLa
yers
Dra
inag
e
Cul
verts
(Con
cret
e)
Tunn
els
(Lin
ing)
Cul
verts
(Ste
el)
Ret
aini
ngW
alls
Brid
ges
(pre
192
0)
Brid
ges
(pos
t 192
0)
Assets
Ass
et L
ifecy
cle
(Yea
rs)
$0
$20
$40
$60
$80
$100
$120
$140
$160
$180
Ann
ual D
epre
ciat
ion
($m
)
Asset Lifecycle Annual Depreciation

Minimize life cycle costs? Yes, but ….
Definition: To provide a desired level of service in the most cost effective manner for present and future customers
So we can’t minimise our whole of life costs until we know what service we are delivering. No service at all would give us the lowest costs!!
Page 38
LOS?
LOS?
LOS?

Page 39
Example: Moving the $$ goal posts – how to respond?
A perspective of one agency:
• Customer risk
• Customer expectations
• Lifecycle costs
Customer Expectations
Decreased Funding
Customer Risk
Customer
Risk Life Cycle
Costs
Life Cycle
Costs
Customer Expectations
Customer Expectations
Optimal Funding Constrained Funding
$
$ $
$ $
$ $ $
Customer
Risk
Life Cycle
Costs

Example: Scenario based approach to program development
Low expenditure: reduce operational and asset preservation costs• Risk exposure may increase, but safety must not be compromised.• Some LoS cuts acceptable, but no legislative requirements compromised.• Asset condition may deteriorate.• May result in deferred liabilities and increased whole of life costs.
Medium expenditure: hold to current levels, with trade-offs • No increase in risk.• Typically, levels of service retained.• Some asset deterioration may occur, but aiming to hold whole of life costs.
High expenditure: an expansion from current• Risk exposures reduced, safety enhanced.• Customer satisfaction and LOS improve.• Improved asset condition, whole of life cycle costs optimized in all areas.
Page 40

TAM Guide shows how to realize the benefits
• TAM enables better use of existing funds – by better quantifying current and future performance and optimizing the agency’s decisions.
• TAM improves agency competitiveness for limited funds –by improving the agency’s credibility, and its knowledge of the long term needs of assets.
• TAM helps build constructive political relationships – by providing hard information that can be readily understood.
Page 41

The TAMP is an accountability mechanism – linking strategy to performance measurement and program delivery
Page 42

Using the TAM Guide – possible agency scenarios
1. Interested in how TAM can be of benefit – but not sure whether it’s worthwhile or what to do first.
2. Preservation / maintenance financial needs and new investment are poorly linked, organizational issues to address.
3. Want to be able to better allocate resources and funds over the long term
4. Have a small number of areas to focus on, for example, risk, performance measurement, predictive modelling, but not sure how to best tackle them
5. Have effective asset management systems in some areas (e.g. pavement management) – but aware of the need to have systems and data for other assets as well
6. Aspire to be best in the class
Page 43

Questions to consider in break-out
What challenges do you expect to face with reauthorization and performance management requirements?
What performance measures are you currently using, and how are they linked to your agency’s mission and the levels of service provided to road users and customers?
In what ways can the TAM Guide assist you to address the following challenges and expectations?
• Greater accountability to the public and funding agencies
• Maximizing use of resources within a highly constrained funding environment
• Linking investment levels to infrastructure condition and transportation system performance
• Preserving assets and improving safety in the face of growing impacts and costs of asset deterioration
• Public expectations for more sustainable transportation solutionsPage 44

Segment 1 Breakout Groups
Jillian BarberScott Bennett
Michael BridgesDeLania HardyAhmad JaberCharles Meyer
Marvin MurphyJanet Oakley
Thomas PrestashKenneth Sweeney
Kevin ChesnikGary EvansVince Latino
Jim McDonnellBen Orsbon
Francine Shaw-WhitsonJennifer Toth
Frank TramontozziDon VaughnRon Vibbert
Jeff BrillhartMissy CassidyCharlie Fielder
King GeeRoger Healy
Leslie MixPatricia Oliver-Wright
Neil PedersenChristine Reed
Richard Tetreault
John BartonJane BergerTom ColeStehen GajMatt HardyGrant LeviLacy Love
Gregory MayoRichard Savoie
Gloria Shepherd
Brian BlanchardMara CampbellKeith DamronTerry GibsonKen Kobetsky
Tracy Larkin-ThomasonJeff Pierce
Jacob PorterJ. "Butch" Wlaschin
Group 1 Group 2 Group 3
Group 4 Group 5

Workshop Agenda
Introduction and TAM Guide Overview Mark Gordon
Session 1: Why Transportation Asset Management Mark Gordon
Session 2: Getting Started Hyun-A Park
Session 3: Transportation Asset Management Plan George JasonSmith
Session 4: Putting TAM into practice Paul Thompson
Group Discussion FHWA
Wrap up and next steps Michael Bridges
Page 46

GETTING STARTED
Segment 2

Getting Started – Segment Overview
• Assessing where you are
• Setting targets for what you want to achieve through your asset management program
• Figuring out what the gaps are
• Developing a strategy & scope for implementation
• Setting the stage for organizational change needed to support asset management

TAM Evolution in an Agency
Simple BCA, or other optimized decision making analysis, of asset investment options
Improvement planning
Predictive and optimization methods are used for determining scenarios for levels of service and applied for programming
IT systems for TAM are connected to business processes and decisions and are linked vertically from enterprise to individual units
Describing the levels of service currently provided by the network
Starting the AM Journey
Listing expansion and new construction
programs
Risk, and the identification of critical assets
Model AM Practice
Describing maintenance practices in broad outline
Listing replacement / rehabilitation programs
Some detail of the extent and composition of the assets being managed (e.g. asset inventories)
Assessment of current asset performance – using measured and elicited methods
Longer term financial forecasts
Asset performance measures are aligned with the corporate direction.
Corporate financial plans are derived from the Asset Management Plan and
these links are clear and easily followed.The process of continuous improvement is entrenched and evident.
Life-cycle management plans exist for each asset group and for some individual assets –
showing cost, performance, and risk outcomes.Measures of achievement of mission goals and
objectives are quantifiable, have written definitions, and are uniform across the agency.
Asset management practices and objectives are clearly derived from the corporate strategic plan.
BE
GIN
NE
RIN
TE
RM
ED
IAT
EA
DV
AN
CE
D

Integration with Decision Making
Strategic plan
Meeting financial responsibilities and
reporting requirements
Tactical plans
Operational plans
Levels of service
Policy
Customerservice
Humanresources
AssetManagement Financial Marketing
Satisfying planned growth and change
in infrastructure needs
Delivering effective and efficient
servicesOutcomes

TAM Improvement Path

TAM Practices Gap Analysis
• The process of continuous improvement is a feature of TAM at all levels of maturity
• The TAM improvement process is about closing the gaps, between - What needs to be done, the desired TAM objectives; and - Current levels of achievement
• The gap analysis tool is tactical - Greater level of detail than the self assessment- Results aggregate up to 6 key areas, expanding on Volume 1- More focus on TAM processes and lifecycle management- Uses the maturity scale at a greater level of detail

TAM Maturity Scale
• A broad characterization of agency evolution
• A way of grouping advancements that typically occur together
• A screening tool to identify likely next steps
• A short-hand way of classifying the audience

TAM Maturity Scale1. No effective support from strategy, processes, or tools. Lack of motivation to improve.
2. Recognition of a need, and basic data collection. Reliance on heroic effort of individuals.
3. Shared understanding, motivation, and coordination. Development of processes and tools.
4. Expectations and accountability drawn from asset management strategy, processes, and tools.
5. Asset management strategies, processes, and tools are routinely evaluated and improved.

Strategic Self Assessment (from Volume 1)
• Policy Goals and Objectives - How does policy guidance benefit from improved asset
management?
• Planning and Programming - Do resource allocation decisions
reflect good practice in asset management?
• Program Delivery- Are appropriate options
and management methods used to deliver the program?
• Information and Analysis- Do information resources
effectively support asset management policy and decisions?
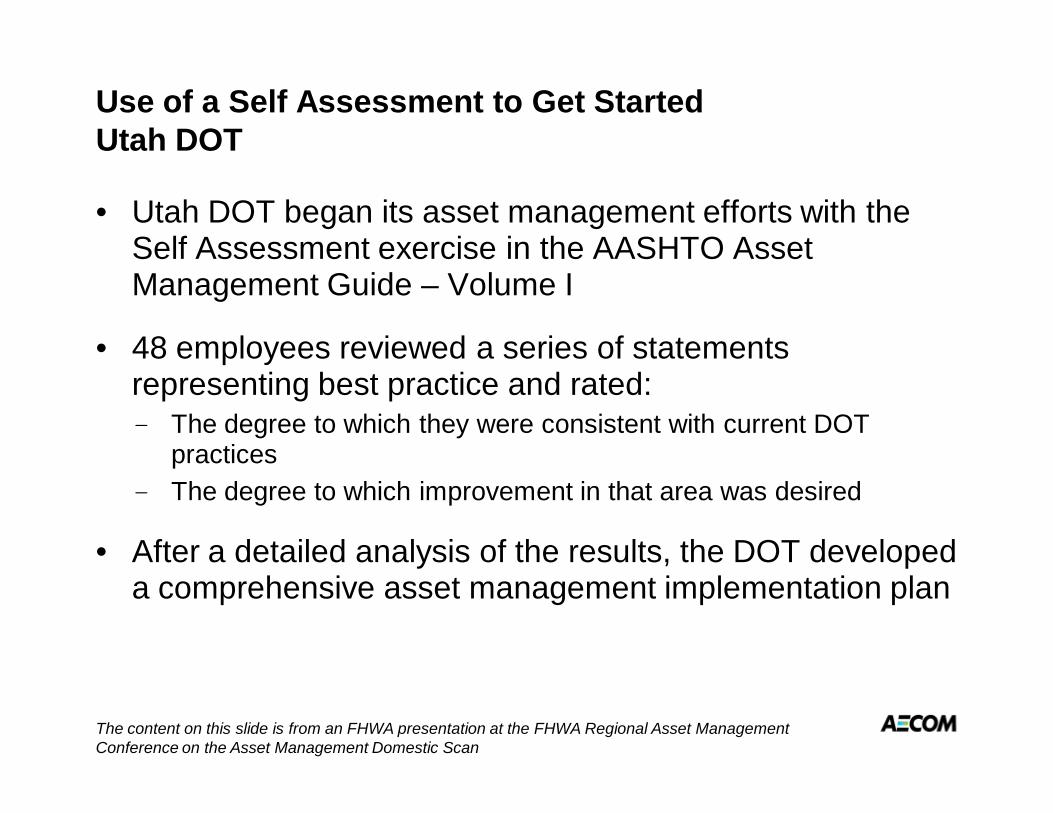
Use of a Self Assessment to Get StartedUtah DOT
• Utah DOT began its asset management efforts with the Self Assessment exercise in the AASHTO Asset Management Guide – Volume I
• 48 employees reviewed a series of statements representing best practice and rated:- The degree to which they were consistent with current DOT
practices- The degree to which improvement in that area was desired
• After a detailed analysis of the results, the DOT developed a comprehensive asset management implementation plan
The content on this slide is from an FHWA presentation at the FHWA Regional Asset Management Conference on the Asset Management Domestic Scan

Use of a Self Assessment to Get StartedUtah DOTResponses to Question A6 – Policy guidance on resource allocation allows Utah DOT sufficient flexibility to pursue a performance-base approach.
0%
20%
40%
60%
80%
100%
SeniorManagement
Regions Asset Groups Planning, ITand AM
Perc
ent o
f Pos
itive
Res
ponc
es
Ex isting Desired
0%
20%
40%
60%
80%
100%
SeniorManagement
Regions Asset Groups Planning, ITand AM
Perc
ent o
f Pos
itive
Res
ponc
es
Ex isting Desired
The content on this slide is from an FHWA presentation at the FHWA Regional Asset Management Conference on the Asset Management Domestic Scan

TAM Practices Gap Analysis
TAM1 Self Assessment
Action Plan TAM
Improvement Plan
Review: • Policy Guidance • Planning and
Programming • Program
Delivery • Information and
Analysis • Lifecycle
Management and TAM
• Legislative Compliance
TAM2 Gap Analysis
Review: • Policy
guidance • Planning and
programming • Program
delivery • Information
and analysis
TAM Business Strategy
TAM Plan
Delivery of Agency Mission
TAM2 Gap Analysis
TAM Improvement
Plan
TAM Plan
TAM2 Gap Analysis

TAM Gap Analysis Tool
Key TAM Area Element
Lifecycle Management
Project Identification and PrioritizationEvaluation of Asset ImprovementsDesign ProcessesManagement of Asset Improvement Contracts Preservation Strategy and Analysis
Sub-element Score
Preservation Plans
Preservation Monitoring
Active management of maintenance, tracking performance and controlling backlog.
Preservation Contract Management
Procedures in place (and followed) for the collection of O&M data required and updating of O&M records.
Preservation Monitoring è Organization is able to monitor performance of assets
and ensure that they are operational when required.

TAM Gap Analysis Example
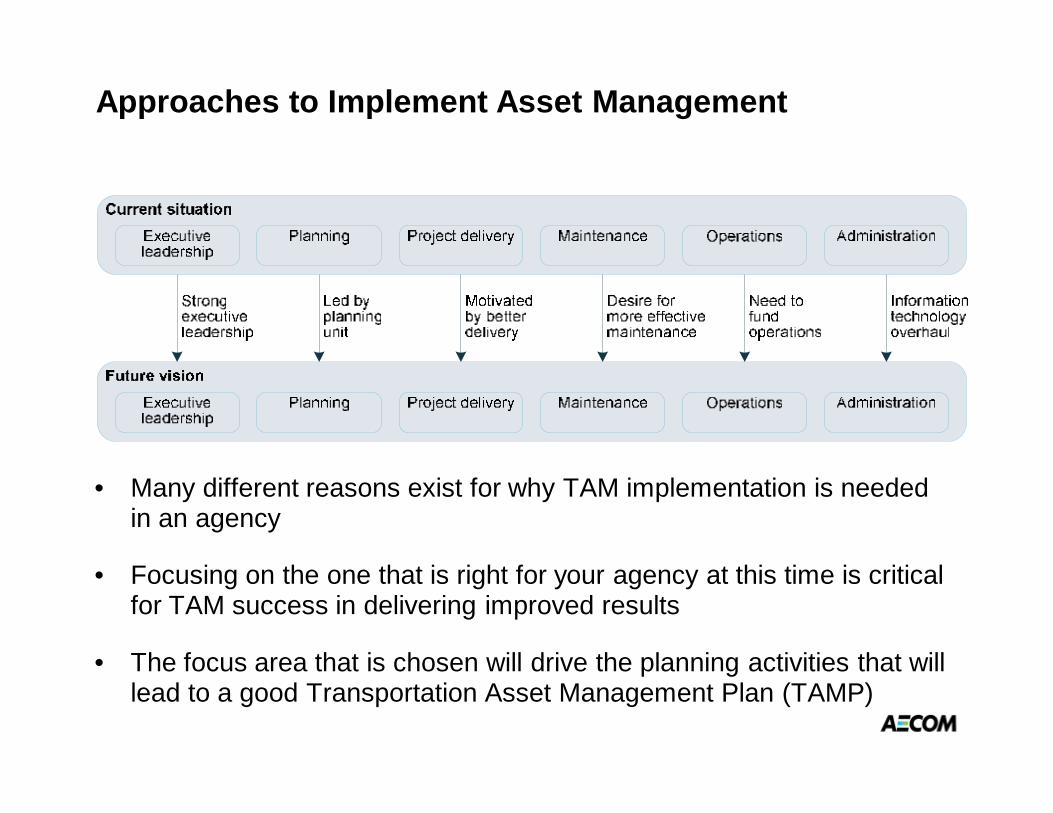
Approaches to Implement Asset Management
• Many different reasons exist for why TAM implementation is needed in an agency
• Focusing on the one that is right for your agency at this time is critical for TAM success in delivering improved results
• The focus area that is chosen will drive the planning activities that will lead to a good Transportation Asset Management Plan (TAMP)

Change and Leadership in Asset Management

Ohio DOT – Asset Management Results
0
20
40
60
1 2 3 4 5 6 7 8 9 10 11 12
2005 1997
% O
f Mile
s D
efic
ient
Districts
Overall reduction in deficiencies of 81%The content on this slide is from Gordon Proctor’s presentation at the FHWA Regional Asset Management Conference

Organizational Change Frameworks
• Organizational change is a fundamental part of TAM
• Understanding and planning for the change needed in your organization will ensure successful TAM implementation
• Multiple methods and tools exist for managing organizational change
Baldrige Framework
Balanced ScorecardFramework
Six SigmaFramework
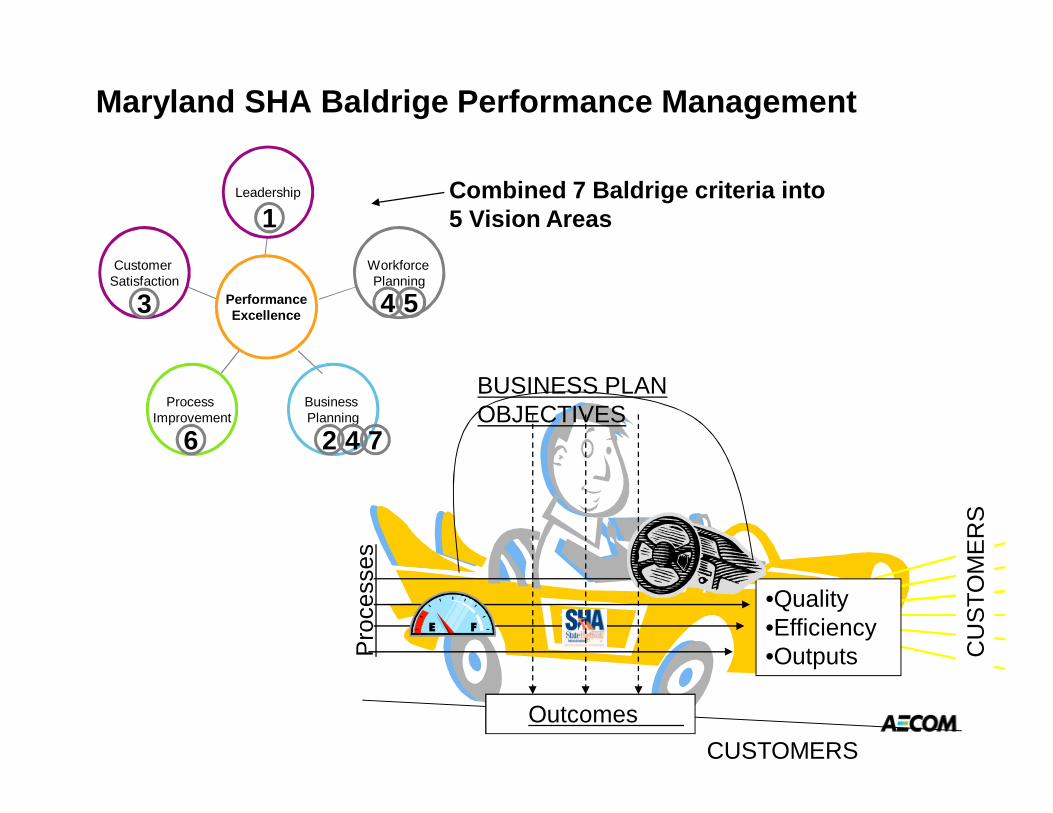
Combined 7 Baldrige criteria into 5 Vision Areas
Maryland SHA Baldrige Performance Management
Customer Satisfaction
Process Improvement
Business Planning
Workforce Planning
Leadership
PerformanceExcellence
1
3 4 5
7426
CU
STO
ME
RS
CUSTOMERS
Pro
cess
es
•Quality•Efficiency•Outputs
Outcomes
BUSINESS PLAN OBJECTIVES

Wyoming DOT – Balanced Scorecard

Developing Levels of Service
Levels of service describe what the customers perceive• Not set in isolation• All agencies have some now, in some form (e.g. GASB 34
Modified Approach)• Set at different levels — strategic, customer and technical• All must be SMART — Specific, Measurable, Achievable,
Relevant, Timebound• Customer levels of service should be set with customer
input- Start by documenting what is delivered now (the first-time up you
can skip consultation / customer research)- Pick from the full range of customer research tools when gathering
customer input• Customer levels of service amplify the
agency mission, they must not contradict it

Technical Levels of Service
• Take customer levels of service and convert them into technical language
• Technical levels of service should not stand alone, but support a customer level of service or a legislative requirement
• Used by asset managers and engineers to ensure that they are delivering the right things
• Describe what the technical measures are required to deliver the customer levels of service. E.g. - maximum and average roughness measured in IRI- minimum and average skid resistance- illumination levels from street lights
• The early stages of formal TAM may require current technical levels of service to be converted into “customer speak” and become current customer levels of service

Levels of Service Example for Sidewalks
Safe design
Safe separation
Health benefits
Smooth alignment
Comfort
Quality surface
Quality crossings
Efficient linkages
Direct access
Cleanliness
Safe transportation
network(social outcome)
People and businesses
efficiently linked(economic and social outcome)
"I arrive safe"
"It is easy to walk on"
"It is always clean"
Feel safe when walking
Well lit, ableto see clearly at
night
Lightinghelps protect my
property
Satisfied withthe walking experience
Sidewalks are clean, tidy, free
of litter
Standards for sidewalk width and separation
Minimum illumination
levels
Surface discontinuities
< 'x' inch
Wheelchair ramps at all intersections
Maximum slope and crossfall
standards
Street cleaning frequencies
Customer LOS Technical LOSStrategicobjectives
Examples of customer values
Vision / Strategic Outcomes
Level of service examples

Segment 2 – Group Assignment
• Each participant will share where they are in TAM maturity and state if there is a clear focus in their agency for asset management activities
• Each participant will answering the following questions (participants are encouraged to think about answers to these questions prior to the event)- Scope of TAM – What assets are included in the focus of your TAM
effort?- Organizational Engagement – Who are the people that will make TAM a
success?- What are the decision points where TAM is going to influence better
results for your agency (budgeting, staff allocation, design, etc.)?§ Who is involved?§ What decisions are being made?§ What impacts are the result?
• The group will select two participant agencies (more if there is time) to further develop responses to the questions above. A presentation of these responses will be given to the entire workshop group.
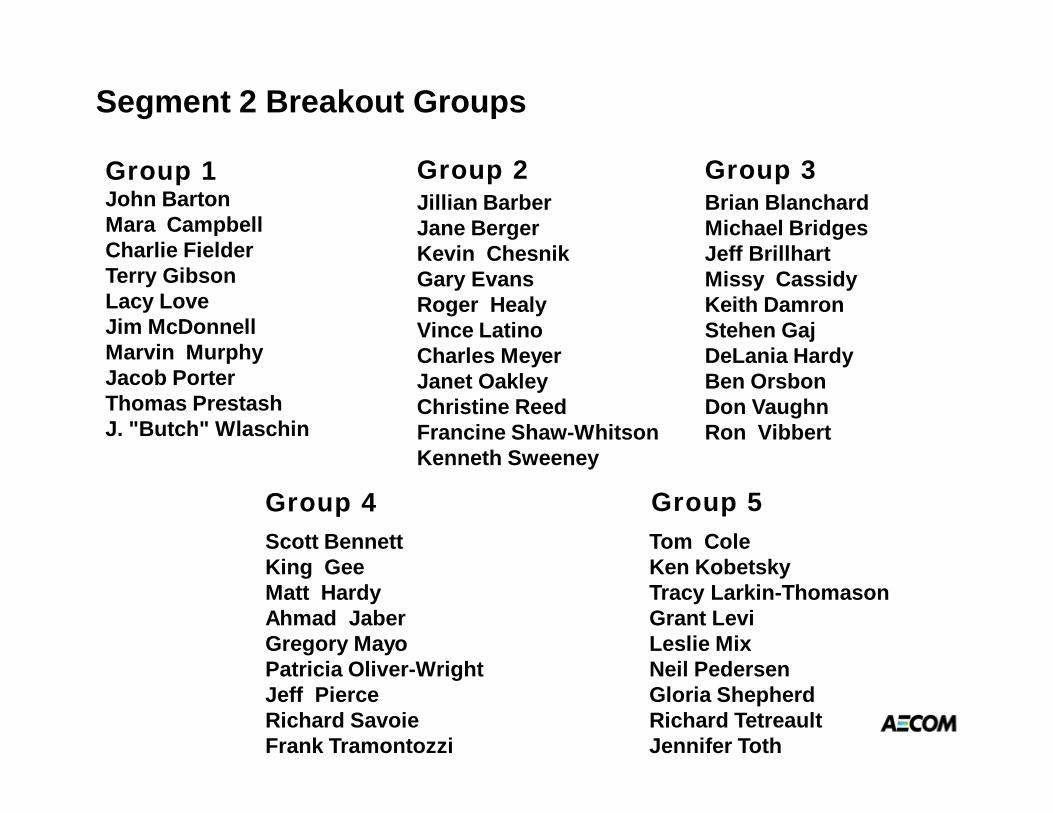
Segment 2 Breakout Groups
John BartonMara CampbellCharlie FielderTerry GibsonLacy LoveJim McDonnellMarvin MurphyJacob PorterThomas PrestashJ. "Butch" Wlaschin
Jillian BarberJane BergerKevin ChesnikGary EvansRoger HealyVince LatinoCharles MeyerJanet OakleyChristine ReedFrancine Shaw-WhitsonKenneth Sweeney
Brian BlanchardMichael BridgesJeff BrillhartMissy CassidyKeith DamronStehen GajDeLania HardyBen OrsbonDon VaughnRon Vibbert
Scott BennettKing GeeMatt HardyAhmad JaberGregory MayoPatricia Oliver-WrightJeff PierceRichard SavoieFrank Tramontozzi
Tom ColeKen KobetskyTracy Larkin-ThomasonGrant LeviLeslie MixNeil PedersenGloria ShepherdRichard TetreaultJennifer Toth
Group 1 Group 2 Group 3
Group 4 Group 5

Segment 3 —Transportation Asset Management Plan
What a Transportation Asset Management Plan (TAMP) is
What it is
What it does
What it contains
How to develop a TAMP

ASSET MANAGEMENT PLAN CONTEXT
Page 2

What it is —Transport Scotland describes its Road AMP as “A
document that sets out the agreed ten-year work and financial plans for the trunk road network and describes how we will optimally manage these assets, through the development and application of recognised good asset management practices, to deliver customer expectations and the Aims, Objectives and Targets defined in the Corporate and Business Plans.
Transportation Asset Management Plan
Page 3

Transportation Asset Management PlanWhat it does —
• Provides a key tool to help you meet your strategic objectives
• Gives a focal point for information about:- Asset quantities and values- Investment strategies- How the assets are going to be managed to § Meet agency strategic objectives§ provide the agreed level of service to present and future customers
at the lowest practical lifetime cost .
• Provides best practice coordination of complex issues- Requires logical thought and analysis- Cross- silo coordination required
• Mechanism to aid communication internally and externally
• Provides a robust repository and recovery of asset management information
• Reinforces continuous improvementPage 4

What it contains•Format and level of detail to suit the agency’s level of TAM maturity
•No one “correct structure”--TAM Guide
- International Infrastructure Management Manual
- PAS 55 (UK)
-NZTA
-Transport ScotlandPage 5

Scottish Roads AMP
NATIONAL AMP
1 Introduction2 Aims, Objectives, Targets &
Expectations3 Road Assets4 Asset Management Practices5 Current and Future Demand6 Performance Management Framework7 Risk Management8 Lifecycle Plans9 Decision Support10 Work Plan11 Financial Plan12 Risks to the Ramp & their Management13 Monitoring, Reviewing & Continual
Improvement14 Asset Management Improvements15 References A. Road Structures – Construction FormB. Asset Management PlanningC. Information Management
Executive SummaryAbbreviations1 About the State Highway AMP2 Putting the Customer First3 The State Highway and its Assets4 Operating Performance and Asset
Condition5 Managing Customer Demand6 Managing Risk7 Asset Lifecycle and Funding
Requirements8 Implementation on the Ground9 Our Improvement Plan
Page 6

Items that the AMP should cover
• Strategic goals and levels of service -Agency performance measures
& achievement• Life cycle management
-Asset inventory & condition assessment
-Asset preservation-Replacement and renewal incl
predictive modelling-Risk assessment &
management-Program planning-Program delivery-Sustainability
• Growth & demand forecasting -establishing the need for
improvements
• Financial Summary-Valuation & depreciation, link to
GASB 34-annual and longer term
programs• TAM Practices• TAM Improvement Plan• Appendices
-May be extensive and detailed or just contain minimum of relevant supporting information
Page 7

Who should be involved in the TAMP?
TAM is focussed on delivering services – many parties should be involved.- The TAM Plan team- Internal stakeholders.- External stakeholders.- Customers may
be a new consideration
Page 8

Business processes and the TAMP
The TAMP is the center through which the processes required to deliver an agency’s goals and objectives relate to each other and are coordinated
Page 9

The TAMP is therefore the hub of service delivery
It gathers all the inputs and moderates them with all the appropriate controls
It outputs the programs, forecasts and information required for the agency to achieve its mission
Without a TAMP the Mission is harder to achieve and it may just be a happy coincidence that it is achieved
TransportAsset
Management Plan
Asset life-cycle management strategies
& policies
Service performance strategies & policies
Growth/ demand strategies & policies
Corporate Strategic Goals & Objectives
Financial management strategies & policies
Business improvement strategies & policies
TransportAsset
Management Plan
Optimized life cycle management plans
Critical assets
Long-term financial forecast
The current state of infrastructure
Improvement plan
Current & proposedservice levels
Growth & demand management plan
Annual Delivery Programs
Page 10

What does a TAMP look like?Many are single documents, especially when they cover local or regional assets
At State level the TAMP is likely to be a smaller document that:• Draws published information together from a large number of internal and
some external publications.• Directs its outputs to separate programs such as budget forecasts,
approved improvement and preservation programs, and procedure and process manuals
The picture at State level is of a “bookshelf” that comprises the TAMP. • E.g. There are 55 manuals and publications that
together describe the NZTA State Highway (national highway) asset management system.
• Many of these manuals are also used by local roading authorities.
Page 11

Writing and updating the TAM Plan
1. Start where you are now2. Document what you do now and currently planned asset
management improvements3. Populate the Improvement Plan as you write the TAMP, use
it to fill gaps that you do not have the time or information to fill now.
4. Prioritize the IP and allocate resources to it5. Use the plan and give effect to the improvement plan6. Repeat the cycle from 2.Page 12

TAMP Steps
Page 13
TAMP Steps 1, 2, 3, 4 Set Agency Direction for TAM
• Set agency goals and objectives for TAM
• Perform an agency self assessment and TAM gap analysis
• Define the scope of TAM in the agency
• Agency-wide strategic performance measurement
• Establish performance management standards
2.2 2.3 2.3 3.6 5.2
Gather Data • Asset inventory, condition
assessment and performance monitoring
• Asset valuation and depreciation • Data to support Transportation
Asset Management
6.2 7.4 8.7
Concurrent Agency Processes • Integration • Key principles for TAMIS
implementation • Alternative models for TAMIS
implementation • Asset management and
enterprise resource planning • Data to support Transportation
Asset Management
8.3 8.4 8.5 8.6 8.7
TAMP Steps 5, 6, 7 Write the Plan
• Lifecycle asset management • Linking strategic performance
measures to levels of service • Growth and demand
forecasting • Program planning • •Linking the plan to existing
business processes • Risk assessment and
management • Sustainability • TAM Improvement Plan
6.3, 6.4 & 6.5 5.3 5.4 7.2 4.4 5.5 7.5 2.3
Understand the TAMP Process • Why have a TAMP? • Business process context • Components of a transportation
asset management system • Key principles for TAMIS
implementation • Alternative models for TAMIS
implementation • Asset management and enterprise
resource planning
4.2 4.3.1 8.2 8.4 8.5 8.6
TAMP Step 8 Implement, Use, and Review the
TAMP • The iterative process of
TAMP development, review and improvement
4.3.5
Is the plan affordable?
No
Strategic Plan, Annual Plan, business plans,
annual reports
Yes

Prepare yourself, the Agency, and the team
Page 14
TAMP Steps 1, 2, 3, 4 Set Agency Direction for TAM
• Set agency goals and objectives for TAM
• Perform an agency self assessment and TAM gap analysis
• Define the scope of TAM in the agency
• Agency-wide strategic performance measurement
• Establish performance management standards
2.2 2.3 2.3 3.6 5.2
Understand the TAMP Process • Why have a TAMP? • Business process context • Components of a transportation
asset management system • Key principles for TAMIS
implementation • Alternative models for TAMIS
implementation • Asset management and enterprise
resource planning
4.2 4.3.1 8.2 8.4 8.5 8.6

Carry out the essential supporting processes
Page 15
Gather Data • Asset inventory, condition
assessment and performance monitoring
• Asset valuation and depreciation • Data to support Transportation
Asset Management
6.2 7.4 8.7
Concurrent Agency Processes • Integration • Key principles for TAMIS
implementation • Alternative models for TAMIS
implementation • Asset management and
enterprise resource planning • Data to support Transportation
Asset Management
8.3 8.4 8.5 8.6 8.7

Write the plan / Compile the documents
Page 16
TAMP Steps 5, 6, 7 Write the Plan
• Lifecycle asset management • Linking strategic performance
measures to levels of service • Growth and demand
forecasting • Program planning • •Linking the plan to existing
business processes • Risk assessment and
management • Sustainability • TAM Improvement Plan
6.3, 6.4 & 6.5 5.3 5.4 7.2 4.4 5.5 7.5 2.3

Check the plan’s viability
Page 17
TAMP Steps 5, 6, 7 Write the Plan
• Lifecycle asset management • Linking strategic performance
measures to levels of service • Growth and demand
forecasting • Program planning • •Linking the plan to existing
business processes • Risk assessment and
management • Sustainability • TAM Improvement Plan
6.3, 6.4 & 6.5 5.3 5.4 7.2 4.4 5.5 7.5 2.3
Is the plan affordable?
No
Yes

The most important steps — Use and Continuous Improvement!
Page 18
TAMP Step 8 Implement, Use, and Review the
TAMP • The iterative process of
TAMP development, review and improvement
4.3.5
Is the plan affordable?
No
Yes

“ However, this is our first RAMP, and it was decided that it would be more prudent to only cover some of the asset types in this first version. It was agreed that the two major asset types of
(i) Roads (focusing on carriageways); and
(ii) Bridges and Other Road Structures,
would be used for this RAMP”
—Transport Scotland
Continuous Improvement means you can prioritize your efforts
Page 19
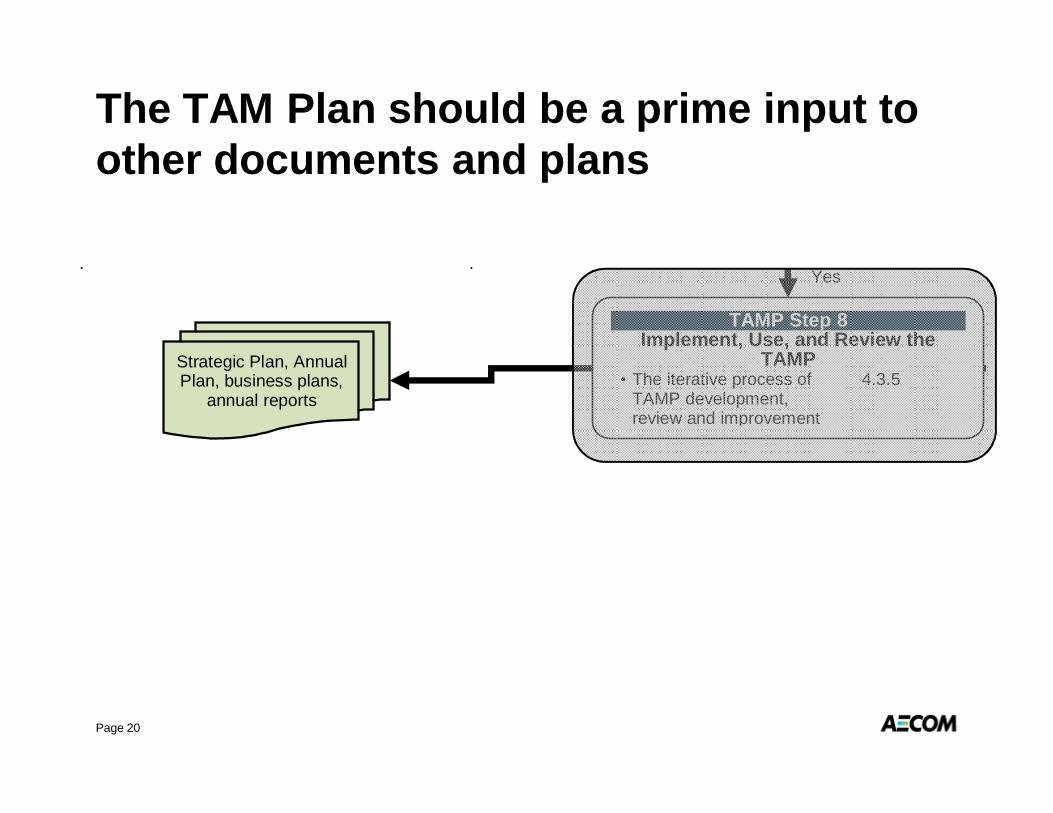
The TAM Plan should be a prime input to other documents and plans
Page 20
TAMP Step 8 Implement, Use, and Review the
TAMP • The iterative process of
TAMP development, review and improvement
4.3.5
Strategic Plan, Annual Plan, business plans,
annual reports
Yes

Segment 3 Breakout Groups
Mara CampbellTom ColeRoger HealyGrant LeviJim McDonnellBen OrsbonRichard SavoieRichard TetreaultJ. "Butch" Wlaschin
Scott BennettJane BergerKeith DamronKen KobetskyLeslie MixMarvin MurphyJeff PierceGloria ShepherdKenneth SweeneyDon Vaughn
Jeff BrillhartKevin ChesnikGary EvansKing GeeMatt HardyAhmad JaberVince LatinoLacy LovePatricia Oliver-WrightRon Vibbert
John BartonBrian BlanchardMichael BridgesMissy CassidyStehen GajTerry GibsonDeLania HardyTracy Larkin-ThomasonCharles MeyerJennifer Toth
Jillian BarberCharlie FielderGregory MayoJanet OakleyNeil PedersenJacob PorterThomas PrestashChristine ReedFrancine Shaw-WhitsonFrank Tramontozzi
Group 1 Group 2 Group 3
Group 4 Group 5

How are your strategic goals and objectives currently linked to annual and longer term programs?
Where do staff find all the information they require to prepare and manage these programs?
How do you know that they are using the correct inputs?
What are your current intentions on preparing a TAMP?
What parts [of a TAMP] do you see as being of most value to you?
Questions to Consider
Page 22

Each group will present the findings for at least two states
• linkages,
• information sources and inputs,
• TAMP intentions,
• TAMP value.
• Any other relevant comments
Working Group Presentations and Discussion
Page 23

Understanding of how a TAMP can improve linkages between corporate strategy and annual and longer-term programs
Better understanding of the risks and vulnerabilities associated with current programming and asset management practices
Page 24

1
MOVING FROM THE TAMPTO IMPLEMENTATION
Segment 4

2
Moving from the TAMP to implementation
– Organizing for change
• Leadership
• Building the team
• Change management
– Tools
• Performance measurement
• Levels of service
• Forecasting
• Breaking silos
– Verifying progress
3
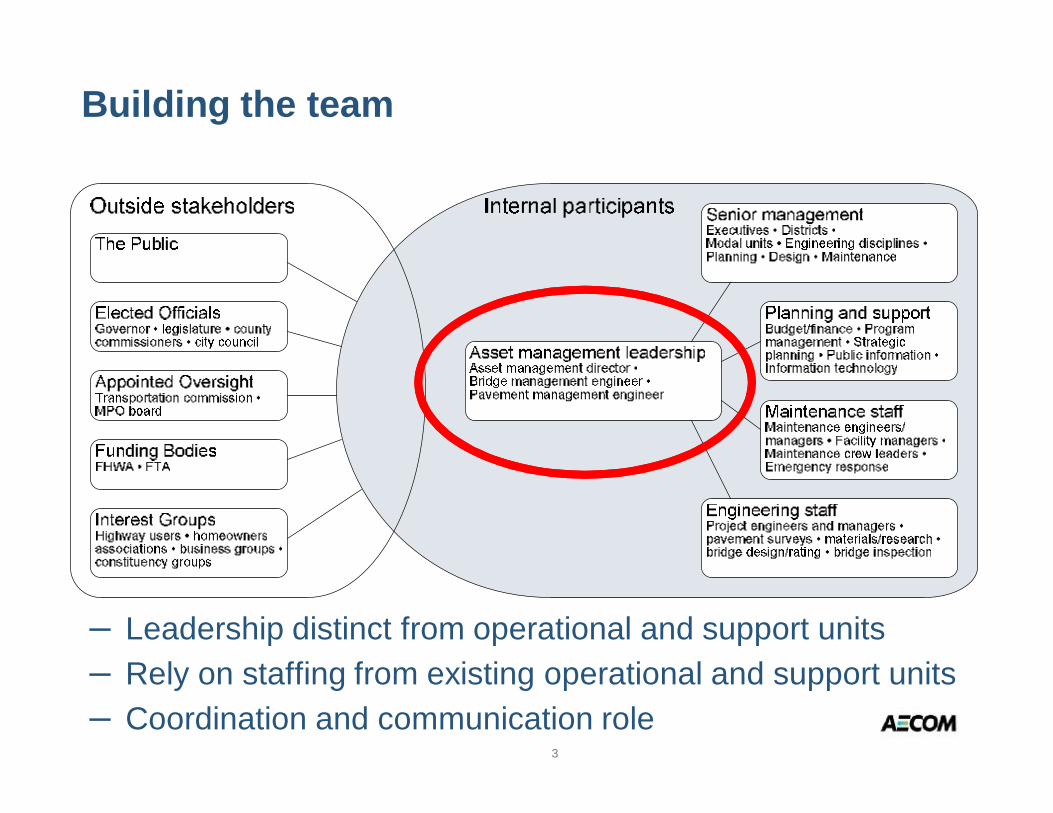
Building the team
– Leadership distinct from operational and support units– Rely on staffing from existing operational and support units– Coordination and communication role

4
Asset Management Leadership

5
Step-by-step: Building the team
– The champion/intrapreneur needs stakeholder allies• Supply side: Build the tools/processes/data• Demand side: Foster demand for better information
– Top management support is not automatic

6
Change management and incrementalism
– Build consensus and buy-in– Information is power
• Share the power• Use the power
Consensus on desired outcomes
and how to measure them
Put measures to work: simple
targets and criteria
Keep refining and improving

7
Tools: Measurement and forecasting
– First measure the outcomes you want, guided by the TAMP
– Then measure the • inputs, • outputs, • external factors
that affect your ability to deliver

8
Levels of service
– Build on Transportation Asset Management Plan– Foundation of performance measurement– Describe what service the agency intends to supply– Build stakeholder consensus

9
Being pro-active
– What does it mean?• Reaching out to stakeholders• Taking the initiative• Forecasting and influencing outcomes
– Forecasting tools and processes:
0
10
20
30
40
50
60
70
80
90
100
0 10 20 30 40 50 60 70 80 90 100Age of element (years)
Hea
lth in
dex A1 - Concrete deck
B2 - Pourabl e joi ntD2 - Pa i nt s teel beamF3 - R/C Column
Consequence
Likelihood Insignificant Minor Significant Major Catastrophic
Very Rare Low Low Low Moderate High Rare Low Low Moderate High High Seldom Low Moderate Moderate High Extreme
Common Moderate Moderate High Extreme Extreme Frequent Moderate High High Extreme Extreme
Last
insp
ectio
n
Yea
r of
anal
ysis
Base
yea
r
Res
idua
l yea
r
Initi
al In
terv
entio
n
Follo
w-U
p In
terv
entio
n
Res
idua
l Nee
ds
Follo
w-U
p In
terv
entio
n

10
Breaking the silos
Strategic elements– Common strategy– Common outcome measures– Common self-assessment– Transportation Asset Management Plan
Tools– Investment Candidate File– Tradeoff analysis– Performance framework

11
Performance frameworkUtility
Weighting and utility
Condition Mobility Safety Risk Reliability Externalities Comfort/Convenience
Life Cycle Cost
O-D
trav
el ti
me
Wal
k di
stan
ce
Cra
sh ra
tes
Satis
fact
ion
of b
arrie
r sta
ndar
ds
Pas
seng
er fa
cilit
y lia
bilit
y
Brid
ge s
cour
risk
Adv
ance
d de
terio
ratio
n
Std
devi
atio
n of
trip
tim
e
Freq
uenc
y of
mov
able
brid
ge o
peni
ngs
Noi
se le
vels
Ozo
ne c
once
ntra
tion
Gre
enho
use
gase
s
Vehi
cle
and
stat
ion
clea
nlin
ess
Roa
d ro
ughn
ess
Res
t are
a cl
eanl
ines
s
Pave
men
t life
cyc
le c
ost
Brid
ge li
fe c
ycle
cos
t
Scaling and amalgamation models
Analysis and forecasting models
Pavement Management
System
UserCost
Fare
s an
d to
lls
Veh
icle
ope
ratin
g co
sts
Pave
men
t con
ditio
n ra
ting
Brid
ge h
ealth
inde
x
Volu
me/
capa
city
ratio
Tran
sit f
acili
ty li
fe c
ycle
cos
t
Pro
perty
val
ue im
pact
s
Relative weights of performance measures
Relative weights of assets (utilization, replacement cost, value)
Bridge Management
System
Maintenance Management
System
Transit Management
System

12
Verifying progress

13
TAM as a management approach
– Teamwork across operational silos– Very specific, shared definition of desired outcomes
• Levels of service• Performance expectations
– Internal and external consensus-building– Information is power
it must be shared and used– Expertise and tools are necessary,
but not the main driver– What gets measured gets done
Build a performance-oriented culture

14
WORKING GROUP SESSIONPutting TAM into practice

15
Segment 4 Breakout Groups
Jillian BarberScott Bennett
Michael BridgesTom Cole
Keith DamronRoger HealyVince LatinoLeslie Mix
Marvin MurphyJanet Oakley
Richard Savoie
Jane BergerMissy Cassidy
Stehen GajDeLania HardyGregory Mayo
Jeff PierceChristine ReedJennifer Toth
Frank TramontozziDon Vaughn
John BartonJeff Brillhart
King GeeMatt Hardy
Ahmad JaberTracy Larkin-Thomason
Grant LeviPatricia Oliver-Wright
Thomas PrestashFrancine Shaw-Whitson
Mara CampbellGary Evans
Terry GibsonKen Kobetsky
Lacy LoveBen Orsbon
Neil PedersenGloria ShepherdRichard Tetreault
Brian BlanchardKevin ChesnikCharlie FielderJim McDonnellCharles MeyerJacob Porter
Kenneth SweeneyRon Vibbert
J. "Butch" Wlaschin
Group 1 Group 2 Group 3
Group 4 Group 5