asset management strategy · asset management strategy bogan shire council jayantha ediriweera -...
TRANSCRIPT

Asset Management Strategy
27.04.2017
Adopted on 27th April 2017

Adopted on 27th April 2017

October 2014

Asset Management Strategy
Bogan Shire Council Jayantha Ediriweera - Water and Asset Manager Page 1 Asset and Water Manager
TABLE OF CONTENTS
1. Executive Summary ....................................................................................................................... 2
2. Strategic Framework...................................................................................................................... 6
3. Services Provided .......................................................................................................................... 8
4. Levels of Service ............................................................................................................................ 9
5. Condition of Council’s Assets .................................................................................................... 11
6. Operations .................................................................................................................................... 17
7. Maintenance ................................................................................................................................. 18
8. Capital Renewal / Rehabilitation ................................................................................................. 20
9. Capital Upgrades & New Assets ................................................................................................. 22
10. Disposal Plan ................................................................................................................................ 23
11. Financial Plan ............................................................................................................................... 24
12. Key Performance Measures ........................................................................................................ 25
13. Plan Improvements ...................................................................................................................... 26
14. Risk Management Plan ................................................................................................................ 28
15. Appendix A: Example of Annual Service Costs ....................................................................... 29
16. Appendix B: Improvement Action Plan (2016) .......................................................................... 30
17. Appendix C: 20 Year Financial Plan ($,000) .............................................................................. 36
Document Control
Rev No Date Revision Details
Author Verifier Approver
1 20.02.2017 Draft-1 Jayantha Ediriweera(JE)
Derek Francis(DF)
Graeme Bourke (GB)
Steph Waterhouse(SW)
2 12.04.2017 Draft-2 JE DF/GB/SW Adopted by Council on 27th April 2017 Minute No: 091/2017

Asset Management Strategy
Bogan Shire Council Jayantha Ediriweera - Water and Asset Manager Page 2 Asset and Water Manager
1. Executive Summary
As part of the preparation of this Strategy a high-level review of Council’s Asset Management policies, practices and systems has been completed to provide both strategic direction and guidance for improving asset management planning and performance. Council is responsible for infrastructure and other assets that have a current replacement cost of approximately $247 million. Asset Management Plans have now been developed for each of the five main categories of assets Council controls.
The introduction by the NSW State Government, into the Local Government Act, legislation for integrated planning and reporting has increased the profile of Asset Management Plans and their integration with Community Strategic Plans (CSP) through the Resourcing Strategy. This has helped raise the profile of asset planning and outlined minimum requirements for development of these plans. Linkages to the CSP are outlined in each of the individual Asset Management Plans
This Asset Management Strategy (AMS) is aligned with the National Asset Management and Financial Planning Assessment Framework (NAMAF), which provide a nationally consistent approach to Asset Management and Financial Planning. The approach used satisfies the requirements of the Department of Local Government, and builds on the existing Community Strategic Plan.
Bogan Shire Council’s objective in the development of this Asset Management Strategy is to establish a framework for good AM at Council by outlining Council's AM objectives, AM practices and an action plan for AM improvements. This is mainly to ensure a comfortable country lifestyle by progressively improving and maintaining the level of appropriate facilities and services and encouraging growth and economic development that is responsive to the needs of the community.
In conjunction with this strategy, Asset Management Plans (AMPs) are being prepared for each major infrastructure group.
Transport and Storm Water
Water
Sewer
Buildings
Other Assets
This Strategy is presented at a high level to provide key information that can used in the determination of levels of service and funding required. Table 1.1 provides a snapshot of the Corporations asset groups, twenty (20) year average costs, the funding gap if one exists between the available renewal budget and predicted renewal requirements and the projected backlog of works as at Years 1 and 10. Figure 1.1 shows the rolling 10 year backlog for each asset category.
Table 1.1: Council’s Asset Portfolio Overview in ($,000)
Asset Category Current Replacement
Cost
Operation & Maintenance
Budget ( 10 year average)
Renewal Budget
( 10 year average)
Upgrade & New Budget
( 10 year average)
Average Renewal
Funding Gap ( 10 year average)
Backlog 2024/25
Transport and Stormwater
171,394 4,477 1,065 195 605 1,300
Water 31,067 2,297 491 360 64 235
Sewer 10,564 755 125 55 - -
Buildings 27,395 520 410 214 - 0
Other Assets 6,230 80 66 4 - 0
Total 246,650 8,129 2,157 828 669 1,535

Asset Management Strategy
Bogan Shire Council Jayantha Ediriweera - Water and Asset Manager Page 3 Asset and Water Manager
Notes: 1. Budget Figures are the 20 year annual average amounts indexed by 0.9% p.a. for growth
Figure 1.1: Forecast Expenditure over the next 10 years in ($,000)
Table 1.1 highlights that depending on decisions regarding the condition at which assets are maintained or renewed that there is a Renewal Funding Gap for which future generations will become liable if remedial action is not taken. It needs to be stressed that we are considering long-term averages in this strategy and accordingly in some years the cost to renew will be higher and some years lower dependant on the number of assets that are due for renewal in that particular year.
The 20 year forecasts presented in this Asset Management Strategy (AMS) are based on the modelling undertaken and achieving the levels of service presented in the plan, and are intended to assist Council when considering future Community Strategic Plans, Delivery Programs and Operational Plans. If changes are made to the Long Term Financial Plan, those changes will be reflected in the next AMS and Asset Management Plans (AMPs).
Figure 1.2 provides an indication of the total annual expenditure for all asset categories in each of the major program areas together with the backlog that is expected in any one year based on the currently available funding.
Figure 1.2: Forecast Expenditure & Backlog over the next 10 years in ($,000)
A number of options are available to address the asset renewal funding gap including adjustment to service levels, extending asset life (i.e. changing the acceptable condition levels prior to renewal), obtaining increased grant funding, increases in rate revenue ie Special Rate Variation and borrowing strategies.
In addition to these options, which are available generally to Local Government, as part of its Fit for the Future Plan, Council resolved to refocus its asset expenditure on renewals. This essentially involves identifying cash
$0
$500
$1,000
$1,500
$2,000
$2,500
$3,000
$3,500
$4,000
2016/17 2017/18 2018/19 2019/20 2020/21 2021/22 2022/23 2023/24 2024/25 2025/26
Transport Water Sewer Buildings Other assets
-
5,000
10,000
15,000
2016/17 2017/18 2018/19 2019/20 2020/21 2021/22 2022/23 2023/24 2024/25 2025/26
Renewals Maintenance Operations Upgrade / Expansion Rolling Backlog

Asset Management Strategy
Bogan Shire Council Jayantha Ediriweera - Water and Asset Manager Page 4 Asset and Water Manager
resources that can be used to address the infrastructure backlog and increase spending on asset maintenance and renewals. Some work has already been undertaken in confirming appropriate road infrastructure depreciation and backlogs and this is planned to continue. Cash generated from FAG grants, Roads to Recovery Grants, an Asset Renewal Reserve and an Infrastructure Levy can be used to eliminate the asset backlog and meet all required benchmarks. In addition, Council will continue the practice, started in preparing the 2016/17 budget, of identifying asset renewals as distinct from new works and making decisions on an appropriate level of spending on asset renewals.
Levels of Service, Intervention Levels, Condition Rating and Useful Life
The determination of Levels of Service (LOS) is crucial in the calculation of the gap between required funds for asset service delivery and available budgets. The levels will be determined by defining the outcomes as agreed with the community, identifying the services required to meet those outcomes and the infrastructure required to support those services. Details on proposed LOS are contained within each of the six Asset Management Plans.
In order to allocate limited funds responsibly, renewal or rehabilitation of assets will only be undertaken once they reach a certain condition, referred to as the intervention level. Typically, assets will not be renewed until they are between a condition 3 and 4 depending on the utilisation, function and / or criticality of the asset. Condition Rating assessments on individual assets are undertaken on a regular basis depending on the component, its current age, previous condition and criticality.
Bogan Shire council follows the Integrated Planning and Reporting Manual for local government in NSW since the consistent approach to the identification of asset conditions is a key objective of the NSW Government’s integrated planning and reporting reforms. Therefore, council has adopted the following five-category condition assessment model as described in infrastructure planning and reporting manual.
The following graph presents a snapshot of the current condition of Councils assets based on the value of each asset component in each of 5 conditions ranging from 1 being near new to 5 as a completely failed component or asset. Note that this only includes the assets that have been condition rated and modelled in the July 2016 Asset Management Plans
Figure 1.3: Councils Asset Condition Profile Based on Replacement Value in ($ ‘000)
$-
$10,000
$20,000
$30,000
$40,000
$50,000
$60,000
$70,000
1 Excellent 2 Good 3 Average 4 Poor 5 Very Poor
Buildings $3,758 $16,963 $4,240 $2,435 $-
Sewer $571 $10,750 $365 $387 $-
Water $737 $27,477 $3,483 $2,702 $-
Road Pavement $26,495 $677 $162 $224 $-
Sealed Road $6,419 $3,879 $645 $204 $-
Unsealed Road $6,164 $8,833 $479 $1,050 $-
Rep
lace
men
t C
ost
($'0
00)

Asset Management Strategy
Bogan Shire Council Jayantha Ediriweera - Water and Asset Manager Page 5 Asset and Water Manager
The Useful Life of an asset is the period from when it is constructed until it reaches its defined intervention level. The modelling undertaken is based on this information which is a ‘best estimate’, with the actual life dependant on numerous factors that influence the rate of deterioration of the asset (e.g. construction methods, materials, weather, usage, and worker skill). Appendix A provides an example calculation of this
Risk Management
Section 14 outlines the management of risk in delivery of assets to the community with their delivery considered in the Enterprise Risk Management Program. Critical assets are identified in each AMP with those most critical listed in this Strategy.
Improvement Program
The process of managing assets is one of continually improving the knowledge Council has including maintaining up to date asset registers, condition ratings and the cost of work on the asset and the rate at which assets deteriorate and reach their intervention level.
To manage that process Council has undertaken a self-assessment against the National Asset Management Assessment Framework (NAMAF), which assisted in developing a plan of action to improve Council’s Asset Management knowledge, practices and benchmark performance. The benchmarking information has been taken from data made available on a number of Council’s that have completed an assessment.
Figure 1.4: Status of NAMAF Improvement Program
At the beginning of the Asset Management Project in 2012 Council was assessed at 59% compliance in terms of
meeting the objectives of the NAMAF framework. By March 2016, Council had achieved a 77% compliance rating. The adopted improvement plan in Appendix B will ensure that Council maintains this level of competency and achieves full compliance with the NAMAF in 2016
0%10%20%30%40%50%60%70%80%90%100%
0%10%20%30%40%50%60%70%80%90%
100%
Str
ate
gic
Lo
ng
Ter
mP
lan
nin
g
An
nu
al B
ud
get
An
nu
al R
epo
rt
Ass
et M
anag
emen
tP
oli
cy
Ass
et M
ana
gem
ent
Str
ate
gy
Ass
et M
ana
gem
ent
Pla
n
Go
ver
nan
ce a
nd
Man
ag
emen
t
Pra
ctic
e A
rea
Da
ta a
nd
Sy
stem
Sk
ill
an
d P
roce
ss
Ev
alu
atio
n
Status of NAMAF Improvement Program
Bench MarkLow Bench MarkHigh 2012 2016
Asset Management Strategy
Bogan Shire Council Jayantha Ediriweera - Water and Asset Manager Page 6 Asset and Water Manager
2. Strategic Framework
Bogan Shire Council developed a comprehensive community engagement strategy to ensure a broad range of opinions; ideas and visions were captured to help shape the Bogan Community Strategic Plan. From this Plan a number of key outcomes are supported by the effective management of Assets including:
Safe and Secure
Economic viability for the shire as a whole – sustained business activity and continuing economic development
Effective regulation and law enforcement
Safe and trafficable road networks
Full range of health services readily available
Sanitation standards maintained
Water quality assured
Effective sewerage systems in place
Flood Protection provided
Protection and promotion of natural and man‐made environments
Enjoyable
Quality sporting and recreation facilities provided
Cultural and social fabric of the community encouraged and supported
Library service catering for the broader community
The latest communication mediums are easily accessible
High standard of service maintained through successful management of assets
Affordable
Lower cost of living relative to regional and capital centres of population
Competitive and diverse commercial enterprises
Equitable distribution of rates, fees and charges
Efficient and effective delivery of services
Relaxed
The more laid‐back qualities associated with “country” living are not lost
Community and social fabric promoted and supported
To assist in delivering these outcomes, Council will operate and maintain its assets to:
1. Ensure adequate provision is made for the long-term management of assets, the delivery of new assets and the renewal or upgrading of existing assets to meet service delivery objectives.
2. Ensure that assets are maintained in a safe and functional condition.
3. To encourage and support the economic and social development in and around Bogan Shire
4. Ensure that Infrastructure is managed to deliver the requirements of Council’s Asset Management Policy
and Community Strategic Plan.
We will achieve these objectives by:
Maximising the service potential of existing assets by ensuring that they are appropriately used and maintained
Identifying opportunities to reduce demand for new / upgraded assets by implementing demand management techniques and considering alternative service delivery options
Increasing value for money in the identification and delivery of new works by considering life cycle costing and / or alternative construction techniques
Focusing attention on results by clearly assigning responsibility, accountability and reporting requirements in relation to asset management.
The key principles guiding the development of Council’s Asset Management Strategy are:
Sound information and systems are needed to inform decision making;
Comprehensive asset management planning is required to ensure decisions are based on an evaluation of alternatives that take into account life cycle costs, benefits and risks of assets;

Asset Management Strategy
Bogan Shire Council Jayantha Ediriweera - Water and Asset Manager Page 7 Asset and Water Manager
The Community will be informed and have an opportunity to have involvement in establishing level of service standards based on a willingness to pay;
Responsibility for asset management, including accountability and reporting requirements, is clearly established, communicated and implemented;
An effective policy framework is established for the strategic management of assets.
To assist in the delivery of the objectives in this plan, a number of key documents & systems have been prepared
and should be referred to in considering the findings presented:
Table 2.1: Where can I find additional information?
Document / System Content
Community Strategic Plan Outcomes and Strategies identified by the community and includes the delivery,
operational plan, annual report and resourcing strategy
Council Asset Policy How we manage assets
Asset Management Plans Detailed analysis for each asset portfolio including Transport, Buildings, Water,
Sewer, Other Assets
Asset Management Manual Procedures and Processes that guide the management of assets
Condition Assessment Manual Details on the process of assessing condition, including photographic examples of
various conditions
Asset Management System (AM)
(CONFIRM would be available in 2017)
Electronic system that contains the asset register, condition ratings and used to
model future renewals
The Strategy will be influenced by the following factors:
1. The increasing community expectations for a higher quality of service to be provided by Council.
2. An increasing focus on lifestyle and environmental issues.
3. The combination of ageing asset stock and increased community expectations will make risk management an increasingly important asset management activity.
4. The trend for the cost of materials, labour, and risk management will continue to be much greater than CPI in the short to medium term due to:
a) The cost of materials due to a range of factors - increasing: production, wages, cartage, insurances, quality assurance and other ancillary costs.
b) Escalations in the price of petroleum products will continue to have a significant impact because of the high proportion of the budget allocated to maintaining the road network, an area highly sensitive to the price of oil;
c) The continuing increased cost of risk management processes and public liability insurance;
d) The increased cost of occupational health and safety regulation and superannuation contributions.
5. The impact weather patterns have upon the pace of deterioration.
6. The ageing of infrastructure will require renewal at some time in the future if service levels are to be maintained.
7. Council’s 2015/16 Financial Statements indicate that the Bogan Shire Council is in a sound financial position, however further work will need to be undertaken to ensure that Council is able to meet the ‘Fit for the Future’ ratio’s around required asset renewal and asset maintenance expenditures as a rural council.
To effectively manage the long term financial impact of new assets developed as the Town grows, an increase in maintenance, operational and renewal costs will be factored into the plan.
The Town population is projected to grow at 0.14% per annum, based on the latest projections developed for the Community Strategic Plan. This will require new areas for housing, which are being staged through Town planning to provide for logical and economic provision of suitable, serviced land. The population at the 2011 Census was estimated to be 2,900.

Asset Management Strategy
Bogan Shire Council Jayantha Ediriweera - Water and Asset Manager Page 8 Asset and Water Manager
3. Services Provided
Council recognises the importance of asset management planning. The preparation of this Asset Management Strategy is another step in providing guidance to Council on improving its asset management systems and practices.
The establishment of a classification system for asset groups will be included in each asset management plan (AMP) to ensure the efficient allocation of resources to maintain levels of service appropriate to their function. These classifications will be developed within each AMP specifically based on functionality, utilisation, and community requirements.
The infrastructure assets managed by Council are detailed in Table 3.1, noting that the building current replacement cost for parks, water and sewer are contained within those asset categories.
Table 3.1: Council Asset Portfolio in ($,000)
Asset Category Component Dimension / Scale Current
Replacement Cost
Transport Regional and Rural Roads with road structures ,bus shelters ,signs and culverts
1490 km
$ 161,340 Town and Village Streets 70.5 km
Footpaths 12.3 km
Bridges 14 Nos
Stormwater Levee bank with gates and pump stations, 12.3 km $ 6,330
Kerbs and gutter 40.0 km $ 2,817
Open drains with storm water signs 9.0 km $ 907
Water Water Canal 67 km $ 3,793
Water Mains( trunk and reticulation) 107 km $ 11,992
Water Treatment Works 01 No $ 7,472
Water Pumping Stations 07 Nos $ 1,056
Water Reservoirs(standpipe, concrete and dams)
13 Nos $6,754
Sewer Sewer Mains ( gravity and rising) 20 km $7,600
Sewerage Pump Stations 04 Nos $2,265
Sewerage Treatment Works 01 No $699
Buildings Administration
$27,395
Public order & safety
Health
Environment
Community services & education
Housing & community amenities
Water
Sewer
Recreation & culture
Mining manufacture & Construction
Housing & Community Amenities
Transport & Communication
Other (Includes Swimming pool, Airport, plant, office equipment, land and other assets) $ 6,230
Total $246,650

Asset Management Strategy
Bogan Shire Council Jayantha Ediriweera - Water and Asset Manager Page 9 Asset and Water Manager
4. Levels of Service
One of the basic tenets of sound asset management practice is to provide the level of service the current and
future community want and are prepared to pay for, in the most cost effective way (IIMM2015). The final
determination of service levels will be undertaken in conjunction with the community as the Superior Asset
Management Project progresses. This will enable Council to make informed decisions on the allocation of
community resources in accordance with community priorities and willingness to pay.
Figure 4.1 – How do we develop Level of Service?
The level of service and the cost to deliver services at that level is an essential component in strategic asset management planning. Council must know the true cost of service delivery, priorities placed by the community on infrastructure, the service levels that are desired by the community and at what level they are willing to pay.
Figure 4.2 – How can we determine a sustainable level of service?
Strategy
Service
Asset
Outcomes agreed by Council / Community
Services required to meet outcomes
Infrastructure required to support the service
What the Community wants
What the community will pay
Community Desires
Willingness to Pay
Whole of Life Cost
What it will cost to provide
Benefits
Costs
Benefit / Cost Ratio

Asset Management Strategy
Bogan Shire Council Jayantha Ediriweera - Water and Asset Manager Page 10 Asset and Water Manager
As work on developing acceptable levels of service are underway, for the development of each Asset Management Plan, historical defined levels of service will be identified together with options to increase or decrease these levels and the cost savings / increases associated with those options. This will provide an excellent starting point for the consultation required as indicative costs for various service levels will be available.
Council will continue to develop service levels in the future revisions of each Asset Management Plan and link these service levels to the Delivery Program. This will provide the link between service levels and costs of service delivery, providing a tool for community consultation on these levels to enable Council to make decisions on service levels and costs in setting budgets and rate levels.
To assist in this process, consideration of life cycle costing and funding models is required to better inform Council and the Community.
Figure 4.3 – How do Levels of Service influence the Delivery Program?
Two primary types of level of service are defined in the AMP’s:
Community LOS – relates to how the community receives the service in terms of safety, quality, quantity,
reliability responsiveness, cost efficiency and legislative compliance; and
Technical LOS – are the technical measures of performance developed to ensure the minimum
community levels of service are met.
Current LOS based on available
budgets
Resource Plan and Delivery Program used to assist with community
consultation
Adjust Levels of Service based on
community
feedback
Finalise Asset Management Plans based on feedback identifying required
budgets for the Delivery Program

Asset Management Strategy
Bogan Shire Council Jayantha Ediriweera - Water and Asset Manager Page 11 Asset and Water Manager
5. Condition of Council’s Assets
Council maintains a Condition Assessment Manual that details the frequency of inspection and condition rating to
be used for all assets. This data is recorded in the Council Asset Management Systems and used to predict the
timing of renewal / maintenance requirements in the Long Term Financial Plan.
Bogan Shire council follows the Integrated Planning and Reporting Manual for local government in NSW since
the consistent approach to the identification of asset conditions is a key objective of the NSW Government’s
integrated planning and reporting reforms. Therefore, council has adopted the following five-category condition
assessment model as described in infrastructure planning and reporting manual.
However, conditions of roads are particularly important when considering the pavement structure and seal of the
road. For these components, more specific description s of condition levels may include in following tables. A
similar approach is applied for the condition assessment of footpath as well.
Level Condition Description Description for Roads
1 Excellent No work required( normal maintenance) Normal maintenance
2 Good Only minor maintenance work required Some surface/Pavement structure deterioration – Patching only needed for repair
3 Average Maintenance required Serious surface/Pavement structure deterioration - Require resurfacing or recycling of pavement structure
4 Poor Renewal required Deterioration materially affecting entire surface /Pavement structure - requires renovation within 1 year
5 Very poor Urgent renewal / upgrading required Deterioration of sufficient extent to render the surface /Pavement structure unserviceable
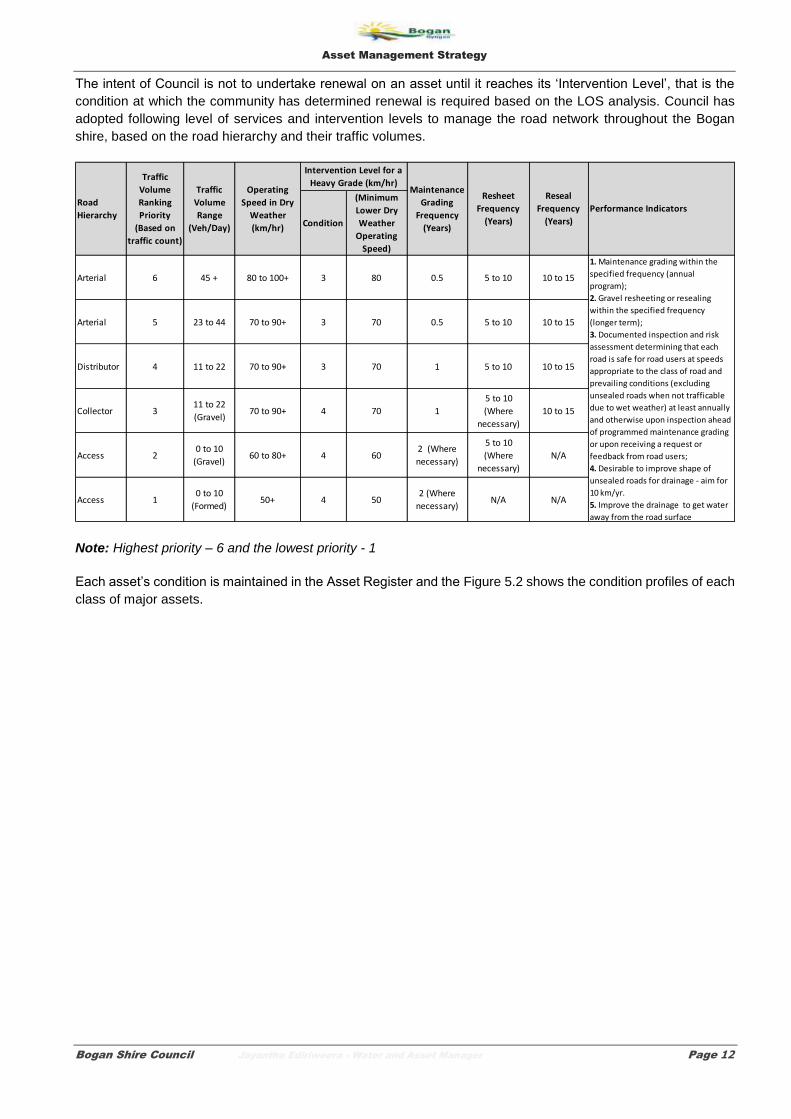
The intent of Council is not to undertake renewal on an asset until it reaches its ‘Intervention Level’, that is the
condition at which the community has determined renewal is required based on the LOS analysis. Council has
adopted following level of services and intervention levels to manage the road network throughout the Bogan
shire, based on the road hierarchy and their traffic volumes.
Table 5.1: What are Council’s Intervention Levels to Renew an Asset?
Components Hierarchy Intervention Level
Useful Life
Road Surface - Seal Arterial and Distributor Average 25
Road Surface Formed Gravel Arterial ,Distributor ,Collector and Access
Poor 30
Water Treatment Plant, Water Pumps and Water Pipes
Criticality AAA Average 80
Sewerage Pump Stations and Sewer mains
Criticality AAA Average 50
Buildings ( Admin, Community Services, Health and Safety)
Criticality AA Poor 40
Other Assets (Swimming pool, Playground equipment, Sporting grounds)
Criticality A Poor 25
Asset Management Strategy
Bogan Shire Council Jayantha Ediriweera - Water and Asset Manager Page 12 Asset and Water Manager
The intent of Council is not to undertake renewal on an asset until it reaches its ‘Intervention Level’, that is the
condition at which the community has determined renewal is required based on the LOS analysis. Council has
adopted following level of services and intervention levels to manage the road network throughout the Bogan
shire, based on the road hierarchy and their traffic volumes.
Note: Highest priority – 6 and the lowest priority - 1
Each asset’s condition is maintained in the Asset Register and the Figure 5.2 shows the condition profiles of each
class of major assets.
Condition
(Minimum
Lower Dry
Weather
Operating
Speed)
Arterial 6 45 + 80 to 100+ 3 80 0.5 5 to 10 10 to 15
Arterial 5 23 to 44 70 to 90+ 3 70 0.5 5 to 10 10 to 15
Distributor 4 11 to 22 70 to 90+ 3 70 1 5 to 10 10 to 15
Collector 311 to 22
(Gravel)70 to 90+ 4 70 1
5 to 10
(Where
necessary)
10 to 15
Access 20 to 10
(Gravel)60 to 80+ 4 60
2 (Where
necessary)
5 to 10
(Where
necessary)
N/A
Access 10 to 10
(Formed)50+ 4 50
2 (Where
necessary)N/A N/A
Resheet
Frequency
(Years)
Reseal
Frequency
(Years)
Performance Indicators
1. Maintenance grading within the
specified frequency (annual
program);
2. Gravel resheeting or resealing
within the specified frequency
(longer term);
3. Documented inspection and risk
assessment determining that each
road is safe for road users at speeds
appropriate to the class of road and
prevailing conditions (excluding
unsealed roads when not trafficable
due to wet weather) at least annually
and otherwise upon inspection ahead
of programmed maintenance grading
or upon receiving a request or
feedback from road users;
4. Desirable to improve shape of
unsealed roads for drainage - aim for
10 km/yr.
5. Improve the drainage to get water
away from the road surface
Road
Hierarchy
Traffic
Volume
Ranking
Priority
(Based on
traffic count)
Traffic
Volume
Range
(Veh/Day)
Operating
Speed in Dry
Weather
(km/hr)
Intervention Level for a
Heavy Grade (km/hr)Maintenance
Grading
Frequency
(Years)

Asset Management Strategy
Bogan Shire Council Jayantha Ediriweera - Water and Asset Manager Page 13 Asset and Water Manager
Figure 5.2: What Condition Are Council’s Assets in ($,000)?

Asset Management Strategy
Bogan Shire Council Jayantha Ediriweera - Water and Asset Manager Page 14 Asset and Water Manager
Condition Assessment Model for Bogan Shire Roads
Road Hierarchy - Formed Gravel Roads
Arterial Distributor
Excellent Normal
maintenance
Good Some
surface/Pavement
structure
deterioration –
Patching only
needed for repair
Average Serious
surface/Pavement
structure
deterioration -
Require resurfacing
or recycling of
pavement structure
Poor Deterioration
materially affecting
entire surface
/Pavement
structure - requires
renovation within 1
year
Very poor Deterioration of
sufficient extent to
render the surface
/Pavement
structure
unserviceable
Condition Description

Asset Management Strategy
Bogan Shire Council Jayantha Ediriweera - Water and Asset Manager Page 15 Asset and Water Manager

Asset Management Strategy
Bogan Shire Council Jayantha Ediriweera - Water and Asset Manager Page 16 Asset and Water Manager

Asset Management Strategy
Bogan Shire Council Jayantha Ediriweera - Water and Asset Manager Page 17 Asset and Water Manager
6. Operations
Operational activities are those regular activities that are required to continuously provide the service including asset inspection, electricity costs, fuel and overheads. Inspections are an important operational activity and details of some of those undertaken are provided below, further information is available in each AMP.
Table 6.1: When do we undertake Inspections?
Inspection Frequency
Transport (Formed Gravel Surface) After rain or Every six months
Transport (Sealed surface Surface) Annually
Transport (Pavement Structures) Annually
Water – Condition of above ground assets Quarterly
Sewer – Condition of above ground assets Quarterly
Buildings – safety for medium / high buildings Quarterly
Other Assets Quarterly
The expenditure on operational costs in each asset group are detailed in table 6.2 and graphed below in Figure 6.1.
Table 6.2: What are Council’s Annual Average Operational Costs?
Activity 10 year average
($,000)
Transport and Stormwater 2,365
Water 1,674
Sewer 410
Buildings 426
Other Assets 50
Total 4,925
Figure 6.1: What is the breakup of Council’s Operational Costs?
2,365 48%
1,674 34%
410 8%
426 9%
50 1%
Transport
Water
Sewer
Buildings
Other Assets

Asset Management Strategy
Bogan Shire Council Jayantha Ediriweera - Water and Asset Manager Page 18 Asset and Water Manager
7. Maintenance
Routine maintenance is the regular on-going work that is necessary to keep assets operating to ensure they reach
their useful life. It includes work on an asset where a portion may fail and need immediate repair to make it
operational again. It may be either planned where works are programmed in or cyclic in nature or reactive in
response to storm damage, vandalism etc.
Maintenance is either planned or reactive, defined as:
Reactive maintenance – unplanned repair work carried out in response to service requests.
Planned maintenance – repair work that is identified and managed through a maintenance management system (MMS). MMS activities include inspection, assessing the condition against failure/breakdown experience, prioritising, scheduling, actioning the work and reporting what was done to develop a maintenance history and improve maintenance and service delivery performance.
Maintenance expenditure levels are considered to be adequate to meet required service levels. Future revision of this strategy will include linking required maintenance expenditures with required service levels in the Community Strategic Plan. The level of service and standards of care for maintenance is carried out in accordance with details in each AMP. Example maintenance activities are outlined in table 7.1.
Table 7.1: Examples of Maintenance Activities and the frequency we undertake them are?
Asset Group Activity Class Frequency
Transport Maintenance Grading Arterial ,
Distributor, Collector
Access
Regional road = 6 Monthly
Distributor and Collector
road = Annually
Access road = Every two
year
Water Mains flushing All Quarterly
Sewer CCTV Inspections All Annually
Buildings Fire Systems All Annually
Drainage Cleaning of pipes All Planned maintenance
Adjusting Levels of Service
Council can adjust the level of service and reduce the cost of providing the service by either reducing the time to respond to maintenance requests (e.g. only undertaking work during business hours), or by reducing the frequency of maintenance activities (e.g. grading roads on a less frequent basis). Conversely increasing the frequency of maintenance activities will increase the cost of providing the service.
The proposed maintenance programs are detailed in each AMP, with the average annual costs detailed below:
Table 7.2: What are Council’s Average Annual Maintenance Costs?
Activity 10 year average
(2015 $,000)
Transport and Stormwater 2,112
Water 623
Sewer 345
Buildings 94
Other Assets 30
Total 3,204

Asset Management Strategy
Bogan Shire Council Jayantha Ediriweera - Water and Asset Manager Page 19 Asset and Water Manager
Figure 7.1: What is the breakup of Council’s Maintenance Costs?
2,112 66%
623 19%
345 11%
94 3%
30 1%
Transport
Water
Sewer
Buildings
Other Assets

Asset Management Strategy
Bogan Shire Council Jayantha Ediriweera - Water and Asset Manager Page 20 Asset and Water Manager
8. Capital Renewal / Rehabilitation
Renewal or rehabilitation includes work on an existing asset to replace or rehabilitate it to a condition that restores the capability of the asset back to that which it had originally. The intervention level and estimated useful lives are contained in Table 5.1.
Renewal will be undertaken using ‘low-cost’ renewal methods where practical. The aim of ‘low-cost’ renewals is to restore the service potential or future economic benefits of the asset by renewing the assets at a cost less than the full replacement cost.
This Asset Strategy contains an analysis based on broad assumptions and best available knowledge to date. Modelling is not an exact science so we deal with long term averages across the entire asset stock. Work will continue on improving the quality of Council’s asset registers and systems to increase the accuracy of Council’s renewal models.
Assets requiring renewal will be generally identified from estimates of remaining life and condition assessments obtained from the asset register and models. Asset renewal proposals will be inspected to verify the accuracy of the remaining life estimate and to develop a preliminary renewal estimate. Verified proposals are ranked by priority and available funds, and then scheduled in future works programmes.
Details of planned renewal activities proposed over the next 4 years are contained in each Asset Management Plan. The first year of the program will be considered in the development of the next Operational Plan and the remaining 3 years of work will be assessed each year to confirm that the asset has reached its intervention level prior to the work being scheduled.
The costs presented in table 8.1 identify the required level of funding to maintain the asset to what is considered an appropriate standard and the funding available. The required funding in that table is based on the intervention levels specified in Section 5.
For this strategy, an analysis has been undertaken to determine assets that are already at or above intervention level that are not able to be funded in the next Operational Plan. This work is quantified in the ‘Backlog’ column, with the estimated backlog after 10 years also identified.
Table 8.1: Renewal Costs, Backlog and Gap (10 year average – in $,000)
Activity Budgeted Renewal (10 year average)
Required Renewals
(10 year average)
Funding Gap (10 year average)
Backlog (2025/26)
Transport and Stormwater 1,065 1,195 605 1,300
Water 491 515 64 235
Sewer 125 125 0 0
Buildings 410 410 0 0
Other Assets 66 66 0 0
Total 2,157 2,311 669 1,535
It is clear from the initial analysis of each asset class that a gap in funding may exist depending on the condition at which renewal occurs. A number of options are available to manage this gap, including:
Improving knowledge of the condition of assets and their remaining life, thereby deferring renewal as late as possible;
Improving maintenance to extend the life of assets and defer projected renewal;
Improving efficiency and introducing innovative practices for carrying out maintenance and renewal works;
Using lower cost renewal / rehabilitation methods;
Rationalising (disposing of unnecessary assets);
Lowering service levels;
Increasing funding; and / or a
Combinations of each option.

Asset Management Strategy
Bogan Shire Council Jayantha Ediriweera - Water and Asset Manager Page 21 Asset and Water Manager
Asset Management Plans for each asset class consider these options in the analysis of service levels and the gap analysis.
It should also be recognised that the acquisition of additional assets (expansion and upgrade) will add to the funding gap for projected renewal and to annual operating and maintenance costs.
Figure 8.1: What will we spend over the next 10 years on Renewal in ($,000)?
It has been identified that renewal works for the following assets are required within Council’s 10 year Long Term Financial Plan. Whether or not renewal works are undertaken will be determined by Council priorities, including whether or not existing buildings should be retained, and as these decisions have yet to be made, the costs have not been included in the Long Term Financial Plan as this would be unrealistic.. It would be expected that if Council does not receive funding or can borrow funds that some of these projects will not be viable.
Administration Building $ 600,000
Environmental Building $ 50,000
Town Hall $ 500,000
Additional Staff Housing $ 1,000,000
Palais Theatre/Youth centre $ 3,000,000
Aged Care Accommodation $ 1,000,000
Figure 8.1 indicates that, based on current projections, Council will spend approximately $1.8 million per annum on renewals across the 5 major asset groups. The yellow bars (rolling backlog) indicate that in any year the value of work exceeding the intervention levels set in the Asset Plans will be between $0.3 million and $4.0 million. If an additional $0.4 million per year was spent on renewals, then at the end of this 10 year period there would be no backlog of renewal works outstanding.
Lifecycle costs
The lifecycle costs are determined based on the total cost of ownership of each asset including operations, maintenance, renewal and disposal costs. The average annualised lifecycle costs for a number of components is presented in each of the individual Asset Management Plans.
$0
$500
$1,000
$1,500
$2,000
$2,500
$3,000
$3,500
$4,000
2016/17 2017/18 2018/19 2019/20 2020/21 2021/22 2022/23 2023/24 2024/25 2025/26
Ren
ewal
Co
st($
'000
)
2016/17 2017/18 2018/19 2019/20 2020/21 2021/22 2022/23 2023/24 2024/25 2025/26
Rolling Backlog $0 $0 $150 $350 $550 $730 $920 $1,125 $1,330 $1,535
Other assets $345 $70 $30 $30 $30 $30 $30 $30 $30 $30
Buildings $225 $673 $400 $400 $400 $400 $400 $400 $400 $400
Sewer $227 $375 $250 $125 $0 $225 $0 $25 $0 $25
Water $1,339 $865 $790 $490 $290 $260 $220 $190 $185 $285
Transport $1,403 $1,600 $1,000 $950 $950 $950 $950 $950 $950 $950

Asset Management Strategy
Bogan Shire Council Jayantha Ediriweera - Water and Asset Manager Page 22 Asset and Water Manager
9. Capital Upgrades & New Assets
Upgrades enhance an existing asset to provide a higher level of service, for example widening an existing road seal. New assets are those created to meet an additional service level requirement or increase the size of a network, for example, new subdivisions, or extension of the stormwater drainage network.
Capital upgrade and expansion expenditure adds to future liabilities. These works commit Council to fund ongoing budget liabilities for operations, maintenance, depreciation and finance costs (where applicable) for the life of the asset. They are discretional expenditure, which increases future operating and maintenance costs because it increases Council’s asset base, but may be associated with additional revenue from the new user group.
The requirements for new assets may result from growth, social or environmental needs. The impact from growth is included and will be further developed in the next suite of Asset Plans and this Strategy. At present growth is predicted to continue at 0.14% per annum.
Upgrades or new assets may be funded at least in part through Developer Contributions in the form of a Section 64 or 94 Contribution, a Voluntary Planning Agreement, or as part of a subdivision development.
New assets and upgrade/expansion of existing assets are identified from various sources such as council or community requests, proposals identified by strategic plans or partnerships with other organisations. Project proposals are assessed to verify need and to develop a preliminary lifecycle cost estimate. Verified proposals are ranked by priority and available funds and scheduled in future works programmes.
Council has developed a framework for the prioritisation of capital projects and that information is used in the consideration of all new projects above the threshold set in the framework. Included in the analysis is the identification of life cycle costs as outlined in Appendix A.
Table 9.1: Top Proposed Project in each asset group over the next 10 years in ($,000)
Asset Group Project Years Estimated Cost ($'000)
Water Water security project 2017-2020 10,000
Transport Road Construction ( 1km) in each year 2017-2025 150
Figure 9.1: What will we spend over the next 10 years on Upgraded or New Assets in ($,000)?
-
500
1,000
1,500
2,000
2,500
3,000
3,500
2016/17 2017/18 2018/19 2019/20 2020/21 2021/22 2022/23 2023/24 2024/25 2025/26
New
Ass
ets
Co
st($
000)
2016/17 2017/18 2018/19 2019/20 2020/21 2021/22 2022/23 2023/24 2024/25 2025/26
Other Assets 40 - - - - - - - - -
Buildings 1,034 305 100 100 100 100 100 100 100 100
Sewer 102 50 50 50 50 50 50 50 50 50
Water 736 2,593 25 - 250 - - - - -
Transport 600 150 150 150 150 150 150 150 150 150

Asset Management Strategy
Bogan Shire Council Jayantha Ediriweera - Water and Asset Manager Page 23 Asset and Water Manager
10. Disposal Plan
Disposal is any activity associated with disposal of a decommissioned asset including sale, demolition or
relocation. Assets with a condition rating of 5 (Very poor condition), where Council has received no contact through
the Customer Request System indicating that the community don’t require the asset (as they have raised concerns
or complaints about the asset condition) may be considered to be a redundant asset or not utilised and therefore
decommissioned and disposed unless it is considered critical infrastructure
Prior to consideration of any proposed disposal a detailed report will be presented to Council.
Table 10.1: What assets are we planning to dispose of?
Asset Reason Year Cost
N/A N/A N/A N/A

Asset Management Strategy
Bogan Shire Council Jayantha Ediriweera - Water and Asset Manager Page 24 Asset and Water Manager
11. Financial Plan
As part of its funding strategy, Council has the option to supplement any or all of the current or new Asset
proposals that come into consideration for construction with borrowings. This strategy is heavily influenced by the
monitoring of Councils Debt Service Ratio. The debt service ratio is a measure of the degree to which revenues
are committed to servicing debt. The purpose of the ratio is to assess the impact of loan principal and interest
repayments on the discretionary revenue of the Council. Council’s long term target is to maintain a ratio of less
than 12%.
A summary of the income and expenditure over the next 20 years is included in Appendix C, with the projected budget amounts being based on 2015 dollars increased for growth by 0.9% per annum. It is important to recognise that the forecasts developed in each AMP and therefore this Strategy are based on delivering the levels of service identified in each Plan. This information will be used to assist in the development of the overall Council Long Term Financial Plan that is adopted with the Community Strategic Plan, Delivery Program and Operational Plan.
Any changes made to the overall Long Term Financial Plan adopted by Council will be reflected in the next Asset Management Strategy and AMP’s.
Funding for management of assets can come from a variety of sources as detailed in the table below.
Table 11.1: Where does Council’s Funding and Income come from?
Activity ($,000)
Grants & Other Contributions 7,234
Fees & Charges 2,327
Rates & General Revenue 2,812
Interest and Investment Revenue 120
Total 12,931
Figure 11.1: What is the breakup of Council’s income streams?
49%
0%
27%
22%
2%
Grants & Other Contributions
Infrastructure Levy (Addit Rates)
Fees & Charges
Rates & General Revenue
Interest

Asset Management Strategy
Bogan Shire Council Jayantha Ediriweera - Water and Asset Manager Page 25 Asset and Water Manager
12. Key Performance Measures
AMPs document the linkage between levels of service and life cycle costs. Performance Levels are target Levels
of Service. The performance measures for Council services typically are:
Community safety and accessibility of the built environment - including reductions in road pavement
roughness, and increases in accessibility including maintaining and extending network of sealed roads,
footpaths, and bridges;
Accessibility of footpaths, and levels of street lighting;
Environmental amenity - including the cleaning of stormwater drainage pits, water quality works, public
transport and bicycle way enhancements.
To monitor these performance standards, the following asset knowledge needs to be assembled:
Demand projections and forecasts;
A description of the current asset portfolio;
A broad description of the management activities (operations & maintenance, renewals, capital works and
asset disposals) required to deliver the defined service levels;
Identification of strategies and actions required to ensure service sustainability, including resources and
timeframes;
A cash-flow forecast outlining the asset related expenditure required over the term of the plan;
Compliance and risk strategies and costs.
As part of identifying the best value mix of service, there needs to be a clearly understood link between the
economic, social and environmental prosperity for the community and the asset stock needed and revenues
needed to deliver these objectives.
This information allows Council to make better informed decisions on the allocation of limited resources based on
community values of service and cost. It stands to reason that the provision of services providing the highest
benefit at the least cost will give the greatest value.

Asset Management Strategy
Bogan Shire Council Jayantha Ediriweera - Water and Asset Manager Page 26 Asset and Water Manager
13. Plan Improvements
It is not the intention of this strategic document to identify recommendations for individual areas of Council’s operations, but to establish the key areas for asset management improvement. An independent review of Council’s asset management processes and data utilising the NAMAF undertaken by Jacqui Hansen and Mike Brearley, on behalf of the LMWUA, in October 2015 confirmed that Bogan Shire Council are currently performing very well. The tasks covered by the objectives of Asset Management Strategy, Asset Plans, Governance and Management and Levels of Service are particularly well done. For these four elements, Bogan achieved the highest score of the eleven councils assessed.
ID Details Maturity Maximum Result
1 Strategic Long Term Planning
17
20
85%
2 Annual Budget
13
16
81%
3 Annual Report
17
20
85%
4 Asset Management Policy
14
20
70%
5 Asset Improvement Strategy
11
12
92%
6 Asset Plans
70
88
80%
7 Governance and Management
24
28
86%
8 Levels of Service
12
16
75%
9 Data & Systems
22
32
69%
10 Skills & Processes
27
40
68%
11 Evaluation
6
12
50%
Overall 233 304 77%
Details of the review are contained in the Asset Management Improvement Strategy (AMIS) report and includes the following improvement actions:
The NAMAF assessment has primarily identified that these Council’s AM documents are due for review. Most were developed in 2012 and now require an update to reflect Council’s latest data.
Based on this assessment the high priority areas from the action plan are:
1. Council’s AM Policy was drafted in 2014 but not adopted by Council. Council must adopt an AM Policy which defines Council’s vision and service delivery objectives for asset management.
2. Council’s AM Strategy must document the current status of AM practices (processes, asset data and information systems) and what improvements are required, with corresponding accountabilities, resource requirements and timeframes. Because the AM Strategy was developed in 2012, it does not reflect the current status or an up to date improvement plan. In addition, the asset valuations detailed in the AM Strategy are now outdated. It is recommended that Council update the AM Strategy.
3. Council’s AM Plans were developed in 2012 and require an update to reflect as a minimum the latest asset data and contemporary capital works planning.

Asset Management Strategy
Bogan Shire Council Jayantha Ediriweera - Water and Asset Manager Page 27 Asset and Water Manager
4. Partial linkages exist between the Long Term Financial Plan and AM Plans. Whilst good linkages exist between the Water and Sewer AM Plan and the LTFP, improvements are needed for the other asset classes. It is recommended that after AM Plans are updated, that the links between each AM Plan and the LTFP be strengthened.
5. AM System: Whilst Council maintains an up-to-date multiple spreadsheet system, it is not completely integrated or secured. Council will continue with neighbouring councils, to investigate options for a consolidated and integrated asset register with the required functionality to ensure security and data integrity. This may mean a move away from spreadsheets to a software system.
6. Further work is required on Community Levels of Service monitoring and performance reporting. In particular, Council’s Customer Service request System needs development.
The action plan has been updated to incorporate the priorities identified in the NAMAF and is attached in Appendix B.

Asset Management Strategy
Bogan Shire Council Jayantha Ediriweera - Water and Asset Manager Page 28 Asset and Water Manager
14. Risk Management Plan
Bogan Shire Council is committed to a structured and systematic approach to the management of risk and has
committed resources to the implementation of an Enterprise Risk Management Program. This program aims to
embed the principles of risk management in all aspects of Council’s operations, which will ultimately:
Increase the likelihood of Council achieving its objectives
Create an environment where all employees have a key role in managing risk
Encourage proactive management
Improve the identification of opportunities and threats
Improve stakeholder confidence and trust
Improve financial stability and minimise losses
Improve organisational performance
For assets with potentially long lives, risks associated with changing economic conditions, varying levels of
demand for services, new competition and maintenance and disposal requirements needs to be analysed and
managed to ensure the investment is worthwhile.
The relative size of a project is not the only consideration. Projects or programs, which are inherently complex will
also benefit from particular attention to Risk Management. This might occur when there are important economic
or financial aspects, sensitive environmental or safety issues, or complex regulatory and licensing requirements.
One of the outcomes of this risk assessment in each plan will be the determination of Critical Assets. Critical
assets are specific assets which have a high consequence of failure but not necessarily a high likelihood of failure.
By identifying critical assets and critical failure modes, Council can appropriately target and refine inspection
regimes, maintenance plans and capital expenditure plans.
Operations and maintenances activities may also be targeted to mitigate critical assets failure and maintain
service levels. These activities may include increased inspection frequency, higher maintenance intervention
levels, etc. The most critical assets in each group are identified in the individual Asset Management Plans, with
examples presented in Table 14.1 below:
Table 14.1 Critical Assets
Asset Group Critical Asset Critical Failure Mode Treatment Plan
Transport and Storm water (Roads)
1. Yarrandale Road
2. Hermidale Nymagee Road
Premature failure due to sub-
standard design and / or
construction
Increased condition inspections to
enable early intervention. Renewal
scheduled at condition 3
Water Pipes rated AAA (trunk and
reticulation)
Mains breakage interrupting service Shortened response times to
breakages, renewal at condition 3
Sewer Sewer Pump House -1 Pump failure or loss of power Standby pumps, installation of
generator and contingency plans
Buildings Administration building Destruction due to fire event. Increased inspection regime on
fire detection systems, business
continuity planning.
Other Assets Swimming pool Failure of chemical dosing , pump
controls and infrastructure
Increased inspection regime to
asset maintenance and renewal
requirements.

Asset Management Strategy
Bogan Shire Council Jayantha Ediriweera - Water and Asset Manager Page 29 Asset and Water Manager
15. Appendix A: Example of Annual Service Costs
This example details the costs to provide, operate (including daily cleaning), and maintain a new public Barbeque that is expected to have a life of 10 years. The annual service cost is detailed in Table A.1.
Table A.1 Annual Service Cost for a Public BBQ
Capital Cost Annual Service Cost Remarks
Capital Cost 8,000
Finance/Opportunity cost 320 4% pa
Depreciation 800 10 years
Operations (cleaning) 7,300 Daily cleaning
Maintenance 400
Demolition 100 $1,000 @ 10 yrs
Revenue 0
TOTAL $8,000 8,920
The Annual Service Cost for the provision of the public barbeque is $8,920 for the 10 year life required. The cost per use can be calculated by dividing the Annual Service Cost by the number of uses.
The Costs shown in bold are the ongoing budget commitments that the Council must fund in future budgets for the service provided by the new barbeque. These total $8,920 per annum for the next 10 years (depreciation, operations, and maintenance).
The Annual Service Cost is a tool for evaluating capital works projects. Council should be satisfied that it will obtain value or community benefits greater than $8,920 per annum for this project, otherwise the project should not be approved.
This information will be used when considering annual capital works programs to assist in assessing projects. This shows the project estimate, apportioned into renewal and new asset components, the budget commitment and equivalent rate increase required to fund the budget commitment and the annual service cost.
In determining its capital works program, Council will make a policy decision to allocate funds for asset renewal in accordance with its Asset Management Plans under the principle of allocating the value of depreciation expense progressively for asset renewals.

Asset Management Strategy
Bogan Shire Council Jayantha Ediriweera - Water and Asset Manager Page 30 Asset and Water Manager
16. Appendix B: Improvement Action Plan (2016)
# Details Responsibility Status Due Completed
1 Strategic Long Term Planning
1.1 Council has a Strategic Longer Term Plan (planning horizon of at least 5 years) that incorporates a vision, strategic outcomes, mission, values and service outcomes that Council wants to achieve.
GM Completed 2012
1.2 The development of the Strategic Longer Term Plan included community consultation and reflects community needs.
GM Completed 2012
1.3 The Strategic Longer Term Plan incorporates priorities and performance measures and indicates how they will be monitored and measured.
GM Completed 2012
1.4 Council has a sustainable Long Term Financial Plan covering the period of the Strategic Longer Term Plan (at least 5 year) supporting the implementation of its Long Term Plan.
FM Completed 2012
1.5 The Long Term Financial Plan has been prepared based on the resource requirements and strategic objectives detailed in Council’s Long Term Plan and Asset Management Plans.
FM Moderate 2012
2 Annual Budget
2.1 The Annual Budget contains estimates of revenue and expenditure with an explanation of the assumptions and methodologies underpinning the estimates, an explanation of the financial performance and position of the Council and has been prepared based on the resource requirements and strategic objectives detailed in Council’s Strategic Longer Term Plan, Asset Management Plans and Long Term Financial Plan.
FM Advanced
2.2 The Annual Budget reflects the Council's strategic objectives and contains a statement of how Council will meet the goals and objectives of its Strategic Longer Term Plan.
FM Advanced
2.3 The Annual Budget aligns with Year 1 of the Long Term Financial Plan, and was adopted following community consultation
FM Completed
2.4 Council’s Annual Budget includes resources to implement Strategic Longer Term Plan strategies.
FM Advanced
3 Annual Report
3.1 The Annual Report complies with all statutory requirements including publication by the due date and is made widely available to the public.
FM Completed
3.2 The Annual Report includes independently audited financial statements that are prepared on an accrual basis in accordance with the Australian Accounting Standards.
FM Completed

Asset Management Strategy
Bogan Shire Council Jayantha Ediriweera - Water and Asset Manager Page 31 Asset and Water Manager
# Details Responsibility Status Due Completed
3.3 The Annual Report reviews the performance of the Council against its strategic objectives and explains variations between the budget and actual results and how these variations impact on the Strategic Longer term plan
FM Moderate
3.4 The Annual Report includes details of any major changes in functions of the Council, organisation structure and/or policy initiatives and how these changes might impact on Council’s Strategic Longer Term Plan
Advanced
3.5 In relation to the financial reporting framework in the Annual Report, the Annual Report addresses the following issues in accordance with relevant state policies, Australian Accounting Standards and other best practice guidelines: a. Asset valuations and revaluations b. Asset acquisitions including capitalisation policy c. Asset disposals
FM Completed
4 Asset Management Policy
4.1 Council has an adopted Asset Management Policy which defines the Council’s vision and service delivery objectives for asset management.
GM Moderate
4.2 The Asset Management Policy has a direct linkage with Council’s Strategic Longer Term Plan and Long Term Financial Plan.
GM Advanced
4.3 The Asset Management Policy requires the adoption of Asset Management Plans informed by community consultation and local government financial reporting frameworks.
GM Advanced
4.4 The Asset Management Policy defines asset management roles, responsibilities and reporting framework.
GM Advanced
4.5 The Asset Management Policy identifies a process for meeting training needs in financial and asset management practices for councillors and staff.
GM Advanced
5 Asset Improvement Strategy
5.1 Council has an Asset Management Strategy which shows how the asset portfolio can meet the service delivery needs of the community and defines the future vision of asset management practices within Council
AM Completed
5.2 Council’s Asset Management Strategy is linked to Council's Asset Management Policy and integrated into Council’s Strategic Longer Term planning and annual budgeting processes.
AM Completed
5.3 Council's Asset Management Strategy documents the current status of asset management practices (processes, asset data and information systems) within the Council and what actions Council must take to implement the Asset Management Policy, including and accountabilities, resource requirements, timeframes
AM Advanced
5.4 Add in Critical Asset section and details on linkage to LTFP
AM Not Commenced

Asset Management Strategy
Bogan Shire Council Jayantha Ediriweera - Water and Asset Manager Page 32 Asset and Water Manager
# Details Responsibility Status Due Completed
6 Asset Plans
6.1 There are documented Asset Management Plans for all material asset groups in a consistent format in accordance with industry best practice (E.g. Appendix A of the International Infrastructure Management Manual (IIMM)) available to all relevant staff across the organisation.
AM Advanced
6.2 The Asset Management Plans define which asset groups are covered by each Plan in accordance with a clearly documented Infrastructure Asset Hierarchy.
AM Completed
6.3 a. AMP refers to Council's Asset Management Policy and Asset Management Strategy;
AM Advanced
6.4 b. AMPs Include all assets and document asset inventory information for the asset group/category as recorded in the asset register;
AM Advanced
6.5 c. AMPs Document the asset hierarchy within each asset group;
AM Completed
6.6 d. AMPs Document the current condition of assets; AM Advanced
6.7 e. AMPs Document the adopted useful lives of assets; AM Completed
6.8 f. AMPs Include risk assessment and criticality profiles; AM Completed
6.9 g. AMPs Provide information about assets, including particular actions and costs to provide a defined (current and/or target) level of service in the most cost effective manner;
AM Advanced
6.10 h. AMPs Include demand management forecasts; AM Advanced
6.11 i. AMPs Address life cycle costs of assets; AM Advanced
6.12 j. AMPs Include forward programs identifying cash flow forecasts projected for i. Asset Renewals;
MES Advanced
6.13 j. AMPs Include forward programs identifying cash flow forecasts projected for ii. New Assets and Upgrades of existing assets;
MES Advanced
6.14 j. AMPs Include forward programs identifying cash flow forecasts projected for iii. Maintenance expenditure
MES Advance
6.15 j. AMPs Include forward programs identifying cash flow forecasts projected for iv. Operational expenditure (including depreciation expense);
MES Advanced
6.16 k. AMPs Address asset performance and utilisation measures and associated targets as linked to levels of service;
MES Advanced
6.17 l. AMPs Include an asset rationalisation and disposal program; and
MES Advanced
6.18 m. AMPs Include an asset management improvement plan.
MES Advanced
6.19 n. AMPs Include consideration of non-asset service delivery solutions (leasing private/public partnerships)
MES Advanced
6.20 o. AMPs Recognise changes in service potential of assets through projections of asset replacement costs, depreciated replacement cost and depreciation expense.
MES Advanced

Asset Management Strategy
Bogan Shire Council Jayantha Ediriweera - Water and Asset Manager Page 33 Asset and Water Manager
# Details Responsibility Status Due Completed
6.21 The Asset Management Plans link to the Council’s Asset Management Policy, Asset Management Strategy, Strategic Longer Term Plan, Long Term Financial Plan and other relevant Council Policy objectives.
MES Advanced
6.22 The Asset Management Plans have all been prepared in association with community consultation.
MES Advanced
7 Governance and Management
7.1 Council has mechanisms in place to provide high level oversight by the Council, CEO/GM and Executive Management Team, for development and implementation of the Asset Management Strategy and Asset Management Plans.
GM Completed
7.2 Roles and responsibilities are clearly defined in a matrix or policy, identifying positions responsible for determining levels of service and positions responsible for managing the assets to meet service delivery needs
GM Completed
7.3 The staff structure and position descriptions clearly define asset management functions, responsibilities and skill requirements for managing all asset classes.
Advanced
7.4 Council has a documented process for making capital investment decisions, which is driven by Council’s Strategic Longer Term Plan, Long Term Financial Plan and the Council Plan and explicitly details the impacts on the future operations and maintenance budgets, “Whole of Life” costs and risk management assessments.
GM Advanced
7.5 Council involves all its departments in Asset Management.
GM Completed
7.6 Council has an Asset Management Steering Committee, with cross functional representation and clearly defined and documented terms of reference, focussed on coordinating the linkages between service delivery and asset management implementation.
GM Advanced
7.7 There are internal processes to promote Asset Management across Council
GM Advanced
8 Levels of Service
8.1 Council has Service Plans for each of its services which have been developed in consultation with the community.
GM Advanced
8.2 Council has undertaken the process of defining, quantifying and documenting current community levels of service and technical levels of service, and costs of providing the current levels of service.
GM Advanced
8.3 Current and target levels of service (for both community levels of service and associated technical levels of service) are clearly defined in each Asset Management Plan.
GM Advanced
8.4 Technical levels of service are incorporated into service agreements and/or maintenance, operational and capital renewal procedures.
MES Advanced

Asset Management Strategy
Bogan Shire Council Jayantha Ediriweera - Water and Asset Manager Page 34 Asset and Water Manager
# Details Responsibility Status Due Completed
9 Data & Systems
9.1 Council has a consolidated, integrated, accurate, up to date and complete componentised asset register with the required functionality to ensure security and data integrity, which includes all information about each asset sorted by asset group.
AM Moderate
9.2 There is a common corporate data framework used across all asset groups, which is defined by Council’s Infrastructure Asset Hierarchy.
AM Advanced
9.3 Council has documented repeatable methodologies to carry out consistent asset condition surveys and defect identification assessments, as documented in a Condition Rating Assessment Manual for applicable asset classes
AM Advanced
9.4 Council's asset financial reporting functionality is comprehensive and includes audit trails, depreciation calculations, reporting thresholds and records of acquisition and disposal of assets
FM Advanced
9.5 Council's systems, procedures and processes allow it to benchmark its asset management performance against like Councils over time.
AM Moderate
9.6 Asset Management systems have the functionality to generate maintenance and renewal programs and produce associated cash flow forecasts.
AM Advanced
9.7 Council has defined and documented procedures for determining asset replacement and treatment unit rates, which are then stored in Council’s Asset Management system.
AM Advanced
9.8 Council has a defined process for operations, maintenance, renewal and upgrade planning for its existing assets.
AM Advanced
10 Skills & Processes
10.1 Council has a process to review and update the Asset Management Strategy on a maximum of a 5 year cycle. The Asset Management Strategy is to be formally adopted by Council.
AM Advanced
10.2 Council has a process to review and update Asset Management Plans for all asset groups on a maximum of a 3 to 4 year cycle consistent with the Council election cycle. Asset Management Plans are formally adopted by Council
AM Advanced
10.3 Council has a process to identify operational risks, assign responsibilities and monitor risk treatment actions all recorded within a risk register.
MES Moderate
10.4 Council has a process to annually review and update the financial forecasts for all asset classes and update the Long Term Financial Plan.
FM Advanced
10.5 Council has assessed the skills and knowledge required to perform asset data management activities, conduct financial reporting valuations and develop Asset Management Plans. Council has a current asset management skills matrix. Staff training needs have been identified and training scheduled.
GM Advanced

Asset Management Strategy
Bogan Shire Council Jayantha Ediriweera - Water and Asset Manager Page 35 Asset and Water Manager
# Details Responsibility Status Due Completed
10.6 Council has a defined methodology for assessing the Remaining and Useful Life, Residual Value and Depreciation Method of assets.
AM Completed
10.7 Council has a process to collect and record asset data into an Asset Management system upon the commissioning of new (and/or modified) assets, including built and contributed assets.
AM Completed
10.8 Council has formal processes for the handover of assets to asset custodians/owners.
GM Minimal
10.9 Council has a process to communicate the financial implications of the Asset Management Plans to internal and external stakeholders.
FM Moderate
10.10 Council provides ongoing training programs for councillors, council management and officers on key asset management topics.
GM Moderate
11 Evaluation
11.1 Council has a documented evaluation process by which asset management improvements are identified, timeframes established, resources allocated, actioned, monitored and reported to the Executive Management Team and /or CEO
GM Moderate
11.2 Technical levels of service are monitored and performance reported.
MES Moderate
11.3 Community levels of service are monitored and performance reported.
MES Moderate

Asset Management Strategy
Bogan Shire Council Jayantha Ediriweera – Manager Water and Asset Page 36
17. Appendix C: 20 Year Financial Plan in ($,000)
Table C.1: Long Term Financial Plan - General
Year 2016/17 2017/18 2018/19 2019/20 2020/21 2021/22 2022/23 2023/24 2024/25 2025/26 2026/27 2027/28 2028/29 2029/30 2030/31 2031/32 2032/33 2033/34 2034/35 2035/36 Average(20yr)
Income
Grants & Other Contributions 7,672 5,633 5,906 6,311 6,589 6,786 6,988 7,171 7,434 7,653 7,653 7,653 7,653 7,653 7,653 7,653 7,653 7,653 7,653 7,653 7,234
Infrastructure Levy (Addit Rates) - 43 44 45 46 47 49 50 51 52 52 52 52 52 52 52 52 52 52 52 47
Fees & Charges 2,327 3,478 3,580 3,686 3,795 3,908 4,023 4,142 4,265 4,391 4,391 4,391 4,391 4,391 4,391 4,391 4,391 4,391 4,391 4,391 4,075
Rates & General Revenue 2,812 2,879 2,949 3,019 3,092 3,166 3,242 3,320 3,399 3,481 3,481 3,481 3,481 3,481 3,481 3,481 3,481 3,481 3,481 3,481 3,308
Interest 120 265 260 260 264 269 271 272 269 265 265 265 265 265 265 265 265 265 265 265 258
Sub-Total 12,931 12,298 12,739 13,321 13,786 14,176 14,574 14,955 15,418 15,842 15,842 15,842 15,842 15,842 15,842 15,842 15,842 15,842 15,842 15,842 14,923
Renewal
Transport 1,403 1,600 1,000 950 950 950 950 950 950 950 780 780 780 780 780 780 780 780 780 780 923
Water 1,339 865 790 490 290 260 220 190 185 285 175 175 175 175 175 175 175 175 175 175 333
Sewer 227 375 250 125 - 225 - 25 - 25 200 25 - 525 - 225 - 25 - 25 114
Buildings 225 673 400 400 400 400 400 400 400 400 297 297 297 297 297 297 297 297 297 297 353
Other assets 345 70 30 30 30 30 30 30 30 30 30 30 30 30 30 30 30 30 30 30 48
Sub-Total 3,539 3,583 2,470 1,995 1,670 1,865 1,600 1,595 1,565 1,690 1,482 1,307 1,282 1,807 1,282 1,507 1,282 1,307 1,282 1,307 1,771
Maintenance
Transport 2,112 2,112 2,112 2,112 2,112 2,112 2,112 2,112 2,112 2,112 2,112 2,112 2,112 2,112 2,112 2,112 2,112 2,112 2,112 2,112 2,112
Water 623 623 623 623 623 623 623 623 623 623 623 623 623 623 623 623 623 623 623 623 623
Sewer 210 354 356 357 358 360 361 362 364 365 366 368 369 371 372 374 375 376 378 379 359
Buildings 94 94 94 94 94 94 94 94 94 94 94 94 94 94 94 94 94 94 94 94 94
Other Assets 30 30 30 30 30 30 30 30 30 30 30 30 30 30 30 30 30 30 30 30 30
Sub-Total 3,069 3,213 3,215 3,216 3,217 3,219 3,220 3,221 3,223 3,224 3,225 3,227 3,228 3,230 3,231 3,233 3,234 3,236 3,237 3,239 3,218
Operations
Transport 2,365 2,365 2,365 2,365 2,365 2,365 2,365 2,365 2,365 2,365 2,365 2,365 2,365 2,365 2,365 2,365 2,365 2,365 2,365 2,365 2,365
Water 1,674 1,674 1,674 1,674 1,674 1,674 1,674 1,674 1,674 1,674 1,674 1,674 1,674 1,674 1,674 1,674 1,674 1,674 1,674 1,674 1,674
Sewer 410 410 410 410 410 410 410 410 410 410 410 410 410 410 410 410 410 410 410 410 410
Buildings 426 426 426 426 426 426 426 426 426 426 426 426 426 426 426 426 426 426 426 426 426
Other Assets 50 50 50 50 50 50 50 50 50 50 50 50 50 50 50 50 50 50 50 50 50
Sub-Total 4,925 4,925 4,925 4,925 4,925 4,925 4,925 4,925 4,925 4,925 4,925 4,925 4,925 4,925 4,925 4,925 4,925 4,925 4,925 4,925 4,925
Upgrade / Expansion
Transport 600 150 150 150 150 150 150 150 150 150 150 150 150 150 150 150 150 150 150 150 173
Water 736 2,593 25 - 250 - - - - - - - - - - - - - - - 180
Sewer 102 50 50 50 50 50 50 50 50 50 50 50 50 50 50 50 50 50 50 50 53
Buildings 1,034 305 100 100 100 100 100 100 100 100 100 100 100 100 100 100 100 100 100 100 237
Other Assets 40 - - - - - - - - - - - - - - - - - - - 2
Sub-Total 2,512 3,098 325 300 550 300 300 300 300 300 300 300 300 300 300 300 300 300 300 300 564
Total Expenditure 14,045 14,819 10,935 10,436 10,362 10,309 10,045 10,041 10,013 10,139 9,932 9,759 9,735 10,262 9,738 9,965 9,741 9,768 9,744 9,771 10,478
Rolling Backlog - - 150 350 550 730 920 1,125 1,330 1,535 1,690 1,815 1,940 2,065 2,190 2,315 2,430 2,545 2,660 2,775 139

Asset Management Strategy
Bogan Shire Council Jayantha Ediriweera – Manager Water and Asset Page 37
Table C.2: Long Term Financial Plan –Water
Year 2016/17 2017/18 2018/19 2019/20 2020/21 2021/22 2022/23 2023/24 2024/25 2025/26 2026/27 2027/28 2028/29 2029/30 2030/31 2031/32 2032/33 2033/34 2034/35 2035/36
Average
Income
Grants $155 $2,650 $132 $132 $383 $133 $113 $103 $100 $101 $94 $94 $94 $94 $94 $94 $94 $94 $94 $94 $155
Develop Contributions $0 $0 $0 $0 $0 $0 $0 $0 $0 $0 $0 $0 $0 $0 $0 $0 $0 $0 $0 $0 $0
Fees & Charges $1,769 $1,817 $1,865 $1,915 $1,967 $2,019 $2,073 $2,129 $2,186 $2,245 $2,305 $2,305 $2,305 $2,305 $2,305 $2,305 $2,305 $2,305 $2,305 $2,305 $2,152
Other Income $577 $77 $77 $77 $77 $77 $77 $77 $77 $77 $77 $77 $77 $77 $77 $77 $77 $77 $77 $77 $102
Total Income $2,500 $4,543 $2,074 $2,124 $2,426 $2,229 $2,263 $2,309 $2,363 $2,422 $2,476 $2,476 $2,476 $2,476 $2,476 $2,476 $2,476 $2,476 $2,476 $2,476 $2,408
Renewals
Mains $80 $80 $80 $80 $80 $50 $40 $25 $25 $25 $25 $25 $25 $25 $25 $25 $25 $25 $25 $25 $41
APC Channel $180 $180 $180 $180 $180 $180 $150 $135 $130 $130 $120 $120 $120 $120 $120 $120 $120 $120 $120 $120 $141
Treatment Plant $995 $575 $350 $0 $0 $0 $0 $0 $0 $0 $0 $0 $0 $0 $0 $0 $0 $0 $0 $0 $96
Pumps & Others $84 $30 $180 $230 $30 $30 $30 $30 $30 $130 $30 $30 $30 $30 $30 $30 $30 $30 $30 $30 $55
Renewal $1,339 $865 $790 $490 $290 $260 $220 $190 $185 $285 $175 $175 $175 $175 $175 $175 $175 $175 $175 $175 $333
Maintenance
Mains $46 $46 $46 $46 $46 $46 $46 $46 $46 $46 $46 $46 $46 $46 $46 $46 $46 $46 $46 $46 $46
APC Channel $153 $153 $153 $153 $153 $153 $153 $153 $153 $153 $153 $153 $153 $153 $153 $153 $153 $153 $153 $153 $153
Treatment Plant $131 $131 $131 $131 $131 $131 $131 $131 $131 $131 $131 $131 $131 $131 $131 $131 $131 $131 $131 $131 $131
Pumps & Others $293 $293 $293 $293 $293 $293 $293 $293 $293 $293 $293 $293 $293 $293 $293 $293 $293 $293 $293 $293 $293
Total $623 $623 $623 $623 $623 $623 $623 $623 $623 $623 $623 $623 $623 $623 $623 $623 $623 $623 $623 $623 $623
Operations
Mains $59 $59 $59 $59 $59 $59 $59 $59 $59 $59 $59 $59 $59 $59 $59 $59 $59 $59 $59 $59 $59
APC Channel $585 $585 $585 $585 $585 $585 $585 $585 $585 $585 $585 $585 $585 $585 $585 $585 $585 $585 $585 $585 $585
Treatment Plant $33 $33 $33 $33 $33 $33 $33 $33 $33 $33 $33 $33 $33 $33 $33 $33 $33 $33 $33 $33 $33
Pumps & Others $997 $997 $997 $997 $997 $997 $997 $997 $997 $997 $997 $997 $997 $997 $997 $997 $997 $997 $997 $997 $997
Total $1,674 $1,674 $1,674 $1,674 $1,674 $1,674 $1,674 $1,674 $1,674 $1,674 $1,674 $1,674 $1,674 $1,674 $1,674 $1,674 $1,674 $1,674 $1,674 $1,674 $1,674
Upgrade / Expansion
Storage $736 $2,593 $25 $0 $250 $0 $0 $0 $0 $0 $0 $0 $0 $0 $0 $0 $0 $0 $0 $0 $180
Water Treatment and Headworks $0 $0 $0 $0 $0 $0 $0 $0 $0 $0 $0 $0 $0 $0 $0 $0 $0 $0 $0 $0 $0
Others including Pipelines $0 $0 $0 $0 $0 $0 $0 $0 $0 $0 $0 $0 $0 $0 $0 $0 $0 $0 $0 $0 $0
Total $736 $2,593 $25 $0 $250 $0 $0 $0 $0 $0 $0 $0 $0 $0 $0 $0 $0 $0 $0 $0 $180
Total Expenditure $4,372 $5,755 $3,112 $2,787 $2,837 $2,557 $2,517 $2,487 $2,482 $2,582 $2,472 $2,472 $2,472 $2,472 $2,472 $2,472 $2,472 $2,472 $2,472 $2,472 $2,810
Rolling Backlog $0 $0 $0 $0 $0 $30 $70 $125 $180 $235 $290 $315 $340 $365 $390 $415 $430 $445 $460 $475 $228

Asset Management Strategy
Bogan Shire Council Jayantha Ediriweera – Manager Water and Asset Page 38
Table C.2: Long Term Financial Plan –Sewer
Year
2016/17
2017/18
2018/19
2019/20
2020/21
2021/22
2022/23
2023/24
2024/25
2025/26
2026/27
2027/28
2028/29
2029/30
2030/31
2031/32
2032/33
2033/34
2034/35
2035/36
Average
Income
Grants $9 $9 $9 $9 $9 $9 $9 $9 $9 $9 $9 $9 $9 $9 $9 $9 $9 $9 $9 $9 $9
Develop Contributions $0 $0 $0 $0 $0 $0 $0 $0 $0 $0 $0 $0 $0 $0 $0 $0 $0 $0 $0 $0 $0
Fees & Charges $626 $626 $626 $626 $626 $626 $626 $626 $626 $626 $626 $626 $626 $626 $626 $626 $626 $626 $626 $626 $626
Other Income $79 $79 $79 $79 $79 $79 $79 $79 $79 $79 $79 $79 $79 $79 $79 $79 $79 $79 $79 $79 $79
Total Income $714 $714 $714 $714 $714 $714 $714 $714 $714 $714 $714 $714 $714 $714 $714 $714 $714 $714 $714 $714 $0
Renewals
Sewer Main Renewal $30 $0 $0 $0 $0 $200 $0 $0 $0 $0 $200 $0 $0 $0 $0 $200 $0 $0 $0 $0 $32
Pumpstations $80 $25 $0 $25 $0 $25 $0 $25 $0 $25 $0 $25 $0 $525 $0 $25 $0 $25 $0 $25 $42
SCADA System $0 $0 $0 $100 $0 $0 $0 $0 $0 $0 $0 $0 $0 $0 $0 $0 $0 $0 $0 $0 $0
STP Improvement $117 $350 $250 $0 $0 $0 $0 $0 $0 $0 $0 $0 $0 $0 $0 $0 $0 $0 $0 $0 $36
Renewal $227 $375 $250 $125 $0 $225 $0 $25 $0 $25 $200 $25 $0 $525 $0 $225 $0 $25 $0 $25 $109
Maintenance
Mains $67 $210 $210 $210 $210 $210 $210 $210 $210 $210 $210 $210 $210 $210 $210 $210 $210 $210 $210 $210 $203
Pumping Stations $16 $16 $16 $16 $17 $17 $17 $17 $17 $17 $17 $18 $18 $18 $18 $18 $18 $19 $19 $19 $17
Treatment $10 $10 $10 $10 $10 $10 $11 $11 $11 $11 $11 $11 $11 $11 $11 $11 $12 $12 $12 $12 $11
Others with management expenses $117 $118 $119 $120 $121 $122 $123 $125 $126 $127 $128 $129 $130 $131 $133 $134 $135 $136 $137 $139 $128
Other $0 $0 $0 $0 $0 $0 $0 $0 $0 $0 $0 $0 $0 $0 $0 $0 $0 $0 $0 $0 $0
Total Maintenance $210 $354 $356 $357 $358 $360 $361 $362 $364 $365 $366 $368 $369 $371 $372 $374 $375 $376 $378 $379 $359
Operations
Mains $118 $118 $118 $118 $118 $118 $118 $118 $118 $118 $118 $118 $118 $118 $118 $118 $118 $118 $118 $118 $118
Pumping Stations $13 $13 $13 $13 $13 $13 $13 $13 $13 $13 $13 $13 $13 $13 $13 $13 $13 $13 $13 $13 $13
Treatment $5 $5 $5 $5 $5 $5 $5 $5 $5 $5 $5 $5 $5 $5 $5 $5 $5 $5 $5 $5 $5
Others with management expenses $274 $274 $274 $274 $274 $274 $274 $274 $274 $274 $274 $274 $274 $274 $274 $274 $274 $274 $274 $274 $274
Other $0 $0 $0 $0 $0 $0 $0 $0 $0 $0 $0 $0 $0 $0 $0 $0 $0 $0 $0 $0 $0
Total Operations $410 $410 $410 $410 $410 $410 $410 $410 $410 $410 $410 $410 $410 $410 $410 $410 $410 $410 $410 $410 $410
Upgrade / Expansion
Pump Stations $102 $50 $50 $50 $50 $50 $50 $50 $50 $50 $50 $50 $50 $50 $50 $50 $50 $50 $50 $50 $53
Treatment and Disposal $0 $0 $0 $0 $0 $0 $0 $0 $0 $0 $0 $0 $0 $0 $0 $0 $0 $0 $0 $0 $0
Other Structures incl Plant $0 $0 $0 $0 $0 $0 $0 $0 $0 $0 $0 $0 $0 $0 $0 $0 $0 $0 $0 $0 $0
Total Upgrade/Exp $102 $50 $50 $50 $50 $50 $50 $50 $50 $50 $50 $50 $50 $50 $50 $50 $50 $50 $50 $50 $53
Total Expenditure $949 $1,189 $1,066 $942 $818 $1,045 $821 $847 $824 $850 $1,026 $853 $829 $1,356 $832 $1,059 $835 $862 $838 $865 $935
Rolling Backlog $0 $0 $0 $0 $0 $0 $0 $0 $0 $0 $0 $0 $0 $0 $0 $0 $0 $0 $0 $0

Asset Management Strategy
Bogan Shire Council Jayantha Ediriweera – Manager Water and Asset Page 39