assessments of undiscovered oil and gas resources of the
TRANSCRIPT

1
Assessment of Undiscovered Oil and Gas Resources of the Nation’s Outer Continental Shelf, 2021
Introduction This report summarizes the results of the Bureau of Ocean Energy Management’s (BOEM) 2021 Assessment of Undiscovered Oil and Gas Resources for the U.S. Outer Continental Shelf (OCS). The OCS comprises the portion of the submerged seabed of which the mineral estate is subject to Federal jurisdiction (Figure 1). The 2021 assessment represents a comprehensive appraisal that considers relevant data and information available as of January 1, 2019 and builds upon previous OCS resource assessments. This assessment provides estimates of undiscovered, technically and economically recoverable oil and natural gas resources outside of known oil and gas fields on the OCS. It considers recent geophysical, geological, technological, and economic information and uses a probabilistic play-based approach to estimate the undiscovered oil and gas resources for individual geologic plays. This methodology is suitable for both conceptual plays, where there is little specific information available, and for established plays, where considerable information from discovered oil and gas fields is available. Individual geologic play results are aggregated to larger areas including basins, planning areas, and regions. More detailed information about the geology, assessment methodology, and economics will be made available in separate play-specific regional assessment reports.
Commodities Assessed Commodities assessed include crude oil, natural gas liquids (condensate), and natural gas that exist in
conventional reservoirs and are producible with conventional recovery techniques. Crude oil and condensate are reported jointly as oil; associated and non-associated gas are reported as gas. Oil volumes are reported as billions of barrels of oil (Bbo) and gas as trillion standard cubic feet of gas (Tcfg). Oil-equivalent gas is a volume of gas (associated and/or non-associated) expressed in terms of its energy equivalence to oil (i.e., 5,620 cubic feet of gas is equal to one barrel of oil). The combined volume of oil and oil-equivalent gas resources is referred to as barrel of oil-equivalent (BOE) and is reported in Bbo. To ensure consistency in reporting recoverable resources across all OCS regions, this assessment does not include quantities of hydrocarbon resources that could be recovered from known and future fields by enhanced recovery techniques. It also does not consider methane hydrates, gas in geopressured brines, or oil and natural gas that could be present in insufficient quantities or quality (low-permeability, “tight” reservoirs) to be produced by conventional recovery techniques. Estimates of undiscovered recoverable resources are presented in two categories: undiscovered technically recoverable resources (UTRR), and undiscovered economically recoverable resources (UERR). UTRR estimates are generated stochastically and are reported here at the mean value and at the 95th and 5th percentile values. This range of estimates corresponds to a 95 percent probability (i.e., a 19 in 20 chance) and a 5 percent probability (i.e., a 1 in 20 chance) of there being more than those amounts present, respectively. The 95th and 5th percent probabilities are considered reasonable
Using a play-based assessment methodology, the Bureau of Ocean Energy Management estimates a mean of 68.79 billion barrels of undiscovered technically recoverable oil and a mean of 229.03 trillion cubic feet of undiscovered technically recoverable natural gas in the United States Outer Continental Shelf.
Figure 1. Outer Continental Shelf areas of the United States.
BOEM Fact Sheet RED-

2
minimum and maximum values, and the mean is the average or expected value. UTRR results are presented as “risked” estimates, meaning resource estimates include the probability, or risk, that hydrocarbons could not be present in the play. UERR results are presented as price-supply curves, which show the relationship of commodity prices to economically recoverable resources. Price-supply curves couple oil prices with gas prices to reflect fixed economic values of gas relative to oil. Due to fluctuations in the economic value of gas, the 2021 assessment analyzed five different British Thermal Unit (BTU)-based oil and gas price pairings. These pairings represent gas prices that assume a 20 percent, 30 percent, 40 percent, 60 percent, and 100 percent economic value of gas relative to oil on a BTU basis. Due to current market conditions this Fact Sheet reports the 30 percent pairings.
Methodology The 2021 assessment of undiscovered resources incorporates a play-based approach toward the analysis of hydrocarbon potential. The play-based approach provides a strong relationship between information derived from oil and gas exploration activities and the geologic model developed by BOEM’s assessment team. An extensive effort was undertaken in developing play models, delineating the geographic limits of each play, and compiling data on geologic and reservoir engineering parameters. These parameters are used in determining the total quantities of recoverable resources in each play. The BOEM assessment model uses a probabilistic approach to account for the inherent uncertainties associated with an assessment of undiscovered resources. Results are reported as a range of values corresponding to different probabilities of occurrence. Due to sparse data associated with many of the geologic plays in the frontier portions of the Alaska, Atlantic, Gulf of Mexico, and Pacific OCS regions, analog plays are developed as a subjective approach to cover the range of uncertainties associated with these plays. For mature areas with significant amounts of data, such as the Gulf of Mexico and Southern California, geologic plays are analyzed by combining the subjective methodology using historical trends with a discovery-based approach to account for the existing discovered pools. The economic portion of the assessment incorporates a range of oil and gas price points and employs a relationship between the cost of exploration and development and commodity prices. For the 2021 assessment, BOEM developed and incorporated a new, standardized methodology for estimating the chance of success for both geologic plays and individual prospects. BOEM also developed a new workflow that quantifies the probability of three major
petroleum system elements and applies the chance of success (chance hydrocarbons are discovered) of a geologic play or prospect based on the quality of data associated with those elements.
Assessment Results The 2021 assessment represents a multi-year effort that includes data and information available as of January 1, 2019. Estimates of UTRR oil for the entire OCS range from 57.32 Bbo at the 95th percentile to 81.75 Bbo at the 5th percentile, with a mean of 68.79 Bbo (Figure 2 and Table 1). Similarly, gas estimates range from 183.46 Tcfg to 278.22 Tcfg with a mean of 229.03 Tcfg. On a BOE basis, 43 percent of the potential resources are within the
Figure 2. Risked Mean Undiscovered Technically Recoverable Resources by type and region.
3
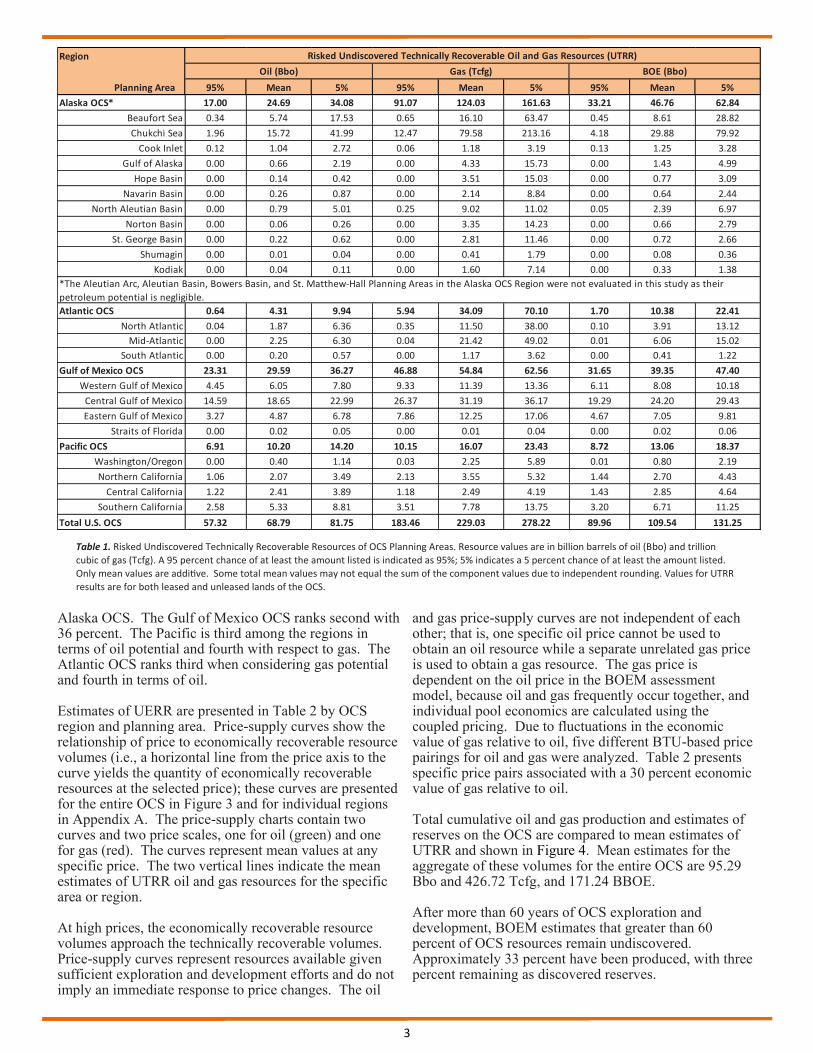
Alaska OCS. The Gulf of Mexico OCS ranks second with 36 percent. The Pacific is third among the regions in terms of oil potential and fourth with respect to gas. The Atlantic OCS ranks third when considering gas potential and fourth in terms of oil. Estimates of UERR are presented in Table 2 by OCS region and planning area. Price-supply curves show the relationship of price to economically recoverable resource volumes (i.e., a horizontal line from the price axis to the curve yields the quantity of economically recoverable resources at the selected price); these curves are presented for the entire OCS in Figure 3 and for individual regions in Appendix A. The price-supply charts contain two curves and two price scales, one for oil (green) and one for gas (red). The curves represent mean values at any specific price. The two vertical lines indicate the mean estimates of UTRR oil and gas resources for the specific area or region. At high prices, the economically recoverable resource volumes approach the technically recoverable volumes. Price-supply curves represent resources available given sufficient exploration and development efforts and do not imply an immediate response to price changes. The oil
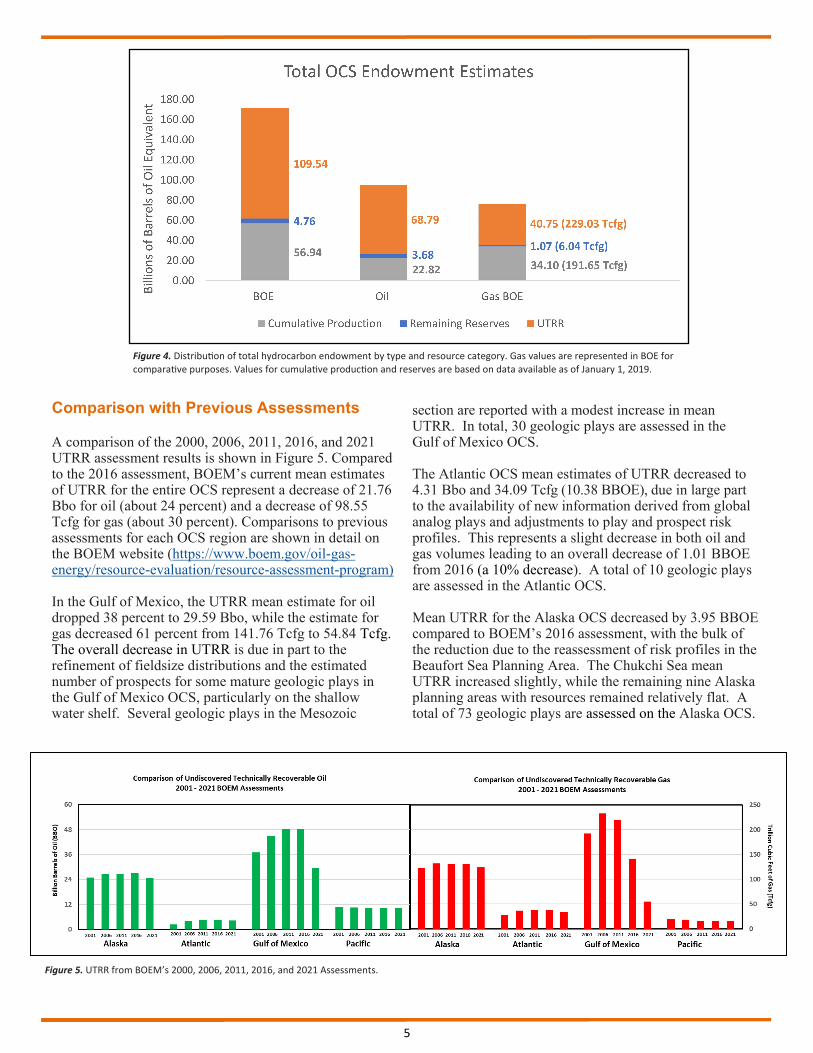
and gas price-supply curves are not independent of each other; that is, one specific oil price cannot be used to obtain an oil resource while a separate unrelated gas price is used to obtain a gas resource. The gas price is dependent on the oil price in the BOEM assessment model, because oil and gas frequently occur together, and individual pool economics are calculated using the coupled pricing. Due to fluctuations in the economic value of gas relative to oil, five different BTU-based price pairings for oil and gas were analyzed. Table 2 presents specific price pairs associated with a 30 percent economic value of gas relative to oil. Total cumulative oil and gas production and estimates of reserves on the OCS are compared to mean estimates of UTRR and shown in Figure 4. Mean estimates for the aggregate of these volumes for the entire OCS are 95.29 Bbo and 426.72 Tcfg, and 171.24 BBOE. After more than 60 years of OCS exploration and development, BOEM estimates that greater than 60 percent of OCS resources remain undiscovered. Approximately 33 percent have been produced, with three percent remaining as discovered reserves.
Table 1. Risked Undiscovered Technically Recoverable Resources of OCS Planning Areas. Resource values are in billion barrels of oil (Bbo) and trillion
cubic of gas (Tcfg). A 95 percent chance of at least the amount listed is indicated as 95%; 5% indicates a 5 percent chance of at least the amount listed.
Only mean values are additive. Some total mean values may not equal the sum of the component values due to independent rounding. Values for UTRR
results are for both leased and unleased lands of the OCS.
Region
Planning Area 95% Mean 5% 95% Mean 5% 95% Mean 5%
Alaska OCS* 17.00 24.69 34.08 91.07 124.03 161.63 33.21 46.76 62.84
Beaufort Sea 0.34 5.74 17.53 0.65 16.10 63.47 0.45 8.61 28.82
Chukchi Sea 1.96 15.72 41.99 12.47 79.58 213.16 4.18 29.88 79.92
Cook Inlet 0.12 1.04 2.72 0.06 1.18 3.19 0.13 1.25 3.28
Gulf of Alaska 0.00 0.66 2.19 0.00 4.33 15.73 0.00 1.43 4.99
Hope Basin 0.00 0.14 0.42 0.00 3.51 15.03 0.00 0.77 3.09
Navarin Basin 0.00 0.26 0.87 0.00 2.14 8.84 0.00 0.64 2.44
North Aleutian Basin 0.00 0.79 5.01 0.25 9.02 11.02 0.05 2.39 6.97
Norton Basin 0.00 0.06 0.26 0.00 3.35 14.23 0.00 0.66 2.79
St. George Basin 0.00 0.22 0.62 0.00 2.81 11.46 0.00 0.72 2.66
Shumagin 0.00 0.01 0.04 0.00 0.41 1.79 0.00 0.08 0.36
Kodiak 0.00 0.04 0.11 0.00 1.60 7.14 0.00 0.33 1.38
Atlantic OCS 0.64 4.31 9.94 5.94 34.09 70.10 1.70 10.38 22.41
North Atlantic 0.04 1.87 6.36 0.35 11.50 38.00 0.10 3.91 13.12
Mid-Atlantic 0.00 2.25 6.30 0.04 21.42 49.02 0.01 6.06 15.02
South Atlantic 0.00 0.20 0.57 0.00 1.17 3.62 0.00 0.41 1.22
Gulf of Mexico OCS 23.31 29.59 36.27 46.88 54.84 62.56 31.65 39.35 47.40
Western Gulf of Mexico 4.45 6.05 7.80 9.33 11.39 13.36 6.11 8.08 10.18
Central Gulf of Mexico 14.59 18.65 22.99 26.37 31.19 36.17 19.29 24.20 29.43
Eastern Gulf of Mexico 3.27 4.87 6.78 7.86 12.25 17.06 4.67 7.05 9.81
Straits of Florida 0.00 0.02 0.05 0.00 0.01 0.04 0.00 0.02 0.06
Pacific OCS 6.91 10.20 14.20 10.15 16.07 23.43 8.72 13.06 18.37
Washington/Oregon 0.00 0.40 1.14 0.03 2.25 5.89 0.01 0.80 2.19
Northern California 1.06 2.07 3.49 2.13 3.55 5.32 1.44 2.70 4.43
Central California 1.22 2.41 3.89 1.18 2.49 4.19 1.43 2.85 4.64
Southern California 2.58 5.33 8.81 3.51 7.78 13.75 3.20 6.71 11.25
Total U.S. OCS 57.32 68.79 81.75 183.46 229.03 278.22 89.96 109.54 131.25
*The Aleutian Arc, Aleutian Basin, Bowers Basin, and St. Matthew-Hall Planning Areas in the Alaska OCS Region were not evaluated in this study as their
petroleum potential is negligible.
Risked Undiscovered Technically Recoverable Oil and Gas Resources (UTRR)
Oil (Bbo) Gas (Tcfg) BOE (Bbo)

4
Figure 3. Price supply curve of the entire United States OCS. Vertical lines represent UTRR and are independent of commodity price. Curved lines represent UERR and are price dependent.
Table 2. Risked Undiscovered Economically Recoverable Resources of OCS Planning Areas. Resource values are in billion barrels of oil (Bbo) and trillion
cubic of gas (Tcfg). Some total mean values may not equal the sum of the component values due to independent rounding. Prices are in dollars per barrel
($/Bbl) for oil, and dollars per thousand cubic feet ($/Mcf) for gas. Table 2 represents a gas price adjustment of 0.3. Values for UERR results are for both
leased and unleased lands of the OCS.
Region
Planning Area
Oil Gas Oil Gas Oil Gas Oil Gas Oil Gas
Alaska OCS* 0.00 0.00 0.02 0.01 0.60 0.24 5.62 5.68 12.24 18.82
Beaufort Sea 0.00 0.00 0.00 0.00 0.02 0.02 2.80 3.75 7.69 14.97
Chukchi Sea 0.00 0.00 0.00 0.00 0.08 0.04 1.67 1.42 2.99 2.89
Cook Inlet 0.00 0.00 0.00 0.00 0.00 0.00 0.02 0.02 0.03 0.05
Gulf of Alaska 0.00 0.00 0.00 0.00 0.00 0.00 0.01 0.01 0.04 0.05
Hope Basin 0.00 0.00 0.00 0.00 0.10 0.03 0.37 0.17 0.47 0.24
Navarin Basin 0.00 0.00 0.00 0.00 0.00 0.00 0.02 0.01 0.05 0.05
North Aleutian Basin 0.00 0.00 0.00 0.00 0.00 0.00 0.00 0.00 0.00 0.00
Norton Basin 0.00 0.00 0.02 0.01 0.40 0.15 0.72 0.28 0.89 0.36
St. George Basin 0.00 0.00 0.00 0.00 0.00 0.00 0.02 0.03 0.08 0.22
Shumagin 0.00 0.00 0.00 0.00 0.00 0.00 0.00 0.00 0.00 0.00
Kodiak 0.00 0.00 0.00 0.00 0.00 0.00 0.00 0.00 0.00 0.00
Atlantic OCS 2.06 0.00 2.88 0.00 3.51 0.00 3.83 0.92 3.95 4.38
North Atlantic 1.05 0.00 1.37 0.00 1.61 0.00 1.73 0.50 1.77 2.25
Mid-Atlantic 1.00 0.00 1.50 0.00 1.85 0.00 2.02 0.42 2.08 2.12
South Atlantic 0.01 0.00 0.03 0.00 0.06 0.00 0.09 0.00 0.11 0.01
Gulf of Mexico OCS 8.27 6.81 13.73 12.20 19.84 20.39 23.53 27.17 25.14 30.85
Western Gulf of Mexico 1.80 1.28 2.89 2.32 4.14 4.03 4.94 5.61 5.28 6.51
Central Gulf of Mexico 5.59 4.75 8.98 8.14 12.76 13.20 15.05 17.42 16.05 19.74
Eastern Gulf of Mexico 0.89 0.78 1.86 1.74 2.94 3.15 3.53 4.13 3.80 4.59
Straits of Florida 0.00 0.00 0.01 0.01 0.01 0.01 0.01 0.01 0.01 0.01
Pacific OCS 3.55 4.81 4.69 6.11 6.15 7.81 7.15 9.05 7.63 9.73
Washington/Oregon 0.05 0.18 0.07 0.24 0.11 0.36 0.15 0.49 0.18 0.58
Northern California 0.72 0.76 0.92 0.98 1.21 1.30 1.43 1.57 1.53 1.71
Central California 0.99 1.03 1.33 1.38 1.69 1.74 1.92 1.99 2.04 2.10
Southern California 1.79 2.84 2.37 3.52 3.14 4.40 3.64 5.01 3.88 5.34
Total U.S. OCS 13.88 11.63 21.32 18.32 30.11 28.44 40.12 42.83 48.95 63.77
*The Aleutian Arc, Aleutian Basin, Bowers Basin, and St. Matthew-Hall Planning Areas in the Alaska OCS Region were not evaluated in this study as
their petroleum potential is negligible.
Risked Undiscovered Economically Recoverable Oil and Gas Resources (UERR)
$8.54/Mcf$1.60/Mcf $5.34/Mcf
$30/Bbl $40/Bbl $60/Bbl $100/Bbl $160/Bbl
$2.14/Mcf $3.20/Mcf
5
Comparison with Previous Assessments
A comparison of the 2000, 2006, 2011, 2016, and 2021 UTRR assessment results is shown in Figure 5. Compared to the 2016 assessment, BOEM’s current mean estimates of UTRR for the entire OCS represent a decrease of 21.76 Bbo for oil (about 24 percent) and a decrease of 98.55 Tcfg for gas (about 30 percent). Comparisons to previous assessments for each OCS region are shown in detail on the BOEM website (https://www.boem.gov/oil-gas-energy/resource-evaluation/resource-assessment-program) In the Gulf of Mexico, the UTRR mean estimate for oil dropped 38 percent to 29.59 Bbo, while the estimate for gas decreased 61 percent from 141.76 Tcfg to 54.84 Tcfg. The overall decrease in UTRR is due in part to the refinement of fieldsize distributions and the estimated number of prospects for some mature geologic plays in the Gulf of Mexico OCS, particularly on the shallow water shelf. Several geologic plays in the Mesozoic
section are reported with a modest increase in mean UTRR. In total, 30 geologic plays are assessed in the Gulf of Mexico OCS. The Atlantic OCS mean estimates of UTRR decreased to 4.31 Bbo and 34.09 Tcfg (10.38 BBOE), due in large part to the availability of new information derived from global analog plays and adjustments to play and prospect risk profiles. This represents a slight decrease in both oil and gas volumes leading to an overall decrease of 1.01 BBOE from 2016 (a 10% decrease). A total of 10 geologic plays are assessed in the Atlantic OCS. Mean UTRR for the Alaska OCS decreased by 3.95 BBOE compared to BOEM’s 2016 assessment, with the bulk of the reduction due to the reassessment of risk profiles in the Beaufort Sea Planning Area. The Chukchi Sea mean UTRR increased slightly, while the remaining nine Alaska planning areas with resources remained relatively flat. A total of 73 geologic plays are assessed on the Alaska OCS.
Figure 4. Distribution of total hydrocarbon endowment by type and resource category. Gas values are represented in BOE for
comparative purposes. Values for cumulative production and reserves are based on data available as of January 1, 2019.
Figure 5. UTRR from BOEM’s 2000, 2006, 2011, 2016, and 2021 Assessments.

6
The Pacific OCS mean UTRR estimates of 10.20 Bbo and 16.07 Tcfg remain relatively unchanged for both oil and natural gas, respectively, when compared to the previous assessment. A total of 43 geologic plays are assessed on the Pacific OCS. A number of changes were made on the input side of UERR calculations, including updating exploration and development cost files, corporate tax rates and structure, and transportation tariff assumptions and costs. The net impact is that UERR volumes shown in Table 2 (and the price-supply curves shown in Figure 3 and Appendix A) represent a decrease for all OCS regions since last reported in 2016.
Notably, UERR gas resources in Alaska have declined since 2016 due to the implementation of an increased transportation tariff associated with the presumed movement of gas via overland pipelines and delivery by liquefied natural gas tanker systems. In the Atlantic OCS, UERR gas volumes were negatively impacted by assumptions associated with geologic field size distributions and from updated development costs. In the Gulf of Mexico, UERR has decreased proportionally with the sizeable drop in UTRR. In the Pacific OCS, the aggregate impact on UERR from changes to the economics inputs is largely neutral.
List of Terms Analogous Reservoirs: Reservoirs that have similar rock and fluid properties, reservoir conditions (depth, temperature, and pressure), and drive mechanisms, but are typically at a more advanced stage of development than the reservoir of interest and thus could provide concepts to assist in the interpretation of more limited data and recovery estimation. Conventionally Recoverable: Resources that are producible by natural pressure, pumping, or secondary recovery methods, such as gas or water injection.
Cumulative Production: The sum of all produced volumes of oil and gas prior to a specified point in time.
Field: Area consisting of a single reservoir or multiple reservoirs all grouped on, or related to, the same general geologic structural feature and/or stratigraphic trapping condition. There could be two or more reservoirs in a field that are separated vertically by impervious strata, laterally by local geologic barriers, or by both.
Play: A group of pools that share a common history of hydrocarbon generation, migration, reservoir development, and entrapment.
Pool: A discovered or undiscovered accumulation of hydrocarbons, typically within a single stratigraphic interval.
Probability: A means of expressing an outcome on a numerical scale ranging from impossibility to absolute certainty; the chance that a specified event will occur.
Prospect: A geologic feature having the potential for trapping and accumulating hydrocarbons; a pool or potential field.
Reserves: The quantities of hydrocarbon resources anticipated to be recovered from known accumulations from a given date forward. All reserve estimates involve some degree of uncertainty. Resources: Concentrations in the earth’s crust of naturally occurring liquid or gaseous hydrocarbons that can conceivably be discovered and recovered. Total Endowment: All technically recoverable hydrocarbon resources of an area. Estimates of total endowment equal the sum of undiscovered technically recoverable resources, cumulative production, and remaining reserves.
Undiscovered Economically Recoverable Resources (UERR): The portion of the undiscovered technically recoverable resources that is economically recoverable under imposed economic and technologic conditions.
Undiscovered Resources: Resources postulated, based on
geologic knowledge and theory, to exist outside of known
fields or accumulations. Included also are resources from
undiscovered pools within known fields to the extent that
they occur within separate plays.
Undiscovered Technically Recoverable Resources
(UTRR): Oil and gas that could be produced as a
consequence of natural pressure, artificial lift, pressure
maintenance, or other secondary recovery methods, but
without any consideration of economic viability. They are
primarily outside of known fields.
7
Selected References BOEM, 2018. 2016a National Assessment of Undiscovered Oil and Gas Resources of the U.S. Outer Continental Shelf. BOEM-2017-085, 115 p. BOEM, 2017. Assessment of Undiscovered Oil and Gas Resources of the Nation’s Outer Continental Shelf, 2016a. BOEM Fact Sheet RED-2017-12, 8 p. BOEM, 2017a. Assessment of technically and economically recoverable hydrocarbon resources of the Gulf of Mexico Outer Continental Shelf as of January 1, 2014. BOEM OCS Report 2017-005, 50 p. Lasco, D., 2017b. 2016 Assessment of Oil and Gas Resources: Alaska Outer Continental Shelf Region. BOEM 2017-064, 14 p. Post, P. J., R. J. Klazynski, E. S. Klocek, T. J. Riches, and K. Li, 2016. Inventory of technically and economically recoverable hydrocarbon resources of the Atlantic Outer Continental Shelf as of January 1, 2014. BOEM 2016-071, 58 p. Ojukwu, C.O., and K. Smith, 2016. 2016 Assessment of oil and gas resources: Assessment of the Pacific Outer Continental Shelf Region. BOEM 2016- 053, 33 p.
For Further Information Supporting geological studies, previous assessment results, and methodologies used by BOEM for resource assessment can be found on BOEM’s website, www.boem.gov. For further information on this study please contact:
Matt Frye, 703-787-1514 [email protected]
For detailed regional information please contact: Alaska OCS: Michael Bradway, 907-334-5331 [email protected]
Atlantic OCS: Matthew Wilson, 504-736-2411 [email protected]
Gulf of Mexico OCS: Matthew Wilson, 504-736-2411 [email protected]
Pacific OCS: Chima Ojukwu, 805-384-6362 [email protected]
8
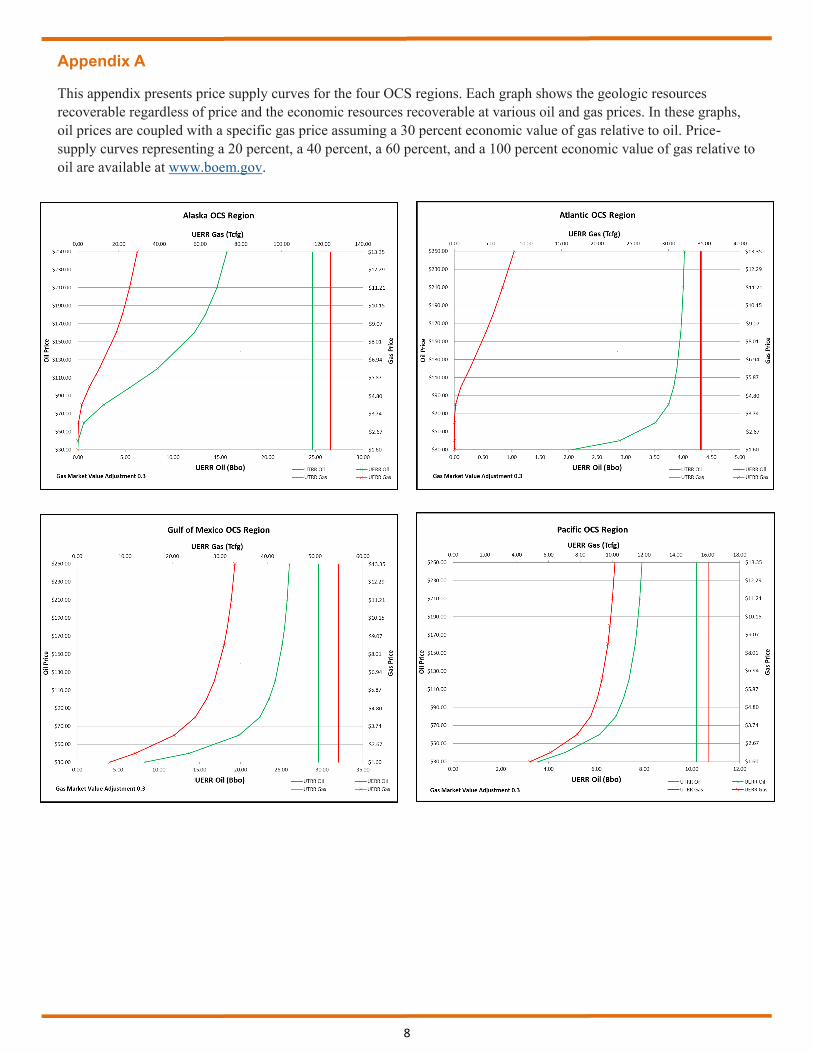
Appendix A This appendix presents price supply curves for the four OCS regions. Each graph shows the geologic resources
recoverable regardless of price and the economic resources recoverable at various oil and gas prices. In these graphs,
oil prices are coupled with a specific gas price assuming a 30 percent economic value of gas relative to oil. Price-
supply curves representing a 20 percent, a 40 percent, a 60 percent, and a 100 percent economic value of gas relative to
oil are available at www.boem.gov.