assessment of tillage erosion by mouldboard plough...
TRANSCRIPT

Abstract
Assessment of tillage erosion by mouldboard
plough in Tuscany (Italy)
S. De Alba , L. Borselli ,D . Torri -' , S. Pellegrini , P. Bazzoffi
This study was designed to characterise the soil translocation effect induced by mouldboard ploughing with an implement
traditionally used in the Tuscany region (Central Italy). We discuss the results of a set of field experiments performed to measure
soil displacement along slopes of varying gradient in different directions and at several depths of tillage. Using the Soil Erosion
by Tillage (SETi) model. soil translocation patterns for different tillage scenarios were analysed. with special attention paid to
the effects of the direction and depth of tillage on the extent and spatial pattern of soil movement. The lateral slope gradient Sp
and tillage depth D were found to be the dominant controlling factors for total soil displacement. The effect of the slope gradient
in a direction parallel to tillage ST was much less pronounced. These findings reveal the importance of the asymmetric nature of
the soil movement produced by mouldboard ploughing and the predominant effect of the lateral displacement dp on the actual
trajectory of soil motion. Results demonstrate that spatial patterns of soil redistribution due to mouldboard ploughing are highly
variable and depend on the particular characteristics of the implement used. This dependence is so strong that maximum
downslope soil translocation can occur during both, contour tillage or up-down tillage. For this particular mouldboard plough,
maximum downslope soil transport took place at a tillage direction ca. 70° and not when tillage was conducted along the steepest
slope direction (0°). These findings highlight the potential of the combined approach applied. The physically based SETi model
can be properly calibrated using a relatively limited dataset from field experiments. Once calibrating, the SETi model can then be
used to generate synthetic tillage translocation relationships, which can predict the intensity and spatial pattern of soil
translocation over a much wider range of tillage scenarios than the particular experimental conditions, in terms of topography
complexity (slope gradients and morphology) and the direction and depth of tillage. These synthetic relationships are useful
tools for evaluating strategies designed to reduce tillage erosion.
Keywords: Tillage erosion; Tillage translocation; SETi model; Field experiments; Modelling; Metal tracers; Electromagnetic probe

1. Introduction
Tillage has been recognised as a cause of intense landscape modification and as a major source of soil erosion and redistribution along hillslopes (Guiresse and Revel, 1995; Govers et aI., 1999; Torri et aI., 2002). The first documented experimental study in which soil translocation by tillage was evaluated dates back to the 1940's (Mech and Free, 1942). Despite profound evidence of soil translocation processes, it was only in the 1990s that systematic research on this topic began (e.g., Lindstrom et aI., 1990, 1992; Govers et aI., 1994; Quine et aI., 1994; Lobb et aI., 1995).
The practice of mouldboard ploughing warrants particular attention, since it is the most common method of primary tillage used in conventional agriculture systems. Further, it has been reported that mouldboard ploughing leads to high rates of soil transport and erosion (e.g., Govers et aI., 1994; Gerontidis et aI., 2001). The mouldboard plough causes the detachment and movement of the entire topsoil layer (i.e., the plough layer), generally at a uniform depth of 0.24-0.40 rn, but in extreme cases such as those of cropped areas of clayey soils in the Tuscany region, tillage depth frequently surpasses 0.50 In. Of particular interest are the experimental works related to the use of the mouldboard plough by Lindstrom et al. (1990, 1992), Revel et al. (1993), Govers et al. (1994), Lobb et al. (1995, 1999), De Alba (1998, 2001), Van Muysen et al. (1999, 2002), Torri and Borselli (2002) and Gerontidis et al. (2001).
The morphology (slope gradient, curvature) and characteristics of tillage operations (tillage implement, and the direction, speed and depth of tillage) appear to be the main factors controlling soil redistribution over a slope. Soil displacement is proportional to the gradient of the local slope, while net rates of soil loss or gain are related to the morphology and curvature of the slope, i.e., that erosion prevails on convexities or shoulders and deposition prevails in concavities or hollows (e.g., Lindstrom et aI., 1992; Govers et aI., 1999). In an independent manner, De Alba (2001) and Torri and Borselli (2002) recently demonstrated that soil displacement due to mouldboard ploughing is not only affected by the local steepest slope gradient but also by the relative orientation of the slope aspect with respect to the tractor's direction of motion. These
authors argue that to accurately describe soil translocation, the actual trajectory of soil movement needs to be determined along with the total displacement distance. Soil displacement along the steepest slope direction is only one component of the soil motion trajectory, and in most cases it is not the dominant direction.
Tillage experiments are the most basic source of data for establishing relationships between soil displacement due to tillage and control factors such as the type of implement, the slope gradient, the depth and speed of tillage, etc. However, variables that can be inferred from experimental data are constrained by the limited experimental conditions under which they were obtained; this restriction being greater, the smaller the experimental dataset. For the combined approach used in this paper, experimental data were used to calibrate the physically based Soil Erosion by Tillage (SETi) model, to generate more general soil translocation equations. These equations could then be used to describe the results and extrapolate them to a broader range of tillage scenarios than those of the experimental conditions.
The general objective of the present study was to characterise the translocation effects of mouldboard ploughing using a type of instrument of widespread use in Tuscany (Central Italy). The results of a set of field experiments, performed to measure soil displacement along different slope gradients in different directions and at different depths of tillage, are discussed. Soil translocation patterns in different tillage scenarios were analysed using the SETi model, with special emphasis placed on the effect of the direction and depth of tillage on the extent and spatial pattern of soil movement. Finally, we discuss some of the practical implications of the experimental and theoretical findings in evaluating possible tillage patterns that might reduce tillage erosion.
2. Methods
The study area was located at the S. Elisabetta Experimental Centre, Vicarello (Volterra) in the central hilly region of Tuscany (43"27'N, 11 "30'E, 151.5 m above mean sea level). Its climate is Mediterranean, sub-humid with a mean annual precipitation of 678 mm (1954-1996). The soil of

the experimental site is a Vertic Xerorthent (Soil Survey Staff, 1975), developed over P1iocene clayey marine deposits. The topsoil has an average clay content of 45%, a bulk density of 1.4-1.5 Mg m-3
and an organic carbon content of 1 %. Agronomical management of this experimental site is that typical to the central Tuscany area. The dominant cropping system is cereal and forage rotation. Cereal cultivation is usually alternated with the growth of forage species, mainly alfalfa, every two years. Characteristic tillage operations are mouldboard ploughing to a depth of 0.35-0.5 rn, followed by disking before cereal or alfalfa sowing. The area has a rolling morphology with frequent steep slopes of up to 45% gradient; fields of up to 40% slope being commonly ploughed. In these extreme conditions, it is common practice to conduct tillage along a direction oblique to the maximum slope direction. Interviews with local farmers revealed that this tillage pattern is widespread and based on empirical observations. The oblique direction of tillage allows farmers to reduce the time of tillage operations, reduce fuel consumption and achieve maximum movement of soil clods and soil loosening.
2.1. Field experiments designed to quantify soil translocation due to tillage
Soil displacement due to mouldboard ploughing was determined in 19 field experiments. The tillage equipment used was similar to the most widespread in the study area. Tillage operations were conducted using a tracked tractor with a mouldboard plough with a single deep-tillage bottom 45 cm width. In the experimental hillslope, a detailed survey was performed to locate each plot and determinate its local slope gradient and aspect. The experimental plot had an area of ca. 10 m2, in which an average number of 152 metallic tracers were installed buried in the soil. The tracers were placed along eight micro wells, 45 cm depth and 2 cm of diameter, at a vertical distance of 2.5 cm from each other. The space between tracers was filled with mud such that they became incorporated into the soil mass. Each tracer was identified by an alphanumeric code. The position of each microwell and tracer was recorded with reference to a local system of Cartesian coordinates (x, y, z) using a Total Station.
For each tillage experiment, we defined the tractor trajectory for the tillage operation and measured the corresponding counter-clockwise angle (cv) between the slope aspect and the tillage direction. Before each experiment, tillage depth was established outside the experimental plot. During tillage, the speed of the tractor was kept constant at an average of between 1.1 and 1.3 m S-l Tillage speed was measured by recording the total time needed to go over a given control distance within the plot. The starting soil conditions were: mean soil moisture 12% and mean soil bulk density 1.5 Mg m-3 A median clod diameter of 0.1 m was calculated by analysing clod size distribution in the topsoil after tillage using a standard sieving method and around 50 kg of soil mass. Table 1 describes the conditions for all the experimental plots including, slope gradient, direction and depth of tillage and the field method used to measure tracer displacement: (1) the excavation method or (2) the low-induction electromagnetic probe method (EM38).
Eleven field experiments were conducted using the excavation method (Fig. 1). These experiments involved recovering the tracers after tillage using a metal detector. The tracers were then dug out and identified. The final position of each tracer was recorded according to a local coordinates system. The difference between the initial and final position of each tracer was used to calculate total tracer displacement and the displacement components in the directions x, y and z. For the whole set of experiments, the average proportion of tracers recovered was always greater than 90%.
The EM38 electromagnetic probe (Geonics Ltd.) was used in a further eight experiments. This method is based on mapping electromagnetic anomalies induced by the metal tracers incorporated into the soil. The EM38 probe measures topsoil electrical conductivity by inducing a secondary magnetic field. The experimental protocol used is described in detail in Borselli and Torri (2001). The set-up of the plots for the experiments is similar to that described above for the excavation method except that tracer density is double. In each plot, 304 tracers were placed along two parallel vertical lines of microwells as indicated in Fig. 2. Unlike the former method, the size and direction of movement is given by the difference between the positions of the centre of mass of the entire set, or "cloud", of tracers before and after the

Table I Overview of the experimental sehlp for the mouldboard experiments
Plot Slope gradients (%) Tillage direction, Depth of Field method
Smax ST Sp LV (0) tillage (m)
4.0 -3.9 -1.0 15 0.42 Excavation method 2 34.0 -34.0 0.0 0 0.42 Excavation method 3 25.4 -23.9 -8.7 20 0.42 Excavation method 4 16.7 -16.6 -1.5 5 0.42 Excavation method 5 13.1 -12.8 -2.7 12 0.27 Excavation method 6 4.6 -4.5 -0.8 10 0.42 Excavation method 7 34.0 -34.0 0.0 0 0.27 Excavation method 8 25.4 -25.0 -4.4 10 0.27 Excavation method 9 16.7 -16.4 -2.9 10 0.27 Excavation method
10 13.1 -13.1 -1.1 5 0.42 Excavation method 11 4.6 -4.6 0.4 355 0.27 Excavation method 12 23.0 -19.1 -12.9 34 0.27 Electromagnetic probe 13 37.0 -34.3 -13.9 22 0.27 Electromagnetic probe 14 27.0 -21.6 -16.2 37 0.27 Electromagnetic probe 15 12.0 -5.8 -10.5 61 0.27 Electromagnetic probe 16 9.0 -5.2 -7.4 55 0.45 Electromagnetic probe 17 20.0 -3.5 -19.7 80 0.35 Electromagnetic probe 18 25.0 -10.6 -22.7 65 0.28 Electromagnetic probe 19 39.0 -16.5 -35.3 65 0.35 Electromagnetic probe
LV, Angle (collllter clockwise) between tillage direction and slope aspect, Smax, maximum slope gradient; ST, slope gradient in the direction of tillage; Sp, slope gradient in the direction perpendicular to tillage.
tillage operation, thus there is no need to individually identify each tracer. A rigid wooden frame (Fig. 2) was used as a reference for the local electromagnetic measurements. The main advantage of this method is that it is quick to perform and avoids disturbing the soil surface. The method is just as accurate, its maximum estimation error being 0.1 m for the position of the tracer cloud centre of mass (Borselli and Torri, 2001). Initial soil conditions for the
'V" Tracer wells
.... � �!i - Tillage
CO - .... _ �ir.ion
Maximum slope direction
experiments were similar to those used for the excavation method.
2.2. Estimating soil translocation using the Soil Erosion by Tillage model
The Soil Erosion by Tillage model developed by Torri and Borselli (2002) is a physically based model that simulates the 3D behaviour of the transported soiL
Mild _____ �-----.tJ
I I I :45 cm
Tracers
Fig. 1. Site setup of an experimental plot using metal tracers.

EM-38 probe
Measurements at each grid node (20 cm mesh) l1Y Ox
--U tracer wells -h+- •••••••• ••••••••
Mobile bar--t---:'..::"--c<I---------t- f •
Fixed Frame
Dispersion cloud of tracers after {ilia 'e
Fig. 2. Experimental setup for measuring the cloud of tracers left after tillage using an EM38 electromagnetic probe. The size of the wooden frame used for the Vicarello experiments was 3.5 m x 3.5m.
A flow-chart describing the simulation model is provided in Fig. 3. The model identifies three different phases of soil motion as follows:
(l) Drag phase: movement of soil in contact with the tillage implement. The only significant force is the drag exerted by the tillage device.
(2) Jump phase: soil clods projected by the tillage implement are free to fall under the effects of gravity and of their velocity at the time of ejection.
TilltJge IlIstrllmcllt dwrm.1eri.\·tic:.\'
- Ol"erllll"lljng angle (lirecli olla ('? - Angle of s o;1 ejeclioll f (") - Chara(:lerislj(,' ex/xmellfsfor Ihe eqlmlio/l.5
oflhe drag phase mOlion: Lex, Ley, Le:, Les
I
Soil motion plwse.\·
t
(3) Rolling phase: the clods roll (or slide) for a while under the effects of gravity, resistance and their velocity immediately after the jump phase (or the drag phase in the absence of jump) .
The different control factors and algorithms governing each of these motion phases are described in detail in Torri and Borselli (2002). The SETi model is coded into a computer program in a MathLab®
environment. The input data are the average mass and diameter of the soil clods, the tillage implement characteristics, the tractor speed and the tillage direction with respect to the slope aspect. The implement characteristics are related to the size and shape of the instrument, and are formulated in terms of the directions in which the soil is ejected from the mouldboard blade: the overturning lateral direction (a angle) and the vertical angle of soil ejection (<p angle). The outputs of simulation are equations describing the soil displacements produced during each motion phase as functions of the maximum slope gradient and direction of tillage ( '" angle) for three different directions of soil movement: (a) along the maximum slope, (b) across the slope and (c) in a vertical direction.
Tillflge c:ollllitiOlU
- Slope gradielll f1 (") Inililll soil cOllllilioll.f
� 8111kdensily r(Mg mJ) - D;reclioll oflillage fJJ (") - Tractor speed V (",Is) - Median clod size d (m) - Deplh of Iillage /J (Ill)
I I J,
I /Jrug I I Jump I I Holing I
To/ul soil tli'plflcemell/
Vector�' (if.mil ma/ion: X, Y, wul Z tlirec/iOlu Aclm" Irtljectory of.mil mol't!melll Ix;)';].)
Fig. 3. Flowchart of the Soil Erosion by Tillage (SEE) model.
3. Results and discussion
3.1. Soil displacement versus tillage direction and topography
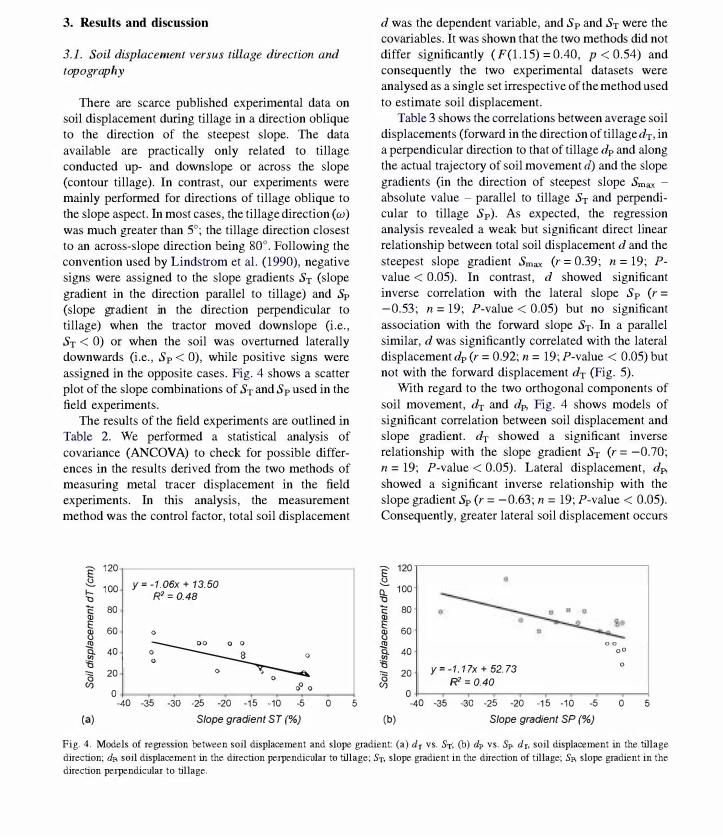
There are scarce published experimental data on soil displacement during tillage in a direction oblique to the direction of the steepest slope. The data available are practically only related to tillage conducted up- and downs lope or across the slope (contour tillage). In contrast, our experiments were mainly performed for directions of tillage oblique to the slope aspect. In most cases, the tillage direction (U!) was much greater than 5°; the tillage direction closest to an across-slope direction being 80°. Following the convention used by Lindstrom et a1. (1990), negative signs were assigned to the slope gradients ST (slope gradient in the direction parallel to tillage) and Sp (slope gradient in the direction perpendicular to tillage) when the tractor moved downslope (i.e., ST < 0) or when the soil was overturned laterally downwards (i.e., Sp < 0), while positive signs were assigned in the opposite cases. Fig. 4 shows a scatter plot of the slope combinations of ST and Sp used in the field experiments.
The results of the field experiments are outlined in Table 2. We performed a statistical analysis of covariance (ANCOVA) to check for possible differences in the results derived from the two methods of measuring metal tracer displacement in the field experiments. In this analysis, the measurement method was the control factor, total soil displacement
E 120 � 100 >--'0 <: 80 � E 60 � .!l! i 40
'" 0 20 U)
0 -40
(a)
Y = -1.06x + 13.50 R2 = 0.48
0
� : 8 Q
0 0
000 -35 -3� -25 -20 -15 -10 -5
Slope gradient ST (%)
0 5
d was the dependent variable, and Sp and ST were the covariables. It was shown that the two methods did not differ significantly (F(1.15) = 0.40, p < 0.54) and consequently the two experimental datasets were analysed as a single set irrespective of the method used to estimate soil displacement.
Table 3 shows the correlations between average soil displacements (forward in the direction of tillage dT, in a perpendicular direction to that of tillage dp and along the actual trajectory of soil movement d) and the slope gradients (in the direction of steepest slope Smax -absolute value - parallel to tillage ST and perpendicular to tillage Sp). As expected, the regression analysis revealed a weak but significant direct linear relationship between total soil displacement d and the steepest slope gradient Sm� (r = 0.39; n = 19; Pvalue < 0.05). In contrast, d showed significant inverse correlation with the lateral slope Sp (r =
-0.53; n = 19; P-value < 0.05) but no significant association with the forward slope ST' In a parallel similar, d was significantly correlated with the lateral displacement dp (r = 0.92; n = 19; P-value < 0.05) but not with the forward displacement dT (Fig. 5).
With regard to the two orthogonal components of soil movement, dT and dp, Fig. 4 shows models of significant correlation between soil displacement and slope gradient. dT showed a significant inverse relationship with the slope gradient ST (r = -0.70; n = 19; P-value < 0.05). Lateral displacement, dp, showed a significant inverse relationship with the slope gradient Sp (r = -0.63; n = 19; P-value < 0.05). Consequently, greater lateral soil displacement occurs
E 120 � 100 % <: 80 � E 60 �
i 00
40 00
Y = -1.17x + 52.73 0 '" 20 0 R' = 0.40 U)
0 -40 -35 -3� -25 -20 -15 -10 -5 0 5
(b) Slope gradienl SP (%)
Fig. 4. Models of regression between soil displacement and slope gradient: (a) dr vs. ST; (b) dp vs. Sp. dr, soil displacement in the tillage direction; dp, soil displacement in the direction perpendicular to tillage; ST, slope gradient in the direction of tillage; SI', slope gradient in the direction perpendicular to tillage.

Table 2 Summary of the experimental results
Plot Slope (%), Tillage direction, Soil displacement (m) Smax LV (0) d-down S.D. d-across S.D. d de dp
4 15 0.53 0.28 -0.53 0.25 0.75 0.37 0.65 2 34 0 0.59 0.41 -0.66 0.37 0.88 0.59 0.66 3 25.4 20 0.68 0.48 -0.46 0.23 0.82 0.49 0.66 4 16.7 5 0.52 0.35 -0.42 0.29 0.67 0.49 0.47 5 13.1 12 0.33 0.11 -0.51 0.41 0.61 0.21 0.57 6 4.6 10 0.27 0.15 -0.36 0.35 0.45 0.21 0.40 7 34 0 0.32 0.19 -0.27 0.11 0.42 0.32 0.27 8 25.4 10 0.58 0.28 -0.49 0.38 0.76 0.49 0.58 9 16.7 10 0.46 0.2 -0.39 0.19 0.60 0.39 0.46
10 13.1 5 0.32 0.13 -0.66 0.36 0.73 0.26 0.68 11 4.6 355 0.16 0.09 -0.43 0.25 0.46 0.19 0.41 12 23 34 0.77 -0.28 0.82 0.48 0.67 13 37 22 0.66 -0.56 0.86 0.40 0.76 14 27 37 0.53 -0.33 0.62 0.22 0.58 15 12 61 0.71 -0.33 0.79 0.06 0.78 16 9 55 0.69 -0.37 0.78 0.09 0.77 17 20 80 0.69 -0.Q7 0.69 0.05 0.69 18 25 65 1.04 -0.32 1.08 0.15 1.07 19 39 65 0.84 0.00 0.84 0.35 0.76
d-down, soil displacement downslope; d-across, soil displacement across the slope; d, total soil displacement; fir, soil displacement in the tillage direction; dp, soil displacement in the direction perpendicular to tillage.
a Since the position of the metal tracer cloud centre of mass is a single point, here the S.D. is substituted by the maximum average error of the calculated position, which is 0.1 m (Borselli and Tom, 2001).
when the soil is laterally overturned downslope (i.e., Sp < 0). These general tendencies are consistent with most of the translocation models in the literature and are shown in Table 6.
3.2. Calibrating the SETi model using data from field experiments
The SETi model was calibrated using the field data from Table 2 as inputs and applying an iterative
Table 3 Summary of statistical correlations between soil displacement and topography
de dp sm� ST sp
d 0.18 0.92 0.39 -0.13 -0.53
de -0.22 0.45 -0.70 0.22 dp 0.20 0.15 -0.63
d, total soil displacement; fir, soil displacement in the tillage direction; dp, soil displacement in the direction perpendicular to tillage; Smax, maximum slope gradient; ST, slope gradient in the direction of tillage; Sp, slope gradient in the direction perpendicular to tillage *Underlined correlations are significant at the Pvalue < 0.05.
method to minimize the average error of estimation for d-down, d-across and total displacement d. A specific optimisation code was implemented in the Matlab®
environment, based on a differential evolution genetic algorithm (Stom and Price, 1997) and adopting all the additional setup strategies to ensure a global optimisation result, described by Stom and Price (1997) and Price (1999).
We used a modified version of the SETi equations describing the drag phase of motion (unpublished version). This modified version takes into account that the trajectory of the soil clods along the mouldboard plough varies according to implement size and shape, and also depends on the depth and speed of tillage. Thus, distances of soil movement along the mouldboard, the actual trajectory along the bottom surfaceLs (m) and projected distances in directions parallel to tillage Lx (m), lateral to tillage Ly (m), and in the vertical direction Lz (m), are calculated as flll1ctions of the depth of tillage D (m) and speed of tillage V (m S-I) using the equation:
(1)

0.8
0.6
0.4
:[ 0 @ 0 0 0.2 � 0 , •
� 0
� , , 0
0 0 • 0
• � g 2 � 0 0
E -0.2
" -0.4
-0.6 0 Drag 0 Jump , Rolling �Total
-0.8
0 30 60 90 120 150 180 210 240 270 300 330 360
(a) Direction of tillage (degrees)
0.8
0.6
:[ 0.4
� 0.2 0 @ 0 -Sl � � • � � � 0 � 0
0 • •
e 0 � u , 2 rn -0.2 0 0 0 "
-0.4
-0.6 0 Drag 0 Jump , Rolling ____ Total
-0.8
0 30 60 90 120 150 180 210 240 270 300 330 360
(b) Direction of tillage (degrees)
0.8
0.6
0.4 0 -"-0 0 0
E' 0 0 0 -------., � 0.2 � � 0 0 0 � 0 0 0 2 2 2 2 2
� • , , , ,
-0.2
� " -0.4
-0,6 0 Drag 0 Jump • ROiling ______ Total
-0.8
0 30 60 90 120 150 180 210 240 270 300 330 360
(c) Direction of tiffage (degrees)
Fig. 5. Soil displacement simulated using the SETi model for the three phases of motion and total displacement along the directions of: (a) maximum slope; (b) across the slope; (c) vertical direction. (15% slope, 0.3 ill tillage depth).
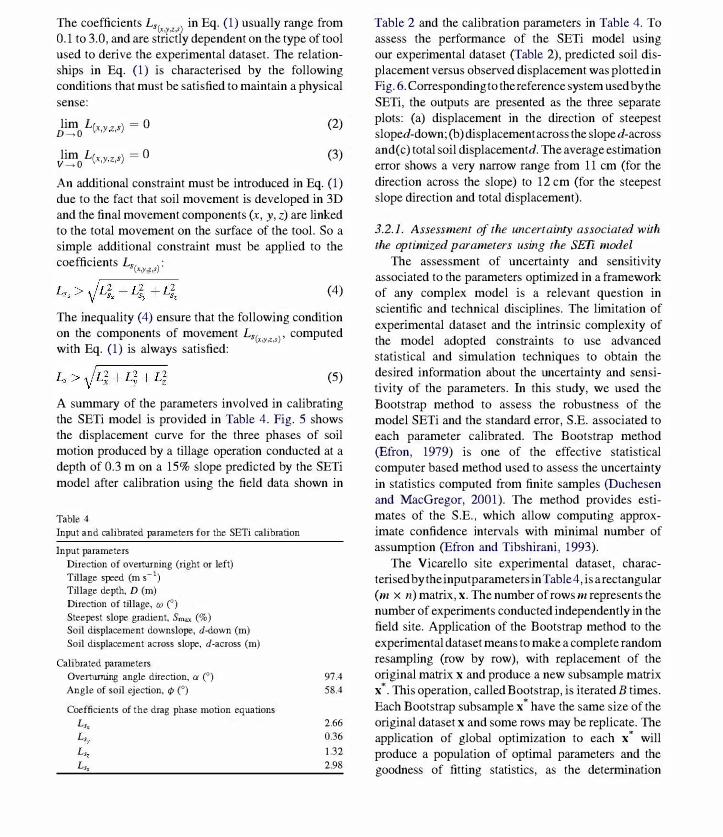
The coefficients L'(','7ei in Eq, (1) usually range from 0,1 to 3,0, and are strictly dependent on the type of tool used to derive the experimental dataset. The relationships in Eq, (1) is characterised by the following conditions that must be satisfied to maintain a physical sense:
lim L(xyZ') � ° D--+O " ,
lim L(xyZ') �O V---+O " ,
(2)
(3)
An additional constraint must be introduced in Eq, (1) due to the fact that soil movement is developed in 3D and the final movement components (x, y, z) are linked to the total movement on the surface of the tool. So a simple additional constraint must be applied to the coefficients Ls( i: x,y,z,s
L',> VL;,+L;,+L;, (4)
The inequality (4) ensure that the following condition on the components of movement Ls(x;y,z,f)' computed with Eq, (1) is always satisfied:
(5)
A summary of the parameters involved in calibrating the SETi model is provided in Table 4, Fig, 5 shows the displacement curve for the three phases of soil motion produced by a tillage operation conducted at a depth of 03 m on a 15% slope predicted by the SETi model after calibration using the field data shown in
Table 4
Input and calibrated parameters for the SETi calibration
Input parameters Direction of ovemmling (right or left) Tillage speed (m s -1) Tillage depth, D (m) Direction of tillage, W (0) Steepest slope gradient, Smax (%) Soil displacement downslope, d-down (m) Soil displacement across slope, d-across (m)
Calibrated parameters Overturning angle direction, a (0) Angle of soil ejection, cp (0) Coefficients of the drag phase motion equations
L,. L" L" L"
97,4
58,4
2,66
036
132
2,98
Table 2 and the calibration parameters in Table 4, To assess the performance of the SETi model using our experimental dataset (Table 2), predicted soil displacement versus observed displacement was plotted in Fig, 6, Corresponding to the reference system used by the SETi, the outputs are presented as the three separate plots: (a) displacement in the direction of steepest sloped-down; (b) displacement across the slope d-across and( c) total soil displacementd, The average estimation error shows a very narrow range from 11 cm (for the direction across the slope) to 12 cm (for the steepest slope direction and total displacement),
3.2.1. Assessment of the uncertainty associated with the optimized parameters using the SETi model
The assessment of uncertainty and sensitivity associated to the parameters optimized in a framework of any complex model is a relevant question in scientific and technical disciplines. The limitation of experimental dataset and the intrinsic complexity of the model adopted constraints to use advanced statistical and simulation techniques to obtain the desired information about the lll1certainty and sensitivity of the parameters, In this study, we used the Bootstrap method to assess the robustness of the model SETi and the standard error, S,E, associated to each parameter calibrated, The Bootstrap method (Efron, 1979) is one of the effective statistical computer based method used to assess the uncertainty in statistics computed from finite samples (Duchesen and MacGregor, 2001), The method provides estimates of the S,E" which allow computing approximate confidence intervals with minimal number of assumption (Efron and Tibshirani, 1993),
The Vicarello site experimental dataset, characterised by the input parameters in Table4, is arectangular (m X n) matrix, x. The number of rows m represents the number of experiments conducted independently in the field site, Application of the Bootstrap method to the experimental dataset means to make a complete random resampling (row by row), with replacement of the original matrix x and produce a new subsample matrix x
". This operation, called Bootstrap, is iterated B times.
Each Bootstrap subsample x'
have the same size of the original dataset x and some rows may be replicate. The application of global optimization to each x
' will
produce a population of optimal parameters and the goodness of fitting statistics, as the determination

1.2
0 0.8 8 0
0 0 "' 0 "" 0.4 0 090 � .g 0.0 " " � -0.4 '" �
0:: -0.8
I Ups/ope I I Downs/ope -1.2
-1.2 -\ .O -0.8 -0.6 -0.4 -0.2 0.0 0.2 0.4 0.6 0.8 1.0 1.2
(a) Observed d-dowlI (m)
1.2
Rightside I I Lefiside 0.8
� 0.4 <
� 0 � 0.0 " " �
-0.4 " , () 0::
-0.8
-1.2 -\.2 -1.0 -0.8 -0.6 -0.4 -0.2 0.0 0.2 0.4 0.6 0.8 1.0 1.2
(b) Observed d-(Jcross (m)
1.2
1.0 0
0 0 � 0.8 0
0 \\ 00
" 0 '100
] 0.6 0 g 0 .� �
0.4 0:: 0
0.2
0.0 0.0 0.2 0.4 0.6 0.8 1.0 1.2
(c) Observed d (Ill)
Fig. 6. Petfonnance of the SETi model using the experimental dataset: (a) displacement in the direction of maximum slope d-down; (b) displacement across the maximum slope d-across; (c) total soil displacement d.

2,0 3, 5 1,0
1,8
1,6
1,4
J,
""' 2, �
° T'
5 �
0,9
� "C O,S
.§
.� 0,7
"? 1,2 .§ " � 1,0
� O,S ""
0,6
...:::.. "" 2, �
$" " I, 5 ." "'-� cS I,
°
5
° @
& 0,. .g 'C' 0,5 � � � 0,4 ."
"'-� 0,3 II
0,4
0,2 0, 5 � 0,2
0,1
0,0 Ca) ALPHA PHI 0,
Cb) °
LSr (c) 0,0 lI_Up-aOwlI acrO:l.1
Fig. 7. Sllllllllary of the SETi calibration results applying the Bootstrap method to the Vicarello site experimental database (Table 2) and using a number of Bootstrap subsamples B = 100: (a) angles of overtuming a and soil ejection (jJ (radians); (b) coefficients of the drag phase motion equation Ls(x;y,r); (c) distribution of the coefficient of detennination? for the obsetved and predicted displacements in the X- and Y- directions. (Whiskers = 10 and 90%; box line = median.)
coefficient r2 Following Efron (1982) the S.E. associated to a given parameter or statistics () is given by the following equation:
S.E. � Lf�1 (8i -iJ,)2
B-1 (6)
The number ofBootstrap subsamples is set by the user and is not limited to the number of observation in the original dataset. A large B allows one to gather more information about the S.E. in () and Bootstrap is more efficient with unsmooth model or non-linear statistics (Efron and Tibshirani, 1993). In this study, the Bootstrap method has been adopted with B = 100. This means that the global optirnisation has been ran 100 times using B different Bootstrap subsamples of the same matrix x of experimental data. The Simulation was limited to B = 100 due the huge computation time required for each optimization to be completed
Table 5
satisfactorily. The results of the Bootstrap analysis are given in Fig. 7 and Table 5. In the Fig. 7, the whiskers represent, respectively, the 10 and 90% percentiles of the distribution for each parameter. The Table 5 shows the average value and S.E. for each parameter and the l' values for the variables predicted, d_up-down and d-across. The results indicate the robustness of the model SETi and the limited uncertainty S.E. associated to each parameter calibration. The distribution of the r2 values, relative to the predicted and observed displacements in X- and Y-direction, indicate that the 90% of values fall in a more than acceptable range (Fig. 7c; Table 5).
3.3. Effect of tillage depth on soil displacement
To assess the effect of tillage depth on the intensity of soil translocation, SETi output relationships were
Means and S.E. calculated for the SETi calibration parameters and r values for the predicted variables, applying theBootstrap method (B = 100
Bootstrap subsamples)
Meon S.E.
Alpha (rad)
1.68 0.12
Phi (rad)
1.07 0.20
2.60 0.23
0.43 0.24
1.20 0.18
2.94 0.09
r d-across
0.85 0.76

used to develop synthetic regression models of the type:
d � j{ST; Sp; D) (7)
which relates the soil displacement distance to the slope gradients ST and Sp and depth of tillage D. Fig. 8a and b are plots of the distances dT and dp against the gradients ST and Sp, respectively, for three depths of tillage, 0.2, 0.3 and 0.4 m. Each regression model was built using a total number of values of n = 108, corresponding to 9 values of maximum slope gradients ranging between 5 and 45% and 12 directions of tillage (wangles) between 0" and 330". A summary of the regression results is showed in Table 6.
Regression analysis reveals that for both direction of soil movement, forward and lateral, displacement showed a strong direct relationship with the depth of tillage. In the case of soil movement parallel to the direction of tillage, for a tillage depth change from 0.2 to 0.4 rn, the regression coefficient of the curves in Fig. 8a varies between -0.59 and -0.92, and the regression constant a shows a very narrow range,
11.1-18.8. The multivariate regression model is:
dT � 3.36 - 0.76ST + 38.54D
(n � 324;r2 � 0.94;p < 0.001)
(8)
100
90 r- I I I Deplh o/Iillage (m)
80 r- 0=0.4 --
� 70
.... 60 "
� 50 < u '" 40 ,� " � 30 V>
20
f- -- 0=0.3 -- 0=0.2
C- V V ,.-/' V V V
,.-/' --------- ---- ----
V V ..- � -
-" �
f-::: I- � 10
o o -5 -10 -15 -20 -25 ·30 -35 -40 ·45
(a) Slope gradient ST (%)
For the lateral displacement dp, regression curves if Fig. 8b show significant higher values for the regression coefficients as well as for the interception. Regression coefficient varies between -0.84 and -1.07, while the regression constant a shows a narrow range, varying between 38.4 and 49.7. Multivariate regression analysis resulted in a high regression coefficient e = 56.6 for the depth of tillage, which significantly differed from zero at a P < 0.001; the multivariate model being:
dp � 27.09 - 0.96Sp + 56.60D
(n � 324;r2 � 0.96;p< 0.001)
(9)
For the total distance d along the actual trajectory of soil displacement, the multivariate regression model obtained is:
d � 27.51 - O.22ST - 0.86Sp + 73.05D
(n � 324;r2 � O.92;p < O.OOI)
(10)
The strong direct relationship with D in Eq. (10) implies that the expected increase in total displacement d (cm) can be calculated for any increment of D (cm) using the linear relationship:
Ild � 0.73/lD (11)
100
/ 90
,.-/' ,.-/' 80
� 70
'- 60 "
� so u '" 40 '" .�
V /' ,.-/' ----
V V V ..-..- --
V V-" V v-I-'-V V- I-'
" � 30 Deplh o/Iillage (11/) -
20 -- /J 0..1 --- /J'='O.3
10 -- D� 0.1 -
I I I o ·5 -10 -15 -20 -25 -30 -35 -40 -45
(b) Slope gradiellf SP (%)
Fig. 8. Soil displacement in relation to the slope gradient using the SETi model predictions for three depths of tillage: 0.2, 0.3 and 0.4 m. (a) dr vs. ST; (b) dp vs. Sp. dT, soil displacement in the tillage direction; dp, soil displacement in the direction perpendicular to tillage; ST, slope gradient in the direction of tillage; Sp, slope gradient in the direction perpendicular to tillage.
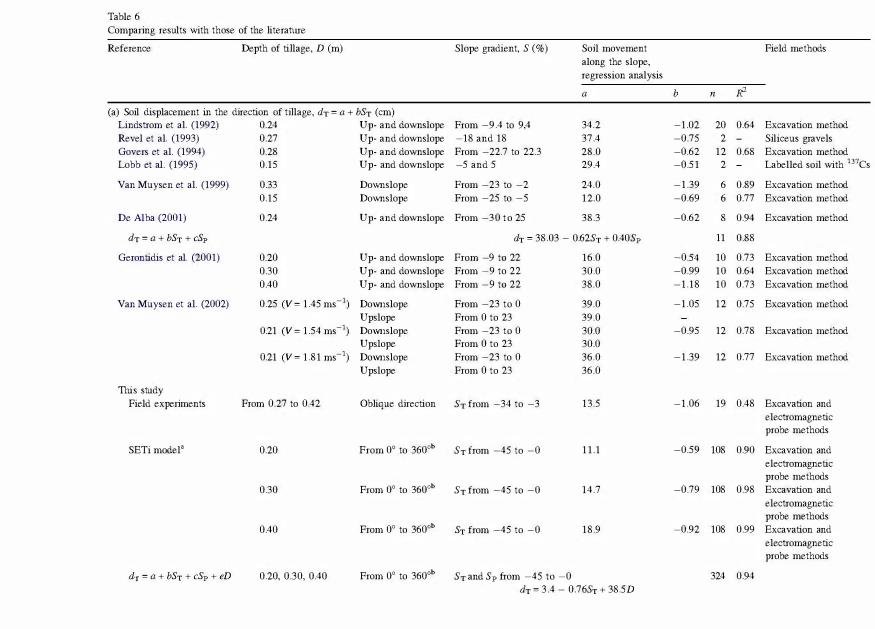
Table 6
Comparing results with those of the literahue
Reference Depth of tillage, D (m)
(a) Soil displacement in the direction of tillage, dT = a + bST (cm) Lindstrom et al. (1992) 0.24 Up- and downslope Revel et al. (1993) 0.27 Up- and downslope Govers et al. (1994) 0.28 Up- and downslope Lobb et aL (1995) 0.15 Up- and downslope
Van Muysen et al. (1999) 0.33 Dmvnslope 0.15 Dmvnslope
De Alba (2001) 0.24 Up- and downslope
dT = a + bST + cSp
Gerontidis et al. (2001) 0.20 Up- and downslope 0.30 Up- and downslope 0.40 Up- and downslope
Van Muysen et al. (2002) 0.25 (V = 1.45 ms-1) DO\Vllslope Upslope
0.21 (V = 1.54 ms-1) DO\Vllslope Upslope
0.21 (V = 1.81 ms-1) DO\Vllslope Upslope
TIlls study Field experiments From 0.27 to 0.42 Oblique direction
SETi modela 0.20 From 0° to 3600b
0.30 From 0° to 3600b
0.40 From 0° to 3600b
fir = a + bST + cSp + eD 0.20, 0.30, 0.40 From 0° to 3600b
Slope gradient, S (%)
From -9.4 to 9,4
-18 and 18
From -22.7 to 22.3 -5 and 5
From -23 to -2
From -25 to -5
From -30 to 25
Soil movement along the slope, regression analysis
a
34.2
37.4
28.0 29.4
24.0
12.0
38.3
dT = 38.03 - 0.62ST + 0.40Sp
From -9 to 22 16.0
From -9 to 22 30.0
From -9 to 22 38.0
From -23 to 0 39.0
From 0 to 23 39.0
From -23 to 0 30.0 From 0 to 23 30.0
From -23 to 0 36.0
From 0 to 23 36.0
ST from -34 to -3 13.5
ST from -45 to -0 11.1
ST from -45 to -0 14.7
ST from -45 to -0 18.9
ST and Sp from -45 to -0 dT = 3.4 - 0.76ST + 38.5D
Field methods
b n If
-1.02 20 0.64 Excavation method -0.75 2 - Siliceus gravels -0.62 12 0.68 Excavation method -0.51 2 - Labelled soil with 137CS
-1.39 6 0.89 Excavation method -0.69 6 0.77 Excavation method
-0.62 8 0.94 Excavation method
11 0.88
-0.54 10 0.73 Excavation method -0.99 10 0.64 Excavation method -1.18 10 0.73 Excavation method
-1.05 12 0.75 Excavation method
-0.95 12 0.78 Excavation method
-1.39 12 0.77 Excavation method
-1.06 19 0.48 Excavation and electromagnetic probe methods
-0.59 108 0.90 Excavation and electromagnetic probe methods
-0.79 108 0.98 Excavation and electromagnetic probe methods
-0.92 108 0.99 Excavation and
324 0.94
electromagnetic probe methods
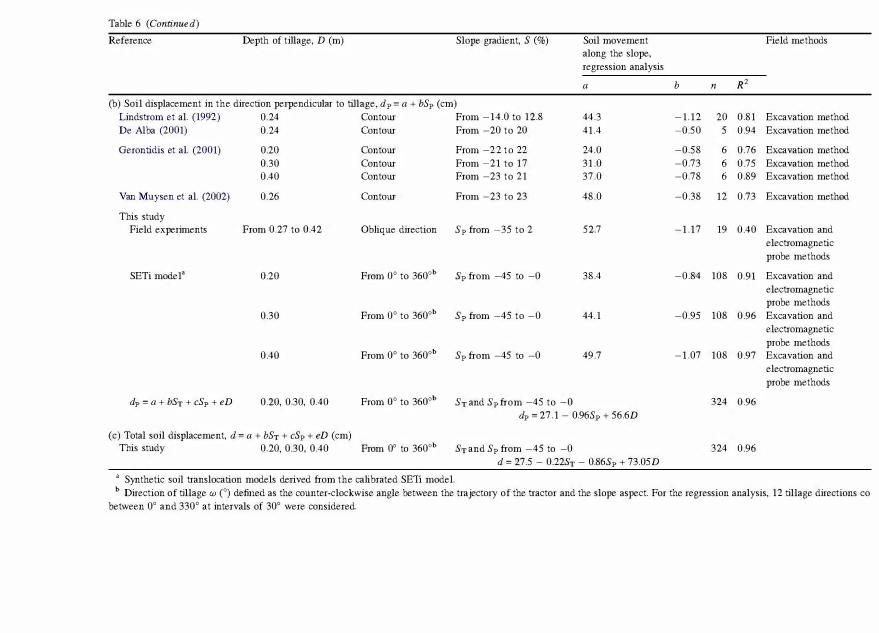
Table 6 (Continued)
Reference Depth of tillage, D (m) Slope gradient, S (%) Soil movement along the slope, regression analysis
a (b) Soil displacement in the direction perpendicular to tillage, dp = a + bSp (cm)
Lindstrom et al. (1992) 0.24 ContOlu De Alba (2001) 0.24 ContOlu
Gerontidis et al. (2001) 0.20 ContOlu 0.30 ContOlu 0.40 ContOlu
Van Muysen et al. (2002) 0.26 ContOlu
This study Field experiments From 0.27 to 0.42 Oblique direction
SETi mode13 0.20 From 0° to 3600b
0.30 From 0° to 3600b
0.40 From 0° to 3600b
dp = a + bST + cSp + eD 0.20, 0.30, 0.40 From 0° to 3600b
(c) Total soil displacement, d = a + bST + cSp + eD (cm) This study 0.20, 0.30, 0.40 From 0° to 3600b
a Synthetic soil translocation models derived from the calibrated SETi model.
From -14.0 to 12.8 44.3
From -20 to 20 41 .4
From -22 to 22 24.0
From -21 to 17 31.0 From -23 to 21 37.0
From -23 to 23 48.0
Sp from -35 to 2 52.7
Sp from -45 to -0 38.4
Sp from -45 to -0 44.1
Sp from -45 to -0 49.7
ST and Sp from -45 to -0 dp = 27.1 - 0.96Sp + 56.6D
ST and Sp from -45 to -0
d = 27.5 - 0.22ST - 0.86Sp + 73.05D
Field methods
b n R'
-1.12 20 0.81 Excavation method -0.50 5 0.94 Excavation method
-0.58 6 0.76 Excavation method -0.73 6 0.75 Excavation method -0.78 6 0.89 Excavation method
-0.38 12 0.73 Excavation method
-1.17 19 0.40 Excavation and electromagnetic probe methods
-0.84 108 0.91 Excavation and electromagnetic probe methods
-0.95 108 0.96 Excavation and electromagnetic probe methods
-1.07 108 0.97 Excavation and electromagnetic probe methods
324 0.96
324 0.96
b Direction of tillage w (0) defined as the counter-clockwise angle between the trajectory of the tractor and the slope aspect. For the regression analysis, 12 tillage directions co between 0° and 330° at intervals of 30° were considered.
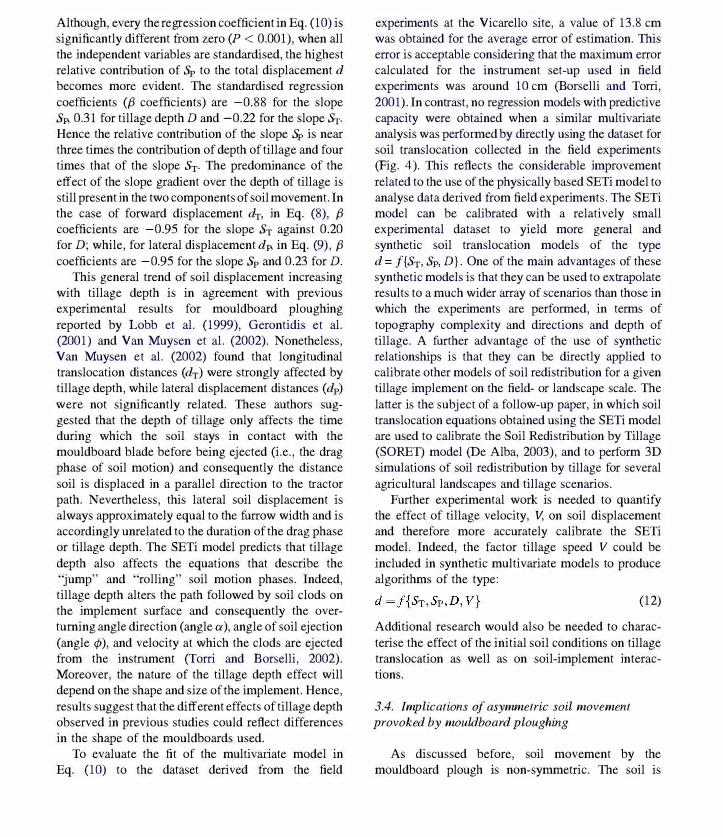
Although, every the regression coefficient in Eq. (10) is significantly different from zero (P < 0.001), when all the independent variables are standardised, the highest relative contribution of Sp to the total displacement d becomes more evident. The standardised regression coefficients (fJ coefficients) are -0.88 for the slope S" 0.31 for tillage depth D and -0.22 for the slope ST' Hence the relative contribution of the slope Sp is near three times the contribution of depth of tillage and four times that of the slope ST' The predominance of the effect of the slope gradient over the depth of tillage is still present in the two components of soil movement. In the case of forward displacement dT, in Eq. (8), fJ coefficients are -0.95 for the slope ST against 0.20 for D; while, for lateral displacement d" in Eq. (9), fJ coefficients are -0.95 for the slope Sp and 0.23 for D.
This general trend of soil displacement increasing with tillage depth is in agreement with previous experimental results for mouldboard ploughing reported by Lobb et al. (1999), Gerontidis et al. (2001) and Van Muysen et al. (2002). Nonetheless, Van Muysen et al. (2002) found that longitudinal translocation distances (dT) were strongly affected by tillage depth, while lateral displacement distances (dp) were not significantly related. These authors suggested that the depth of tillage only affects the time during which the soil stays in contact with the mouldboard blade before being ejected (i.e., the drag phase of soil motion) and consequently the distance soil is displaced in a parallel direction to the tractor path. Nevertheless, this lateral soil displacement is always approximately equal to the furrow width and is accordingly unrelated to the duration of the drag phase or tillage depth. The SETi model predicts that tillage depth also affects the equations that describe the "jump" and "rolling" soil motion phases. Indeed, tillage depth alters the path followed by soil clods on the implement surface and consequently the overturning angle direction (angle a), angle of soil ejection (angle cp), and velocity at which the clods are ejected from the instrument (Torri and Borselli, 2002). Moreover, the nature of the tillage depth effect will depend on the shape and size of the implement. Hence, results suggest that the different effects of tillage depth observed in previous studies could reflect differences in the shape of the mouldboards used.
To evaluate the fit of the multivariate model in Eq. (10) to the dataset derived from the field
experiments at the Vicarello site, a value of 13.8 cm was obtained for the average error of estimation. This error is acceptable considering that the maximum error calculated for the instrument set-up used in field experiments was around 10 cm (Borselli and Torri, 2001). In contrast, no regression models with predictive capacity were obtained when a similar multivariate analysis was performed by directly using the dataset for soil translocation collected in the field experiments (Fig. 4). This reflects the considerable improvement related to the use of the physically based SETi model to analyse data derived from field experiments. The SETi model can be calibrated with a relatively small experimental dataset to yield more general and synthetic soil translocation models of the type d = j(ST, S", D}. One of the main advantages of these synthetic models is that they can be used to extrapolate results to a much wider array of scenarios than those in which the experiments are performed, in terms of topography complexity and directions and depth of tillage. A further advantage of the use of synthetic relationships is that they can be directly applied to calibrate other models of soil redistribution for a given tillage implement on the field- or landscape scale. The latter is the subject of a follow-up paper, in which soil translocation equations obtained using the SETi model are used to calibrate the Soil Redistribution by Tillage (SORET) model (De Alba, 2003), and to perform 3D simulations of soil redistribution by tillage for several agricultural landscapes and tillage scenarios.
Further experimental work is needed to quantify the effect of tillage velocity, V, on soil displacement and therefore more accurately calibrate the SETi model. Indeed, the factor tillage speed V could be included in synthetic multivariate models to produce algorithms of the type:
(12)
Additional research would also be needed to characterise the effect of the initial soil conditions on tillage translocation as well as on soil-implement interactions.
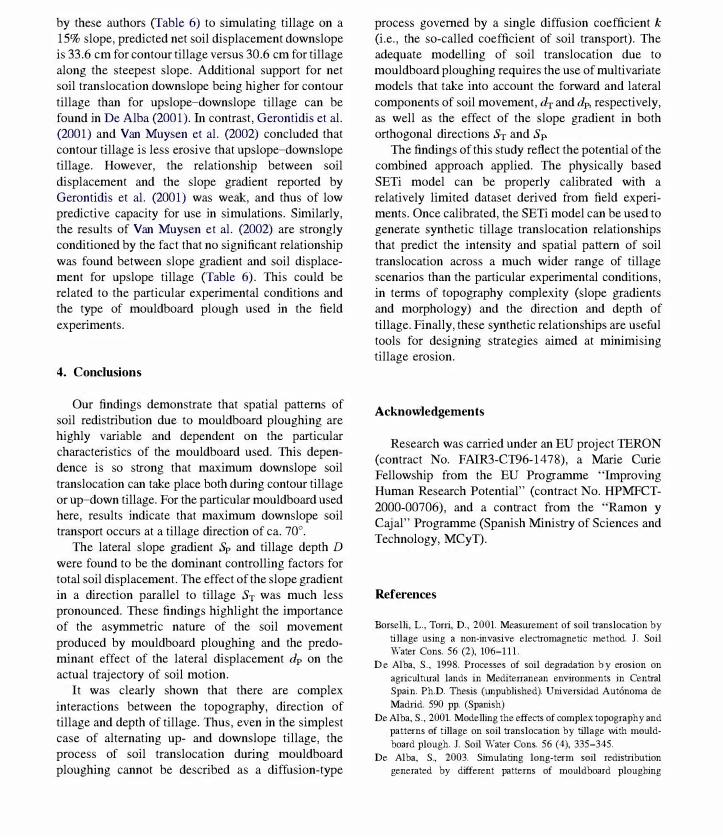
3.4. Implications of asymmetric soil movement provoked by mouldboard ploughing
As discussed before, soil movement by the mouldboard plough is non-symmetric. The soil is

70 ,---------------------�------------------_, I I I I
60 ..... _ .... _T 0101 soil di�pla4e/JIellf d
50
"'" 40 � "
.1 Cl 30
20
10
0 0
0 0 0 o
o o
o o
o dP disTance
dT dislance " . • •
• •
• •
90
• •
• •
• ' " •
• . . '
180
• •
•
• •
•
270
• •
o
. ' . '
360
Tillage direclioll (Omega angle)
Fig. 9 . Predicted distances of soil displacement in the directions: total soil trajectory, dT direction, anddp direction; for a single tillage operation conducted at a 0.3 ill depth on a 15% slope along directions of tillage w between 0° and 3600 (0° = downslope tillage; 1800 = upslope tillage) . dr, soil displacement in the tillage direction; dp, soil displacement in the direction perpendicular to tillage.
pushed forward in the direction of the tractor motion but also towards a lateral direction, producing a trajectory of soil movement along an oblique direction in relation to that of tillage.
Fig. 9 shows the predicted distances d, dT and dp for simulation of a single tillage operation on a 15% slope along directions of tillage ranging from 0" to 360" (Q) . The results reflect the significance of the asymmetric nature of the soil movement produced by mouldboard ploughing and the predominant effect of lateral displacement dp on the actual soil motion trajectory.
The maximum absolute distance d was obtained for a tillage direction of ca. 80° and the minimum d was provoked by a direction of ca. 250", with values of 60.5 and 32.5 cm, respectively. Of the two components of displacement dp and dT, the former was always significantly higher, i.e., dp showed values 1.5-15.5 times higher than the distance dT. The dp distance was in the range 54.8-27.9 cm, corresponding to directions of tillage of 90" and 270", respectively;
while dT was in the range 26.5-2.8 cm for tillage directions of 0° and 180°, respectively.
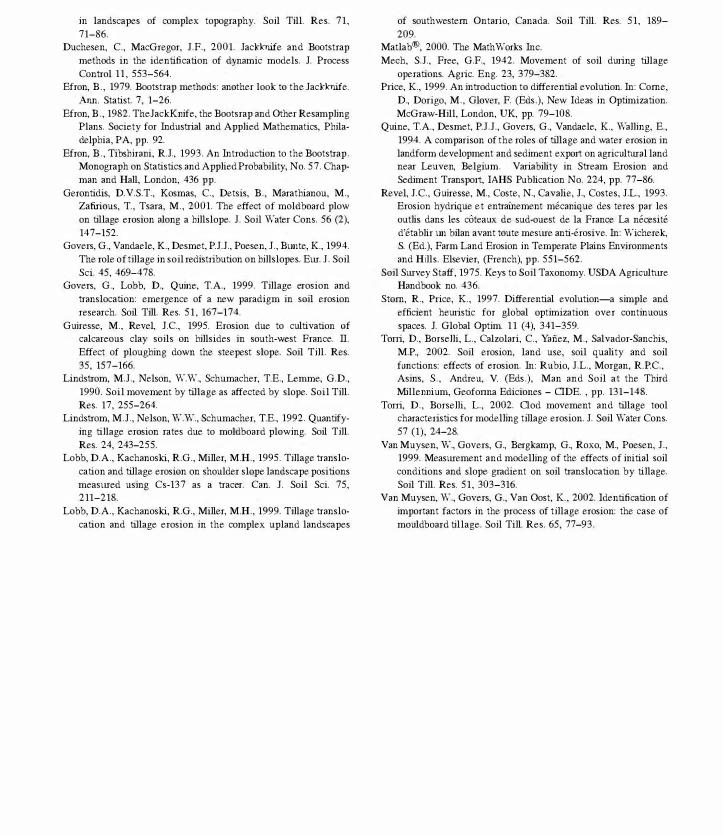
"'When these results were compared to those previously reported by De Alba (2001) for tillage translocation by a typical mouldboard used in Central Spain (Fig. 10), similar relationships were observed among d, dT and dp. However, the prevailing effects of the partial distance dp on absolute soil displacement were not as strong. The relation dp/dT varied between extreme values of 0.7 and 1.7. As a consequence, maximum displacement d corresponded to downslope tillage (i.e., direction of 0") and its minimum value to a tillage direction ca. the upslope direction (i.e., direction of 200"), with d values of 62.9 and 49.9 cm, respectively. These differences between the results of simulation are probably related to the different shape and size of the mouldboard ploughs used in the experiments of Vicarello and Central Spain.
It is important to stress the lack of studies in which the asymmetric nature of soil movement is taken into

70
60
50
� 40
�
� . ;:: Cl 30
20
10
0 0
Ac:lUo/.wif di:,placemem d
tiP dislaflce 0 0 0 0 0 0 0 • • • • • •
• 0 0 0 0 • • e O 0 0 I • o • ° 0 • • o . 0 • I o . 0 • I o o � 0 0 0
•• I . 0 0 0 0 0 0 0
• I • • dT dislaflce • • .. •
90
• • • • • • I I I I I I I I I I I
ISO
Tillage direction (Omega angle)
270 360
Fig. 10. Predicted distances of soil displacement for a single tillage operation conducted at a 0.24 m depth on a 15% slope using a mouldboard plough typical of Central Spain (modified from De Alba, 2001). dr, soil displacement in the tillage direction; dp, soil displacement in the direction perpendicular to tillage.
account to model soil translocation by rnouldboard ploughing. This in part can be explained by the fact that tillage translocation has been defined as a socalled diffusion-type process (Govers et aI., 1994) described by a single constant k (i.e., the diffusion constant or the so-called tillage transport coefficient). This approach makes an important simplification by assuming that soil transport by tillage is only affected by the slope gradient in the direction of soil movement considered (e.g., Van Muysen et aI., 2002). The results presented here together with those reported in De Alba (2001) and Torri and Borselli (2002) stress the inadequacy of this assumption. A single k-factor, the coefficient of tillage transport, cannot properly quantify the soil translocation caused by mouldboard ploughing, which requires the use of more complex models that take into account the complexity of interactions between the topography and tillage patterns in a more realistic manner. The method used here represents a notable improvement over past
models in that topography complexity is dealt with in two different ways: (l) by combining the directions of the steepest slope and tillage (w) in the reference system implemented in the SETi model and (2) by combining the orthogonal slope gradients ST and Sp.
To analyse the predicted spatial pattern of soil translocation using the translocation models in Eqs. (8-10), the displacement trajectory of an idealized soil block was simulated (single tillage operation conducted on a 15% slope in tillage directions, i.e., W between 0° and 360°) to give the results shown in Fig. 11. These results show that the maximum value of soil translocation downslope (60.5 cm) corresponded to a tillage operation conducted in a direction of ca. 70°, while maximum soil translocation upslope (32.5 cm) was produced by conducting tillage in a ca. 250" direction. It should be highlighted that tillage along the steepest slope (i.e., tillage direction of 0°) gave rise to a soil displacement distance downslope of 26.5 cm, i.e., 44% of the

80
6()
40 2700 2400 20
"'" -.2. �
.1 0
Q
/ �210° 30y S \1800 3300 , -20 'JV
-40
-60
00\ / 3� �1200 60° 900
-80 -80 -6() -40 -20 o 20 40 60 80
Diswnce (cm)
Fig. 11 . Predicted final position (white circles) of a soil block S after a single tillage operation petfonned at a 0.3 ill depth using a right-hand mouldboard plough on a 15% slope along directions of tillage (w) between 0° and 360°.
maximum displacement obtained for the 70° direction. In contrast, tillage conducted upslope (i.e., a tillage direction of 180") led to a soil displacement upslope of 2.8 cm, which only represents 8.7% of the maximum displacement obtained for a direction of 250". For tillage performed across the slope (i.e., contour tillage), a downslope soil displacement of 58.4 cm was observed when the soil was overturned laterally and downwards (i.e., a tillage direction of 90"), while soil displacement upslope was 29.9 cm when the soil was overturned laterally and upslope (i.e., tillage direction of 270"). These results indicate that soil displacement along the steepest slope is zero for tillage directions of ca. 175" and 330", while displacement across the slope is zero for tillage directions ca. 70° and 2500•
Thus, simulated results reveal that downslope tillage does not necessarily lead to maximum downslope soil transport. Moreover, contouring tillage with lateral overturning in a downward direction (i.e., a 90°
direction) causes a soil displacement downslope 2.2 times higher than downslope tillage along the steepest slope. Even in the case of alternating the tillage direction in consecutive operations up- and downslope (180" and 0" directions) and contouring (90" and 270" directions) after two such tillage operations, net soil displacement downs lope is significantly higher for contour tillage; results being 28.5 cm versus 23.7 cm for upslope-downslope tillage and therefore 17% lower than the former. These trends are obviously related to the particular characteristics of the mouldboard plough used in the field experiments, and mainly to the observed predominant effect of the lateral displacement dp on the actual trajectory of soil movement.
The experimental results reported by Lindstrom et a1. (1992) indicate a similar trend: soil displacement downslope was higher for contour tillage (alternating the direction of tillage) than for upslope-downslope tillage. If we apply the translocation models reported
by these authors (Table 6) to simulating tillage on a 15% slope, predicted net soil displacement downslope is 33.6 cm for contour tillage versus 30.6 cm for tillage along the steepest slope. Additional support for net soil translocation downs lope being higher for contour tillage than for upslope-downslope tillage can be found in De Alba (2001). In contrast, Gerontidis et a1. (2001) and Van Muysen et a1. (2002) concluded that contour tillage is less erosive that upslope-downslope tillage. However, the relationship between soil displacement and the slope gradient reported by Gerontidis et a1. (2001) was weak, and thus of low predictive capacity for use in sirnulations. Similarly, the results of Van Muysen et a1. (2002) are strongly conditioned by the fact that no significant relationship was found between slope gradient and soil displacement for upslope tillage (Table 6). This could be related to the particular experimental conditions and the type of mouldboard plough used in the field experiments.
4. Conclusions
Our findings demonstrate that spatial patterns of soil redistribution due to mouldboard ploughing are highly variable and dependent on the particular characteristics of the rnouldboard used. This dependence is so strong that maximum downslope soil translocation can take place both during contour tillage or up-down tillage. For the particular mouldboard used here, results indicate that maximum downslope soil transport occurs at a tillage direction of ca. 70°.
The lateral slope gradient Sp and tillage depth D were found to be the dominant controlling factors for total soil displacement. The effect of the slope gradient in a direction parallel to tillage ST was much less pronounced. These findings highlight the importance of the asymmetric nature of the soil movement produced by mouldboard ploughing and the predominant effect of the lateral displacement dp on the actual trajectory of soil motion.
It was clearly shown that there are complex interactions between the topography, direction of tillage and depth of tillage. Thus, even in the simplest case of alternating up- and downslope tillage, the process of soil translocation during mouldboard ploughing cannot be described as a diffusion-type
process governed by a single diffusion coefficient k (i.e., the so-called coefficient of soil transport). The adequate modelling of soil translocation due to mouldboard ploughing requires the use of multivariate models that take into account the forward and lateral components of soil movement, dT and dp, respectively, as well as the effect of the slope gradient in both orthogonal directions ST and Sp.
The findings of this study reflect the potential of the combined approach applied. The physically based SETi model can be properly calibrated with a relatively limited dataset derived from field experiments. Once calibrated, the SETi model can be used to generate synthetic tillage translocation relationships that predict the intensity and spatial pattern of soil translocation across a much wider range of tillage scenarios than the particular experimental conditions, in terms of topography complexity (slope gradients and morphology) and the direction and depth of tillage. Finally, these synthetic relationships are useful tools for designing strategies aimed at minimising tillage erosion.
Acknowledgements
Research was carried under an EU project TERON (contract No. FAIR3-CT96-1478), a Marie Curie Fellowship from the EU Programme "Improving Human Research Potential" (contract No. HPMFCT-2000-00706), and a contract from the "Ramon y Cajal" Programme (Spanish Ministry of Sciences and Technology, MCyT).
References
Borselli, L., Torri, D., 200l. MeaslUement of soil translocation by tillage using a non-invasive electromagnetic method. 1. Soil Water Cons. 56 (2), 106-11 l .
D e Alba, S., 1998. Processes of soil degradation b y erosion on agriculhual lands in Mediterranean environments in Central Spain. Ph.D. Thesis (llllpublished). Universidad Aut6noma de Madrid. 590 pp. (Spanish)
De Alba, S., 2001. Modelling the effects of complex topography and patterns of tillage on soil translocation by tillage v..ith mouldboard plough. 1. Soil Water Cons. 56 (4), 335-345.
De Alba, S., 2003. Simulating long-term soil redistribution generated by different patterns of mouldboard ploughing
in landscapes of complex topography. Soil Till. Res. 71, 71-86.
Duchesen, c., MacGregor, l.P., 2001. lackk:ntle and Bootstrap methods in the identification of dynamic models. l. Process Control 11, 553-564.
Efron, B., 1979. Bootstrap methods: another look to the lackk:ntle. Ann. Statist. 7, 1-26.
Efron, B., 1982. ThelackKnife, the Bootsrap and Other Resampling Plans. Society for mdustrial and Applied Mathematics, Philadelphia, PA, pp. 92.
Efron, B., Tibshirani, Rl., 1993. An mtroduction to the Bootstrap. Monograph on Statistics and Applied Probability, No. 57. Chapman and Hall, London, 436 pp.
Gerontidis, D.Y.S.T., Kosmas, C., Detsis, B., Marathianou, M., Zafirious, T, Tsara, M., 2001. The effect of moldboard plow on tillage erosion along a hillslope. l. Soil Water Cons. 56 (2), 147-152.
Govers, G., Vandaele, K., Desmet, Pl.l., Poesen, l., Bllllte, K, 1994. The role of tillage in soil redistribution on hillslopes. ElU. l. Soil Sci. 45, 469-478.
Govers, G., Lobb, D., Quille, TA., 1999. Tillage erosion and translocation: emergence of a new paradigm in soil erosion research. Soil Till. Res. 51, 167-174.
Guliesse, M., Revel, l.C., 1995. Erosion due to cultivation of calcareous clay soils on hillsides in south-west France. ll. Effect of ploughing down the steepest slope. Soil Till. Res. 35, 157-166.
Lindstrom, M.l., Nelson, W.W., Schumacher, TE., Lemme, G.D., 1990. Soil movement by tillage as affected by slope. Soil Till. Res. 17, 255-264.
Lindstrom, M.l., Nelson, W.W., Schumacher, TE., 1992. Quantifying tillage erosion rates due to moldboard plowing. Soil Till. Res. 24, 243-255.
Lobb, D.A., Kachanoski, RG., :Miller, MH., 1995. Tillage translocation and tillage erosion on shoulder slope landscape positions measlUed using Cs-137 as a tracer. Can. l. Soil Sci. 75, 211-218.
Lobb, D.A., Kachanoski, RG., :Miller, MH., 1999. Tillage translocation and tillage erosion in the complex upland landscapes
of southwestern Ontario, Canada. Soil Till. Res. 51, 189-209.
Matlab®, 2000. The MathWorks mc. Mech, S.1., Free, G.F., 1942. Movement of soil during tillage
operations. Agric. Eng. 23, 379-382. Price, K, 1999. An introduction to differential evolution. m: Come,
D., Dorigo, M., Glover, P. (Eds.), New Ideas in Optimization. McGraw-HilI, London, UK, pp. 79-108.
Quine, TA., Desmet, Pl.l., Govers, G., Vandaele, K, Walling, E., 1994. A comparison of the roles of tillage and water erosion in landform development and sediment export on agriculhual land near Leuven, Belgium. Variability in Stream Erosion and Sediment Transport, IAHS Publication No. 224, pp. 77-86.
Revel, l.C., Guliesse, M., Coste, N., Cavalie, l., Costes, l.L., 1993. Erosion hydrique et entrafuement mecanique des teres par les outlis dans les c6teaux de sud-ouest de la France La necesite d'etablir llll bilan avant toute meSlUe anti-erosive. m: Wicherek, S. (Ed.), Farm Land Erosion in Temperate Plains Environments and Hills. Elsevier, (French), pp. 551-562.
Soil SlUvey Staff, 1975. Keys to Soil Taxonomy. USDA Agriculhue Handbook no. 436.
Stom, R, Price, K, 1997. Differential evolution-a simple and efficient heuristic for global optimization over continuous spaces. l. Global Optim. 11 (4), 341-359.
Torri, D., Borselli, L., Calzolari, c., Yaiiez, M., Salvador-Sanchis, M.P, 2002. Soil erosion, land use, soil quality and soil fimctions: effects of erosion. m: Rubio, l.L., Morgan, RP.C., Asins, S., Andreu, V. (Eds.), Man and Soil at the Third :Millennium, Geofonna Ediciones - ODE. , pp. 131-148.
Torri, D., Borselli, L., 2002. God movement and tillage tool characteristics for modelling tillage erosion. l. Soil Water Cons. 57 (1), 24-28.
Van Muysen, W., Govers, G., Bergkamp, G., Roxo, M., Poesen, l., 1999. MeaslUement and modelling of the effects of initial soil conditions and slope gradient on soil translocation by tillage. Soil Till. Res. 51, 303-316.
Van Muysen, W., Govers, G., Van Oast, K, 2002. Identification of important factors in the process of tillage erosion: the case of mouldboard tillage. Soil Till. Res. 65, 77-93.