assessment of three selected locations in nigeria as
TRANSCRIPT

ABUAD Journal of Engineering Research and Development (AJERD) ISSN:
Volume 3, Issue 1, 90-102
www.ajerd.abuad.edu.ng/ 90
Assessment of Three Selected Locations in Nigeria as Offshore
Windfarms Using Multi-criteria Decision Procedure
Ezekiel Asuku MAYAKI1, Oyewole ADEDIPE1, Uzoma Gregory OKORO1, Rabiu Onoruoiza MAMMAN1,
Sunday Albert LAWAL1
1Department of Mechanical Engineering, School of Infrastructure, Process Engineering and Technology, Federal
University of Technology, Minna Nigeria
[email protected],[email protected], [email protected],
[email protected], [email protected]
Corresponding Author: [email protected]
Date Submitted: 26/12/2019
Date Accepted: 26/04/2020
Date Published: 30/06/2020
Abstract: The continuous rise in carbon footprints arising from industrial and domestic activities has placed urgent need on renewable
energy sources globally. Wind as a renewable energy source is gaining global prominence because it can be harnessed in small and
commercial quantities. Several studies have been carried out on the subject of wind energy. However, this paper is focused on multi-
criteria evaluation of three Nigerian coastal locations (Lagos, Port-Harcourt and Warri) for consideration for installation of offshore
wind farm to improve energy availability in the country. In this paper, attributes for offshore wind farm location were collected for three
locations in Nigeria; Victoria Island (VI) in Lagos, Abbonema area of River State and Koko area of Warri. Ten-year wind speed data for
the three locations were also collected from the archive of Nigeria Metrological Agency (NIMET), while other required factors were
collected with the use of a well-structured Questionnaire and the respondents were senior staff of the Nigerian Airspace Management
Agency (NAMA) and NIMET. Collected data were analyzed using Multi-Criteria analysis tool (TOPSIS). Average of a ten-year wind
speed data for Lagos (VI), Koko (Warri) and Abonemma (Rivers) were 6.251m/s, 7.294m/s and 7.347m/s respectively. Analytical
Hierarchy Process (AHP) gave a Consistency Index of 0.123029264 and Consistency Ratio of 0.084266619. The consistency ratios from
the AHP were used to calculate the required Criteria Weight (Cw) for the TOPSIS analysis. From the cumulative value of the analysed
factors, Victoria Island (Lagos) has the highest figure of 233.6677 with a consideration rate of 38% and this places it above Koko
(Warri) and Abonnema (Rivers) with a value of 187.7704 (30%) and 195.4377844 (32%). Based on the analysis carried out, Victoria
Island Lagos appears to be the best option for offshore wind farm consideration.
Keywords:Multi-Criteria, Offshore, Pair-wise, Analytic, TOPSIS.
1. INTRODUCTION
Consistent power supply is a necessity for social-political sustainability. The recent rise in worlds’ population has made
it a necessity to harness other alternatives energy sources to augment the conventional fossil fuels. Fossil fuel as a source
of energy is accompanied with the emission of greenhouse gasses which in-turn has shown an adverse effect on our
environment. With the current global legislation on greenhouse gas emission and the quest to achieve the Sustainable
Development Goals (SDGs), such as SDG 7 (Affordable and Clean Energy) and SDG 13 (Climate Action), attentions are
now being focused on exploiting renewable energy source since they are readily available, sustainable and environment
friendly. Among the available renewable energy sources, wind energy is becoming an aspect of global focus because of its
availability and sustainability. A recent report on global wind power shows that the total installed capacity of wind power
had increased from 6,100 MW in the year 1996 to 597 GW in 2018 and this further proves the viability of wind as an
alternative energy source [1].
The adoption of wind energy as a source of power generation is more common among the developed nations such as;
Belgium, United Kingdom, China, Denmark, United States of America amongst others. The utilization of wind energy
technology is still not very common in Africa, except for countries like Tunisia, Morocco and Egypt that are making good
progress within the wind energy value chain in Africa [1].
In order to ascertain the viability of any location as a windfarm site, several factors need to be considered. These include
feasibility study based on the recorded wind data from the location and subsequent statistical evaluation [2], cost
comparative and logistic assessment [3], as well as other multiple criteria assessments.
Taking Nigeria as a case study where the idea of wind energy technology is relatively uncommon, most studies are
focused on statistical characterization of potential windfarm sites while little work have been done to ascertain if the

ABUAD Journal of Engineering Research and Development (AJERD) ISSN:
Volume 3, Issue 1
www.ajerd.abuad.edu.ng/ 91
acclaimed sites are readily viable as windfarm sites in terms of other valuable criteria apart from wind energy output
obtained from statistical studies. Up till date, only reference [3] has carried out a study on logistic analysis of Nigeria
offshore windfarm sector. The study was focused on cost comparative assessment of realizable energy output in
comparison to the conventional fossil source, different stages of installation using procedures that optimizes material
transport from the coast to the offshore installation sites. In this paper, the authors intend to explore other multiple criteria
analysis that influences windfarm sites using TOPSIS analysis. As such, it is hoped that the outcome of this study will
attract the attention of policy makers and government agencies within the Nigerian energy sector to focus attention on
developing wind power projects within the selected locations.
The selection of the appropriate offshore installation site involves a few conflicting criteria and these criteria are best
resolved with the use of Multi-Criteria Decision Analysis known as the MCDA or Multi-Criteria Decision Method
(MCDM) [4]. Multiple-criteria decisions making (MCDM) or Multiple-criteria decision analysis (MCDA) is a sub-
discipline of operations research that explicitly evaluates multiple conflicting criteria in decision making (both in daily life
and in settings such as business, government and medicine) [5]. Conflicting criteria are typical in evaluating options; cost
or price is usually one of the main criteria. However, some measure of quality is typically another criterion, easily in
conflict with the cost [6]. In purchasing a car, cost, comfort, safety, and fuel economy may be some of the main criteria to
consider. Structuring complex problems and considering multiple criteria explicitly leads to more informed and better
decisions [7]. There have been important advances in this field since the start of the modern multiple-criteria decision-
making discipline in the early 1960s [8]. A variety of approaches and methods, many implemented by specialized decision-
making software [9] that have been developed for their application in an array of disciplines, ranging from politics and
business to the environment and energy [10]. In this study, attention was focused on technical criteria such as; power
demands, shipping routes, average wind speed within the considered locations and offshore distance from nearby airport.
Other related studies that have been carried out include a study reported in [11] where a state-of the-art survey of
TOPSIS applications Multi-Criteria Decision Aid (MCDA) was presented. A study on site selection for wind farm
installation was also carried out by [12]. Hodgett worked on Multi-Criteria Decision-Making in whole process design [13].
Studies on statistical characterization of wind speed have also been reported by [14], [15], and [16]. While in Nigeria,
reference [17] carried out an assessment of wind energy alternative in Nigeria. A similar work considering Nigeria as a
case study was also carried out investigating wind energy potential in Nigeria [18]. Reference [3] carried out a logistic
analysis of Nigeria offshore wind farm sector while Ajayi [19] carried out the Potential for wind Energy in Nigeria. A
study was also carried out to investigate wind energy potential in Mubi Adamawa, Nigeria [20]. Summarily, the reported
aforementioned works have shown that Multi-Criteria Decision procedure has not been applied to investigate the potential
for installation of offshore windfarms in the three selected Nigeria coastal cities that are considered in this paper.
2. METHODOLOGY
In order to ascertain the appropriateness of a location as a potential site for offshore wind farm, certain criteria must be
fulfilled within the location. There are three major considerations for the selection of an appropriate site(s) for offshore
wind farm. These are economical consideration, socio-political consideration and environmental consideration.
Environmental consideration is further divided into two vital Multi-Criteria aspects. The first is a Multi-Criteria process
concerned with the geographical nature of the selected location. A geographical information system (GIS) is majorly
required to obtain all the criteria needed for analysis. It considers aquatic life, soil topography, undersea soil erosion and
the change in water level. The second aspect considers the suitability of the selected location based on the immediate
surroundings. This aspect is known to be the technical aspect of the environmental consideration. Attributes that are
considered in this aspect are; average wind speed of the offshore region, distance from shore (Settlement), distance from
Airport(s), distance from local electricity distribution companies, proximity to high power demand areas, Interference with
bird flight, interference with undersea cables and gas lines, interference with existing shipping route and interference with
telecommunication installations. Data collected were analysed using the TOPSIS mathematical model.
2.1 Data Collection
This study was limited to the technical attribute required for the location of a wind farm. The considered data were
limited to power demand, distance from airport, average wind speed and shipping route. These data were collected for the
three offshore locations; Lagos VI, Koko area of Warri and Abonemma in Rivers, which are the alternatives for which
their attributes were analysed. 10 years average offshore wind speed data from 2002 to 2011 were collected from Nigeria
Metrological Agency (NIMET). The data were collected using cup generator in a buoy system at 10m above sea level. The
qualitative attributes were sourced for and quantitative attributes were obtained using well-structured questionnaires. Ten
number samples of questionnaires were served to staff of the Nigerian Airspace Management Agency and NIMET in each
of the locations under consideration, out of which eight was the least feedback.
2.2 Mathematical Model
In this study, the technique for order of performance by similarity to ideal solution was applied in resolving the multi-
criteria problem [21]. TOPSIS assists decision maker(s) organize the problems to be solved; it also helps to analyse,
compare and rank alternatives. Also, the Analytical Hierarchy Process (AHP) is one of the multiple criteria decision-
making methods [22]. It provides measures of judgment consistency, derives priorities among criteria and alternatives and

ABUAD Journal of Engineering Research and Development (AJERD) ISSN:
Volume 3, Issue 1
www.ajerd.abuad.edu.ng/ 92
simplifies preference ratings among decision criteria using pair wise comparisons. The mathematical process used for this
study is described in the following section.
2.3 Mathematical Processes
For a matrix of a pair-wise element writing as:
44434241
34333231
24232221
14131211
CCCC
CCCC
CCCC
CCCC
The sum of the values in each column of the pair-wise matrix is given in Equation 1
==
n
iijij cC
1 (1)
Dividing each element in the matrix by its column total to generate a normalized pair-wise matrix described as;
=
=
nmn
m
ij
ij
ij
xx
x
xxx
c
CX
n
i
..
....
...
.
1
21
11211
1
(2)
The consistency vector is calculated by multiplying the pair-wise matrix (Equation 2) by the weights vector, Equation 3 is
formulated as;
=
41
31
21
11
41
31
21
11
44434241
34333231
24232221
14131211
V
V
V
V
C
C
C
C
W
W
W
W
CCCC
CCCC
CCCC
CCCC
(3)
Consistency vector average ʎmax (Average) is calculated by averaging the value of the consistency vector. This is
expressed in Equation 4
==
n
iijCv
1 (4)
Consistency index CI and consistency ratio CR are also expressed in Equations 5 and 6
1−
−=
n
nCI
(5)
RI
CICR = (6)
The structure of the decision matrix Dk is therefore expressed in Equation 7
X1 X2 . . . Xj . . . Xn
A1 xk11 xk
12 . . . xk1j . . . xk
1n
A2 xk21 xk
22 . . . xk2j . . . xk
2n
Dk =
Ai xki1 xk
i2 . . . xkij . . . xk
in
Am xkm1 xk
m2 . . . xkmj . . . xk
mn (7)
Ai represents the alternative i, i = 1,...,m; Xj represents criterion j, j = 1,...,n; with both numerical and non-numerical data.
xkij indicates the performance rating of alternative Ai with respect to criterion Xj by decision maker k, k =1,..., K, and xk
ij is
the component of Dk. Note that non-numerical data from each alternative can be assigned discrete values or linguistics
values.
ABUAD Journal of Engineering Research and Development (AJERD) ISSN:
Volume 3, Issue 1
www.ajerd.abuad.edu.ng/ 93
For easy combination of qualitative and quantitative attributes, Normalization was carried out on the data and this handles
the disparity in both set of data. This was done using the corresponding excel command. Taking the average of the criteria
values gives Equation 8 as:
( )n
CAverage
n
iij == 1 (8)
The standard deviation based on samples was done using the Excel function (=STDEV.S)). This can be expressed as:
( ) −=
=n
i ijCn 1
21
(9)
3. RESULTS AND DISCUSSIONS
3.1 Wind Data
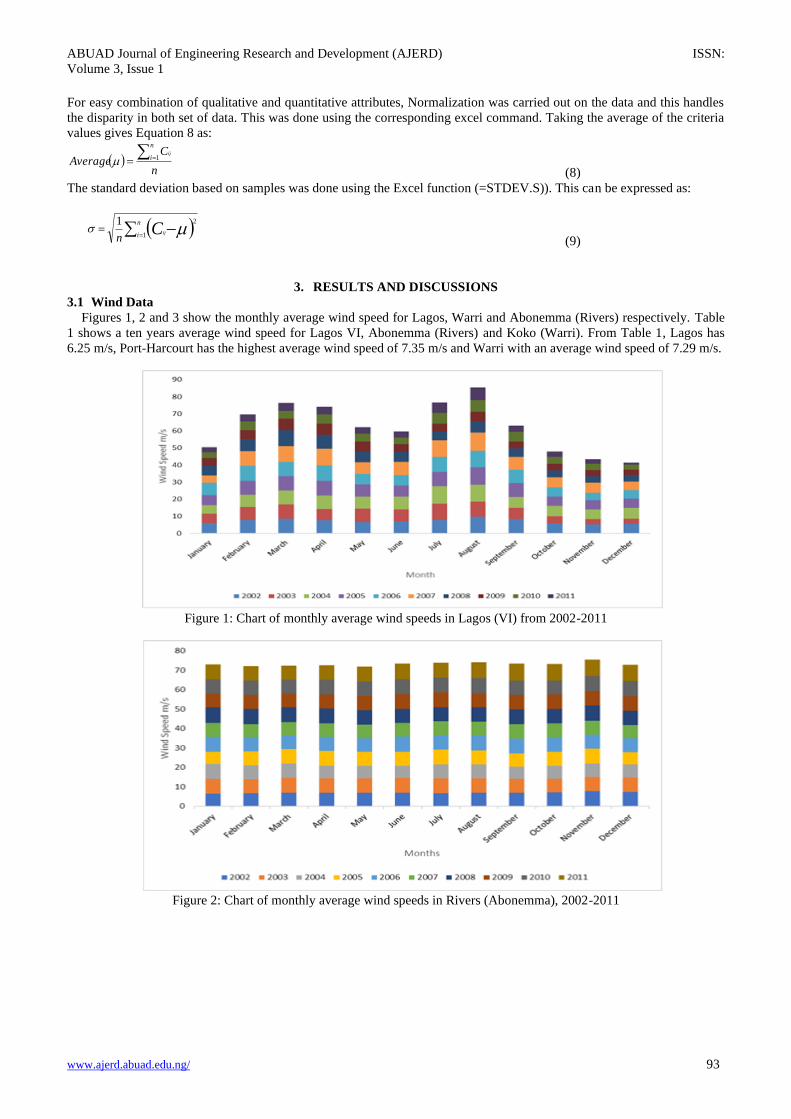
Figures 1, 2 and 3 show the monthly average wind speed for Lagos, Warri and Abonemma (Rivers) respectively. Table
1 shows a ten years average wind speed for Lagos VI, Abonemma (Rivers) and Koko (Warri). From Table 1, Lagos has
6.25 m/s, Port-Harcourt has the highest average wind speed of 7.35 m/s and Warri with an average wind speed of 7.29 m/s.
Figure 1: Chart of monthly average wind speeds in Lagos (VI) from 2002-2011
Figure 2: Chart of monthly average wind speeds in Rivers (Abonemma), 2002-2011

ABUAD Journal of Engineering Research and Development (AJERD) ISSN:
Volume 3, Issue 1
www.ajerd.abuad.edu.ng/ 94
Figure 3: Chart of monthly average wind speeds in Koko (Warri) from 2002-2011
Using Table 1, Figure 4 is the combined chart for the ten years average wind speed for the three alternatives (Lagos VI,
Abonemma (Rivers) and Koko (Warri).
Table 1: Ten Years Average Wind Speed (m/s) for Lagos VI, Koko (Warri) and Abonemma (Rivers)
Alternatives Years
Average 2002 2003 2004 2005 2006 2007 2008 2009 2010 2011
Lagos VI 7.21 6.49 7.27 7.32 7.21 7.6 5.88 4.83 4.7 4 6.25
Koko (Warri) 7.38 7.46 7.35 7.32 7.32 7.17 7.48 7.07 7.2 7.19 7.29
Abonemma
(Rivers) 7.3 7.37 6.89 7.13 7.38 7.06 7.54 7.3 7.56 7.94
7.35
Figure 4: Combined Chart of Average Wind Speed for the three Alternatives
From Figure 4, it can be seen that Lagos VI has a large variation in wind speed for the ten years period which can be
attributed to heavy activities on the Victoria island region. Abonemma (Rivers) has a steady wind speed for the ten years
period and Koko (Warri) is steadier. Also, Lagos VI has 7.32 m/s as its highest wind speed which was in 2005 and lowest
of 4.0 m/s in 2011, Koko (Warri) has it lowest average wind speed in the year 2009 (7.07 m/s) and highest in the year 2008
(7.48 m/s) and Abonemma (Rivers) lowest average wind speed of 6.89 m/s occurred in 2004 while the highest was in 2011
(7.94 m/s). The average wind speed for the three alternatives Lagos VI (6.25 m/s), Abonemma (Rivers) (7.35 m/s) and
Koko (Warri) (7.29 m/s), implies that all of the alternatives have the required average wind speed for the installation of
wind farm which is a minimum of 4.0 m/s as stated by Medugu and Malgwi [20].

ABUAD Journal of Engineering Research and Development (AJERD) ISSN:
Volume 3, Issue 1
www.ajerd.abuad.edu.ng/ 95
3.2 Technical Aspects of the Environmental Attributes
Other required criteria for the proper evaluation of an offshore wind farm like distance from shore, distance from an
airport, proximity to power demand and Local Power distribution (DISCO) companies were collected. The samples
collected were sorted and rearranged as shown in Table 2, 3 and 4 for the three Alternatives. The averages were then
determined for further analysis. The distance from shore was obtained from the NIMET stations in each of the locations.
Lagos VI was found to be 500km, Koko (Warri) 350km and Abonemma (Rivers) was 400km. Different weights from 1 to
5 were assigned to the remaining attributes based on the outcomes from the questionnaire.
Table 2: Attribute data collected for Lagos VI
Attributes SAMPLES
Average 1 2 3 4 5 6 7 8
Distance from Airport (m) 534 530 535 533 535 529 533 535 533
Distance from DISCO (m) 532 533 533 530 533 528 531 529 531.13
Power Demand 4 5 5 5 5 4 4 4 4.5
Bird Flight Interference 3 2 2 2 3 2 2 2 2.25
Shipping Route 2 2 2 1 3 1 2 1 1.75
Undersea Gas Line 2 2 3 4 3 2 2 1 2.38
Telecommunication
Interference 3 4 1 4 4 4 3 3 3.25
Table 3: Attribute data collected for Koko (Warri)
Table 4: Attribute data collected for Abonemma (Rivers)
3.3 Analytical Hierarchy Process
The weight function was computed from the data collected. The computation was based on the AHP principle. Weights
were allotted to Attributes based on their relevance in the determination of the appropriate site location.
3.3.1 Mathematical Evaluation
Some of the notations and symbols used for calculation are defined as follows:
X Decision Matrix (Judgment Matrix)
rij Normalized Decision Matrix with ith number of alternative and jth number of criterion
C1 Power Demand
C2 Distance from Airport
Attributes SAMPLES
Average 1 2 3 4 5 6 7 8
Distance from Airport (m) 437 430 440 437 435 445 437 447 533
Distance from DISCO (m) 433.3 430 435.5 425 432 437 431 431 431.85
Power Demand 5 5 4 3 4 4 3 3 3.88
Bird Flight Interference 2 2 3 1 4 2 3 3 2.5
Shipping Route 4 4 4 5 4 4 3 3 3.88
Undersea Gas Line 5 5 4 4 5 5 4 4 4.5
Telecommunication
Interference 4 5 5 4 5 4 5 5 4.63

ABUAD Journal of Engineering Research and Development (AJERD) ISSN:
Volume 3, Issue 1
www.ajerd.abuad.edu.ng/ 96
C3 Average Wind Speed
C4 Shipping route interference
C5 Undersea Gas Line Interference
C6 Distance from Shore
C7 Distance from Distribution Company
C8 Bird Flight Interference
C9 Telecommunication Interference
W Weight
CI Consistency Index
CR Consistency Ratio
RI Random Inconsistency
µ Average of Criteria Pair-wise Matrix
σ Standard deviation
λmax Consistency Vector Average
n Number of Criteria
Table 5 shows the criterion weight score. Comparison of criteria was done and scored according to the rating on the
table. When a particular criterion is compared to itself, it carries a judgment value of 1; and if two different criteria happen
to have the same level of relevance, a judgment value of 1 is also assigned. When a criterion is less important than that
which it is been compared to, the judgment value is taken from the right-hand side of Table 5 and an inverse of that value
is recorded. However, when a criterion is more important than that which is being compared to, the judgment value is
taken from the right-hand side of table 5 and the actual value is recorded.
Table 5: Effective criteria and pair wise comparison
Factor Factor weighting Score Factor
More Important than Equal Less Important than
C1 1 2 3 4 5 1 1 2 3 4 5 C2
C2 1 2 3 4 5 1 1 2 3 4 5 C3
C3 1 2 3 4 5 1 1 2 3 4 5 C4
C4 1 2 3 4 5 1 1 2 3 4 5 C5
C5 1 2 3 4 5 1 1 2 3 4 5 C6
C6 1 2 3 4 5 1 1 2 3 4 5 C7
C7 1 2 3 4 5 1 1 2 3 4 5 C8
C8 1 2 3 4 5 1 1 2 3 4 5 C9
C9 1 2 3 4 5 1 1 2 3 4 5 C1
Table 6 shows the comparison matrix of order nine (9) where 9 criteria C1, C2, C3, C4, C5, C6, C7, C8 and C9 are
compared against each other.
Table 6: Pair wise input comparison matrix
Factor C1 C2 C3 C4 C5 C6 C7 C8 C9
C1 1 3 2 2 4 0.5 0.3333 0.25 0.25
C2 0.3333 1 0.5 0.5 2 0.25 0.2 0.1667 0.1667
C3 0.5 2 1 1 0.3333 0.3333 0.25 0.2 0.2
C4 0.5 2 1 1 3 0.3333 0.25 0.2 0.2
C5 0.25 0.5 3 0.3333 1 0.2 0.1667 0.1429 0.1429
C6 2 4 3 3 5 1 0.5 0.3333 0.3333
C7 3 5 4 4 6 2 1 0.5 0.5
C8 4 6 5 5 7 3 2 1 1
C9 4 6 5 5 7 3 2 1 1
3.3.2 Normalization
Normalization of the matrix is the next step immediately after matrix comparison. In equation (1), the sum of the pair-
wise criteria matrix column was calculated as shown in Table 7. Using equation (2), each element in the column was

ABUAD Journal of Engineering Research and Development (AJERD) ISSN:
Volume 3, Issue 1
www.ajerd.abuad.edu.ng/ 97
divided by the column sum to return its normalized value. Summation of each column of the normalized matrix was 1,
which conforms to Saaty’s [22] claim that the column sum of a normalized comparison must be equal to 1. Table 8 shows
the normalized form of the comparison matrix.
Table 7: Column total of the pair wise input comparison matrix
Factor C1 C2 C3 C4 C5 C6 C7 C8 C9
C1 1 3 2 2 4 0.5 0.3333 0.25 0.25
C2 0.3333 1 0.5 0.5 2 0.25 0.2
0.1667
0.1667
C3 0.5 2 1 1 0.3333 0.3333 0.25 0.2 0.2
C4 0.5 2 1 1 3 0.3333 0.25 0.2 0.2
C5 0.25 0.5 3 0.3333 1 0.2
0.1667
0.1429
0.1429
C6 2 4 3 3 5 1 0.5
0.3333
0.3333
C7 3 5 4 4 6 2 1 0.5 0.5
C8 4 6 5 5 7 3 2 1 1
C9 4 6 5 5 7 3 2 1 1
Total 15.5833 29.5 24.5 21.8333 35.3333 10.6167 6.7 3.7929 3.7929
Table 8: Normalized comparison matrix
Factor C1 C2 C3 C4 C5 C6 C7 C8 C9 Total Average
C1 0.0641 0.1017 0.0816 0.0916 0.1132 0.0471 0.0498 0.0659 0.0659 0.681 0.0756648
C2 0.0214 0.0339 0.0204 0.0229 0.0566 0.0236 0.0299 0.0439 0.0439 0.297 0.0329427
C3 0.0321 0.0678 0.0408 0.0458 0.0094 0.0314 0.0373 0.0527 0.0527 0.370 0.0411229
C4 0.0321 0.0678 0.0408 0.0458 0.0849 0.0314 0.0373 0.0527 0.0527 0.446 0.0495086
C5 0.0160 0.0170 0.1225 0.0153 0.0283 0.0188 0.0249 0.0377 0.0377 0.318 0.0353393
C6 0.1283 0.1356 0.1225 0.1374 0.1415 0.0942 0.0746 0.0879 0.0879 1.010 0.1122095
C7 0.1925 0.1695 0.1633 0.1832 0.1698 0.1884 0.1493 0.1318 0.1318 1.480 0.1643975
C8 0.2567 0.2034 0.2041 0.2290 0.1981 0.2826 0.2985 0.2637 0.2637 2.200 0.2444073
C9 0.2567 0.2034 0.2041 0.2290 0.1981 0.2826 0.2985 0.2637 0.2637 2.200 0.2444073
Total 1 1 1 1 1 1 1 1 1
3.3.3 Consistency Analysis
Consistency analysis involves the calculation of the Consistency Ratio (CR), Consistency Index (CI) while the Random
Index (RI) has already been generated by [22] as shown in Table 9. From the table, RI for this paper for N of nine (9) is
1.46.
Table 9: Random inconsistency indices for n = 10 [23]
N 1 2 3 4 5 6 7 8 9 10
RI 0.00 0.00 0.58 0.9 1.12 1.24 1.32 1.41 1.46 1.49
N = order of Matrix
Equations (3), (4), (5) and (6) were used to calculate the consistency Vector, Consistency Measure, Consistency Index
and Consistency Ratio. In order to calculate CI and CR, the matrix multiplication function was calculated using the
EXCEL (=MMULT()) function where the averages and number of criteria serve as the arrays. Table 10 shows result for
the process.
Table 10: Result of consistency analysis showing CR, CI and RI
C1 C2 . . . . C7 C8 C9 Total Average (MMULT) N
Consistency
Measure
C1 0.06417 . . . . . . . . 0.68098 0.07566 0.869379118 9 9.869379118
C2 0.02139 . . . . 0.29648 0.03294 1.084848531 9 10.08484853
ABUAD Journal of Engineering Research and Development (AJERD) ISSN:
Volume 3, Issue 1
www.ajerd.abuad.edu.ng/ 98
.
C3 0.03209 . . . . . 0.37011 0.04112 1.079044658 9 10.07904466
C4 0.03209 . . . . . 0.44558 0.04951 0.950148397 9 9.950148397
C5 0.01604 . . . . . 0.31805 0.03534 0.938845846 9 9.938845846
C6 0.12834 . . . . . 1.00989 0.11221 0.862793802 9 9.862793802
C7 0.19251 . . . . . 1.47958 0.1644 0.924888443 9 9.924888443
C8 0.25668 . . . . . . . . 2.19967 0.24441 1.074079089 9 10.07407909
C9 0.25668 . . . . . . . . 2.19967 0.24441 1.074079089 9 10.07407909
Total 1 1 1 1 1 CI 0.123029264
RI 1.46
CR (CI/RI) 0.084266619
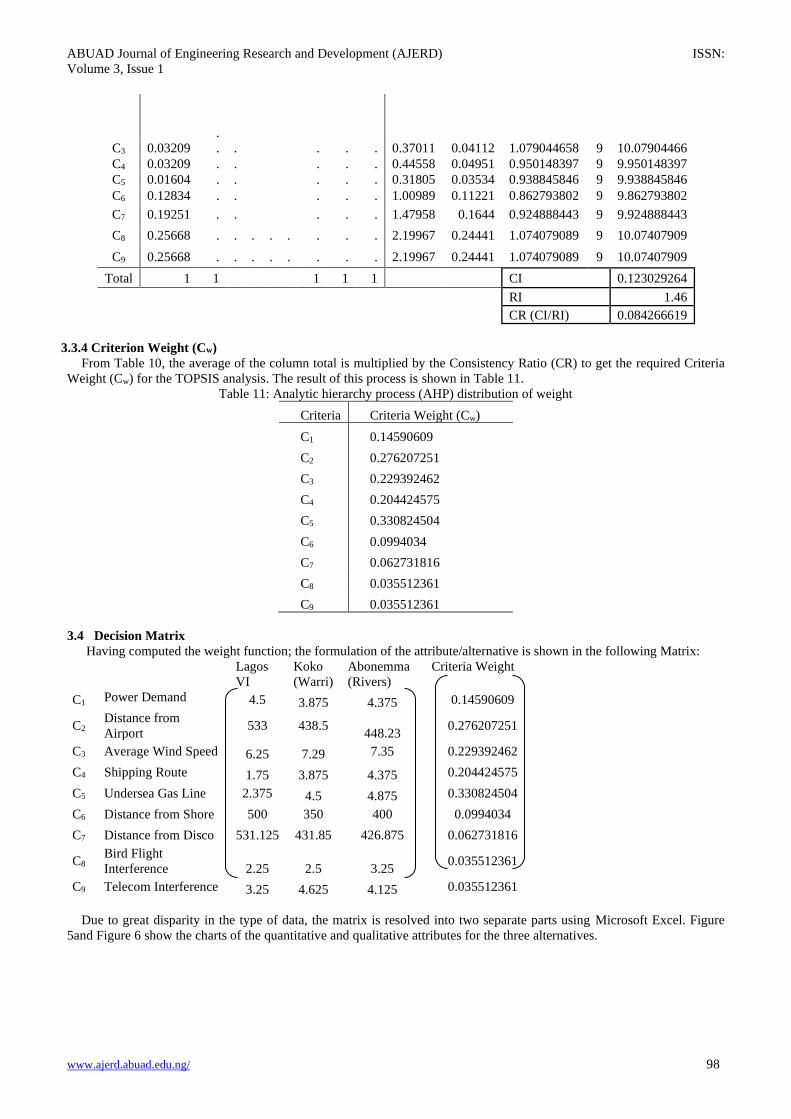
3.3.4 Criterion Weight (Cw)
From Table 10, the average of the column total is multiplied by the Consistency Ratio (CR) to get the required Criteria
Weight (Cw) for the TOPSIS analysis. The result of this process is shown in Table 11.
Table 11: Analytic hierarchy process (AHP) distribution of weight
Criteria Criteria Weight (Cw)
C1 0.14590609
C2 0.276207251
C3 0.229392462
C4 0.204424575
C5 0.330824504
C6 0.0994034
C7 0.062731816
C8 0.035512361
C9 0.035512361
3.4 Decision Matrix
Having computed the weight function; the formulation of the attribute/alternative is shown in the following Matrix:
Lagos
VI
Koko
(Warri)
Abonemma
(Rivers)
Criteria Weight
C1 Power Demand 4.5 3.875 4.375 0.14590609
C2 Distance from
Airport 533 438.5
448.23 0.276207251
C3 Average Wind Speed 6.25 7.29 7.35 0.229392462
C4 Shipping Route 1.75 3.875 4.375 0.204424575
C5 Undersea Gas Line 2.375 4.5 4.875 0.330824504
C6 Distance from Shore 500 350 400 0.0994034
C7 Distance from Disco 531.125 431.85 426.875 0.062731816
C8 Bird Flight
Interference 2.25 2.5 3.25 0.035512361
C9 Telecom Interference 3.25 4.625 4.125 0.035512361
Due to great disparity in the type of data, the matrix is resolved into two separate parts using Microsoft Excel. Figure
5and Figure 6 show the charts of the quantitative and qualitative attributes for the three alternatives.
ABUAD Journal of Engineering Research and Development (AJERD) ISSN:
Volume 3, Issue 1
www.ajerd.abuad.edu.ng/ 99
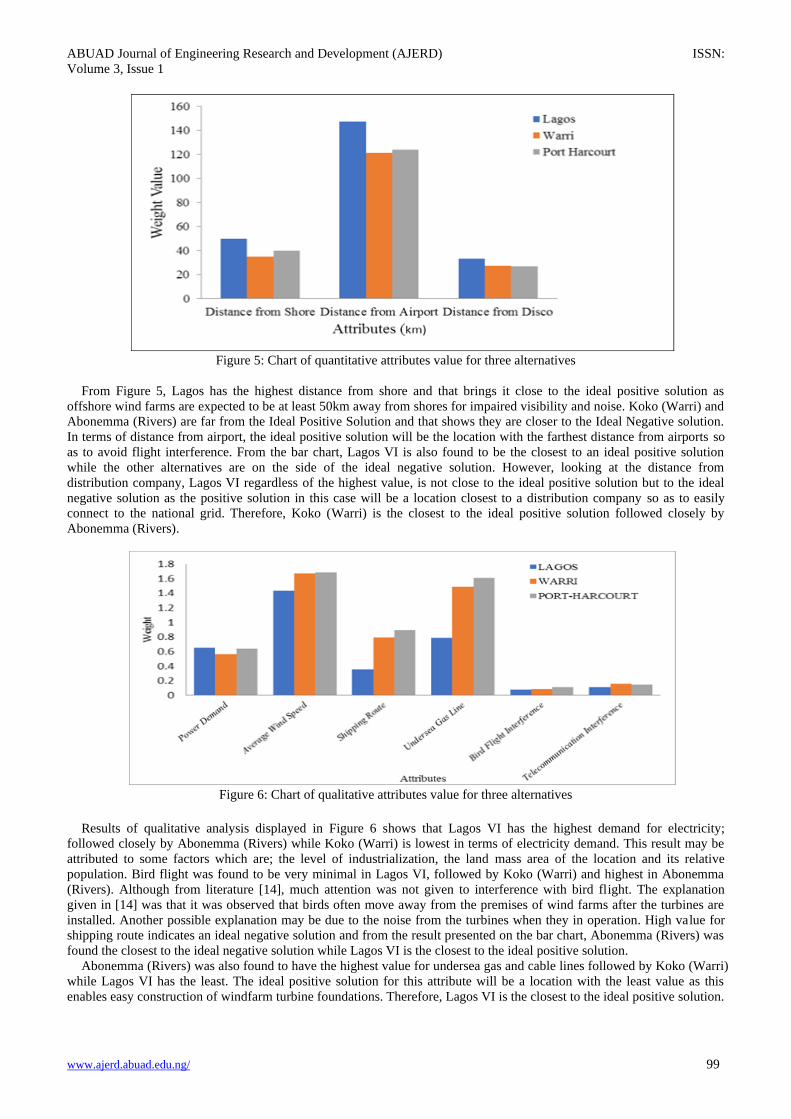
Figure 5: Chart of quantitative attributes value for three alternatives
From Figure 5, Lagos has the highest distance from shore and that brings it close to the ideal positive solution as
offshore wind farms are expected to be at least 50km away from shores for impaired visibility and noise. Koko (Warri) and
Abonemma (Rivers) are far from the Ideal Positive Solution and that shows they are closer to the Ideal Negative solution.
In terms of distance from airport, the ideal positive solution will be the location with the farthest distance from airports so
as to avoid flight interference. From the bar chart, Lagos VI is also found to be the closest to an ideal positive solution
while the other alternatives are on the side of the ideal negative solution. However, looking at the distance from
distribution company, Lagos VI regardless of the highest value, is not close to the ideal positive solution but to the ideal
negative solution as the positive solution in this case will be a location closest to a distribution company so as to easily
connect to the national grid. Therefore, Koko (Warri) is the closest to the ideal positive solution followed closely by
Abonemma (Rivers).
Figure 6: Chart of qualitative attributes value for three alternatives
Results of qualitative analysis displayed in Figure 6 shows that Lagos VI has the highest demand for electricity;
followed closely by Abonemma (Rivers) while Koko (Warri) is lowest in terms of electricity demand. This result may be
attributed to some factors which are; the level of industrialization, the land mass area of the location and its relative
population. Bird flight was found to be very minimal in Lagos VI, followed by Koko (Warri) and highest in Abonemma
(Rivers). Although from literature [14], much attention was not given to interference with bird flight. The explanation
given in [14] was that it was observed that birds often move away from the premises of wind farms after the turbines are
installed. Another possible explanation may be due to the noise from the turbines when they in operation. High value for
shipping route indicates an ideal negative solution and from the result presented on the bar chart, Abonemma (Rivers) was
found the closest to the ideal negative solution while Lagos VI is the closest to the ideal positive solution.
Abonemma (Rivers) was also found to have the highest value for undersea gas and cable lines followed by Koko (Warri)
while Lagos VI has the least. The ideal positive solution for this attribute will be a location with the least value as this
enables easy construction of windfarm turbine foundations. Therefore, Lagos VI is the closest to the ideal positive solution.
ABUAD Journal of Engineering Research and Development (AJERD) ISSN:
Volume 3, Issue 1
www.ajerd.abuad.edu.ng/ 100
Lastly, for telecommunication installations in the three alternatives, a low value here indicates a Positive ideal solution and
Lagos VI has the least value and this implies that it is the closest to the positive ideal situation.
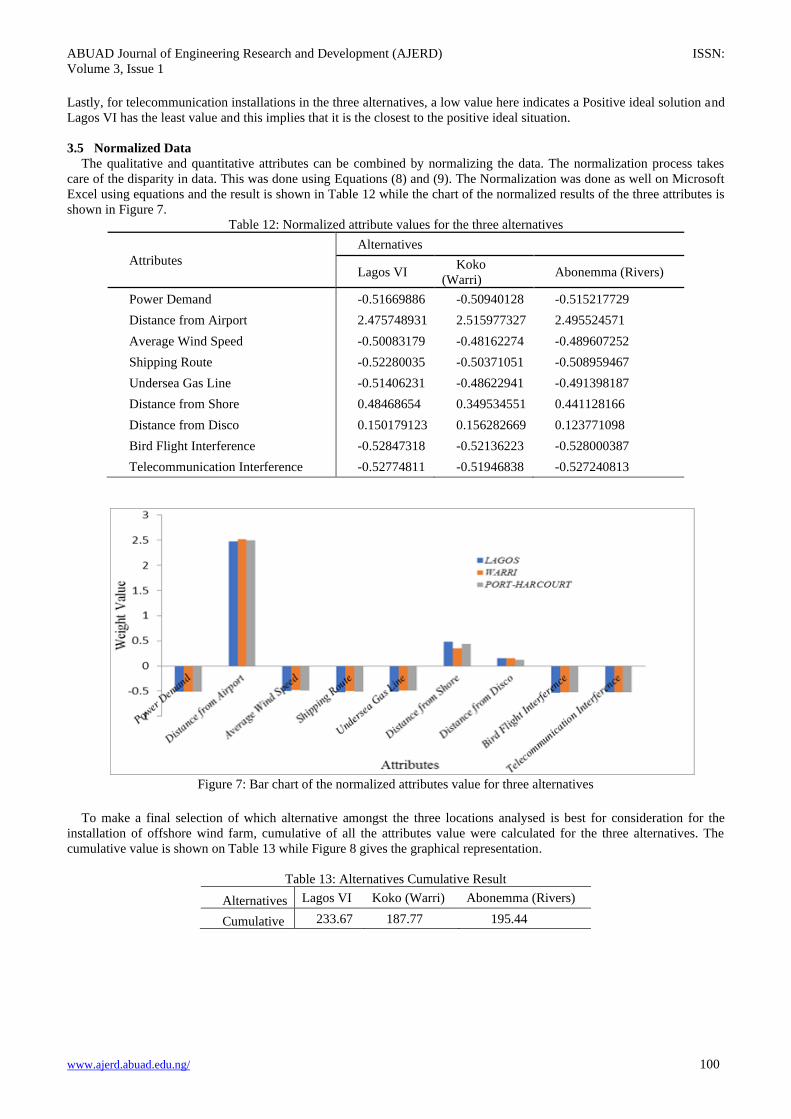
3.5 Normalized Data
The qualitative and quantitative attributes can be combined by normalizing the data. The normalization process takes
care of the disparity in data. This was done using Equations (8) and (9). The Normalization was done as well on Microsoft
Excel using equations and the result is shown in Table 12 while the chart of the normalized results of the three attributes is
shown in Figure 7.
Table 12: Normalized attribute values for the three alternatives
Attributes
Alternatives
Lagos VI Koko
(Warri) Abonemma (Rivers)
Power Demand -0.51669886 -0.50940128 -0.515217729
Distance from Airport 2.475748931 2.515977327 2.495524571
Average Wind Speed -0.50083179 -0.48162274 -0.489607252
Shipping Route -0.52280035 -0.50371051 -0.508959467
Undersea Gas Line -0.51406231 -0.48622941 -0.491398187
Distance from Shore 0.48468654 0.349534551 0.441128166
Distance from Disco 0.150179123 0.156282669 0.123771098
Bird Flight Interference -0.52847318 -0.52136223 -0.528000387
Telecommunication Interference -0.52774811 -0.51946838 -0.527240813
Figure 7: Bar chart of the normalized attributes value for three alternatives
To make a final selection of which alternative amongst the three locations analysed is best for consideration for the
installation of offshore wind farm, cumulative of all the attributes value were calculated for the three alternatives. The
cumulative value is shown on Table 13 while Figure 8 gives the graphical representation.
Table 13: Alternatives Cumulative Result
Alternatives Lagos VI Koko (Warri) Abonemma (Rivers)
Cumulative 233.67 187.77 195.44

ABUAD Journal of Engineering Research and Development (AJERD) ISSN:
Volume 3, Issue 1
www.ajerd.abuad.edu.ng/ 101
Figure 8: Cumulate Decision Pie Chart
Figure 8 shows that Lagos has the highest consideration rate of 38% followed by Port-Harcourt with 32% and lastly
Warri with 30%.
4. CONCLUSION
Multi-Criteria evaluation procedure was applied to evaluate the viability of three offshore locations in Nigeria as
potential sites for windfarms. Attributes for the locations; Victoria Island (Lagos), Koko (Warri) and Abonnema (Port-
Harcourt) were evaluated using multi-criteria analysis tool (TOPSIS), which has shown to be a reliable method. The
outcome of the study showed that the three locations present good wind profile. This was shown by the 10-years average
wind speeds, which were 6.25m/s, 7.29m/s and 7.347m/s for Victoria Island, Koko (Warri) and Abonnema (Port-Harcourt)
respectively. The application of analytical hierarchy process (AHP) gave a normalized column total of 1, consistency index
of 0.123029264 and consistency Ratio of 0.084266619 which is in accordance with Saaty[22] recommendations. The
TOPSIS gave the highest consideration rate for Victoria Island; which may therefore be considered as the best location for
the installation of offshore wind farm facilities.
ACKNOWLEDGMENT
The Authors wish to acknowledge the Nigerian Metrological Agency, Oshodi Lagos for providing the wind data for the
three locations that were considered.
REFERENCES
[1] Global Wind Energy Council. Global wind report annual market updates. [Online]. (2011). Available:
http://www.gwec.net/.
[2] Jaramilo, O. A. & Borja, M. A. (2004). Wind Speed Analysis in La Ventosa, Mexico; a Bimodal Probability
Distribution Case, Renewable Energy, 29(10), 1613-1630.
[3] Chinedum, O., Chinekerem, C., & Anthony, E. (2013). A Logistics Analysis of Nigeria’s Offshore Windfarm
Sector, International Journal of Research in Social Sciences, 4(4), 88-91.
[4] Gregg, K. L. (2015). Multi-criteria Analysis of Offshore Wind Energy Site Selection in North Carolina, MSc
Thesis, East Carolina University, United States.
[5] Snyder, B. & Kaiser, M. J. (2009). A Comparison of Offshore Wind Power Development in Europe and the U.S.:
Patterns and drivers of development, Applied Energy, 86(10), 1845-1856.
[6] Iwayemi, A. (2008). Nigeria’s dual energy problems: Policy issues and challenges, International Association for
energy economics, Fourth Quarter. [Online]. Available: www.iaee.org/en/publications/newsletterdl.aspx? id=53,
17–21.
[7] Bilgili, M., Yasar, A. & Simsek, E. (2011). Offshore Wind Power Development in Europe and its Comparison
with Onshore Counterpart, Renewable and Sustainable Energy Reviews, 15(2), 905-915.
[8] Weistroffer, H. R., Smith, C. H. & Narula, S. C. (2005). Multiple Criteria Decision Support Software, Chapter 24
in: Figueira, J., Greco, S., and Ehrgott, M., Eds. Multiple Criteria Decision Analysis: State of the Art Surveys
Series, Springer, New York.
[9] Madurika, H. K. G. M. & Hemakumara, G. P. T. S. (2015). GIS Based Analysis for Suitability Location Finding
in the Residential Development Areas of Greater Matara Region, International Journal of Scientific and
Technology Research, 4(8), 96-105.
[10] Mardani, A., Jusoh, A. & Zavadskas, E. K. (2015). Fuzzy Multiple Criteria Decision-making Techniques and
Applications – Two Decades’ Review from 1994 to 2014, Expert Systems with Applications, 42(8), 4126–4148.
[11] Behzadian, M., Khanmohammadi, S. O., Morteza, Y. & Joshua, I. (2012). A state of the Art Survey of TOPSIS
Application, Expert System with Application, 39, 13051-13069.
ABUAD Journal of Engineering Research and Development (AJERD) ISSN:
Volume 3, Issue 1
www.ajerd.abuad.edu.ng/ 102
[12] Biswal, G. C. & Shukla, S. P. (2015). Site Selection for Wind Farm Installation, International Journal of Innovative
Research in Electrical Electronics, Instrumentation and Control Engineering, 2(8), 59-61.
[13] Richard E. H., (2013). Multi-criteria Decision-making in Whole Process Design, PhD Thesis, Newcastle University,
United Kingdom.
[14] Michal, S., Jan, B. & Anna, N. (2014). GIS-Based Method for Wind Farm Location: Multi-criteria Analysis,
Mining Science, 21, 65 – 81.
[15] Mukasa, A. D., Mutambatsere, E., Arvanitis, Y. & Triki, T. (2013). Development of Wind Energy in Africa:
Working Paper for African Development Bank Group, 170.
[16] Shih, H. S., Shyur, H. J. & Lee, E. S. (2007). An Extention of TOPSIS for Group Decision Making, Mathematical
and Computer Modelling Journal, 45(7), 801-813.
[17] Garba, A. D. & Al-Amin, M. (2014). Assessment of Wind Energy Alternative in Nigeria from the Lesson of the
Kastina Wind Farm, Civil and Environmental Research Journal, 6(4), 91-94.
[18] Felix, A. A., Akinbulire, T. O., Abdulkareem, A. & Awospo, C. O. (2010). Wind Energy Potential in Nigeria,
International Electrical Engineering Journal (IEEJ), 3(1), 595-601.
[19] O. O. Ajayi (2010). The Potential for Wind Energy in Nigeria, Wind Engineering, 34(3), 303–312.
[20] Medugu, D.W. & Malgwi, D.I. (2005). A study of Wind Energy Potential: Remedy for Fluctuation of Electric
Power in Mubi, Adamawa State, Nigeria, Nigerian Journal of Physics, 17(1), 40-45.
[21] Deng H., Yeh C. & Willis R. J. (2000). Inter-company Comparison Using Modified TOPSIS with Objective
Weights, Computers & Operations Research, 27(10), 963-973.
[22] Saaty, T. L. (1980). The Analytical Hierarchy Process, 2nd ed., McGraw Hill, New York.