assessment of the parameters of a mechanistic soil-crop
TRANSCRIPT

Agricultural water management
ELSEVIER Agricultural Water Management 51 (2001) 53-78 www.elsevier.comllocate/agwat
Assessment of the parameters of a mechanistic soil-crop-nitrogen simulation model using historic
data of experimental field sites in Belgium s. Ducheyne":", N. Schadeck", L. Vanongeval",
H. Vandendriessche", J. Feyen" "Institute for Land and Water Management, Katholieke Universiteit Leuven,
Vital Decosterstraat' 102, B-3000 Leuven, Belgium "Bodemkundige Dienst vall Belgie, W. de Croylaan 48, B-3001 Heverlee, Belgium
Accepted 5 October 2000
Abstract
Intensification of the agricultural sector and the increase in quantity and decrease in quality of municipal and industrial wastewater, in particular during the past decades, resulted in many industrial countries, such as Belgium. in a sharp degradation of surface water and groundwater. To control the current degree of contamination and reduce the environmental impact of the agricultural sector, the Flemish government recently introduced a number of regulations aiming at controlling the use of nitrogen fertilisers. To facilitate the implementation and the control of the new regulations, threshold values of allowable doses of organic and inorganic nitrogen fertilisers, and their spreading in time were made soil independent. As the soil physical, chemical and biological response depends on the geohydrology of the site and the past fertilisation practice, fertiliser standards applied on different soil-crop systems result in different leaching patterns. To assess the effect of the soil on the nitrogen leaching, a number of past experimental field trials
were analysed using the WAVE model as modelling tool for the reconstruction of the nitrogen dynamics. As a first step in the study. the historic data of the field experiments were used to calibrate and validate the WAVE model. The deterministic calibration and validation of the WAVE model yielded a set of model parameters for the examined soil-crop-fertiliser practice conditions. The bottlenecks in the calibration were the nitrogen mineralisation parameters and the initialisation and subdivision of the soil organic matter over the different organic pools. The model validation, being the second step in the study, revealed the power of the WAVE model to predict the evolution and transformations of nitrogen in the soil profile and the leaching of nitrate at the bottom of the root zone. In a third step, the WAVE model was used in a scenario-analysis exercise to examine the factors effecting the amount of nitrate leached at the bottom of the root zone. This analysis revealed
• Corresponding author. Tel.: -'-32- I 6-32972 I: fax: +32- I 6-329760. E-mail address:[email protected] (S. Ducheyne).
0378-3774/01/$ - see front matter (. 2001 Elsevier Science B.V. All rights reserved. PI!: S03 78-3 774(00 )00 I 40-2

54 S. Ducheyne et al.l Agricultural Water Management 51 (2001) 53-78
that the nitrate leached out of the soil profile is controlled by the fertiliser practice, the rainfall depth and its distribution, the soil texture. the soil mineralisation capacity and the past fertilisation practice. ':&J 2001 Elsevier Science B.V. All rights reserved.
Keywords: Soil-crap-nitrogen simulation model; Model parameters; Nitrate leaching; Scenario-analysis
1. Introduction
A critical nitrate threshold value for surface water and groundwater of 50 mg 1-1 (equivalent to 11.3 mg 1-1 NOrN) is imposed by the European community (EC/911676/ EEC) to prevent further contamination of surface water and groundwater bodies in European countries. For its implementation, the Flemish government recently introduced several regulations, MAP-I (1995) and MAP-2 (2000), respectively. The discussions by the Flemish government on the measures to be taken are not concluded yet. In order to facilitate the implementation of policies and their control, threshold values of the maximum allowable doses of organic and inorganic nitrogen fertilisers, and their spreading in time, were made soil independent. However, it is well-known that soils show different leaching patterns due to differences in the physical. chemical and biological behaviour and fertiliser history (Verhagen and Bouma, 1998). The effect of fertiliser practice on the environment can be studied either entirely
through field experimentation or through the use of physical based simulation models in combination with field data t Follet and Wieringa, 1995). Mechanistic models are very powerful tools allowing to reproduce real systems as they are based on physical, chemical and biological laws. However, some of the model parameters can be difficult to measure and require that the model has to be calibrated before the model can be used in a predictive mode. The WAVE model, being a soil-crop-nitrogen model. was used to reconstruct the soil
crop-nitrogen dynamics in a number of past field experiments in Belgium. The overall goal of the exercise was to examine the potential impact of the fertiliser measures taken by the Flemish government. The foregoing was realised performing a scenario-analysis for different soil-crop-fertiliser practices for a time period of 30 consecutive years. The period of analysis was taken sufficiently long to make sure that all climate variations of the region were covered. Prior to the scenario-analysis, the WAVE model was subjected to a deterministic calibration and validation procedure (Ducheyne et aI., 1998a) with the objective of generating for the different experimental field sites for which data were available, the set of model parameters that results in the best fit between observed and simulated system variables.
2. Materials and methods
2.1. Site description and available field data
Historic field data from field experiments, situated in different agricultural regions in Belgium, were used in this study to calibrate the WAVE model. The field experiments
S. Ducheyne et al.l Agricultural Water Management 51 (2001) 53-78 55
were situated in the following regions: (i) the Kempen (sandy soils), (ii) the sandy loamy region, (iii) the loamy region, and (iv) the polders (heavy clay soils with shallow water table). The soil in Helecine (Anoniem, 1982, 1983, 1984, 1985) was classified as an AbaO (well drained loamy soil with a textural B-horizon starting at a depth of more than 40 ern (Belgian Soil Classification System); Haplic Luvisol (World Reference Base, 1998). The soil in Gembloux (Gego, 1993) was classified as an Aba(b) (well drained loamy soil with spotted textural B-horizon; Haplic Luvisol) or as an AdpO (deep, moderately gleyic soils on loam; Eutric Regosol). The soil in Geel, cultivated with maize, was classified as a Zdg (moderately wet sandy soil with distinct humus and/or iron B-horizon; Haplic Podzol). The grassland soil in Geel was classified as a Zeg (wet sandy soil with distinct humus and/or iron B-horizon; Gleyic Podzol). The soil in Houthave is a heavy clay soil, grey at a depth of more than 60 ern, overlaying a clay layer of the Duinkerke, I transgression (Eutric Fluvisol). The soil in Kaggevinne is classified as a wScf (moderately dry loamy sand with a weak humus and/or iron B-horizon and a clay sand substrate starting at small depth; Cambic Podzol). For further details about the fields in Geel, Houthave and Kaggevinne is referred to Coppens and Vanongeval (1998). The crops cultivated during the field trials were sugar beet, winter wheat, winter barley, maize, potato and mowed grassland. Both chemical and organic fertilisers (pig and cow slurry) were used. An overview of the characteristics of the field sites used in the calibration and validation exercise is given in Table 1.
Soil physical properties were measured on each field for each distinguishable soil horizon on undisturbed soil samples (Kopecky rings, 100 crrr', 5 em height, 5.1 em diameter) or reconstructed by using the pedotransfer functions of Vereecken (1988). The water retention curve was measured with the water table method and the low and high pressure cell method (Klute, 1986). The hydraulic conductivity curve was measured with the multi-step outflow method (van Dam et al., 1994). The water flow was described with the Richards equation. van Genuchten-Mualem parameters, for describing the hydraulic functions (van Genuchten and Nielsen, 1985), were fitted on both retention and outflow data, using the multi-step outflow program (van Dam et al., 1990). Basic water retention and hydraulic conductivity curves, to be used as input in the simulation model, were established by averaging individual curves for each soil layer. In addition, the soil texture was measured for each soil horizon.
The fields were intensively monitored during the experimental periods. Soil samples were taken at different depths for mineral nitrogen measurements. Mineral nitrogen was also measured in the groundwater where possible. Every year, a standard analysis of the soil was done which included measurements of pH-KCl, % C and Kjeldahl-N. The composition of the slurry (pH, dry weight, organic matter, total nitrogen and mineral nitrogen) was measured for every application. Besides crop dry yield, Kjeldahl-N and nitrate content of the crop were measured.
2.2. Model description
The WAVE model (water and agrochemicals in the soil, crop and vadose environment; VancIooster et al., 1994; Vanclooster et al., 1996) is a process-based, deterministic, mathematical model simulating the movement of water and the transfer and fate of

Table I Overview of the characteristics of the historic field sites
Ul 0'>
Groundwater level (em)
Y>
i? s .!!I ..;:
" ~ '" :-
i t Location Soil texture Experimental period
Helecine Silt 1982-1985 Gembloux Silt 1984-1986 Geel Sand 1993-1996 Geel Sand 1993-1996 Houthave Clay 1991-1992 Kaggevinne Loamy sand 1988-1994
Crop Fertilisation
Sugar beet Winter wheat Maize-maize-fallow Grassland Maize-winter wheat Sugar beet-winter wheat (burleyj-potato
Chemical Chemical Pig slurry Cow slurry - chemical Pig slurry - chemical Chemical - pig slurry
Deep (>200) Deep (>300) Superficial (115-160) Very superficial (40-120) Superficial (110-300) Deep
~ " '"
~ ~ :::: a "" •.... ~ :5 .::: ~ O;l

S. Ducheyne et al.! Agricultural Warer Management 5] (200]) 53-78 57
agrochemicals in the soil-crop continuum. The model describes the one-dimensional transport of matter and energy in agricultural soils. The modules currently available in the WAVE model simulate the following soil processes: the energy balance, the flow of water, the transport of non-reactive and reactive solutes, and the movement and transformations of nitrogen. In addition, the WAVE model simulates crop growth for several field crops. The model distinguishes different soil horizons that are divided in soil compartments with equal thickness. Flow equations are implemented which are solved numerically using finite difference schemes. Water movement is described using the Richards equation driven by parametric models for the water retention characteristic and the hydraulic conductivity curve. Solute transport is modelled with a non-equilibrium two-site/ two-region convection dispersion model. Heat flow is based on Fourier's heat flux law. For the description of the mineral nitrogen transformation processes, first-order kinetics are used. The soil organic pool is subdivided into three sub-pools (the litter, manure and humus pool) and the transfer between these sub-pools is controlled by first-order rate constants. The rate constants depend on temperature and soil water content. Crop growth is simulated using a universal crop growth model. The crop growth is reduced when water and/or nitrogen is limited in the root zone. In Table 2, an overview is given of the modules and model concepts in the WAVE model and the most important model parameters. The WAVE model is an updated version of the SWATNIT model (Vereecken et al.,
1990), that integrates the SWATRER model (Feddes et al., 1978; Belmans et al., 1983; Dierckx et al., 1986), a nitrogen model based on the SOILN model (Bergstrom et al., 1991), a heat and solute transport model based on LEACHN (Wagenet and Hutson, 1989) and the crop growth model SUCROS (van Keulen et al., 1982; Spitters et al., 1988).
2.3. Simulation procedure
The model was calibrated and validated for the field sites listed in Table 1. The calibration and validation was done according to a systematic calibration and validation
Table 2 Overview of the modules and model concepts in the WAVE model and the most important model parameters
Module Model concept Model parameters
Water Richards' equation, root water extraction function
Solute Convection-dispersion equation. chemical diffusion, linear adsoption, first-order decay Fourier's heat flow equation Heat
Nitrogen Transformations (first-order nitrification, denitrification. hydrolysis). mineralisation and immobilisation out of organic pool (correction in function of temperature and moisture content) Dry weight development. nitrogen uptake (reduction in function of water and nitrogen availability)
Crop
Moisture retention curve. hydraulic conductivity curve. crop coefficient, crop uptake factor. rooting depth Dispersion coefficient. diffusion coefficient, adsorption coefficient. decay rates Thermal conductivity. thermal capacity function Nitrogen transformation parameters. organic matter decay rates
Specific crop parameters

58 S. Ducheyne et al.r Agricultnral Water Management 51 (2001) 53-78
method described by Ducheyne et al. (1998a) and Ducheyne (2000). Based on model sensitivity studies and model expertise, the more sensitive soil hydraulic parameters and crop parameters were calibrated in a first step by 'trial and error' (Loague and Green, 1991). For this step data from field plots with optimal nitrogen fertiliser application were used. In a next step, the soil nitrogen parameters were calibrated by 'trial and error' for which data of field plots with variable nitrogen fertiliser applications were used. After each calibration step, a validation was performed on a part of the data set that was not yet used for the calibration ('split sample technique', Loague and Green, 1991). For the 'split sample', a part of the data set divided in time could be used, or a data set of a field plot with a fertiliser level application that was not used in the calibration. The systematic calibration-validation procedure results in a set of model parameters representative for the soil-crop conditions used. Spatial variability on the field was incorporated in the averaged or 'lumped' model parameters by assuming that these parameters were representative for the whole field. A stochastic simulation approach could take this spatial variability into account (Ducheyne et al., 2000). After having calibrated and validated the model, a scenario-analysis was performed to assess the effect of the government imposed fertiliser regulation with respect to nitrate leaching at the bottom of the root zone. The scenario-analysis was conducted for a weather period of 30 years and different soil-crop conditions.
3. Results and discussion
3.1. Calibration of the model parameters
van Genuchten-Mualem parameters (van Genuchten and Nielsen, 1985) were fitted on the measured water retention and hydraulic conductivity data. The Gardner parameters (Gardner, 1958) were generated from the pedotransfer functions of Vereecken (1988). The most sensitive soil hydraulic parameters such as the saturated hydraulic conductivity, Ksato and the A parameter of the van Genuchten-Mualem relation had to be calibrated for the system under study. The measured and calibrated soil hydraulic parameters are given in Tables 3 and 4. For the fields with deep groundwater table, a free drainage bottom boundary condition was assumed, whereas for the other fields, the position of the water table was given as bottom boundary of the soil profile. The crop parameters used in this study can be found in Ducheyne et al. (1998b). After the calibration of the soil hydraulic parameters and crop parameters, the
nitrogen parameters were calibrated. The nitrogen parameters can also be measured (e.g. Droogers and Bouma, 1997) but was not done in this study. For the fields with data of a fallow field plot, these data were used to calibrate the soil nitrogen transformation and mineralisation parameters. Subsequently, the data of the cultivated field plots with (or without) fertilisation, were used to validate or recalibrate the nitrogen parameters. At the end of the calibration and validation procedure, the soil nitrogen transformation and mineralisation parameters were constant for each field, whatever was the fertilisation level. The volatilisation of NH4-N in case of slurry application, was taken into account by subtracting the amount of volatised nitrogen from the input of NH4-N. The decay

S. Duclieyne et al.! Agricultural Water Management 51 (2001) 53-78 59
Table 3 Summary list of the measured and calibrated soil hydraulic parameters of the fields"
Soil van Genuchten" layer (em) e; fls e! Il III
Helecine: silt 0-30 0.1 0.45 0.001 0.8 1.2 30-60 0.11 0.4 0.002 0.8 1.1 60-90 0.14 0.4 0.001 0.8 90-140 0.14 0.4 0.001 0.8 140-200 0.14 0.4 0.001 0.8
Gembloux: silt. colluvium. valley 0-25 0.1 0.425 (0.402) 0.014 1.326 0.246 25-50 0.1 0.446 (0.419) 0.0142 1.228 0.186 50-80 0.1 0.435 (0.39) 0.0098 1.169 0.145 80-200 0.1 0.428 (0.39) 0.013 1.151 0.131
Gembloux: silt. colluvium 0-25 0.1 0.438 (0.423) 0.0157 1.344 0.256 25-50 0.1 0.439 (0.409) 0.0099 1.307 0.235 50-80 0.1 0.434 (0.412) 0.022 1.188 0.159 80-200 0.1 0.433 (0.416) 0.032 1.18 0.153
Gembloux: silt. plateau 0-25 0.1 0.428 (0.395) 0.0032 1.672 0.402 25-50 0.1 0.42 (0.385) 0.0046 1.369 0.27 50-80 0.1 0.42 (0.405) 0.0027 1.574 0.365 80-200 0.1 0.418 (0.391) 0.0008 1.881 0.468
Geel: maize. sand 0-35 0.055 0.48 0.016 1.574 0.365 35-50 0.019 0.43 0.028 1.686 0.407 50-100 0.011 0.42 0.032 1.85 0.459 100-200 0.017 0.42 0.019 1.804 0.446
Geel: grassland. sand 0-15 0.043 0.44 0.009 1.644 0.392 15-50 0.009 0.41 0.048 1.456 0.313 50-90 0.008 0.39 0.026 1.637 0.389 90-200 0.008 0.45 0.016 1.53 0.346
Houthave: clay (polders) 0-30 0.24 0.46 0.0007 0.57 30-70 0.24 0.47 0.001 0.54 70-100 0.2 0.45 0.00136 0.59 100-350 0.13 0.41 0.00268 0.73
Kaggevinne: loamy sand 0-30 0.Ql5 0.43 0.006 1.606 0.377 30-60 0.081 0.43 0.004 1.828 0.453 60-150 0.151 0.38 0.008 1.328 0.247
n Calibrated parameter values bold and italic; initial parameter values between brackets; Gardner band 11 generated from the pedotransfer functions of Vereeeken (1988) Houthave all parameters generated from the pedotransfer functions of Vereecken (1988).
b fls and flr: saturated and residual moisture content; z, 11 and Ill: shape parameters of the van Genuchten relation; Ksat: saturated hydraulic conductivity; i.: shape parameter of the van Genuchten-Mualern relation; band n: shape parameters of the Gardner relation.
rates of the organic pools in the WAVE model are very sensitive parameters. The decay rate of the manure pool was calibrated so that yearly 40-50% of the manure nitrogen was released from the organic pool. The decay rate of the litter pool was set in such a way that the total amount of litter nitrogen was released in 1 year. The decay rate of the humus

0\ Table 4 0
Summary list of the measured and calibrated soil hydraulic parameters of the fields"
Soil layer (ern) Gardner (G) or Mualem (M)h Soil texture (%)e %Ce
Ksa' (G. M) A (M) b (G) /leG) Clay Silt Sand (em per day)
!"l Helecine: silt 0-30 270 1.59 1.66 II 76 13 1.4 \:::J
30-60 28 0.79 1.66 II 77 12 0.5 ;;; ;::,.
60-90 27 0.2 1.63 12 78 10 0.3 .~ .. 90-140 10 0.3 1.48 20 75 5 '" 140-200 3 0.27 1.48 20 75 5 ~
::, :- Gembloux: silt. colluvium. valley 0-25 12.624 4.8 18 67 15 0.97 ;::
25-50 47.04 8.4 22 20 58 "" 50-80 6.72 1.38 23 22 56
~. 80-200 122.5 5.4 21 57 22 ~
~ Gembloux: silt, colluvium 0-25 76.1 5.3 16 78 6 0.97 ~
25-50 6.2 3.69 21 74 5 ~ ... 50-80 66.2 1.79 24 72 4
~ 80-200 200.1 7.78 20 75 5 ~ !!:
Gembloux: silt, plateau 0-25 3.12 (0.312) 2.9 19 68 13 0.97 ~ 25-50 3.12 (0.312) 0.8 25 69 6 v, ._ 50-80 2.9 (0.29) 10.2 24 68 9 ~ 80-200 10 (0.024) 19.77 22 73 6 c::::.
c::::. ~ ~
Geel: maize, sand 0-35 50.47 (2.47) 2.031 2 5 93 2.9 I (;;J
35-50 18.6 4.041 7 16 77 2.1 50-100 15.55 3.314 2 3 95 0.8 100-200 13.15 4.007 2 3 95 0.4
Geel: grassland, sand 0-15 50.36 (0.36) 2.85 (0.85) 3 7 89 3.1 15-50 32.34 (16.34) 2.099 2 5 94 2.3 50-90 22.16 (I 1.16) 2.39 I 2 97 0.9

Houthave: clay (polders)
90-200 2.056 (1.056) 3.098 2 2 96 0.4
0-30 23.4 2.9 1.35 37 42 21 1.6 30-70 44.9 4.2 1.32 42 41 16 0.9 70-100 31.1 2.24 1.37 35 40 25 0.6 100-350 14.9 0.68 1.53 22 30 48 0.5
0-30 12.09 (20.9) 3.52 (13.52) 8 32 60 1.1 30-60 2.04 4.2 (14.2) 13 15 71 0.4 60-150 1.56 4.889 22 24 53 0.1
Kuggevinne: loamy sand
a Calibrated parameter values bold and italic; initial parameter values between brackets; Gardner band Il generated from the pedotransfer functions of Vereecken (1988) Houthave all parameters generated from the pedotransfer functions of Vereecken (1988).
b (is and Or: saturated and residual moisture content; IX, Il and 111: shape parameters of the van Genuchten relation; Ksat: saturated hydraulic conductivity; ).: shape parameter of the van Genuchten-Mualem relation; band Il: shape parameters of the Gardner relation.
c Soil texture (%) and % C was measured for the standard soil layers 0-30, 30-60, 60-90, 90-120 Col.
", \::J
~ ~ ""
" ~ :::, ,..... :;:: l [ ~ " .., ~
t ~ ~ ~ s .::: t:] I 2<l
0\ -

62 S. Ducheyne et al.lAgriclIlmrai Water Management 51 (2001) 53-78
pool was given a very low value as this is the more stable and less degradable soil organic matter. The soil nitrogen transport and transformation parameters for the different fields are given in Table 5. When looking at the absolute values of the minerali sation parameters, it is obvious that the clay soils have the highest mineralisation constants, followed by the silty soils, the loamy sandy soils and the sandy soils. A similar trend in mineralisation potential of soils was measured by Christensen and Olesen (1998). The initial organic carbon and nitrogen content of the soil organic matter, the
subdivision of the organic carbon and nitrogen content in the different pools of the WAVE model (manure, litter, humus) and their respective CIN ratio's are very important issues as they determine the mineralisation and immobilisation between the mineral and organic nitrogen component in the soil. Especially, as the CIN ratio of fresh crop residues is rather elevated (Verdegem, 1989), the CIN ratio of the litter pool causes an immobilisation phase of mineral nitrogen into organic nitrogen after harvest when crop litter is left on the field (Schepers and Mosier, 1991). As this litter pool is almost completely decomposed during 1 year (and the CIN ratio is lowered in the same time), this pool has to be initialised every year. Besides, the long term simulation of the organic matter dynamics in the soil, is not obvious as the mineralisation in the WAVE model is described by first order kinetics. For this reason, the organic pools are initialised every year as a function of the history of fertilisation and crop residues management. The litter pool is initialised every year in the same way. Manure additions, such as slurry, are a combination of different organic components, which do not degrade in the same time and in the same year of application. The amount of manure that is not decomposed during the year of application, can be seen as a more degradable pool for the subsequent year. This fraction of manure is translated into the manure pool in the WAVE model. For the field of Geel with maize, the manure pool was set to a high value of 6% because of the field history of very high slurry applications in the past. When no slurry fertilisation was applied during 2 subsequent years, this manure pool was set at 3%.
3.2. Validation results
3.2.1. Nitrogen in the soil profile The model output variables for which a comparison with measured data was possible
were: (i) the nitrogen content in the soil profile measured at different depths, (ii) the nitrogen content in the groundwater, and (iii) the dry weight yield and nitrogen content of the agricultural crops. The nitrogen transformation dynamics (nitrification, denitrifica tion, etc.) could not be validated directly due to a lack of measurements, but were calculated by the model with respect to a validation by means of comparison between simulated and measured nitrogen content in the soil profile. The evolution of the simulated (after calibration) and the measured NOrN content in the soil profile for some sets of data (some fertilisation plots) for each field is given in Fig. 1. As can be seen in this figure, the WAVE model is able to reproduce the nitrogen evolution in the soil profile quite well. For the field of Geel cultivated with maize, the model results are vel)' good. Only a small underestimation of the NOrN content in the upper soil layers takes place in spring for the fallow plot and the plot with slurry application in autumn. This

Table 5 Summary list of the nitrogen transport and transformation parameters
Field site parameter Helecine Gcmbloux Geel maize Geel Houihave maize Houthave winter wheat Kaggevinne sugar beet winter wheat grassland
Compartment depth (mill) 100 50 511 50 1110 Ion IIKI Layer Layer Layer Layer Layer Layer Layer
f':> NH.J distribution coefficient. I n.9 I 0.9 I 0.9 I 2 I 0.9 I 0.9 I 0.9 t:J k.(ikg-') Pi 2 us 2 0.9 2 0.9 2 2 2 0.9 2 0.9 2 2 :::- 3 0.9 3 0.9 3 2 3 I 3 1.5 3 1.5 3 2 ~
"" 4 0.9 4 n.9 4 2 4 2 4 1.5 4 1.5 1;;
5 n.9 ~ '" :- Chemical diffusion in pure water. nnt (1.01 o.o: n.nl nm o.oi om <, ;...
Dif (l1l1n' per day) "" a coefficient, a um O,[)) 0.01 n.OI 0.01 0.01 O.[)) ::. 2 b coefflcient, h In 10 10 10 In In 10 [ Hydrodynamic dispersivity, ). (nun) 14 14 100 IOU 100 100 100 .,..
CIN of soil biomass, No 10 10 6 8 8 8 10 ;:;: Synthesis efficiency constanl,/c 0.4 0.4 0.4 0.4 0.4 0.4 0.4 !is .... Ilumificntion cocfficiern.ji, 0.2 0.2 0.2 0.2 0.2 0.2 0.2 ~ Average root radius. RORAD (rum) 0.22 0.22 0.22 0.22 0.22 0.22 0.22 5 Average distance between soil solution ()'()OOI 0.0001 0.0001 0.00002 0.0001 0.0001 ()'()OOI oe
and root surface, RDn (nun) ~ Maximum nitrogen uptake. Nllm" 40000 ~
(mgm-:!) '"" Root density at soil surface. 10 •..... N RDENS" (cml-') c:::.
nr com nr com fir com nrcom nr com nr com nr com c:::. .::: Nitrification constant, knil (per day) 2 I 3 I 3 I 3 I I I I I 2 I
~ 3 I (> I (> I (> I 3 I 3 I 3 I (> I 12 I 12 I 12 0.5 (> U.8 (> U.8 (> I Ci<l 9 I 18 I 18 I 18 0.5 9 0.8 9 0.8 9 15 0 30 0 30 I 30 0.1 15 0.8 15 0.8 15 0 20 0 40 0 40 0 40 0 35 0 35 0
Denitrification constant, k.",l, (per day) 2 0.1 3 0.1 3 0.1 3 0.1 I 0.1 I 0.1 2 0.05 3 0.5 (> 0.5 6 0.5 (> 0.5 3 0.05 3 0.05 3 0.1 6 U.UI 12 0.01 12 om 12 0.1 e 0.03 e 0.03 6 0.01
0\ w

Table 5 tContinued i
0\ .p..
Field site parameter Helecine sugar beet
Gemhloux winter wheal
Geel maize Geel grassland
Houthave maize Houthnve winter wheat Kaggevinne
Volatilisation constant. kvnl (per day)
Decay constant from litter pool. kut (per day)
Decay constant from manure pool, kman (per day)
Decay constant from humus pool. khmu (per day)
Initial C/N in manure pool Initial C/N in litter pnol Initial C/N in humus pnol Fraction of total carbon content in manure pool (%)
9 15 20
O.oI 0.1 o o
2 0.05
3 6 9
15 20 2
O.(JS 6 0.012 12 0.012 18 0.012 30 o 40 0.012 3
6 9
15 20 2
0.012 6 0.012 12 0.012 18 0.012 30 o 40 0.(J(J04 3
9 15 20
0.00021 (>
0.00021 18 0.00007 30 o 40
10 (>(J
10 4
18 30 40
0.01 0.1 o o
3 0.05
(J.OS (>
0.012 12 0.012 18 0.012 30 o 40 0.012 3
0.012 6 0.012 12 0.012 18 0.012 3(J o 40 (J.(J004 3
0.00021 6 0.00021 30 0.00007 40 o IU 6(J 10 o 3
18 30 40
O.oI 0.01 o o
3 0.035
0.012 (>
0.006 12 0.006 18 0.006 30 o 40 O.DI 3
0.006 e 0.006 12 0.006 18 0.006 30 o 40 O.(J0(J21 3
(J.00007 (>
0.00007 30 o 40
12 6(J 2(J
13) (> 3
9 15 21
(3) (>
2 2
9 15 21
18 30 40
0.05 O.oI o o
3 0.024
0.006 3 0.006 6 0.006 9 0.006 15 o 35 O.DI
0.006 3 0.006 6 0.006 9 0.006 15 o 35 (J.OO(J15
0.00007 0.00007 6 o 15
35
I(J 5(J 17 ~0.05 2
~0.05 ~0.05 ~(J.05
9 15 35 I 3
0.03 0.03 o 0.25 o 0.06
0.(J6 0.015 0.DI5 0.012 o 0.06
0.06 0.DI5 0.DI5 0.(J12 o O.(J0(J4
0.00021 0.00007 0.00007 o 12 6(J 6 lot II 3
5 3 2 2 II
9 15 35 I 3
0.03 0.03 o 0.25 o 0.06
6 9
15 35
0.06 O.oI5 0.DI5 0.012 o 0.06
3 6 9 15 35
0.06 0'()(5 O.oI5 0.012 o 0.(J(J(J4
3 6 15 35
(J.00021 0.00007 0.00007 o
2
12 60 6 tot II I
5
II
9 15
2
6 9
15
2
6 9 15
2
e 9 15
2
5 10
0.05 o
!'-" t:I 1:; ::- ~ ~ ~ ~ ;;: Do ~. :::
I
o
0.03
0.006 0.006 0.006 o
0.025 ~ " -: 0.(1I2
0.006 0.006 o
~ ~ §
~ ().()(J(J15
0.00007 0.(J(J005 0.00005 o
..." ..... w 8 .::: ~ Ccl 12
60 15 2
2 2

Fraction of total carbon content in liner pool (%)
4 8 3 4 3 2 2 4 2 4 2 2
9 2 9 2 5 4 5 4 5 2 15 I 15 2 8 I 8 I 10 2 21 I 21 I II I II
92 92 3 (93) 90 3 98 2 93 2 95 2 96
9 (95) 92 9 98 5 93 5 95 5 96 15 97 15 98 8 97 8 98 10 96 !"l
21 97 21 99 II 97 II 98 S? ;:; ::::- .~ '" •• ~ '" :- <, ;:t.. OQ :::.
I gj: ~ ....,
~ is OQ
I v. •.... ~ ,,, g .:::: ~ I ;;cJ
Fraction of 100ai carbon content in humus pool (%)
a. v.

66 S. Ducheyne et al.! Agricultural Water Management 51 (2001) 53-78
underestimation can be explained by the fact that in the model, constant decay rates from the organic pools are used. In reality, a flush of mineralisation takes place in the beginning of spring, because of the sudden start of the activity of the microbial biomass. At this very moment, the actual mineralisation rate on the field may be bigger than the decay rate used by the model. For all fields, the prediction of the nitrate content in the deeper layers is good. The remark has to be made that the nitrate concentrations for grassland are smaller than the nitrate concentrations for the other crops. This is due to the very high microbial activity and high nitrate uptake capacity of grassland. The somewhat
Heilicine sugar beets mineral fertilisation
400 N03- N (kg ha-1) 0-30 em
30-60 em
200
Gembloux winter wheat - mineral fertilisation 150 N03-N (kg ha-1)
100 50
158 100
0-15 em
30-45 em
(A)
50 O~~~~--~~~,~
~~~l".::: ... .;;:~~~~ ~~~~~ee~ee~eeeeeee ~~S~~~~§S~~~~§5~~~
Houthave (maize - winter wheat) 120 ton ha-1slurry - autumn - N03- N (kg ha-1) 200
100
o 200
100
o 200
100 o .
200 '
100] ",'," '.:, 90-120 em O~
oO~~~~~~NNNNNNMM a~ ~~?J ~ ~ ~ ~ ~ ia ss ai aJ~ :::::c:: .•....•... ;::;:::.:::::::;::::;::;::;::::::::::;::;::: ~,... •••••••••• ••••• ••••• ('I')
Kaggevinne: 88_sb; 89_ww; 90_wb; 91_sb; 92_ww; 93_po & 94_ww
N03-N (kg ha -1) - mineral fertilisation ~
200~' J\A0-30em 100 , ' ' o . . .. • 200~~0-60em 100 • . .. ... o . • .. 200~0_90cm 100 • . ..... . . o· , .
Fig. 1. Evolution of the simulated (full line) and measured (dots); N03-N content in the soil profile for some plots of the fields in (A) Helecine, Gembloux, Houthave and Kaggevinne and (B) Geel (maize and grassland).

S. Ducheyne et al.lAgriclIiwrai Water Management 51 (2001) 53-78
GEEL (maize) fallow 200~N03'N(kgha.1) em
100 o
200~" 30-60 em 100 .' N'. o '" ., .• ' '. .' 200~ 100 :.... '" 60-90 em
o ••• 2001
90-120 10~~em
5~ 1 ; ~~~~.~~::.~t~~,,~7~~.~m) NNmMOOMOOM~vv~vv~m~mm
~~~~~~~~~~~~~~~~~~~ w~ ~~ ~_ ~
(B)
Geel maize - 120 ton ha-1slurry. spring
400~~03.N(kgha-1) em
200 . o
400~. 30-60 em 200 • • .," ••
o 400~ 60-90 em 200 •
o • •.•.•• 400~ 90-120 em 200 ',.... . o ._ •••. ~. 5°LII'MI!iIl,,?=:em) ONNMMMMMM~vvvvvmmmmm ~~~~~~a~~~~~~~~~~~a ~~---~~----~~----~ ~..... ....,... -- .•..
Fig. 1. (Continued).
67
Geel maize - 30 ton ha-1slurry - autumn N03-N (kg ha-1)
200~'" '. 0-30 em 100 •••• • O' ••••••• •••
200~. 30-60 em 100 '" . . o .,- .... 200~ 60-90 em 100
••••• • co' o· . .. ..... 200~0_120em 100 • . .' o· . . 5~1 ... , .... ".;.r~~~~:.t:~}:~~I!~m)
N~M~OOMOOMv~~vv_mmmmm Ig~~~~~g~~~~~g~~~~~ Geel grassland· 20 ton ha-1slurry
40~N03.N(kgha.1) 2-30em 20 ", • • '. o . 40~~9.-60em 20 •• ' • .. . o ...., 40~0-90em 20 • ••••• • : 48~···1 •• ; ••••••• ".
•••• 90-120 em 20 ••
,',' " o •••• •.• 18 r :>1.. groundw~t;r (~OO em)
-10~MOOMOOOOOO~V¢V~~~~~~mmmmw ~~~~~~~~~~~~~~~~~~~~~~a ~ ..... ;::~s=~s~~s=~
higher nitrate concentrations in the first year of the experiment are due to local nitrogen spots after grazing.
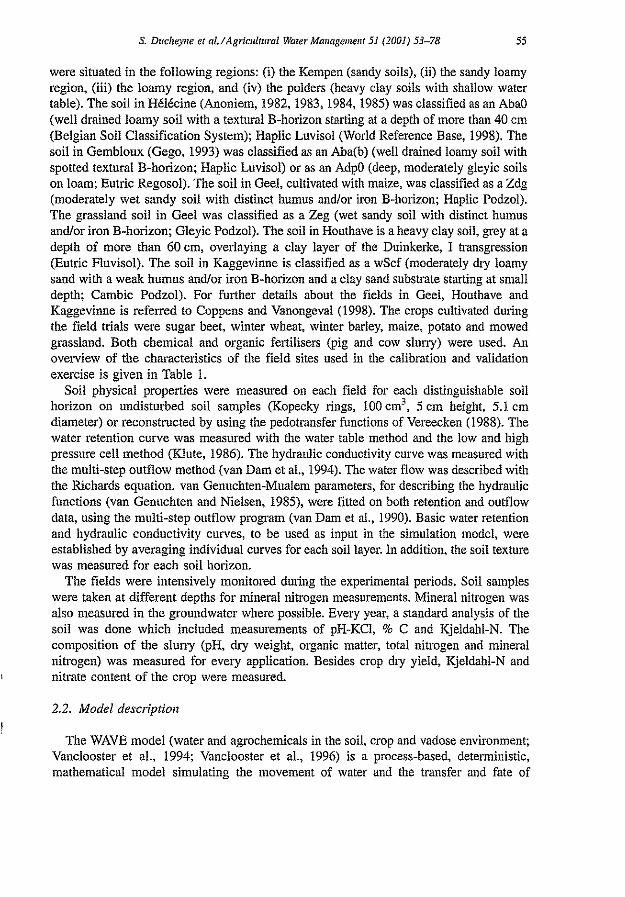
3.2.2. Crop yield and nitrogen uptake Another model performance evaluation was done towards the crop yield and nitrate
uptake by the crop. The measured and simulated winter wheat yield and nitrate uptake by the winter wheat for the field of Gembloux is given as an example in Fig. 2. The prediction of the yield and of the nitrate uptake is good for the fertilised plot (with mineral fertiliser) as for the unfertilised plot. The prediction of the yield and nitrate uptake for the other fields was quite similar.
68 S. Ducheyne et al. / Agricultural Water Management 5] (200]) 53-78
Gembloux winter wheat Gembloux winter wheat not fertilised
Gembloux winter wheat
4
Gembloux winter wheat ]! 300 ,- __ _..:.;fe:;,:rt..:.:I""is:,:e:,::d:..,_ __ --, ~ 250 ';' 200 7il 150 g. 100 <;: 50 o 0 -I--I.....__-+'w4-+-+_,_.'--~ Z M ¢ ~ ~ ~ ~ ~ ~ ~ m m m m ~i~~gi~~~~~~~
~ m ~ ~ ~ ~ ~ ~ ~ ~ ~ ~ ~
~25000 ~----~f~ert~i~li~s~ed~----~ ~20000 ~ 15000 -§, 10000 .~ 5000 ~ 0 . c ~~C9C9C9~~~~~!!~~
~~~~~~~.f~~~l~ ~d1r--u1..rVNc;;ru~re~ct
Fig. 2. Comparison between the simulated (full lines) and the measured (marks) winter wheat dry weight and N03-N uptake for the field of Gembloux.
3.2.3. Nitrogen fluxes and nitrogen concentration in the groundwater A next validation of the model was done by comparing the daily nitrate flux
concentrations at the bottom of the root zone calculated by the WAVE model with the measured nitrate concentrations in the groundwater. The remark has to be made that in reality, the concentration in the groundwater can be diluted by lateral transport processes and that the WAVE model on the contrary only calculates the vertical fluxes in the soil. In Fig. 3, the comparison is made between the daily nitrate flux concentrations (mg 1-1) calculated by the WAVE model at the bottom of the root zone and the measured nitrate concentrations (mg 1-1) in the groundwater for the fields of Geel (maize), Geel (grassland) and Houthave. Positive nitrate fluxes in winter are due to a rising of the water table, whereas positive nitrate fluxes in summer are due to a rising of nitrate by capillary rise. The figure shows a clear pattern between the daily nitrate fluxes and the nitrate concentration in the groundwater. When the nitrate fluxes become more negative, the nitrate concentration in the groundwater rises. When the nitrate flux becomes less negative, the nitrate concentration in the groundwater diminishes, although sometimes with some time discrepancy. The absolute values of the nitrate fluxes and the nitrate concentrations in the groundwater are more or less of the same magnitude. This finding opens the possibility of predicting the nitrate concentration in the groundwater by means of the nitrate fluxes above the groundwater. The remark is made that the absolute limit of N03-N concentration in the groundwater according to the Ee standards (11.3 mg 1-1 NOrN in surface and groundwater) is exceeded for the field of Geel and that this also occurred in some small time intervals for the other fields.

S. Ducheyne et al./ Agricultural Water Management 51 (2001) 53-78 69
NOa-NfluxWAVE (mg r') 150 - Measured NOa-N in 75 O-~~=*~~~==~~~~==~~
-75 -150 +---,----r-.......,--.--.,---,---r-'
o 150 300 450 600 750 900 1050
150 -r-----"=..;;.;....>'-'==<........;:;...;;....;=-'-'--'-'-=---"-'-='-~=~ 75 O~~=X~~~~~~~~~~
-75 -150+--~-~-~-----.,------~
o 150 300 450 600 750 900 1050
Geel (maize) - 120 ton ha" slurry spring 150
J~l2:+9 o 150 300 450 600 750 900 1050
30 ~--~~~--~~--~--r-----~-~ 10 -10 - -30~----~~--~-~--~~--~----~
o 300 600 900 1200 1500
~~ j)~ri"g
-25 jbk1il ~ I -50 ' , . . ,
o 200 400 Day number
600 800
Fig. 3. Comparison between the nitrate flux calculated by the WAVE model and the nitrate concentrations in the groundwater for the fields of Geel (maize), Geel (grassland) and Houthave.
3.2.4. Nitrogen balances The calibrated WAVE model also calculated the nitrogen transformation processes in
the root zone and the nitrogen leaching at the bottom of the root zone as a part of the total nitrogen balance. The root zone was taken as the rooting depth of +20 ern in order to calculate the nitrate leaching out of the root zone. Although, no direct validation with measurements was possible, some general trends were found in the nitrogen transformation and nitrogen leaching amounts for the different fields. A selection of the nitrogen balances for some fertilisation application levels are given in Table 6.

Table 6 Nitrogen balances in kg N ha -I for a selection of the fertilisation application levels"
Nitrogen balances Houthave (1991-maize) Gembloux (1986- Gembloux (1986- Geel (l994-maize) Geel (I996-grassland) Kaggevinne (1993- (kg N ha-I) (100 em, 120 t ha-I fallow) (100 cm, winter wheat) (100 em, (100 em, 30 t ha-I (90 ern, 20 t ha-I slurry potato) (80 ern,
slurry in spring) unfertilised; fallow) fertilised (minerai)) slurry in spring) in spring; mineral and slurry) mineral and slurry)
NH4-N NOrN NH4-N NOrN NH4-N N03-N NH4-N NOrN NH4-N NOrN NH4-N NOrN
Fertilisation 264.0 3.6 0.0 0.0 85.0 85.0 102.4 18.2 178.3 117.5 247.5 150.0 Mineralisation 566.3 - 369.4 - 317.8 - 688.6 - 233.0 - 252.4 Immobilisation - -0.7 - -107.9 - -93.1 - -204.1 - -23.3 - 0.0 NH3 volatilisation -97.3 - 0.0 - 0.0 - -51.2 - -39.5 - -27.3 Nitrification -740.7 740.7 -366.6 366.6 -393.3 393.3 -730.6 730.6 -370.2 370.2 -468.9 468.9 Denitrification - -313.6 - -138.8 - -131.1 - -78.4 - -125.9 - -265.6 Plant uptake -3.3 -180.0 0.0 0.0 -5.0 -197.9 -6.2 -265.0 -5.5 -376.3 -2.8 -185.2 Leaching -0.6 -42.3 -2.2 -108.2 -1.5 -88.9 -0.8 -232.8 0.1 -4.5 -0.3 -95.6 Error 2.5 -10.0 0.0 -0.6 0.0 -0.7 -0.9 -11.7 2.9 -14.8 0.5 -38.5 In + Out + -9.1 197.7 0.6 11.1 3.0 -33.4 1.3 -43.2 -0.9 -57.1 1.1 34.0 Error = Change
U The indicated depth represents the root zone (=rooting depth + 20 em).

S. Ducheyne et al.l Agricultural Water Management 5] (200]) 53-78 71
The net mineralisation (total mineralisation minus immobilisation) over the total root depth for the field of Houthave (clay) ranges between 350 and 550 kg N ha-1• For the silty soils (Helecine and Gembloux) the net mineralisation is between 250 and 350 kg N ha-1• For Kaggevinne (loamy sand) the amount is between 150 and 250 kg N ha-1• The mineralisation capacity is thus decreasing in the order clay > silt> sand, a trend which corresponds to literature data (Christensen and Olesen, 1998). The fields of Geel (sand) do not follow this trend completely. For the grassland field, the mineralisation is between 200 and 250 kg N ha-t, while the maize field has an elevated mineralisation of 300-750 kg N ha-1• On one hand, the high organic carbon content of the fields of Geel is responsible for the higher mineralisation potential, and on the other hand, the field of Geel (maize) has a very rich history of elevated slurry applications by which the mineralisation potential has been increased. The conclusion can be made that the mineralisation potential of soils is not only determined by the soil texture, but even more by the organic carbon and nitrogen pool.
The denitrification is more elevated for a fallow field than for a cultivated field and is more elevated when fertilisation is applied. The field of Houthave (clay) has denitrification amounts of 180 kg N ha-l for the unfertilised plot up to 390 kg N ha-I for the plot with slurry fertilisation in autumn. For the field of Gembloux, the denitrification ranges from 70 kg N ha-1 for the unfertilised plot up to 400 kg N ha-l for the fertilised fallow plot. For the field of Helecine, which has only one fertilised plot, the denitrification is between 250 and 450 kg N ha -1. For the more sandy fields, the denitrification is smaller, with 60 kg N ha-1 for the unfertilised plot up to 290 kg N ha-1
for the fertilised plot in Kaggevinne. For the field of Geel (maize), the unfertilised plot has a denitrification of 10 and 290 kg N ha-1 for the fertilised plot, while this is 60 and 190 kg N ha -1 for the field of Geel (grassland), respectively. Although, a general conclusion is difficult to make, because the denitrification process is influenced by a lot of factors such as the position of the water table, management aspects (cultivation, fertilisation, etc.), soil texture, drainage, among others one can conclude that fine textured soils are less sensitive to denitrification compared to heavy-textured soils.
3.2.5. Nitrate leaching The yearly cumulative nitrate leaching out of the root zone is calculated for the
different fields. Nitrate leaching depends on the amount of rain surplus and it occurs in winter. Besides, the leaching is more elevated for fallow field conditions as the rain surplus becomes higher. Moreover, the leaching of nitrate is influenced by the accumulation of nitrogen in the soil profile during a previous dry year and by the amount of fertilisation. The rooting depth of the crop has an influence on nitrate leaching. The effect of spring or autumn slurry application, and the effect of amount of fertiliser, is illustrated in Fig. 4 for the field of Geel for maize with slurry application (1994) followed by a fallow year (1995). Higher fertilisation applications results in a higher leaching pattern with increased hazards for the autumn applications. The nitrate leaching on a yearly basis for the field of Helecine was not bigger than 40 kg N ha -I, while the nitrate losses for the cultivated fields in Gembloux was lower than 90 kg N ha -I. On the field of Geel (maize) very elevated nitrate leaching (up to 751 kg N ha-I) took place. The field of Geel (grassland) had very low leaching amounts (not more than 40 kg N ha -I) and the

72 s. Ducheyne et al.? Agricultural Water Management 51 (2001) 53-78
o 100 200 300 400 500 Day number (start oct-16)
fallow n!amUsed
o -100 -200 -300 -400 -500 -600 . -700 -800 -I---r--..,-------l
lonaulum 6O+60lon spnng-Ilu!um
o 100 200 300 400 500 Day number (start oct-16)
Fig. 4. Leaching of nitrate at 100 ern soil depth with spring or autumn application, and different amounts of fertiliser for the field of Geel (maize) with pig slurry application (1994) followed by a fallow year (1995).
field of Houthave had a maximum leaching of 62 kg N ha -I. In Kaggevinne leaching was low, except for potatoes with a shallow rooting pattern, for which the leaching reached 95 kg Nha-I.
To make comparison of the leaching patterns with the Ee-limit of 50 mg I-I N03
(= 11.3 mg I-I NOrN) in surface and groundwater possible, following conversion could be assumed: if a yearly rainfall surplus of 300 mm (=300 I m-2) is assumed, 3390 mg m-2 NOrN (=33.9 kg ha-I N03-N) may leach out of the soil profile in the assumption that no transformations of nitrogen take place between the soil profile and the saturated zone.
3.3. Scenario-analysis
It is a fact that the amount of nitrate accumulated during a dry year, can leach out during a subsequent wet period. In order to take this variability in time into account and in order to calculate a representative average nitrate leaching pattern on a yearly basis, model calculations were done for a period of 30 years (1961-1990), using the meteorological data of the KMI (Koninklijk Meteorologisch Instituut) station at Ukkel. The fertilisation quantities used for the scenario-analysis were based on the recent proposals of the Flemish government concerning the Manure Action Plan (MAP-I, 1995). A selection of the following fertilisation scenarios was done: fertilisation 1998 with maximal use of slurry; fertilisation 2003 with maximal use of slurry; fertilisation 1998 with maximal use of chemical fertilisers; fertilisation 2003 with maximal use of chemical fertilisers. The standards of fertilisation according to the MAP are given in Table 7. The composition of the chemical fertilisation consisted of mineral NH4-N and N03-N
to a ratio of 50/50. The nitrogen in slurry is divided into a mineral NH4-N fraction and an organic nitrogen fraction based on average slurry composition measurements. The calibrated model parameters for the specific soil and crop conditions were taken as a starting point for conducting the scenario-analysis. The initialisation of the organic pool was taken as a constant for every year. This is a good assumption for the litter pool as this is a short term pool. The organic matter in the manure pool on the contrary can accumulate during consecutive years of slurry application and this organic matter can

S. Ducheyne et al.Z Agricultural Water Management 51 (2001) 53-78 73
Table 7 The MAP fertilisation standards (1998 and 2003) which were used in the scenario-analysis
Fertilisation (kg N ha-1 per year) Year Chemical
Maize Maximal use of slurry 1998 0
2003 25 Maximal use of chemical fertiliser 1998 200
2003 150
Grassland Maximal use of slurry 1998 0
2003 250 Maximal use of chemical fertiliser 1998 250
2003 300
Winter wheat Maximal use of chemical fertiliser 1998 225
2003 200
Sugar beet/potato Maximal use of slurry 1998 0
2003 75 Maximal use of chemical fertiliser 1998 225
2003 200
Organic
325 250 125 125
450 250 200 200
325 200 100 75
after a long period finally accumulate in the stable humus pool. The results of the scenario-analysis must therefore be seen in the context of an average leaching over a weather period, assuming that no accumulation takes place in the organic pool. The slurry application was not used for winter wheat and was applied at the con-ect moment of the year, namely in spring, according to the prescriptions of MAP. The variation of the yearly average leaching of nitrate for the different scenarios at Gembloux (winter wheat - silt), Geel (maize - sand), Geel (grassland - sand), Houthave (maize-winter wheat rotation - clay) and Kaggevinne (sugar beet, winter wheat, winter barley, sugar beet, winter wheat, potato, winter wheat rotation - loamy sand) is given in Fig. 5.
It is observed that the variation in the yearly rainfall amount is the main source of variation in the pattern of leaching. The wettest year of the period (1965) corresponds with high leaching, while the leaching was low for the dry year 1976. Furthermore, the year 1964 was a very dry year and as a consequence, the leaching in the following year is even more elevated. We can conclude that the high leaching in 1965 is the combined effect of accumulation of nitrogen in the soil profile during a dry year, followed by increased leaching during a wet year. When considering the different standards of organic and inorganic fertilisers, it can be
seen in Fig. 5 that for a given field condition the applied amount of fertiliser is not a source of large variation in leaching of nitrate on a yearly base, as the fertiliser standards do not show large variations either. A small decrease in nitrate leaching was observed for the 2003 standards and for the standards with maximal use of slurry, although this is not a general trend. The remark must be made that the accumulation of organic matter by consecutive years of slurry application was not taken into account. In reality, a

74 S. Ducheyne et al.Z Agricultural Water Management 51 (2001) 53-78
~maxslu1998 ~maxslu2003 ~maxchem1998 -maxchem2003
:~~~ ) 1IIIjjiil!,(~~;
S. Ducheyne et al.IAgricllitllrai Water Management 51 (2001) 53-78 75
during several years). The conclusion can be made that the leaching of nitrate towards the groundwater depends on the mineralisation capacity of the soils. This property is related on one hand to the texture of the soil: clay soils have high mineralisation capacity, followed by loamy soils with smaller mineralisation capacity and sandy soils with lowest mineralisation capacity. Apart from the soil texture, the organic matter pool on the other hand determines even more the mineralisation potential of soils. This was very clear for the field of Geel (maize) which had a very rich history of slurry applications. Even when the pool of manure was halved, the leaching amount was still high.
4. Conclusions
Historic field data from different agricultural regions in Belgium were used to calibrate and validate the WAVE model. A systematic calibration and validation method was used for this purpose. The calibration of the nitrogen mineralisation parameters was an essential step. The initialisation and the subdivision of the organic matter over the different pools in the WAVE model (manure, litter, humus) was equally important. This was done as a function of the history of slurry application and of the management of crop residues. Some model output variables, such as the nitrogen mineralisation, denitrifica tion and nitrate leaching could not be validated directly. When setting up new experimental fields for modelling purposes, measurement of these subcomponents of the nitrogen balance should be taken into consideration. The fate of nitrogen fertiliser in the soil mineral and organic component, in the crop and in the groundwater could for example be traced by labelled-N experiments. The nitrate leaching could be measured in the field with the passive capillary wick method (Holder et al., 1991). Besides, in order to perform the calibration of the complex nitrogen cycle, with correlated parameters, in a more efficient and less labour intensive way, a more dimensional sensitivity analysis of the nitrogen module is recommended (Ducheyne et al., 2000). Nevertheless, this study revealed the power of the WAVE model to predict the
evolution and transformation dynamics of nitrogen in the soil profile and the leaching of nitrate at the bottom of the root zone. The model results of the nitrogen concentration in the soil profile, and of the crop growth and nitrogen uptake for the different fields were satisfactory. The nitrogen balances revealed that nitrogen mineralisation capacity depended on the soil texture, and on the soil organic matter and organic fertilisation history of the field. Denitrification losses seemed to be reduced for fine-textured soils. The study also revealed that higher fertilisation applications result in a higher leaching pattern during winter with more elevated risks for the slurry applications in autumn. Furthermore, a similar pattern could be noticed between the nitrate flux concentration calculated by the model, and the nitrate concentration measured in the groundwater. This finding opens the possibility to predict the nitrate concentration in the groundwater by means of nitrate fluxes above the groundwater.
The calibration of the WAVE model to different combinations of soils and crops, typical for the Belgian agricultural region, yielded an important set of soil, crop and nitrogen model parameter values. These parameter values can be used for model application studies such as scenario-analysis studies.

76 S. Ducheyne et al.r Agricultural Water Management 51 (2001) 53-78
The scenario-analysis performed in this study, confirmed the hypothesis that the amount of nitrate leached at the bottom of the root zone is not only controlled by the fertiliser practice of the crop during that year, but also by the rainfall depth and distribution, the soil texture, the soil mineralisation capacity and the fertilisation history of the soil. Moreover, the power of the WAVE model to evaluate regulatory fertiliser standards was demonstrated. Further research need to be done in order to calibrate the WAVE model for other soil
crop combinations than those used in this study. A more extensive and integrated calibration and measurement campaign will result in a larger database of soil, crop and nitrogen parameters, typical of the farming conditions in Belgium. If this may be realised, it will become feasible to use the model in a predictive way for regional studies to support and evaluate fertiliser regulations. In this context a stochastic simulation approach (e.g. Droogers and Bouma, 1997; Ducheyne et al., 2000) is recommended in order to include spatial variability or uncertainty on the model parameters and to make interpretation of model results in terms of accuracy and in terms of risk possible.
Acknowledgements
This research is financially supported by a Ph.D. research grant of the Flemish Institute for the Encouragement of Scientific and Technological Research in the Industry (IWT) and by project funding of AMINAL (Administratie Milieu, Natuur en Landinrichting) of the Flemish community. The authors are grateful to the Bodemkundige Dienst van Belgie (BDB) for the use of, and assistance with the field data. Similarly, the authors express their gratitude to the Centre de Recherche Agronomique de Gembloux (CRA) for the use of some of their field data.
References
Anoniern, 1982. Proefveldgegevens te Helecine, meetgegevens groeiseizoen 1982. Instituut voor Land and Waterbeheer, K.U. Leuven (in Dutch), p. 87.
Anoniem, 1983. Proefveldgegevens te Helecine, meetgegevens groeiseizoen 1983. Instituut voor Land and Waterbeheer, K.U. Leuven (in Dutch), p. 91.
Anoniem, 1984. Proefveldgegevens te Helecine, meetgegevens groeiseizoen 1984. Instituut voor Land and Waterbeheer, K.U. Leuven (in Dutch), p. 90.
Anoniem, 1985. Proefveldgegevens te Helecine, meetgegevens groeiseizoen 1985. Instituut voor Land and Waterbeheer, K.U. Leuven (in Dutch), p. 128.
Be1mans, C., Weeseling, J.G .. Feddes, R.A., 1983. Simulation of the water balance of a cropped soil: SWATRE. J. Hydrol. 63. 271-286.
Bergstrom. L .. Johnsson, H .. Tortensson, G., 1991. Simulation of nitrogen dynamics using the SOILN model. Fert. Res. 27. 181-188.
Christensen, B.T., Olesen, J.E., 1998. Nitrogen mineralisation potential of organomineral size separates from soils with annual straw incorporation. Eur. J. Soil Sci. 49, 25-36.
Coppens. G .. Vanongeval, L .. 1998. Modellering van de migratie van nutrienten in de bodem. Activiteitenverslag van de Bodemkundige Dienst van Belgie, Rapport 98/00/3 (in Dutch). p. 40.
Dierckx, J.C .. Belmans, C .. Pauwels. P., 1986. SWATRER. a computer package for modelling the field water balance. Reference manual. Institute for Land and Water Management, K.U. Leuven, Belgium, p. 114.

S. Ducheyne et al.Z Agricultural Water Management 51 (2001) 53-78 77
Droogers, P., Bouma, J., 1997. Soil survey input in exploratory modelling of sustainable soil management practices. Soil Sci. Soc. Am. J. 61.1704-1710.
Ducheyne, S., Vanclooster, M., Feyen, J., 1998a. A systematic calibration and validation procedure applied to an integrated soil-crop model. In: Heineke, H.J., Eckelmann, W., Thomasson, A.J., Jones. R.J.A., Montanarella, L., Buckley. B. (Eds.), Land Information Systems: Developments for planning the Sustainable Use Of Land Resources. European Soil Bureau Research Report no. 4, EURI7729EN, 1998, p. 546. Office for Official Publications of the European Communities, Luxembourg, pp. 461-468.
Ducheyne, S., Schadeck, N., Feyen, J., 1998b. ModeIIering van de migratie van nutrienten in de bodem. Interne publicatie nr. 52, Instituut voor Land en Waterbeheer. K.U. Leuven, p. 63 (in Dutch).
Ducheyne, S., 2000. Derivation of the parameters of the WAVE model using a deterministic and a stochastic approach. Ph.D. Thesis No. 434. Faculty of Agricultural and Applied Biological Sciences, K.U. Leuven. Belgium. p. 123.
Ducheyne, S., Booltink, H.W.G., Feyen. J., 2000. A stochastic procedure to reduce model uncertainty for nitrogen simulation in the soil. In: Ducheyne, S .• 2000. Derivation of the paramaters of the WAVE model using a deterministic and a stochastic approach. Ph.D. Thesis No. 434, Faculty of Agricultural and applied Biological Sciences, K.U. Leuven, Belgium, p. 123.
Feddes, R.A., Kowalik, P.J., Zaradny, H .• 1978. Simulation of field water use and crop yield. Simulation Monographs. PUDOC. Wageningen, The Netherlands. p. 189.
Follet, R.F.. Wieringa, P.J., 1995. Integrated nitrogen management in relation to leaching and groundwater quality. (Special Issue) J. Contaminant Hydrol. Elsevier. Amsterdam, 20.
Gardner, W., 1958. Some steady state solutions of the unsaturated moisture flow equation with application to evaporation from a water table. Soil Sci. 85. 228-232.
Gego, E., 1993. Developpement d'un modele de simulation pour l'etude de l'evolution de l'azote mineral du sol sous une culture de froment d'hiver (Triticum aestivum L.). These de Doctorat. Faculte des Sciences Agronomiques de Gembloux, p. 309.
Holder. M .• Brown. K.W .• Thomas. J.C .• Zabcik, D., Murray. H.E., 1991. Capillary-wick unsaturated zone soil pore water sampler. Soil Sci. Soc. Am. J. 55. 1195-1202.
Klute, A. (Ed.), 1986. Methods of soil analysis, Part I. Physical and mineralogical methods. Agronomy 9 (2). 2nd Edition. American Society of Agronomy. Madison, Wisconsin. USA.
Loague. K.. Green. R.E.. 1991. Statistical and graphical methods for evaluating solute transport models: overview and application. In: Wierenga. P.J. (Ed.), Validation of flow and transport models for the unsaturated zone. J. Contam. Hydrol. 7. 51-73.
MAP-I. 1995. Decreet van 20 december 1995 (B.S. 30 december 1995) tot wijziging van het decreet van 23 januari 1991 inzake de bescherming van het leefmilieu tegen de verontreiniging door meststoffen (in Dutch).
MAP-2. 2000. Decreet (B.S. 30 maart 2000) tot wijziging van het decreet van 23 januari 1991 inzake de bescherming van het leefmilieu tegen de verontreiniging door meststoffen (in Dutch).
Schepers, J.S., Mosier. A.R .• 1991. Accounting for nitrogen in non-equilibrium soil-crop systems. In: Follett. R.F., Keeney. D.R., Cruse. R.M. (Eds.), Managing Nitrogen For Groundwater Quality and Farm Profitability. Soil Science Society of America. Madison. WI, USA. pp. 125-138.
Spitters. C.J.T .• van Keulen, H., Van Kraailingen, D.W.G., 1988. A simple but universal crop growth simulation model. SUCROS87. In: Rabbinge, R .. Van Laar, H., Ward. S. (Eds.), Simulation and Systems Management in Crop Protection. Simulation Monographs. PUDOC, Wageningen. The Netherlands. pp. 147-187.
Vanclooster, M., Viaene, P., Diels, J., Christiaens. K.. 1994. WAVE, a mathematical model for simulating water and agrochemicals in the soil and the vadose environment. Reference and user's manual. Release 2.0. Institute for Land and Water Management, K.U. Leuven. Belgium.
Vanclooster, M., Viaene, P., Christiaens, K.. Ducheyne, S .• 1996. WAVE, a mathematical model for simulating water and agrochernicals in the soil and the vadose environment. Reference and user's manual. Release 2.1. Institute for Land and Water Management. K.U. Leuven, Belgium.
van Dam. J.C .• Stricker. J.N.M .. Droogers. P .• 1990. From one-step to multi-step. Determination of soil hydraulic functions by outflow experiments. Report 7. Department of Water Resources. Agricultural University. Wageningen. The Netherlands.
van Dam. J.C., Stricker, J.N.M .• Droogers. P .. 1994. Inverse method to determine soil hydraulic functions from multi-step outflow experiment. Soil Sci. Soc. Am. J. 58. 647-652.

78 S. Ducheyne et al.! Agricultural Water Management 51 (2001) 53-78
van Genuchten, M.T., Nielsen, D.R., 1985. On describing and predicting the hydraulic properties of unsaturated soils. Anal. Geophys. 3 (5). 615-628.
van Keulen, H., Penning de Vries, F.W.T., Drees, E.M., 1982. A summary model for crop growth. In: Penning de Vries, F.W.T., Van Laar, H.H. (Eds.), Simulation of Crop Growth and Crop Production. PUDOC. Wageningen, The Netherlands. pp. 87-98.
Verdegem, L., 1989. Ontwikkeling en validatie van een geintegreerd computermodel als hulpmiddel bij de stikstofdosering en bij de gewas en bodernevaluatie in de intensieve akkerbouw op poldergronden. Ph.D. Thesis. Faculteit van de Landbouwwetenschappen, Rijksuniversiteit Gent (in Dutch).
Vereecken, H., 1988. Pedotransfer functions for the generation of the hydraulic properties for Belgian soils. Ph.D. Thesis no. 171. Faculty of Agricultural and Applied Biological Sciences, K.U. Leuven, Belgium, p. 254.
Vereecken, H., Vanclooster, M., Swerts, Moo 1990. A simulation model for the estimation of nitrogen leaching with regional applicability. In: Merckx, R., Vereecken, H. (Eds.), Fertilisation and the Environment. Academic Press, Leuven, Belgium. pp. 250-263.
Verhagen, J., Bouma, J., 1998. Defining threshold values for residual soil N levels. Geoderma 85. 199-211. Wagenet, R.J., Hutson, J., 1989. LEACHN, a process-based model of water and solute movement,
transformations, plant uptake and chemical reactions in the unsaturated zone. Centre for Environmental Research, Cornell University, Ithaca, NY, USA, p. 147.
World Reference Base, 1998. World reference base for soil resources. World Soil Resources Report no. 84, Food and Agriculture Organisation of the United Nations, Rome.