assessment of subsurface hydrocarbon contamination
TRANSCRIPT

Exploration Technologies, Inc. 3698 Westchase Dr. Houston, TX 77042 Tel: (713) 785-0393; Fax: (713) 785-1550 http://www.eti-geochemistry.com E-mail: [email protected]
Assessment of Subsurface Hydrocarbon Contamination Resulting from Multiple
Releases at Six Former Bulk-fuel Storage and Distribution Terminals, Austin, Texas:
A Case Study
Patrick N. Agostino, Victor T. Jones, III, and Rufus J. LeBlanc Jr.
Agostino, P. N., R. J. LeBlanc Jr., and V. T. Jones III, 2002, Assessment of subsurface hydrocarbon contamination resulting from multiple releases at six former bulk-fuel storage and distribution terminals, Austin, Texas: A case study, in Surface exploration case histories: Applications of geochemistry, magnetics, and remote sensing, D. Schumacher and L. A. LeSchack, eds., AAPG Studies in Geology No. 48 and SEG Geophysical References Series No. 11, p. 299-325.

299
11Assessment of Subsurface HydrocarbonContamination Resulting from MultipleReleases at Six Former Bulk-fuel Storage andDistribution Terminals, Austin, Texas: A Case Study
ABSTRACT
Exploration geochemical methods developed and used by the petroleum industry canbe invaluable for environmental site characterizations. Many of these methods are notused because they are unfamiliar to environmental scientists and to most regulatory
agencies. The rule-of-thumb methods of site characterization (randomly placed monitoringwells, EPA method analyses for target compounds, and the like) are rarely adequate to fullydelineate and explain the nature and distribution of subsurface contamination.
The Austin, Texas, case study demonstrates how a phased assessment approach can beused to accurately define petroleum contamination in a study area. Various unconventionalmethods and techniques (standard for the petroleum industry, but not for the EPA), includingforensic geochemistry, were used to better delineate the areal and vertical extents of subsur-face contamination.
Prior to this study, more than 400 boreholes, monitoring wells, and temporary monitor-ing wells were installed on six former storage and distribution terminals and pipeline proper-ties and adjacent private and public properties in the east Austin area. The assessments per-formed included standard regulatory methodologies (borehole drilling, monitoring-wellinstallation, EPA method BTEX and TPH laboratory analyses, and the like), with the goal ofcharacterizing individual properties. The migration of contaminants off the terminal proper-ties, however, was unresolved and unreported.
The scope of work for this study included documentation of historical hydrocarbon re-leases; collection of soil-vapor, soil-core, and groundwater samples; and analyses of these sam-
Agostino, P. N., R. J. LeBlanc Jr., and V. T. Jones III, 2002, Assessment of subsurface hydrocarboncontamination resulting from multiple releases at six former bulk-fuel storage and distributionterminals, Austin, Texas: A case study, in Surface exploration case histories: Applications ofgeochemistry, magnetics, and remote sensing, D. Schumacher and L. A. LeSchack, eds., AAPGStudies in Geology No. 48 and SEG Geophysical References Series No. 11, p. 299–325.
Patrick N. AgostinoExploration Technologies, Inc.
Houston, Texas, U.S.A.
Rufus J. LeBlanc Jr.Exploration Technologies, Inc.
Houston, Texas, U.S.A.
Victor T. Jones IIIExploration Technologies, Inc.
Houston, Texas, U.S.A.

INTRODUCTIONExploration geochemical methods developed and
used by the petroleum industry can be invaluable in envi-ronmental site characterizations. Environmental compa-nies and consultants do not use many of these methodsbecause the methods are unfamiliar to environmental sci-entists and to most regulatory agencies. The rule-of-thumb methods of site characterization (randomly placedmonitoring wells, EPA method analyses for target com-pounds, and the like) are rarely adequate for fully delin-eating and explaining the nature and distribution of sub-surface contamination.
Additional information that must be integrated withanalytical data to better characterize a site includes histor-ical data and subsurface geology and hydrogeology. Tounderstand the nature and extent of the contamination,it is necessary to understand what products were storedand dispensed on and in the vicinity of a site, where po-tential source areas were located over time, and what geo-logic and hydrogeologic pathways the released productsmigrated along. The subsurface strata through which con-taminants migrate are not isotropic and homogeneousand definitely not “layer cake” in nature. It is mandatorythat the subsurface stratigraphy be properly assessed andmapped for investigators to understand the distributionand migration of hydrocarbon contaminants. The effec-tiveness of a remedial action plan and remediation systemdepends directly on the thoroughness and accuracy of thesite characterization, especially with regard to subsurfacestratigraphy.
The Austin, Texas, case study demonstrates (1) the ef-fectiveness of unconventional methods and techniques(standard to the petroleum industry, but not to the EPA)
for delineating the areal and vertical extents of subsurfacecontamination; (2) the importance of understanding andaccurately mapping the subsurface geology and hydroge-ology in the study area; (3) the merits of compiling andintegrating the historical information for the various facil-ities; (4) the importance of forensic geochemistry; and (5)the relationship among vapor, sorbed (residual), dis-solved, and free (NAPL) phase contamination, and themerits of analyzing (and resolving the distribution of) allfour phases.
BACKGROUND
Six former bulk-fuel storage and distribution termi-nals and various petroleum-product pipelines associatedwith those terminals were operated by six major oil com-panies for more than 40 years in the east Austin area ofAustin, Texas, U.S.A. Residential and commercial proper-ties and a city of Austin park (Figure 1) border the formerterminals and undeveloped pipeline properties. Althoughvarious environmental site assessments and limited reme-diation activities were conducted on the terminal proper-ties, these activities were not adequate to properly detector prevent off-site migration of contaminants.
Assessment reports, corrective action plans, and quar-terly groundwater monitoring reports were submitted tothe Texas Water Commission (TWC) beginning in 1987.In 1992, the TWC required that owners and operators ofthe terminals and pipelines report all historical petro-leum-product releases, assess their respective properties,and determine whether off-site migration of petroleumproducts had occurred. The reports prepared by industryconsultants and submitted to the TWC and the Texas Nat-
ples obtained in close proximity to and down-gradient of the terminal and pipeline properties.Geochemical analytical methods were used to determine the different types of products re-leased and the distribution of these petroleum products (contaminants) in vadose-zone soilsand groundwater. The data collected during this study were integrated with all available datapreviously collected.
Geologic cross sections and soil-vapor, soil, and groundwater isoconcentration maps wereconstructed using the data collected during this study. The maps and sections and forensic geo-chemistry techniques were used to delineate and demonstrate the areal and vertical extents ofpetroleum hydrocarbon impact on private and public properties located down-gradient of thesix former fuel storage and distribution terminals and product pipeline properties in the eastAustin area.
The sources of the vapor, soil, and groundwater contamination were multiple releases onthe terminal and pipeline properties, based on historical records and assessment data. Contam-ination resulting from these releases has reached groundwater and subsequently has migratedoff-site onto public and private properties. Based on the results of the work performed, it is ob-vious that the use of soil-vapor studies and other geochemical methods was essential to eco-nomically assess off-site migration of petroleum contaminants from the terminal and pipelineproperties.

ural Resource Conservation Commission (TNRCC) includ-ed a limited number of minor releases (dated post-1987).More than 400 boreholes, monitoring wells, and tempo-rary monitoring wells were installed on the six storage anddistribution terminals and pipeline properties and adja-
cent private and public properties between 1987 and 1992.Despite this large number of sampling points, the testingperformed down-gradient of the terminal and pipelineproperties was incomplete and inadequate for defining thetrue degree and extent of off-site contamination.
FIGURE 1. Location map of study area, showing the six former bulk storage and distribution terminals and pipelineproperties (A-F) and surrounding city of Austin park (Govalle Park) and residential and commercial properties. Thelocations of pipelines, boreholes, and monitoring wells are also shown.

HISTORICAL INFORMATION—TERMINAL AND PIPELINE
OPERATIONS
For the purposes of this case study, the former termi-nal and pipeline properties have been labeled counter-clockwise from A through F (Figure 1). Limited historicalinformation for the six terminal properties and pipelineswas discussed in reports submitted to the TNRCC, pre-pared by the oil companies’ consultants. A more detailedsummary of this historical information is included in asummary report submitted to the TNRCC, prepared by Ex-ploration Technologies, Inc. (January 1994).
Construction dates for the six terminals ranged from1948 to 1962. Refined petroleum fuel products to the sixterminals were delivered through product pipelines (Fig-ure 1) that ran northwest along Airport Boulevard to oneof three pipeline manifolds located on terminal propertiesC, E, and F. The Company C and Company E manifoldsprovided refined petroleum products to the three oldestterminals, which contained approximately 60% (346,572bbl) of the total storage capacity of the six terminals. Re-fined petroleum fuels were distributed from the pipelinemanifolds to aboveground storage tanks via separateproduct distribution lines. The total storage capacity ofthe aboveground tanks on the six terminals was approxi-mately 576,000 bbl.
The Company E and Company C pipeline manifoldssupplied jet fuel to a former U.S. Air Force base until 1971,via a pipeline on the Company C undeveloped property.This pipeline ran southeast across the Company C unde-veloped property (Figure 1) and then southwest andsoutheast along Shady Lane and Airport Boulevard to theformer U.S. Air Force base. Company A also began to sup-ply jet fuel to the Air Force base in 1971 when the compa-ny purchased the pipeline and manifold facilities. Otherrefined petroleum fuels stored and distributed by the sixterminals included regular and premium leaded and un-leaded gasoline, kerosene, and diesel. No crude-oil prod-ucts were ever transported to or stored on any of the sixterminals.
The majority of refined fuel products delivered to thesix terminals via pipelines during a 40-year period of oper-ation exited the six terminals via truck-loading racks.Products were distributed from the aboveground storagetanks by product distribution lines via pump manifolds tothe truck-loading racks, all of which appear to be majorsources of unreported releases, based on the data com-piled during this study. The product distribution lineswere located underground as late as 1986 at Terminal C,and they appear to have been sources of undetected (andunreported) releases either at flange connections or fromholes in the distribution lines (caused by corrosion). Load-ing-rack drains emptied into underground storage tanks(USTs) in the vicinity of the six loading racks. In addition,
after the refined fuel products were separated from waterin the USTs, the water, which contained dissolved-phasehydrocarbons, was pumped into the berm areas aroundthe storage tanks and allowed to seep into subsurfacesoils.
It should be noted that the oil companies’ consul-tants focused on those losses that occurred after 1987,when the state of Texas began to enforce environmentalregulations regarding refined petroleum products. Thelargest volumes of liquid product (NAPL) found off-siteappear to be related to releases that occurred prior to1987, based on the product types identified in subsurfacesoils and groundwater.
Subsurface assessments indicated vapor, soil, and/orgroundwater contamination in the vicinity of the loadingracks on all six terminals. The loss of gasoline fuels con-taining both lead and methyl tertiary butyl ether (MTBE)indicates both relatively early and late subsurface releases,because lead usage peaked in the 1970s and MTBE was notin general usage until 1985. The presence of MTBE overthe majority of the study area and the commingling witholder jet fuel product(s) in many areas indicate that releas-es from the terminal properties continued after 1985,when MTBE became a common gasoline additive.
Results of the initial study performed for the city ofAustin, including information obtained from the oil com-panies’ reports, were submitted to the TNRCC in a com-prehensive summary report (Exploration Technologies,Inc., 1994).
STUDY AREA General
The study area is located in a part of east Austin con-sisting of residential, industrial, commercial, and city (Go-valle Park) properties. The area is bounded by a residentialarea on the north, Airport Boulevard on the west, BolmRoad on the south, and an unnamed tributary to BoggyCreek and residential properties on the east (Figure 1).Austin is located in the Blackland Prairie physiographicprovince of central Texas. The topography slopes gentlyto the southeast and has an average elevation of 455 ft(137 m) above sea level. Boggy Creek, a tributary to theColorado River (the primary drainage feature in theAustin area), located approximately 1 mi (1.6 km) to thesouth, is the prominent drainage feature in the study area.The climate of the Austin area is humid-subtropical, withan average precipitation of 32 in. (82 cm) per year (Garnerand Young, 1976).
Geology
Austin, in central Travis County, Texas, is located onformations of Late Cretaceous and early Tertiary age thatgently dip to the southeast into the Gulf of Mexico Basin.

The study area is situated on Pleistocene terrace depositsof the Colorado River. The Pleistocene terrace deposits areunderlain, in descending order, by the Navarro and TaylorGroups, Austin Chalk, Eagle Ford Group, Buda Limestone,Del Rio Clay, Georgetown Limestone, and numerous Cre-taceous formations of the Fredericksburg Group. The Ed-wards Limestone, included in the Fredericksburg Group, isa major groundwater aquifer in the west Austin area. ThePleistocene terrace deposits increase in grain size, porosi-ty, and permeability with depth and consist of (in de-scending order) clays, silty clays, silts, and sands that aregraveliferous in some areas. The Pleistocene terraces rangein thickness from less than 10 ft (3 m) to more than 60 ft(18 m) in the Austin area. The study area is situated on thePleistocene First Street Terrace (Urbanec, 1963).
The majority of the site-specific lithologic data wascompiled from borehole and monitoring well logs. ThePleistocene First Street Terrace in the study area is 24–32 ft(7–9.6 m) thick. Subsurface lithologies, in descending
order, include clays, silty clays, clayey silts, silts, and sandswith occasional gravel and show a general increase ingrain size, porosity, and permeability with depth.
An understanding of the areal and vertical stratigraph-ic framework of the First Street Terrace is essential to un-derstanding the migration pathways of subsurface contam-ination in the unsaturated (vadose) and saturated zones.Relatively narrow, silt-filled channel deposits are presentin the shallow subsurface soils (Figure 2). These silt-filledchannels contain relatively young sediments that were de-posited after the initial erosion of the First Street Terrace.The channels trend northwest to southeast across the ter-minal and pipeline and undeveloped properties and ex-tend into Govalle Park and adjacent residential areas.
The depth to sand and other overlying lithologicunits varies widely over the study area. The sand is at rel-atively shallow (4–10 ft, or 1.3–3 m) or intermediatedepths (10–14 ft, or 3–4.2 m) beneath most of the termi-nal properties. East and south of Shady Lane, the sand is
FIGURE 2. Silt isopachmap constructed usingsoil-core data collectedin the study area. Notethe relatively narrowlinear channels inwhich silt sedimentswere deposited.

generally encountered at depths in excess of 18 ft (5.4 m).In areas where sand is present at depth, it is generallyoverlain, in ascending order, by silts, clayey silts, andsilty clays. The vertical relationships of the lithologies en-countered in the First Street Terrace are illustrated incross section A-A’ (Figure 3). The location of the cross sec-tion is shown in Figure 2.
The relatively narrow silt channels present in vadose-zone soils (Figure 2) were primary pathways along whichhydrocarbon contaminants migrated off the terminalproperties toward Govalle Park and residential properties.These contaminants also migrated vertically down togroundwater, thus impacting the aquifer in the studyarea. The contaminants that impacted the groundwatercontinued to migrate off-site (down-gradient) because ofthe regional south-southeast groundwater gradient pres-ent in the study area.
Hydrology
The Pleistocene terrace deposits and Edwards Lime-stone are the two principal groundwater aquifers in thestudy area. The city of Austin’s public water supply is de-rived primarily from the lakes of the Colorado River andthe freshwater zone of the Edwards Limestone. In the eastAustin area, the Edwards Limestone is not considered tobe a source of potable water and is not suitable for indus-trial use because of its high salinity. The water contained
in the Pleistocene terrace deposits, from depths of 10 to 15ft (3 to 4.5 m) below the ground surface, is used for irriga-tion purposes (Texas Department of Water Resources,June 1983). Unfortunately, the groundwater in the studyarea is no longer suitable for irrigation because of the pe-troleum hydrocarbon contamination detected during thisstudy. The Pleistocene terrace aquifer is unconfined in thestudy area. The potentiometric surface map (Figure 4),constructed using data obtained during June through Sep-tember 1994, indicates that the dominant groundwaterflow direction beneath the off-site properties is to thesoutheast, toward the Colorado River.
INVESTIGATIVE METHODSThe scope of work for this study included documenta-
tion of historical hydrocarbon releases; collection of soil-vapor, soil-core, and groundwater samples; and analysesof these samples obtained in close proximity to anddown-gradient of the terminal and pipeline properties. Alldata were integrated with public data collected by the oilcompanies’ consultants and reported to the TNRCC (Ex-ploration Technologies, Inc., 1994). The soil-vapor sur-veys (542 sample sites) performed in Govalle Park, on theundeveloped property, and on private properties wereused to locate 91 borings and 13 monitoring wells. Thedrilling and installation of these borings and monitoring
FIGURE 3. Cross section A-A’, showing the stratigraphy of the First Street Terrace.

wells were necessary to confirm the areal extent of conta-mination delineated using the soil-vapor data and to de-termine the vertical extent and degree of hydrocarboncontamination in soils and groundwater. Various geo-chemical analytical methods were used to determine thedifferent types of products released and the distribution
and concentrations of these petroleum products (contam-inants) in vadose-zone soils and groundwater.
An initial investigation of the bulk–fuel storage anddistribution terminal area was begun in 1993 at the re-quest of the city of Austin (COA). The goal was to deter-mine if Govalle Park (owned by the city) was impacted by
FIGURE 4. Potentiometric surface map of the First Street Terrace aquifer, down-gradient of the terminal and pipelineproperties, using data collected in June through September 1994.

petroleum hydrocarbon releases on the terminal and/orpipeline properties located up-gradient. Data provided bythe oil companies’ consultants and included in theTNRCC files were examined and interpreted. These dataand the historical information available indicated that itwas highly probable that releases on the terminal andpipeline properties during several decades had causedwidespread contamination in the area. The areal and ver-tical extent of the contamination was determined using awell-planned, organized assessment consisting of severalphases. Various geochemical methods were used to con-firm the presence and delineate the morphology of off-site hydrocarbon contamination resulting from releaseson the various terminal and pipeline properties.
Soil-vapor SurveysAn initial soil-vapor survey was performed over city-
owned Govalle Park and adjacent private propertiesdown-gradient of the terminal and pipeline properties.When used properly, a soil-vapor survey is an excellentscreening technique for delineating the areal (horizontal)extent of subsurface contamination (Marrin, 1988; Jonesand Agostino, 1998). Soil-vapor samples were collected at542 sites in the study area to determine the possible pres-ence and areal extent of petroleum-product constituentscontained in near-surface soils and/or groundwater. Thesurvey was conducted south and east of the six terminaland pipeline properties on a staggered sampling grid con-taining approximately 50-ft (15-m) centers. The surveygrid was adjusted slightly to avoid natural hazards such asmajor roadways, utility lines, buildings, and concrete sur-faces. The sites at which the soil-vapor samples were col-lected are shown in Figure 5.
At each sampling location, a manually operatedpounder bar was used to advance a 0.5-in.- (1.3-cm-) di-ameter hole into the soil to a depth of 12 ft (3.6 m). Im-mediately after removal of the pounder bar, a specially de-signed soil-vapor sampling probe was inserted into eachpredriven sampling hole for collection of a soil-vaporsample. In some instances, samples were collected atdepths shallower than 12 ft because of soil conditions orthe presence of shallow groundwater. Based on results ofthe initial soil-vapor survey and existing borehole andmonitoring-well data, an additional 158 soil-vapor sam-ples were collected in close proximity to the groundwateraquifer (at depths of 16–18 ft, or 4.8–5.4 m), using a truck-mounted direct-push collection system. Data obtainedfrom the direct-push vapor survey were integrated withthe hand-probe soil-vapor data (12-ft [3.6-m] samples col-lected at 384 sites). The soil-vapor concentration maps in-clude all data collected using both hand-probe and direct-push methods.
An evacuated 125-cm3 septum-top glass bottle wasattached to the probe and used to collect a soil-vaporsample at each location. An additional 60 cm3 of soil
vapor was extracted from the soil and added to the bottleto create a positive pressure within the bottle and to pro-vide an adequate volume of sample for analysis. The sep-tum was sealed with a silicone rubber sealant to avoidleakage of the vapors and to help preserve the integrity ofthe sample.
The pounder bars, manual sample collection probes,and direct-push sampler were decontaminated betweeneach of the sample sites, using a rinse of detergent and dis-tilled water. A “blank” sample of ambient air was collectedthrough the probes at each sample location for possibleanalysis to ensure that no hydrocarbon constituent carry-over occurred.
Although soil-vapor measurements are commonlyused for screening purposes, it is important to properlyquantify individual hydrocarbon and biogenic gas con-stituents. Most portable field screening instruments mea-sure total volatile organic constituents (VOCs) and are notcapable of accurately quantifying individual soil-vaporcompounds. In addition, studies by Robbins et al. (1990a,b) have shown that data obtained from portable total or-ganic vapor-detection instruments can be misleading be-cause those instruments are influenced by many factors.Although more time-consuming and more costly, detailedsoil-vapor analyses, in which individual constituents areidentified and quantified under laboratory conditions, areinvaluable for properly characterizing the areal extent ofsubsurface contamination. All soil-vapor samples, there-fore, were analyzed in ETI’s central laboratory.
Soil-vapor-constituent concentrations were postedand contoured to display the areal extent of petroleumhydrocarbon and biogenic gas vapors in subsurface soils.These contoured “plume” maps were used to illustrate theareal extent of the subsurface contamination.
Direct-push Borings
Results of the soil-vapor surveys were used to deter-mine 91 locations at which soil cores were collected. Atthese locations, borings were advanced to groundwater,and soil-core samples (in 2-ft, or 0.6-m, lengths) were col-lected continuously from the ground surface to totaldepth, using a direct-push sampling system. Compositesoil samples from each core were analyzed for concentra-tions of benzene, toluene, ethylbenzene, and xylenes(BTEX) and total petroleum hydrocarbons (TPH), usingproprietary screening instruments (Hager and Jones,1990; Smith et al., 1992).
The borings were drilled to confirm the morphologyof the soil-vapor-constituent plumes, to define the verticalextent of hydrocarbon constituents, and to determine thedepth to groundwater at various locations in the studyarea. A geologist logged each 2-ft soil core on-site. The log-ging results were used to determine the subsurface stratig-raphy and to fully characterize the subsurface contamina-tion in vadose-zone soils. The vertical distribution of

hydrocarbon contaminants was used to delineate sourceareas and to determine migration pathways.
Groundwater samples were also collected from bor-ings, through a slotted well point attached to the drillstring or through PVC slotted casing temporarily insertedinto the boreholes. Other groundwater samples were de-rived from conventional monitoring wells.
Completion of Monitoring Wells
Thirteen monitoring wells were drilled and complet-ed using a rotary-drill rig with hollow-stem augers of 11-in. outside diameter. Locations of monitoring wells weredetermined using borehole and soil-vapor data. The wellswere completed at total depths of 23 to 29 ft (7 to 8.7 m).
FIGURE 5. The sites at which soil-vapor samples were collected, indicated by dots.

Each well was developed to ensure that a fresh fluid sam-ple was obtained from the aquifer. After the wells were al-lowed to recharge, disposable bailers were used to collectfluid (groundwater/NAPL) samples from each well. The lo-cations of borings and monitoring wells, drilled and in-stalled during this study, are shown on Figure 1.
Twelve of the monitoring wells installed containedNAPL. Several of these wells were installed within 50 to100 ft (15 to 30 m) of preexisting wells that containedonly moderate levels of dissolved-phase contaminants.No NAPL was found in the preexisting wells, because theywere located outside the narrow channels (preferentialmigration pathways) along which the liquid contami-nants migrated. The only well installed during this studythat did not encounter NAPL was intentionally located along distance down-gradient to serve as a permanent“background” sampling station.
Laboratory Analyses
Soil VaporsSoil-vapor samples were analyzed for C1–C4 (meth-
ane, ethane, propane, and butanes) and C5+ (pentane–xylenes+) hydrocarbons and for carbon dioxide (CO2).Laboratory results of hydrocarbon analyses were quanti-fied in parts per million by volume (ppmv), and carbondioxide concentrations in percent by volume.
Two flame-ionization-detector (FID) gas chroma-tographs were used to independently determine theC1–C4 (methane, ethane, propane, and butanes) and C5+(pentane–xylenes+) hydrocarbon concentrations, in orderto characterize and quantify the hydrocarbon con-stituents present. Light-hydrocarbon analyses (C1–C4)measure the most volatile constituents present in gaso-lines, diesels, jet fuels, and other petroleum products.Methane, ethane, propane, and butanes are present invarying concentrations in most refined petroleum prod-ucts. These light-hydrocarbon compounds tend tovolatilize and dissipate rapidly with time and/or distancefrom the point(s) at which petroleum constituents are in-troduced into the subsurface environment. These lightgases are often sustained by solubility enhancements asso-ciated with the presence of liquid product. Light-hydro-carbon analyses allow for the identification and differenti-ation of natural gas, biogenic methane, gasoline, diesel,and other refined petroleum products.
Pentane–xylenes+ (C5+) hydrocarbon analyses yield aquantitative measure of the concentrations, by volume, ofpetroleum-product vapors present in near-surface soils.C5+ hydrocarbons dissipate more slowly than lighter-frac-tion (C1–C4) compounds. Because of the large number ofindividual compounds present in gasolines, diesels, jetfuels, and the like, the results of C5+ analyses are oftengrouped and reported according to the relative boilingpoints of selected hydrocarbon compounds. For thisstudy, analytical laboratory results were quantified and
summed for the following groups of hydrocarbon com-pounds: pentane to benzene, benzene to toluene, tolueneto xylene, and xylenes+. Laboratory results of C1–C4 andC5+ hydrocarbons were measured in parts per million byvolume (ppmv).
Carbon dioxide is generated by the biodegradation ofpetroleum products (gasoline, diesel, kerosene, etc.), oils,greases, solvents, and other organic materials containedin the subsurface environment. Aerobic bacteria use theoxygen present in subsurface soils and groundwater toconsume organic material, such as hydrocarbons, to pro-duce carbon dioxide. These biochemical reactions arequite common in soils containing petroleum products,because such products are excellent food sources for bac-teria. Carbon dioxide (CO2) concentrations were deter-mined using a gas chromatograph equipped with a ther-mal-conductivity detector (TCD). These data, in tandemwith organic vapor analyses (C1–C4 and C5+), are very use-ful in defining the areal extent of hydrocarbon contami-nants in the subsurface environment. Carbon dioxideconcentrations were measured in percent by volume.
EPA Method Analyses—Soils and Groundwater
BTEX analyses of soils and groundwater were per-formed in accordance with EPA method 8020/5030 andEPA method 8020/602, respectively. TPH analyses of soilsand groundwater were performed in accordance with EPAmethod 418.1.
Preliminary MTBE analyses of groundwater sampleswere performed in accordance with EPA method 8020/602. Gas chromatography/mass spectrometry (GC/MS)analyses were also run on several selected samples to con-firm the presence and concentrations of MTBE (EPAmethod 8240 modified). Total lead analyses were per-formed on selected groundwater samples obtained frommonitoring wells, in accordance with EPA method 7420.
Vapor Headspace Analyses—Groundwater Samples
In addition to analyzing each groundwater sample inaccordance with EPA methodology, the vapor headspaceof each water sample collected from borings and monitor-ing wells was analyzed for dissolved C1–C4 (methane,ethane, propane, and butanes) and C5+ (gasoline range)hydrocarbons, using standard headspace methods. Theheadspace was introduced into each sample bottle by dis-placing 10 ml of water with nitrogen, prior to analysis. Re-sults of these analyses were quantified in parts per millionby volume (ppmv). Vapor headspace chromatogramswere also analyzed and used as an alternate method toconfirm the presence of MTBE.

Miscellaneous Analyses—Product Fingerprinting
Several analytical methods can be used to “finger-print” soil, water, and liquid product (NAPL) samples todetermine the specific petroleum-product type(s) respon-sible for the contamination. Some methods are more rig-orous and definitive than others. Fingerprinting tech-niques used in this study will be summarized below.
Synchronous fluorescence.—Synchronous fluo-rescence analyses were performed on soil-core samples ob-tained from the 91 borings (and 16 additional boreholesand monitoring wells drilled by oil-company consul-tants), as well as on selected fluid samples. These analysesprovide an estimate of the molecular-weight range of ex-tractable aromatic hydrocarbons contained in petroleumproducts. A spectrometer with an ultraviolet (UV) lightsource is used to analyze samples extracted into a hexanesolvent. When UV light is projected through the sample,the absorption and excitation of various aromatic hydro-carbon compounds occur. The excitation of aromatic com-pounds (e.g., benzene and polynuclear aromatic hydrocar-bons, or PAHs) causes the light to be emitted at differentwavelengths, depending on the range of compounds pres-ent. As shown by the product standards included in Figure6, this technique is an inexpensive tool for analyzing andfingerprinting petroleum compounds such as gasoline,diesel, kerosene, jet fuel, and crude oil, and is widely usedby the petroleum industry (Pharr et al., 1992; Gray et al.,1993).
Fluorescence analyses were used to screen soil samplesand identify types of petroleum products present in sub-surface sediments within impacted (plume) areas. Fluoro-grams generated for each 2-ft (0.6-m) soil-core interval areshown in Figure 6 to illustrate product type distributionsin boring PUBH-23, and in Figure 7 in various other bor-ings. The results are discussed in more detail below.
Modified EPA method 8015 (8015M).—Soil,groundwater, and liquid product (NAPL) samples were an-alyzed using EPA method 8015M (for total fuels hydrocar-bons). Samples were extracted into carbon disulfide (CS2)and analyzed by FID gas chromatography for C5+ hydro-carbons (C5–C20) to characterize (fingerprint) and deter-mine the concentrations of hydrocarbon compoundspresent. This well-established analytical method was usedto compare and confirm the results of the synchronousfluorescence analyses and to help select samples for high-resolution capillary gas chromatography analyses.
High-resolution capillary gas chromatogra-phy.—High-resolution capillary gas chromatography(HRCGC) is an excellent technique for fingerprinting var-ious types of refined and crude petroleum products (Bruceand Schmidt, 1994; Zemo et al., 1995). This technique ismore rigorous, more expensive, and more definitive thansynchronous fluorescence or method 8015M. Based onthese other methods, selected soil, groundwater, and liq-
uid product (NAPL) samples were analyzed using high-res-olution capillary gas chromatography, a modification ofASTM method D-3328. Soil and groundwater samples areprepared by using a methylene chloride solvent to extractvarious molecular-weight hydrocarbons from the matrix.Liquid product samples do not require an extraction pro-cedure. The extract or liquid product is analyzed on a cap-illary column using a flame ionization detector (FID) toidentify and characterize hydrocarbon compounds and todefine product types (gasoline, diesel, jet fuel, kerosene,solvents, and the like).
RESULTSSoil Vapors
Laboratory results of soil-vapor samples collecteddown-gradient of the six terminal properties indicate ele-vated concentrations of carbon dioxide (CO2) and meth-ane over a significant part of the survey area. Concentra-tions of CO2 in excess of 14% and methane in excess of10% are present south and east of the terminal properties,in residential areas and in Govalle Park. The biodegrada-tion of hydrocarbons by both aerobic and anaerobic bac-teria in the subsurface environment can occur within veryclose proximity, and thus can yield elevated concentra-tions of both carbon dioxide and methane in areas con-taining hydrocarbon contaminants (Hayman et al., 1988;Jones and Agostino, 1998). The excellent correlation of el-evated C5+ (pentane–xylenes+) hydrocarbon concentra-tions with elevated CO2 and methane concentrations in-dicates that the biogenic gases are the result ofdegradation of petroleum hydrocarbons in specific re-gions of the study area. Regional CO2, methane, and C5+concentration plume maps are included as Figures 8, 9,and 10, respectively. Three contaminant lobes exist be-tween the terminals and undeveloped properties and Go-valle Park and surrounding private properties. The plumemaps indicate that hydrocarbon contaminants originatedon the terminals and product pipeline properties, tra-versed the Company C undeveloped property, and mi-grated beneath city and private properties. Migrationpathways for the contaminant plumes are controlled bysilt-filled channels contained in the Pleistocene sedi-ments. These well-defined pathways are 50 to 150 ft (15 to45 m) wide, linear in shape, and separated by areas ofbackground concentrations of hydrocarbon and biogenicgases.
The distributions of ethane, propane, and normal bu-tane are similar to that of C5+ but are slightly more limit-ed in areal extent. Despite their lower magnitudes, thesemore volatile hydrocarbon compounds clearly exhibitcontaminant distributions similar to the C5+ plume map,further confirming the petrogenic nature and source ofthe off-site contamination. The high CO2, methane, andC5+ vapor concentrations, coupled with moderate con-

FIGURE 6. (a) Fluorograms showing product types identified in soils from the ground surface to -20 ft (6 m) in boring PUBH-23. (b) Bar graph showing the fluorescence data for various wavelength windows (in nm). (c) Standard fluorescence signatures for gasoline, diesel, crude oil, and jet fuel.
(b)
(a)
(c)
0358
10131518202325
Inte
nsity
225 425 475
0358
10131518202325
Inte
nsity
225 275 325 375 425 475Wavelength (nm)
PUBH-23 14-16’ Dilution 1:1
PUBH-23 10-12’ Dilution 1:1
Wavelength (nm)475425375325275225
Inte
nsity
756860534538302315
800
358
10131518202325
Inte
nsity
225 275 325 375 425 475Wavelength (nm)
PUBH-23 0-2’ Dilution 1:1
0358
10131518202325
Inte
nsity
225 275 325 375 425 475Wavelength (nm)
PUBH-23 18-20’ Dilution 1:1
PUBH-23 16-18’ Dilution 1:1
Wavelength (nm)475425375325275225
Inte
nsity
756860534538302315
80
PUBH-23 12-14’ Dilution 1:1
Wavelength (nm)475425375325275225
Inte
nsity
252320181513108530
PUBH-23 8-10’ Dilution 1:1
Wavelength (nm)475425375325275225
Inte
nsity
756860534538302315
80
PUBH-23 6-8’ Dilution 1:1
Wavelength (nm)475425375325275225
Inte
nsity
12511310088756350382513
0
0358
10131518202325
Inte
nsity
225 275 325 375 425 475Wavelength (nm)
PUBH-23 4-6’ Dilution 1:1
PUBH-23 2-4’ Dilution 1:1
Wavelength (nm)475425375325275225
Inte
nsity
252320181513108530
Inte
nti
sy
PRODUCT SIGNATURESSYNCHRONOUS FLUORESCENCE
JET FUELSOUTH LA. CRUDEDIESELGASOLINE
Wavelength (nm)475425375325275225
150
135
120
105
90
75
60
45
30
15
0
FLUORESCENCE (nm)10 100 1,000
18-20’
16-18’
14-16’
12-14’
10-12’
8-10’
6-8’
4-6’
2-4’
0-2’
275 (nm)
305 (nm)
335 (nm)
389 (nm)
FLUORESCENCE (nm) - PUBH-23310 A
gostino et al.

FIGURE 7. Cross-section B-B’ showing fluorograms for each 2 ft (0.6 m) soil core sample collected and analyzed in various borings. Note varia-tions in intensity and contaminant type in individual borings and along the line of section. Different product types are color-coded in accordance with the legend at the lower right.
0102030405060708090
100
Inte
nsity
225 275 325 375 425 475Wavelength (nm)
SITE 4 0-2' Dilution 1:40
0153045607590
105120135150
Inte
nsity
225 275 325 375 425 475Wavelength (nm)
SITE 4 2-4' Dilution 1:1
0358
10131518202325
Inte
nsity
225 275 325 375 425 475Wavelength (nm)
SITE 4 4-6' Dilution 1:1
0255075
100125150175200225250
Inte
nsity
225 275 325 375 425 475Wavelength (nm)
SITE 4 10-12' Dilution 1:4
0358
10131518202325
Inte
nsity
225 275 325 375 425 475Wavelength (nm)
SITE 4 6-8' Dilution 1:1
08
152330384553606875
Inte
nsity
225 275 325 375 425 475
Wavelength (nm)
SITE 4 8-10' Dilution 1:1
01835537088
105123140158175
Inte
nsity
225 275 325 375 425 475Wavelength (nm)
SITE 4 12-14' Dilution 1:4
013253850637588
100113125
Inte
nsity
225 275 325 375 425 475
Wavelength (nm)
SITE 4 14-16' Dilution 1:2
05
101520253035404550
Inte
nsity
225 275 325 375 425 475
Wavelength (nm)
SITE 4 16-18 Dilution 1:1
05
101520253035404550
Inte
nsity
225 275 325 375 425 475Wavelength (nm)
SITE 19 18-20' Dilution 1:1
08
152330384553606875
Inte
nsity
225 275 325 375 425 475Wavelength (nm)
SITE 19 16-18' Dilution 1:1
08
152330384553606875
Inte
nsity
225 275 325 375 425 475Wavelength (nm)
SITE 19 14-16' Dilution 1:4
08
152330384553606875
Inte
nsity
225 275 325 375 425 475Wavelength (nm)
SITE 19 12-14' Dilution 1:20
0102030405060708090
100
Inte
nsity
225 275 325 375 425 475Wavelength (nm)
SITE 19 10-12' Dilution 1:20
08
152330384553606875
Inte
nsity
225 275 325 375 425 475Wavelength (nm)
SITE 19 8-10' Dilution 1:40
0358
10131518202325
Inte
nsity
225 275 325 375 425 475Wavelength (nm)
SITE 19 6-8' Dilution 1:1
0358
10131518202325
Inte
nsity
225 275 325 375 425 475
Wavelength (nm)
SITE 19 4-6' Dilution 1:1
0358
10131518202325
Inte
nsity
225 275 325 375 425 475
Wavelength (nm)
SITE 19 2-4' Dilution 1:1
0358
10131518202325
Inte
nsity
225 275 325 375 425 475
Wavelength (nm)
SITE 19 0-2' Dilution 1:1
08
152330384553606875
Inte
nsity
225 275 325 375 425 475Wavelength (nm)
SITE 20 0-2' Dilution 1:10
0358
10131518202325
Inte
nsity
225 275 325 375 425 475
Wavelength (nm)
SITE 20 2-4' Dilution 1:10
05
101520253035404550
Inte
nsity
225 275 325 375 425 475
Wavelength (nm)
SITE 20 4-6' Dilution 1:1
0358
10131518202325
Inte
nsity
225 275 325 375 425 475
Wavelength (nm)
SITE 20 6-8' Dilution 1:1
0358
10131518202325
Inte
nsity
225 275 325 375 425 475
Wavelength (nm)
SITE 20 8-10' Dilution 1:1
0102030405060708090
100
Inte
nsity
225 275 325 375 425 475Wavelength (nm)
SITE 20 10-12' Dilution 1:20
08
152330384553606875
Inte
nsity
225 275 325 375 425 475
Wavelength (nm)
SITE 20 14-16' Dilution 1:20
0102030405060708090
100
Inte
nsity
225 275 325 375 425 475Wavelength (nm)
SITE 20 12-14' Dilution 1:20
08
152330384553606875
Inte
nsity
225 275 325 375 425 475
Wavelength (nm)
SITE 20 16-18' Dilution 1:10
08
152330384553606875
Inte
nsity
225 275 325 375 425 475Wavelength (nm)
SITE 20 18-20' Dilution 1:2
0358
10131518202325
Inte
nsity
225 275 325 375 425 475
Wavelength (nm)
SITE 22 0-2' Dilution 1:1
0358
10131518202325
Inte
nsity
225 275 325 375 425 475Wavelength (nm)
SITE 22 2-4' Dilution 1:1
0358
10131518202325
Inte
nsity
225 275 325 375 425 475
Wavelength (nm)
SITE 22 4-6' Dilution 1:1
0358
10131518202325
Inte
nsity
225 275 325 375 425 475
Wavelength (nm)
SITE 22 6-8' Dilution 1:1
08
152330384553606875
Inte
nsity
225 275 325 375 425 475Wavelength (nm)
SITE 22 8-10' Dilution 1:2
08
152330384553606875
Inte
nsity
225 275 325 375 425 475Wavelength (nm)
SITE 22 10-12' Dilution 1:20
08
152330384553606875
Inte
nsity
225 275 325 375 425 475Wavelength (nm)
SITE 22 12-14' Dilution 1:40
0102030405060708090
100In
tens
ity
225 275 325 375 425 475Wavelength (nm)
SITE 22 14-16' Dilution 1:20
013253850637588
100113125
Inte
nsity
225 275 325 375 425 475Wavelength (nm)
SITE 22 16-18' Dilution 1:10
08
152330384553606875
Inte
nsity
225 275 325 375 425 475
Wavelength (nm)
SITE 22 18-20' Dilution 1:10
0358
10131518202325
Inte
nsity
225 275 325 375 425 475Wavelength (nm)
SITE 23 0-2' Dilution 1:1
0358
10131518202325
Inte
nsity
225 275 325 375 425 475Wavelength (nm)
SITE 23 2-4' Dilution 1:1
0358
10131518202325
Inte
nsity
225 275 325 375 425 475Wavelength (nm)
SITE 23 4-6' Dilution 1:1
0358
10131518202325
Inte
nsity
225 275 325 375 425 475
Wavelength (nm)
SITE 23 6-8' Dilution 1:1
0358
10131518202325
Inte
nsity
225 275 325 375 425 475Wavelength (nm)
SITE 23 8-10' Dilution 1:1
0358
10131518202325
Inte
nsity
225 275 325 375 425 475
Wavelength (nm)
SITE 23 10-12' Dilution 1:1
0102030405060708090
100
Inte
nsity
225 275 325 375 425 475
Wavelength (nm)
SITE 23 12-14' Dilution 1:10
0102030405060708090
100
Inte
nsity
225 275 325 375 425 475Wavelength (nm)
SITE 23 14-16' Dilution 1:20
0102030405060708090
100
Inte
nsity
225 275 325 375 425 475
Wavelength (nm)
SITE 23 16-18' Dilution 1:4
0153045607590
105120135150
Inte
nsity
225 275 325 375 425 475
Wavelength (nm)
SITE 23 18-20' Dilution 1:40
0358
10131518202325
Inte
nsity
225 275 325 375 425 475
Wavelength (nm)
SITE 24 0-2' Dilution 1:1
0358
10131518202325
Inte
nsity
225 275 325 375 425 475
Wavelength (nm)
SITE 24 2-4' Dilution 1:1
0358
10131518202325
Inte
nsity
225 275 325 375 425 475
Wavelength (nm)
SITE 24 4-6' Dilution 1:1
0358
10131518202325
Inte
nsity
225 275 325 375 425 475
Wavelength (nm)
SITE 24 6-8' Dilution 1:1
0358
10131518202325
Inte
nsity
225 275 325 375 425 475
Wavelength (nm)
SITE 24 8-10' Dilution 1:1
0358
10131518202325
Inte
nsity
225 275 325 375 425 475Wavelength (nm)
SITE 24 10-12' Dilution 1:1
0358
10131518202325
Inte
nsity
225 275 325 375 425 475Wavelength (nm)
SITE 24 12-14' Dilution 1:1
0102030405060708090
100
Inte
nsity
225 275 325 375 425 475
Wavelength (nm)
SITE 24 14-16' Dilution 1:10
013253850637588
100113125
Inte
nsity
225 275 325 375 425 475
Wavelength (nm)
SITE 24 16-18' Dilution 1:10
08
152330384553606875
Inte
nsity
225 275 325 375 425 475Wavelength (nm)
SITE 24 18-20' Dilution 1:1
0102030405060708090
100
Inte
nsity
225 275 325 375 425 475Wavelength (nm)
SITE 27 0-2' Dilution 1:2
08
152330384553606875
Inte
nsity
225 275 325 375 425 475
Wavelength (nm)
SITE 27 8-10' Dilution 1:1
08
152330384553606875
Inte
nsity
225 275 325 375 425 475
Wavelength (nm)
SITE 27 6-8' Dilution 1:1
0358
10131518202325
Inte
nsity
225 275 325 375 425 475Wavelength (nm)
SITE 27 4-6' Dilution 1:10
08
152330384553606875
Inte
nsity
225 275 325 375 425 475Wavelength (nm)
SITE 27 2-4' Dilution 1:2000
0358
10131518202325
Inte
nsity
225 275 325 375 425 475Wavelength (nm)
SITE 27 10-12' Dilution 1:1
05
101520253035404550
Inte
nsity
225 275 325 375 425 475
Wavelength (nm)
SITE 27 12-14' Dilution 1:1
08
152330384553606875
Inte
nsity
225 275 325 375 425 475Wavelength (nm)
SITE 27 14-16' Dilution 1:40
013253850637588
100113125
Inte
nsity
225 275 325 375 425 475
Wavelength (nm)
SITE 27 16-18' Dilution 1:10
0102030405060708090
100
Inte
nsity
225 275 325 375 425 475Wavelength (nm)
SITE 27 18-20' Dilution 1:4
0102030405060708090
100
Inte
nsity
225 275 325 375 425 475Wavelength (nm)
SITE 28 0-2' Dilution 1:4
08
152330384553606875
Inte
nsity
225 275 325 375 425 475
Wavelength (nm)
SITE 28 2-4' Dilution 1:1000
08
152330384553606875
Inte
nsity
225 275 325 375 425 475Wavelength (nm)
SITE 28 4-6' Dilution 1:2
0358
10131518202325
Inte
nsity
225 275 325 375 425 475Wavelength (nm)
SITE 28 6-8' Dilution 1:500
08
152330384553606875
Inte
nsity
225 275 325 375 425 475
Wavelength (nm)
SITE 28 8-10' Dilution 1:20
0102030405060708090
100
Inte
nsity
225 275 325 375 425 475Wavelength (nm)
SITE 28 10-12' Dilution 1:20
0102030405060708090
100
Inte
nsity
225 275 325 375 425 475Wavelength (nm)
SITE 28 12-14' Dilution 1:40
0358
10131518202325
Inte
nsity
225 275 325 375 425 475Wavelength (nm)
SITE 28 14-16' Dilution 1:20
020406080
100120140160180200
Inte
nsity
225 275 325 375 425 475Wavelength (nm)
SITE 28 16-18' Dilution 1:1
0102030405060708090
100
Inte
nsity
225 275 325 375 425 475Wavelength (nm)
SITE 28 18-20' Dilution 1:10
Assessm
ent of Subsurface Hydrocarbon C
ontamination 311

centrations of light-hydrocarbon compounds (ethane,propane, and butanes) adjacent to the terminal proper-ties, pipelines, residential areas, and Govalle Park, confirmthat there have been releases of petroleum hydrocarbonsto the area from the terminal properties.
A natural-gas pipeline leak was detected along ShadyLane, west of the Terminal A property. The soil-vapor re-
sults in this area indicated a typical natural-gas signature(where methane > ethane > propane > isobutane, and soforth). Methane concentrations in excess of 60% andethane in excess of 3% (and other light gases) confirmedthis linear anomaly as natural gas. Carbon dioxide anom-alies having a limited areal extent are present in otherparts of the study area. These anomalies are interpreted as
FIGURE 8. Color contour map of CO2 soil-vapor plume.

resulting from the biodegradation of organic material(s)other than petroleum hydrocarbons, because no signifi-cant concentrations of C1–C4 or C5+ hydrocarbons arepresent in these areas.
Soil-vapor surveys, conducted using relatively densesampling grids, were necessary to delineate the areal extentof subsurface contamination and especially the narrow mi-
gration pathways controlled by the subsurface geology(channels) along which contaminants moved beneath pri-vate properties and Govalle Park. Plume maps constructedusing the soil-vapor data were used to optimally locateborings and monitoring wells in the study area, with vir-tually 100% accuracy.
FIGURE 9. Color contour map of methane soil-vapor plume.

SoilsSoil-core samples collected during direct-push bor-
ing operations were analyzed, using various screeningand accepted oil-industry analytical techniques, to de-termine the degree of impact and to identify specific pe-troleum products responsible for the impact. Each com-posite 2-ft soil sample was analyzed initially (screened)using a derivative ultraviolet spectrometer for BTEXcompounds and a fixed-wavelength infrared spectrome-ter for total petroleum hydrocarbons (Hager and Jones,1990; Smith et al., 1992). In addition, synchronous fluo-rescence and EPA method 8015M analyses were per-formed on all soil-core samples. These analyses can bedefinitive in determining the source(s) and products re-sponsible for the impact.
BTEX and TPH screening analyses were used to deter-mine the soils having the highest contaminant levels.These samples were then analyzed for BTEX and TPH,using EPA methodology in order to comply with standardregulatory practices. The TPH screening analyses were alsoused to construct TPH concentration “slice” maps (Figure11) for various depth intervals using the continuous soilscreening data. These slice maps show the areal and verti-cal distribution of heavier-molecular-weight hydrocarboncontaminants and the cones of dispersion in vadose-zonesoils associated with various petroleum-product releaseson the terminals and pipeline properties.
EPA-method BTEX and TPH analyses were performedon selected samples collected both from borings andmonitoring wells. These data were integrated with datacollected by consultants for the terminal and pipelineowners and operators. Figures 12 and 13 are isoconcentra-tion maps of total BTEX and TPH concentrations (EPAmethod 418.1 results) in vadose-zone soils beneath pri-vate properties, Govalle Park, and the terminals and prod-uct pipeline (undeveloped) properties. These isoconcen-tration maps include larger areas (including the terminalproperties) than do the soil-vapor maps and provide thelinks between impacted soils on COA (Govalle Park) andprivate properties and the terminal and pipeline proper-ties located up-gradient. It is apparent from these mapsthat contaminants in subsurface soils are the result of re-leases of hydrocarbons from multiple locations on the ter-minal and pipeline properties.
Lithologic information from borings confirms thatsilt sediments (channels) control the migration of the pe-troleum hydrocarbons off the terminal and pipeline prop-erties. The locations of the silt channels in general are de-fined by the soil-vapor, BTEX, and TPH plume maps andare consistent with the silt isopach map (Figure 2). The pe-troleum contaminants, located using various geochemicalmethods, are analogous to dyes that stain the sediments,thus outlining the geologic pathways. The narrow migra-tion pathways (channels) are best defined on the soil-vapor maps (Figures 8, 9, and 10) because of the largernumber (higher density) of sample locations. These nar-
row pathways were not defined by the random drillingperformed by other consultants prior to this study.
Groundwater
Dissolved-phase contaminant plume maps were con-structed, including total BTEX, TPH, and MTBE concentra-tions, containing data collected during the third quarter of1994. The total BTEX, TPH, and MTBE plume maps are in-cluded here as Figures 14, 15, and 16, respectively. The dis-solved-phase groundwater data used to construct thesemaps were collected from direct-push borings and moni-toring wells drilled for the COA and from monitoring wellson the terminal properties (data collected by oil-companyconsultants) during a scheduled quarterly monitoringevent. This data set (196 groundwater analyses) is the mostcomprehensive one assembled in the study area.
The major total BTEX plume (Figure 14) extends southfrom Terminal B across terminals C, D, and E and undevel-oped (pipeline) properties, and south of Shady Lane acrossprivate properties and Govalle Park. A smaller plume of el-evated BTEX concentrations is located on and south of theTerminal A property. The Terminal F property also showssignificant BTEX contamination that extends eastwardacross private properties into Govalle Park and south of theintersection of Airport Boulevard and Bolm Road.
The TPH plume (Figure 15) has a geometry similar tothat of the BTEX plume. Large portions of the terminaland pipeline properties, private properties, and GovallePark exceed 1000 µg/L (or 1 ppm), which was the TNRCCaction level for this area during the time the initial assess-ments were conducted. Both the total BTEX and TPHplumes clearly indicate off-site migration of petroleumhydrocarbon contaminants from the terminal and pipe-line properties.
Methyl tertiary butyl ether (MTBE), the most com-mon oxygenate additive in gasoline, is more soluble(48,000 mg/L) in groundwater than other petroleum hy-drocarbon compounds. It does not sorb to aquifer mate-rial and is more mobile than other BTEX compounds. Evi-dence indicates that MTBE moves as rapidly in ground-water as a conservative tracer and undergoes only disper-sive attenuation (Barker et al., 1990; Squillace et al., 1996).Because of its extremely high solubility and mobility, theMTBE plume (Figure 16) exhibits the greatest areal extentof the dissolved-phase contaminants. Although there isno established TNRCC action level or target cleanup goalfor MTBE at the present time, the EPA has established aHealth Advisory Level of 40 µg/L (or 40 ppb) as the limitconsidered safe for drinking water. Other regulatory au-thorities, such as the state of Maine (which has a 50-µg/Laction level), consider MTBE to be a health hazard (Klanand Carpenter, 1994). In 1999, California outlawed thefuture use of MTBE in gasoline.
The MTBE plume is the most extensive in areal ex-tent, and indicates that releases of MTBE occurred over

time on all the terminals and some pipeline properties.The MTBE plume confirms that releases on the terminaland pipeline properties have impacted Govalle Park andprivate properties down-gradient (south-southeast), atleast as far as the baseball field south of Boggy Creek (Fig-ure 16).
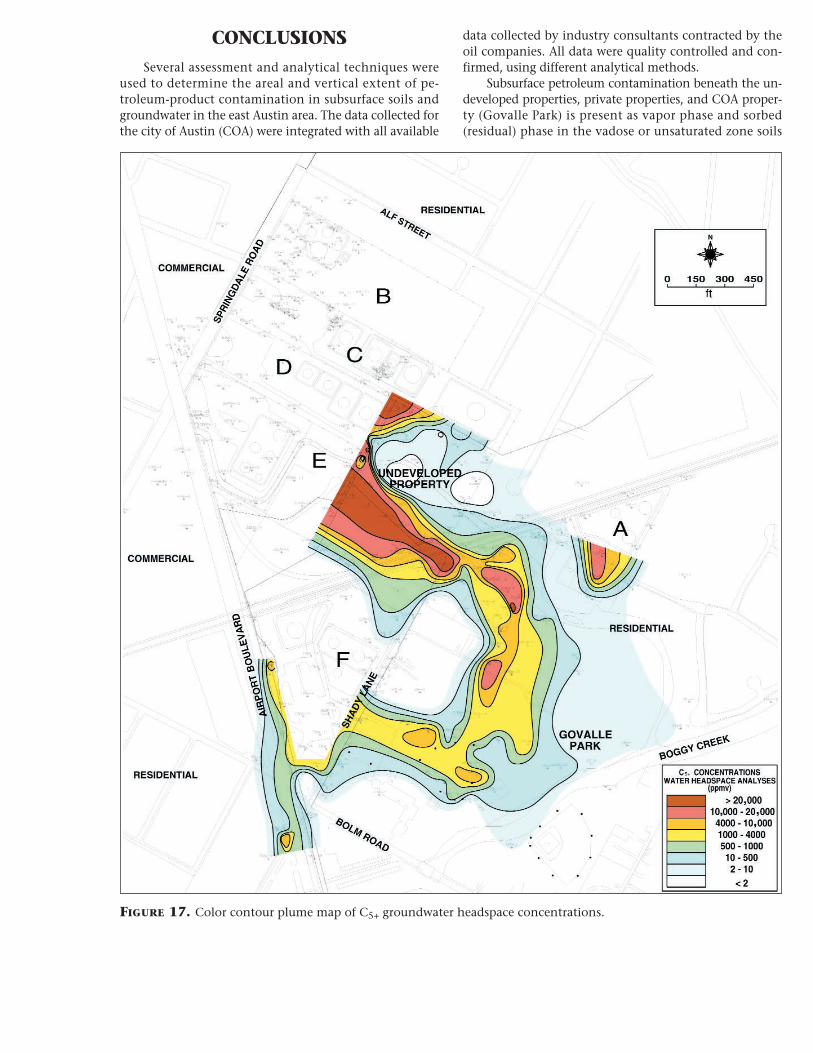
Vapor headspace concentrations of C5+ (Figure 17)were measured, plotted, and mapped for all groundwatersamples collected by Exploration Technologies, Inc., be-tween June and September 1995. The headspace analyses
provide an independent and alternate data set for quanti-fying volatile hydrocarbon components present ingroundwater. The C5+ vapor headspace concentrationsmap (in ppmv) shows a contaminant plume similar inmorphology to the BTEX and TPH plumes, and indicatesthat groundwater is impacted over a larger areal extentthan indicated by the BTEX and TPH maps (Figures 14and 15). Note that this plume was not mapped on the ter-minal properties, because the monitoring wells on theseproperties were not available for sampling.
FIGURE 10. Color contour map of C5+ (pentane–xylenes+) soil-vapor plume.

FIGURE 11. TPH screening analyses “slice” maps, showing the areal extent of TPH concentrations at various depthintervals (slices) over the interval 8 ft to 20 ft (2.4 m to 3 m) below the ground surface.
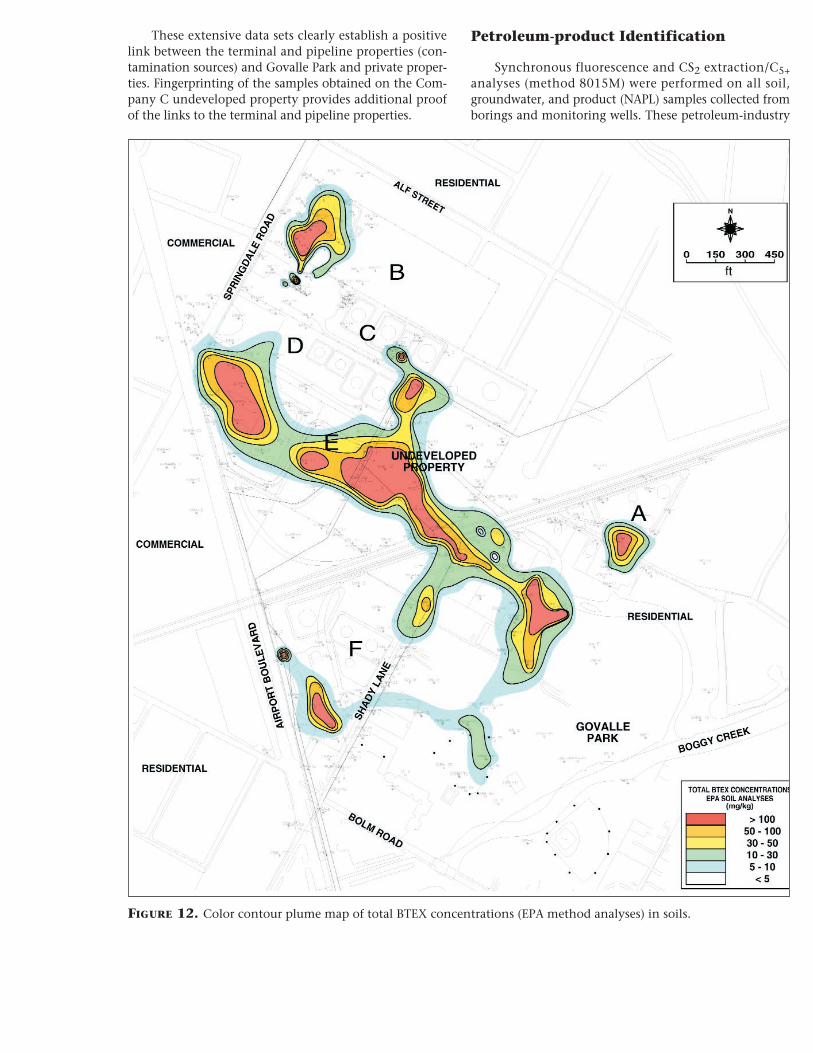
These extensive data sets clearly establish a positivelink between the terminal and pipeline properties (con-tamination sources) and Govalle Park and private proper-ties. Fingerprinting of the samples obtained on the Com-pany C undeveloped property provides additional proofof the links to the terminal and pipeline properties.
Petroleum-product Identification
Synchronous fluorescence and CS2 extraction/C5+analyses (method 8015M) were performed on all soil,groundwater, and product (NAPL) samples collected fromborings and monitoring wells. These petroleum-industry
FIGURE 12. Color contour plume map of total BTEX concentrations (EPA method analyses) in soils.

analytical methods are relatively inexpensive (comparedwith EPA analyses) and are quite definitive in distinguish-ing specific petroleum products. Figure 6 shows synchro-nous fluorescence results of soil cores obtained from di-rect-push boring PUBH-23 (highlighted in Figure 1),located on the western boundary of the undevelopedproperty. The figure includes fluorograms (signatures) of
soil-core samples (2-ft [0.6-m] lengths) collected continu-ously, from 0–2 ft deep, down to the total depth of theboring (18–20 ft [5.4–6 m]). The fluorograms graphicallydemonstrate that subsurface contamination begins at adepth of approximately 6–8 ft (1.8–2.4 m), and the signa-tures indicate that the contaminants are mixtures of dieseland gasoline. These signatures continue to a depth of 12–14
FIGURE 13. Color contour plume map of TPH concentrations (EPA method analyses) in soils.

ft (3.6–4.2 m). At 14–16 ft (4.2–4.8 m), petroleum contam-ination is virtually absent, as shown by the fluorograms.At a depth of 16–18 ft (4.8–5.4 m), petroleum contamina-tion is again apparent, but the signature indicates that theproduct type is gasoline.
Cross section B-B’ (Figure 7) shows synchronous fluo-
rescence signatures for various direct-push borings locateddown-gradient of the terminal and pipeline properties.The location of this cross section is shown in Figure 2.This figure illustrates how the subsurface contaminationand contaminant type(s) vary with depth and location inthe study area. Both Figures 6 and 7 demonstrate that the
FIGURE 14. Color contour plume map of total BTEX concentrations (EPA method analyses) in groundwater.

contamination in the Austin study area is the result ofmultiple product releases present in distinct zones at vari-ous depths.
Based on the results of the fluorescence and CS2 ex-traction/C5+ analyses, selected product samples were ana-lyzed using high-resolution capillary gas chromatography(HRCGC). Product samples obtained (using a direct-push
sampling system) from site PUBH-23, between the Com-pany E and Company C pipeline manifolds, site PUBH-16at the south property line of the Company C undevelopedproperty, and sites PUBH-30 and PUBH-28 on privateproperties, were identified as jet fuel. Jet fuel was alsoidentified at numerous locations in Govalle Park and onprivate properties (Figure 18). In addition to jet fuel, sev-
FIGURE 15. Color contour plume map of TPH concentrations (EPA method analyses) in groundwater.

eral other product types were identified, including gaso-line (both leaded and unleaded), kerosene, MTBE, sol-vents, a heavy lubricant, and mixtures of those products.
Figure 18 shows HRCGC chromatograms of variouspetroleum products identified, and the locations (boringsand monitoring wells) where those products were ob-tained. The petroleum-product types identified from liq-
uid product (NAPL) samples were also found and identi-fied in soil and groundwater samples collected in thestudy area. All fingerprinting results (excluded from thispaper because of space limitations) are included in thecomprehensive report prepared by Exploration Technolo-gies, Inc., and submitted to the TNRCC (ExplorationTechnologies, Inc., 1995).
FIGURE 16. Color contour plume map of MTBE concentrations (EPA method analyses) in groundwater.
CONCLUSIONSSeveral assessment and analytical techniques were
used to determine the areal and vertical extent of pe-troleum-product contamination in subsurface soils andgroundwater in the east Austin area. The data collected forthe city of Austin (COA) were integrated with all available
data collected by industry consultants contracted by theoil companies. All data were quality controlled and con-firmed, using different analytical methods.
Subsurface petroleum contamination beneath the un-developed properties, private properties, and COA proper-ty (Govalle Park) is present as vapor phase and sorbed(residual) phase in the vadose or unsaturated zone soils
FIGURE 17. Color contour plume map of C5+ groundwater headspace concentrations.

FIGURE 18. Map of study area, showing product types identified in fluid (NAPL and groundwater) samples collectedfrom borings and monitoring wells using high-resolution capillary gas chromatography. Product types are color-codedin accordance with the legend at lower right. High-resolution capillary GC chromatogram signatures are shown foreach boring and monitoring-well sample analyzed.

and as liquid (NAPL), dissolved, and sorbed phase in thesaturated zone or groundwater aquifer. The sources of thevapor, soil, and groundwater contamination were multiplereleases on the oil companies’ terminal and pipeline prop-erties. Contamination resulting from these releases has co-alesced in soils and groundwater and subsequently has mi-grated off-site onto public and private properties.
Soil-vapor, soil, and groundwater isoconcentrationmaps; geologic cross sections; and product analyses wereused to delineate and demonstrate the areal and verticalextent of the impact of petroleum hydrocarbons on pri-vate and public properties down-gradient of the six for-mer fuel storage and distribution terminals and productpipeline properties in the east Austin area of Austin,Texas. Results of the assessment study are summarized asfollows.
Elevated soil-vapor concentrations present in near-surface soils are the result of petroleum-product contami-nation in subsurface soils and groundwater.
Various refined petroleum products have impactedsubsurface soils, extending from the ground surface to thegroundwater in many areas. These soils containingsorbed- (residual-) phase hydrocarbons are and will con-tinue to be the major source of dissolved-phase contami-nation in the aquifer.
The groundwater aquifer in the east Austin area hasbeen impacted by multiple releases of refined petroleumproducts, as exhibited by liquid-phase (NAPL) hydrocar-bons on the groundwater in several areas, and by the ele-vated concentrations of dissolved-phase total BTEX, MTBE,and TPH.
The groundwater flow in the area is generally to thesouth-southeast, down-gradient of the six former storageand distribution terminals and pipeline properties.
The MTBE plume (the most soluble compound pres-ent in refined petroleum products) is the largest in arealextent, measuring more than 3000 ft (900 m) in lengthfrom northwest to southeast. This plume extends morethan 1800 ft (540 m) down-gradient (south-southeast) ofthe terminal and pipeline properties across Boggy Creek.
Analytical results of soil, groundwater, and liquidproduct (NAPL) samples, using synchronous fluorescence,EPA method 8015M, and high-resolution capillary gaschromatography, indicate that the petroleum products re-sponsible for the contamination are gasoline, kerosene,jet fuel, diesel, solvents, and a heavy lubricant. These areessentially all the products that were handled or stored onthe terminal and pipeline properties.
The ages of the petroleum products impacting Gov-alle Park and private properties, in some cases, exceed 20years, based on high-resolution capillary GC analyses andhistorical data.
In most of the impacted parts of the study area, mix-tures of different petroleum products have been identi-fied, indicating that there have been multiple releases ofhydrocarbon products.
The majority of the NAPL found in the off-site (down-gradient) wells was weathered (aged) jet fuel. Oil-compa-ny consultants did not report losses of jet fuel, primarilybecause such losses occurred prior to 1987.
The sources of the three major coalescing contami-nant plumes are the six former fuel storage and distribu-tion terminals and associated pipelines owned and operat-ed by companies B, C, D, E, F, and A.
ACKNOWLEDGMENTSThe authors express their sincere appreciation to Olga
Sandria-O’Neal for designing and drafting the figures andassisting in the preparation of the manuscript. We alsothank Chester Beaver and the city of Austin, Texas, fortheir support of this study and for permission to publishthe results.
REFERENCES CITEDBarker, J. F., C. E. Hubbard, and L. A. Lemon, 1990, The in-
fluence of methanol and MTBE on the fate and persis-tence of monoaromatic hydrocarbons in groundwa-ter: Proceedings of Petroleum Hydrocarbons andOrganic Chemicals in Ground Water—Prevention,Detection, and Restoration, p. 113–127.
Bruce, L. G., and G. W. Schmidt, 1994, Hydrocarbon fin-gerprinting for application in forensic geology: Re-view with case studies: AAPG Bulletin, v. 78, no. 11, p.1692–1710.
Exploration Technologies, Inc., 1994, Summary of subsur-face petroleum product contamination, east Austinbulk storage terminal area: Austin, Texas, January1994, report submitted to TNRCC (Texas Natural Re-source Conservation Commission), 13 p.
Exploration Technologies, Inc., 1995, Environmental in-vestigation of subsurface hydrocarbon contamina-tion, east Austin storage and distribution terminalsarea: Austin, Texas, November 28, 1995, report sub-mitted to TNRCC (Texas Natural Resource Conserva-tion Commission), 24 p.
Garner, L. E., and K. P. Young, 1976, Environmental geol-ogy of the Austin area: An aid to urban planning: Bu-reau of Economic Geology, University of Texas atAustin, Report of Investigations, no. 86, 39 p.
Gray, N. R., S. J. McMillen, and A. G. Requejo, 1993, Rapidcharacterization of PAHs in oils and soils by totalscanning fluorescence: SPE Paper 25990, presented atthe 1993 SPE/EPA Exploration & Production Environ-mental Conference, San Antonio, March 7–10, 1993,p. 465–475.
Hager, Robert N., and V. T. Jones, 1990, Field screening forBTEX in soils using ultra-violet derivative spec-troscopy. Presented at the Fifth Annual Conference,Hydrocarbon Contaminated Soils—Analysis, Fate, En-vironmental & Public Health Effects, Remediation,and Regulation, September 24–27, 1990, School of

Public Health, University of Massachusetts, Amherst,8 p.
Hayman, J. W., R. B. Adams, and J. J. McNally, 1988,Anaerobic biodegradation of hydrocarbon in con-fined soils beneath busy places: A unique problem ofmethane control: Proceedings of Petroleum Hydrocar-bons and Organic Chemicals in Ground Water: Pre-vention, Detection, and Restoration, v. 1, p. 383–396.
Jones, V. T. III, and P. N. Agostino, 1998, Case studies ofanaerobic methane generation at a variety of hydro-carbon fuel contaminated sites: 1998 Petroleum Hy-drocarbons and Organic Chemicals in Ground Water:Prevention, Detection, and Remediation, Proceed-ings, p. 94–129.
Klan, M. J., and M. J. Carpenter, 1994, A risk-based drink-ing water concentration for methyl tertiary butylether (MTBE): The Proceedings of the 1994 PetroleumHydrocarbons and Organic Chemicals in GroundWater: Prevention, Detection, and Remediation Con-ference, p. 107–115.
Marrin, D. L., 1988, Soil-gas sampling and misinterpreta-tion: Groundwater Monitoring Report, spring, p.51–57.
Pharr, D. Y., J. K. McKenzie, and A. B. Hickman, 1992, Fin-gerprinting petroleum contamination using synchro-nous scanning fluorescence spectroscopy: GroundWater, v. 30, no. 4, p. 484–489.
Robbins, G. A., B. G. Deyo, J. D. Stuart, and M. J. Lacy,1990a, Soil gas surveying for subsurface gasoline con-
tamination using total organic vapor detection instru-ments, Part I: Theory and laboratory experimenta-tion: Ground Water Monitoring Review, v. 10, no. 3(summer), p. 122–131.
Robbins, G. A., B. G. Deyo, J. D. Stuart, and M. J. Lacy,1990b, Soil gas surveying for subsurface gasoline con-tamination using total organic vapor detection instru-ments, Part II: Field experimentation: Ground WaterMonitoring Review, v. 10, no. 4 (fall), p. 110–117.
Smith, J. G., P. N. Agostino, and V. T. Jones III, 1992, Real-time on-site screening instruments for the identifica-tion of petroleum contaminants: Haztech Interna-tional Conference Proceedings, p. 2D-1–2D-25.
Squillace, P. J., J. S. Zogorski, W. G. Wilber, and C. V. Price,1996, Preliminary assessment of the occurrence andpossible sources of MTBE in groundwater in the Unit-ed States, 1993–1994: Environmental Science andTechnology, v. 30, no. 5, p. 1721–1730.
Texas Department of Water Resources, June 1983, Occur-rence, availability, and quality of ground water inTravis County, Texas: Report 276, 76 p.
Urbanec, D. A., 1963, Stream terraces and related depositsin the Austin area: M.A. thesis, University of Texas atAustin, 94 p.
Zemo, D. A., J. E. Bruya, and T. E. Graf, 1995, The applica-tion of petroleum hydrocarbon fingerprint characteri-zation in site investigation and remediation: GroundWater Monitoring Review, spring, p. 147–156.