assessment of resident wellbeing and perceived ... · assessment of resident wellbeing and...
TRANSCRIPT

Assessment of Resident Wellbeing and Perceived Biodiversity Impacts in the Padampur Resettlement,
Royal Chitwan National Park, Nepal
Final Report
Submitted to
HMG, Ministry of Forest and Soil Conservation, Nepal
HMG, Ministry of Local Development, Nepal HMG, Department of National Parks and Wildlife Conservation, Nepal
King Mahendra Trust for Nature Conservation, Nepal District Development Committee, Bharatpur, Chitwan, Nepal
Royal Chitwan National Park, Kasara, Chitwan, Nepal Padampur Village Development Committee, Padampur, Chitwan, Nepal
WWF-Nepal Program, Kathmandu, Nepal &
National Fish and Wildlife Foundation (NFWF) / Save The Tiger Fund (STF)
by Narayan P. Dhakal, M. S. (Ph. D. candidate)
Kristen C. Nelson, Ph. D. J. L. David Smith, Ph. D.
University of Minnesota
Department of Fisheries, Wildlife and Conservation Biology http://www.conbio.umn.edu
April 2006

Acknowledgements
This report would not have been completed without valuable support from organizations
and several individuals to whom we wish to express our sincere gratitude.
We would like to acknowledge National Fish and Wildlife Foundation (NFWF)’s Save
the Tiger Fund (STF) for providing financial support for the study. In particular, Ms.
Trecy Walhmer, former Director of Conservation Programs (DCP), provided constant
support from the initial project design, Mr. Mahendra Shrestha, Director Conservation
Program and Ms. Karin Vermilye, Project Administrator for continued assistance. We
would also like to thank Dr. Eric Dinnerstein for sharing his thoughts and resettlement
concepts in the design phase of this research study.
We wish to acknowledge the University of Minnesota’s, Conservation Biology Program
for scholarly and partial funding support. Dr. David Bengston provided very helpful
insights on Narayan Dhakal’s graduate committee. And our special thanks go to
Francesca J. Cuthbert for her support with the University’s administrative process and
Meagan Keefe for editing and formatting the final draft.
We deeply appreciate the help of the King Mahendra Trust for Nature Conservation’s
Biodiversity Conservation Center for providing secondary information to the project. We
especially thank Mr. Lal P. Gurung (Project Director), Mr. Prem Poudel, Mr. Pradip
Khanal, Mr. Bishnu B. Lama, Mr. Harka M. Lama, Mr. Kapil Pokharel, Mr. Yogendra
Lama and Mr, Janardan Parajuli. Their contribution to this project is valued highly.
In particular, we would like to extend our sincere appreciation to field surveyors, Mr.
Postraj Aryal, Mr. Birendra Mahato, Mr. Bhagarith Giri, Mr. Balaram Poudel, Ms. Indra
K. Aryal and Ms. Rupa Giri for their patience in completing the field data collection. We
are pleased the Padampur Village Development Committee (VDC) provided support
and a research permit for household interview. We would also like to thank Nepal
Indigenous Development Society (NIDS) and its staff in helping us during the household

survey. We are highly indebted with the support from the local level social workers, Mr.
Babu Ram Puri and Mr. Basudev Dhuganana, for their generous help in gathering field
information pertinent to our study.

Assessment of Resident Wellbeing and Perceived Biodiversity
Impacts in the Padampur Resettlement,
Royal Chitwan National Park, Nepal
Executive Summary
Considering people’s plight as a result of forced resettlement during the creation and
maintenance of national parks and protected areas in many African and Asian
countries, we investigate social, economic, and biodiversity impacts of a citizen-initiated
resettlement program in Padampur, Nepal. Findings are based on three focus group
sessions designed to understand the residents’ critique of the resettlement planning
process and a household survey (n=322) designed to investigate respondents’
comparative evaluation of wellbeing factors in old and new Padampur.
Mixed results, but many positive outcomes, were found regarding respondents’
evaluations of their wellbeing improvement existed in health services, physical access
and facilities, land ownership and title, and social ties after the resettlement. Whereas,
there was some loss of Tharu traditional knowledge and culture, loss of farm-based
jobs, water scarcity, and lower food production. Anticipated marginalization was
reduced through increased support services and women’s empowerment programs.
Respondents’ believed the resettlement would provide an increase in the Park’s core
wildlife habitat for endangered species, contributing to conservation of endangered
mega species (mainly rhino and tiger). Changes in wellbeing should be monitored in
order to evaluate the long-term socio-economic impact of citizen-initiated resettlement.
Of particular concern in Padampur is the need to increase off-farm economic
opportunities and water availability.

Lists of Tables & Figures Page Socio-demographic characteristics 63 Table 1: Total and sample population and gender categories of Padampur Village Development Committee (VDC) Table 2: Caste and ethnicity of respondent households and total population in Padampur Village Development Committee (VDC) Table 3: Age categories of members in sampled households Table 4: Religious beliefs of respondent households Table 5: Primary languages spoken in the respondent household. Table 6: Respondent household members’ education levels Table 7: Respondent household members’ primary occupations Table 8: Respondents’ origin, yes / no indicator question Table 9: Respondent’s origin: location Table 10: Respondents’ reason for migrating to Chitwan Table 11: Respondents’ willingness to leave old Padampur Table 12a: Respondents’ reasons for leaving old Padampur Table 12b: Respondents’ reasons for not agreeing to leave old Padampur Table 13: Respondents’ overall evaluation of the resettlement program 1. Land Tenure 65 Table 14: Land holding categories of households in old and new locations Table 15: Respondent households’ average land holding Table 16: Respondents’ ownership of land title in old and new locations Table 17: Respondents’ receipt of monetary compensation Table 18: Respondents’ evaluation of monetary compensation Table 19: Respondents’ comparisons of land quality in old and new location Table 20: Respondents’ overall evaluation of land distribution mechanism Table 21: Respondents’ reasons for biased land distribution Table 22: Ownership of land title among Tharu respondents 2. Employment 67 Table 23: Respondents’ evaluation of their economic status in old and new location Table 24: Respondents’ evaluation of changing job Table 25: Respondents’ reason for change in employment Table 26: Respondents’ comparison of employment opportunities Table 27: Respondents’ reasons for satisfaction and dissatisfaction Table 28: Comparative cultivated land, production, and market value for respondent households Table 29: Respondents’ household yearly income from off-farm job Table 30: Respondents’ involvement in small scale enterprise 3. Housing 68 Table 31: Respondents’ comparison of housing in old vs. new location Table 32: Respondents’ comparative evaluation on housing structures, building materials, water and energy sources in old vs. new location Table 33: Respondents’ comparison of their physical wealth in old vs. new 4. Marginalization 69 Table 34: Respondents’ evaluation of differential impacts on particular groups of people Table 35: Respondents’ evaluation of affected people Table 36: Respondents’ opinions of sustainability of support services Table 37: Respondents’ reasons for optimism and pessimism 5. Food Management 70 Table 38: Respondents’ comparison of child nutrition in new vs. old location

Table 39: Respondents’ evaluation of land allocation for adequate food production Table 40: Respondents’ ability to sell surplus production Table 41: Respondents’ reasons for fulfilling food deficit 6. Health Facilities 70 Table 42: Respondents’ comparison of the health situation in old vs. new location Table 43: Respondents’ evaluation of range of health services in new location Table 44: Respondents’ assessment of availability of sanitation facilities in new location Table 45: Respondents’ evaluation of women related health services 7. Common Property Resources 71 Table 46: Area of land allocation for common properties in new Padampur Table 47: Respondents’ comparison of physical infrastructures in old vs. new location Table 48: Respondents’ evaluation of compensation, planning, operation and sustainability of physical infrastructure in new Padampur 8. Social Ties 72 Table 49: Respondents’ view of neighbors in the new Padampur Table 50: Respondents’ opinion of characteristics of neighbors in the new Padampur Table 51: Respondents’ evaluation of social relations among new neighbors Biodiversity Impacts 72 Table 52: Respondents’ evaluation of impacts of resettlement on biodiversity in old location Table 53: Respondents’ evaluation of impacts of resettlement on biodiversity in new location Table 54: Respondents’ purpose of visits and duration of time spent in the Park while they were in the old location Table 55: Respondents’ evaluation of sufficiency of fuel wood in old location vs. new location Table 56: Respondents’ sources of timber in the old location Table 57: Respondents’ comparison of consumption of forest products in old location vs. new location Table 58: Respondents’ evaluation of negative aspects of wildlife in the old location Table 59: Respondents’ evaluation of positive aspects of wildlife in the old location Table 60: Respondents’ evaluation of positive aspects of wildlife in the new location Table 61: Respondents’ perception of effects of resettlement in the Barandhabar Forest Corridor Summary Tables 74 Table 62: Summary of respondents’ evaluation of well being characteristics in new Padampur: Yes / no indicator questions. Table 63: Summary of respondents’ comparisons of wellbeing characteristics in old vs. new Padampur: scale indicator questions. Lists of Figures Figure 1: Core analysis units and their definitions based on the Impoverishment Risks and 13 Reconstruction (IRR) model (Cernea, 2000). Figure 2: A portion of Royal Chitwan National Park (RCNP), Barandhabar Forest Corridor and 16 old and new Padampur sites Figure 3: Three community forests North of new Padampur 46

Table of Contents
Title
Page
Executive Summary Lists of Tables & Figures Introduction
Resettlement in Nepal Padampur Dilemma Padampur & Tharu People
i
ii
1
5 6 8
Methods
Assessment of Planning Process Household Survey The Study Area & History Socio-demographic Characteristics
10
10 11 15 17
Results and Discussions
Assessment of Planning Socioeconomic Wellbeing
1. Land Tenure Land Ownership/Title Compensation Land Quality Implications for Tharu
2. Employment
Economic Status Job Changes Job Satisfaction Crop Pattern and Yield Off-farm employment Micro Enterprises
18
19
19
19 21 22 22 23
24 25 26 27 28 29

Title 3. Housing
Physical Structure Change in Wealth Scarcity of Fresh Water
4. Marginalization
Effects on Tharu people Support Services Women Empowerment
5. Food Management
6. Health Facilities
Tharu’s case
7. Common Property Resources
8. Social Ties Socio-cultural Effects on Tharu
Biodiversity Impacts
Natural Resources Consumption Value of Wildlife Threats to Connectivity and Corridor
Page
29 30 30 31
32 33 34 36
36
38 39
40
42 43
44
46 48 49
Conclusion References Cited Additional Bibliography Tables Appendices
Questionnaire for focus group meetings Questionnaire for household survey
51 55 58 63
76 77 78

Assessment of Resident Wellbeing and Perceived Biodiversity Impacts in the Padampur Resettlement,
Royal Chitwan National Park, Nepal Introduction
The impact of biodiversity conservation on human wellbeing as a result of the creation
of park and protected areas has become an important concern in South Asian nations.
The maintenance of a true balance between conservation and human needs has always
been a complex matter. There have been several cases of conservation initiatives
affecting the livelihood of people, in particular indigenous communities, leading to
impoverishment for these people after their forced displacement. In the past,
biodiversity conservation practices have been uniformly biased towards conserving
biological resources, while undermining people’s needs (Cernea, 2005; West and
Berchin, 1991; Clochester, 1997; McLean and Stradee, 2000; Rawal, 1991).
Conservation related resettlement programs are judged to be largely unsuccessful, due
to people’s opposition to move from their original place, especially in the case of tribal
and indigenous peoples (Schmidt-Soltau, 2003). In some cases, environmental
resettlement programs have been positive with respect to income, off-farm employment
and access to infrastructure, but failed to provide people’s participation in making
decisions (Dickinson & Webber, 2004).
Some argue the issue is not whether or not to practice resettlement but to know how it
should be designed and implemented for the benefit of people, while minimizing risk
(Cernea and Schmidt-Soltau, 2005). It is also important to understand people’s self
determination, i.e., whether they want to get away from the recurrent hardships caused
by natural hazards and disturbances from Park wild animals or stay at their original
residence and strategize for a better living. Future policies should consider residents’
desires prior to make any decisions regarding resettlement of enclaves.

We investigate this complex issue by focusing on Padampur, Nepal as a particular
enclave that faced the resettlement debate since 1964 and was finally resettled in 2004.
At this point in history, insights can be gained by investigating how it was planned and
how people evaluate their own wellbeing one year after resettlement was completed.
Prior to the establishment of Royal Chitwan National Park (RCNP)1, old Padampur was
a predominantly Tharu2 village in Chitwan. Old Padampur remained an enclave within
RCNP. It provides a good example of the issues facing resettlement. The enclave
remained within the national Park after Park designation despite various conflicts
associated with the Park and the people. Over a period of thirty years residents
discussed the possibility of resettlement but could never reach a consensus to move. In
1993, for the first time, major flooding had a devastating impact on the agricultural land
of the entire old Padampur community. This catastrophe suddenly awakened the
Padampur residents to the fear that they might keep loosing their highly valued land to
each year’s monsoon flood. As a result, a renewed local initiative was established to
request government help in resettling. Such a change in attitude within this enclave
community is set against the backdrop of an on-going debate over the policy of
resettlement.
To take a special look at human wellbeing, we investigated eight anticipated risks under
the scope of the Impoverishment Risk and Reconstruction (IRR) model designed by
Michael Cernea (2000). Variables considered in this theoretical model include,
landlessness, joblessness, homelessness, increased morbidity, loss of common
property, marginalization, and social disarticulation. The model suggests that if these
are not minimized one may observe increased impoverishment. He further suggests risk
mitigation measures through strategies and funding. This model has been largely
applied for the World Bank’s funding of 200 resettlement projects throughout the world
(2000). In this study, we compared people’s wellbeing in reference to each risk in the
1 RCNP will be referred as Park hereafter. 2 Tharu are considered an indigenous people of RCNP. However, anthropologists argue they might have migrated from the Northern Indian States of Bihar during extreme drought in 1769 and made their refuge in the boarder forest in Nepal (Gunaratne, 2002)

old location and the new location in order to understand people’s self evaluation in the
changed context.
Kai Schmidt-Soltau argues that the IRR model may not provide every solution to the
resettlement problem, specifically when dealing with tribal and indigenous communities.
He argues that the compensation package is never sufficient to match people’s property
and sentiment and that the non-transparent distribution mechanisms also impede social
justice (2003). He further argues there is no way to compensate intrinsic loss and notes
discrepancies in balancing theories and practice in terms of minimizing risks (2003).
Similarly, other researchers note that risks should be analyzed based on process based
mechanisms rather than a blueprint model. Instead of risk reversal, remedial responses
should be applied for the irreparable losses of the communities (Dwivedi, 2002).
Previous studies have been primarily focused on forced displacement and resettlement
and have been highly critical about its adverse impacts on people’s livelihood and
wellbeing (Clochester, 1997; McLean, 2000; McLean and Stradee, 2003; Ghimere &
Pimbert, 1997). These findings have led to the general conclusion that resettlement is a
threat rather than an opportunity to improve wellbeing and insure optimal biodiversity
conservation. But there is subtlety in the origin of resettlement. As Gebre pointed out,
“Voluntary migrants are defined as people who, for some reason, willingly left their
habitual environment or place of origin, and resettled in settings other than their own. In
terms of resource and service provision, most voluntary migrants appeared materially
better off than most involuntary relocates” (2002:31 ). The voluntary resettlement may
be a better option as people are found to be re-established sooner than involuntary
resettlement (Gebre, 2002).
In our study we investigated whether a citizen initiated resettlement program could be a
conservation option for the future. This could only be true if people’s judgments on their
wellbeing and conservation outcomes remain positive. The central issue is whether and
how the citizen-initiated resettlement program is contributing to socioeconomic
wellbeing as well as biodiversity conservation. Rather than contributing to the rhetoric of

the resettlement debate, this study adds the voice of the Padampur residents in a
quantitative and qualitative assessment of their experience, current conditions, and
prospects for the future.
The case of old Padampur is unique because it started with the resident initiated
demand for resettlement in response to the devastating flood in 1993. It was also based
on a history of numerous participatory conservation initiatives developed by the King
Mahendra Trust for Nature Conservation (KMTNC) creating a foundation for
cooperation and trust with the residents of Padampur.
This study of citizen initiated resettlement suggests a careful evaluation of people’s
attitudes, perceptions of risks, alternatives assessment, and perceived benefits of
resettlement may be timely. Given how rapidly community-based conservation has
become established in Nepal and the increasing confidence of local communities in
working with NGOs and the government, it is time to evaluate the current role of
resettlement in conservation and rural community wellbeing.
This report presents the findings from personal interviews with 322 randomly selected
household representatives in new Padampur. This citizen- initiated resettlement
program may have some positive outcomes as compared to other forced resettlement
and displacements. Residents said that in terms of physical facilities and alternative
economic opportunities their new location remained better. Unfortunately, provision and
sustainability of fresh water, an important part of livelihood, has been unhelpful. In
addition, cultural norms and practices of the indigenous Tharu people have also been
compromised by the scarcity of water. We did find increasing confidence in support
services of INGOs, NGOs and the government. With this study, it is not prudent to
predict long-term risks associated with the resettlement as we conducted this survey
within a year of the complete resettlement; rather this serves as a baseline for
evaluation and an early indictor of issues that must be addressed.

This report can help conservation professionals and scientists considering resettlement
programs as a potential conservation option for ecosystem management in human
dominated landscapes.
Resettlement in Nepal
The genesis of resettlement in Nepal was first based on the capacity to control endemic
malaria in the Tarai (Plain) and Inner Tarai Valleys as of the early 1950s. The 1961
census data showed 170,137 inter-zonal migrants, which increased to 445,128 in 1971,
929,585 in 1981 and 1,228,356 in 1991 (KC, 1998). Nepal was moving highland people
into the lowlands for more economic opportunity.
In 1953 after independence, the Nepali government officially initiated a planned
resettlement program in Chitwan. The Rapti Valley Multipurpose Development Project
(RVMDP)3 was established to encourage hill people to settle in the low- lands by
clearing forests into productive farm land. However, the project failed to provide socio-
economic justifications. Opportunities in the lowland were mostly exploited and the
government was not able to resettle people in a systematic manner. During this period
there was an influx of both authorized and unauthorized settlers. As a result, a large
number of people resettled in the Terai making their ultimate refuge at the edge of the
forest, leading to further ecosystem degradation (Ghimere, 1992; Singh, 1984; Elder et.
al, 1976; Gee, 1959). By 1959, 12,000 people from the hill area had been settled in
Chitwan, in alluvial grassland areas (prime tiger and rhino habitat). In addition, it was
proposed to resettle 25,000 people within Rapti Valley of Chitwan (Gee, 1959).
Padampur Dilemma
Over the years, old Padampur and the Park had a rocky relationship. The main issues
of conflict were loss of human life, loss of livestock (domestic cattle may constitute up to
30% of tiger kills in settled areas peripheral to the Park), damage to crops (estimated to
3 This project was funded by USAID as bilateral aid to Nepal’s economic development.
range from 10% to 100% depending on the farmer) and restrictions concerning the use
of the Park's resources (hunting, fishing, grazing, as well as collection of timber, fuel
wood and other forest products for food and medicine, all prohibited within the Park)
(Milton and Binney, 1980; Mishra, 1982).
Sixteen people were killed by tigers in and around the Park between October 1980 and
early 1989 (McDougal, 1989), the trend continued. As the number of tigers in the Park
increased so did man eater’s problems. The tiger/human conflict was a major problem
for the Park authority. There were also economic problems; the tourism business led to
locally inflated prices for basic foods and household products. This problem was
compounded by the fact that few local people were employed in the Park or in the
tourism businesses, leading to poverty for the local population as a result of the Park's
presence (Mishra, 1982). In addition, poaching was a major issue but it increased after
2000 when the Royal Nepal Army guard diverted their attention towards national
security issues due to increasing insurgency in the country. At that time several guard
posts were shut down inside the Park. Finally, there were efforts to address wildlife
problems over time. As far back as 1974 a fence and moat were constructed in an
attempt to reduce rhinoceros grazing on rice crops (Milton and Binney, 1980)
Among many challenges old Padampur also faced the high waters from the Rapti River
during monsoons and severe crop depredation, especially by rhinoceros. In 1993, for
the first time, major flooding had a devastating impact on the agricultural land of the
entire Padampur community. The monsoon flood in 1993 destroyed almost all the
farmland in Jayamangala and parts of the other four wards surrounding it. An old
Padampur resident and former Chairman of the Padampur Resettlement Commission
mentioned that the cause of the high flood is due to the dike construction between
Lothar to Kumrose, as part of East Rapti Irrigation Project, ultimately siphoning water to
old Padampur lands (Mr. Babu R. Puri, pers. comm., 2004). The elder Tharu Mr. Mallu
Mahato, remembered the occurrence of high monsoon floods affecting agriculture and
livestock in 10 year intervals. He further recalled that previous floods were even higher,

but caused less harm due to the low population densities and scattered settlement than
the devastating floods in the 1990’s (Mr. Mallu Mahato, pers. comm., 2004)
Groups of villagers from old Padampur began discussions with the Biodiversity
Conservation Center (BCC)4 in the late 1980s about the difficult living conditions and
the possibility of relocating. Opinions among the residents were divided primarily
because the villagers in the western portion of the enclave suffered more from floods
and rhinoceros trampling than those in the east. Western residents wanted to move,
people in the east were less willing to move (Milton and Binney, 1980). As a result of
this stalemate the government did not take any action, but they did reduce investment in
infrastructure such as schools and health clinics. As a result, people faced the added
difficulties of not being able to access health care during the monsoons when river
water swelled to high levels.
Given these circumstances some old Padampur residents openly advocated moving to
a site closer to an urban, area away from crop-raiding herbivores and flooding rivers.
Prior to 1980, Milton and Binney’s reported that people of old Padampur were willing to
move to the new location if the Nepali government fulfilled certain conditions such as,
compensation for their land and construction expenses, provision of development
services as well as shifting the whole village to one area, to maintain social ties with
adequate physical infrastructure.
Padampur and Tharu People
Historically, sections of Padampur were established in the 1930s by Tharu people, later
an influx of hill migrants joined the Tharu in the 1950s (Padampur VDC, 2003). Before
the planned resettlement of the 1950s, the entire lowland area of the Chitwan District
was inhabited by the indigenous Tharu people, partially due to their resistance to
4 Biodiversity Conservation Center (BCC) one of the field arms of King Mahendra Trust for Nature Conservation (KMTNC) was involved in biological research, conservation, human resource development and community development activities since 1989. BCC has strong ties with the local community in minimizing the Park/people conflicts through social forestry and providing alternative livelihood options to reduce forest dependency.

malaria (Gurung, 1983; Gee, 1959). In the early 19th century, movement to the valley
was discouraged in order to maintain a disease prone forest as an obstacle for invasion
from South (Gurung, 1983). During this period Tharu people were heavily dependent on
forest resources in many ways. Fishing and collection of snails were essential parts of
the Tharu diet fulfilling their protein needs. Gradually cattle grazing and agriculture were
primary activities of the community, with a heavy reliance on the forest resources.
Collection of minor forest products supplied food, household tools, and medicinal
products. All these activities, important for the Tharu livelihood, were restricted after the
establishment of the Park. Tharu were practicing shifting cultivation prior to the Nepal
government’s land registration and reform policy in early 1960’s (McLean, 2000 &
Muller-Böker, 1993).
After malaria eradication and land reform after 1960s the Tharu people were often
exploited by and discriminated against by hill people to whom they lost their arable land.
But the Tharu should not be considered a naive tribal inhabitant of the Terai. In the past
and present, they are an important part of the Nepalese economy and governance.
Their contribution ranges from generating land revenue for the state, judiciary power in
some areas5 and labor. In fact, the Tharu guided the hill migrants on how to create a
living in the lowland Terai (Gunaratne, 2002). However, poor Tharu people are
vulnerable to exploitation by hill migrants and large landholding Tharu due to their
limited education and economic power.
The formation of the Park in 1973 affected various cultural traits and family structures of
the Tharu people, by restricting their free access into the Park to visit religious sites as
well as trade and movement among other enclaves within the forest. Similar to the
Tharu, Bote, Maji and Mushars are also indigenous to Chitwan and were dependent on
the river for their livelihood. They were knowledgeable about river ecology and their
livelihood was compromised after the Park establishment (Ghimire, 1999). However,
provisions for fishing permit in the Park rules helped address the needs of these people
5 Some Tharu are elected as Village Development Committee (VDC) Chairmen and some are Ward Chairmen at the local level.

to some degree. There was some informal understanding between the Park authority
and the people that they could extract minor forest products unless it involves
harvesting timber and poaching wild animals.

Methods
In order to investigate the citizen’s evaluation of how wellbeing changed and perceived
impact on existing biodiversity as a result of the Padampur resettlement, the following
research questions were asked.
a) What change is there in Padampur residents’ wellbeing as a result of the
resettlement?
b) What are the residents’ perceptions of the resettlement contribution to
conservation?
We used both quantitative and qualitative survey methods to examine the planning
process, household wellbeing, and the perceived impact on biodiversity. Three focus
group meetings were conducted to assess the resettlement planning process.
Participants discussed the resettlement course of action by evaluating performance of
the responsible institution to-date, and the group perceptions of how resettlement
addressed their interests.
Assessment of Planning Process
The focus group discussions were used as a tool to assess the planning process of the
resettlement program. The method of focus group data analysis is adapted from
(Krueger, 1998). Three independent focus groups were ward representatives (n=11),
government and non-government officials (n=8), and Indigenous people and women
(n=10).
The focus group meetings concentrated on the history of the resettlement planning
process, their evaluation of planning and implementation to-date, and perceptions of
how resettlement addressed their interests (Appendix I). Questions include how people
felt about the resettlement program?; what are the challenges of resettlement projects?;
and what suggestions do they provide for future resettlement planning? The entire
conversation of the focus group meetings was recorded on audio tape and partially
recorded on video.
All focus group meetings were conducted in a friendly manner in a village environment.
The facilitator, Narayan Dhakal, was involved in the area implementing conservation
and development activities for the past three years. Each member took a minimum of 2
minutes to a maximum of 7 minutes to express their views. The group participants were
overwhelmingly vocal in their appreciation, concerns, and grievances about the
resettlement program. Seven out of ten participants were women in the women and
indigenous focus group. The women’s group expressed their opinion about the
resettlement program, particularly related to gender issues.
A Tharu surveyor with an undergraduate education helped with non-Nepali speaking
Tharu and co-facilitated the sessions. Most of the sessions were conducted in Nepali,
but in the women and indigenous focus group, participants were assisted with their
language to help understand the questions and discussion. Each participant was also
provided the option to communicate in their own language at several points in the
discussion.
Tape recorded data was transcribed and the main points were summarized. The focus
group meetings were very fruitful in terms of gathering qualitative data to identify how
people perceived the overall resettlement program. The focus group meeting also
helped to expand on the quantitative data collected from the household survey.
Household Survey
Altogether 1,9286 households are listed as resident in the new Padampur (Land
Distribution Lists of Padampur Resettlement Commission Report, 2004). This
population record is the most reliable because every household (hh)7 is listed with the
name of hh. chief and the amount of land they received in new Padampur. In order to
6 The number of household data varies according to source; the Chitwan District Development Committee (CDDC) profile indicates 2140 where as the Village Development Committee (VDC) data shows 2034. 7 Household is referred as hh. hereafter.
ensure a robust sample, we randomly selected 322 respondents from the new
Padampur VDC list. Since the castes and ethnic groups are uniformly distributed among
the Padampur community, we did not use a stratified random sample. However, we
checked the sample to ensure that of each ethnic group was represented (Table 1).
This randomized household survey was used to evaluate community members’
comparison of their wellbeing before and after resettlement.
Face-to-face household interviews were conducted to understand household
representatives’ perceptions of their socioeconomic wellbeing and impact on
biodiversity after the resettlement. The interview ranged from a minimum of 45 minutes
to a maximum of one and half hours, depending upon the respondent’s preference for
elaborating. Six local youths with university undergraduate degrees were hired and
trained to conduct the survey. The questionnaires were pilot tested first in May 2004
and later in February 2005 and finalized. Each sampled household was contacted
seven days prior to the survey and asked if they would agree to an interview. A project
brief was typed in Nepali script to help local people understand the context. Residents
responded positively to the informed consent adapted by this research project. The
positive response may be because this practice had not been used in any other survey
conducted in Padampur previously. People appreciated being asked and given the right
to decline.
Initial interviews with conservation and community leaders as well as attributes
identified in the literature (Cernea, 2000) were used to design a 58 question survey
instrument that reflects land tenure, employment, housing, food management, social
articulation, marginalization, health facilities, and physical infrastructure. These
variables were further analyzed for differential impacts based on ethnicity, caste, and
gender. In order to understand people’s perceptions of the impact of resettlement on
existing biodiversity, respondents were asked to evaluate the conservation impacts. An
additional 17 questions, relevant to human induced impacts on natural resources and
comparative biodiversity status in both locations, were asked (Appendix II).

Comparative questions were asked about people’s perception of factors in old
Padampur vs. new Padampur. The survey tool was designed for eight factors:
landlessness, joblessness, homelessness, marginalization, increased morbidity, food
insecurity, loss of physical facilities as well as social disarticulations (Cernea, 2000).
The core analysis units and their definition by Cernea (2000) are listed below (figure 1)
along with our terms used in the questionnaire.
Questions based on both socioeconomic and biodiversity factors were asked specifying
different units as land tenure, employment, housing, marginalization, health facilities,
food management, common property resources, and social ties. Respondents’
perceptions on resettlement’s impacts on biodiversity were also asked. We did not
collect biological or vegetation data to measure the impact on biodiversity resources.
After the interview, completed questions were coded following a coding guide and
entered into an SPSS data base. Data was checked for data entry errors and analyzed
with SPSS using descriptive statistics.
Questions based on both socioeconomic and biodiversity factors were asked specifying
different units as land tenure, employment, housing, marginalization, health facilities,
food management, common property resources, and social ties. Respondents’
perceptions on resettlement’s impacts on biodiversity were also asked. We did not
collect biological or vegetation data to measure the impact on biodiversity resources.

Figure 1: Core analysis units and their definitions based on the Impoverishment Risks and Reconstruction (IRR) model Cernea (2000).
Anticipated Risks Definition (Cernea, 2000) Our Term
Landlessness “Expropriation of land removes the main foundation upon which people’s productive systems, commercial activities, and livelihoods are constructed. This is the principal form of de-capitalization and pauperization of displaced people, as they lose both natural and man-made capital”
Land tenure
Joblessness “The risk of losing wage employment is very high both in urban and rural displacements for those employed in enterprises, services, or agriculture. Yet, creating new jobs is difficult and requires substantial investment. Unemployment or underemployment among resettles often endures long after physical relocation has been completed”
Employment
Homelessness “Loss of shelter tends to be only temporary for many resettles; but, for some, homelessness or a worsening in their housing standards remains a lingering condition. In a broader cultural sense, loss of a family’s individual home and the loss of a group’s cultural space tend to result in alienation and status-deprivation”
Housing
Marginalization “Forced displacement results in marginalization that people suffer both physically and psychologically and this happens even before resettlement design”
Marginalization
Increased morbidity
“Massive population displacement threatens to cause serious declines in health levels. Displacement-induced social stress and psychological trauma are sometimes accompanied by the outbreak of relocation-related illnesses, particularly parasitic and vector-born diseases such as malaria and schistosomiasis. Unsafe water supply and improvised sewage systems increase vulnerability to epidemics and chronic diarrhea, dysentery, etc. The weakest segments of the demographic spectrum-infants, children, and the elderly-are affected most strongly”
Health facilities
Food insecurity “Forced displacement increases the risk that people will fall into temporary or chronic undernourishment, defined as calorie-protein intake levels below the minimum necessary for normal growth and work”
Food management
Loss of physical facilities
“For the landless and asset less, people loss of access to the common property assets that belonged to relocated communities (pastures, forested lands, water bodies, burial grounds, quarries, etc.) results in significant deterioration in income and livelihood levels”
Common property resources
Social disarticulations
“It disperses and fragments communities, dismantles patterns of social organization and interpersonal ties; kinship groups become scattered as well. Life-sustaining informal networks of reciprocal help, local voluntary associations, and self-organized mutual service are disrupted. This is a net loss of valuable “social capital,” that compounds the loss of natural, physical, and human capital”.
Social ties
After the interview, completed questions were coded following a coding guide and
entered into an SPSS data base. Data was checked for data entry errors and analyzed
with SPSS using descriptive statistics.
The Study Area & History
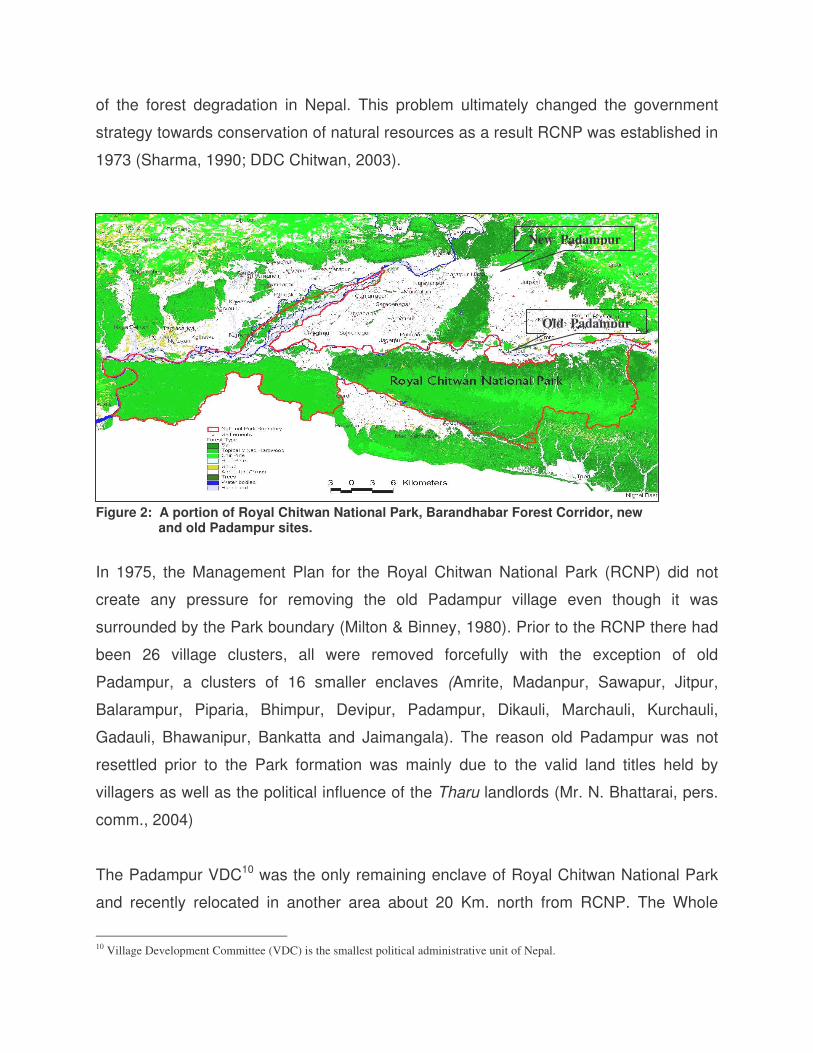
The old Padampur Village lies within the Chitwan District (Figure 2), one of the most
popular districts of Nepal due to its immense biological and economic resources. In
1973, establishment of Royal Chitwan National Park (RCNP),8 was recognized as a
World Natural Heritage Site (Mishra and Jefferies, 1985). RCNP is situated in south
central Nepal, covering 932 sq. km. in the subtropical lowlands of the inner Terai. Prior
to Park establishment, the area comprising the Tikauli forest - from the Rapti river to the
foothills of the Mahabharat - extending over an area of 175 sq. km. was designated
Mahendra Mriga Kunj (Deer Park).
The global biological significance of RCNP provides highest density of endangered
large mammals’ tiger and probably 2nd largest density of one horned rhinoceros
(Dinnerstein & Price 1991, Smith et. al, 1999, Dinnerstein at. al, 1999), and presence of
wild elephants. The Terai area including Chitwan was virgin forest preserved for
centuries and an undisturbed wildlife habitat particularly for tigers and wild elephants
(Smythies, 1925). In 1951, the World Health Organization (WHO) initiated malaria
eradication work at the same time synchronized resettlement was launched to
encourage Hill people to resettle in the highly fertile low lands9. Since then the influx of
people from mountain areas has continued as people search for a better life. The
increase in the population of Chitwan, and the Terai as a whole was the primary cause
8 The Park has over seven types of forests, six types of grasslands, three main rivers systems, a number of oxbow lakes and wetlands which support 50 species of mammals, 526 species of birds, 49 species of reptiles and amphibians and 120 species of fishes. Floral diversity encompasses over 600 species of which 50 are grasses, 16 orchids and 73 ferns. The RCNP has a buffer of 35 Village Development Committees and 2 Municipalities covering 766.1 sq km of area in the Park vicinity. Progressive mechanisms for resolving Parks and people conflict and also for community development have been developed in recent years (UNESCO, 2002). 9 Geographically Nepal divided into five physiographic zones, Chitwan lies within two physiographic zones, Siwalik and Mid mountain. (DDC, 2003).
of the forest degradation in Nepal. This problem ultimately changed the government
strategy towards conservation of natural resources as a result RCNP was established in
1973 (Sharma, 1990; DDC Chitwan, 2003).
Figure 2: A portion of Royal Chitwan National Park, Barandhabar Forest Corridor, new and old Padampur sites.
In 1975, the Management Plan for the Royal Chitwan National Park (RCNP) did not
create any pressure for removing the old Padampur village even though it was
surrounded by the Park boundary (Milton & Binney, 1980). Prior to the RCNP there had
been 26 village clusters, all were removed forcefully with the exception of old
Padampur, a clusters of 16 smaller enclaves (Amrite, Madanpur, Sawapur, Jitpur,
Balarampur, Piparia, Bhimpur, Devipur, Padampur, Dikauli, Marchauli, Kurchauli,
Gadauli, Bhawanipur, Bankatta and Jaimangala). The reason old Padampur was not
resettled prior to the Park formation was mainly due to the valid land titles held by
villagers as well as the political influence of the Tharu landlords (Mr. N. Bhattarai, pers.
comm., 2004)
The Padampur VDC10 was the only remaining enclave of Royal Chitwan National Park
and recently relocated in another area about 20 Km. north from RCNP. The Whole
10 Village Development Committee (VDC) is the smallest political administrative unit of Nepal.
New Padampur
Old Padampur

Chitwan District lies between 270 21’ 45” to 270 52’ 30” North to 830 54’ 45” to 840 48’
15” east the area extends from the low land Bhabar area to Mahabharata Mountain
range, a change in elevation from 141 to 1945 meter (DDC11, 2004).
Socio-demographic Characteristics
The total population of new Padampur is 11,037 with 5,543 males (50.2%) and 5,494
females (49.8%). The majority of households are from the Tharu caste/ethnicity, which
constitutes 44 % (889 hh.)12. The second largest caste/ethnic group is Brahmin 22%
(444 hh.). The average family size of households is 5.15 individuals (total population /
no. of households) (District Development Committee, 2002) (Table 1 & 2).
Working age of majority of sample (16 to 59 age group) were (59%). Nepali (49 %) and
Tharu (36%) were dominant mother languages spoken, with Tamang, Gurung, Magar,
Bote, Chepang and Lama also spoken in the area (Table 4). A majority of respondents
were followers of Hinduism 88 % (283 hh) (Table 5). Approximately a quarter of the
respondents were either uneducated (27%) or educated up to the primary (22%) or
secondary level (29%) (Table 6). Many of the respondents were still in school, as they
reported their occupation as student at 29% (n = 617).
The second most frequent occupation was agriculture 24% (n=518) (Table 7). The
majority of respondents did not consider themselves indigenous to Chitwan, 59% (191
hh). Their original home was Pahadi the northern hilly areas and they moved for
agricultural reasons (Table 8,9 & 10).
11 District Development Committee (DDC), is one step above from the VDC level administration. 12 The number within the parenthesis after the percentage represents the frequencies of respondents, i.e., n=42 corresponding percentage.

Results and Discussions
Assessment of Planning
The focus group participants felt the resettlement master plan was well designed
regarding physical infrastructure (road, schools, public buildings, government offices,
burial grounds and community forests) and public properties. However the majority of
focus group members expressed their dissatisfaction with the long implementation
period (nine years) and poor planning for fresh water resources. They believed the
lengthy planning process affected people’s livelihoods due to inflation and uncertainties.
Land speculation drove up the price of land in the new area because current owners
knew Padampur was moving. But the residents did not actually move right away so they
did not receive their compensation money for several years. Focus group members also
expressed that they would have preferred an open option (a household could choose to
move to another part of the country) rather than moving everyone into the same
location. They suggested that this arrangement might have reduced pressure on
agricultural lands in the new location.
Regarding participation in planning, focus group members said that some groups were
underrepresented and more planning was still needed. Despite the fact that Tharu
residents were the majority in Padampur, they were under-represented in resettlement
planning. In addition, the lack of post resettlement planning made it difficult to adapt to
the alternative economic opportunities immediately after the move. Members noted that
during the frequent changes in administration, there were problems with decision
making and an effective and timely implementation of the master plan.
Socioeconomic Wellbeing
One of the compelling arguments against conservation related resettlement is the
impoverished livelihoods of the residents after they have been forcefully resettled
(Cernea & Schimidt-Soltau, 2005). In this section we investigate eight anticipated risks
discussed in Cernea’s (2000) Impoverishment Risk and Reconstruction (IRR) model.
The Padampur resettlement was different from many forced resettlement and
displacement cases that have been published primarily due to Padampur residents’
involvement in the resettlement decision- making process from the beginning. Our
assessment is based on people’s perception of their recent socioeconomic changes
since the completion of the resettlement process. When asked whether respondents
agreed to leave their original location, 80% (259 hh) said they agreed, whereas 20% (63
hh) said they did not. The reasons cited for leaving the original location were threat of
flood 60% (156 hh), lack of health facilities 14% (37 hh), wildlife crop depredation 12%
(31 hh), and lack of transportation facilities 8% (21 hh). Reasons for residents gave for
not agreeing to leave were valuing their traditional residence 30% (19 hh) and better
production in the old location 40% (25 hh). In response to whether or not they were
satisfied with this resettlement program, 81% (260 hh) of new Padampur residents said
yes and 19% (62 hh) said no (See Tables 11, 12 and 13).
1. Land Tenure
Land is one of the major economic factors for rural farmers. A vast majority of rural
people depend on agriculture as it contributes 42% of GDP and employs over 80% of
Nepali people (ISRSC13, 2001). More importantly, land in the Terai is quite suitable for
rice production due to the alluvial grasslands of the past. These rice lands are found
along river banks and streams and are highly valuable for Nepal’s rural farmers
(Regmi, 1999). Cash crops, such as rice, wheat and mustard, are the main
commodities in the Terai. Income from these crops is a major part of Nepal’s agrarian
economy. Given that land is the foundation of agricultural production, risk of
impoverishment due to landless is one primary argument against forced displacement
and resettlement.
“Expropriation of land removes the main foundation upon which people’s productive systems, commercial activities, and livelihoods are constructed. This
13 Informal Sector Research and Study Center, P.O. Box 94, Kamaladi, Kathmandu, Nepal, E-mail: [email protected]

is the principal form of de-capitalization and pauperization of displaced people, as they lose both natural and man-made capital” (Cernea, 2000:14).
As unoccupied land becomes scarcer, without affecting the livelihoods of other people
equal compensation for land is very difficult, if not impossible (Cernea & Schmidt-
Solatau, 2005)
The overall land size in the new location was reduced to 1000 ha. from 1800 ha. in the
old location. In our survey, we asked the respondents from 322 households about
their land area in the old versus the new location, the monitory compensations,
fairness in distributing compensation packages, land title certificates and their general
opinions about land distribution. We found that the landless in the old location gained
land in this resettlement project. Average land owned was reduced as people with
more than one bigha14 of land received one bigha and monetary compensation for
remaining land.
Some people displaced during the 1964 forced displacement15 at the time of the Park’s
establishment made their homes in old Padampur with the support of their friends and
relatives. They were living on Ailaini16 land without ownership right to it. In the new
location, they received land titles for areas not exceeding one bigha (20 kattha)17 each.
Land Ownership / Title
Out of the 322 sampled households, 13% (42 hh)18 were landless in the old location and
received a land area of three kattha in the new location. This arrangement provided
them greater security in their land holdings. However, in the resettlement, the size of per
capita landholding was reduced from 23.5 kattha in old Padampur to 14.8 kattha in new
14 “Bigha” is the Nepali term for land measurement in the lowland area one bigha is equal to 1.67 acre. In a lower denominations 1biga= 20 kattha. Since the kattha is the most common measurement units we use this measurement unit throughout the document. 15 Out of forced displaced hhs, 351 (some of them have legal land title) have filed their cases in the supreme court and their cases are not resolved as yet. It is known that the court has ordered the PRC and Land Exise office in Chitwan to explain the status of 151 hh’s (Mr. Basu Dhngana, pers. comm.) 16 Ailaini land is the land not registered in private ownership but people are cultivating it for their livlihoods. 17 In 1964, Government provided land in the Madi valley across the southern ridge from Padampur. Some people resettled in Madi Valley and people who did not want to leave their original home dispersed in the region. Their cases are still undecided by the Supreme Court (Mr. N. Bhattarai pers. comm., 2004) 18

Padampur as people with larger landholdings received less land in the new location.
Number of household had land holding between 0.1 to 20 kattha increased from 49%
(159 hh) in the old location to 70% (227 hh) in the new location but 17% (54 hh) had
their landholding reduced in the resettlement (Table 14 & 15).
Land titles are an important component of land security. In a rural setting land title also
provides some opportunities for credit and for increased economic activity. Eighty-five
percent (272 hh) of respondents received land titles in the resettlement including 33%
(107 hh) who did not have titles in the old location. The remaining 14% (47 hh) (Table
16) said that they still did not have land titles at the time of the interview. Since then
they have all received titles for their land (Mr. Prem Poudel, pers. comm., 2005)
Of the total recorded households (1928 hh) in new Padampur, 239 were missing in the
record due to their lack of legal land separation registration documents (PRC, 2004).
The Padampur Relocation Committee (PRC) later confirmed that only 177 households
were missing in the record to receive their land (PRC, 2004). Of these, 96 households19
still have not received land as of May, 2004. A higher level government intervention will
be necessary to include their names for land compensation (Mr. Surya S. Regmi,
Chairman of PRC pers. comm., 2004). However, for this study, authentic data from the
missing households could not be obtained. The focus groups further confirmed that
there are discrepancies in distribution of compensations that may be due to
government’s poor data collection methods and political bias.
Compensation
When asked whether household respondents received financial compensation for the
reduction in their land holdings, only 30% (96 hh) said that they did, 65% (210 hh) did
not and 5%(16 hh) did not respond (Table 17). Twenty-four percent (76 hh) of
19 Later communication with Chairman, Mriga Kunja Buffer Zone Committee, revealed only 82 hhs were missing from getting land in new Padampur. Their cases were either due to lacking legal of property separation documentation or landlessness. Missing records from property separation may not be the serious problem as people can still live in their parent’s house. However, for the landless their problem is greater and has to be considered seriously (Mr. Basu Dhungana, pers. comm., 2005)
respondents said the compensation was fair while 42% (135 hh) said that was not
(Table 18). Their grievances were the government mechanisms for allocating land were
biased and there was a slow distribution of both monetary compensation and land.
Households that received the money earlier were better off, because they were able to
buy additional land. However, people who received their money after eight years could
not buy land because land prices had increased tremendously as a result of the
increased demand in the area.
Land Quality
When asked to compare the land quality in the old and the new locations, 70% (226 hh)
thought it was worse, 23% (74 hh) believed it was better and 7% (22 hh) said it was the
same (Table 19). Water scarcity was the main reason for the negative response
according to 72% of the respondents. Apart from the water scarcity, respondents stated
that the area would have been highly fertile and productive because it was previously
forested land with sufficient soil nutrients. In the focus group meetings participants
confirmed that the soil quality in the new location was better as long as there was water
available.
When asked “what is your opinion about the overall distribution of land among
households in new Padampur?” Forty-nine percent (159 hh) said the distribution was
fair, 48% (156 hh) said biased and 2% (7 hh) said they didn’t know (Table 20). The
respondents who thought it was biased cited as their reasons better land for relatives
32% (103 hh), reduced land size 10% (34 hh), and land without irrigation 5% (17 hh)
(Table 21).
Implications for Tharu
Before 1950, the total population of Chitwan (25,000) was mostly Tharu as the area was
malaria prone and they were the only inhabitants in the Terai. Tharu collected taxes for
the state and helped organize hunting trips for Rana rulers in Kathmandu. Their

economy was based on the size of their land and resulting harvests. After 1955 when
the hill migrants were resettled into Chitwan, Tharu land ownership began to decline
sharply. Numerous factors are responsible for this decline; however some authors
argue that the main cause was overexploitation by the hill migrants (mostly Brahmins)
as they took advantage of Tharu illiteracy and lack of knowledge about their rights
(Gunaratne, 2002).
The Padampur resettlement contributed to another decline in land ownership that
affected Tharus, who had larger landholdings in the old Padampur. Of 114 Tharu
respondents, 22% (26 hh) who owned land between two and five bigha in the old
location owned at least two bigha in the new location. Title security has increased with
83 Tharu hhs holding land titles in the old location, as compared to 102 hhs in the new
location (Table 22). Land titles are increasingly important to Tharu households as they
become more aware of local politics through education. In addition, some Tharu
households acquired additional land with the compensation money, while others spent
the cash they received.
2. Employment
Old Padampur was very good for agricultural production due to alluvial soils and the
surrounding National Park. In the new location, households must also work off the farm
because their landholdings have been reduced. The risk of impoverishment may be
greater if alternative economic opportunities are not in place.
“The risk of losing wage employment is very high both in urban and rural displacements for those employed in enterprises, services, or agriculture. Yet, creating new jobs is difficult and requires substantial investment. Unemployment or underemployment among resettles often endures long after physical relocation has been completed” (Cernea, 2000 : 15).
In new Padampur some people believe they are more mobile due to the increased road
access making it easier to find jobs. However, for some people it is more difficult to seek
out jobs in the new location due to unknown situations. Alternative employment
opportunities have been introduced through the support of both national and
international NGOs. These initiatives have been temporary20, however new Padampur
needs at least five years of regular support in developing local skills, linking markets
and creating an atmosphere for micro-enterprises. This support has to be in place as
part of the reconstruction efforts, or the risk of impoverishment may be higher.
Unfortunately, the commitment by the NGOs and INGOs has diminished during the
recent political conflicts between the government and Maoist insurgents.
During resettlement planning, training for generating alternative livelihood options and
strategies for changing the rural economy was lacking. The former Chairman of the
Padampur Relocation Committee (PRC) felt that support from King Mahendra Trust for
Nature Conservation (KMTNC) in biological and socioeconomic development through
the Tiger Rhino Conservation Project (TRCP) was exemplary in leading the community
towards more off-farm economic opportunities. However, this support has to be
continued for a minimum of five years to assist people in self reliant activities to help
support their livelihood (Mr. B. R. Puri, Chairman PRC pers. com., 2005).
Economic Status
Forty eight percent (154 hh) of total respondents said their economic condition was
worse than it was in the old location (Table 23) many of those that respond negatively
were Tharu. For the hill migrants this was the second resettlement in forty years, as
their first move from the mountains was in the 1960’s. Twenty- eight percent of
respondents (90 hh) mostly hill migrants said they are better off, and 24% (78 hh) said
that the resettlement does not affect their livelihood at all (Table 23). The later group
represented marginal families whose primary income was based on farm labor.
However, some of these households engaged in Income Generation Activities (IGA) run
by NGOs as well as other income generating activities.
20 The Tiger Rhino Project is helping in new Padampur to support local livelihoods so resident’s attitudes towards the surrounding Barandhabhar forest are positive and conserve the critical corridor. There have been numerous activities related to skill development and conservation been accomplished. However, the project will end on April, 2005.

The majority of Tharu respondents (65 hh) had a negative response regarding
economic wellbeing. This was the first resettlement they had experienced in their
lifetime. They were extremely concerned about the scarcity of water and the possible
impacts this would have on their traditional culture in the new location. The Tharu
evaluation of their relative economic wellbeing was found to be discouraging.
Tharu households with more financial resources or adaptation skills have been able to
purchase land outside of new Padampur with their compensation money. However, the
Tharu with limited experience dealing with money did not save their cash income to
invest in income generating activities. Some of these households used the
compensation money to enhance their lifestyles such as, building permanent houses of
concrete and buying motorcycles. In other studies, cash compensation was not a good
option for indigenous communities as they were accustomed to activities, such as
gathering forest resources. According to Cernea and Schimidt-Soltau It is unlikely that
displaced people from forest areas will invest their compensation wisely without support
in cash management and economic training (Cernea & Schmidt, 2005). Nevertheless,
the Tharu economy in old Padampur was not solely based on forest resources. They
already had some experience dealing with cash economy based on their exchanges
with the hill migrants selling agricultural products.
Job Changes
In the resettlement, villagers experienced a change in employment from subsistence
farming to cash-based income generating activities. Some examples of these new
activities include dairy farming, mushroom farming, vegetable farming, wool spinning,
and selling in street shops. Sixty-one percent (198 hh) said they had already changed
their employment, 37% (119 hh) said they had not changed, and 2% (5 hh) were unsure
(Table 24). The reasons for the shift away from agricultural employment were primarily
due to limited land and water shortages. Reasons for moving towards these off farm
jobs were because they were closer to the market 42% (135 hh), more mobile 45% (145
hh) with access to roads and transportation 69% (221 hh) it was easier to find work 15%
(48 hh) (Table 25).
Job Satisfaction
The level of satisfaction with the recent shift in work demonstrated that the majority 56%
(180 hh) were satisfied with the change in their employment status. Many stated that
whatever work they get is easier than farm labor. Out of the remaining households, 18%
(58 hh) were not satisfied, and 25% (81 hh) said their satisfaction level was the same as
it was previously (Table 26). The reasons for job satisfaction were availability of outside
labor (31%), skill training opportunities (32%), access to the job market (19%), (31%)
however, had a negative response on the availability of outside jobs and (2%) thought
there was limited access to job markets (Table 27).
When asked about the availability of employment opportunities in the new location, 56%
(180 hh) said they were happy with it, 25 % (81 hh) found no difference, and 18% (58
hh) said that they were not happy at all with the change. The positive responses were
attributed to the availability of non-farm jobs (31%), skill learning opportunities (32%),
and other reasons (8%). The reasons for the negative responses were limited outside
jobs (21%), no access to job advertisements (2%) and limited skill learning opportunities
(4%).
Crop Pattern and Yield
Respondents were found to be growing the same crops (rice, maize, mustard, wheat,
lentil and vegetables) in the new location as they did in the old. However, the area
planted and crop yields changed. Rice production declined sharply in the new location,
mainly due to the scarcity of water and the reduced land size. Rice is the most important
crop for Nepalese society both as a staple food and as a source of income. One of the
reasons Tharu people were unhappy was due to this reduced production of rice.
Villagers said the soil quality of the new area was good for the production of maize,

mustard, and lentils because it was recently cleared forest. They also believed
vegetable production would be an excellent source of income in the winter, provided
there is available irrigation. The annual household income from farm-based earning was
reduced by 35% in the new location. For the sample households, Nepalese rupees 5.7
million NRs. (US $ 79,529) worth of production in a year was recorded in the new
location as compared to 8.8 million NRs. (US $ 123,003) in the old location (Table 28).
Off-farm employment
In the old location 95 individuals were found to be involved in off-farm employment,
representing 26% of household respondents (84 hh). The types of work they were
involved with included government, NGO or private services (54 %), business (3%),
labor (33%), and other (9%). When asked how much they earned per year off the farm,
87 individuals provided their yearly income from off-farm activities as being a total of
3.15 million NRs. (US $ 45,000)21 (Table 29). Based on these respondents, the off farm
income per individual 22 was US $ 73.34. The responses ranged from a maximum of $
2,860 to minimum of $ 6 which is 35% below national per capita23 US $ 220 (ISRSC,
2001).
In contrast, in the new location 239 individuals representing 60% of households (193
hh) were involved in off-farm employment. The type of work remains similar (i.e., 56%
government, NGO or private services, 6% business, 23% labor and 11% others). Only
211 of 239 people provided their annual income and the average per capita income in
the new area was $ 96 and ranged from $ 7 - $ 5,142. These observations indicate that
the off farm employment opportunities as well as average income have increased in the
new location. This change has taken place despite the current political conflicts of the
area, which have limited much economic activity. In casual conversations, people said
there had been a decline in business, tourism, and other areas due to the conflict
21 US $ 1.00 = NRs. 70.00 22 The average sample household size (2131/332) is 6.6 23 The lower per capita as appeared in our findings is due to the cultural nature of respondents either non or less reporting their true income.

between the government and Maoist groups. Respondents were optimistic that the
situation would improve when the present crisis ends.
Micro Enterprises
It is evident that the villagers will not be sustained economically by agricultural
production alone in the new location. Therefore, people may be in a difficult economic
position if they do not adapt to the changing options. Some respondents 9% (23 hh) had
already engaged in some micro enterprise development at the household level (Table
30). In their initial phases, these enterprises were supported by NGOs and INGOs
through skill development training, technical support, and some financial support.
Respondents and community leaders believe more technical and financial assistance
will be necessary to bring about the desirable economic shift in new Padampur.
Currently, the small businesses are primarily based around agriculture and include
mushroom farming, wool spinning, poultry farming, dairy farming, bee keeping,
vegetable farming, and others. Economic assessment of these enterprises could not be
done at this early stage.
3. Housing
Housing is a basic need for any community. In the Padampur move, community
involvement in housing was an important issue. In a forced displacement it’s been
argued that:
“Loss of shelter tends to be only temporary for many resettlees; but, for some, homelessness or a worsening in their housing standards remains a lingering condition. In a broader cultural sense, loss of a family’s individual home and the loss of a group’s cultural space tend to result in alienation and status-deprivation” (Cernea, 2000:16).
In the old Padampur people mostly had houses made of thatch, mud and timber.
Because of the speculation about the possibility of relocating the village people did not
build permanent structures. In addition many people lacked sufficient capital to invest
in housing. These structures were, however, more environmentally friendly than those

built in the new location. In terms of both housing and land tenure, the people in new
Padampur experienced more security than in the old location. The actual structures
were more secure, and they were built on private land rather than government land
with indisputable ownership rights.
Physical Structure
Households with more than 12 bigha of land in the old location received only 2 bigha
due to the land distribution criteria24. Financial compensation was provided for the
additional land (PRC, 2004). Some people invested the compensation money in better
housing and/or purchased land in other places (Focus group meeting, 2005).
In a comparison of housing in the old and new location, 66 % (213 hh) said they have
“better” 25 housing after the transfer, 31% (101 hh) said their housing conditions
remained the same and only 3% (8 hh) said they have worse housing conditions in the
new location (Table 31). The respondent’s criteria for better housing in the new location
were mainly based on the physical structure, including roof, walls, number of rooms,
and availability of electricity (Table 32).
Change in Wealth
Wealth as measured by possessions increased slightly based on the number of
household technology items, vehicles, and alternative energy options. In a comparison
of energy options for cooking use of bio gas increased by 8%, use of Liquid Petroleum
Gas (LPG) increased by 7%, electric cooker increased by 3% and pressure cooker
increased by 9%. The slight shift towards alternative energy sources and modern
appliances was particularly beneficial for women, as they typically spent more time
doing household chores (collecting fodder and fuel wood and cooking) in the old
24 According to the land compensation criteria of Padampur Relocation Commission, a minimum of three kattha (3,645 sq. ft.) land was provided for those who did not have their own land and having less than three kattha of land holdings. Households between three kattha to one bigha (72,900 sq. ft.) received equal amount of land in the new location. Households with more than one bigha of land received one biga of land plus one third land and equivalent money for two third of land. The rate of compensation was NRs. 300,000 (eqv. US $ 4,286) per bigha (1 bigha=20 kattha). 25 Better housing is more permanent structure made of brick, cement and concrete.

location. With this additional free time women began to get more involved outside of
their houses in things like agro-forestry, community forestry projects, and other IGAs
Similarly, respondents reported motorcycle and bicycles ownership increased by 2%
and 13% respectively. But the use of bullock carts reduced in the new location by 29%.
The availability of electricity in Padampur also allowed them to purchase electronic
devices such as TVs, VCRs and CD players (Table 33).
Scarcity of Fresh Water
In terms of drinking water availability, 46% (148 hh) of respondents said that it was
worse in the new location than the old. The drinking water problem appears to be a
political issue, according to Mr. Babu R. Puri, former Chairman of Padampur Relocation
Commission. Apparently, a plan was prepared and approved by the committee to
channel upper Sangdi River water for the drinking water in new Padampur. At the time
of implementation, however, the villagers in the upper catchments did not agree to
share their water with new Padampur. As perceived by Mr. Puri, this was mainly due to
the political differences between him and residents people living near the water source.
Interviewees in the upper catchments had a different interpretation. According to them,
releasing water was a condition of their Government resettlement project (400
households approximately). The water problem appears to be a result of poor planning:
They failed to conduct a feasibility study for water supply and calculate the demand for
approximately 12,000 people; They did not obtain a binding agreement with the
adjacent village regarding water in the upstream catchments; They lacked a proper
vision for reconstruction in the new area.
In the new Padampur, the Drinking Water and Sewage Corporation (DWSC) in
collaboration with the local community, is managing a 100,000 liter tank supplied by
pumped ground water. Given the electricity costs for pumping, people are paying higher
water fees than normal. Local NGOs have also supported some drinking water plans
run by committees of local users. Nevertheless, Mr. Dipak Gyanwali, Nepal’s renowned

water resources expert said “rain water harvest can be an option to deal with fresh
water shortage problem. Padampur residents to be trained in producing alternative
crops that require less water and involve off farm economic activities rather depend only
on rice production” (pers. comm., 2004).
4. Marginalization
Forced displacement can result in marginalization, and can affect people both physically
and psychologically (Cernea, 2000). In the old location, the government’s investment in
local development activities was virtually non-existent. Access to physical infrastructure
and facilities for public use was nominal compared to other villages throughout the
Chitwan District. In addition, there was no intervention by NGOs and INGOs. Due to the
government’s long term plan to move the village, the old Padampur remained isolated.
Local development authorities saw it as an enclave of the Park, whereas Park
authorities said they did not have resources for local development activities. Even the
allocated buffer zone revenue26 could not be fully used due to an inactive village
representative (Jitendra Choudhari, pers. comm., 2004). Marginalization existed in the
old Padampur and could have been exacerbated in the new Padampur.
“Marginalization occurs when families lose economic power and spiral on a ‘downward mobility’ path. Middle-income farm households do not become landless, they become small landholders; small shopkeepers and craftsmen downsize and slip below poverty thresholds. Many individuals cannot use their earlier acquired skills at the new location; human capital is lost or rendered inactive or obsolete. Economic marginalization is often accompanied by social and psychological marginalization, expressed in a drop in social status, in resettlees’ loss of confidence in society and in themselves, a feeling of injustice, and deepened vulnerability”(Cernea, 2000:17).
What happens when a community comes from a location that has had minimal
development? It may be premature to judge possible economic marginalization as the
residents moved to the new location, one year prior to the study. According to the
26 The buffer zone regulation provided 30 – 50 % of Park revenue to be invested in the local community for various conservation and development activities managed by local user groups.

official record of the Padampur Relocation Commission, a total of 343 landless families
received land after the resettlement of them 42 hh were represented in our random
sample. On this count, marginalization was reduced.
Land was more equally distributed due to the land compensation threshold set by the
Relocation Commission. The minimum area of land-to-land compensation was one
bigha (0.625 ha.). The bigger landholders became smaller landholders. The gap
between landlords and tenants was reduced due to this mechanism that shifted the
village towards greater equity. For larger land owners who did not invest their
compensation funds wisely, there was also a chance of increased marginalization.
Effects on Tharu People
In a resettlement and displacement, indigenous communities are likely to lose much of
their culture and their economic independence in a changed environment (Cernea &
Schmidt-Soltau, 2005), thereby increasing marginalization. The indigenous Tharu
community in old Padampur was the last remaining settlement of cultural diversity. The
Tharu community has more attachment with the forest than other Padampur residents
who migrated from the hills (McLean, 2000). Collecting minor forest products such as
forest fibers, wild fruits, medicinal plants, and aquatic food sources such as fish and
shells from the river were important economic activities for Tharu households in old
Padampur. A majority of respondents (220 hh) said some groups of people were more
affected by the resettlement than others and 31% (98 hh) said there was not. When
asked who were such groups and how they were affected?, 63% (203 hh) of
respondents said Tharu, 42% (135 hh) said Bote, and 34% (110 hh) said Chepang.
Indigenous residents of new Padampur do not gather the same products from the
community forests in the new location due to the size of the forest. Their collections are
limited to fuelwood, fodder, and some medicinal plants in the newly established
community forest. The shortage of flowing water in the new location is further
aggravating their economic and cultural predicament 27(Table 35)
An ethno-botany survey conducted by the Tiger Rhino Conservation Project (TRCP)
identified that the Tharu Garaus28 knew the medicinal value of 200 plant species in the
Royal Chitwan National Park (RCNP). Similar to the Tharu, the Bote29, Darai and Kumal
groups of indigenous people were equally dependent on the forest resources. Despite
Park restrictions, many indigenous people were dependent on Park resources for their
immediate survival (Mueller-Boeker, 1999; Banskota et. al. 1996, Straede, 2000;
Straede and Helles, 2000). They used to enter into the Park to gather resources but
after their access was restricted, there were always risks of being caught by the Park
guards or the Royal Nepal Army.
Support Services
Increased support services in the new location were appreciated by the residents
because they contributed to improving livelihoods in the new settlement. Based on our
findings, people were satisfied with the support of the Government Organizations
(GOs), NGOs and INGOs. We found five NGOs actively working in different fields and
complementing government efforts to address immediate development needs after
resettlement. The King Mahendra Trust for Nature Conservation (KMTNC) through the
funding support from GEF, UNF and UNDP was running a Tiger Rhino Conservation
Project (TRCP).30 The Nepal Indigenous Development Society (NIDS) was instrumental
27 In an informal communication with the local villagers in Padampur, some Tharus are still visiting the Park’s buffer areas after the resettlement to practice their culture, traveling 18–20 Km to their previous home area. 28 Garau is the Tharu priest and sometimes also called Witch Doctor. 29 The Bote, Darai, Kumal, Maji, Mushars are also regarded as indigenous group in Chitwan. 30 For updates please visit at: http://www.kmtnc.org.np/prakriti/current/prakriti4.htm This project has been instrumental in providing both biological and socioeconomic support for the area aiming to reduce human pressure and conducting biological research in the Barandhabhar corridor forest which joins lowland and mid hill forest areas of Nepal (KMTNC, 2003). In addition, the project has been influential in establishing a community based conservation model by enhancing local capacity to ensure long term management of natural resources. Three new community forests with operational plans preparation and a series of capacity building trainings have been provided for the new Padampur villagers. A number of alternative income generating schemes were also introduced to reduce pressure in the forest, for example, distribution of improved stoves (907 hh), bio-gas (185 hh.), mushroom farming (43 hh.), bee keeping (35 hh), livestock farming (15 hh), dairy farming (26 hh) and vegetable farming. All these micro enterprises were introduced with substantial technical training and institutional mechanism to make
in implementing programs mainly designed to help Tharu women and support health,
sanitation, and literacy education programs in the new location.
New Padampur household respondents were asked to evaluate sustainability of support
services provided by the NGOs and INGOs. Nineteen percent (60 hh) were highly
optimistic, 73% (236 hh) were optimistic and 7% (22 hh) not optimistic at all (Table 36).
Explanations for the optimism included services were more accessible (54%) and more
institutionalized (20%). In contrast, people’s pessimism was due to the prevailing
political situation (6%) in 2005 (Table 37).
Empowerment of Women
In the women’s focus group, participants said that women’s empowerment has
increased significantly in the new location. The reduction in land size resulted in
reduced labor needs on the farm and in the household for women. More spare time has
enabled women to learn new skills and gain more education. Women’s skill training
programs include bee keeping, mushroom farming, goat rearing, fruit farming, wool
spinning and vegetable farming. In one focus group meeting, a participant expressed
her feelings about women’s empowerment in the new location:
“We are so lucky to be here compared to the old location. We acquired more knowledge and insights in our free time in new location. While in the old location we were heavily involved in hard work while men members were enjoying gossiping at tea shop. Now we have developed skill and knowledge on how to generate income. We don’t even think water scarcity is a major problem as we are confident this will be solved sooner or later. The opportunities and awareness in the new place really increased our understanding on development and conservation”
these efforts sustainable. A special program for gender related literacy (180 hh), establishment of saving and credit group (28 groups), wool spinning training (52 hh) and series of conservation and awareness trainings for women to increase their participation in natural resource management (KMTNC, 2004) At the community level, financial support was provided to establish a livestock veterinary center and a health post near new Padampur. TRCP helped the local Tharu community at Chitwan to establish a Tharu cultural museum so that their lifestyle and knowledge could be recognized. The museum was built in a strategic location as a tourist attraction. The revenue generated from this museum will be solely spent on conserving Tharu culture by establishing a Tharu Cultural Study Center. In parallel to this, an Indigenous Healing Center was also established to prevent indigenous knowledge from further degradation. (KMTNC, 2004). The WWF – Nepal Program also embarked on launching conservation and development activities in new Padampur for more information visit WWF Nepal’s website at http://www.wwfnepal.org/where_we_work/working_community_TAL.php.

Marginalization is difficult to evaluate at this stage of the resettlement. However, it is not
difficult to imagine that it will increase if strong support services are not provided by the
government and non-governmental institutions for a few years as households make the
transition to the new economies and social conditions of the new location.
5. Food Management
Food management is a crucial factor after relocation. The evidence of food shortage
and insecurity after the resettlement are highlighted in the resettlement discourse.
“Forced displacement increases the risk that people will fall into temporary or chronic undernourishment, defined as calorie-protein intake levels below the minimum necessary for normal growth and work” (Cernea, 2000 : 17).
In the new Padampur, lower production was observed as a result of the decrease in
land area for farming and water scarcity. People who used to grow enough food now
depend on cash because their existing land is not sufficient to support their food
requirements. Padampur residents expressed mixed reactions about their food quality,
and strategies for dealing with the food shortage.
Forty-three percent (138 hh) said the children’s nutrition was better in the new location
and 27% (87 hh) said it was worse. Some said that the available market allowed them
to buy food 30% (125 hh) (Table 38), but those who perceived that quality was worse
argued that processed food can not be equal to what was produced on their own farm
land.
In general, the current land holdings were inadequate for people to produce sufficient
food to feed their families. Seventy-four percent of the respondent (237 hh) produced
less food from their current land holding due to the reduced size and water scarcity as
compared to the old location. Only 26 % (85 hh) did not have food shortages with their
current land holdings and of them 2% (6 hh) said they were able to sell surplus food
(Table 39 & 40).

In response to the management of a food deficit, 32% (104 hh) were buying from the
market, 11% (35 hh) borrowed from the villagers who had surplus food, and 31% (98
hh) said they also buy food from their earnings from labor employment (Table 41).
Managing a food deficit may be challenging in the new Padampur, as people shifted
from a highly agrarian to cash economy under the prevailing political situation in the
area.
Households will need to generate cash to sustain their families. There has been some
indication of a shifting economy in animal husbandry, small scale enterprise, and
alternative income generating activities. A few households began farming mushrooms,
spinning fine wool out of raw wool, selling milk in the milk depot and selling vegetables
such as green garlic, onions, ginger and spinach. These household based enterprises31
indicate a slight economic shift seen in the new location where people produce and sell
their products in the nearby market.
6. Health Facility
Padampur residents in the old location were struggling with inadequate health facilities.
The situation was severe especially in emergencies during the monsoon season. Public
infrastructure services and transportation facilities to reach the nearest health post were
very poor. “Sick people tend to die while they keep waiting for the river flow to go down.
Compared to previous hardships, now people can get any type of health services in the
city within half an hour”. (Rukumanda Paudel, informal pers. comm., 2004).
In the new location it is expected that mortality and morbidity will decrease as result of
the established health post, which provides immunization services for the children of
certain ages. The resettlement project provided improved infrastructure for health
facilities and road access to get immediate medical services. In addition to modern
31 These enterprises were designed for households that can not afford large investments. The initial grant for the kick off the enterprises was provided by TRCP. The mushroom farming for example, is a enterprise that a farmer can grow mushroom within his premises and sell the product in the market. The economic assessment and viability of these enterprise could not be done as these initiatives were recently started.

health services, some Tharu people are still practicing their traditional healing methods
with the Gurau. Research on forced resettlement indicates that there could be increased
mortality and deteriorating health conditions.
“Massive population displacement threatens to cause serious declines in health levels. Displacement-induced social stress and psychological trauma are sometimes accompanied by the outbreak of relocation-related illnesses, particularly parasitic and vector-born diseases such as malaria and schistosomiasis. Unsafe water supply and improvised sewage systems increase vulnerability to epidemics and chronic diarrhea, dysentery, etc. The weakest segments of the demographic spectrum infants, children, and the elderly are affected most strongly” (Cernea, 2000:18).
As opposed to the hardships Padampur residents were facing before the move, they
were relieved with better health facilities in the new location. Seventy-eight percent
respondents (251 hh) said they had better health services in the new location, whereas
16% (51 hh) said they were the same. The villagers’ indications of better health facilities
included the availability of immediate medical services (91%), quick emergency services
(91%) and easy access to child immunization (92%). During our survey, village children
were being taken to the health post in new Padampur for immunization (Table 42 & 43).
Five percent respondents disagreed and said that the new health facilities were worse
because of the high costs and transportation necessary to receive these services.
Households’ sanitation level in the new area increased as modern toilets, safer drinking
water facilities, compost and rubbish pits were found almost in every household (Table
44). Similarly, health care for women improved in the new location. Ninety-one percent
of respondents (294 hh) said they have better pre and post-natal care for women. Only
9% of the respondents (28 hh) said that they did not, citing a lack of proximity, no
trained midwives, and no telephone services to contact an ambulance service (Table
45).

Tharu’s Case
In a cross analysis, we found of the 114 Tharu respondent households the majority said
there were much better health conditions in the new location. Similarly, 90% (103 hh)
were getting immediate medical services, 90% (103 hh) had access to children
immunizations, and 87% (101) found easier access to emergency medical help. Ninety
percent of Tharu people (102 hh) said they were satisfied with the women’s health
facilities in new Padampur.
Tharu people also depend on traditional healers and knowledge to treat several
diseases. To preserve and maintain indigenous knowledge and practice, the Tiger
Rhino Conservation Project (TRCP) worked with local indigenous healers to establish a
Clinic in Bachhauli. The Clinic has been popular and receives six to ten visits per day for
various consultations and treatments. Run by a group of indigenous healers, it is
registered legally in the Chitwan District Administration Office. Through this local clinic
Tharu boys are being motivated to learn indigenous medical knowledge.
7. Common Property Resources
Out of 1,000 ha. land in the new Padampur, 200 ha. have been used for common
property. The Relocation Commission divided the total allocated public land into village
roads 45%, government offices, schools, and sites for religious purposes 4%, river and
drainage 20%, and community forests 31% (Padampur Relocation Commission, 2004)
(Table 46).
These resources were important to the success of the resettlement project. They helped
the people from old Padampur maintain the socioeconomic conditions present in their
old communities. However researchers argue that, in aftermath of involuntary
resettlements these common resources are not compensated adequately:

“For poor people, particularly for the landless and asset less, loss of access to the common property assets that belonged to relocated communities (pastures, forested lands, water bodies, burial grounds, quarries, etc.) results in significant deterioration in income and livelihood levels. Typically, losses of common property assets are not compensated by governments. These losses are compounded by loss of access to some public services, such as school (Mathur 1998; Mahapatra 1999a, 1999b), losses that can be grouped within this category of risks” (Cernea,2000:19).
The physical infrastructure in new Padampur was very useful for the people. Household
respondents confirmed that public physical infrastructure in the new location was better.
Seventy-three percent (233 hh) said there was very good common physical
infrastructure, 23% (74 hh) said it was satisfactory, and 4 % (14 hh) said it was poor.
Public physical infrastructure in the old location was perceived by 82% (265 hh) of
respondents as being very poor or even non-existent in many cases (Table 47).
Ninety-two percent respondents (295 hh) said they were well compensated for public
resources in the new location. Only 6% (18 hh) said they were not compensated due to
a lack of funding and land availability. Regarding the government’s accountability in the
planning and implementation of the physical infrastructure, 90% (289 hh) said they were
satisfied. Respondents were also asked whether the built infrastructure was functional
and 85% (274 hh) respondents said yes, while 10% (32 hh) said no. They cited
carelessness in construction (3%) and lack of adequate maintenance (7%) as being
their main reason for this.
In relation to land allocation in the new site for future community use, 70% (227 hh) said
there was enough, 20 % said there was not (63 hh), 10% (32 hh) did not know (Table
48). People who believed there was inadequate land for future use is due to the limited
budget and a perceived threat to remaining forests. The bad planning of the
resettlement commission was also a cause of allocating inadequate land.
In the long term, 83% (268 hh) felt that current land allocation for common use would be
inadequate, only 10% (32 hh) said it would be enough. The assessment that there is
adequate land in short term but inadequate land in the long run is understandable and

suggests a high degree of environmental awareness. People throughout Nepal have
observed rapid population growth and witnessed the consequences in terms of land
shortage and habitat degradation. These perceived future problems were not foreseen
as an immediate problem in new Padampur, but rather as a national problem of Nepal
due to a lack of resources to develop urban economies.
8. Social Ties
One of the criticisms of forced resettlement focuses on the disintegration of the social
fabric within resettled communities. Top down resettlement conceived by government,
development and non-governmental organizations has been documented to have
serious social consequences.
“Forced displacement tears apart the existing social fabric. It disperses and fragments communities, dismantles patterns of social organization and interpersonal ties; kinship groups become scattered as well. Life-sustaining informal networks of reciprocal help, local voluntary associations, and self-organized mutual service are disrupted. This is a net loss of valuable ‘social capital,’ that compounds the loss of natural, physical, and human capital. The social capital lost through social disarticulation is typically unperceived and uncompensated by the programs causing it, and this real loss has long-term consequences” (Cernea, 2000:19).
Furthermore, a resettled community may be politically weaker. The elder’s knowledge
may disappear and the younger generation that takes the lead can result in
deteriorating traditional family values (Cernea & Schmidt-Soltau, 2005).
The Padampur Relocation Commission (PRC) argues that it made every effort to
maintain social ties by encouraging people to live together and by allocating land near
their former neighbors. However, in our survey 37% (120 hh) had the same neighbors
in the new location and 32% (66 hh) said their neighbors were from the same village
known each other well. Seven percent, on the other hand said they had new
neighbors that they did not know from the same village (Table 49 & 50).
The majority of respondents 69% (223 hh) said that their relationships among
neighbors, in the new place were good. However, 4% (13 hh) said it was not easy to
deal with new people, and 23% (75 hh) said the relationships were not like before.
They said it required more time to get to know each other in order to maintain a good
relationship (Table 51).
It is common for new Padampur residents to be involved in variety of social events.
Respondents were engaged in local development activities such as public road (86%)
and bridge (82%) construction. Another important social event identified by respondents
was sharing good and bad time with neighbors (96%). People believed they engaged in
more community events in the new location as compared to the old. Participating in the
management of the community forest and the village’s drinking water were major social
events in the new location. The support services form the NGOs and INGOs helped
people engage in more community meetings and a shared awareness about improving
their environment and livelihoods.
Socio-cultural Effects on Tharu
Unlike other resettlement programs, the Padampur resettlement happened within a
similar socio-economic boundary. The village moved approximately 20 km north of the
old location. Also the surrounding host communities were not strangers to the newly
resettled population. Some social consideration for Tharu was evident in planning new
Padampur because relatives and clan members were all moved together. Respondents
argue that similar to other Tharu communities of Nepal, the Tharu in Chitwan32 are more
attached to nature than the hill migrants. For example, they need natural resources in
their festivals (McLean, 2000; Gurung, 1999). On the memorial day of their ancestors,
they require a special grass to decorate the front yard of their house. Tharu in old
Padampur were within the ecological boundary of the Park and found it easier to
maintain their close link with the environment which may be difficult in the new location
(McLean, 2000).
32 In an effort to help preserving local culture, KMTNC and the local Tharu people in Sauraha came up with an idea to establish a Tharu Cultural Museum. The purpose of this museum is to preserve and display the remaining Tharu Culture in Chitwan. The initial financial resources were provided by TRCP and local Tharu group. The Buffer Zone Management Committee contributed land. The museum will serve as for cultural conservation and provide education for younger generation about their cultural values.

Biodiversity Impacts
Conservation of biodiversity and human use of forest lands is a complex issue. Often
both local people and researchers view biodiversity conservation and meeting local
people’s resources needs as a conflict situation. For tigers conflict arises because tigers
need a larger land base than is available in the existing network of protected areas.
Despite an extensive protected area system in the Nepalese lowlands tigers are
threatened because the largest protected areas (Chitwan and Bardia national Parks)
are too small and isolated to support populations large enough to have long term
viability (Smith et. al, 1987; Dinnerstein & Wakramanayake, 1993; Smith et. al. 1998;
Ahearn et al., 2001). Lands outside of protected areas which can serve to connect or
enlarge protected areas are also important to local people for grazing, fodder and fuel
wood gathering. In old Padampur this competition for land between tigers and people
created human tiger conflicts. Wild tiger prey was reduced in border areas just inside
the park because of illegal grazing and both tigers and their prey had a negative impact
on residents of old Padampur. The prey species grazed on local crops and tigers killed
livestock.
Padampur resettlement can be seen as both a positive and negative outcome for local
people, but clearly a positive result for conservation. After the Padampur resettlement
the rhino and tiger population are increasing as evidenced by tracks of both species in
the former agricultural lands of old Padampur (Dinnerstein, et, al., 1999). These lands
are now a part of the Park and provide habitat for at least three breeding tigers (J. L.
David Smith, pers. comm., 2005) and approximately 20 rhinoceros (Dinnerstein, et, al.,
1999). The resettlement of Padampur has both increased the land base of Royal
Chitwan National Park by adding 1800 ha of prime alluvial habitat to the Park and
improved existing park habitat by reducing human use of areas of the Park that were
adjacent to old Padampur.
In our survey the majority of respondents agreed that the resettlement program has
enhanced biodiversity in the evacuated area. They categorized the biodiversity

improvements as 1) an increased core area of the Park 86% (278 hh), 2) a likely
increase in wildlife numbers 76% (244 hh), 3) reduced poaching 40% (128 hh), and 4)
reduced human pressure 52% (168 hh)(Table 52).
Household respondents also noted that the resettlement program contributed to
biodiversity conservation in the new location by developing community forests 86% (278
hh), adapting alternative energy sources instead of fuel wood 33% (106 hh), and
reducing the number of cattle 60% (194 hh) (Table 53).
Because Padampur residents were historically heavily dependent upon natural
resources in the old locations, conservation activists anticipated similar forest
degradation at the new site. However, predictions of forest degradation did not
materialize. Padampur residents realized the potential scarcity of natural resources at
the new site and valued the adjacent forest resources. With the initiative of Tiger Rhino
Conservation Project (TRCP)33, three community forests (Figure 3) were established
north of the new settlement. As elsewhere in Nepal, these community forests (CF) are
managed by a local community forest council in accordance with well developed
management prescriptions. People are allowed to periodically collect dead wood for
fuel, which is gathered communally and then distributed among all community forest
users. Villagers can also visit the forest every day to collect fodder and other minor
forest products on a regulated basis. This limited use of the forest established by user
group committees was a hardship that was offset by increased community services
generated by funds from community forest activities.
33 TRCP is an integrated conservation and development project funded by GEF, UNF and UNDP. The project is still going on and executed by KMTNC. The aim of this project is to ensure conservation of endangered tiger and rhino in a landscape level by conserving the Barandhabhar Forest Corridor. This corridor joins the RCNP and Valmik Tiger Reserve, India. This whole landscape is known as Vakmik- Parsa-Chitwan Tiger Conservation Unit.

Figure 3: Three community forests in North from new Padampur
In contrast to this new management system, at the old location, people tended to enter
the Park for diverse time intervals (every day, every week, every two weeks or every
month) and for a variety of reasons. Of the 144 respondents who visited the forest daily
when living in old Padampur, 74% said they spent 1 to 4 hours, 20% said 5 to 8 hrs.,
and only 6% said they spent 9 to 12 hrs. in the forest on a daily basis. Their time was
spent mostly collecting fodder, fishing and collecting medicinal herbs and minor forest
products for their daily needs (Table 54).
Natural Resources Consumption
Un-regulated land use and individual households attempting to extract a maximum
share of forest resources result in overgrazing by cattle and forest degradation in low
lands Nepal (Sharma, 1990). Animal husbandry is considered a major economic activity
for rural farmers producing milk, meat, dung cake, and compost fertilizer. John
Sidenskiter (1976) indicated that livestock densities were higher near the Park due to
the availability of good grazing in the Park. In addition, Jnawali (1994) found that Tharu
traditionally keep more cattle compared to hill migrants in Chitwan as a means of

converting forest biomass to dung to support their farm based economy (e.g. fertilizers,
mud plaster, fuel).
Our survey revealed that in old Padampur respondents kept more local cattle than they
currently do and they relied on free grazing the park as the main source of fodder.
Livestock numbers measured in Livestock Units (LU)34 decreased significantly between
old and new Padampur. Most importantly free grazing, livestock in old Padampur
consisted of approximately 4 LU / hh and was reduced to approximately 0.8 LU/hh. in
new site. This suggests cattle numbers may pose less of a threat to the forest area in
the new location. The situation is reversed for improved breeds with 0.012 LU of hybrid
cattle in old Padampur hh and twenty times that number, 0.24 LU, in new Padampur /
hh. Stall feed hybrid livestock are considered better for biodiversity because their fodder
includes farm as well as forest biomass. Stall feeding also reduces grazing on
regenerating Sal (Sorea robusta) seedling. From an economic perspective, people
prefer to stall feed hybrid cattle because it increases milk production and has the
additional benefit of facilitating biogas production (Dinnerstein, et, al., 1999)
The fuel wood demand from the growing population in and around Chitwan National
Park was a major cause of Park / People conflicts in old Padampur (Sharma, 1990). In
spite of legal restrictions on fuel wood gathering, Park authorities had to make
compromises with the resident allowing some fuel wood collection. However, there was
no legal provision for such collection. The majority of respondents (193 hh) said they
were self sufficient in fuel wood in the old location but 40% (128 hh) were not (Table
55). In the new location however, only 19% (62 hh) said they were self sufficient in fuel
wood (Table 55). The fuel wood deficit in the new location is being partially fulfilled by
harvesting stumps that were left behind when the land was cleared for resettlement,
collecting dead wood in community forest, and use of alternative energy options, such
as bio gas and Liquid Petroleum Gas (LPG). The villagers cautioned that the fuel wood
34 The conversion factors – Buffalo (1), Cow (0.7), Sheep/Goat (0.1) were adapted from (Bride, 1983; Jahnke, 1982 sited by Saetre, 1994 then cited by Regmi, 1998).

problem could become severe and may threaten the adjacent forests if alternative
energy options are not further developed to offset the declining supplies of tree stumps.
People in old Padampur were also reliant on the Park for timber for building homes,
86% (277 hh) (Table 56).
In the new area most residents experienced a reduction in the use of forest products
compared to the old location (Table 57). Households responded to reduce forest
resources by reducing livestock numbers, and using modern construction materials
(iron, concrete, bricks). Overall, Padampur residents have begun to use markets as a
means of fulfilling household needs, thereby decreasing their reliance on materials from
local forests.
Value of Wildlife
Human / wildlife conflicts in the old location were primarily crop and livestock
depredation. During the rice harvesting season approximately 43% of the rhino diet was
fulfilled by villager’s crops (Jnawali, 1986). In one study a few villagers nearest to the
park reported that in some years 80 to 90% of all their crops were lost due to grazing by
wild animals. As a result, farmers responded by abandoning farming near the park
boundary (Milton and Binney, 1980). In our survey for the old location, respondents
reported experiencing crop depredation, livestock depredation, and human injury or
death by tigers or rhinos (Table 58). Despite various problems associated with wildlife,
people of old Padampur valued wild animals as a resource for attracting tourists, 66%
(214 hh) (Table 59). Income from tourism was shared with local villagers through the
Buffer Zone Act which stipulated that 30 - 50% of Park revenue be distributed to buffer
zone villagers35.
35 However, as soon as they resettled in the new location they did not get buffer zone revenue because of Buffer Zone legal definition. According to the buffer zone regulations the villages those join their village boundary with the park are defined as the buffer zone village. (Narayan Poudel, Deputy DG Department of National Parks and Wildlife Conservation)

After arriving in the new location people still positively value wildlife. The new Padampur
respondents said it was good to see wildlife. They also appreciated having healthier
ecosystems with increased ecological services such as watershed management and
larger wildlife populations, which they felt was a national asset and a source of revenue
(Table 60). Compare to the old location, the respondents said the negative aspects of
wildlife in the new area were negligible. Only 17% (56 hh) referred to crop depredation
problem, and 9% (28 hh) reported livestock depredation, and 1.6% (5 hh) said human
injury and death were a major problem.
Threats to Connectivity & Corridor
One of the expected threats of the Padampur resettlement on existing biodiversity was
the potential impacts on the role of the Barandhabar Forest Corridor (BCF) as a link
between mountain and Terai ecosystems. The new Padampur site is adjacent to the
eastern portion of BCF. During the focus group discussions, residents mentioned that
there had to be urgent actions by appropriate agencies to stop illegal forest harvesting
in the mountain area. In our survey, respondent perception of the BCF was that it
provided environmental services (84%) and served as a source of fuel wood, fodder,
and timber (30%).
Compared to local natural resource consumption in the old location, the people’s
activities were more organized in the new location; they only entered the forest at
specified times as and as a registered member of the community forest user.
Respondents predicted that some potential impacts of the resettlement project on the
Barandhabar Forest Corridor could be increased human pressure 65% (209 hh), air
pollution 17% (55 hh), increased road traffic36 22% (68 hh) and a decreased width of the
corridor 55% (177 hh) (Table 61).
36 A road that passes through the corridor is a popular assess road and has had more traffic since the resettlement.
Conclusion
Although many studies have pointed out adverse implications of forced resettlement
and displacements in socioeconomic wellbeing, our research demonstrates that a
citizen initiated resettlement program brings mixed results with many positive outcomes
(Table 62 and 63). There were positive evaluations of equity in land size and security.
The land was distributed favorably to smaller landholders, who received an equal
amount of land and landless households were provided land and title to support their
livelihoods.
Overall, social ties among the Padampur residents did not disintegrate after
resettlement. More needs to be done, however to support employment shifts towards an
off-farm based economy. In addition, marginalization was not an issue due to increased
support services and women’s empowerment. The risk of morbidity and mortality often
attributed to resettlement did not occur because at the new site there were increased
access to local health services and to hospitals in the near by city. As a whole,
resettlement design and implementation was satisfactory with the exception of water
resource planning.
As Cernea (2000) pointed out, collaborative resettlement planning between planners
and resettlees is important for risk reversal. Maintaining transparent communication and
sharing information is also critical for resettlees to effectively participate in the planning.
One of the positive aspects of the Padampur resettlement was the extensive
involvement of resettlees from the beginning of the planning. Our data suggests that
citizen participation in the resettlement planning resulted in increased probability of
socio-economic wellbeing as compared to forced resettlement and displacements.
Despite several positive outcomes, there were also problems that need to be
addressed. We found food production in the new Padampur was reduced compared to
the old location primarily due to water shortages. For example, in the old location every
household produced rice for up to two seasons. In the new location, due to water

shortages, some households were limited to one crop of rice or only maize. In addition,
the resettlement program was not favorable for Tharu people who had lived in
Padampur for more than 200 years. One of the earlier critiques of Padampur
resettlement was degradation of traditional knowledge within the Tharu community in
the resettlement design (Mclean, 2000; McLean & Str�de, 2003). We found there was
concern among the Tharu and other residents that there would be loss of intrinsic
biodiversity value and nature based knowledge among the Tharu. Nevertheless, Tharu
people should not be looked at through only an indigenous lens as their livelihood was
not entirely dependent on forest resources such as some indigenous communities living
in African rain forests (Röschenthaler, 2000; Schimidt-Soltau, 2003). Many Tharu are
fully engaged in the market economy, often as some of the largest land owners.
Another drawback of Padampur resettlement was the lengthy planning and
implementation process. The delay was due to frequent change in the government and
conflicts among political forces. The lack of water is another considerable factor in
resettlement design as it may intensify social and economic risks if this issue is not
addressed in a timely manner. In the post resettlement development, the involvement of
NGOs and INGOs has been critical in Nepal due to inadequate financial resources to
embrace different aspects of the resettlement. The current political turmoil has also
impeded smooth economic development after the resettlement.
Cernea & Schimidt-Soaltau (2005) have discussed African conservation and forced
resettlements scenarios as being biased towards conservation at the cost of livelihood
for millions of poor indigenous people. Their arguments are primarily that the
conservation benefit is not shared among stakeholders and the costs are not shared as
well. Nepal’s situation differs from the African context. Increased people-centered
conservation efforts from both government and non-government sectors, such as
revenue sharing mechanisms, helped distribute the benefits and change local people’s
attitude towards conservation. (Lehmkul, et. al., 1988; Heinen and Kattel,1992; Heinen
and Yonzon, 1994; Heinen & Mehta, 2000; Mehta & Heinen, 2001). In terms of
biodiversity conservation, people’s evaluation of the Padampur resettlement was that it

was positive for conservation. The resettlement program helped support biodiversity
conservation in the old as well as new location by restoring a natural ecosystem,
reducing human-induced pressure, and increasing the understanding of conservation
practices in the new Padampur. A related observation is that residents of other enclaves
within lowland biodiversity landscapes asked to initiate a dialogue about their
resettlement to a safer place. This change in attitude of the enclave residents, after the
Padampur resettlement, provides a new avenue for landscape scale conservation
dealing with Park/People issues. However, extra effort is necessary to support the
livelihoods of the poorest of the poor who are more dependent on the forest resources
than other community members.
Finally, the majority of earlier forced resettlement and displacement studies were based
on qualitative data and participant observations, which may be due to methodological
differences of professional disciplines. Our study is based on representative,
quantitative data in new Padampur. In addition, qualitative data were gathered from the
three focused groups in order to assess the overall evaluation of the resettlement and
planning process. The findings represent what a broad range of the people involved
think about the project. Since the study was done just one year after completion of the
resettlement program, our findings provides an empirical baseline for assessing the
impacts of the resettlement over time.
We suggest that future scientific studies should focus on periodic monitoring of the
livelihood patterns after resettlement. We raise this issue because the sociopolitical
problems of a particular country and a region may instigate poverty and job loss and
reduce market potential overshadowing resettlement. Another reason for future studies
is to detect unanticipated negative consequences of resettlement and address them in a
timely manner. Formal biological monitoring of wildlife species is also essential in
evaluating the actual impacts of resettlement on biodiversity over time.

Reference Cited
Ahearn, S. C., J.L.D. Smith, A. R. Joshi, and J. Ding. 2001. TIGMOD: an individual-based spatially explicit model for simulating tiger/human interaction in multiple use forest. Ecological Modeling 140:81-97
Banskota, K., B. Sharma, U. Sharma, and A. Rijal. 1996. Royal Chitwan National Park After Twenty Years: An assessment of Values, Threats, and Opportunities. Technical Report for King Mahendra Trust for Nature Conservation. Center for Resources and Environmental Studies.
Bookbinder M. P., E. Dinnerstein, A. Rijal, H. Cauley, and A. Rajouria. 1998. Ecotourism’s support of biodiversity conservation. Conservation Biology 12 (6): 1399-1404
Cernea, M. 2000. Impoverishment Risks, Risk Management and Reconstruction: A Model of Population Displacement and Resettlement. In Risks and Reconstruction: Experiences of Resettlers and Refugees. eds, Cernea M. and M. Christopher, 2000. The World Bank, Washington DC.
Cernea, M. and K. Schmidt-Soltau, 2005.National Parks and Poverty Risks: Is Population Resettlement the Solution? Web link: www.uicn.org/wpc2003/pdfs/programme/ workshops/newways/cerneasoltaupres.pdf
Cernea, eds. 1999. The Economics of Involuntary Resettlement Question and Challenges. The World Bank. Washington D. C.
Courtland Robinson, W. 2003. Risks and Rights:The Causes,consequences, and Challenges of Development-Induced Displacement. Ocational Paper. The Brookings Institution-SAIS. 1775 Massachusetts Avenue, NW, Washington DC 20036-2188
Colchester, M. 1997. Salvaging nature: Indigenous peoples and protected areas. Social Change and Conservation , eds. K. B. Ghimere and M. P. Pimbert, 97-130. London:Earthscan.
Dickinson, D. and M. Webber, 2004. Environmental Resettlement and Development on the Steppes of Inner Mongolia. Working Paper Series – 19 Environmental Resettlement and Development.
DDC Chitwan, 2002. District Profile of Chitwan. District Development Committee, Chitwan. Information and Resource Archive Center, Chitwan.
Dillman, D. A. 2000. Mail and Internet Surveys: The Tailored Design Method. Dinnerstein, E., and E. D. Wikramanayake. 1993. Beyound "hotspots": how to prioritize investments to
conserve biodiversity in the Indo-Pacific region. Conservation Biology 7:53-65 Dinnerstein, E., A. Rijal, M. Bookbinder, B. Kattel and A. Rajouria. 1999. Tigers as neighbors: efforts to
promote local guardianship of endangered species in lowland Nepal. In Riding the Tiger: Tiger Conservation in Human-dominated Landscapes, eds J. Seidensticker, S. Christie and P. Jackson.Cambridge University Press, Cambridge.
Dwivedi, R.2002. Models and Methods in Development-Induced Displacement (Review Article). Development and Change 33(4):709-732
Elder, J. W., M. Ale, M. Evans, D. P. Gillespie, R. K. Nepali, S. P. Poudel and B. P. Smith, 1976. Planned resettlement in Nepal’s terai. A social analysis of Khajura / Bardia Project. Tribhuvan University Press, Kathmandu, Nepal. INAS, CEDA and Depatment of Sociology University of Winsconsin, USA
Gebre, Y., 2002. A Differential Re establishment of voluntary and In voluntary Migrants: The Case of Netekel Settlers in Ethiopia. African Study Monographs, 23(1): 31-46, March 2002
Gee, E.P. 1959. Report on a Survey of the Rhinoceros Area of Nepal. Oryx 5(1):59-85. Ghimere, K. 1992. Forest or Farm? The Politics of Poverty and Land Hunger in Nepal. Delhi Oxford
University Press, India. Ghimere, M. 1999. Royal Chitwan National Park and its Impact on the Indigenous People of Chitwan and
Nawalparasi, Nepal. In Indigenous People and Protected Areas in South and Southeast Asia. eds, M. Colchester and C. Erni, 41-66. Proceedings of the Conference at Kundasang, Sabah, Malaysia, 14 -18 October 1998
Guneratne, A. 2002. Many Tongues, One People: The Making of Tharu Identity in Nepal. Cornell University Press, Ithaca and London.
Gurung, K.K. 1983. Heart of the Jungle, The Wildlife of Chitwan, Nepal. Andre Deutsch Limited. 105 Great Russell Street London WC1 in association with Tiger Tops Pvt. Lt. Kathmandu, Nepal
Heinen, J. T., and B. Kattel. 1992a. Parks, people, and conservation: A review of management issues in Nepal’s protected areas. Population Environment J. Interdisciplinary Studies 14(1):48-84

Heinen, J. T., and B. Kattel. 1992b. A review of conservation legislation in Nepal: Past, progress and future needs. Environmental Management. 16(6):723-733
Heinen, J. T., and J. N. Mehta. 1999. Conceptual and legal issues in the designation and management of conservation areas in Nepal. Environmental Conservation. 26(1):21:29
Heinen, J. T., and J. N. Mehta. 2000. Emerging issues in legal and procedural aspects of buffer zone management with case studies from Nepal. Journal of Environmental Development. 9(1):45-67
Heinen, J. T., and P.B. Yonzon. 1994. A review of conservation issues and programs in Nepal: From a single species focus towards HMG/ Min. of Local Development. 2004. Padampur Relocation – an Introduction. Padampur Relocation Committee, Chitwan, Nepal.
ISRSC, 2001. District Development Profile of Nepal. Informal Sector Research and Study Center, Kathmandu. Nepal.
KC, B. K. 2003. Migration, poverty and development in Nepal. Economic and Social Commission for and the Pacific. Ad hoc Expert Group Meeting on Migration and Development 27-29 August. Unpublished
KMTNC, 2003. Tiger Rhino Landscape Scale Conservation Project. Quarterly Progress Report Submitted to UNDP, Kathmadu. Unpublished.
Krueger. R. A., 1998.Designing and conducting focus group interview. University of Minneosta, St. Paul, Minnesota
Krueger. R. A.. 1995, Focus Group: A Practical Guide for Applied Research. SAGE Publications, London. Lemkuhl, J. F., R. K. Upreti, and U. R. Sharma. 1988. National Parks and Local Development: Grasses
and people in Royal Chitwan National Park, Npeal. Environmental Conservation. 15(2):143 -148. McLean J. and S. Straede. 2003. Conservation, Relocation, and the Paradigms of Park and People
Management – A Case Study of Padampur Village and The Royal Chitwan National Park, Nepal. Society and Natural Resources. 16:509-526. Taylor and Francis Group.
McLean, J. 2000. Conservation and the impact of relocation on the Tharus of Chitwan, Nepal. Himalayan Research Bulletin 19(2):38-44
Mehta. J. and J. T. Heinen. 2001. Does community-based conservation shape favorable attitudes among locals? An empirical study from Nepal. Environmental Management 28(2):165-177
Milton, J. P. And G. A. Binney. 1980. Ecological Planning in the Nepalese Terai: A report on resolving resource conflicts between wildlife conservation and agricultural land use in Padampur Panchyat. Threshhold International Center for Environmental Renewal, Washington D.C. 20007. USA
Mishra, H. R. 1982. Balancing human needs and conservation in Nepal’s Royal Chitwan National Park. Ambio 11(5):246-252
Mishra, H. R. 1984. A delicate balance: Tigers, rhinoceros, tourists and Park management vs. the needs of local people in Royal Chitwan National Park, Nepal. In National Parks, Conservation and Development: The role of protected areas in sustaining society, ed. J. A. McNeely and K. R. Miller, 197-205. Washington DC: Smithsonian Institution Press.
Mishra, H. R., M. Jefferies. 1991. Royal Chitwan National Park: Wildlife heritage of Nepal. King Mahendra Trust for Nature Conservation, Kathmandu, Nepal.
Pimbert, M. P. and K. B. Ghimere (eds).1997. Social Change and Conservation: Environmental Politics and Impacts of National Parks and Protected areas. Earthscan Publications Limited. UK.
Pimbert, M.P. and J.N. Pretty. 1995. Parks, People and Professionals. Putting “Participation” into Protected Area Management. UN Research Institute for Social Development (UNRISD). International Institute for Environment and Development (IIED) and World Wide Fund for Nature (WWF).
McDougal, C. 1989. Tiger attacks around Chitwan National Park. Cat News 11:13. Rawal, S. R., 1995. The Gir National Park and the Maldharis "Beyond Setting Aside". In Resident
Peoples and National Parks: Social Dilemmas and Strategies in International Conservation, eds P. C. West, S.R. Berchin.
Regmi, M.C. 1999. Thatched huts and stucco places: Phesants and landlords in 19th century Nepal. Adroit Publishers, Delhi, India.
Regmi, B.P. 1998. Study on “Park-people conflict: Livestock grazing and their impact on wildlife habitat” in western section (Gola and Manau area) of Royal Bardia National Park, Bardia Nepal (a case study of wildlife and livestock management in buffer zone). Masters Thesis, Tribhuvan University, Central Department of Botany, Kritipur, Nepal

Sharma, U. R. 1990, An overview of Park people interactions in Royal Chitwan National Park, Nepal, Landscape and Urban Planning, 19:133-144, Elsevier Science Publishers B. V., Amsterdam – the Netherlands
Sharma, U. R. 1991. Park-people interactions in Royal Chitwan National Park, Nepal. Ph. D. thesis, The University of Arizona, Tucson.
Shrestha, B. 1996. Park-people conflict around the Royal Chitwan National Park. Journal of Natural History 15:73-82
Shrestha, M. 2004. Relative ungulate abundance in a fragmented landscape: implications for tiger conservation. University of Minnesota, Ph. D. Thesis
Röschenthaler, U. 2000. Culture, history and perceptions on resettlement: A baseline study of the six villages in the Korup National Park. In cooperation with University of Buea, Cameroon & University Frankfurt, Institut für Historische Ethnologie. Liebigstr. 41, 60323 Frankfurt/Main, Germany, [email protected]
Schmidt–Soltau, K. 2003. Conservation Related Resettlement in Central Africa: Environmental & Social risks. Development and Change 34(3):525
Singh, M. L., 1984. Comparative Evaluation of Planned and un Planned Resettlement in Nepal. CEDA, Tribhuvan University, Kathmandu, Nepal
Smith, J.L.D., C. McDougal, S. C. Ahearn, A. R. Joshi and K. Conforti. 1999. Metapopulation structure of tigers in Nepal. In Riding the Tiger: Tiger Conservation in Human-dominated Landscapes. Cambridge University Press, Cambridge. eds, John Seidensticker, Sarah Christie and Peter Jackson.
Smith, J. L. D, Ahearn, and C. McDougel. 1998. Landscape analysis of tiger distribution and habitat quality in Nepal. Conservation Biology 12:1338-1346
Smythies, E. A. 1925. India’s Forest Wealth. India of today 4:1-137. London Humphrey Milford Oxford University Press, Bombay Calcutta Madras.
Str�de, S. and F. Helles. 2000. Park-people conflict resolution in Royal Chitwan National Park, Nepal: Buying time at high cost? Environmental Conservation, 27(4):368-381
West, P., and S. Brechin. 1991. Resident peoples and national Parks: Social dilemmas and strategies in international conservation. Tucson: University of Arizona Press.
Additional Bibliography Ando, A., J. Camm, S. Polasky and A. Solow. 1998. Species distributions, land values, and efficient
conservation. Science 279: 2126-2128. Arrow, K. et al. 1995. Economic growth, carrying capacity, and the environment. Science 268: 520-521. Arrow, K.J. et al. 1996. Is there a role for benefit-cost analysis in environmental, health, and safety
regulation? Science 272: 221-222. Balmford, A. et al. 2002. Economic reasons for saving wild nature. Science 297: 950-953. Barrett, C.B., K. Brandon, C. Gibson and H. Gjertsen. 2001. Conserving biodiversity amid weak
institutions. Bioscience 51(6): 497-502. Bengston, D. N. 1993. Changing Forest Values and Ecosystem Management. Society of Natural
Resources,7:515-533 Black, R. and M. F. Sessay. 1997. Forced migration, environmental change and woodful issues in the
Senegal River Valley. Environmental Conservation 24(3):251-260 Brown, L. 1999. Feeding nine billion. In State of the World 1999: A World-watch Institute Report on
Progress Toward a Sustainable Society. New York: Norton.

Bruner, A.G., R.E. Gullison, R.E. Rice and G.A.B. da Fonseca. 2001. Effectiveness of Parks in protecting tropical biodiversity. Science 291:125-128.
Callicott, J.B. and K. Mumford. 1997. Ecological sustainability as a conservation concept. Conservation Biology 11(1): 32-40.
Campbell, L.M. and A. Vainio-Mattila. 2003. Participatory development and community-based conservation: opportunities missed for lessons learned. Human Ecology 31(3): 417-437.
Cernea, M. 1997. The Risks and Reconstruction Model for Resettling Displaced Populations. World Development, 25 (10):1569-1587. ©World Bank. Elsevier Science. Printed in Great Britain
Cernea, M. 2005. ‘Restriction of access’ is displacement: a broader concept and policy. Forced Migration Review, 23:48-49
Colchester, M. 2000. Self-Determination or Environmental Determinism for Indigenous Peoples in Tropical Forest Conservation. Conservation Biology 14 (5):1365-1367
Chicchon, A. 2000. Conservation Theory Meets Practice. Conservation Biology 14 (5):1368-1369 Schwartzman, S., D. Nepsted and A. Moreira. Arguing tropical forest conservation: people versus Parks,
14 (5):1370-1374. Chow, J., R.J. Kopp and P.R. Portney. Energy resources and global development. 1528-1531. Christopher W. Moore, The Mediation Process: Practical Strategies for Resolving Conflict, 2nd Edition,
1996. Plenum Press Clark, D. and A. Carothers, 2000. Resettlement: The World Bank’s Assault on the Poor. Center for
International Environmental Law. Clark, J.A. 1994. The Endangered Species Act: its history, provisions and effectiveness. In Endangered
Species Recovery: Finding the Lessons, Improving the Process, T.W. Clark, R.P Reading and A.L. Clarke ed. Island Press.
Cohen, J.E. 2003. Human population: the next half century. Science 302: 1172-1175. Cox, P. 1997. Ecocolonialism and indigenous-controlled rainforest preserves in Samoa. Ambio 26(2): 84-
89. Daily, G.C. and K. Ellison. 2002. Costa Rica: paying Mother Nature to multitask. In The New Economy of
Nature: The Quest to Make Conservation Profitable. Island Press. Daily, G.C. et al. 2000. The value of nature and the nature of value. Science 289: 395-396 Dasgupta, P. 1995. The population problem: theory and evidence. Journal of Economic Literature 32:
1879-1902. Dietz, T., E. Ostrom and P.C. Stern. 2003. The struggle to govern the commons. Science 302: 1907-1912 Ehrenfeld, D. 1988. Why put a value on biodiversity? In Biodiversity, E.O. Wilson (ed.). National Academy
Press. Esty, D. 2001. Bridging the trade-environment divide. Journal of Economic Perspectives 15(3): 113-130. Ferraro, P.J. and A. Kiss. 2002. Direct payments to conserve biodiversity. Science 298: 1718-1719 Fishbein, M. and M.J. Manfredo. 1992. A theory of behavior change. In Influencing human behavior:
theory and applications in recreation, tourism, and natural resources management, M.J. Manfredo (ed.). Champaign, IL: Sagamore.
Flitsch, K.M., D.H. Anderson, Ph.D.,Thompson, J.L., and Rosendahl, J. M., 2004. Estimating Summer Use in Voyageurs National Park. Technical Report. University of Minnesota, College of Natural Resources.
Fulton, D.C., M.J. Manfredo and J. Lipscomb. 1996. Wildlife value orientations: a conceptual and measurement approach. Human Dimensions of Wildlife 1(2): 24-47.
Gan, J., O. O. Onianwa, J. Schelhas. G.C. Wheelock and M. R. Dubois. 2005. Does Race Matter in Landwoners’ Participation in Conservation Incentive Programs?. Society of Natural Resources 18:431-445
Gee, E.P. 1963. Report on a Survey of the Rhinoceros Area of Nepal. Oryx 7(3):67-76. Getz, W.M., L. Fortmann, D. Cumming, J. duToit, J. Hilty, R. Martin, M. Murphree, N. Owen-Smith, A.M.
Starfield and M.I. Westphal. 1999. Sustaining natural and human capital: villagers and scientists. Science 283: 1855-1856.
Ginsberg, J. 2002. CITES at 30 or 40. Conservation Biology 16(5): 1184-1191. Goulder, L.H. and D. Kennedy. 1997. Valuing ecological services: philosophical bases and empirical
methods. In Nature’s Services: Societal Dependence on Natural Ecosystems, G. Daily (ed.). Island Press
Goulder, L.H. and R.N Stavins. 2002. Discounting: An eye on the future. Nature 419: 673-674.

Grumbine, R.E. 1996/97. Using biodiversity as a justification for nature protection in the U.S. Wild Earth 6(4): 71-80.
Hackel, J.D. 1999. Community conservation and the future of Africa’s wildlife. Conservation Biology 13(4): 726-734.
Hannigan, J.A. 1995. Biodiversity loss: the successful 'career' of a global environmental problem. In Environmental Sociology: A Social Constructionist Perspective. New York: Rutledge.
Hausman, D.M. and M.S. McPherson. 1996. Two examples. In Economic Analysis and Moral Philosophy. Cambridge University Press.
Heinen, J. T. 1996. Human behavior, incentives, and protected area management. Conservation Biology. 10:681-684
Heinen, J. T. 1993. Park-people relations in Koshi Tuppo Wildlife Reserve, Nepal: A socio-economic analysis. Environmental Conservation. 20(1)25:33
Jackson-Smith, D. and G. W. Gillespie, Jr.2005. Impacts of Farm Structural Change on Farmers’ Social Ties. Society of Natural Resources, 18:215-240.
James E. Crowfoot and Julia M. wondolleck, eds, Environmental Disputes: Community Involvement in Conflict Resolution. 1990. Island Press.
Jantzen, D. 1992. A south-north perspective on science in the management, use, and economic development of biodiversity. In Conservation of Biodiversity for Sustainable Development, O.T. Sandlund, K Hindar and A.H.D. Brown (eds.). Oslo: Scandanavian University Press.
Johnson, D.G. 2000. Population, food and knowledge. American Economic Review 90(1): 1-14. Julia M. Wondolleck 1988. Public Lands Conflict and Resolution: Managing National Forest Dispute.
Plenum Press Karieva, P. (ed.). 2002. Applying ecological science to recovery planning (various articles). Ecological
Applications 12(3): 629-723. Kinsey B.H. and H. Binswanger. 1993. Characteristics and Performance of Resettlement Programs: A
Review. World Development 21(9):1477-1494. Pergamon Press Ltd. Printed in Great Britain. Kinsey, B. H. and H. P. Binswanger. 1993. Characteristics and Performance of Resettlement Programs: A
Review. World Development 21(9):1477-1494 Koenig, D. 2001. Toward Local Development and Mitigating Impoverishment in Development-Induced
Displacement and Resettlement. The Final Report Prepared for ESCOR R7644 and the Research Program on Development-Induced Displacement and Resettlement organized by the Refugee Studies Centre, University of Oxford. Department of Anthropology, American University. Washington, DC 20016-8003 USA
Koenig, D. and T. Diarra. 1998. The Environmental Effects of Policy Change the West African Savanna: Resettlement, Structural Adjustment and Conservation in Western Mali. Journal of Political Ecology 5:23
Kriesi, H. 1996. The organizational structure of new social movements in a political context. In Comparative Perspectives on Social Movement, D. McAdam, J.D. McCarthy and M.N. Zald (eds.). Cambridge: Cambridge University Press.
Lime, W.L. and M. S. Lewis, 1995. Voyageurs National Park Snowmobile Study: Phase 1 of a 2-Year Study. Cooperative Park Studies Unit, University of Minnesota. College of Natural Resources.
Manfredo, M.J., T. Teel and A.B. Bright. 2003. Why are public values toward wildlife changing? Human Dimensions of Wildlife 8: 287-306.
McAdam, D., J.D. McCarthy and M.N. Zald. 1996. Introduction: opportunities, mobilizing structures, and framing processes – toward a synthetic, comparative perspective on social movement. In Comparative Perspectives on Social Movement, D. McAdam, J.D. McCarthy and M.N. Zald (eds.). Cambridge: Cambridge University Press.
McPhee, J. 1971. Encounters with the Archdruid. Farrar, Straus and Giroux. Miller, J., J.M. Scott, C.R. Miller and L.P. Waits. 2002. The Endangered Species Act: dollars and sense?
BioScience 52(2): 163-168. Mehta. J. and J. T. Heinen. 2001. Does community-based conservation shape favorable attitudes among
locals? An empirical study from Nepal. Environmental Management 28(2):165-177 Miquelle, D. 2004. Validity Assessment of Barandhabhar Forest as an Ecological Corridor. A Report
Submitted to KMTNC & UNDP. Unpublished.

Nepal, S. K. and K. E. Weber. 1992. Struggle for existence. Park people conflict in the Royal Chitwan National Park, Nepal. Bangkok: Asian Institute of Technology.
Nepal, S. K. and K. E. Weber. 1995. Prospects of coexistence: Wildlife and local people. Ambio 24(4):238-245
Nepal, S.K. 2002. Involving Indigenous Peoples in Protected Area Management: Compratives from Nepal, Thailand, and China. Environmental Management 30(6):748-763
O’ Leary, R. and L. B. Bingham. 2003. the Promise and Performance of Environmental Conflict Resolution. Resources for the Future Press, Washington D. C. page 366
Oates, J.F. 1999. Conservation at the close of the Twentieth Century: for love of nature or love of money? In Myth and Reality in the Rain Forest: How Conservation Strategies are Failing in West Africa. University of California Press.
Oates, J.F. 1999. Conservation falls in love with economic development. In Myth and Reality in the Rain Forest: How Conservation Strategies are Failing in West Africa. University of California Press.
Pindyck, R.S. and D.L. Rubinfeld. 1989. The analysis of competitive markets. In Microeconomics. Macmillan Publishing Co.
Polasky, S. 1994. What role for economic considerations in species conservation policy? Endangered Species Update 11(11): 1-4.
Pretty, J., 2003. Social capital and the collective management of resources. Science 302: 1912-1914. Proctor, J.D. 2001. Solid rock and shifting sands: the moral paradox of saving a societally constructed
nature. In Social Nature: Theory, Practice, and Politics, N. Castree and B. Braun (eds.). Malden, MA: Blackwell.
Redford, K. H. and S. Sanderson, 2000. Extracting Humans from Nature. Conservation Biology 14 (5):1362 - 1364
Redford, K.H. and A.M. Stearman. 1992. Forest-dwelling native Amazonians and the conservation of biodiversity: interests in common or in collision? Conservation Biology 7: 248-255.
Regmi, M. C. 1976. Landownership in Nepal. The Center for South and Southeast Asia Studies. University of California, Berkley
Repetto, R. and T. Holmes. 1983. The role of population in resource depletion in developing countries. Population and Development Review 9: 609-632.
Rittel, H.W.J. and M.M. Webber. 1984. Planning problems are wicked problems. In Developments in Design Methodology, N.Cross (ed.). J. Wiley & Sons.
Runge, C.F. 1999. A conceptual framework for agricultural trade and the environment: beyond the ‘green box’. Journal of World Trade 33(6).
Ruttan, V. 2002. Productivity growth in world agriculture: sources and constraints. Journal of Economic Perspectives 16(4): 161-184.
Sagoff, M. ed, 1988. At the shrine of our lady of Fatima; or why political questions are not all economic. in The Economy of the Earth: Philosophy, Law and the Environment. Cambridge University Press.
Salwasser, H. 2002. Navigating through the wicked messiness of natural resource problems: roles for science, coping strategies, and decision analysis. Sierra Science Summit. Draft.
Schwartzman, S., A. Moreira and D. Nepstad. 1999. Rethinking Tropical Forest Conservation: Perils in Park. Conservation Biology 4 (5):1351-1357
Schwartzman, S., D. Nepstad and A. Moreira. 2000. Arguing Tropical Forest Conservation: People versus Parks. Conservation Biology 14(5):1370-1374
Sen. A. 1994. Population: delusion and reality. The New York Review of Books, Sept. 22, 1994, 62-71. Shaffer, M.L., J.M. Scott and F. Casey. 2002. Noah’s Options: Initial cost estimates of a national system
of habitat conservation areas in the United States. Special issue of Ecological Applications 13(1), Supplement (various articles).
Sharma, U. R. 1998. Collaborative management of protected areas: Nepal, Proceedings of workshop on Collaborative Management of Protected Areas in the Asian Region. Royal Chitwan National Park, 25-29 May.
Sharma, U. R., and W. W. Saw. 1993. The role of Nepal’s Royal Chitwan National Park in meeting the grazing and fodder needs of local people. Environmental Conservation 20(2):139:142
Smith, M.D. and J.E. Wilen. 2003. Economic impact of marine reserves: the importance of spatial behavior. Journal of Environmental Economics and Management 46(2): 183-206.
Stavins, R.N. 1988. What can we learn from the grand policy experiment? Lessons from SO allowance trading. Journal of Economic Perspectives 12: 69-88.
Susskind, L, P. Levy, and J. Thomas-Learmer. 2000. Negotating Environmental Agreements:how to avoid escalating confrontation, needless costs, and unnecessary ligitation. Island Press, Washington D. C., Pg. 337.
Susskind L. (editor), et. al. 1999. The consensus Building Handbook: A Comprehensive Guide to Reaching Agreement. Sage Publications
Terborgh, J. 1999. Tropical forests: worth more dead than alive. In Requiem for Nature. Island Press. Terborgh, J. 2000. The Fate of Tropical Forests: A Matter of Stewardship. Conservation Biology 14
(5):1358 – 1361 Thorbjarnarson, J. 1999. Crocodile tears and skins: international trade, economic constraints, and limits
to sustainable use of crocodilians. Conservation Biology 13(3): 465-470. Tierney, J. 1990. Betting the planet. The New York Times Magazine, December 2, 1990. Tilman, D., K. Cassman, P. Matson, R. Naylor and S. Polasky. 2002. Agricultural sustainability and the
costs and benefits of intensive production practices. Nature 418: 671-677. Treadwell, J.L. 2001. Supreme Court invalidates Corps’ migratory bird rule. Water Log: A Legal Reporter
of the Mississippi-Alabama Sea Grant Consortium 21(1): 1, 7-9. Webber, M and B. McDonald. 2002. Involuntary Resettlement, Production and Income: Evidence from
Xiaolangdi, PRC. Department of Geography, University of Melbourne Webster, D. 1997. The looting and smuggling and fencing and hoarding of impossibly precious, feathered
and scaly wild things. The New York Times Magazine, February 16, 1997. Weiner, J. 2001. Policy design for international greenhouse gas control. In Climate Change Economics
and Policy.ed, M. Toman. Resources for the Future. West, P. 1994. Introduction: Resident peoples and protected areas-part III. Society of Natural Resources
7:303-304 Western, D. and R.M. Wright. 1992. The background to community-based conservation. In Natural
Connections: Perspectives in Community-based Conservation, D. Western and R.M. Wright (eds.). Island Press.
Western, D. M. C. Pearl, eds. 1989. Conservation for the Twenty-first Century. New York Oxford University Press.
Wikramanayake, E. D., E. Dinnerstein, J. G. Robinson, K. U. Karanth, A. Rabinowitz., D. Olson, T. Mathew, P. Hedao, M. Connor, G. Hemley and D. Bolze. 1999. Where can tigers live in the future? A framework for identifying high-priority areas for the conservation of tigers in the wild. In Riding the Tiger: Tiger Conservation in Human-dominated Landscapes, J. Seidensticker, S. Christie and P. Jackson, Eds. Cambridge University Press, Cambridge.
Wondolleck, J. and S. Yafee. 2000. Making Collaboration Work: Lessions from innovation in natural resources management, Island Press, Washington D. C. pg. 277

Tables Socio-demographic Characteristics Table 1: Total and sample population and gender categories of Padampur Village Development Committee (VDC)
Total Population Sample Population Ward No. Total
hh. Ma Fe Total % Total
hh. Ma Fe Total %
1 269 634 643 1277 12 39 170 149 319 15 2 226 722 790 1512 14 37 129 118 247 12 3 176 547 540 1087 10 29 84 79 163 8 4 142 408 399 807 7 30 103 106 209 10 5 202 536 526 1062 10 40 130 103 233 10 6 278 752 727 1479 13 44 142 153 295 14 7 145 418 426 844 8 20 58 61 119 40 8 325 744 750 1494 13 49 160 154 314 15 9 271 782 693 1475 13 34 105 127 232 11
Total 2,034 5,543 5,494 11,037 100 322 1081 1050 2131 100 Population data source: District Development Committee, Chitwan2002 Table 2: Caste and ethnicity of respondent households and total population in Padampur Village Development Committee (VDC) Caste Sample % VDC Total % Tharu 114 35 889 44 Brahmin 90 28 444 22 Chhetri 28 9 161 8 Chepang 7 2 32 1 Bote 13 4 60 3 Others* 70 22 448 22
Total 322 100 2034 100 *Tamang, gurung, darai, newar, dharti, damai, Kami, Rai/Magar, Giri/Puri, Kumal & Sarki Table 3: Age categories of members in sampled households
Age n % 0 -15 710 33
16 - 59 1255 59 60 -100 164 8 Total 2131 100
Table 4: Religious belief of respondent households
Type n % Hindu 283 88 Buddhist 32 10 Christian 3 1 Others 3 1
Total 322 100 Table 5: Primary languages spoken in the respondent household.
Type n % Tharu 115 36 Nepali 159 49 Tamang 19 6 Gurung 8 3 Others 20 6 Total 322 100
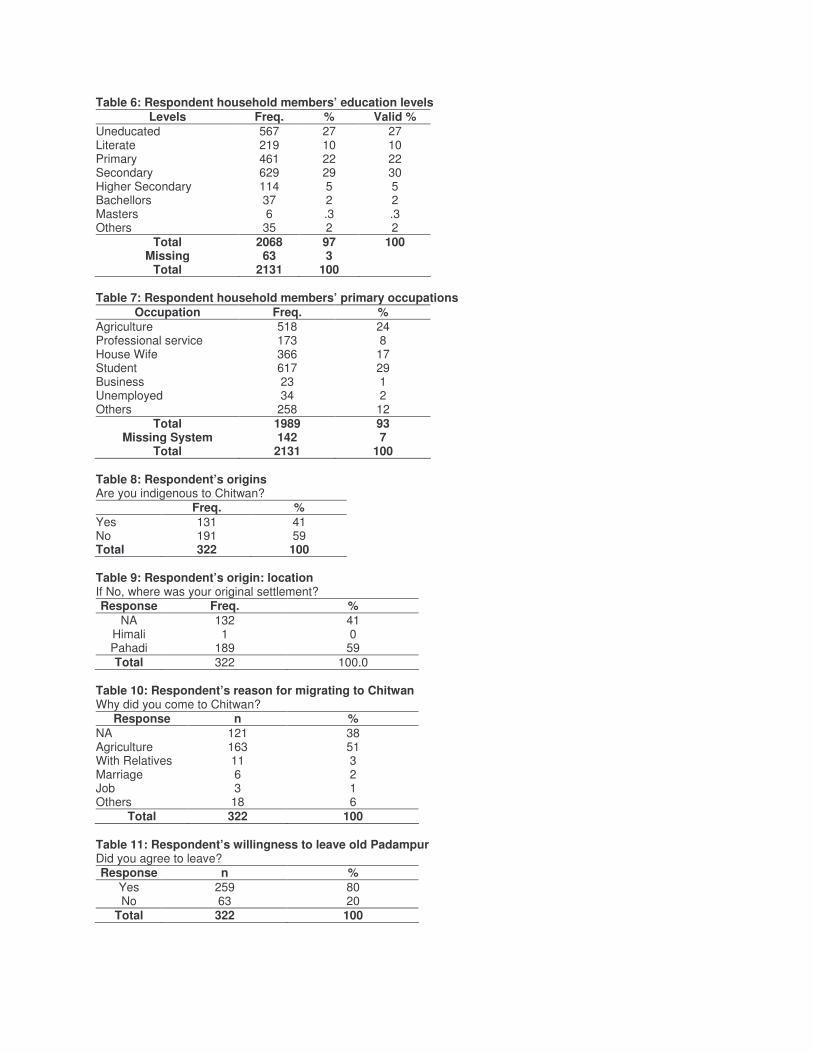
Table 6: Respondent household members’ education levels Levels Freq. % Valid %
Uneducated 567 27 27 Literate 219 10 10 Primary 461 22 22 Secondary 629 29 30 Higher Secondary 114 5 5 Bachellors 37 2 2 Masters 6 .3 .3 Others 35 2 2
Total 2068 97 100 Missing 63 3
Total 2131 100 Table 7: Respondent household members’ primary occupations
Occupation Freq. % Agriculture 518 24 Professional service 173 8 House Wife 366 17 Student 617 29 Business 23 1 Unemployed 34 2 Others 258 12
Total 1989 93 Missing System 142 7
Total 2131 100 Table 8: Respondent’s origins Are you indigenous to Chitwan?
Freq. % Yes 131 41 No 191 59 Total 322 100 Table 9: Respondent’s origin: location If No, where was your original settlement? Response Freq. %
NA 132 41 Himali 1 0 Pahadi 189 59 Total 322 100.0
Table 10: Respondent’s reason for migrating to Chitwan Why did you come to Chitwan?
Response n % NA 121 38 Agriculture 163 51 With Relatives 11 3 Marriage 6 2 Job 3 1 Others 18 6
Total 322 100 Table 11: Respondent’s willingness to leave old Padampur Did you agree to leave? Response n %
Yes 259 80 No 63 20
Total 322 100

Table 12a: Respondent’s reasons for leaving old Padampur Reasons n %
Wildlife depredation 31 12 Threat from flood 156 60 Lack of transportation facilities 21 8 Lack of health facilities 37 14 No development activities 8 3 Threat of being alone 6 2
Total 256 100 Table 12b: Respondent’s reasons for not agreeing to leave old Padampur
Reasons n % Availability of fodder and fuel wood 1 1 Traditional place 19 30 Clean Environment 3 5 Better production 25 40 Easily available forest products 4 6 Personal reason 2 4 Others 9 14
Total 63 100 Table 13: Respondent’s overall evaluation of the resettlement program Overall, are you satisfied with this resettlement program? Response n %
Yes 260 81 No 62 19
Total 322 100 1. Land Tenure Table 14: Land holding categories of households in old and new locations
*1 Kattha = 3,645 Sq. Ft. ** 2 missing system Table 15: Respondent households’ average land holding
How much land did you own in the old place?
How much land do you own now in the new location?
Range
n % n % 0 kattha* 42 13 2 1 0.1-20 kattha 159 49 227 70 21-40 kattha 67 21 86 27 41-60 kattha 32 10 2 1 61-80 kattha 10 3 1 0 81-100 kattha 4 1 1 0 >100 kattha 8 3 1 0
Total 322 100 320** 100
Land holding in Old Padampur Unit Kattha
Landholding in New Padampur Unit Kattha
n 322 322 Mean 23.5 14.8 Sum 7577.7 4764.1
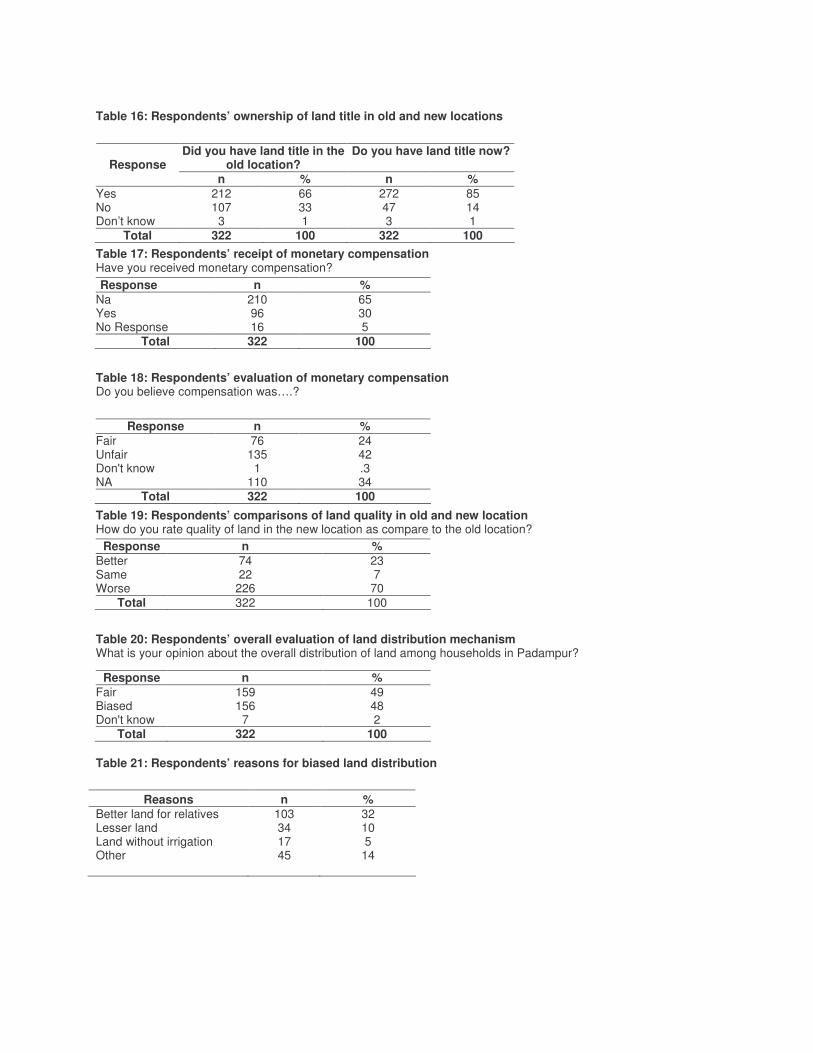
Table 16: Respondents’ ownership of land title in old and new locations
Table 17: Respondents’ receipt of monetary compensation Have you received monetary compensation?
Table 18: Respondents’ evaluation of monetary compensation Do you believe compensation was….?
Table 19: Respondents’ comparisons of land quality in old and new location How do you rate quality of land in the new location as compare to the old location?
Table 20: Respondents’ overall evaluation of land distribution mechanism What is your opinion about the overall distribution of land among households in Padampur?
Table 21: Respondents’ reasons for biased land distribution
Did you have land title in the old location?
Do you have land title now? Response
n % n % Yes 212 66 272 85 No 107 33 47 14 Don’t know 3 1 3 1
Total 322 100 322 100
Response n % Na 210 65 Yes 96 30 No Response 16 5
Total 322 100
Response n % Fair 76 24 Unfair 135 42 Don't know 1 .3 NA 110 34
Total 322 100
Response n % Better 74 23 Same 22 7 Worse 226 70
Total 322 100
Response n % Fair 159 49 Biased 156 48 Don't know 7 2
Total 322 100
Reasons n % Better land for relatives 103 32 Lesser land 34 10 Land without irrigation 17 5 Other 45 14

Table 22: Ownership of land title among Tharu respondents Did you have land title
in the old location? (A)
Do you have land title now?
(B) Response n % n %
Yes 83 73 102 90 No 31 27 12 10 Don’t know 0 0 3 1
Total 114 100 114 100 2. Employment
Table 23: Respondents’ evaluation of their economic status in old and new location How do you compare your economic status in the new place as compared to the old place?
Response n % Better 90 28 Same 78 24 Worse 154 48
Total 322 100 Table 24: Respondents’ evaluation of changing job Are their any changes in your job since coming to the new location?
Response n % Yes 198 61 No 119 37 Don’t know 5 2
Total 322 100 Table 25: Respondents’ reason for change in employment
Reasons n % Closer to Market 135 42 More mobile 145 45 Transportation & Road network 221 69 Easier to find work 48 15 Others 26 8 Table 26: Respondents’ comparison of employment opportunities How do you compare your satisfaction with the employment opportunities in the new location vs. old location?
Response n % Cum. % Satisfied 180 56 56 Indifference 81 25 81 Not Satisfied 58 18 99 Don't know 3 1 100
Total 322 100 Table 27: Respondents’ reasons for satisfaction and dissatisfaction
Available
% Not Available
% NA %
Outside work 101 31 65 31 156 48 Skill Learning Opportunities
104 32 14 4 204 64
Access to Job Advertisement
61 19 6 2 255 79
Others 26 8 0 0 296 92

Table 28: Comparative cultivated land, production, and market value for respondent households
Old Location New Location
Types of Crops
Cultivated Area in Bigha*
Amount Produced in Quintel
Market Value in NRs
‘000
Cultivated Area in Bigha
Amount Produced in Quintel
Market Value in NRs ‘000**
Rice 109 9171 6641 58 981 659 Maize 50 829 455 113 2521 2412 Mustard 49 893 534 108 2613 1861 Wheat 60 927 559 6 140 17 Lentil 25 490 513 70 1576 743 Vegetables 7 224 150 76 78 16 Total 300 12534 8852 431 7909 5708 * 1 biga (20 kattha) = 1.67 acre ** 1 US $ = 70.00 NRs. Table 29: Respondents’ household yearly income from off-farm job
Person Involved in job Old Padampur (n=2131)
New Padampur (n=2131)
Father 47 64 Mother 2 2 Son 35 119 Others 3 8
Total 87 193 Total Earning in NRs. 9330000 3148600
Table 30: Respondents’ involvement in small scale industries Have you operated any small scale enterprise?
Response n % Yes 23 9 No 236 91 Total 259 100 Missing 63 Total 322 100 3. Housing Table 31: Respondents’ compassion of housing in old vs. new location How is your house construction? in the new location, compared to the old location?
Response n % Better 213 66 Same 101 31 worse 8 3
Total 322 100 Table 32: Respondents’ comparative evaluation of housing structures, building materials, water, and energy sources in old vs. new location How do you compare the structure and materials for your house in the new place compared to the old place?
Roof Wall No. of Rooms Electricity Drinking Water Response n % n % n % n % n %
Better 222 72 164 51 132 41 183 57 118 37 Same 87 27 145 45 172 53 62 19 34 11 worse 3 .9 5 2 7 3 59 18 148 46 No Response 0 0 8 2 11 3 18 6 22 7
Total 322 100 322 100 322 100 322 100 322 100

Table 33: Respondents’ comparison of their physical wealth in old vs. new Old Padampur New Padampur Physical Wealth
n % n % Bicycle 241 75 284 88 Radio 236 73 258 80 TV 17 5 109 34 Rice Cooker 2 1 12 4 Pressure cooker 40 12 69 21 Bio-Gas 1 0 24 8 LPG Gas 2 1 25 8 Tractor 8 3 14 4 Motorcycle 5 2 13 4 Bullock Cart 100 31 9 3 VCR and CD Player 13 4 37 12 Buses 0 0 2 1 4. Marginalization Table 34: Respondents’ evaluation of differential impacts on particular groups of people Is there any group of people more affected than others?
Response n=322 % Yes 220 69 No 98 31
Total 318 100 Table 35: Respondents’ evaluation of affected people If yes, who are they and how do they affected?
Effected Group
n=322 % Water Shortage
Short of forest
products
Others
Tharu 203 63 191 11 1 Bote 135 42 133 2 0 Mushar 7 2 4 3 0 Chepang 110 34 106 2 2 Table 36: Respondents’ opinions of sustainability of support services How optimistic are you that these support services will remains for a long period of time?
Response n % Highly optimistic 60 19 Optimistic 236 73 Not optimistic at all 22 7 Don't know 4 1
Total 322 100 Table 37: Respondents’ reasons for optimism and pessimism
Response n=322 % Sustainable Programs 63 20 More Accessible 175 54 Political Un-certainty 20 6

5. Food Management
Table 38: Respondents’ comparison of child nutrition in new vs. old location How do you compare your children’s nutrition in the new place than to the old place?
Response n % Better 138 43 Same 97 30 Worse 87 27 Total 322 100 Table 39: Respondents’ evaluation of land allocation for adequate food production Does the current land allocation allowed you to produce enough food to feed your entire family?
Response n % Yes 85 26 No 237 74
Total 322 100 Table 40: Respondents’ ability to sell surplus production If yes, do you sale surplus food?
Table 41: Respondents’ reasons for fulfilling food deficit How do you fulfill your food deficit? Response n % Buy 104 32 Borrowed 35 11 Others 98 31 NA 85 26 Total 322 100 6. Health Facilities Table 42: Respondents’ comparison of the health situation in old vs. new location How do you compare the condition of the health for children and elderly in the old and new location?
Response n % Much better 251 78 Same 51 16 worse 16 5 Don't Know 4 1
Total 322 100 Table 43: Respondents’ evaluation of range of health services in new location
Immediate medical services
Quick emergency
services
Access to children
immunization
Response n % n % n %
Yes 293 91 294 91 298 92 No 26 8 28 9 22 7 Don’t know 3 1 0 0 2 1
Total 322 100 322 100 322 100
Do you sell surplus food? Response n %
Yes 6 2 No 79 98 Don’t know 0 0
Total 85 100

Table 44: Respondents’ assessment of availability of sanitation facilities in new location Facilities n=322 %
Temporary toilet 103 34 Permanent toilet 87 28 Tap water 47 15 Tube well 8 3 Roar pump 2 1 Rubbish pit 22 7 Compost pit 34 11 Others 4 1
Total 307 100 Table 45: Respondents’ evaluation of women related health services Do you find it easy to get services particularly for women for their pre and post natal care?
Response n % Yes 294 91 No 28 9
Total 322 100 7. Common Property Resources Table 46: Area of land allocation for common properties in new Padampur Common Property Bigha Acre % Village Roads 134 224 45 Government offices, schools and religious sites
11 18 4
Rivers and Drainage 59 99 20 Community Forest 96 160 31 Total 300 501 100 Table 47: Respondents’ comparison of physical infrastructures in old vs. new location What is your general evaluation of the infrastructure in the old and the new location?
Physical infrastructure in the new place
Physical infrastructure in the old place
Response
n % n % Very Good 233 73 16 5 Satisfactory 75 23 41 13 Poor 14 4 265 82
Total 322 100 322 100 Table 48: Respondents’ evaluation of compensation, planning, operation and sustainability of physical infrastructure in new Padampur
Were All PP Compensated?
Are you satisfied with the local inf.
Planning?
Are All inf. are in operation?
Is there enough land set aside for
future use?
Response
n % n % n % n % Yes 295 92 289 90 274 85 227 70 No 18 6 29 9 31 10 63 20 don't know 9 2 4 1 16 5 32 10
Total 322 100 322 100 322 100 322 100 8. Social Ties Table 49: Respondents’ view of neighbours in the new Padampur Do you have the Same Neighbors that you had in the past location?
Response n % Yes 120 37 No 202 63
Total 322 100
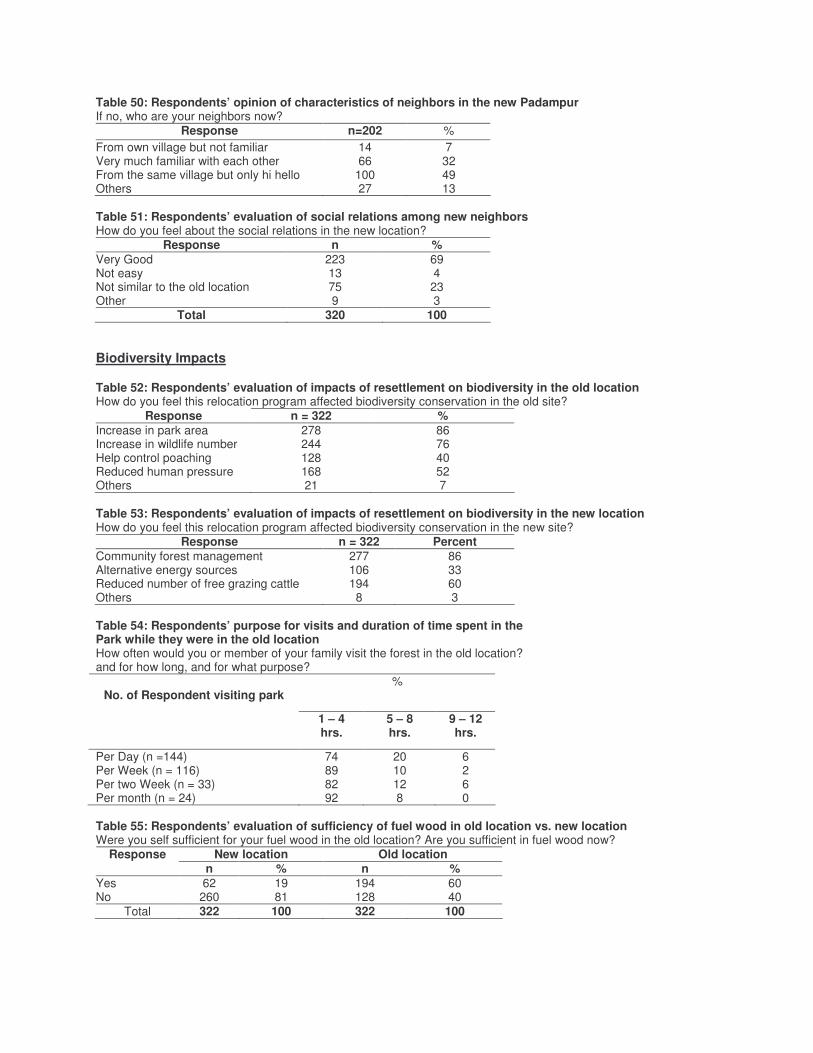
Table 50: Respondents’ opinion of characteristics of neighbors in the new Padampur If no, who are your neighbors now?
Response n=202 % From own village but not familiar 14 7 Very much familiar with each other 66 32 From the same village but only hi hello 100 49 Others 27 13 Table 51: Respondents’ evaluation of social relations among new neighbors How do you feel about the social relations in the new location?
Response n % Very Good 223 69 Not easy 13 4 Not similar to the old location 75 23 Other 9 3
Total 320 100 Biodiversity Impacts
Table 52: Respondents’ evaluation of impacts of resettlement on biodiversity in the old location How do you feel this relocation program affected biodiversity conservation in the old site?
Response n = 322 % Increase in park area 278 86 Increase in wildlife number 244 76 Help control poaching 128 40 Reduced human pressure 168 52 Others 21 7 Table 53: Respondents’ evaluation of impacts of resettlement on biodiversity in the new location How do you feel this relocation program affected biodiversity conservation in the new site?
Response n = 322 Percent Community forest management 277 86 Alternative energy sources 106 33 Reduced number of free grazing cattle 194 60 Others 8 3 Table 54: Respondents’ purpose for visits and duration of time spent in the Park while they were in the old location How often would you or member of your family visit the forest in the old location? and for how long, and for what purpose?
% No. of Respondent visiting park
1 – 4 hrs.
5 – 8 hrs.
9 – 12 hrs.
Per Day (n =144) 74 20 6 Per Week (n = 116) 89 10 2 Per two Week (n = 33) 82 12 6 Per month (n = 24) 92 8 0 Table 55: Respondents’ evaluation of sufficiency of fuel wood in old location vs. new location Were you self sufficient for your fuel wood in the old location? Are you sufficient in fuel wood now?
New location Old location Response n % n %
Yes 62 19 194 60 No 260 81 128 40
Total 322 100 322 100

Table 56. Respondents’ sources of timber in the old location How did you get timber in old location?
Response n % From neighbor 4 1 From forest 277 86 From market 5 2 Others 29 9 Don't know 7 2
Total 322 100 Table 57: Respondents’ comparison of consumption of forest products in old location vs. new location In general, has your consumption of the following items increase or decreased or stayed the same from the old location to the new location?
Table 58: Respondents’ evaluation of negative aspects of wildlife in the old location What are the negative aspects of wildlife in the old location?
Crop depredation Livestock depredation Human Injury and kill n =322 % n = 322 % n = 322 %
Response
314 97 232 72 253 79 Table 59: Respondents’ evaluation of positive aspects of wildlife in the old location What are the Positive aspects of wildlife in the old location?
Ecotourism Revenue Sharing Others Response n =322 % n =322 % n =322 %
Positive 214 66 145 45 25 8 Table 60: Respondents’ evaluation of positive aspects of wildlife in the new location What are the Positive aspects of wildlife in the new location?
Good to see Better ecosystem National wealth Ecotourism Response n =322 % n =322 % n =322 % n =322 %
Positive 267 83 185 57 202 63 116 36 Table 61: Respondents’ perception of effects of resettlement in the Barandhabar Forest Corridor How the resettlement project affect the forest corridor?
Responses n=322 % Increased human pressure 209 65 Increased livestock pressure 53 17 Increased transportation 68 22 Increased pollution 55 17 Decreased in width of corridor 177 55
Fuel wood Fodder Construction Materials
Medicinal Plants
Forest Fiber Response
n % n % n % n % n % Increased 7 2 9 3 65 20 9 3 9 3 Decreased 270 84 284 88 222 69 249 77 258 80 Same 41 13 23 7 23 7 21 7 11 3 Total 318 99 316 98 310 96 279 87 278 86 Missing System 4 1 6 2 12 4 43 13 44 14
Total 322 100 322 100 322 100 322 100 322 100

Summary Tables Table 62: Summary of respondents’ evaluation of well being characteristics in new Padampur: Yes / no indicators questions.
Wellbeing Characteristics Questions Yes / No indicators Land Tenure: YES NO DK Did you have land title in the old location? (n=322) 66% (212) 33% (107) 1% (3) Do you have land title now? (n=322) 85% (272) 14% (47) 1% (3) Did you receive financial compensation of your land? (n=112) 86% (96) 0 14%(16) Employment:
Are there any changes in your job since coming to the new location? (n=322) 61% (198) 37% (119) 2% (5) Are you operating any Small Scale Enterprise? (n=259) 9% (23) 91% (236) 0 Marginalization:
Do you think there are any groups of people who are more affected by the re-location program than others? n=(318)
69% (220) 31% (98) 0
Food Management:
Does the current land allocation allow you to produce enough food to feed your entire family? n=(322)
26% (85) 74% (237) 0
If yes, do you sell surplus food? (n=85) 7% (6) 53%(79) 0 Health Facilities:
Do you find it easy to get immediate medical services in the new location? (n=322) 91% (293) 8% (26) 1% (3) Do you have easy access to child immunization? (n=320) 92% (298) 7% (22) 0 Do you have easy access to pre and post natal care? (n=322) 91% (294) 9% (28) 0 Common Property Resources:
Were all common properties in the old location, compensated in the new location? (n=322)
92% (295) 6% (18) 2% (9)
Are you satisfied with the government plan for infrastructures in the new location? (n=322)
90% (289) 9% (29) 1% (4)
Are all built infrastructures are in operation? (n= 322) 85% (274) 10% (32) 5% (15) Social Ties:
Do you have the same neighbors that you had in the old location? (n=322) 37% (120) 63% (202) 0

Table 63: Summary of respondents’ comparisons of wellbeing characteristics in old vs. new Padampur: Scale indicator questions.
Wellbeing Characteristics Comparison Questions Scale indicators Land Tenure: Better Same Worse How do you rate the quality of land in the new location as compare to the old location? (n=322)
23% (74) 7% (22) 70% (226)
Employment:
How do you compare your economic status in the new place as compared to the old place? (n=322)
28% (90) 24% (78) 48% (154)
Satisfied Same Not satisfied How do you compare your satisfaction with the employment opportunities new vs. old? (n=322)
56% (180) 25% (81) 18% (58)
Housing:
Better Same Worse
How is your house construction in the new location, compared to the old location? (n=322)
66% (213) 31% (101) 3% (8)
Food Management:
Better
Same
Worse
How do you compare your children’s nutrition in the new place to the old place? (n=322)
43% (138) 30% (97) 27% (87)
Sufficient Not sufficient Do produce sufficient food from current land holding? (n=322) 26% (85) 74% (237) Health Facilities:
Much better Same Worse
How do you compare the condition of health for children and elderly in the old and new location? (n=322)
78% (251) 16% (51) 5% (16)
Common Property Resources
Good
Satisfactory
Poor
What is your general evaluation of the infrastructure in the new location? (n=322) 30% (96) 66% (212) 4% (14) How were the infrastructures (road, school, electricity and water) in the old (site? n=322)
5% (16) 13% (41) 82% (265)
Social Ties:
Very Good Not Easy Others
How is your social relation with new neighbors in the new location? (n=322) 69% (223) 27% (88) 4% (11)

Appendices

Appendix I: Questionnaire for Focus Group
Padampur: The Social, Economic and Biodiversity Assessment of a Citizen Initiated Resettlement
Project
1. Please tell us your name and address?
2. How long have you been resident of Padampur VDC?
3. What is your impression about the recent resettlement program?
4. What are the benefits of the resettlement program, those you have observed during the
Padampur resettlement?
5. What were the challenges during the relocation program those the people faced?
6. How has people’s well-being been in the new location? In terms of:
a. Land distribution
b. Housing security
c. Employment and other economic opportunities
d. Public infrastructures and local services
e. Social and educational facilities
f. Others if there is any
7. What are the benefits of this relocation program you have seen in biodiversity conservation?
8. If you had a chance to give an advice to other people living similar to your past condition, would
you recommend a resettlement program? If so what advice would you give, please list? If not
why?
9. What are the most important things you think should be considered in planning and implementing
future relocation program, if there is going to be one?
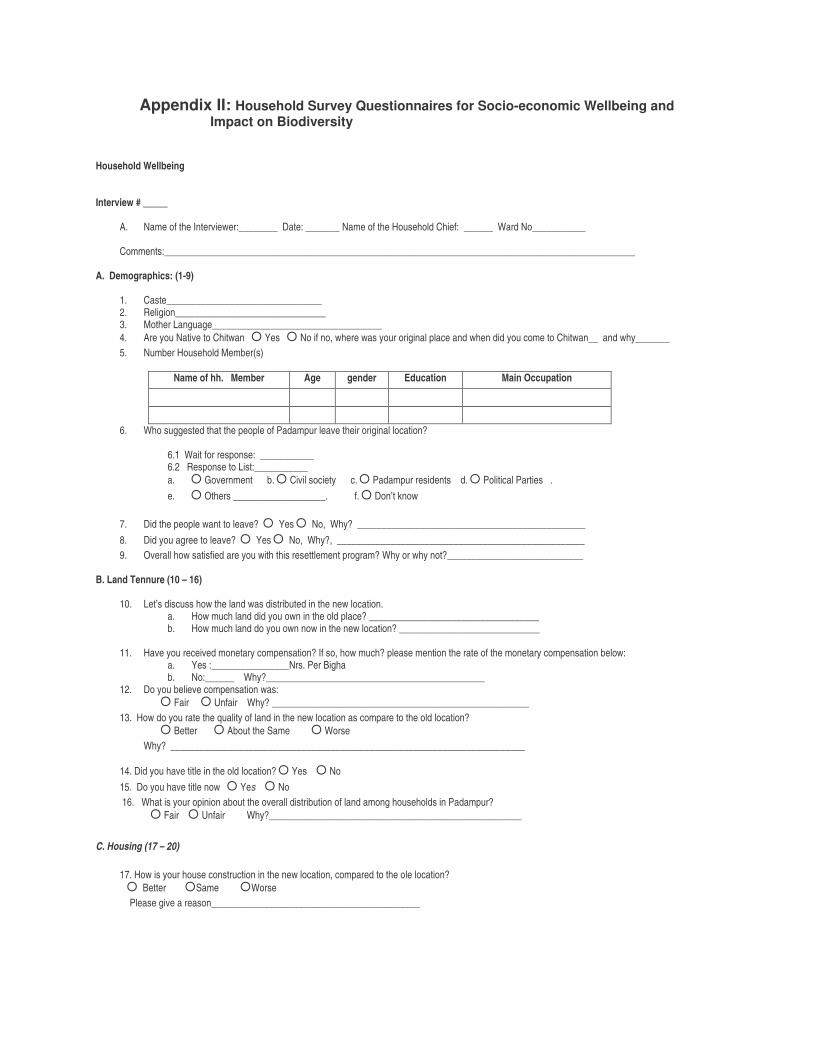
Appendix II: Household Survey Questionnaires for Socio-economic Wellbeing and Impact on Biodiversity Household Wellbeing Interview # _____
A. Name of the Interviewer:________ Date: _______ Name of the Household Chief: ______ Ward No___________ Comments:_________________________________________________________________________________________________
A. Demographics: (1-9)
1. Caste________________________________ 2. Religion_______________________________ 3. Mother Language___________________________________ 4. Are you Native to Chitwan � Yes � No if no, where was your original place and when did you come to Chitwan__ and why_______ 5. Number Household Member(s)
Name of hh. Member Age gender Education Main Occupation
6. Who suggested that the people of Padampur leave their original location?
6.1 Wait for response: ___________ 6.2 Response to List:___________ a. � Government b. � Civil society c. � Padampur residents d. � Political Parties . e. � Others ___________________. f. � Don’t know
7. Did the people want to leave? � Yes � No, Why? _______________________________________________ 8. Did you agree to leave? � Yes � No, Why?, ___________________________________________________ 9. Overall how satisfied are you with this resettlement program? Why or why not?____________________________
B. Land Tennure (10 – 16)
10. Let’s discuss how the land was distributed in the new location. a. How much land did you own in the old place? ___________________________________ b. How much land do you own now in the new location? _____________________________
11. Have you received monetary compensation? If so, how much? please mention the rate of the monetary compensation below:
a. Yes :________________Nrs. Per Bigha b. No:______ Why?_____________________________________________
12. Do you believe compensation was: � Fair � Unfair Why? _____________________________________________________ 13. How do you rate the quality of land in the new location as compare to the old location? � Better � About the Same � Worse
Why? _________________________________________________________________________ 14. Did you have title in the old location? � Yes � No 15. Do you have title now � Yes � No 16. What is your opinion about the overall distribution of land among households in Padampur?
� Fair � Unfair Why?____________________________________________________
C. Housing (17 – 20)
17. How is your house construction in the new location, compared to the ole location? � Better �Same �Worse Please give a reason___________________________________________

18. How do you compare the structure and materials of your house in the new place compared to the old place?
Description Better About the same
Worse Why? Please give a reason
Roof Walls No. of rooms Electricity Drinking Water
19. How do you compare your economic status in the new place as compared to the old place? In accordance with following order � Better � About the same � Worse
20. Please say if you had/have following items in your household
Old location: TV color / B& W, Bicycle Radio, pressure cooker, biogas, tractor, motorcycle, bullock cart, trucks, buses, radio/cassette
New location: TV color / B& W, Bicycle Radio, pressure cooker, biogas, tractor, motorcycle, bullock cart, trucks, buses, radio/cassette
D. Food Management (21 – 24)
21. How do you compare your children’s nutrition in the new place to the old place.
� Better � About the Same � Worse Why?_______________________________________________
22. Does the current land allocation allow you to produce enough food to feed your entire family? � Yes � No, if no go to 23 a. If yes, do you have surplus food and what do you do with it:
� sale_____________NRs/ year � save for future � barter within village � other___________________________
23. How do you fulfill your food deficit?_____________________________________________________________________ 24. Are your earnings enough to buy the extra food you need to feed your family? � Yes � No if no, how do you fulfill your food deficit?_________________________________________________________________________________________
E. Employment (25 – 33) 25. Are there any changes in your job since coming to the new location? �Yes �No If yes, give reason why these changes occurred? ___________________________________________________________
26. How do you compare your satisfaction with the employment opportunities? � Satisfied � About the same � Not satisfied Why? Please give reason in any category chosen _______________________________________________________ 27. How much land did you cultivate in old Padampur and how much now and what do you produce in one year from your land. Old New
Owned # biga___________ ___________ Rented # biga____________ ____________
Crop Old Padampur New Padampur
Area Quintal Price Area Quintal Price

28. What are off-farm employment activities you or your family members are involved with and corresponding earnings per year?
Old Location New Location
Who Type of Job Yearly Income
Who Type of Job Yearly Income
29. Are you operating any Small Scale Enterprise (SME) � Yes � No if yes? Please list:
Type of SME Description Last Year’s Income
30. Did any one from your household or yourself obtained loans from the bank or cooperatives etc. in Old Padampur If yes, for what purpose? __________for whom_____________________________
31. Have you taken out any loan since you arrived in New location? If yes, what is the purpose__________________________
32. What is your last year’s income and saving if you have any? (2004)
Last year’s income from Last Years Saving from Where do you save
33. What are the current problems related to finding jobs? Please prioritize them and what are you doing to solve these problems
F. Common Property Resources (34 - 40)
34. What is your general evaluation of the infrastructure in the new location?
� Good �Fair �Poor 35. How were the infrastructures (road, school, electricity and water) in the old site?
� Good �Fair �Poor 36. Were all common properties in the old location, compensated in the new location? � Yes � NO if no, Why?
______________________________________________________________________________________________ 37. Are you satisfied with the government plan for infrastructure (road, schools, health posts, community centers etc) in the new location?
� Yes � NO Why? Give reason__________________________________ 38. Are all physical facilities (those constructed) are functioning? � Yes � No if no, Why?_____________________________ 39. Is there enough community land set aside for future community use � Yes � NO if yes, what are they, please list________
_____________________________________________________________________________________________________ if no, please give reasons_________________________________________________________________________________ 40. Will the existing physical infrastructures adequately serve the growing need of the people? � Yes � NO if no,
Why________________________________________________________________________________________________
G: Health Facility (41 – 47)
41. How do you compare the condition of health for children and elderly in the old and new location? � Much better � About the same � Worse
42. Do you find easy to get immediate medical facilities in the new location? �Yes � No 43. Do you find it easy to immunize your children in the new location � Yes � No if no, why please
give_________________________________________________________________________________________________ 44. Do you find it easy to get to the nearest health post, if there is an emergency? � Yes � No if no, why please give
reason____________________________________________________________________________________________
Problems Prioritize What are you doing to solve these problems

45. Do you find it easy to get services particularly for women for their pre and post natal care? � Yes � No if no, why please give reason________________________________________________________________________________________________
46. Do you find it easy to get family planning services in the new location? � Yes � No if no, why please give reason________________________________________________________________________________________________
47. In your house do you have: a. � pit toilets or � permanent toilet b. � Tap drinking water or � Tub-well or � Rower pump c. � Rubbish pit or � Compost pit d. � Others if any_____________
H. Social Ties (48 – 52)
48. How do you feel about the social relations in the New Location? ___________________________________________________________________________________________________ 49. Do you have the same neighbors that you had in the old location? � Yes � No if no, who are your neighbors? Now _______________________________________________________________________________________________________ 50. Do you feel you have the same cooperation from your neighbors as you had in the past location � Yes �No if no, why
__________________________________________________________________________________________________ 51. What special events, did you participate in old location? Please list:
_____________________________________________________________________________________________________ 52. What special events have you participated since your arrival? Please list:
____________________________________________________________________________________________________ I. Marginalization (53 – 58)
53. Is there a difference in support services in the new location as compared to the old location? � More support services � About the same � Few support services Why? Please explain any category selected_________________________________________________________ 54. How optimistic are you that these support services will remains for a long period of time? � Highly optimistic � Optimistic � not optimistic Please explain why in any category selected______________________________________
55. Are there NGOs & INGOs programs complementing government efforts? � Yes � No if yes please list NGOs and their function:
NGOs Functions _____________________________ ________________________________ _____________________________ _________________________________
56. Do you think there are any groups of people who are more affected by the re-location program than others? � Yes � No, who are they and how are they affected? Group How ___________________ ________________________________________________________________ ___________________ ________________________________________________________________
57. Do you observe any loss of cultural traits of any particular group in the new location?
���� Yes � No if yes, please explain _________________________________________________________
58. Overall how has the impact of moving to the new location been for the well being of you and your family?
� Good � No impact � Bad Impacts on Biodiversity (59–75) This particular section deals with impact on natural resources in old and new location. The impact is basically from the human induced activities of grazing, fuel wood collection and consumption of other forest resources by the people for various purposes.
59. How do you feel this relocation program affected in conserving biodiversity in the old site? ________________________________________________________ 60. How do you feel this relocation program affected in conserving biodiversity in the new site?

___________________________________________________________________________________________ 61. How often would you or member of your family visit the forest in the old location, for how long, and for what purpose please mention below:
For how long? what purpose?
_____________________ ________________________________________________________________________
62. Let’s talk about livestock in the old and new location:
63. Were you self sufficient for your fuel wood in the old location? � Yes � No if No, then how did you fulfill your fuel wood requirement______________________________________________________________________________________________
64. Are you self sufficient for fuel wood now? � Yes � No if no, then how do you fulfill your requirements______________________ 65. How did you gather / get construction materials in the old location___________________________________________________ 66. In general, has your consumption of the following items increased or decreased or stayed the same from the old location to the new location?
Items Increased Decreased Stayed the Same Why? Fuel wood
Fodder
Construction Materials
Medicinal herbs
Plant fibers
Other’s …………if any
67. Let’s talk about wildlife now: What were the positive and negative aspects of wildlife in the old location for Padampur residents Positive:_________________________________________ Negative:_________________________________________
68. How often did you have household livestock and crop depredation from the Park’s wild animals in the old location?
69. What were the positive and negative aspects of wildlife in the new location for Padampur residents? Positive:_________________________________________ Negative:_________________________________________ 70. In the new location, how do you use the surrounding Barandhabhar forest? _________________________________________ ________________________________________________________________________________________________________ 71. What impact have you seen from the relocation in the Barandhabhar Corridor Forest? 72. How do you compare?:
a. The quality of air in the old versus the new location? � better � about the same � worse why?________________________________________________________________________________
b. The quality of water in the streams and rivers in the old and new location?
Old Padampur New Padampur Type of livestock #
Hybrid
# Loca
l
Months Free
Grazing
Months Stall Feed
Use of Livestock
# Hybrid
# Loca
l
Months Free
Grazing
Months Stall Feed
Use of Livestoc
k
Cow
Oxen
Buffalo
He buffalo
Goat
Sheep
Pig
Chicken
Ducks
Year Crop Depredation Livestock Depredation Human injury Human killed
Which Wild animal
Typical Loss
Yes/No
Name of Crops Total Loss in NRs. Which W/
animal
Name of Livestock
Total Loss in
NRs.

� better � about the same � worse, why?_______________________________________________
73. Are you a member of a Community Forest? � Yes � No if Yes, a. Please mentioned the name ____________________.__________of CF and how far it is located from your home _____Km. b. How often do you participate in forest conservation work of this Community Forest? � Once in a month � Quarterly � Semi annually � Other____________
74. How many times did you bring your livestock to the Vet. Center in 2004 ___________________ 75. How often have you seen the following wild animals in Barandabhar forest in past two years?
Wild Animals Frequent sightings Occasional sightings Rare sightings No sightings at all
Rhino
Tiger
Deer
Wild boar