assessment of modis ndvi time series data products for
TRANSCRIPT
Remote Sensing of Environment 115 (2011) 427–437
Contents lists available at ScienceDirect
Remote Sensing of Environment
j ourna l homepage: www.e lsev ie r.com/ locate / rse
Assessment of MODIS NDVI time series data products for detecting forest defoliationby gypsy moth outbreaks
Joseph P. Spruce a,⁎, Steven Sader b, Robert E. Ryan c, James Smoot a, Philip Kuper a, Kenton Ross d,Donald Prados e, Jeffrey Russell f, Gerald Gasser g, Rodney McKellip h, William Hargrove i
a Computer Sciences Corporation, John C. Stennis Space Center, Mississippi, formerly with Science Systems and Applications, Inc., John C. Stennis Space Center, Mississippi, United Statesb University of Maine, Orono, Maine, United Statesc Innovative Imaging & Research, John C. Stennis Space Center, Mississippi; formerly with Science Systems and Applications, Inc., John C. Stennis Space Center, Mississippi, United Statesd Science Systems and Applications, Inc., Lanham, Maryland, United Statese Diamond Data Systems; formerly with Computer Sciences Corporation, John C. Stennis Space Center, Mississippi, United Statesf Naval Research Laboratory, John C. Stennis Space Center, Mississippi, formerly with Computer Sciences Corporation, John C. Stennis Space Center, Mississippi, United Statesg Lockheed Martin Mission Services—Civil Programs, John C. Stennis Space Center, Mississippi, United Statesh National Aeronautics and Space Administration, John C. Stennis Space Center, Mississippi, United Statesi United States Forest Service, Eastern Forest Environmental Threat Assessment Center, Asheville, North Carolina, United States
⁎ Corresponding author.E-mail address: [email protected] (J.P. Spruc
0034-4257/$ – see front matter © 2010 Elsevier Inc. Aldoi:10.1016/j.rse.2010.09.013
a b s t r a c t
a r t i c l e i n f oArticle history:Received 1 July 2009Received in revised form 5 September 2010Accepted 18 September 2010
Keywords:MODIS NDVI time series dataGypsy mothRegional forest defoliation detection productsDefoliation classification accuracyNational forest threat early warning systemTemporal data processing
This paper discusses an assessment of Moderate Resolution Imaging Spectroradiometer (MODIS) time-seriesdata products for detecting forest defoliation from European gypsy moth (Lymantria dispar). This paperdescribes an effort to aid the United States Department of Agriculture (USDA) Forest Service in developing andassessing MODIS-based gypsy moth defoliation detection products and methods that could be applied in nearreal timewithout intensive field survey data collection as a precursor. In our study, MODIS data for 2000–2006were processed for the mid-Appalachian highland region of the United States. Gypsy moth defoliation mapsshowing defoliated forests versus non-defoliated areas were produced from temporally filtered andcomposited MOD02 and MOD13 data using unsupervised classification and image thresholding of maximumvalue normalized difference vegetation index (NDVI) datasets computed for the defoliation period (June 10–July 27) of 2001 and of the entire time series. These products were validated by comparing stratified randomsample locations to relevant Landsat and Advanced Spaceborne Thermal Emission and Reflection Radiometer(ASTER) reference data sets. Composites of 250m daily MOD02 outperformed 16-day MOD13 data in terms ofclassifying forest defoliation, showing a lower omission error rate (0.09 versus 0.56), a similar Kappa (0.67versus 0.79), a comparable commission error rate (0.22 versus 0.14), and higher overall classificationagreement (88 versus 79%). Results suggest that temporally processed MODIS time-series data can detectwith good agreement to available reference data the extent and location of historical regional gypsy mothdefoliation patches of 0.25 km2 or more for 250-meter products. The temporal processing techniques used inthis study enabled effective broad regional, “wall to wall” gypsy moth defoliation detection products for a6.2 million ha region that were not produced previously with either MODIS or other satellite data. This studyprovides new, previously unavailable information on the relative agreement of temporally processed, gypsymoth defoliation detection products from MODIS NDVI time series data with respect to higher spatialresolution Landsat and ASTER data. These results also provided needed timely information on the potential ofMODIS data for contributing near real time defoliation products to a USDA Forest Service Forest Threat EarlyWarning System.
e).
l rights reserved.
© 2010 Elsevier Inc. All rights reserved.
1. Introduction
The forests of the United States (U.S.) are currently subjected to avariety of biotic and abiotic threats that result in ephemeral and standreplacement disturbances involving millions of hectares. Native and
non-native insects and diseases collectively damage across the U.S.nearly 45 times more total area of forest than wildfires and cause atleast 5 times more economic impact (Dale et al., 2001). Exotic pestscaused annual economic losses in U.S. forest products estimated at2 billion dollars per year (Pimentel et al., 2000). Among these pests isthe European gypsy moth (Lymantria dispar), which recentlydefoliated in excess of 400,000 ha per year (USFS, 2009) across theEastern U.S. and is spreading south and west into other parts of thecountry (Tobin and Blackburn, 2007).

428 J.P. Spruce et al. / Remote Sensing of Environment 115 (2011) 427–437
The U.S. Healthy Forests Restoration Act (HFRA) of 2003 mandatesthat the Secretary of Agriculture develop a national Early WarningSystem (EWS) for early detection, monitoring, andmitigation of foresthealth threats (Bosworth, 2006). In response to the HFRA, the UnitedStates Department of Agriculture U.S. Forest Service (USFS) hasestablished Eastern andWestern Regional Threat Assessment Centers.These forest threat centers have been tasked to develop anoperational EWS, which will include integrated geospatial data tocharacterize and track forest environmental threats at multiple scales(USFS, 2004, 2005; Hargrove et al., 2009). This EWS will considerthreats from native and exotic forest-damaging insect and diseases. Itwill also regard abiotic threats such as damage from hurricanes andice storms. One goal of this USFS EWS is to detect, map, and monitorforest defoliation and other disturbances at broad regional tocontinental scales. Since 2005, The National Aeronautics and SpaceAdministration (NASA) at Stennis Space Center (SSC) and Oak RidgeNational Laboratories have been assisting the USFS threat centers toevaluate and integrateMODIS (Moderate Resolution Imaging Spectro-radiometer) time series data products for inclusion into the EWS,particularly in detecting forest disturbance (e.g., defoliation) fromexotic insects, such as the gypsy moth (Spruce et al., 2007; Hargroveet al., 2009).
This EWSwill regard two required scales of forest monitoring: 1) astrategic, national level satellite-based scale of monitoring to identifyapparent locations of disturbances where threats are suspected (i.e.,early warning), and 2) a finer-scale, local (e.g., states, counties, andsmaller regions) tactical tier consisting of airborne overflights and on-the-ground monitoring to assess the validity and nature of warningsfrom the upper tier (Hargrove et al., 2009). The tactical tier is largelyalready in place within the Forest Service and its State collaborators,consisting of Aerial Detection Surveys (ADS) of forest disturbances(sketchmapping from aircraft), ground surveys, and insect trappingprograms (Ellenwood, 2006; Hargrove et al., 2009). Below is adescription of aerial sketch mapping surveys, including the advan-tages and limitations, followed by a discussion of the connection andcomplementary relationship of aerial sketch mapping and MODIS-based forest monitoring in the implementation of a national forestthreat EWS.
The ADS aerial sketchmapping surveys provide an importantmeans for gathering geospatial information at regional to nationalscales on the general location and severity of forest disturbancesduring a given growing season (McConnell et al., 2000; Johnson andWittwer, 2008). For gypsy moth defoliation, these surveys result inmaps depict detected defoliated areas in terms of 2 severity classes:moderate (30–50% defoliation) and heavy defoliation (N50% defoli-ation) at a 2 km resolution (USFS, 2007). In sketchmapping forestdisturbances, as the airplane traverses an area of interest, an analystinteractively screen digitizes the outlines of apparent forest change ordefoliation boundaries onto Global Positioning System-synchronizedgeographic information system (GIS) map displays of the overflownareas (Schrader-Patton, 2003).
Although aerial sketch mapping of forest defoliation and mortalityevents is an important facet of the current forest threat monitoringcapability of the USFS, the system has some limitations. These effortstend to be expensive and labor-intensive, can be dangerous, can alsobe affected by persistent cloud cover, and may not provide completebroad-area coverage (de Beurs and Townsend, 2008; Hargrove et al.,2009). Aerial sketch maps of forest defoliation andmortality give onlyapproximate location and are often not accurately georeferenced,which complicates map overlay and GIS analysis (Ciesla, 2000; USFS,2007). They frequently overestimate the extent of change within adelineated polygon (Hall et al., 2006; Johnson and Ross, 2008) and canalso omit spotty or scattered defoliation areas (Johnson and Ross,2008). Such surveys can also omit extensively defoliated forests, dueto monetary constraints and bad weather. Such surveys are oftenproduced without formal, broad area accuracy assessment. Johnson
and Ross (2008) recently assessed the accuracy of ADS sketch maps ofinsect-induced mortality in a Western US region, comparing ADSresults to field survey data. They concluded that the assessed ADSsketch maps of mortality were acceptable for coarse scaled analyses,but lacked spatial specificity for use in fine-scaled applications.
Nonetheless, ADS products are valuable as preliminary reconnais-sance tools in forest health monitoring and can be thought of as aninitial stage to a multi-phase sampling of forest health conditions(Johnson and Wittwer, 2008). ADS currently represents the onlymeans for collecting and summarizing forest defoliation andmortalitysurvey information at regional and continental United States (CONUS)scales. From 2002 through 2006, the ADS forest survey area averaged1,800,000 km2 across the US (Johnson and Wittwer, 2008).
MODIS-based forest disturbance detection products from thisnational EWS is not meant to replace ADS sketchmapping and mayactually be useful for complementing these activities (Hargrove et al.,2009). As part of the national EWS, aerial sketch mapping will be usedwith higher spatial resolution data sources (e.g., available satellite,aerial, and in-situ data) to help confirm, validate, and attribute causesof detected forest disturbances. Then, one important objective of thenational EWS will be to use coarser scaled regional products from thestrategic tier of the EWS to spatially focus the activities of the tacticaltier, thus making the two scales of observation (i.e. work activities)complementary and more effective (Hargrove et al., 2009). Inparticular, near real time MODIS defoliation products will focus aerialsketchmapping efforts on high probability disturbed forests to reduceaerial survey costs and increase efficiencies of the overall ADSmonitoring and evaluation capability (Hargrove et al., 2009).
Since the initial deployment of the MODIS sensor on the Terrasatellite in 2000, the USFS has increasingly used MODIS data for broadregional forest resource monitoring applications, gradually transition-ing from research to an operational basis, as with fire mapping(Quayle et al., 2003). The USFS has also been developing and assessingregional disturbance mapping products from MODIS data, althoughthese products are still considered to be experimental (Ellenwood,2006; Nielson et al., 2006).
Coarse resolution satellite data from sensors such as AdvancedVery High Resolution Radiometer (AVHRR) and SPOT VEGETATIONhave been used to monitor large regional insect-induced forestdisturbance (Kharuk et al., 2004; Breshears et al., 2005; Fraser et al.,2005; Potter et al., 2005); however, most of these studies wereconducted in coniferous forest settings and the 1–8 km resolution ofthese systems is considered too coarse for the national scale EWSdescribed by Hargrove et al. (2009). With all of the recent MODISproducts available in different formats and resolutions, it is importantto learn from previous research, which MODIS wavebands, vegetationindices, spatial resolutions (0.25 km, 0.50 km), radiometric calibra-tion methods, and temporally processed products (e.g., selectivesingle dates or temporally processed daily to 16 day composites) havebeen successful in detecting forest canopy disturbance at the regionalscale. For example, recent research in remote sensing changedetection of forest disturbance (Jin and Sader, 2005a; Hayes andCohen, 2007; Kharuk et al., 2007; de Beurs and Townsend, 2008;Hayes et al., 2008) and advances in time-series data processing (Chenet al., 2004; McKellip et al., 2005; Bradley et al., 2007; Lunetta et al.,2006) suggest that temporally processed vegetation indices, derivedfrommultitemporal MODIS data, can play a significant role in regionalforest disturbance monitoring and threat assessment applications.
Multispectral vegetation indices and transformations have beenused extensively as data inputs in forest change detection studies(Coppin and Bauer, 1996; Coppin et al., 2004). The normalizeddifference vegetation index (NDVI) contrasts the visible red and nearinfrared (NIR) spectral bands, which are available on most multi-spectral satellite systems. Other indices that incorporate data from theshortwave infrared (SWIR) waveband, including Tasseled CapWetness, have been applied in several studies with forest change

429J.P. Spruce et al. / Remote Sensing of Environment 115 (2011) 427–437
detection results equal to or exceeding those using NDVI (Cohen et al.,2002; Franklin et al., 2001; Jin and Sader, 2005b; Hayes and Cohen,2007; Hayes et al., 2008). de Beurs and Townsend (2008) assessedgypsy-moth-induced forest defoliation impacts using non-composit-ed daily data sets and temporal composites of MODIS vegetation indexproducts, computed from atmospherically corrected reflectancebands. These researchers concluded that MODIS data are useful formapping annual gypsy moth defoliation for patches greater than0.63 km2. They reported coefficient of determination (adjusted r2)values between MODIS (using 250-meter normalized differenceinfrared index (NDII) data sets, based on NIR and 2150 nm SWIRbands) and Landsat estimates of defoliated foliar biomass of 0.638 and0.769 for 2000 and 2001, respectively. Though nominally 250 m, thesebest apparent daily MODIS data products were in part based on 500-meter SWIR reflectance data. The daily products showed highercorrelations than the temporal composite products; but significantcloud coverage for the daily products precluded a wall-to-wall surveyof the defoliation extent in the study area.
Forest disturbance patterns from insect defoliation can range fromdispersed and spotty occurrences to extensive large patches. In manycases, as with gypsy moth defoliation, such disturbance tends to beephemeral with refoliation usually occurring subsequent to defolia-tion. This differs from the more severe stand replacement distur-bances such as forest harvesting and high burn intensity wildfires thatremoves all or a significant part of the canopy. A review of availableliterature indicated few studies of higher resolution MODIS productsfor mapping deciduous forest insect defoliation have been reported.Recent studies indicate that broad-area forest disturbance (fromforest harvest or clearing for agriculture) can be detected usingMODIS multispectral time series data with spatial resolutions of 250to 500 m. Although, these studies were focused on forest harvest orforest conversion to agriculture, they are still informative to theapplication of MODIS NDVI products and spatial resolutions forregional studies of insect-induced forest defoliation.
In a Northeast U.S. mixed forest environment of deciduoushardwood and coniferous species, Jin and Sader (2005a) reported that16-day composite 250-meter NDVI data from MOD13 productsachieved 69% detection agreement (with Landsat), while single-day250-meter NDVI data from MOD09 products achieved 76% detectionagreement when the disturbed patch size was greater than 20 ha. Thedetection agreement increased to approximately 90% for both datasources when the patch size exceeded 50 ha. The latter result indicatedthat selective single day products achieved better results for distur-bances within a detectable patch size, which agrees with findings bydeBeurs and Townsend (2008)mentioned previously. In another study,Hayes et al. (2008) tested the effect of MODIS product spatial resolution(0.25, 0.50, and 1 km) on forest disturbance detection and modelprediction for a tropical deciduous forest region in Guatemala. Theseauthors reported that the normalized difference moisture index (NDMIof the NIR and 1650 nm SWIR bands) calculated from half-kilometerMOD02 calibrated radiance datasets generally showed the bestrelationships in detecting forest harvest disturbance (tropical forestclearing as a precursor to agriculture) and the lowest model predictionerrors at individual study areas and time intervals.
In summary, all three studies (Jin and Sader, 2005a; de Beurs andTownsend, 2008; Hayes et al., 2008) reported better forest distur-bance detection results with selective single date MODIS compared to16 day composite NDVI products. The interpretation of this collectivefinding is that the 16 day composites, produced before the recentCollection 5 MODIS products and without additional advancedtemporal data processing, were noisy due to unmasked, residualcontamination from cloud and radiometric processing anomalies, thusreducing their disturbance detection accuracy compared to selective,non-composited single day products. However, the use of temporalcomposite products increases the odds of obtaining wall to wallcloud-free data products. With better temporal processing, it is
conceivable that the temporal composite product performance wouldhave improved for this forest disturbance detection application. Alsothese studies suggest that both the 250- and 500-meter resolutionMODIS data can be useful for monitoring forest disturbance when itoccurs as extensive, large patches. All of these studies were conductedwith the intent of monitoring forests on either an annual or eventbasis. None of these studies addressed the need for monitoring forestson a more frequent interval, as would be required for a forest threatearly warning system. The latter will require temporal compositing ofdaily data as opposed to single date data sets, due to frequent cloudcover of many forested areas in the U.S.
Validation of historical MODIS defoliation mapping products isoften hindered by the lack of contemporary ground reference data indesired locations over regional study areas. Multiple dates of groundreference data or high resolution aerial and satellite imagery (e.g.IKONOS and QuickBird data) are either not available or too expensiveto obtain. One alternative is to use low cost, regional mediumresolution imagery (e.g., Landsat, ASTER, or SPOT multispectral data)to support verification or assessment of MODIS-based defoliationdetection products.
A review of published research was conducted to determine thesuitability of medium resolution imagery as a reference source forcomparison of MODIS defoliation products. Earlier studies usingLandsat and SPOT imagery demonstrated successful applications indetecting deciduous broad-leaved forest defoliation.
For example, Williams and Nelson (1986) employed multitem-poral Landsat Multispectral Scanner (MSS) vegetation index (NIR/redband ratio) products to detect gypsy moth defoliation in Pennsylvaniaat an approximate overall accuracy of 90%. Ciesla et al. (1989)reported that 20-meter SPOT satellite false color composite imageryshowed moderate to heavy gypsy moth defoliation areas and yieldedan 86% agreement with comparable products from high-altitudeaerial photography. Muchoney and Haack (1994) reported gypsymoth defoliation products from SPOT imagery yielded a 69% overallagreement compared to USFS defoliation sketch maps, but theyacknowledged that the reference sketch mapping products alsocontained classification errors. Vogelmann (1990) compared LandsatThematic Mapper (TM) NDVI and SWIR/NIR ratio imagery on severalforest cover types subjected to biotic or abiotic forest damage. Heconcluded that 1) the SWIR/NIR ratio was superior in identifying lowversus high forest damage in areas with balsam fir mortality; 2) bothSWIR/NIR and NDVI distinguished between low and high damage onbroad-leaved forest sites; and 3) NDVI was superior in separatingmedium and low damage within deciduous forest.
Landsat as a reference source for validation of MODIS-based forestdefoliationmap products is subject to errors, but previous disturbancestudies have shown that Landsat has achieved reasonably goodaccuracy in detecting and mapping harvest disturbances anddisturbances caused by defoliating insects.
2. Objectives
MODIS data, available since 2000, provides a rich set of multi-bandreflectance and temperature data products available for use in theforest threat EWS being developed by the USFS Forest ThreatAssessment Centers. The study described herein assesses MODIStime-series vegetation index data products for their ability tocontribute broad, regional geospatial information on gypsy mothdefoliation of forest stands. One unique aspect of the methodology isthe development of temporally processed time series data to reducethe effect of cloud contamination and to allow a wall-to-wallassessment of defoliation in the study area. The use of temporalcompositing is a necessary facet of the EWS's requirement for wall towall cloud-free observational coverage, as discussed previously hereinand also by Hargrove et al. (2009). The EWS was also in need ofinformation on the ability of MODIS products to detect forest

430 J.P. Spruce et al. / Remote Sensing of Environment 115 (2011) 427–437
disturbance events across large regions, such as ephemeral forestdefoliation from gypsy moths.
In response, a study was conducted with the following objectives:1) assess agreement of historical, regional MODIS gypsy mothdefoliation products with available medium resolution Landsat andASTER reference data ; and 2) assess results of multiple MODIS NDVItime series defoliation detection products in regard to requirements fora national scale forest threat EWS, especially in regard to spatialresolution and compositing technique (compositing of daily datacompared to aggregate compositing of standard pre-existing 16 day
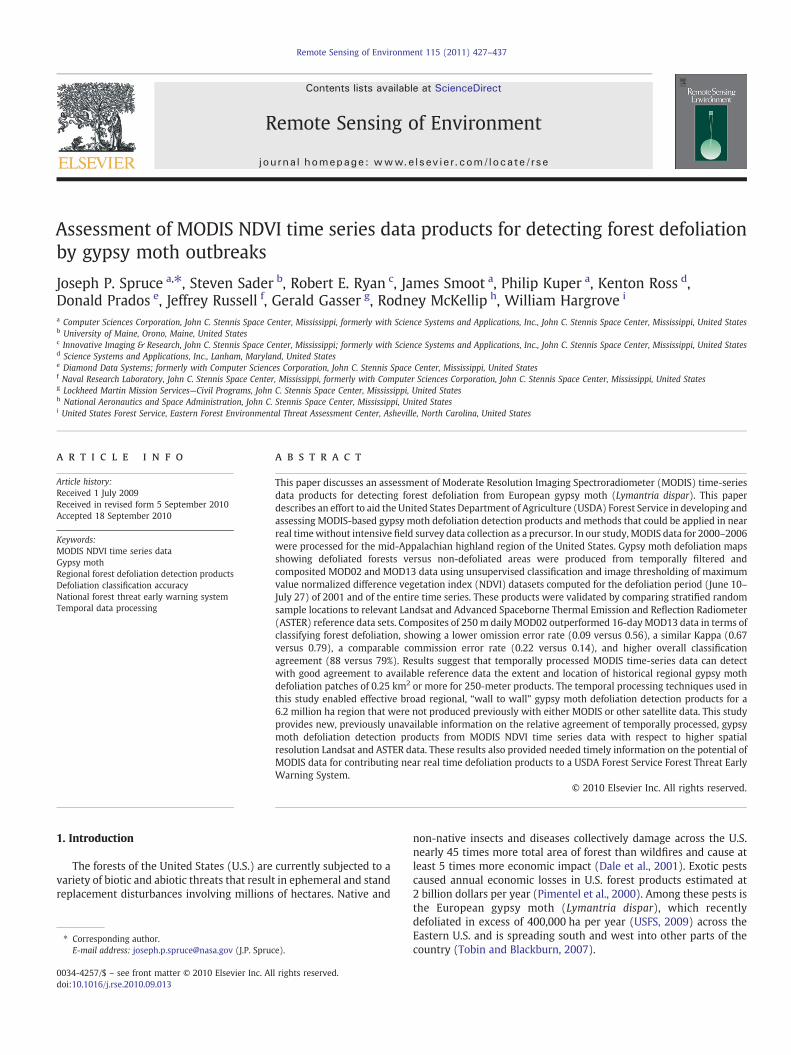
Fig. 1. Location of study area in the Eastern United States (study area extent is outlined in rRadar Mission). Ground elevations in the study area range from approximately 34 (dark bl
composite products) . Objective 2 was pursued in part to better assesstemporal compositing and spatial resolution processing needs of theEWS. The latter objectivewas addressed to assess if temporal processingof MODIS time series data at desirable spatial resolutions (e.g., 250–500 m)would enable useful regional-scale detections of insect-inducedforest defoliation.While the longer term goal was to develop a near realtimeMODIS-based regional forest disturbance detection capability, thisstudy was done using historical data. The latter enabled meaningfulcomparisons to higher spatial resolution reference data (primarilyLandsat and ASTER satellite data) to be employed.
3. Methods
3.1. Study area
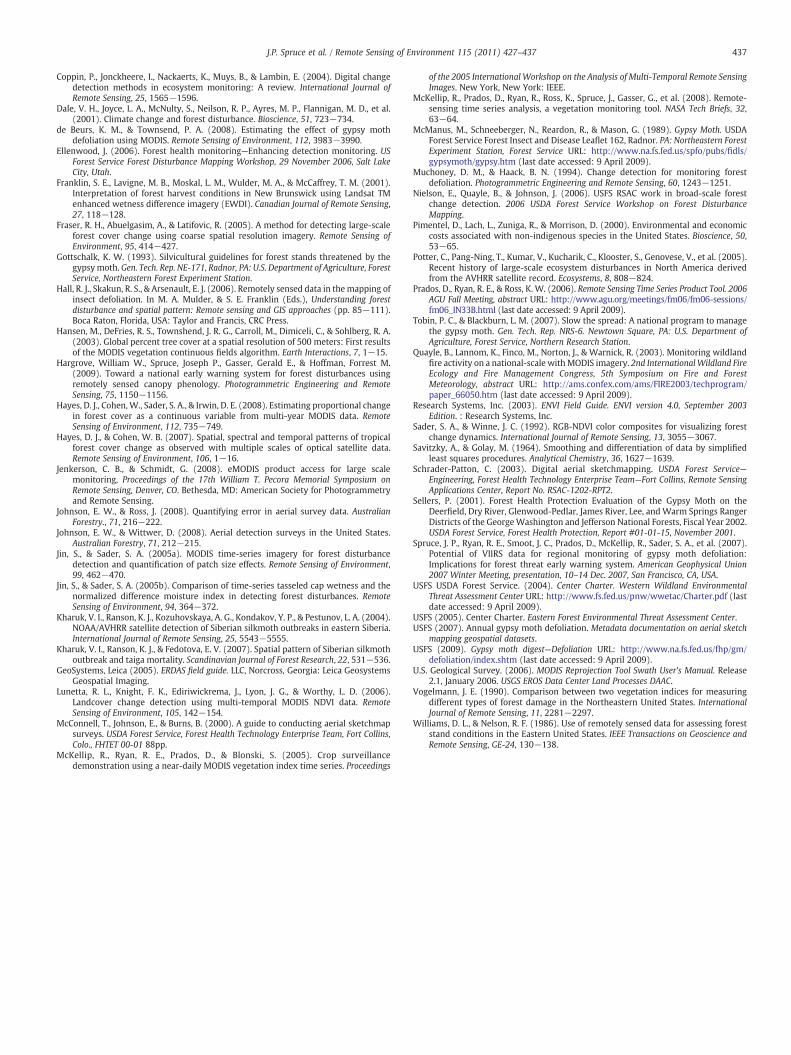
The mid-Appalachian highland region of the Eastern United States was selected for the study area because gypsy moth defoliation hadoccurred over multiple years during the MODIS operational period (Fig. 1). This area encompasses portions of 4 states (West Virginia, Virginia,Pennsylvania, and Maryland) and a total area of approximately 6.2 million ha. It is largely forested with broad-leaved, hardwood tree species,including an abundance of oak-dominated stands occurring along an extensive network of ridges. Many of the valleys in this region are inagricultural use among residential and small urban communities. During outbreak years, gypsy moth defoliation in this region tended to occurwithin the oak-dominated forests as large, extensive patches (Fig. 2).
3.2. Satellite data acquisition and preprocessing
Several MODIS Aqua and Terra multitemporal data products were acquired over the study area for all available dates during spring and summer2000 through 2006, including Collection 4MOD02 (single-day) andMOD13 (16-day) products. MOD03 andMOD35 products were also acquired tomask out cloud-covered and poor quality data. Additional high-resolution satellite images from Hyperion, Advanced Land Imager, Landsat TM andEnhanced ThematicMapper Plus (ETM+), andAdvanced Spaceborne Thermal Emission and Reflection Radiometer (ASTER)were acquired for use asreference data in the evaluation of the MODIS-based gypsy moth defoliation detection products.
3.3. Processing MODIS time series data
Cloud-free data is an important requirement for operationalmonitoringof forest disturbancewith electro-opticalmultispectral sensors.Obtainingoptimal single dates of cloud-free, area-wide coverage can bedifficult, especially in cloud-pronemountainous forests in the easternUnited States. The
ed and overlain onto a digital elevation product acquired from the Shuttle Topographyue grey tones) to 1483 m (yellow).

Fig. 2. Oblique view of gypsy moth defoliation. Photograph acquired by Mark Robinson, USDA Forest Service. Source: http://www.forestryimages.org/browse/detail.cfm?imgnum=2912081 (accessed March 31, 2009).
431J.P. Spruce et al. / Remote Sensing of Environment 115 (2011) 427–437
scarcity of cloud-free data on single dates may be mitigated when temporal composites of cloud-free data encompass the time during which treedamage symptoms are evident. In this study, analysts applied each MODIS time series data product as input into the MATLAB-based Time SeriesProduct Tool (TSPT) to generate cloud-free time-series datasets (McKellip et al., 2005; Prados et al., 2006; McKellip et al., 2008). The TSPT softwareidentifies and removes user-defined, suspectedpoor-quality data degraded by atmospheric contamination and poor viewing geometry. Replacementof the “contaminated” data was a necessary step in producing essentially cloud-free temporal image composites of the study area during the gypsymoth defoliation period for each year in the time series.
The procedure for generating the MOD02 NDVI time series in this study was initiated by inputting daily MODIS Terra MOD02 data files overthe entire 2000–2006 time frame into the TSPT. The TSPT initially called upon the MRTSwath (USGS, 2006) software to reproject the needed co-registered NIR and red reflectance data to the UTMmap projection. The NDVI was calculated from relevant NIR and red reflectance bands, cloudmasked with the MOD35 product, and further masked to exclude reflectance data collected with sensor zenith angles greater than 47°, and toeliminate aberrant spikes in NDVI (that were either much higher or lower than can be reasonably expected compared to adjacent NDVI values inthe time series). The data voids in the cleaned dataset were then subjected to temporal interpolation, followed by temporal filtering with theSavitzky–Golay algorithm (Savitzky and Golay, 1964). This algorithm includes parameter settings for 1) temporal frame size; 2) polynomialorder; and 3) Full Width Half Maximum (FWHM) in regard to the temporal distance from a given date. These settings were determined by trialand error and are somewhat dependent on the satellite data product and on scene-dependent parameters, such as cloud frequency. For example,in this study, the MOD02-based daily product generation uses a temporal frame size of 15 days, a polynomial order of 1, and an FWHM of 8 days.In some cases, the Savitzky–Golay filtering did not return an NDVI value because of clouds on several contiguous dates of data. In such instances,additional data void interpolation was performed, using the nearest cloud-free NDVI data points on each side of the void (for a given date)followed by cubic spline curve fitting of the date and pixel in question. This multi-step time series data procedure was run to compute temporallyfiltered daily NDVI products for the defoliation period of each year during 2000–2006.
The TSPT produces intermediate files so that the effect of each processing step can be assessed. It also stacks output from each day into amultitemporal data stack for each year. The final filtered output contains NDVI pixels gridded at 250-meter Ground Sampling Distance (GSD).TSPT was also used to temporally process and refine the 16-day MOD13 NDVI products into 48-day temporal composites of the same defoliationperiod as with the MOD02 products.
3.4. Detection of gypsy moth defoliation from MODIS time series data
For each year during 2000–2006, MODIS time series were computed for the period when peak gypsy moth defoliation tended to occur in thestudy area (June 10–July 27). This time frame was determined using available documentation on the phenology of gypsy moth defoliation (e.g.,McManus et al., 1989) and on the scheduling of gypsymoth sketchmapping surveys (e.g., USFS, 2007). This approach differs from that of de Beursand Townsend (2008), who used the BioSIMmodel in conjunctionwith field data to estimate the period of peak defoliation.We also used Landsatand ASTER imagery in conjunction with published, regionally specific gypsy moth insect development chronology (e.g., McManus et al., 1989 )and sketch mapping metadata (e.g., USFS, 2007) to help determine the June 10–July 27 defoliation time frame. For the Northeast and Great Lakesregion of the United States, Ciesla (2000) reported that the optimal bio-window for aerial sketch mapping of gypsy moth defoliation is from June20 to July 20. In general, gypsy moth defoliation in early June has not yet reached its peak extent. By early August, partial re-foliation can beevident, though the re-foliation level varies according to multiple factors, such as site, weather, and defoliation intensity (Gottschalk, 1993).Gypsy moth defoliation can occur over consecutive years depending on these conditions and others influencing pest insect population dynamics,such as the impacts of pathogens on the defoliating insects. McManus et al. (1989) indicate that larval (i.e., caterpillar) development ceases inearly July, which also marks the end of defoliation progression. We defined the defoliation time frame or bio-window as a 48-day period to aid

432 J.P. Spruce et al. / Remote Sensing of Environment 115 (2011) 427–437
production of cloud-free temporal composites of NDVI levels during evident gypsy moth defoliation. This 48-day time frame includes 3 dates of16-day composites from the MOD13 data and 48 days of daily MOD02 data from the MODIS Terra sensor.
ERDAS IMAGINE® (Leica GeoSystems, 2005) and ENVI® (Research Systems, Inc, 2003) software were used to compute and assess MODIS gypsymoth defoliation mapping products. For each MODIS time-series product during the targeted defoliation period, the maximum NDVI value wascomputed on a per-pixel basis for all 7 years. A multi-channel image data stack was used to compute the maximum NDVI during each defoliationseason of 2000–2006 and of themaximumNDVI during the defoliation periods for all 7 years combined. Inmost cases, the latter records forest NDVIvalues during non-defoliated states over the defoliation time frame. Fig. 3 depicts the maximum NDVI during the defoliation season for all yearsassigned to the red color and themaximumNDVI for the defoliation season of 2001 assigned to the blue and green colors. The RGB display shows thedefoliation areas in red tones, indicating a drop in NDVI for the 2001 defoliation period compared to themaximumNDVI during the defoliation timeframe across the entire 2000–2006 era. This form of change detection visualization employs an additive color theory approach to multi-date colorcompositing discussed by Sader andWinne (1992). Defoliation detectionmapswere first developed using unsupervised classification of one date ofmaximumNDVIduring adefoliation seasonof a givenyear andof themaximumNDVI during thedefoliation time frameacross all 7 years.MODISdatasets for 2001 were selected for developing and validating detection products because relevant, cloud-free Landsat and ASTER imagery were alsoavailable for this year (Fig. 4). Unsupervised classifications were produced for MOD02 and MOD13 data products using ISODATA unsupervisedclustering and 20 cluster classes per dataset. Initially, the 20 classes were initially recoded into 3 land cover categories: 1) non-forest; 2) non-defoliated forest; and 3) defoliated forest. Recoding was aided by visual comparisons with Landsat, ASTER, and Hyperion images, and reference toUSFS gypsy moth sketch maps and National Land Cover Database 2001 data products. Compared to higher resolution remotely sensed data,commission error was noted for smaller patches on the 250-meter and 500-meter products. To reduce such commission error in the MODIS 250-meter products, homogenous single-class patches in the recoded image were aggregated (“clumped”) to dissolve small patches of less than 4 pixelsinto the dominant class of the surrounding area. For MODIS 500-meter products, homogenous single-class patches in the recoded image wereaggregated to dissolve regions of less than2 pixels into thedominant class of the surrounding area. This aggregation resulted in aneffectiveminimumareamappingunit of 0.25 and 0.50 km2 for the 250- and 500-meter products, respectively. Final classificationswere created by recoding from3 into 2classes (defoliated forest versus “other”). Fig. 5 depicts defoliation maps computed from the MOD02 250-meter NDVI data.
Image thresholding techniques were applied to compute an additional defoliation detection product from the 250-meter MOD02 time seriesdata. MOD02 NDVI products were used to compute a percent change in NDVI for the 2001 defoliation season compared to themaximumNDVI forsame time frame across the entire 2000–2006 period, using the following formula:
%Change in MaximumNDVI =ðMaximumNDVI Peak Defoliation YearXÞ− MaximumNDVI Peak Defoliation All Yearsð Þ
MaximumNDVI Peak Defoliation All Yearsð Þ � 100
The output image was thresholded into 2 classes (defoliated versus non-defoliated) based on visual comparison with MOD02 and LandsatNDVI RGB displays (Fig. 4). This detection product was thresholded so that anomalously high drops in NDVI, indicative of forest defoliation, weredefined as pixels with 4% change or greater. As with the MOD02 unsupervised classification result, we applied clump aggregation techniques onthe image thresholded defoliation product to reduce visual indications of commission error due to small patches. Homogenous single-classpatches in the recoded image were “clumped” to dissolve small patches of 4 pixels or less into the dominant class of the surrounding area. Thetotal area of detected forest defoliation was enumerated for each MODIS defoliation detection product (Table 1).
Fig. 3. Synoptic view of 2001 gypsy moth defoliation using RGB color composite image based onMOD02maximumNDVI during the defoliation seasons across 2000–2006 era loadedin red plus maximum NDVI during the defoliation for 2001 assigned to the blue and green color guns. The deep red tones indicate defoliation. The yellow box shows the location ofFigs. 4 and 5.

Fig. 4. Visual comparison of 2001 gypsy moth defoliation evident on Landsat (left) versus MODIS (right) 2-date NDVI color composite imagery. The Landsat RGB includes NDVI fromJune 10, 2000, loaded in the red and NDVI from July 15, 2001, loaded into the blue and green color guns. The MODIS RGB is from MOD02 data and composed as discussed in thecaption for Fig. 3.
433J.P. Spruce et al. / Remote Sensing of Environment 115 (2011) 427–437
3.5. Validation of gypsy moth defoliation detection products
A stratified random sample of pixels was selected using the MODIS 250-meter classification (MOD02 NDVI) so that each of 3 classes (non-forest, non-defoliated forest, and defoliated forest) was represented by at least 50 random sample locations. Each random sample pertained to asingle MODIS 250-meter pixel area consisting of a single class. The sample selection algorithm collects samples that occurred within 3×3 pixelwindows of single class values to aid assessment of polygonal surface cover patch features as opposed to the edges of such features. An analystviewed each randomly sampled location on either Landsat or ASTER imagery recorded during the 2001 defoliation time frame. The primary 2001scenes included path 17 row 34 Landsat data from July 7 (Landsat 5) and July 15 (Landsat 7). We also utilized July 15, 2001 Landsat 7 data frompath 17 row 33. The primary ASTER data sets were from July 24, 2001. This analysis also employed Landsat 7 data of largely non-defoliated forestwithin the study area from June 10, 2000 for path 17 rows 33 and 34. Landsat 5 data from path 17 rows 33 and 34 acquired September 17, 2001was also used for comparative purposes, though some gypsy moth defoliation was still evident. In addition, NDVI products were computed fromLandsat imagery and then copied into a two channel data stack that was used to visually interpret the defoliation status of randomly samplelocations. This stack was used to compute 2 date RGB screen displays in which the predominantly non-defoliated early summer 2000 LandsatNDVI channel was loaded into the red color gun and a corresponding 2001 Landsat NDVI was loaded into the blue and green color gun (Fig. 4).This RGB showed defoliated forests in red tones, enabling an additional enhanced view of forest defoliation, not evident when only viewing singledate Landsat false and true color composite RGBs.
The visual interpretation of Landsat color composite imagery as a reference source to support accuracy assessment of historical MODISregional forest change detection has been applied and reported in previous studies (Jin and Sader, 2005a; Hayes and Cohen, 2007; Hayes et al.,2008). The use of Landsat TM and ETM+ as reference data is also supported by work from Williams and Nelson (1986) in which Landsat MSSdefoliation detection products yielded 90% overall accuracy. In assessing MODIS-based defoliation detection products, the Landsat and ASTERdata interpretation of randomly sampled areas were made by a trained, experienced geospatial image analyst. In doing so, the expectation wasthat this product validation method would enable a reasonably good assessment of MODIS defoliation detection product performance, eventhough the interpretation of defoliation on Landsat and ASTER image data are also subject to some error.
Fig. 5. Example of defoliation detection products computed from MODIS MOD02 time-series data. The area shown here is identical to Fig. 4. The mapped defoliation shown in red isdraped onto a forest mask derived from NLCD 2001 data in which forest is shown in green and non-forest is displayed in tan.

434 J.P. Spruce et al. / Remote Sensing of Environment 115 (2011) 427–437
Based on interpretation of the Landsat or ASTER false color composite RGB displays at a fixed high-resolution viewing scale (1:17,500), theanalyst interpreted and categorized each selected 250×250 m sample location as being either predominantly non-forest, non-defoliated forest,or defoliated forest. In doing so, the 250 by 250 m area of each random sample location was clearly defined on the applicable Landsat or ASTERscreen displays. An error matrix was then prepared to compute estimates of percent overall agreement with available reference data as well asomission and commission error on a per-class basis. Kappa statistics were generated to assess overall classification agreement adjusted forrandom chance effects (Congalton, 1991). Kappa statistics were also computed on a per-class basis. In addition, an assessment of agreement wasperformed on 2-class classification products depicting defoliated forest versus “other” by grouping samples from non-defoliated and non-forestto “other.”
Table 2Agreement of MODIS-based defoliation detection products for 2001 compared tointerpretation of randomly sampled locations on Landsat and ASTER RGB displays.
Product Defoliatedforest
Other Overall
OER CER Kappa OER CER Kappa OA OK
MOD02 NDVI250-munsupervisedclassification
0.09 0.22 0.67 0.13 0.05 0.86 88.4(153/173)
0.75
MOD02 NDVI250-m imagethresholded
0.16 0.21 0.68 0.11 0.08 0.76 87.3(151/173)
0.72
4. Results and discussion
4.1. Agreement assessment of unsupervised classification of gypsy mothforest defoliation
Unsupervised classification agreement results of defoliated forestversus “other” land cover for the MOD02 250-meter NDVI, MOD13250-meter NDVI, and MOD02 500-meter NDVI are presented inTable 2. The table also includes agreement metrics for the imagethresholded defoliation detection product.
The MOD02 250-meter NDVI classification product and the imagethresholded product yielded very similar overall classificationagreement with the reference data (88.4% versus 87.3%), overallKappa values (0.75 versus 0.72), defoliation class omission error rates(0.09 versus 0.16), and defoliation class Kappa values (0.67 versus0.68). The MOD13 250-meter NDVI classification had a lower overallagreement (79.1%) and a much lower overall Kappa (0.46). TheMOD13 250-meter NDVI classification of defoliation yielded highomission error rate (0.56) but the lowest commission error rate (0.14)and highest defoliation class Kappa (0.79), suggesting that theclassification usually omitted defoliation areas but did not substan-tially over-classify (i.e., cause excessive commission error) defoliationareas. Non-defoliation agreements are also reported in Table 2.
Compared to 250-meter data products, the overall agreement wassimilar, but slightly lower, using the 500-meter data products. TheMOD02 500-meter NDVI classification had an overall agreement of85.0% and Kappa of 0.65. For defoliation detection, the 500-meterNDVI had higher omission rate (0.30) but slightly lower commissionerror rate (0.18) and higher defoliation class Kappa (0.73) comparedto the MODIS 250-meter defoliation mapping products.
4.2. Temporal datasets created from time series product tool
Williams and Nelson (1986) reported that the Eastern United Statesis often 50+ percent cloudy during the summer months. Based onavailable Collection 4 MODIS MOD35 cloud mask products, the studyarea's cloud frequency during the gypsy moth defoliation time frame(June 10–July 27) approached 80% for 2000–2006 (Table 3). This cloudfrequency significantly hinders effective use of Landsat data for annualregion-wide detection of gypsy moth defoliation, particularly whereseveral Landsat scenes are required to cover the study area. For largestudy areas, it is also difficult tofind single dates ofMODIS datawith lowcloud coverage for the study area during the defoliation season. Incontrast to previous studies of gypsy moth defoliation, our studyemployed a novel approach to reduce cloud contamination problems byemploying temporal processing techniques (e.g., TSPT discussed in
Table 1Summary area estimates of 2001 gypsy moth defoliated forest and “non-defoliatedother” for assessed MODIS NDVI sketch mapping products (areas expressed in squarekilometers).
2001 gypsy moth defoliation detection product Defoliation Other Total
MOD02 250 m NDVI unsupervised classification 2427 59,572 61,999MOD02 250 m NDVI image thresholded classification 2290 59,710 61,999MOD13 250 m NDVI classification 1228 59,622 60,847MOD02 500 m NDVI classification 1694 60,305 61,999
Methods) to allow a wall-to-wall assessment of defoliation patternsacross the entire study area. This study successfully applied availablepest phenology information in defining the period over which temporalcompositingwas done, using available scheduling information on aerialgypsymothdefoliation surveys (Ciesla, 2000; Sellers, 2001; USFS, 2007)and regional gypsymoth life cycle trends (McManus et al., 1989). Doingso enabled a broad regional assessment of defoliation, an importantrequirement for the forest threat EWS.
Temporal processing of the MODIS data using the TSPT resulted inthe detection of large defoliation patches, rather than producingproducts including defoliation patterns interrupted by scene-depen-dent cloud contamination. In 2001, the cloud cover in the study areawas at a low enough frequency to be mitigated through temporalprocessing (e.g., compositing and filtering). The fact that cloud-freetemporal composites for the main defoliation period of 48 contiguousdays could be developed within the cloud-prone mid-Appalachianhighlands study area is encouraging. Also, these results are promisinggiven that only available MODIS Terra data was used and that no datawere collected from June 15 through July 2, 2001, because of a sensorissue. Despite time-series data processing, residual atmosphericcontamination from clouds and from cloud shadows lowereddetection ability, although less so for the MOD02 products. Producingcomparable defoliation classification agreement results with Landsator ASTER, using single-day MODIS imagery without temporalprocessing would be unlikely given the cloud statistics and thevariability of average sensor zenith angle for the MODIS imagery.Many of the better single-date MODIS scenes across the time serieswere collected at high sensor zenith angles, which effectivelyincreased the Point Spread Function and decreased the spatialresolution.
The temporal compositing can be complicated by use of data bandsgenerated at different spatial sampling scales (e.g., 250 versus 500 m)
classificationMOD13 NDVI250-munsupervisedclassification
0.56 0.14 0.79 0.03 0.22 0.33 79.1(137/173)
0.46
MOD02 NDVI500-munsupervisedclassification
0.30 0.18 0.73 0.08 0.14 0.48 85.0(147/173)
0.65
OER = Omission Error Rate (1-Producer's Agreement), CER = Commission Error Rate(1-User's Agreement), Kappa = Kappa Statistic, OA = % Overall Agreement (# correct/total), and OK = Overall Kappa.

Table 3Estimated frequency of cloud coverage during the gypsy moth defoliation time frame ofJune 10–July 27 for 2000–2006, based on analysis of Collection 4 MODIS MOD35 dailycloud mask products.
Year % Cloudy # Sampleddays
Mean # cloudydays
Mean # sunnydays
2000 82.51 47.00 38.78 8.222001 73.28 30.00 21.98 8.022002 76.01 48.00 36.49 11.512003 77.26 48.00 37.08 10.922004 83.77 48.00 40.21 7.792005 81.13 48.00 38.94 9.062006 73.55 48.00 35.30 12.70Average all years 78.48 45.29 35.54 9.75
435J.P. Spruce et al. / Remote Sensing of Environment 115 (2011) 427–437
and by different sensor subsystems (e.g., visible and NIR versusSWIR). Noise mitigation of temporal composites can also beproblematic even when the utilized bands have the same resolutionand are from the same sensor subsystem. Consequently, noisemitigation of vegetation index products based on both NIR andSWIR bands may need to be applied to raw bands independently priorto computing higher order vegetation index products. The resultspresented here focus on the use of NDVI time series for monitoringforest disturbance, primarily due to the higher inherent spatialresolution of the MODIS NDVI products generated from 250-meterred and NIR bands.
4.3. Data gaps and recommended future work
Atmospheric correction of reflectance is highly desirable fordetection and depiction of vegetation anomalies from NDVI timeseries, although for a given current season the products need to be asnear real time as possible for fullest use in the USFS EWS. Whileatmospherically corrected products may be desirable, the most usefulresults for this experiment were from MOD02 products that were notatmospherically corrected. It is not completely clear as to why thetemporally composited daily MOD02 products performed better thanthe atmospherically corrected, temporally composited MOD13 pro-ducts, although other authors have reported similar findings favoringselective dates of daily MODIS over MOD13 temporal composites inforest disturbance detection studies (Jin and Sader, 2005a; Hayeset al., 2008; de Beurs and Townsend, 2008). The MOD02 temporalcomposites in this study appeared to be less noisy and visuallydepicted the defoliation more consistently. Another factor is that the2001 defoliation season was only covered by MODIS Terra and thatthere was a multi-day stretch (June 15–July 2) during the surveyedJune 10–July 27 defoliation period in which no MODIS data wascollected due to a sensor issue. This could have created an advantagein using daily data to mitigate data voids prior to temporalcompositing. It is conceivable that the computation of 48 daycomposites from the temporally processed 16 day MOD13 NDVIdata was a less effective strategy than computing 48 day compositesfrom the daily, temporally processed MOD02 data. The MOD13defoliation products were computed from the best available pre-processed MODIS data at the time: the Collection 4 products. The useof Collection 5 MODIS products may improve the MOD13 results forthis application by providing data with improved atmosphericcorrection and reduced residual noise.
An effort was also made to use Collection 4 MODIS MOD09atmospherically corrected ground reflectance data for this applica-tion, but this was abandoned because of the noise from residualatmospheric contamination evident in the MOD09 raw data displays.This noise caused significant omission for classification of defoliationareas. Because of these problems, further evaluation (e.g., agreementassessment) of MOD09 products for this application was delayed untila better determination could be made on the nature of the MOD09
noise artifacts and an optimal approach for noise reduction. Views ofnon-temporally filtered MOD09 data products indicate that the noiseproblem is evident before TSPT processing, suggesting that residualatmospheric contamination was a factor. A modification of theatmospheric correction procedure may be needed to make MOD09products more useful for this forest threat EWS application. For areasprone to clouds during defoliation, atmospheric correction mayincrease noisiness of vegetation index products compared to resultsfrom MOD02 planetary reflectance. Collection 5 MOD09 atmospher-ically corrected data should enable an improved application productand may therefore help improve defoliation detection results forcloud-prone areas, such as the mid-Appalachian Highlands.
Alternative indices to NDVI should be explored using MODIS datafor mapping forest defoliation. In particular, we recommend thatMODIS NDVI defoliation maps be compared to those from NDMI (Jinand Sader, 2005b; Hayes et al., 2008) or NDIIb7 obtained from the NIRand 2150 nm SWIR band (de Beurs and Townsend, 2008) time seriesproducts (or comparable vegetation index products involving SWIRand NIR bands). NDMI-based defoliation analysis was initiated in thisstudy but was not fully pursued because of noise evident in the TSPT-processed NDMI products that was not evident in the correspondingNDVI products. The noise problem is apparently due to running theTSPT noise reduction routines on the vegetation index product versusthe individual bands used to compute the vegetation index. It appearsthat noise reduction may need to be applied separately to the 250-meter NIR and 500-meter SWIR bands prior to computing daily NDMIimages and producing subsequent temporal composites. In addition,the fusion of MODIS Aqua and Terra data products may also improvequality of NIR-and SWIR-based vegetation indices used to computeforest defoliation detection products. The application of fused MODISAqua and Terra data products should be advantageous to decreasedata voids from clouds and to decrease the noise from atmosphericcontamination in general.
Although not an objective of this study or an absolute requirementof the forest threat EWS described by Hargrove et al. (2009), futureresearch is recommended to determine if more than one defoliationseverity class can be accurately detected from 250 or 500 m MODISdata. Additional defoliation severity classes would be useful ifobtainable at sufficiently high accuracies. While this study did notyield multiple defoliation classes, the determination might beattempted using a fractional abundance classification approach (e.g.,Hansen et al., 2003) to compute percent forest overstory defoliationon a per-pixel basis. Accuracy of gypsy moth defoliation detectionproducts as a function of patch size should also be explored andcompared to results from work by de Beurs and Townsend (2008).Their study concluded that defoliation patches greater than 0.63 km2
can be accurately detected with daily non-composited MODIS data. Incomparison, all of defoliation detection products from our study werederived using a minimum patch size of 0.25 km2 (2 pixels) for the250 m products and 0.5 km2 (4 pixels) for the 500 m product.
In comparing results across the different years of the time series,the MODIS defoliation mapping products were most effective foryears when defoliation was extensive, such as 2001. While resultsindicated that defoliation maps for 2001 produced from MODIS datashowed general agreement with reference data, accuracy assessmentis needed for other years to confirm consistency of the detectiontechniques and suitability of the data for the application.
This investigation considered one extensive study area (mid-Appalachian Highlands) that is not completely representative of allforest landscapes and U.S. regions with extensive forest. Other foresttypes and landscape conditions vulnerable to major insect threatsshould be examined using similar datasets and techniques, becausethe USFS forest threat EWS will be implemented on a national scale.This study provided some evidence that MODIS time series NDVI datacan provide geospatial information on gypsy moth defoliation in nearreal time, although more testing is needed to demonstrate and

436 J.P. Spruce et al. / Remote Sensing of Environment 115 (2011) 427–437
validate the potential for supplying this information in near real timeto the EWS. Some of this testing was recently performed for 2009using MOD13 NDVI data in conjunction with near real time MODISNDVI from the USGS eMODIS data stream (Hargrove et al., 2009).
Gypsy moth defoliation phenology is an important component ofthe approach for region-wide defoliation detection from daily MODIStime series data. The bio-temporal window used in this studyappeared to be appropriate based on the 2001 gypsy moth casestudy discussed here. However, other biotic and abiotic factors canalso cause defoliation, so care must be taken when defining the bio-temporal windows of observation and interpreting detection results.For example, forest tent caterpillar (Malacosoma disstria) peakdefoliation in this region tends to occur earlier than gypsy mothdefoliation, though there is some overlap in the defoliation phenologyof these two pests. Abiotic agents, such as ice storm damage, alsoproduce ephemeral forest defoliation. The most definitive assignmentof a causal agent requires field validation in a statistically validmanner to represent the region at large.
5. Conclusions
This study produced MODIS-based gypsy moth defoliation mapsfor 2001 that showed reasonable agreement compared to availablereference data. Effective defoliation detection products wereobtained, using temporally filtered and composited MOD02 andMOD13 NDVI data. Accuracy assessments of these products employedvisual interpretation of random sample locations on higher resolutionLandsat and ASTER imagery; previous studies have shown thistechnique (of using moderate resolution satellite data for assessingMODIS-based forest change detection accuracy) to be valid. TheMOD02 250-meter defoliation detection products yielded the highestagreement with the reference data. The MOD02 500-meter unsuper-vised classification overall classification and Kappa agreements withreference data were slightly lower than for the MOD02 250-meterproducts; however, the Kappa agreement of MOD02 500-meterdefoliation classification with Landsat and ASTER reference data wasslightly higher. The MOD02 products outperformed the MOD13products, although the MOD13 product still provided a means tovisualize defoliation patches and conservatively estimate gypsy mothdefoliation across the landscape. These results suggest that MODIS-based gypsy moth defoliation detection products provides comple-mentary information on the location and extent of heavy defoliationareas, compared to that obtained from aerial sketchmap products andmay be helpful for adjusting end-of-year estimates of defoliationcurrently based on aerial sketch maps. When produced in near realtime, such MODIS products should be useful for aiding planning andimplementation of ADS surveys. The MODIS results required thatmultitemporal data be processed over the entire MODIS time seriesduring 2000–2006 to establish a cloud-free baseline of the non-defoliated NDVI values during the time of defoliation. The success ofthe techniques employed in this study requires sufficient cloud-freedata across the defoliation time frame to enable cloud-free temporalcomposites. It also requires that noise reduction of residual atmo-spheric contamination be sufficiently effective to provide useableimagery for defoliation detection. The success depends in part on useof an appropriate bio-temporal window for a given biotic threat (e.g.,gypsy moth defoliation) and locale. Single dates of non-compositedMODIS data can also be effective for monitoring gypsy mothdefoliation when suitable region-wide, cloud-free data are availableat acceptable viewing geometries during both defoliated and non-defoliated states of the same time frame.
The USFS is considering using 500-meter MODIS reflectance dataproducts for inclusion into a near-real-time EWS. Our results suggestthat this sampling scale can be effective for monitoring regional gypsymoth defoliation, providing that defoliation tends to occur as large,extensive patches. In terms of latency, the MOD02 products are more
amenable to the EWS near-real-time requirement than the MOD13products. However, efforts are underway by the USFS and NASA thatmay enable near-real-time processing of MOD02 data into theproducts that are atmospherically corrected and also mitigated forBidirectional Reflectance Distribution Function (BRDF) effects. TheseNRT products would be created at a 250 or 500-meter GSD and wouldbe similar to MOD43B4 products. These products would be thenprocessed into gypsy moth defoliation products. However, until suchnear-real-time BRDF corrected reflectance data products are availableand validated, the results of this study indicate that MOD02 andMOD13 products have potential for contributing useful gypsy mothdefoliation maps needed for the EWS. The MOD13 products alsoshowed less potential for this application, though this potentialshould increase using Collection 5 Terra and Aqua data. The MOD13products are also more suitable for integrating with USGS eMODISexpedited CONUS MODIS NDVI products (latter described byJenkerson and Schmidt, 2008). Collection 5 MOD13 and eMODISproducts were employed to generate 2009 gypsy moth defoliationdetection products for the Eastern U.S. in near real time (Hargroveet al., 2009).
This study has demonstrated that useful regional gypsy mothdefoliation detection products can be obtained from temporallyprocessed MODIS NDVI time series data. Such products will be auseful component of the eventual nationwide forest threat EWS thatwill provide information on forest disturbances periodically through-out each year (Hargrove et al., 2009). Utilizing available informationon appropriate bio-windows and historical reference data on pestoccurrence will enable MODIS-disturbance detection products to beassessed according to potential damage agent. Such information willbe available in GIS formats to aid planning, implementation, andanalysis of aerial sketchmapping surveys and to assist other facets ofnatural resource management.
Acknowledgments
Participation in this research by Science Systems and Applications,Inc. and Computer Sciences Corporation was supported by NASA atthe John C. Stennis Space Center, Mississippi, under Task OrderNNS04AB54T. We thank Slawomir Blonski and two anonymousreviewers for providing constructive comments on the manuscript.
References
Bosworth, D. (2006). Statement of Dale Bosworth, Chief, U.S. Forest Service, UnitedStates Department of Agriculture Before the United States Senate. Committee onEnergy and Natural Resources, Subcommittee on Public Lands and Forests ConcerningHealthy Forests Restoration Act Implementation, July 19, 2006 URL: http://www.fs.fed.us/congress/109/senate/oversight/bosworth/071906.html (last date accessed:6 April 2009).
Bradley, B. A., Jacob, R. W., Hermance, J. F., & Mustard, J. F. (2007). A curve fittingprocedure to derive inter-annual phenologies from time series of noisy satelliteNDVI data. Remote Sensing of Environment, 106, 137−145.
Breshears, D. D., Cobb, N. S., Rich, P. M., Price, K. P., Allen, C. D., Balice, R. G., et al. (2005).Regional vegetation die-off in response to global-change-type drought. Proceedingsof the National Academy of Sciences U.S.A., 102, 15144−15148.
Chen, J., Jönsson, P., Tamura, M., Gu, Z., Matsushita, B., & Eklundh, L. (2004). A simplemethod for reconstructing a high-quality NDVI time-series data set based on theSavitzky–Golay filter. Remote Sensing of Environment, 91, 332−344.
Ciesla, W. M., Dull, C. W., & Acciavatti, R. E. (1989). Interpretation of SPOT-1 colorcomposites for mapping of defoliation of hardwood forests by gypsy moth.Photogrammetric Engineering and Remote Sensing, 55, 1465−1470.
Ciesla,W.M. (2000).Remote Sensing in Forest Health Protection. FHTETReport No. 00-03.U.S. Department of Agriculture, Forest Service, Forest Health Technology Enterprise Team,Remote Sensing Applications Center 266 p., URL: http://www.fs.fed.us/foresthealth/technology/pdfs/RemoteSensingForestHealth00_03.pdf (last date accessed: 9April2009).
Cohen,W. B., Spies, T. A., Alig, R. J., Oetter, D. R., Maiersperger, T. K., & Fiorella, M. (2002).Characterizing 23 years (1972–95) of stand replacement disturbance in WesternOregon forests with Landsat imagery. Ecosystems, 5, 122−137.
Congalton, R. G. (1991). A review of assessing the accuracy of classifications of remotelysensed data. Remote Sensing of Environment, 37, 35−46.
Coppin, P. R., & Bauer, M. E. (1996). Digital change detection in forest ecosystems withremote sensing imagery. Remote Sensing Reviews, 13, 207−234.
437J.P. Spruce et al. / Remote Sensing of Environment 115 (2011) 427–437
Coppin, P., Jonckheere, I., Nackaerts, K., Muys, B., & Lambin, E. (2004). Digital changedetection methods in ecosystem monitoring: A review. International Journal ofRemote Sensing, 25, 1565−1596.
Dale, V. H., Joyce, L. A., McNulty, S., Neilson, R. P., Ayres, M. P., Flannigan, M. D., et al.(2001). Climate change and forest disturbance. Bioscience, 51, 723−734.
de Beurs, K. M., & Townsend, P. A. (2008). Estimating the effect of gypsy mothdefoliation using MODIS. Remote Sensing of Environment, 112, 3983−3990.
Ellenwood, J. (2006). Forest health monitoring—Enhancing detection monitoring. USForest Service Forest Disturbance Mapping Workshop, 29 November 2006, Salt LakeCity, Utah.
Franklin, S. E., Lavigne, M. B., Moskal, L. M., Wulder, M. A., & McCaffrey, T. M. (2001).Interpretation of forest harvest conditions in New Brunswick using Landsat TMenhanced wetness difference imagery (EWDI). Canadian Journal of Remote Sensing,27, 118−128.
Fraser, R. H., Abuelgasim, A., & Latifovic, R. (2005). A method for detecting large-scaleforest cover change using coarse spatial resolution imagery. Remote Sensing ofEnvironment, 95, 414−427.
Gottschalk, K. W. (1993). Silvicultural guidelines for forest stands threatened by thegypsymoth. Gen. Tech. Rep. NE-171, Radnor, PA: U.S. Department of Agriculture, ForestService, Northeastern Forest Experiment Station.
Hall, R. J., Skakun, R. S., & Arsenault, E. J. (2006). Remotely sensed data in themapping ofinsect defoliation. In M. A. Mulder, & S. E. Franklin (Eds.), Understanding forestdisturbance and spatial pattern: Remote sensing and GIS approaches (pp. 85−111).Boca Raton, Florida, USA: Taylor and Francis, CRC Press.
Hansen, M., DeFries, R. S., Townshend, J. R. G., Carroll, M., Dimiceli, C., & Sohlberg, R. A.(2003). Global percent tree cover at a spatial resolution of 500 meters: First resultsof the MODIS vegetation continuous fields algorithm. Earth Interactions, 7, 1−15.
Hargrove, William W., Spruce, Joseph P., Gasser, Gerald E., & Hoffman, Forrest M.(2009). Toward a national early warning system for forest disturbances usingremotely sensed canopy phenology. Photogrammetric Engineering and RemoteSensing, 75, 1150−1156.
Hayes, D. J., Cohen,W., Sader, S. A., & Irwin, D. E. (2008). Estimating proportional changein forest cover as a continuous variable from multi-year MODIS data. RemoteSensing of Environment, 112, 735−749.
Hayes, D. J., & Cohen, W. B. (2007). Spatial, spectral and temporal patterns of tropicalforest cover change as observed with multiple scales of optical satellite data.Remote Sensing of Environment, 106, 1−16.
Jenkerson, C. B., & Schmidt, G. (2008). eMODIS product access for large scalemonitoring, Proceedings of the 17th William T. Pecora Memorial Symposium onRemote Sensing, Denver, CO. Bethesda, MD: American Society for Photogrammetryand Remote Sensing.
Johnson, E. W., & Ross, J. (2008). Quantifying error in aerial survey data. AustralianForestry., 71, 216−222.
Johnson, E. W., & Wittwer, D. (2008). Aerial detection surveys in the United States.Australian Forestry, 71, 212−215.
Jin, S., & Sader, S. A. (2005a). MODIS time-series imagery for forest disturbancedetection and quantification of patch size effects. Remote Sensing of Environment,99, 462−470.
Jin, S., & Sader, S. A. (2005b). Comparison of time-series tasseled cap wetness and thenormalized difference moisture index in detecting forest disturbances. RemoteSensing of Environment, 94, 364−372.
Kharuk, V. I., Ranson, K. J., Kozuhovskaya, A. G., Kondakov, Y. P., & Pestunov, L. A. (2004).NOAA/AVHRR satellite detection of Siberian silkmoth outbreaks in eastern Siberia.International Journal of Remote Sensing, 25, 5543−5555.
Kharuk, V. I., Ranson, K. J., & Fedotova, E. V. (2007). Spatial pattern of Siberian silkmothoutbreak and taiga mortality. Scandinavian Journal of Forest Research, 22, 531−536.
GeoSystems, Leica (2005). ERDAS field guide. LLC, Norcross, Georgia: Leica GeosystemsGeospatial Imaging.
Lunetta, R. L., Knight, F. K., Ediriwickrema, J., Lyon, J. G., & Worthy, L. D. (2006).Landcover change detection using multi-temporal MODIS NDVI data. RemoteSensing of Environment, 105, 142−154.
McConnell, T., Johnson, E., & Burns, B. (2000). A guide to conducting aerial sketchmapsurveys. USDA Forest Service, Forest Health Technology Enterprise Team, Fort Collins,Colo., FHTET 00-01 88pp.
McKellip, R., Ryan, R. E., Prados, D., & Blonski, S. (2005). Crop surveillancedemonstration using a near-daily MODIS vegetation index time series. Proceedings
of the 2005 International Workshop on the Analysis of Multi-Temporal Remote SensingImages. New York, New York: IEEE.
McKellip, R., Prados, D., Ryan, R., Ross, K., Spruce, J., Gasser, G., et al. (2008). Remote-sensing time series analysis, a vegetation monitoring tool. NASA Tech Briefs, 32,63−64.
McManus, M., Schneeberger, N., Reardon, R., & Mason, G. (1989). Gypsy Moth. USDAForest Service Forest Insect and Disease Leaflet 162, Radnor. PA: Northeastern ForestExperiment Station, Forest Service URL: http://www.na.fs.fed.us/spfo/pubs/fidls/gypsymoth/gypsy.htm (last date accessed: 9 April 2009).
Muchoney, D. M., & Haack, B. N. (1994). Change detection for monitoring forestdefoliation. Photogrammetric Engineering and Remote Sensing, 60, 1243−1251.
Nielson, E., Quayle, B., & Johnson, J. (2006). USFS RSAC work in broad-scale forestchange detection. 2006 USDA Forest Service Workshop on Forest DisturbanceMapping.
Pimentel, D., Lach, L., Zuniga, R., & Morrison, D. (2000). Environmental and economiccosts associated with non-indigenous species in the United States. Bioscience, 50,53−65.
Potter, C., Pang-Ning, T., Kumar, V., Kucharik, C., Klooster, S., Genovese, V., et al. (2005).Recent history of large-scale ecosystem disturbances in North America derivedfrom the AVHRR satellite record. Ecosystems, 8, 808−824.
Prados, D., Ryan, R. E., & Ross, K. W. (2006). Remote Sensing Time Series Product Tool. 2006AGU Fall Meeting, abstract URL: http://www.agu.org/meetings/fm06/fm06-sessions/fm06_IN33B.html (last date accessed: 9 April 2009).
Tobin, P. C., & Blackburn, L. M. (2007). Slow the spread: A national program to managethe gypsy moth. Gen. Tech. Rep. NRS-6. Newtown Square, PA: U.S. Department ofAgriculture, Forest Service, Northern Research Station.
Quayle, B., Lannom, K., Finco, M., Norton, J., & Warnick, R. (2003). Monitoring wildlandfire activity on a national-scale withMODIS imagery. 2nd International Wildland FireEcology and Fire Management Congress, 5th Symposium on Fire and ForestMeteorology, abstract URL: http://ams.confex.com/ams/FIRE2003/techprogram/paper_66050.htm (last date accessed: 9 April 2009).
Research Systems, Inc. (2003). ENVI Field Guide. ENVI version 4.0, September 2003Edition. : Research Systems, Inc.
Sader, S. A., & Winne, J. C. (1992). RGB-NDVI color composites for visualizing forestchange dynamics. International Journal of Remote Sensing, 13, 3055−3067.
Savitzky, A., & Golay, M. (1964). Smoothing and differentiation of data by simplifiedleast squares procedures. Analytical Chemistry, 36, 1627−1639.
Schrader-Patton, C. (2003). Digital aerial sketchmapping. USDA Forest Service—Engineering, Forest Health Technology Enterprise Team—Fort Collins, Remote SensingApplications Center, Report No. RSAC-1202-RPT2.
Sellers, P. (2001). Forest Health Protection Evaluation of the Gypsy Moth on theDeerfield, Dry River, Glenwood-Pedlar, James River, Lee, and Warm Springs RangerDistricts of the GeorgeWashington and Jefferson National Forests, Fiscal Year 2002.USDA Forest Service, Forest Health Protection, Report #01-01-15, November 2001.
Spruce, J. P., Ryan, R. E., Smoot, J. C., Prados, D., McKellip, R., Sader, S. A., et al. (2007).Potential of VIIRS data for regional monitoring of gypsy moth defoliation:Implications for forest threat early warning system. American Geophysical Union2007 Winter Meeting, presentation, 10–14 Dec. 2007, San Francisco, CA, USA.
USFS USDA Forest Service. (2004). Center Charter. Western Wildland EnvironmentalThreat Assessment Center URL: http://www.fs.fed.us/pnw/wwetac/Charter.pdf (lastdate accessed: 9 April 2009).
USFS (2005). Center Charter. Eastern Forest Environmental Threat Assessment Center.USFS (2007). Annual gypsy moth defoliation. Metadata documentation on aerial sketch
mapping geospatial datasets.USFS (2009). Gypsy moth digest—Defoliation URL: http://www.na.fs.fed.us/fhp/gm/
defoliation/index.shtm (last date accessed: 9 April 2009).U.S. Geological Survey. (2006). MODIS Reprojection Tool Swath User's Manual. Release
2.1, January 2006. USGS EROS Data Center Land Processes DAAC.Vogelmann, J. E. (1990). Comparison between two vegetation indices for measuring
different types of forest damage in the Northeastern United States. InternationalJournal of Remote Sensing, 11, 2281−2297.
Williams, D. L., & Nelson, R. F. (1986). Use of remotely sensed data for assessing foreststand conditions in the Eastern United States. IEEE Transactions on Geoscience andRemote Sensing, GE-24, 130−138.