assessment of electrophoresis and electroosmosis in ... · 2 experimental procedure 2.1 materials...
TRANSCRIPT

Assessment of electrophoresis and electroosmosis in construction materials: effect of enhancing electrolytes and heavy metals contamination
M. Castellote • S. Botija • C. Andrade
Abstract Electrokinetic effects are those that take place by application of an electric field to porous materials, with the zeta potential as the key parameter. Specifically, in the case of contaminated construction materials, the generation of an electroosmotic flux, with the corresponding dragging due to water transport, is a crucial mechanism to succeed in the treatment of decontamination. Therefore, it is of great interest trying to optimize the treatment by the addition of specific electrolytes enhancing the electrokinetic phenomena. Most of the data of zeta potential found in literature for construction materials are based in micro-electropho-resis measurements, which are quite far of the real conditions of application of the remediation treatments. In this paper, electrophoretic and electroosmotic experiments, with monolithic and powdered material respectively, have been carried out for mortar, brick and granite clean and contaminated with Cs, Sr, Co, Cd, Cu and Pb. The electrolytes tested have been distilled water (DW), Na2-EDTA, oxalic acid, acetic acid and citric acid. The zeta potential values have been determined through the two different techniques and the results compared and critically analysed.
Keywords Electrokinetics • Electroosmosis • Electrophoresis • Mortar • Brick • Granite • Zeta potential • Heavy metals • Enhancing electrolytes • Decontamination
1 Introduction
Waste disposal has become a major concern in most industrial countries because of limited sites and strict environmental standards for landfilling. Due to the high cost of landfilling, an effective method of removing construction and demolition (C&D) debris from the waste stream is necessary. However, they may contain certain levels of hazardous elements such as heavy metals. One possible source of contamination is the soil on which structures are constructed, as they might have been contaminated by past use, such as spills from historical chemical handling or atmospheric deposition of pollutants [1]. Moreover, hazardous metals may diffuse into the built structure as a result of several industrial activities, radioactive spillages or even from the nature of constituent materials. For example, high amounts of lead, cadmium and zinc have been documented in structures placed in a mining district of Missouri state [2]. Additionally, since the service lives of nuclear power plants are limited to a certain number of years, the need for the management of quite a large volume of radioactive contaminated concrete arises, which, in most cases, was not taken into account when the capacities of the low and medium activity repositories were designed. Therefore, the decontamination of these structures is of great interest in order to declassify the wastes as radioactive and manage them as conventional ones.
Therefore, in the last years, decontamination of constructions materials has become a subject of great interest, mainly related to radioactive elements. Trials with different types of treatments can be found in literature [3-13]. Among them, only a few studies on electrokinetic treatments to decontaminate concrete [8-13].
The decontamination of construction materials by application of electrical fields profits mainly of two

different phenomena: electromigration and electrokinetic effects. In addition, sorption and desorption processes in the liquid/solid interphase has also to be taken into account. This paper deals mainly with the study of the electrokinetic effects within the framework of decontamination processes.
When two phases are placed in contact there develops, in general, a difference in potential between them. As a consequence, the region between two adjoining phases is marked by a separation of electric charges, so that near to or on the surface of one phase there is an excess of charge of one sign and the balancing charge is distributed through the adjoining surface regions of the other phase. When one of these phases is caused to move tangentially past the second phase there are observed a number of phenomena which are grouped under the generic name of "electrokinetic effects". When the solid remains stationary and the liquid moves in response to an applied electrical field this is called electro-osmosis [14]. This is the case of a monolithic material when submitted to an external electrical field. If one phase consists of a liquid in which the second phase is suspended as particles of solid, then, the particles can be induced to move by applying an electric field across the system. This is called electrophoresis [14].
The zeta potential is the key parameter in the establishment of the electrokinetic effects. It can be defined as the average potential at an imaginary surface, which is considered to lie close to the solid surface, and within which the fluid is stationary during an electrokinetic process (surface of shear) [14].
Several experiments have been carried out to determine zeta potential in cementitious materials. The most numerous from cement or synthetic CSH suspensions, by the microelectrophoresis technique [12, 15-24], but also using other techniques as acoustophoresis [25], which are very important to know the basic features of the electrokinetics for these materials but are quite far of the real conditions of application of the remediation treatments, as the material is grinded and in a very diluted suspension. By the first time, the authors were able to demonstrate and quantify the electroosmotic flux through monolithic hardened carbonated concrete [26] in realkalisation tests with carbonated concrete, following in situ the experiment by neutron diffraction analysis [27], studying the influence of the external solution [28], and the composition of the binder [29].
Additionally, it is of great interest trying to optimize the treatment by the addition of specific electrolytes enhancing the electrokinetic phenomena, that are of common use in soil remediation techniques and that are very scarce when dealing with construction materials [12, 13].
Covering both points, in this paper, micro-electropho-retic and electroosmotic experiments, with monolithic and
powdered material respectively, have been carried out for mortar, brick and granite clean and contaminated with Cs, Sr, Co, Cd, Cu and Pb. The enhancing electrolytes tested have been distilled water (DW), Na2-EDTA, oxalic acid, acetic acid and citric acid, commonly used in soil cleaning. The zeta potential values have been determined through both different techniques and the results compared and critically analysed.
2 Experimental procedure
2.1 Materials
Three different materials have been used: Mortar, Brick and Granite. The mortar was cast with cement type IV-B-32.5 SR/BR, that includes fly ashes in their composition, with the mix proportion given in Table 1, making cylindrical specimens of 75 mm diameter and 150 mm height. The brick was a Spanish solid type brick commonly used in facades, in which, cores of 75 mm diameter were taken. Granite samples were directly obtained from an extractive company that works around Madrid that supplied cylinders of 75 mm diameter. The chemical composition, determined by acid digestion of two duplicates of the powdered material and ICP analysis, of the cement used in the mortar and that of the brick and granite used are given in Table 2.
The materials were characterised by mercury intrusion porosimetry (Micromeritics IV 9500) and BET surface area determination (Micromeritics ASAP 2010). To determine the pH of their aqueous phase, 1 g of powdered sample was shaken in 2 mL of DW and the pH of the resulting solutions was measured.
For the different tests to be performed, different samples were prepared. On one hand, monolithic specimens of 75 mm diameter and about 10 mm depth (cutting slices from mortar and granite and extracting cores from the bricks) to perform the electroosmotic tests, and powdered samples (diameter <100 urn) for the electrophoretic
Table 1 Mix proportions of the mortar used
Cement IV-B-32.5 SR/BR (%) Sand (%) Water (%) Additive
31.51 56.01 11.87 0.61
Table 2 Chemical composition of the cement used in the mortar and that of the brick and granite
S i0 2 A1203 Fe 2 0 3 CaO MgO S 0 3 Na20 K 2 0
Cement 30.46 10.58 4.49 46.49 2.59
Brick 73.54 14.20 5.38 1.64 1.40 0.013 0.63 2.65
Granite 73.15 13.08 2.26 2.12 0.42 0.008 3.00 3.25

measurements. For both procedures, clean and contaminated material was prepared.
2.2 Procedures
2.2.1 Contamination of the specimens
To contaminate the specimens, slices of 75 mm diameter and about 10 mm depth were contaminated with a nominally 0.05 M solution of Sr, Cs, Co, Cu, Cd and Pb that was prepared in DW with the corresponding chloride of each metal; so all the metals in the same solution. The final concentration of each metal was dependent on their interferences with the other species and was analyzed by ICP. In order to achieve reproducible contamination of the specimens, the vacuum saturation method was chosen and the procedure described in the standard ASTM CI202-97 [30] was followed with some modifications: (1) Before proceeding to the saturation, the specimens were maintained for 3 days at 40 °C. (2) Saturation was performed using the metal's solution instead of deionised water. The objective of this procedure was to replace the air that fills the pores of the materials with the solution of metals.
Once saturated the samples, metal concentration was obtained by furnace-assisted fluorhidric acid digestion and ICP spectrometry.
For the contaminated powdered samples, after contamination of the slices, they were grinded until a particle size less than 100 urn.
2.2.2 Micro-electrophoretic measurements
The micro-electrophoretic measurements were carried out with clean and contaminated powdered samples using a commercial zeta-meter. A high quality stereoscopic microscope is used to track colloidal particles inside a chamber in whose ends the electrodes are placed. Charged colloids move in the field and their velocity and direction are related to their zeta potential, that is calculated from the electrophoretic mobility of the colloids, through the Smoluchowski equation. Powder suspensions in a solid/ liquid ratio of 0.1 g:50 mL were prepared using different solutions: DW, Na2-EDTA, oxalic acid, acetic acid and citric acid, at different concentrations: 0.001, 0.01, 0.05 and 0.1 M. 10 readings of zeta potential were taken for each composition.
2.2.3 Electroosmotic measurements
Electroosmotic tests have been carried out on monoliths of these hardened samples, by using the ECD (Electroosmotic Cell Device) described in [29] and whose setup is schematically depicted in Fig. 1, in order to obtain the zeta
w
1 /^y~T/^
Voltage measurement
( A V e , , \
nsin l°
\ spiteifFen /
r Anolyte
\ 0 mpeefmeuer
Catholyte
Power supply (T^) A \ / ^ - ^
Fig. 1 Schematic setup of the ECD used for the electroosmotic tests
potential of the hardened material. The set-up of the ECD is very similar to the migration cell used by the authors to determine the diffusion coefficient of different ions through concrete by migration tests [31] with the main modification that the ECD includes two capillary tubes in order to precisely measure the flow of transported liquid.
In the ECD, a disc of the material to be tested (between 1 and 2 cm depth) was used for separating the two chambers where the solutions (catholyte and anolyte) and the electrodes (cathode and anode) were located. All the samples were contaminated with the exception of one experiment using DW in both compartments having a twin measurement with a contaminated sample.
Two meshes of activated titanium were used as electrodes and a voltage difference was applied between them, without any pH control at the electrodes. The volume of liquid in both chambers was periodically monitored, as well as the potential drop at the surface of the disc by placing two reference electrodes in contact with the surfaces. A summary of the experimental details of the tests performed is given in Table 3. Distilled water was used in the anodic compartments while the specific solutions were placed in the cathodic compartments. The exception is the case of the test with Na2C03 in the anolyte, due to the noticeable electroosmotic fluxes reported with this solution for carbonated cementitious materials [29].
Due to the different materials and solutions tested, the voltages applied have been adjusted (ranging from 12 and 75 V DC), in order to reach total current densities passed in a comparable range for the different experiments. Most of the experiments have been performed in duplicate/triplicate specimens, sometimes varying the voltage applied depending on the results of the previous experiments.

Table 3 Summary of the experimental details of the electroosmotic tests performed
Test Catholyte Anolyte Contaminated specimen? Nominal voltage applied (V)
DW-clean
DW
E
AA
OA
C
CA
Distilled water
Distilled water
Na2-EDTA 0.2 M
Acetic acid 0.2 M
Oxalic acid 0.1 M
Distilled water
Citric acid 0.2 M
Distilled water
Distilled water
Distilled water
Distilled water
Distilled water
Na2C03 1 M
Distilled water
No
Yes
Yes
Yes
Yes
Yes
Yes
55
55
25-50
75
25
12
50
The zeta potential was determined by measuring the flux of liquid transported from one compartment to the other according to Eq. 1 [14]:
4nr¡ Z = V-
qDE (1)
where | is the zeta potential, V is the liquid volume electroosmotically transported in a second, D is the dielectric constant, E is the electrical field applied, q is the transversal area for the flux of liquid and r\ is the liquid viscosity coefficient.
The value of q, transversal area, has been normalized by means of the porosity to the cross section available to the liquid to pass through. This assumes cylindrical pores in the perpendicular direction of the flux of liquid.
3 Results
3.1 Characterization of the materials
Parameters obtained by mercury intrusion porosimetry, MIP (total porosity, average pore diameter and bulk density) and BET (Brunauer, Emmett, and Teller) surface area determinations are given in Table 4. Even considering the discussion on the interpretation of results from MIP, the differences corresponding to the different materials is quite clear: As expected, total porosity of granite is clearly the smallest of the three materials, followed by the mortar and finally the brick, having both around a 20% of total porosity.
The distribution of pore sizes is given in Fig. 2, where it can be noticed that there are important differences in the
Table 4 Microstructure parameters of the three materials
Total Average pore Density porosity diameter (4 V/A) (g/cm3) (% vol.) (um)
BET specific area (m /g)
Mortar
Granite
Brick
19.28
1.15
22.78
0.059
1.087
0.552
1.95
2.55
1.92
6.56
0.14
2.38
0.009-
0.006-
0.003-
0.000-
4 j
/ s I
B—
- * -X
ft \ \
Mortar
— Granite
-Brick
1.E+03 1.E+02 1.E+01 1.E+00 1.E-01
Average pore diameter (/vm)
1.E-02
Fig. 2 Pore distribution in the three studied materials obtained by mercury intrusion porosimetry
average pore diameter. The three materials have a certain presence of pores between 100 and 200 microns. In fact, this is almost the only porosity of granite. That is why granite presents the higher average pore diameter even though their porosity is very low. The mortar exhibits the smaller average pore diameter, having mainly two different blocks of sizes of pores, centred about 2 and 0.05 um. In the case of bricks, there is only one continuous big block of size of pores, having the maximum around 5 um and extended from 0.2 to 10 um. Therefore, the average pore diameter of brick is much bigger than that of mortar.
Attending to the specific area, that of mortar is higher than those of brick and especially granite, due to the high proportion of small pores (gel pores) of mortar.
The relative pH of the aqueous phase of the samples obtained by dissolving 1 g of powdered sample in 2 mL of DW until equilibrium was 12.4, 9.2 and 7.8 for mortar, granite and brick, respectively.
3.2 Contamination of the samples
The amount of each metal in the samples has been calculated by knowing the weight of contaminating solution that has been retained, and the concentration of each metal in the solution, determined by ICP analysis. Therefore, the final amount of contamination depends on the effective

Fig. 3 Concentration of the different metals in the specimens obtained through vacuum saturation
600-
E
c CD U c o Ü
400-
200
• Mortar B Brick
*j - ^ t t
Cd Cu Co Cs Sr Pb
porosity of the samples. In Fig. 3, the average in the amount of each metal, by mass of sample, after the vacuum saturation process is presented, together with the standard deviation for a total of nine individual data.
Notice that, as expected, contamination is higher in the case of brick and much smaller in the case of granite, being the relative proportions of each metal (average value) the same for the three different materials: Cd > Sr x Cs > Cu x Co >Pb .
3.3 Micro-electrophoretic measurements
In the Figs. 4a-b, 5a-b and 6a-b, the values of zeta potential obtained in micro-electrophoretic measurements for mortar, brick and granite respectively are presented.
In each of these figures, in the figure (a), the values for the clean material in the different solutions at different concentrations are given. In the origin of the X-axis, the value in DW has also been depicted. In figure (b), the values for the contaminated material for the same electrolytes are presented.
From Figs. 4, 5, 6, it can be deduced the influence of the type of electrolyte and of the concentration, being different depending on the type of material.
So, concerning clean mortar, as a general rule it can be said that the zeta potential values are in general negatives (—12.6 mV for DW) and that using the different solutions
there is only a significant increase in the negative zeta potential values only in the cases of EDTA and Na2C03 at specific concentrations, being the most significant increase using EDTA. Specifically, two different trends can be distinguished: On one hand, oxalic acid, EDTA and sodium carbonate, exhibits more positive values of zeta potential as more diluted the solution, reaching a kind of maximum of absolute value at 0.01 M for EDTA and Na2C03 and around 0.05 M for oxalic acid. Concerning acetic and citric acids, the tendency is the contrary; the values obtained are very close to that of DW, decreasing slightly the absolute value of the zeta potential towards a limit value, attributed to the compression of the electrical double layer. Therefore, citric acid and acetic acid are not expected to enjoy a special interaction with the surface; so they seem to be "indifferent" electrolytes for the system.
In the case of contaminated mortar in general, the tendencies are similar to that of clean mortar with the changes of smaller magnitude with respect to water (—10.5 mV for DW) as reference, having more positive values. It is remarkable the case of Na2C03 whose zeta potential increase its negative value being of the same order of the EDTA solution.
For brick, the differences between contaminated and clean material are very noticeable. The zeta potential values obtained for clean brick, increase towards more negative values mainly for oxalic acid, EDTA and Na2C03,
Fig. 4 Zeta potential obtained in micro-electrophoretic measurements for mortar in different solutions (OA oxalic acid; E EDTA; C sodium carbonate; AA acetic acid; CA citric acid) at different concentrations, a Clean material and b contaminated material. In the origin of the X-axis, the value in DW
Clean Mortar Contaminated Mortar
1 0 -
o-
1 0 l
2 0 -
3 0 -
4 0 -
5 0 -
(a) 4
\ \_ 1 \ T ^ l
r 1 1 1—
- • -OA
-•-E
T ^ A A
- • -CA
DW 0.001 0.01 0.1
Concentration (mol/l)
10 ( b )
0-
-10
> JE. -20-
-30
-40-
-50 DW 0.001 0.01 0.1
Concentration (mol/l)
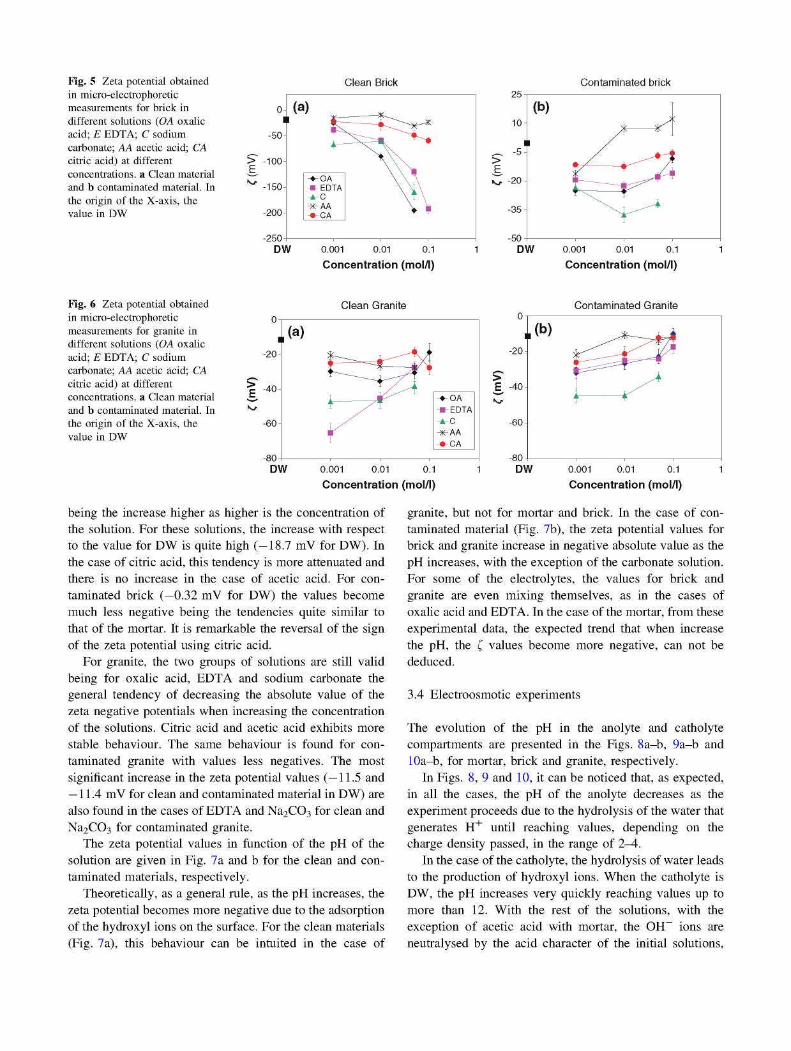
Fig. 5 Zeta potential obtained in micro-electrophoretic measurements for brick in different solutions (OA oxalic acid; E EDTA; C sodium carbonate; AA acetic acid; CA citric acid) at different concentrations, a Clean material and b contaminated material. In the origin of the X-axis, the value in DW
Clean Brick Contaminated brick
o (a)
-50
> -100-E ^ -150-
-200-
DW
- • -OA -•-EDTA -árC * A A -•-CA
0.001 0.01 0.1
Concentration (mol/l)
25
10
_ -5-
> E, ^ -20-
-35-
(b)
-50-DW 0.001 0.01 0.1
Concentration (mol/l)
Fig. 6 Zeta potential obtained in micro-electrophoretic measurements for granite in different solutions (OA oxalic acid; E EDTA; C sodium carbonate; AA acetic acid; CA citric acid) at different concentrations, a Clean material and b contaminated material. In the origin of the X-axis, the value in DW
Clean Granite Contaminated Granite
-20
-40-
-60
- 8 0 ^ DW
(a) „(»)
> E
0.001 0.01 0.1
-20
-40-
-60-
-80 J DW
Concentration (mol/l)
0.001 0.01 0.1
Concentration (mol/l)
being the increase higher as higher is the concentration of the solution. For these solutions, the increase with respect to the value for DW is quite high (—18.7 mV for DW). In the case of citric acid, this tendency is more attenuated and there is no increase in the case of acetic acid. For contaminated brick (—0.32 mV for DW) the values become much less negative being the tendencies quite similar to that of the mortar. It is remarkable the reversal of the sign of the zeta potential using citric acid.
For granite, the two groups of solutions are still valid being for oxalic acid, EDTA and sodium carbonate the general tendency of decreasing the absolute value of the zeta negative potentials when increasing the concentration of the solutions. Citric acid and acetic acid exhibits more stable behaviour. The same behaviour is found for contaminated granite with values less negatives. The most significant increase in the zeta potential values (— 11.5 and — 11.4 mV for clean and contaminated material in DW) are also found in the cases of EDTA and Na2C03 for clean and Na2C03 for contaminated granite.
The zeta potential values in function of the pH of the solution are given in Fig. 7a and b for the clean and contaminated materials, respectively.
Theoretically, as a general rule, as the pH increases, the zeta potential becomes more negative due to the adsorption of the hydroxyl ions on the surface. For the clean materials (Fig. 7a), this behaviour can be intuited in the case of
granite, but not for mortar and brick. In the case of contaminated material (Fig. 7b), the zeta potential values for brick and granite increase in negative absolute value as the pH increases, with the exception of the carbonate solution. For some of the electrolytes, the values for brick and granite are even mixing themselves, as in the cases of oxalic acid and EDTA. In the case of the mortar, from these experimental data, the expected trend that when increase the pH, the £ values become more negative, can not be deduced.
3.4 Electroosmotic experiments
The evolution of the pH in the anolyte and catholyte compartments are presented in the Figs. 8a-b, 9a-b and lOa-b, for mortar, brick and granite, respectively.
In Figs. 8, 9 and 10, it can be noticed that, as expected, in all the cases, the pH of the anolyte decreases as the experiment proceeds due to the hydrolysis of the water that generates H+ until reaching values, depending on the charge density passed, in the range of 2-4.
In the case of the catholyte, the hydrolysis of water leads to the production of hydroxyl ions. When the catholyte is DW, the pH increases very quickly reaching values up to more than 12. With the rest of the solutions, with the exception of acetic acid with mortar, the OH~ ions are neutralysed by the acid character of the initial solutions,

Fig. 7 Zeta potential values in function of the pH of the solution for the a clean material and b contaminated materials (OA oxalic acid; E EDTA; C sodium carbonate; AA acetic acid; CA citric acid)
0-
-50-
" • -100
-150
-200
(a)
* 1 o • o •
0
c
o n
4&
A A
A
Clean material
• OA-Mortar BE-Mortar AC-Mortar XAA-Mortar •CA-Mortar
>OA-Brick DE-Brick AC-Brick XAA-Brick OCA-Brick
>OA-Granite DE-Granite AC-Granite +AA-Granite OCA-Granite
> E. **r
10 -
0 -
-10 -
-90 -
-30 -
-40 -
(b) x
* x
•
°o
°-«^x
o *@ D
• • a •
o
Contamined material
•
• X •
• A
á.
á.
A A
A i i
10 12 14 0 2 4 6 10 12 14
PH PH
Fig. 8 Evolution of the pH in the a anolyte and b catholyte during the electroosmotic experiments with contaminated mortar in different solutions (DW-clean distilled water-clean material; DW distilled water; OA oxalic acid; E EDTA; AA acetic acid; CA citric acid)
(b)
0E+00 3E+06
C h a r g e dens i t y p a s s e d ( C / m
6E+06 2 N
13-
10-
i 71
4 -
1 -
P ^/.
•
7jr-
— • — =•=
Catholyte
—• —•
0E+00 3E+06
C h a r g e dens i t y p a s s e d (C/m'
6E+06 2,
Fig. 9 Evolution of the pH in the a anolyte and b catholyte during the electroosmotic experiments with contaminated brick in different solutions (DW-clean distilled water-clean material; DW distilled water; OA oxalic acid; E EDTA; AA acetic acid; CA citric acid)
0.E+00 3.E+06
Charge density passed (C/m
6.E+06 0.E+00 2>
3.E+06
Charge density passed (C/m
6.E+06 2,
Fig. 10 Evolution of the pH in the a anolyte and b catholyte during the electroosmotic experiments with contaminated granite in different solutions (DW-clean distilled water-clean material; DW distilled water; OA oxalic acid; E EDTA; AA acetic acid; CA citric acid)
(a)
i Q.
II
- 1 Anolyte
- > l^**iP* l e _
- * - DW-clean + DW -•-OA + E -*-AA -• -CA
(b)
i Q.
0E+00 2E+05
Charge densi ty passed (C/m
4E+05 2>
r Catholyte
i&x-Mtfc*—*—*-
Z¿^+ = 0E+00 2E+05
Charge density passed (C/m
4E+05 2%

50 100
Time (h)
150
Fig. 11 Evolution of the intensity of current measured for the experiment with DW in contaminated mortar
remaining more or less table at a pH close to that of the initial solution. From more to less acidic: oxalic acid, citric acid, acetic acid and EDTA.
In Fig. 11, as an example, the evolution of the intensity of current for the experiment with DW in contaminated mortar is presented. From Fig. 11, it can be noticed that, as the electroosmotic experiments go on, there are certain points in which there is a sudden increase in the circulating current. This increase has been attributed to the establishment of the electroosmotic flux [27, 28]. It is worth pointing out that, from the picture of intensity, the establishment of electroosmotic flux can be detected but the calculation of the zeta potential has to be made from the values of transported flux.
The accumulated electroosmotic flux, for the three materials with the different solutions is presented in Fig. 12a-c for mortar, granite and brick respectively. In Fig. 12d, a detail of the picture for brick at lower values of the Y-axis has been depicted.
From Fig. 12, it can be noticed that for the three materials, using DW as electrolyte, when they are not contaminated, even the fluxes measured very small (in the cases of mortar and granite), they are detectable. In the case of brick and granite they goes towards the catholyte, what means that the surface charge of the materials is negative. In the case of mortar, it tends to the anolyte. When the materials are contaminated, the values of the surface charge become more positive, leading in the cases of brick to positive values of the zeta potential. Apart from these cases with water, the only flux detected towards the positive chamber has been in the case of mortar using acetic acid as electrolyte.
As a general trend, it can be said that for the three materials, the maximum amount of liquid collected was in the case of citric acid. No EOF was detected with sodium carbonate, for mortar and granite, and very small one in the case of brick.
From the measured flux, and considering in each moment the effective potential measured between the two sides of the specimen, the differential zeta potential values have been calculated trough the different experiments. The values obtained have been presented in Fig. 13, where it can be seen that in some cases, the zeta potential values obtained do not seem to correlate with the electroosmotic
Fig. 12 Accumulated electroosmotic flux volumes for the three materials with the different solutions for a mortar, b granite and c-d brick. Flux from the anolyte towards the catholyte has been given positive values and towards the anolyte negative values (DW-clean distilled water-clean material; DW distilled water; OA oxalic acid; E EDTA; AA acetic acid; CA citric acid; C sodium carbonate)
(a) 30
20
1 1° u_ 0 O LU - 1 0
-20 H
-30
• flux 1 towards 1 cathode
1 flux - 1 towards
^ anode Mortar
1
(b)
o LU
0E+00 3E+06 6E+06
Charge density (C/m2)
200-
100
3E+05 6E+05
Charge density (C/m2)
0E+00 3E+06 6E+06
Charge density (C/m2)
0E+00 3E+06 6E+06
Charge density (C/m2)
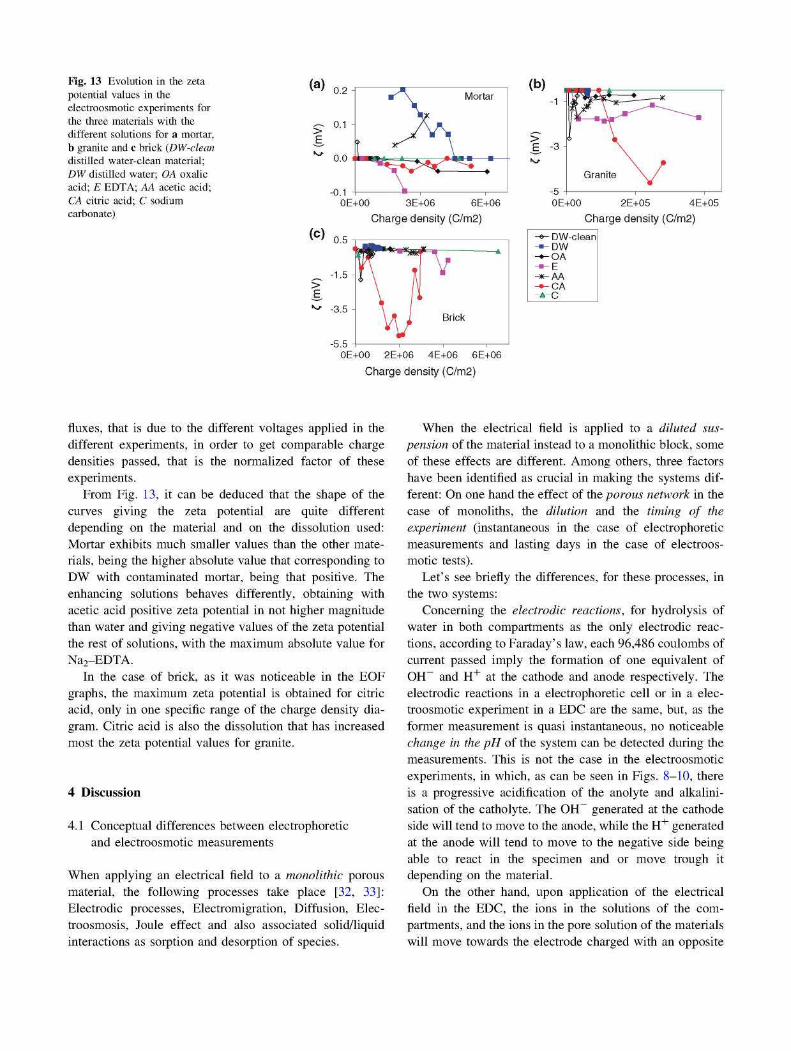
Fig. 13 Evolution in the zeta potential values in the electroosmotic experiments for the three materials with the different solutions for a mortar, b granite and c brick (DW-clean distilled water-clean material; DW distilled water; OA oxalic acid; E EDTA; AA acetic acid; CA citric acid; C sodium carbonate)
OE+00 3E+06 6E+06 Charge density (C/m2)
(C> 0.5
OE+00 2E+06 4E+06 6E+06
Charge density (C/m2)
2E+05 4E+05 Charge density (C/m2)
fluxes, that is due to the different voltages applied in the different experiments, in order to get comparable charge densities passed, that is the normalized factor of these experiments.
From Fig. 13, it can be deduced that the shape of the curves giving the zeta potential are quite different depending on the material and on the dissolution used: Mortar exhibits much smaller values than the other materials, being the higher absolute value that corresponding to DW with contaminated mortar, being that positive. The enhancing solutions behaves differently, obtaining with acetic acid positive zeta potential in not higher magnitude than water and giving negative values of the zeta potential the rest of solutions, with the maximum absolute value for Na2-EDTA.
In the case of brick, as it was noticeable in the EOF graphs, the maximum zeta potential is obtained for citric acid, only in one specific range of the charge density diagram. Citric acid is also the dissolution that has increased most the zeta potential values for granite.
4 Discussion
4.1 Conceptual differences between electrophoretic and electroosmotic measurements
When applying an electrical field to a monolithic porous material, the following processes take place [32, 33]: Electrodic processes, Electromigration, Diffusion, Elec-troosmosis, Joule effect and also associated solid/liquid interactions as sorption and desorption of species.
When the electrical field is applied to a diluted suspension of the material instead to a monolithic block, some of these effects are different. Among others, three factors have been identified as crucial in making the systems different: On one hand the effect of the porous network in the case of monoliths, the dilution and the timing of the experiment (instantaneous in the case of electrophoretic measurements and lasting days in the case of electroosmotic tests).
Let's see briefly the differences, for these processes, in the two systems:
Concerning the electrodic reactions, for hydrolysis of water in both compartments as the only electrodic reactions, according to Faraday's law, each 96,486 coulombs of current passed imply the formation of one equivalent of OH~ and H+ at the cathode and anode respectively. The electrodic reactions in a electrophoretic cell or in a electroosmotic experiment in a EDC are the same, but, as the former measurement is quasi instantaneous, no noticeable change in the pH of the system can be detected during the measurements. This is not the case in the electroosmotic experiments, in which, as can be seen in Figs. 8-10, there is a progressive acidification of the anolyte and alkalini-sation of the catholyte. The OH~ generated at the cathode side will tend to move to the anode, while the H+ generated at the anode will tend to move to the negative side being able to react in the specimen and or move trough it depending on the material.
On the other hand, upon application of the electrical field in the EDC, the ions in the solutions of the compartments, and the ions in the pore solution of the materials will move towards the electrode charged with an opposite
sign to that each ion exhibits, traversing the monolith material, in order to carry the electricity passing through the cell. This phenomenon is known as electromigration. Thus, every ion takes part in the migration process in a proportion known as their "transport or transference number". Additionally, diffusion will take place simultaneously to the electromigration movement and the final result will depend on the relative importance of both movements (voltage drop applied). At the voltage usually applied in the remediation treatments, diffusion can be completely neglected.
Concerning the electrokinetic effects, it has been explained previously so, here, just to point out again that Electro-osmosis is the electrokinetic effect that takes place when the solid remains stationary and the liquid moves in response to the applied electrical field, and that electrophoresis, that is produced, when the particles are induced to move by the effect of the electric field across the system. In both cases, the direction of the flux of water will depend on the sign of the charged walls of the pores.
Finally, the Joule effect is defined as the increase in heat resulting from the passage of a current through a conductor. It is expressed in terms of intensity of current or in terms of the voltage across the resistor and it is proportional to the time of application of the current. Concerning this effect, again due to the differences in timing, even though the intensity passing through the cell is much higher than in the case of electroosmotic measurements, the total heat generated in the electrophoretic cell are much smaller.
Therefore, as a consequence of all these processes, there are changes in the concentration of every species in the aqueous phase of pores of the material continuously, what imply the alteration of the solid/liquid equilibrium in the pores leading to the possible modification of the micro-structure with dissolution and/or precipitation, adsorption/ desorption of phases already present in the matrix or to the formation and precipitation of new ones, with the corresponding change in the zeta potential. These alterations must be different in the two studied systems, and for the same system, different in function of the material and electrolyte.
4.2 Zeta potential in the different systems
In order to understand the processes involved in the changes in the surface charge of the different materials in different media, it is important to know the composition and structure of the materials:
Cement paste is a random composite material, made up of anhydrous cement, capillary pores, and various other chemical phases that are a result of the hydration reactions between water and cement [34]. The main reaction product phase is an amorphous or at best poorly crystalline calcium
silicate hydrate gel, produced via a hydration reaction and denoted C-S-H. Other important phase is Portlandite, Ca(OH)2, that conforms about a 20% of the solid phases of the cement paste. The aqueous solution of the porous network of cementitious materials is a highly alkaline liquid rich in Na+, K+, OH~ and saturated in Ca + , in equilibrium with the precipitated Portlandite.
Concerning brick, its main ingredient is clay, silicates hydrated of aluminium. In the firing process clay minerals break down, release chemically bound water and change into a mixture of mainly quartz and mullite (3AIO3 • 2SÍO2), containing the impurities and substitutions of the original clay, mainly Fe and Mg.
Granite, it is a rock constituted essentially by quartz, feldspar and mica. In the granite used in this research, the feldspar is essentially plagioclases, and more specifically albite (sodium aluminosihcate, NaAlSiaOg, with less of 10% of Ca or K substituting the Na in the crystal network. The mica is or the type Biotite, that is a filosilicate of Fe and Mg (Mg,Fe)3 (Al,Fe) Si3O10 (OH,F)2.
Additionally, the theoretical affinity of each metal (contaminants and constitutive of the materials) to bound to the enhancing electrolytes, that is to say, the relevant constants of the quelation equilibriums (log p) and that of precipitation (pKs) for the different solutions and metals involved in these processes are also very important to know in order to deduce the behaviour of each specie in every system. They are given in Table 5 [35].
In the electrophoretic measurements with clean mortar in DW, negative values of zeta potential has been obtained, even though in literature positive values have been reported [12, 23, 29]. This difference has been attributed to the dilution effect. When making a suspension of the mortar powders in water, precipitated Ca(OH)2 is dissolved and therefore, Ca ions are desorbed from the sites in the CSH, leading to negative values of the zeta potential, in accordance with [23]. Concerning the effect of different solutions as enhancing electrolytes, as said, in general two groups can be identified (On one hand EDTA, oxalic acid and Na2C03 and on the other hand acetic and citric acid) whose differences can not be attributed to pH differences, as can be seen in Fig. 6. The behaviour of the former group, increasing the negative charge of the matrix, as the concentration of the solution increases, is attributed to increasing the desorption of positively charged species, Ca2+, by quelation or complexation of them and so, removing them to the solution as soluble species, or by formation of insoluble Ca-species that remove it from the solution by precipitation and induces again the desorption of more Ca. In fact, Ca + is very easily complexed by EDTA (Ca2+/Y4~; log ft = 11.0) and it is also very favourable to the formation of insoluble calcium oxalate and calcium carbonate (pKs of 8.7 and 8.4, respectively)—see Table 5.

Table 5 Constants of quelation equilibriums (log ¡5) and of precipitation (pKs) for the different solutions and metals (constitutive and contaminants) involved in the processes [35]
Ca (II) Al (III) Mg (II) Fe (III) Cs (I) Sr (II) Co (II) Cu (II) Cd (II) Pb (II)
EDTA Me/Y4" Me/cit4~
Me/Hcit3-
Me/H2cit2~
Me/H3cit~
Me/C2042~
Me/CH3COO" Me(OH)xj
Me(C204)xi
Me(C03)xi
Log ft Log ft
Log ft/#
Log ft/.. pKs
pKs
pKs
iHh
11.0
4.8
3.3
1.1
3.0
5.0
8.7
8.4
15.5
7.2/12.0/13.3
33.5
8.7
3.2
11.1
4.1
5.0
25.1
25.0
11.9
6.3
_/_/18.0
37.0
15.9
2.7
2.5
3.4
7.2
9.0
15.4
5.4
12.1
17.8
14.2
6.2/10.2
2.2
18.8
7.5
9.6
16.1
4.3
4.0
14.4
7.8
13.7
18.3
6.5
5.7
1.8/2.0/2.0/1.9
14.4
10.5
13.5
The change of tendency at higher concentrations is attributed to the compression of the electrical double layer due to the increase in the ionic strength.
On the contrary, for acetic and citric acids, the tendency is different; they seem to be indifferent electrolytes for the system obtaining values very close to that of DW. In fact, citric acid can form complexes with Ca, but less strong than that of EDTA (Ca2+/Hcit3-/H2cit2-/H3cir; log /?! — 4.8/3.3/1.1) and at the dilution of the system, the complexes, if formed, do not seem to affect the remaining Ca absorbed. Acetic acid forms soluble salts with Calcium.
In the case of contaminated mortar, the behaviour is quite similar to that of the clean material, tending to more positive values, due to the fact that the behaviour of most metals can be considered as equivalent to that of Ca in their binding with the anions of the enhancing solutions (see Table 5).
In the behaviour of brick in the electrophoretic cell, it is remarkable the big difference between the clean and contaminated material. There is a very big increase in the negative value of the zeta potential due to the effect of EDTA, oxalic acid and Na2C03, that in this case has been attributed to the quelation/removal of constitutive species of the material, as could be Al, Fe or Mg. (see the high values for log p\ for complexation of Al and Fe). The specificity in the adsorption can be corroborated in Fig. 10, where the pH seems not to be a determining factor. In the case of contaminated specimens, the electrolytes are reacting with the contaminant metals, more labile bound to the matrix, and therefore, the availability to act on the fixed elements is smaller and the behaviour found is very similar to that of mortar with the exception of the reversal of the sign of the zeta potential with acetic acid, that might be due to secondary adsorption of positive complex, for example of PbCOOH+.
Concerning granite, only EDTA at diluted concentrations seems to be strong enough to remove positive ions
from the matrix, and from Fig. 10, it seems that the determining ions to the zeta potential are the H+ and OH~, as it seems to be pH dependent. Contamination of the material, by removal of the metals, homogenize the behaviour with that of the other materials.
When performing the electroosmotic experiments, noticeable differences in behaviour with respect to the electrophoretic measurements are observed:
Concerning mortar, data in literature obtained by zeta potential measurements with powdered CSH in dilute solutions, established the Ca2+ ions as potential determining ions for the CSH surface [20-23]. In fact, they established that at low concentrations of Ca in solution, the zeta potential is negative, and at higher Ca + content, the zeta potential values become positive, with a point of zero charge of 2 mmol/L [23]. This is in agreement with the results obtained here, as in the electroosmotic test with mortar, with hardened samples having their own calcium saturated pore solution, the zeta potential values in DW, are positive due to the adsorption of Ca ions on the negative sites of CSH. As expected the values are higher with the contaminated sample, as most of the metals are precipitated/adsorbed at the alkaline pH of the aqueous phase.
Concerning the different electrolytes, all the tested solutions (with the exception of sodium carbonate for which no flux was detected, and acetic acid that gives also positive sign due to the lack of binding with the metals either constituents or contaminants) reverse the sign of the £, obtaining fluxes towards the catholyte and therefore negative surface charge of the walls of the pores in the matrix.
In this system, the quelant agents seem to be most effective than the precipitating ones, as here, precipitation takes place in the pores of the matrix while in the electrophoretic system, precipitation took place in the cell, removing Ca even more efficiently than quelants. Therefore, citric acid, that was not so effective in electrophoresis,
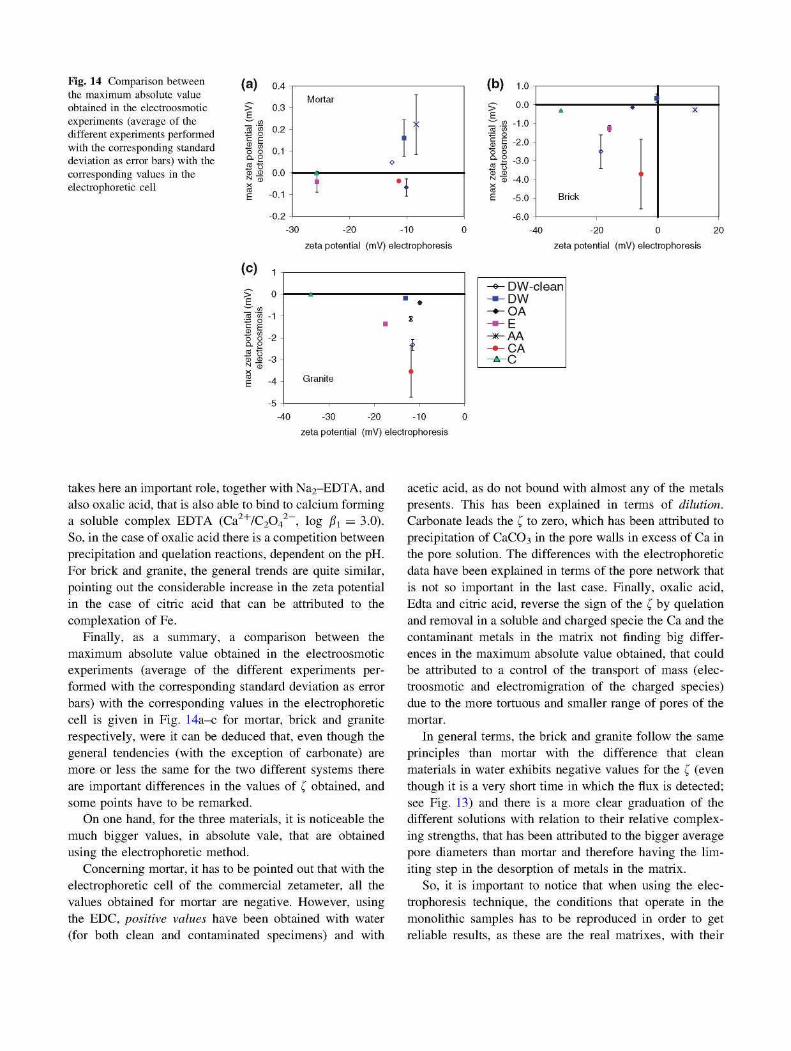
Fig. 14 Comparison between the maximum absolute value obtained in the electroosmotic experiments (average of the different experiments performed with the corresponding standard deviation as error bars) with the corresponding values in the electrophoretic cell
(a)
II 0 03 N "J
(C)
0.3 -
0.2 -
0.1 -
0.0 -
0.1 -
0? -
Mortar
> : ii
o
i \
(b) i.o
-30 -20 -10 0
zeta potential (mV) electrophoresis
0 -
1 -
2 -
3 -
4 -
ñ -
Granite
• .
. *
f o
•I
-40 -30 -20 -10 0
zeta potential (mV) electrophoresis
l§
0.0
-1.0 -
-2.0 -
| -3.0
I -4.0 Ji
-5.0 -
-6.0
I A
~
-1
o
Brick
i>
X
-40 -20 0 20
zeta potential (mV) electrophoresis
takes here an important role, together with Na2-EDTA, and also oxalic acid, that is also able to bind to calcium forming a soluble complex EDTA (Ca2+/C204
2", log ft = 3.0). So, in the case of oxalic acid there is a competition between precipitation and quelation reactions, dependent on the pH. For brick and granite, the general trends are quite similar, pointing out the considerable increase in the zeta potential in the case of citric acid that can be attributed to the complexation of Fe.
Finally, as a summary, a comparison between the maximum absolute value obtained in the electroosmotic experiments (average of the different experiments performed with the corresponding standard deviation as error bars) with the corresponding values in the electrophoretic cell is given in Fig. 14a-c for mortar, brick and granite respectively, were it can be deduced that, even though the general tendencies (with the exception of carbonate) are more or less the same for the two different systems there are important differences in the values of £ obtained, and some points have to be remarked.
On one hand, for the three materials, it is noticeable the much bigger values, in absolute vale, that are obtained using the electrophoretic method.
Concerning mortar, it has to be pointed out that with the electrophoretic cell of the commercial zetameter, all the values obtained for mortar are negative. However, using the EDC, positive values have been obtained with water (for both clean and contaminated specimens) and with
acetic acid, as do not bound with almost any of the metals presents. This has been explained in terms of dilution. Carbonate leads the £ to zero, which has been attributed to precipitation of CaCÜ3 in the pore walls in excess of Ca in the pore solution. The differences with the electrophoretic data have been explained in terms of the pore network that is not so important in the last case. Finally, oxalic acid, Edta and citric acid, reverse the sign of the £ by quelation and removal in a soluble and charged specie the Ca and the contaminant metals in the matrix not finding big differences in the maximum absolute value obtained, that could be attributed to a control of the transport of mass (electroosmotic and electromigration of the charged species) due to the more tortuous and smaller range of pores of the mortar.
In general terms, the brick and granite follow the same principles than mortar with the difference that clean materials in water exhibits negative values for the £ (even though it is a very short time in which the flux is detected; see Fig. 13) and there is a more clear graduation of the different solutions with relation to their relative complex-ing strengths, that has been attributed to the bigger average pore diameters than mortar and therefore having the limiting step in the desorption of metals in the matrix.
So, it is important to notice that when using the electrophoresis technique, the conditions that operate in the monolithic samples has to be reproduced in order to get reliable results, as these are the real matrixes, with their
concentrated and specific pore solution, where the phenomena that need to be understood take place.
5 Conclusions
Micro-electrophoretic and electroosmotic experiments, with monolithic and powdered material respectively, for mortar, brick and granite clean and contaminated with Cs, Sr, Co, Cd, Cu and Pb, using several enhancing electrolytes has allowed to obtain the following conclusions:
• The contamination of a construction material with heavy metals can change their zeta potential causing even a reversal of the sign towards positive values. This difference depends on the type of contaminants and on the construction material.
• The remediation treatment of contamined construction materials can be improved by the addition of specific electrolytes enhancing the electrokinetic phenomena.
• Even though the electrophoresis technique is very useful in order to establish the basic features of the processes, there can be important differences in the values obtained in suspensions by electrophoresis and those obtained by electroosmosis in monolithic samples which are mainly related to the porous network in the case of monoliths, the dilution and the timing of the experiment (instantaneous in the case of electrophoretic measurements and lasting days in the case of electro-osmotic tests).
• This effects could be so important that both the sign and the absolute value of the zeta potential can be different depending on the technique used.
• The increases in the absolute values of the zeta potential are much more attenuated in the case of monolithic samples in electroosmotic experiments.
• The optimum enhancing solution (leading to the highest absolute values of zeta potential) found for each material might not be the same for both techniques: Precipitation agents, as C 0 3 2 - , seem to be very effective in the case of electrophoresis. However, if precipitation takes place in the pores, the £ can be very close to zero. In electroosmotic experiments, chelating agents seem to be more effective.
• In general, citric acid has resulted to be the most effective increasing the £ towards negative values for the three materials.
• When using the electrophoresis technique, the conditions that operate in the monolithic samples has to be reproduced as possible in order to get reliable results, as these are the real matrixes, with their concentrated and specific pore solution, where the phenomena that need to be understood take place.
References
1. Townsend T, Tolaymat T, Leo K, Jambeck J (2004) Sci Total Environ 332:1
2. Perry PM, Pavlik JW, Sheets RW, Biagioni RN (2005) Sci Total Environ 226:275
3. Morillon C, Pilot G (1989) Decontamination of concrete by surface melting with a novel plasma-jet burner. Feasibility study. Commun Eur Communities [Rep.] EUR (1989) (EUR 12489), 55 pp
4. Cornelissen HAW, Van Hulst LPDM (1990) Kema Sci Tech Rep 8:345
5. Cornelissen HAW, Van Hulst LPDM (1990) Kema Sci Tech Rep 8:359
6. Krause TR, Helt JE (1993) Ceram Trans 36:53-59 7. Hamilton MA, Rogers RD, Nelson LO, Holmes RG, Milner TN
(1998) Biodecontamination: cost-benefit analysis of novel approach for decontamination of massive concrete structures. ImechE conference transactions (Nuclear Decommissioning '98), pp 123-130
8. Sugimoto J, Soda A, Yoshizaki Y (1995) Dekomisshoningu Giho 13:13
9. DePaoli DW, Harris MT, Morgan IL, Ally MR (1997) Sep Sci Technol 32:387
10. Castellote M, Andrade C, Alonso C (2002) Environ Sci Technol 36:2256
11. Popov K, Glazkova I, Myagkov S, Petrov A (2006) Russ Colloid J 68:743
12. Popov K, Glazkova I, Myagkov S, Petrov A, Sedykh E, Bannykh L, Yachmenev V (2007) Colloids Surf A 299:198
13. Popov K, Glazkova I, Yachmenev V, Nikolayev A (2008) Environ Pollut 153:22
14. Hunter RJ (1981) Zeta potential in colloid science. Principles and applications. Academic Press Limited, London
15. Nágele E (1985) Cem Concr Res 15:453 16. Nágele E (1986) Cem Concr Res 16:853 17. Nágele E (1987) Cem Concr Res 17(4):573 18. Nágele E (1989) Chem Eng Sci 44(8): 1637 19. Chatterji S, Kawamura M (1992) Cem Concr Res 22:774 20. Banfill PFG (1994) Features of the mechanism of realkalisation
and desalination treatments for reinforced concrete. In: Proceedings of the international conference on 'corrosion and protection of steel in concrete', 24-28 July, Sheffield
21. Yang M, Neubauer CM, Jennings HM (1997) Adv Cem Based Mater 5:1
22. Nachbaur L, Nkinamubanzi P, Nonat A, Mutin JC (1998) J Colloid Interface Sci 202:261
23. Viallis-Terrisse H, Nonat A, Petit JC (2001) J Colloid Interface Sci 244:58
24. Labbez C, Nonat A, Pochard I, Jonsson B (2007) J Colloid Interface Sci 309:303
25. Flatt RJ, Ferraris CF (2002) Mater Struct 35:541 26. Andrade C, Castellote M, Sarria J, Alonso C (1999) Mater Struct
32:427 27. Castellote M, Llórente I, Andrade C, Turrillas X, Alonso C,
Campo J (2006) Cem Concr Res 36:791 28. Castellote M, Llórente I, Andrade C (2003) Mater Constr
53(271-272): 101 29. Castellote M, Llórente I, Andrade C (2006) Cem Concr Res
36:1915 30. ASTM C 1202 - 97, Standard test method for electrical indication
of concrete's ability to resist chloride ion penetration 31. Andrade C (1993) Cem Concr Res 23(3):724 32. Bard AJ, Faulkner LR (1980) Electrochemical methods. Funda
mentals and applications. Wiley, Hoboken

33. Newman JS (1991) Electrochemical systems. Prentice Hall, Englewood Cliffs
34. Taylor HFW (1990) Cement chemistry. Academic Press, San Diego
35. Burriel F, Lucena F, Arribas S, Hernández J (1989) Química analítica cualitativa. Publicaciones Madrid, Editorial Paraninfo, Madrid 1952. ISBN, 978-84-9732-140-2