assessment of eeg signal quality in motion environments
TRANSCRIPT

Assessment of EEG Signal Quality in Motion Environments
by Scott E. Kerick, Kelvin S. Oie, and Kaleb McDowell
ARL-TR-4866 June 2009
Approved for public release; distribution is unlimited.

NOTICES
Disclaimers The findings in this report are not to be construed as an official Department of the Army position unless so designated by other authorized documents. Citation of manufacturer’s or trade names does not constitute an official endorsement or approval of the use thereof. Destroy this report when it is no longer needed. Do not return it to the originator.

Army Research Laboratory Aberdeen Proving Ground, MD 21005-5425
ARL-TR-4866 June 2009
Assessment of EEG Signal Quality in Motion Environments
Scott E. Kerick, Kelvin S. Oie, and Kaleb McDowell
Human Research and Engineering Directorate, ARL Approved for public release; distribution is unlimited.

ii
REPORT DOCUMENTATION PAGE Form Approved OMB No. 0704-0188
Public reporting burden for this collection of information is estimated to average 1 hour per response, including the time for reviewing instructions, searching existing data sources, gathering and maintaining the data needed, and completing and reviewing the collection information. Send comments regarding this burden estimate or any other aspect of this collection of information, including suggestions for reducing the burden, to Department of Defense, Washington Headquarters Services, Directorate for Information Operations and Reports (0704-0188), 1215 Jefferson Davis Highway, Suite 1204, Arlington, VA 22202-4302. Respondents should be aware that notwithstanding any other provision of law, no person shall be subject to any penalty for failing to comply with a collection of information if it does not display a currently valid OMB control number. PLEASE DO NOT RETURN YOUR FORM TO THE ABOVE ADDRESS.
1. REPORT DATE (DD-MM-YYYY)
June 2009 2. REPORT TYPE
Final 3. DATES COVERED (From - To)
November 2005–December 2005 4. TITLE AND SUBTITLE
Assessment of EEG Signal Quality in Motion Environments 5a. CONTRACT NUMBER
5b. GRANT NUMBER
5c. PROGRAM ELEMENT NUMBER
6. AUTHOR(S)
Scott E. Kerick, Kelvin S. Oie, and Kaleb McDowell 5d. PROJECT NUMBER
6110274A 5e. TASK NUMBER
5f. WORK UNIT NUMBER
7. PERFORMING ORGANIZATION NAME(S) AND ADDRESS(ES)
U.S. Army Research Laboratory ATTN: AMSRD-ARL-HR-SB Aberdeen Proving Ground, MD 21005-5425
8. PERFORMING ORGANIZATION REPORT NUMBER
ARL-TR-4866
9. SPONSORING/MONITORING AGENCY NAME(S) AND ADDRESS(ES)
10. SPONSOR/MONITOR’S ACRONYM(S)
11. SPONSOR/MONITOR'S REPORT NUMBER(S)
12. DISTRIBUTION/AVAILABILITY STATEMENT
Approved for public release; distribution is unlimited.
13. SUPPLEMENTARY NOTES
14. ABSTRACT
Assessing the neurocognitive demands of humans operating in real-world environments is critical for understanding Soldier performance. However, the capability to reliably measure brain dynamics of Soldiers in operational environments is a major challenge because of inherent artifacts in real environments. This study quantified the integrity of electroencephalographic (EEG) signals as a function of varied motion artifacts that are characteristic of realistic environments. Participants performed a standard auditory discrimination task in three ambulatory and three vehicle motion environments. Classic event-related potential (ERP) waveforms were observed as evidenced by higher amplitude P300s to target vs. non-target stimuli and increasing amplitudes from frontal to parietal midline recording sites in some conditions. However, artifacts in other conditions resulted in significant data loss and contamination that prevented analysis of ERP data. Spectral analyses were also applied to characterize the nature and extent of artifacts present in each condition, showing that induced signal artifacts were generally related to the specific motion environments. In conclusion, our results suggest that EEG can be reliably recorded in certain operational environments such as driving on paved or washboard surfaces, but advanced technologies and artifact reduction algorithms are required to improve signal reliability in ambulatory and more extensive vehicle motion environments. 15. SUBJECT TERMS
EEG, driving, ambulatory, artifact, event-related potential (ERP), ride motion simulator, spectral analysis
16. SECURITY CLASSIFICATION OF: 17. LIMITATION OF ABSTRACT
UU
18. NUMBER OF PAGES
36
19a. NAME OF RESPONSIBLE PERSON
Scott E. Kerick a. REPORT
Unclassified b. ABSTRACT
Unclassified c. THIS PAGE
Unclassified 19b. TELEPHONE NUMBER (Include area code)
410-278-5833 Standard Form 298 (Rev. 8/98)
Prescribed by ANSI Std. Z39.18
iii
Contents
List of Figures v
Acknowledgments vi
1. Introduction 1
2. Methods & Procedures 3
2.1 Participants ......................................................................................................................3
2.2 Apparatus.........................................................................................................................3
2.2.1 Motion Environments ............................................................................................3
2.2.2 Electroencephalography ........................................................................................3
2.2.3 Auditory Discrimination Task ...............................................................................5
2.3 Procedures .......................................................................................................................5
2.4 Data Reduction ................................................................................................................6
2.5 Design ..............................................................................................................................6
2.6 Statistical Analysis ..........................................................................................................6
2.6.1 Percentage of Acceptable Trials ............................................................................6
2.6.2 Confirmation of ERP Waveforms .........................................................................7
2.6.3 P300 Amplitude of Confirmed ERPs ....................................................................8
2.6.4 EEG Spectral Power ..............................................................................................8
2.6.5 Behavioral Measures .............................................................................................9
3. Results 9
3.1 Percentage of Acceptable Trials ......................................................................................9
3.2 Confirmation of ERP Waveforms ...................................................................................9
3.3 P300 Amplitude of Confirmed ERPs ............................................................................10
3.4 EEG Spectral Power ......................................................................................................12
3.5 Behavioral Measures .....................................................................................................12
4. Discussion 12
5. Conclusions 18

iv
6. Recommendations 18
7. References 20
List of Symbols, Abbreviations, and Acronyms 23
Distribution List 24

v
List of Figures
Figure 1. The MOOG 6-DOF RMS. ...............................................................................................4
Figure 2. BioSemi multi-channel, biopotential measurement system used to acquire EEG data. ...................................................................................................................................4
Figure 3. EEG data exemplars. EEG data at Cz from a single participant in each of the six environments after initial signal pre-processing (i.e., band pass filtering and eye-blink reduction). ..................................................................................................................7
Figure 4. Exemplar ERP waveforms. ERP data at Cz (thin lines) from a single participant over five of the six environments.............................................................................................10
Figure 5. Group-averaged waveforms. Group-averaged ERP data at Cz in each of the six environments. .....................................................................................................................11
Figure 6. Mean (geometric) spectral power at Cz across all participants for riding (a–c; sitting, washboard, cross-country, respectively) and ambulatory (f–h; standing, walking, jogging, respectively) conditions. Spectral power of the total acceleration of the RMS motion profiles is shown for the washboard (d) and cross-country (e) conditions. .......13
Figure 7. Spectral power in frequency bands by environmental condition. Spectral power in (a) delta, (b) theta, (c) alpha, (d) beta I, and (e) beta II frequency bands by environmental condition. Asterisks indicate significant differences from the sitting control condition (p < 0.05). See legend for environmental condition labels. ....................................................14

vi
Acknowledgments
The authors would like to thank the U.S. Army Aberdeen Test Center (ATC) and Honeywell International, Inc. for assistance in the completion of this project, as well as the following individuals: David Chandler, Aaron Johnson, John Filippi, and Gerald Hinkle of ATC and Charlotte Bernard of the U.S. Army Research Laboratory. We dedicate this paper to the memory of Patrick Nunez of the U.S. Army Tank Automotive Research, Development, and Engineering Center whose support was critical to the success of our program.

1
1. Introduction
The field of cognitive neuroscience has become increasingly important for establishing the scientific foundations and principles of brain function associated with human performance. Functional brain imaging and neurophysiology methods (e.g., electroencephalography [EEG], functional magnetic resonance imaging [fMRI], functional near-infrared spectroscopy [fNIR], magnetoencephalography [MEG], and positron emission tomography [PET]) enable the study of cognitive and sensorimotor functions of the human brain across a wide range of behaviors. The application of these methods in experimental inquiry has been predominantly conducted within highly constrained tasks in artificial laboratory environments where strict control of conditions can be maintained. However, we live in a complex, dynamic world and assessing the cognitive demands of human operators during the performance of real-world tasks in real-world environments is critical for understanding how we really behave (Gevins et al., 1995). Additionally, extending research to more ecologically valid task environments is necessary to advance generalizability of inferences drawn from laboratory research to more naturalistic behaviors. The question is how can this be accomplished?
Regarding ecological task validity, some neurophysiology measurement technologies can be generally ruled out due to the necessity for large, heavy machinery (e.g., fMRI, MEG, and PET) or low temporal resolution and response delays that may be incompatible with measuring real-time cognitive processing (e.g., fMRI and PET). One major advantage of EEG is that it can be acquired feasibly across a wide range of tasks in more realistic environments as modern EEG measurement systems are becoming more portable and less constraining to participants. In addition, EEG provides the highest available temporal resolution (order of milliseconds) to measure dynamic electrical activity generated by cortical neurons and is not confined by intrinsic time delays that are inherent of hemodynamic imaging techniques (order of seconds). A disadvantage of EEG is its limited spatial resolution due to volume conduction; however, this issue is becoming less problematic with modern high-density recording systems, co-registration with structural MRI, and source-localization procedures (Gevins et al., 1995; Michel et al., 2004).
As with all brain-imaging techniques, EEG is still limited by the problem of signal artifacts (for a review, see Cutmore and James, 1999). The primary rationale for employing strict control of experimental tasks and environments is the vulnerability of recordings to corruption by undesirable signal artifacts produced by non-brain sources. For example, electromagnetic interference from lights or other electrical equipment, eye blinks and eye movements, skeletomuscular activity from postural or voluntary motor responses, and physical motion of the measurement apparatus can render measurements unusable and have largely been dealt with by restricting both task and environment. Surprisingly, we are unaware of any published studies

2
that have systematically varied the recording environment with the intent of evaluating the effects of induced artifacts on EEG signal quality. Accordingly, research outside of traditional laboratories is needed to explicitly examine the nature and extent of the influence of various environmentally induced artifacts on the quality of EEG measurements so they can be better isolated and minimized in the future.
A limited number of studies have examined EEG from participants performing realistic tasks, but the experimental designs still controlled the task environments and minimized signal artifacts associated with muscular and environmental sources. Such tasks have included putting a golf ball (Crews and Landers, 1993) and shooting a weapon (for a review, see Hatfield et al., 2004). Further, issues of signal artifact have been addressed in marksmanship research by examining subcomponent processes of shooting and by implementing controlled postural conditions (Kerick et al., 2001; Salazar et al., 1989). Although these tasks illustrate realistic behaviors and lend themselves to neurophysiological measurement, they do not represent the dynamic nature of most human environments.
Investigators have also examined EEG from participants during driving (Cerezuela et al., 2004; Miller, 1997; Ramaekers et al., 1992; Santana-Diaz et al., 2000) and piloting aircraft (Dussault et al., 2004; Wilson, 2002), where the dynamic task environments are likely to induce signal artifacts. However, the focus of these studies was not to isolate and characterize artifacts (e.g., independent component analysis) and therefore the tasks and data analysis methods may not have yielded results that correctly attribute the observed signals to strictly brain-related processes. Others have used advanced signal processing methods to remove a wide variety of artifacts (e.g., independent component analysis), but still did not focus analyses and discussion on the nature and extent of such artifacts and how they affected signal quality (Liang et al., 2005; Lin et al., 2005). Accordingly, research specifically designed to investigate the pervasiveness of artifacts is required to substantiate these and future interpretations of EEG data recorded in such dynamic environments.
Therefore, the goal of this study was to evaluate the feasibility of obtaining brain-relevant signals from within task environments that explicitly induce non-brain-related signal artifacts. We examined event-related potentials (ERP) elicited by a standard auditory discrimination task (i.e., the “oddball paradigm”) in six different environmental conditions: a stationary seated control condition, two dynamic vehicle motion simulation conditions with participants in a seated position, a standing condition, and two dynamic ambulatory conditions. These six environments were implemented to represent a broad range of task conditions that we considered likely to confound EEG data by various types (postural, dynamic muscular, and mechanical forces) and levels (low, moderate, and severe) of artifacts. We used the oddball task because it has been shown to reliably elicit a stereotypical electrocortical signal that is related to cognitive processing (Polich and Kok, 1995; Rugg and Coles, 1995). Our main objective was to assess the feasibility of obtaining this traditional ERP waveform in each of the environments, which would support the possibility of recording ERP data, specifically, and EEG data, in general, within

3
more realistic environments. Expecting to observe signal degradation in the more dynamic conditions (e.g., jogging and riding in a vehicle over cross-country terrain), obtaining recordings in noisy environments also allowed us to investigate the nature and extent of various artifacts imposed by the different environments and to assess how future technological developments and signal processing algorithms might be advanced in order to achieve this objective.
2. Methods & Procedures
2.1 Participants
The test participants were normal adult right-hand- and right-eye-dominant males (N = 5; age range 27–39). The voluntary, fully informed consent of the persons used in this research was obtained as required by U.S. Army human use regulations (U.S. Department of Defense, 1999; U.S. Department of the Army, 1990).
2.2 Apparatus
2.2.1 Motion Environments
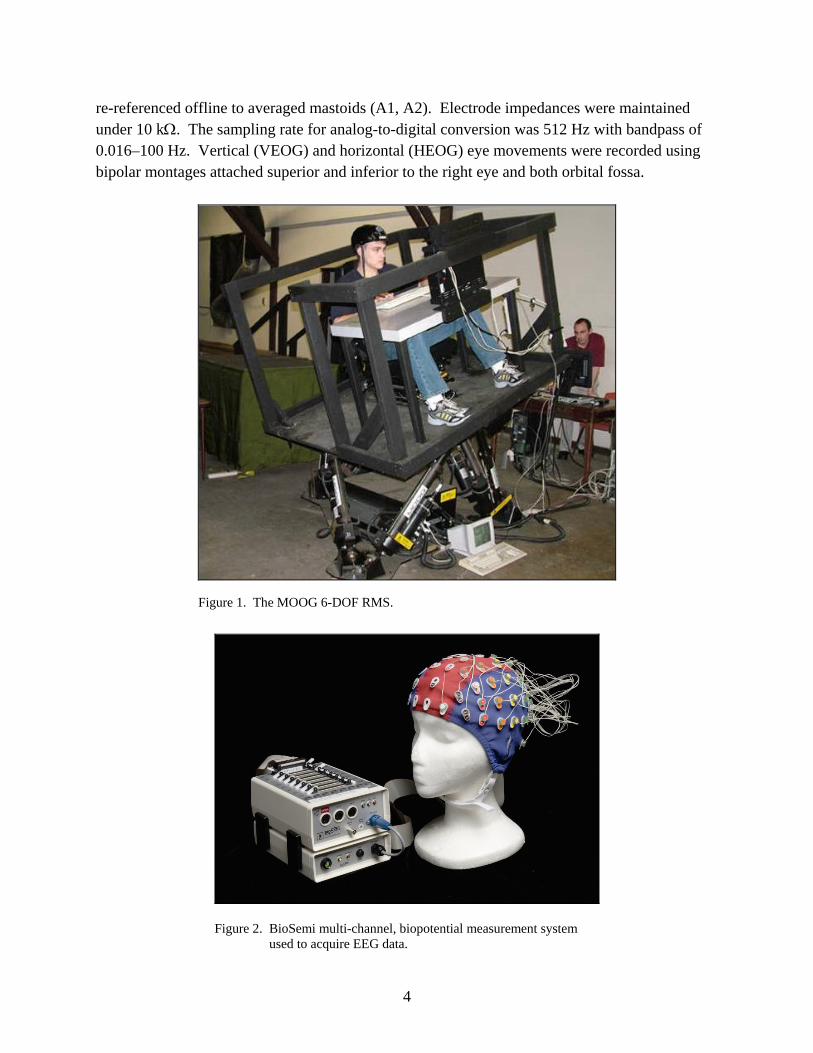
A ride-motion simulator (RMS) was used to simulate vehicle motion environments (figure 1). The RMS uses a MOOG 6 degree-of-freedom (6-DOF) 20000E motion platform (MOOG, East Aurora, NY), capable of producing dynamics similar to that of military ground vehicles traversing over secondary roads and cross-country terrain. It is comprised of a platform mounted on a hexapod actuator design that is securely fixed to a non-movable surface and produces motions in the longitudinal, lateral, vertical, roll, pitch, and yaw directions with maximal acceleration limited to ±0.6 g lateral and longitudinal and –0.5 to 0.7 g vertical. A treadmill (Quinton, Bothell, WA) was used to simulate ambulatory motion environments.
2.2.2 Electroencephalography
Continuous EEG data were acquired using a 24-bit, 40-channel ActiveTwo* amplifier with ActiView* software and an electrode cap (Active Headcap*) with pre-amplified surface electrodes (figure 2). Pre-amplified electrodes boost the electrical signal at the scalp and increase the signal-to-noise ratio through high-input and low-output impedances (Metting van Rijn et al., 1990). A water-soluble electrode gel (Signa Gel; Parker Laboratories, Inc.; Fairfield, NJ) was inserted into each of the electrode casings to facilitate conductivity between the scalp and electrode surfaces. EEG data were recorded from 32 electrode sites referenced to a common mode sense (CMS) electrode with the midline frontopolar electrode (FPz) as ground. Data were
*ActiveTwo, ActiView, and Active Headcap are registered trademarks of BioSemi, Amsterdam, Netherlands.
4
re-referenced offline to averaged mastoids (A1, A2). Electrode impedances were maintained under 10 k. The sampling rate for analog-to-digital conversion was 512 Hz with bandpass of 0.016–100 Hz. Vertical (VEOG) and horizontal (HEOG) eye movements were recorded using bipolar montages attached superior and inferior to the right eye and both orbital fossa.
Figure 1. The MOOG 6-DOF RMS.
Figure 2. BioSemi multi-channel, biopotential measurement system used to acquire EEG data.

5
2.2.3 Auditory Discrimination Task
An auditory discrimination task was implemented using the “oddball paradigm” (Polich and Kok, 1995; Polich, 1997). Within each condition, a total of 100 auditory stimuli (target and non-target stimuli) were presented once every 3.5–6.5 s in a random series with the target stimuli (2000 Hz) occurring less frequently (probability = 0.20) than the non-target (1000 Hz; probability = 0.80) stimuli. All auditory stimuli were 50 ms in duration and presented at 60 dB. Inter-stimulus intervals were varied to reduce the likelihood of habituation via expectancy effects (Yordanova and Kolev, 1997). The auditory stimuli were generated by a personal computer running E-Prime (ver. 1.1; Psychology Software Tools, Inc., Pittsburgh, PA) and presented binaurally to the participants via stereo headphones, which were worn throughout all task conditions.
In all task conditions, the participant held a modified bicycle grip (analogous to a gaming joystick) in his right hand and was instructed to press a button, which was attached to the top of the grip, with his thumb as quickly as possible in response to target stimuli and to not respond to non-target stimuli. Each participant was instructed to fixate on a spot marked directly in front of him at eye-level. Response times were recorded as the time interval between the onset of target stimuli and the time of each relevant button press. Response errors (i.e., the combination of percent failures to respond to target stimuli and the percent of responses to non-target stimuli) were also recorded. These behavioral measures were obtained for comparison purposes with the previous P300 literature using simple reaction time tasks and to confirm that the different environmental conditions did not grossly affect response times and error rates.
2.3 Procedures
Upon entering the laboratory, the participant was familiarized with the equipment and tasks, completed the volunteer consent form, practiced the auditory discrimination task, were prepared for EEG recordings, and then completed the experimental conditions. The experiment consisted of the performance of the auditory discrimination task while the participant was in a seated position (control condition) and while situated in five different motion environments, for a total of six experimental conditions. EEG was recorded continuously in each of the six conditions. In a “control” condition, the participants sat belted into a 6-DOF RMS in a stationary mode with no motion. The control condition was the critical comparative task condition for relating the data from motion environment conditions to a standard condition resembling that of traditional laboratory studies for recording ERP data.
To assess ERP data in motion environments, we subjected each participant to two dynamic vehicle motion simulation conditions while seated, a stationary standing condition, and two dynamic ambulatory conditions. For the vehicle motion environments, a “washboard” condition consisted of simulating the motion of a tracked vehicle traversing a regular washboard surface (i.e., a series of regular bumps with short spacing on the road surface) at 10 mph and a “cross-

6
country” condition consisted of simulating the motion of an 8-wheeled vehicle traversing cross-country (i.e., series of irregular dips with variable spacing on an off-road surface) at 15 mph. For the “standing” condition, the participants stood stationary on a treadmill with no motion (0 mph) or incline (0º). For the ambulatory motion environments, a “walking” condition consisted of the participant walking on the treadmill at 3 mph and a “jogging” condition consisted of the participant jogging on the treadmill at 5 mph, both set at 0º incline. A 2-min warm-up was provided for the jogging condition to minimize risk of injury by gradually increasing the treadmill up to speed. The sequence of conditions was assigned randomly within blocks of RMS (control, washboard, and cross-country) and treadmill (standing, walking, jogging) environments and blocks of RMS and treadmill conditions were counterbalanced to minimize order effects. Each task condition was ~6 min in duration, with 5-min rest provided between each task performance. The total time to complete the experimental session was 90–120 min.
2.4 Data Reduction
EEG data were subjected to several stages of signal processing and data reduction prior to statistical analysis. EEG reduction began with all continuously recorded data bandpass filtered from 0.01 to 40.0 Hz, and the application of an eye-artifact-reduction algorithm using a regression and subtraction method (Semlitsch et al., 1986). Filtered and eye-artifact reduced continuous data were epoched around event markers indexing the onset of auditory stimuli with 200 ms pre-stimulus and 1000 ms post-stimulus periods for each trial, electrode, subject, and condition. All impedances for the electrodes examined were verified to be less than 10 k. Individual trials were then subjected to an automatic artifact rejection process with a criterion of ±75 µV. To validate the automatic artifact rejection process, individual epochs were visually inspected separately to identify and delete artifact-contaminated epochs. All ERP analyses were completed with both the automatic and the visual inspection methods with similar results (i.e., percentage of trials accepted). Hereafter, only analyses of the automatic rejection criterion data are reported.
2.5 Design
The designs and the analyses of data differed with different classes of dependent variables. Accordingly, the next section describes how data from each class of dependent variable were analyzed (see section 2.6). All analyses were conducted using SPSS (version 14.0). When relevant, post-hoc comparisons of significant effects were examined using least significant difference (LSD) tests. Means and standard errors of the means are reported throughout.
2.6 Statistical Analysis
2.6.1 Percentage of Acceptable Trials
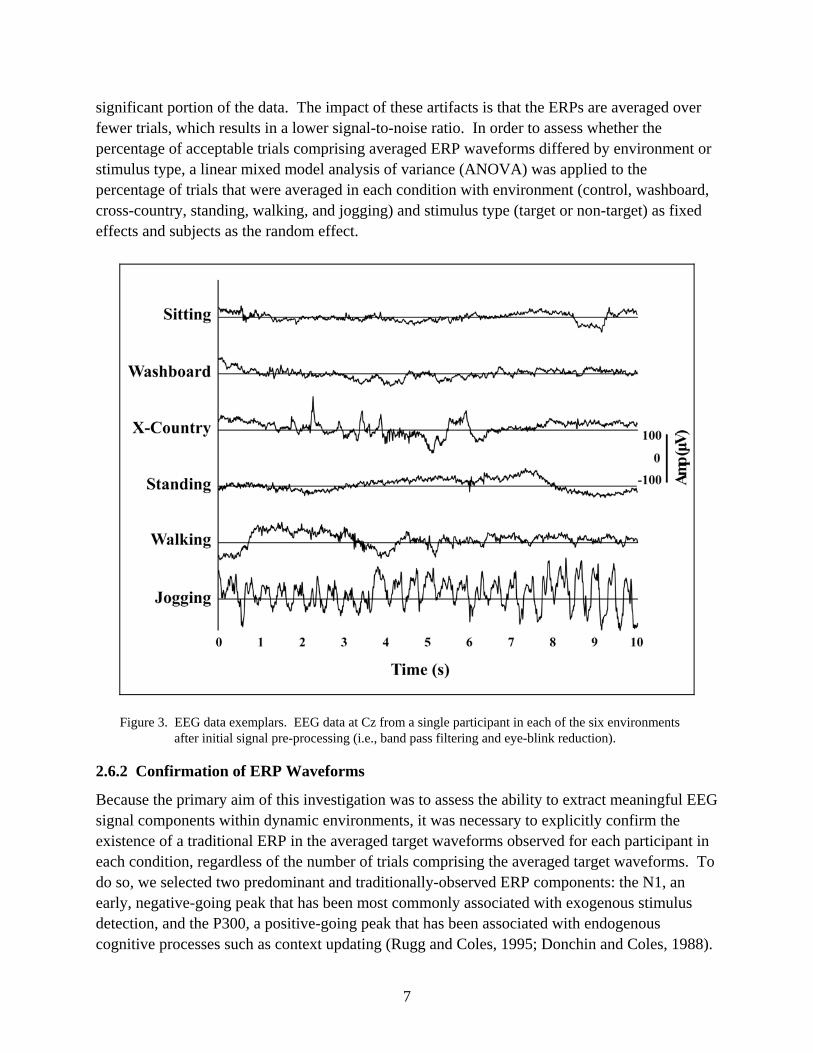
After filtering and removing eye-artifacts, other sources of gross artifact were still observable to varying extents across the different environments (see figure 3). In laboratory settings similar to the sitting control condition, gross artifacts typically impact only a small portion of the data. However, in some of the environmental conditions examined here, gross artifacts impacted a
7
significant portion of the data. The impact of these artifacts is that the ERPs are averaged over fewer trials, which results in a lower signal-to-noise ratio. In order to assess whether the percentage of acceptable trials comprising averaged ERP waveforms differed by environment or stimulus type, a linear mixed model analysis of variance (ANOVA) was applied to the percentage of trials that were averaged in each condition with environment (control, washboard, cross-country, standing, walking, and jogging) and stimulus type (target or non-target) as fixed effects and subjects as the random effect.
Figure 3. EEG data exemplars. EEG data at Cz from a single participant in each of the six environments after initial signal pre-processing (i.e., band pass filtering and eye-blink reduction).
2.6.2 Confirmation of ERP Waveforms
Because the primary aim of this investigation was to assess the ability to extract meaningful EEG signal components within dynamic environments, it was necessary to explicitly confirm the existence of a traditional ERP in the averaged target waveforms observed for each participant in each condition, regardless of the number of trials comprising the averaged target waveforms. To do so, we selected two predominant and traditionally-observed ERP components: the N1, an early, negative-going peak that has been most commonly associated with exogenous stimulus detection, and the P300, a positive-going peak that has been associated with endogenous cognitive processes such as context updating (Rugg and Coles, 1995; Donchin and Coles, 1988).
8
To extract the ERP waveforms, the filtered and inspected data epochs for each subject were sorted by stimulus type (target vs. non-target) and averaged across target trials within each condition. Two time epochs were defined for the observation of the signal peaks at the vertex (Cz): N1, 80–200 ms and P300, 280–450 ms. One-tailed t-tests were used to assess whether the observed value at each sample in the averaged target waveform for each participant within these two time epochs were different, in the appropriate direction, from the averaged values observed in the participant's pre-stimulus, baseline epoch (–200 to 0 ms). A conservative criterion for significance (alpha = 0.001) was used to accept or reject the statistical hypothesis for each comparison to account for the large number of comparisons.
2.6.3 P300 Amplitude of Confirmed ERPs
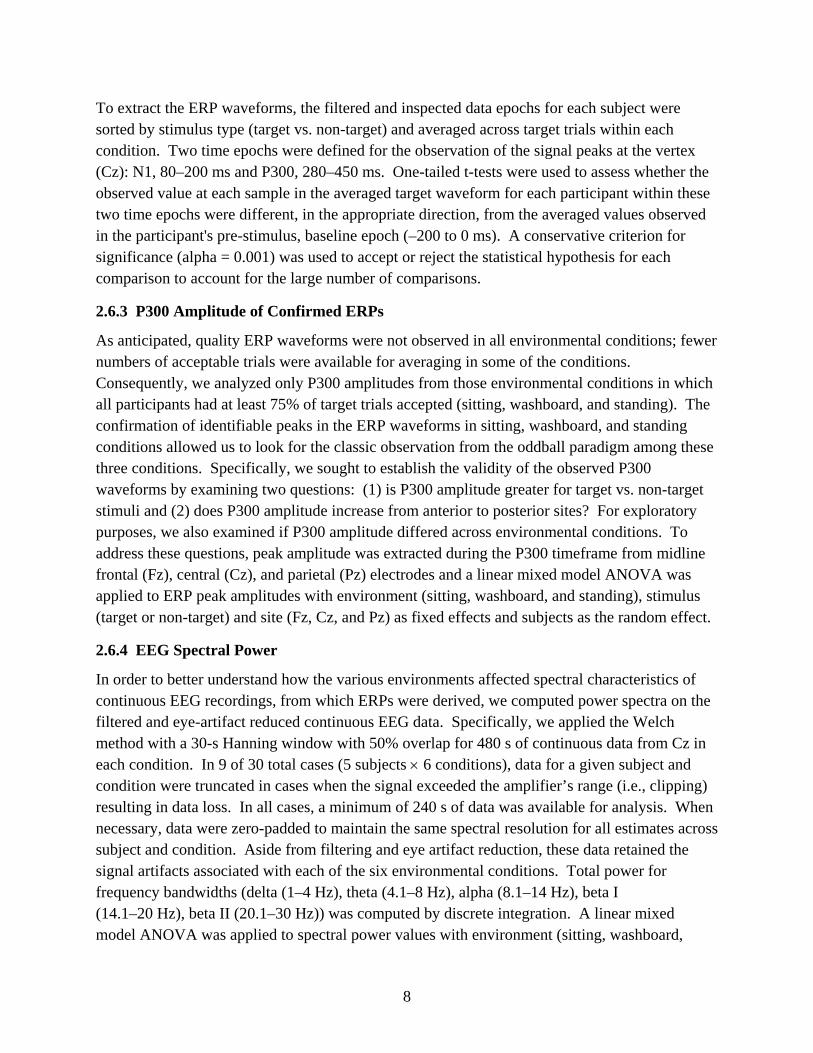
As anticipated, quality ERP waveforms were not observed in all environmental conditions; fewer numbers of acceptable trials were available for averaging in some of the conditions. Consequently, we analyzed only P300 amplitudes from those environmental conditions in which all participants had at least 75% of target trials accepted (sitting, washboard, and standing). The confirmation of identifiable peaks in the ERP waveforms in sitting, washboard, and standing conditions allowed us to look for the classic observation from the oddball paradigm among these three conditions. Specifically, we sought to establish the validity of the observed P300 waveforms by examining two questions: (1) is P300 amplitude greater for target vs. non-target stimuli and (2) does P300 amplitude increase from anterior to posterior sites? For exploratory purposes, we also examined if P300 amplitude differed across environmental conditions. To address these questions, peak amplitude was extracted during the P300 timeframe from midline frontal (Fz), central (Cz), and parietal (Pz) electrodes and a linear mixed model ANOVA was applied to ERP peak amplitudes with environment (sitting, washboard, and standing), stimulus (target or non-target) and site (Fz, Cz, and Pz) as fixed effects and subjects as the random effect.
2.6.4 EEG Spectral Power
In order to better understand how the various environments affected spectral characteristics of continuous EEG recordings, from which ERPs were derived, we computed power spectra on the filtered and eye-artifact reduced continuous EEG data. Specifically, we applied the Welch method with a 30-s Hanning window with 50% overlap for 480 s of continuous data from Cz in each condition. In 9 of 30 total cases (5 subjects 6 conditions), data for a given subject and condition were truncated in cases when the signal exceeded the amplifier’s range (i.e., clipping) resulting in data loss. In all cases, a minimum of 240 s of data was available for analysis. When necessary, data were zero-padded to maintain the same spectral resolution for all estimates across subject and condition. Aside from filtering and eye artifact reduction, these data retained the signal artifacts associated with each of the six environmental conditions. Total power for frequency bandwidths (delta (1–4 Hz), theta (4.1–8 Hz), alpha (8.1–14 Hz), beta I (14.1–20 Hz), beta II (20.1–30 Hz)) was computed by discrete integration. A linear mixed model ANOVA was applied to spectral power values with environment (sitting, washboard,
9
cross-country, standing, walking, jogging) and frequency band (delta, theta, alpha, beta I, beta II) as fixed effects and subjects as the random effect.* For comparison, power spectra for the total linear acceleration of the RMS during the riding conditions were also computed.
2.6.5 Behavioral Measures
Response times were recorded as the time interval between the onset of target stimuli and the time of each relevant button press. Response errors (i.e., the combination of percent failures to respond to target stimuli and the percent of responses to non-target stimuli) were also recorded. A linear mixed model ANOVA was applied to each measure separately with environment (sitting, washboard, cross-country, standing, walking, jogging) as the fixed effect and subjects as the random effect.
3. Results
3.1 Percentage of Acceptable Trials
The Environment x Stimulus linear mixed model ANOVA applied to the percentage of acceptable trials revealed a significant main effect for environment, F(5,24) = 9.57, p < .01, but not for stimulus, F(1,24) = 0.05, p > 0.83, or their interaction, F(5,24) = 0.76, p > 0.59. Post-hoc analyses (alpha = 0.05) of the environment main effect revealed that a lower percentage of trials was accepted in both the jogging (14.13) and cross-country (64.13) conditions compared to each of the other conditions (sitting = 97.00; washboard = 93.00; standing = 90.50; walking = 71.25), which did not differ from each other (all SEM = 10.05).
3.2 Confirmation of ERP Waveforms
The one-tailed t-tests of N1 and P300 amplitude peaks within each condition relative to their respective mean baseline values revealed significant N1 peaks (p < 0.001) in the sitting, washboard, standing, and walking conditions (see bold regions between 80 and 100 ms in figure 4). In the 20 cases where sufficient percentages of trials were accepted (i.e., 75%), the two standard ERP components were analyzed for the detection of signal peaks at the central electrode (Cz) for target stimuli. In 17 of these 20 cases across participants and environments, the N1 and P300 peaks were found to be significantly different than the pre-stimulus baseline epoch (–200 to 0 ms).
*To further verify that the artifacts induced by the environmental conditions were not affecting the reduction in signal noise
achieved by signal averaging in different ways, an additional analysis was performed on non-stimulus-locked epochs. Data from each trial, within both participant and condition, were segmented into non-overlapping 1200 ms epochs, with 24 epochs randomly re-sampled without replacement. These epochs were then averaged over increasing numbers of epochs (n = 8, 12, 16, 20, 24), and subjected to Fourier analysis. Total power was then computed. To improve estimation for each level of n, this re-sampling was performed 1000 times within a given condition for each participant. As expected, results showed a systematic decrease in the mean observed power with increasing n, with no observable differences in noise reduction between conditions.

10
Figure 4. Exemplar ERP waveforms. ERP data at Cz (thin lines) from a single participant over five of
the six environments.*
3.3 P300 Amplitude of Confirmed ERPs
The Environment x Stimulus x Site linear mixed model ANOVA applied to P300 peak amplitudes was limited to data from the three environments in which all participants had at least 75% of the target trials accepted (sitting, washboard, standing). The results revealed a significant main effect for both site, F(2,68) = 5.11, p < 0.01, and stimulus, F(1,68) = 17.20, p < 0.01. The main effect for environment was not significant, F(2,68) = 0.33, p > 0.72, nor were any of the two-way interactions (all p’s > 0.13) nor the three-way interaction (p > 0.97). Post-hoc analyses of the significant main effects indicated that P300 amplitude increased from
*No data are presented for the jogging condition as no trials met the ±75 µV automatic rejection criteria. For illustrative
purposes, data are presented for the cross-country and the walking conditions even though they have low numbers of accepted trials (the number of trials per average are presented in parentheses). Significance from baseline was observed, indicated by the bolded line segments, in the N1 time frame for all conditions where trials met the rejection criteria except cross-country, which had a low number of trials. Significance from baseline was observed in the P300 time frame (bolded portion) for all conditions with accepted trials. Shaded areas highlight timeframes for N1 and P300 peaks.

11
anterior to posterior sites (Fz = 9.10 ± 1.63 μV; Cz = 11.51 ± 1.63 μV; Pz = 13.25 ± 1.63 μV) and was higher for the target (13.50 ± 1.54 μV) than for the non-target (9.08 ± 1.54 μV) stimuli. Similar results were obtained when data from the five environments (sitting, washboard, cross-country, standing, and walking) in which at least two participants had 75% accepted trials were included in a follow-up analysis, though this analysis suffered from several missing cells due to gross-artifact data loss. Figure 5 shows the averaged ERP waveforms in response to target stimuli for each of the six environmental conditions at site Cz, with the corresponding percentages of acceptable trials in parentheses.
Figure 5. Group-averaged waveforms. Group-averaged ERP data at Cz in each of the six environments.*
*ANOVA on P300 peak amplitudes was only applied to environmental conditions in which all participants had at least 75%
of trials accepted (sitting, washboard, and standing), but data from all conditions are presented for illustrative purposes (the percentage of trials accepted are provided in parentheses). Shaded areas highlight timeframes for N1 and P300 peaks.

12
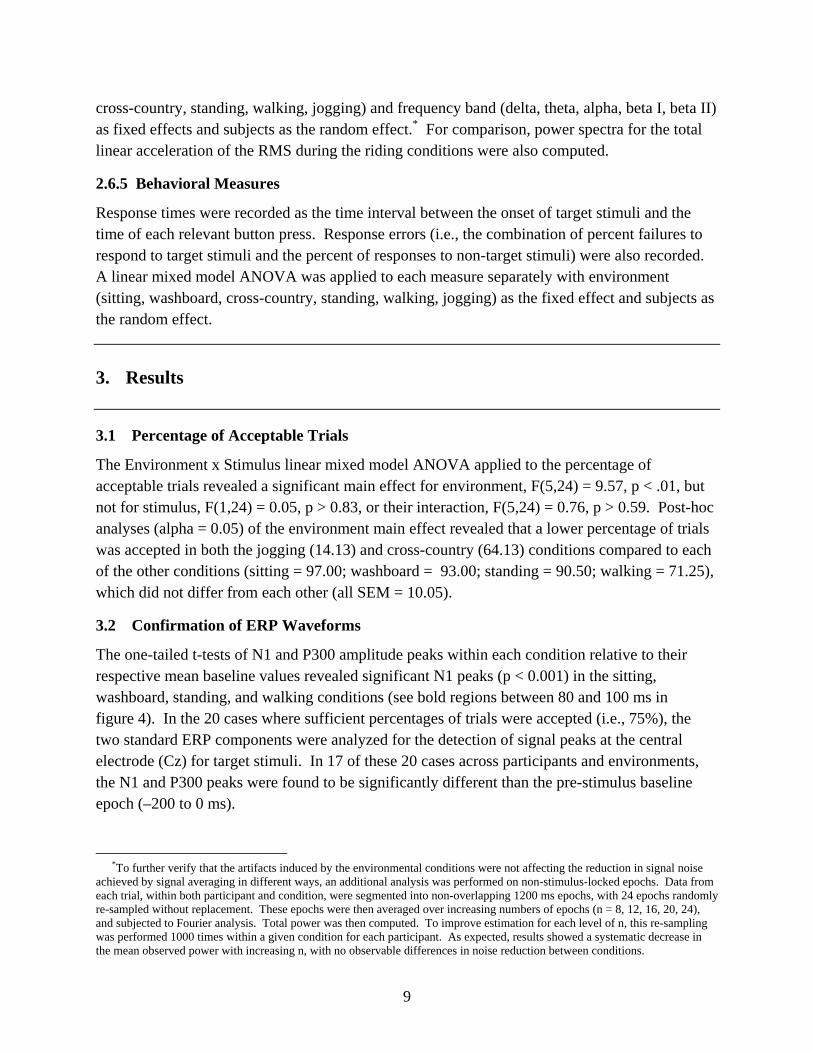
3.4 EEG Spectral Power
Figure 6 presents the geometric mean of the power spectra across participants for the environmental conditions, computed for Cz. The spectra demonstrate signal artifacts induced by the levels of motion across conditions. For example, evidence of signal artifacts related to the participants’ walking (figure 6g) and running (figure 6h) stride frequencies and related biological motion (below 5 Hz) can be observed, including artifacts potentially due to signal harmonics. Clear peaks can also be observed in the washboard condition (figure 6b) at ~ 2.6–2.7 Hz and at ~5.2–5.4 Hz, which correspond to peaks observed in the power spectra of RMS motion (total acceleration; see figures 6d and 6e). Linear mixed model analyses revealed significant environment effects for all spectral power bands: delta, F(5,78) = 44.40, p < 0.01; theta, F(5,78) = 27.74, p < 0.01; alpha, F(5,78) = 18.48, p < 0.01; beta I, F(5,78) = 32.14, p < 0.01; beta II, F(5,78) = 46.60, p < 0.01. Post-hoc comparisons between the seated control condition and all other conditions (see figure 7) showed that observed differences in spectral power were generally consistent with the observed environment main effects: (1) the jogging (ps < 0.01) condition showed greater spectral power in all frequency bands, (2) the cross-country condition showed greater spectral power in all frequency bands cross-country (ps < 0.02) except for alpha (p < 0.25), and (3) no differences were found for any frequency band in either the washboard (ps > 0.12) or standing (ps > 0.38) conditions. In the walking condition, only one significant difference was found, namely the delta frequency band (p < 0.01).
3.5 Behavioral Measures
Linear mixed model results indicated that neither the response time, F(5,23) = 0.11, p > 0.99, nor the error rate, F(5,22) = 0.51, p > 0.77, were significantly different across the six experimental environments. The overall response time for the experiment was 545 ± 38 ms and the overall error rate was 2.90% ± 0.80%.
4. Discussion
The purpose of this study was to record EEG in a variety of dynamic environments that researchers typically avoid due to the confounding influences of artifacts in order to better quantify and characterize the nature and extent of those artifacts on EEG signal quality. The task environments employed in this study were explicitly chosen to induce varied levels and types of signal artifact in EEG recordings from both vehicle motion and ambulatory conditions. In order to assess the effects of induced artifacts on the integrity of observed EEG signals, a standard auditory discrimination task (i.e., “oddball paradigm”) was adopted from the literature, because this task has been shown to elicit a reliable ERP in normal subjects (Polich and Kok, 1995; Polich, 1997). Using this task enabled us to systematically test the extent to which signals observed in motion environments resembled traditional waveforms obtained in controlled laboratory settings; spectral analyses further allowed the characterization of the nature of the artifacts in the EEG signal.

13
Figure 6. Mean (geometric) spectral power at Cz across all participants for riding (a–c; sitting, washboard, cross-country, respectively) and ambulatory (f–h; standing, walking, jogging, respectively) conditions. Spectral power of the total acceleration of the RMS motion profiles is shown for the washboard (d) and cross-country (e) conditions.
Our findings revealed that, in the sitting, washboard, and standing conditions, sufficient numbers of trials were acceptable (retained at least 75% of trials for all participants) and typical ERP waveforms with identifiable N1 and P300 peaks were observed at the individual participant level in these three conditions (see figure 4). The amplitude and topographic distribution of the P300 peaks in these three conditions were found to be consistent with classic findings in laboratory settings (Polich and Kok, 1995; Polich, 1997). That is, the observed mean P300 amplitude peak was larger for the target versus the non-target stimuli, and increased in amplitude from frontal to more posterior brain regions. Additionally, the percentage of acceptable trials, the general morphology of the ERP waveforms, the P300 amplitudes, and the spectral power across
(a)
(f) (g) (h)
(e)(d)
(c)(b)
14
Figure 7. Spectral power in frequency bands by environmental condition. Spectral power in (a) delta, (b) theta, (c) alpha, (d) beta I, and (e) beta II frequency bands by environmental condition. Asterisks indicate significant differences from the sitting control condition (p < 0.05). See legend for environmental condition labels.
(e)
(a) (b) (c)
(d)

15
frequency bands support an argument for the feasibility of recording quality data in these three environments. However, we caution that it is possible that small differences among environmental conditions may not have been detected given the small sample size used in this study.
On the other hand, artifacts induced in the more dynamic cross-country, walking, and jogging conditions strongly affected the percentage of acceptable trials in each condition, and the effects of artifact corruption were found to be specific to the type of motion environment. Higher levels of participant movement imposed by the cross-country, walking, and jogging conditions resulted in lower percentages of acceptable trials and greater variation in the N1 and P300 peaks, if obtainable at all. For example, 71% of trials were acceptable across all participants in the walking condition, and data from only three of five participants attained the criterion 75% of acceptable trials. Even more problematic was the cross-country condition, for which only 64% of trials were accepted across all participants, and only two of five participants met the criterion of 75% of acceptable trials. The highest level of induced artifact corruption was observed in the jogging condition, for which only 14% of trials were accepted, with no single participant meeting the 75% trial acceptance criteria to confirm a valid ERP waveform. Consequently, data from these three conditions were excluded from the ANOVA on P300 peaks.
Regarding spectral power of continuous EEG recordings in each condition, no differences were observed in the theta, alpha, beta I, or beta II frequency bands for the sitting, standing, washboard, and walking conditions (see figures 6 and 7). In the cross-country and jogging conditions, power was higher at all frequency bands, relative to the sitting control condition, except alpha power in the cross-country condition. In the walking condition, delta power was higher than that observed in the sitting control condition.
For the cross-country condition, frequency spectra showed that, despite a ride motion profile with a relatively narrow bandwidth (i.e., signal power for the RMS motion is primarily located at frequencies <5 Hz) that peaked at ~2.1 Hz, power in the EEG signal was increased broadly throughout the frequency range (0.1–30 Hz). By contrast, in the washboard condition, the observed power in the spectra of the ride motion accelerations was less broad than that of the cross-country condition, with power found primarily at two distinct frequencies (~2.6 Hz and ~5.3 Hz, see figure 6d). These two frequencies are clearly reflected in the observed EEG spectra (figures 6b and 7), though, unlike in the cross-country condition, significantly increased power was not observed across frequency bandwidth. These results are suggestive that brain-relevant EEG signals may be measured even under conditions such as within moving vehicles which are much more dynamic than traditional laboratory settings. The results also underscore the importance of understanding the relationship between environmental motion and induced signal artifacts, as separating brain-relevant versus non-brain-relevant EEG signal components around these frequencies may be problematic. This has been a shortcoming in previous studies examining driving both in motion-base simulators (Liang et al., 2005; Lin et al., 2005) and in

16
actual vehicles (Cerezuela et al., 2004; Miller, 1997; Ramaekers et al., 1992; Santana-Diaz et al., 2000). However, considering the relatively rough nature of the vehicle motion environments examined here compared to those utilized in some previous studies (e.g., Cerezuela et al., 2004; Lin et al., 2005), it seems that EEG measurement is reasonable in typical civilian on-road driving conditions.
In the jogging condition, the effects of artifact on signal integrity were generally more pronounced, and not surprisingly, the highest level of induced artifact corruption was observed in this condition. Frequency spectra showed that the EEG signal had an elevated overall level of observed power relative to the other ambulatory conditions (figures 6h and 7), as well as clear evidence of signal artifacts that could likely be attributed to the participants’ gait cycles. A peak in the spectra is observed at ~2.6 Hz, which is consistent with experimentally observed stride frequencies during running (Wixted et al., 2005). Identifiable peaks were also observed at harmonics of this frequency peak, which one might reasonably expect from a nonlinear, vibratory system such as a participant running on a non-rigid surface (i.e., treadmill). In the jogging condition, the increase in spectral power was not confined only to the observed peaks related to participant movements, but was also broadly distributed across the entire frequency range. Thus, given the standard signal processing conducted here, it would not be possible to attribute observed increases in spectral power to brain-related signal changes due to corruption by signal artifacts related to the participants’ movements.
Spectra in the walking condition revealed a similar profile, though with a slightly lower frequency peak at around 1.7 Hz, consistent with the lower stride frequency in walking vs. jogging, as well as similar observable peaks at harmonic frequencies. Post-hoc comparison to the sitting control condition revealed that the walking condition differed only in the low-frequency delta bandwidth. However, casual observation of the EEG spectrum does not indicate the traditional alpha peak that is observed in the sitting, standing, and washboard conditions. This suggests that with a larger sample size, differences in spectral power at higher frequencies may be revealed. Further, in comparison to the washboard, 22% fewer trials were accepted in the walking condition. These results indicate the importance of understanding how motions that induce artifacts affect observed signals (e.g., within specific frequency bands). For example, the results observed in the walking condition are suggestive of low-pass characteristics, with motion artifacts affecting signal integrity most prominently at low frequencies (i.e., the delta bandwidth). Therefore, signals related to cognitive processes such as attention and working memory that are related to these frequencies (Dussault et al., 2004; Hankins and Wilson, 1998) would be most susceptible to corruption under increased motion conditions.
For time-locked brain processes such as those reflected in the ERP, traditional techniques appear to be sufficient for sitting, standing, and low to moderate vehicular motion conditions. Further, increased sampling could be utilized to improve estimation (e.g., averaging out signal noise) in walking and higher vehicular motion, so that sufficient numbers of stimulus trials can be accepted despite signal artifacts. Frequency specificity of induced artifacts, however, may be

17
especially problematic with analyses such as spectral analysis in which brain-related processes are not time locked and can thus be distributed randomly within a signal. In this case, averaging (e.g., the Welch method) does not necessarily allow differentiation between primarily brain-related components and non-brain-related signal artifacts. This is clearly an issue for the high ambulatory and riding motion environments. However, conservative interpretations of brain-related activity from spectral analyses, especially in higher frequency bandwidths, may be possible as the degree of artifact-inducing motion within the experimental task environment diminishes.
While comparisons of cognitive processes across motion environments were not the focus of the current study, the results are also promising for generalizing previous laboratory findings to these more realistic task contexts. Namely, P300 amplitude and topographic distribution, as well as response times and error rates in the experimental task, were not found to be significantly affected by the motion environments presented. While strong conclusions should not be made given the limited sample size of the current study, these results are suggestive that motion environments, in and of themselves, may not have a strong effect on cognitive processing. Further study is needed, however, to validate such a conclusion across additional, more complex tasks, and cognitive processes that are characterized by different EEG measures (e.g., event-related spectral perturbation, independent component analysis).
It should also be noted that the pre-amplified electrodes used in the current study have been developed to improve the low signal-to-noise ratios typical of EEG measurement (Metting van Rijn et al., 1990). The results presented here indicate that even under motion conditions that are more severe than typical on-road driving (i.e., washboard), brain-related signals were obtainable. Still, one cannot necessarily say that these results are directly informative regarding previous results in the literature, as the degree to which results presented here may have benefited from improvements in measurement (e.g., the use of pre-amplified electrodes) is not known.
We conservatively suggest that it is reasonable that EEG measurement is feasible under conditions that are less severe than the washboard condition, especially at higher motion frequencies, given the relatively low evidence for artifact corruption. Under motion conditions that will induce more signal artifact, additional signal analyses may enable the capability to measure EEG in a greater range of operational environments. This may be especially true for conditions in which the source of the motion can be recorded or predicted. For example, rhythmic activation of artifact corresponding to the stride frequencies of subject during walking or running may be susceptible to identification using advanced signal analyses such as principal component analysis (Ille et al., 2002) or independent components analysis (Jung et al., 2000). Other approaches such as signal space projection (Uusitalo and Ilmoniemi, 1997), regression methods (Gratton et al., 1983) and adaptive filtering (He et al., 2004), may also hold potential for dealing with signal artifact corruption to obtain brain-based signal components. Finally, though the current study focuses on characterizing the EEG signal to extract brain-relevant signal components, depending upon the task and questions of interest, signal components typically
18
thought of as artifact may be meaningful, as well. For example, signal components related to neck muscle activity may be used as an indicator of fatigue state, rather than discarded simply as noise artifacts.
5. Conclusions
The capability to reliably measure brain activity patterns in ecologically valid environments is a major challenge and has rarely been attempted. This study evaluated the feasibility of obtaining brain-relevant signals under conditions designed to induce motion-related signal artifacts. The integrity of EEG signals was quantified as a function of increased levels of motion that are characteristic of realistic environments. Participants performed a standard auditory discrimination task in ambulatory (standing, walking, and jogging) and vehicle motion environments (riding in a motion simulator with no motion, washboard, and cross-country road surface conditions). Based on the results presented here:
• EEG can be reliably recorded and obtained in operational environments that do not produce severe motion-related signal artifacts, such as driving a civilian vehicle, even when employing only traditional EEG signal analyses.
• Even under conditions where EEG measurement is plausible, frequency-specific, environment-related motion artifacts require that care is taken to understand how motion-induced signal artifacts affect the interpretation of observed signals relative to underlying cognitive processing.
• Under more severe motion conditions, application of advanced artifact reduction algorithms may improve the ability to reliably obtain brain-relevant signals.
6. Recommendations
The use of current EEG measurement technologies and traditional artifact reduction and analysis techniques is viable under motion conditions that do not produce severe motion-related signal artifacts. Therefore, developing capabilities to employ EEG measurement in operational environments should be pursued. However, information about the motion environment should also be obtained. This information should be used to: (1) inform researchers about the sources of signal artifacts in the EEG signal, and (2) provide a potential source for context variables needed to interpret psychophysiological data characterizing behavior. The application of advanced artifact reduction and signal decomposition algorithms (e.g., principal or independent

19
component analysis, signal space projection, adaptive filtering) should also be pursued for improving signal integrity to expand the motion environments in which EEG measurement is possible.
20
7. References
Cerezuela, G. P.; Tejero, P.; Choliz, M.; Chisvert, M.; Monteagudo, M. J. Wertheim’s Hypothesis on ‘Highway Hypnosis’: Empirical Evidence From a Study on Motorway and Conventional Road Driving. Accident; Analysis and Prevention 2004, 36, 1045–54.
Crews, D. J.; Landers, D. M. Electroencephalographic Measures of Attentional Patterns Prior to the Golf Putt. Medicine and Science in Sports and Exercise 1993, 25, 116–26.
Cutmore, T. R. H.; James, D. A. Identifying and Reducing Noise in Psychophysiological Recordings. International Journal of Psychophysiology 1999, 32, 129–50.
Donchin, E.; Coles, M. G. H. Is the P300 Component a Manifestation of Context Updating? Behavioral and Brain Sciences 1988, 11, 357–74.
Dussault, C.; Jouanin, J. C.; Guezennec, C. Y. EEG and ECG Changes During Selected Flight Sequences. Aviation, Space, and Environmental Medicine 2004, 75, 889–97.
Gevins, A.; Leong, H.; Du, R.; Smith, M. E.; Le, J.; Durousseau, D.; Zhang, J.; Libove, J. Towards Measurement of Brain Function in Operational Environments. Biological Psychology 1995, 40, 169–86.
Gratton, G.; Coles, M. G. H.; Donchin, E. A New Method For Off-Line Removal of Ocular Artifact. Electroencephalography and Clinical Neurophysiology 1983, 55, 468–84.
Hankins, T. C.; Wilson, G. F. A Comparison of Heart Rate, Eye Activity, EEG and Subjective Measures of Pilot Mental Workload During Flight. Aviatiation, Space, and Environmental Medicine 1998, 69, 360–67.
Hatfield, B. D.; Haufler, A. J.; Hung, T. M.; Spalding, T. W. Electroencephalographic Studies of Skilled Psychomotor Performance. Journal of Clinical Neurophysiology 2004, 21, 144–56.
He, P.; Wilson, G.; Russell, C. Removal of Ocular Artifacts From Electro-Encephalogram by Adaptive Filtering. Medical and Biological Engineering and Computing 2004, 42, 407–412.
Ille, N.; Berg, P.; Scherg, M. Artifact Correction of the Ongoing EEG Using Spatial Filters Based on Artifact and Brain Signal Topographies. Journal of Clinical Neurophysiology 2002, 19, 113–24.
Jung, T. P.; Makeig, S.; Humphries, C.; Lee, T. W.; McKeown, M. J.; Iragui, V.; Sejnowski, T. J. Removing Electroencephalographic Artifacts by Blind Source Separation. Psychophysiology 2000, 37, 163–78.

21
Kerick, S. E.; McDowell, K.; Hung, T. M.; Santa Maria, D. L.; Spalding, T. W.; Hatfield, B. D. The Role of the Left Temporal Region Under the Cognitive Motor Demands of Shooting in Skilled Marksmen. Biological Psychology 2001, 58, 263–77.
Liang, S. F.; Lin, C. T.; Wu, R. C.; Huang, T. Y.; Chao, W. H. Classification of Driver’s Cognitive Responses From EEG Analysis. IEEE International Symposium on Circuits and Systems, 2005; pp 156–59.
Lin, C. T.; Wu, R. C.; Liang, S. F.; Chao, W. H.; Chen, Y. J.; Jung, T. P. EEG-Based Drowsiness Estimation for Safety Driving Using Independent Component Analysis. IEEE Transactions on Circuits and Systems I-Regular Papers 2005, 52, 2726–38.
Metting van Rijn, A. C.; Peper, A.; Grimbergen, C. A. High-Quality Recording of Bioelectric Events: 1. Interference Reduction, Theory and Practice. Medical and Biological Engineering and Computing 1990, 28, 389–97.
Michel, C. M.; Murray, M. M.; Lantz, G.; Gonzalez, S.; Spinelli, L.; de Peralta, R. G. EEG Source Imaging. Clinical Neurophysiology 2004, 115, 2195–22.
Miller, J. C. Quantitative Analysis of Truck Driver EEG During Highway Operations. Biomedical Science Instrumentation 1997, 34, 93–98.
Polich, J. EEG and ERP Assessment of Normal Aging. Electroencephalography and Clinical Neurophysiology 1997, 104, 244–56.
Polich, J.; Kok, A. Cognitive and Biological Determinants of P300: An Integrative Review. Biological Psychology 1995, 41, 103–46.
Ramaekers, J. G.; Uiterwijk, M. M. C.; O’Hanlon, J. F. Effects of Loratadine and Cetirizine on Actual Driving and Psychometric Test Performance and EEG During Driving. European Journal of Clinical Pharmacology 1992, 42, 363–69.
Rugg, M. D.; Coles, M. G. H. Electrophysiology of Mind: Event-Related Brain Potentials and Cognition; Oxford, Oxford University Press, 1995.
Salazar, W.; Landers, D. M.; Petruzzello, S. J.; Crews, D. J.; Kubitz, K. A. The Effects of Physical/Cognitive Load on Electrocortical Patterns Preceding Response Execution in Archery. Psychophysiology 1989, 25, 478–79.
Santana-Diaz, A.; Jammes, B.; Esteve, D.; Gonzalez-Mendoza, M. Driver Hypovigilance Diagnosis Using Wavelets and Statistical Analysis. IEEE 5th International Conference on Intelligent Transportation Systems, 2000; pp 162–67.
Semlitsch, H. V.; Anderer, P.; Schuster, P.; Presslich, O. A Solution for Reliable and Valid Reduction of Ocular Artifacts Applied to the P300 ERP. Psychophysiology 1986, 23, 695–703.

22
Uusitalo, M. A. R.; Ilmoniemi, J. Signal-Space Projection Method for Separating MEG or EEG into Components. Medical and Biological Engineering and Computing 1997, 35, 135–40.
U.S. Department of the Army. Use of Volunteers as Subjects Of Research; AR 70-25; Government Printing Office: Washington, DC, 1990.
U.S. Department of Defense. Code of Federal Regulations: Protection of Human Subjects; 32 CFR 219; Office of the Secretary of Defense, Government Printing Office: Washington, DC, 1999.
Wilson, G. F. An Analysis of Mental Workload in Pilots During Flight Using Multiple Psychophysiological Measures. International Journal of Aviation Psychology 2002, 12, 3–18.
Wixted, A.; Thiel, D.; James, D.; Hahn, A.; Gore, C.; Pyne, D. Signal Processing for Estimating Energy Expenditure of Elite Athletes Using Triaxial Accelerometers. The 4th IEEE Conference on Sensors, 2005; pp 798–801.
Yordanova, J.; Kolev, V. Developmental Changes in the Event-Related EEG Theta Response and P300. Electroencephalography and Clinical Neurophysiology 1997, 104, 418–30.

23
List of Symbols, Abbreviations, and Acronyms
ANOVA Analysis of Variance
AR Army Regulation
CFR Code of Federal Regulations
CMS Common Mode Sense
DOF Degree of Freedom
EEG Electroencephalography
ERP Event-Related Potential
fMRI Functional Magnetic Resonance Imaging
fNIR Functional Near-Infrared Spectroscopy
HEOG Horizontal Electro-oculogram
LSD Least Significant Difference
MEG Magnetoencephalography
PET Positron Emission Tomography
RMS Ride Motion Simulator
SPSS Statistical Package for Social Sciences
VEOG Vertical Electro-oculogram
NO. OF COPIES ORGANIZATION
24
1 DEFENSE TECHNICAL (PDF INFORMATION CTR only) DTIC OCA 8725 JOHN J KINGMAN RD STE 0944 FORT BELVOIR VA 22060-6218 1 DIRECTOR US ARMY RESEARCH LAB IMNE ALC HRR 2800 POWDER MILL RD ADELPHI MD 20783-1197 1 DIRECTOR US ARMY RESEARCH LAB AMSRD ARL CI OK TL 2800 POWDER MILL RD ADELPHI MD 20783-1197 1 DIRECTOR US ARMY RESEARCH LAB AMSRD ARL CI OK PE 2800 POWDER MILL RD ADELPHI MD 20783-1197
ABERDEEN PROVING GROUND 1 DIR USARL AMSRD ARL CI OK TP (BLDG 4600)

NO. OF NO. OF COPIES ORGANIZATION COPIES ORGANIZATION
25
1 ARMY RSCH LABORATORY - HRED AMSRD ARL HR ML J MARTIN MYER CENTER RM 2D311 FT MONMOUTH NJ 07703-5601 1 ARMY RSCH LABORATORY - HRED AMSRD ARL HR MZ A DAVISON 320 MANSCEN LOOP STE 115 FT LEONARD WOOD MO 65473 1 ARMY RSCH LABORATORY - HRED AMSRD ARL HR MD T DAVIS BLDG 5400 RM C242 REDSTONE ARSENAL AL 35898-7290 1 COMMANDANT USAADASCH ATSA CD AMSRD ARL HR ME DR HAWLEY 5800 CARTER RD FT BLISS TX 79916-3802 1 ARMY RSCH LABORATORY - HRED AMSRD ARL HR MM DR V J RICE BLDG 4011 RM 217 1750 GREELEY RD FT SAM HOUSTON TX 78234-5002 1 ARMY RSCH LABORATORY - HRED AMSRD ARL HR MG R SPINE BLDG 333 PICATINNY ARSENAL NJ 07806-5000 1 ARMY RSCH LABORATORY - HRED ARMC FIELD ELEMENT AMSRD ARL HR MH C BURNS THIRD AVE BLDG 1467B RM 336 FT KNOX KY 40121 1 ARMY RSCH LABORATORY - HRED AWC FIELD ELEMENT AMSRD ARL HR MJ D DURBIN BLDG 4506 (DCD) RM 107 FT RUCKER AL 36362-5000 1 ARMY RSCH LABORATORY - HRED AMSRD ARL HR MK MR J REINHART 10125 KINGMAN RD FT BELVOIR VA 22060-5828 1 ARMY RSCH LABORATORY - HRED AMSRD ARL HR MY M BARNES 2520 HEALY AVE STE 1172 BLDG 51005 FT HUACHUCA AZ 85613-7069
1 ARMY RSCH LABORATORY - HRED AMSRD ARL HR MP D UNGVARSKY POPE HALL BLDG 4709 BCBL 806 HARRISON DR FT LEAVENWORTH KS 66027-2302 1 ARMY RSCH LABORATORY - HRED AMSRD ARL HR MJF J HANSBERGER JFCOM JOINT EXPERIMENTATION J9 JOINT FUTURES LAB 115 LAKEVIEW PKWY STE B SUFFOLK VA 23435 1 ARMY RSCH LABORATORY - HRED AMSRD ARL HR MQ M R FLETCHER NATICK SOLDIER CTR AMSRD NSC WS E BLDG 3 RM 343 NATICK MA 01760-5020 1 ARMY RSCH LABORATORY - HRED AMSRD ARL HR MT J CHEN 12423 RESEARCH PKWY ORLANDO FL 32826 1 ARMY RSCH LABORATORY - HRED AMSRD ARL HR MT C KORTENHAUS 12350 RESEARCH PKWY ORLANDO FL 32826 1 ARMY RSCH LABORATORY - HRED AMSRD ARL HR MS C MANASCO SIGNAL TOWERS BLDG 29808A RM 303 FT GORDON GA 30905-5233 1 ARMY RSCH LABORATORY - HRED AMSRD ARL HR MU 6501 E 11 MILE RD MS 284 BLDG 200A 2ND FL RM 2104 WARREN MI 48397-5000 1 ARMY RSCH LABORATORY - HRED AMSRD ARL HR MF C HERNANDEZ 2421 NW AUSTIN RD STE 220 FT SILL OK 73503-9043 1 ARMY RSCH LABORATORY - HRED AMSRD ARL HR MV S MIDDLEBROOKS 91012 STATION AVE RM 348 FT HOOD TX 76544-5073

NO. OF COPIES ORGANIZATION
26
1 ARMY RSCH LABORATORY - HRED AMSRD ARL HR MN R SPENCER DCSFDI HF HQ USASOC BLDG E2929 FT BRAGG NC 28310-5000 1 ARMY RSCH LABORATORY - HRED AMSRD ARL HR MW E REDDEN BLDG 4 ROOM 332 FT BENNING GA 31905-5400 1 ARMY G1 (CD DAPE MR B KNAPP only) 300 ARMY PENTAGON RM 2C489 WASHINGTON DC 20310-0300
ABERDEEN PROVING GROUND 7 DIR USARL AMSRD ARL CI OK TP S FOPPIANO AMSRD ARL HR P FEDELE T LETOWSKI AMSRD ARL HR MB J LOCKETT AMSRD ARL HR MD D HARRAH AMSRD ARL HR SD B AMREIN AMSRD ARL HR SE L ALLENDER

NO. OF COPIES ORGANIZATION
27
3 DIRECTOR US ARMY NATICK SOLDIER RDE CTR AMSRD NSC TS S H GIROLAMO KANSAS STREET NATICK MA 01760-5056
ABERDEEN PROVING GROUND 9 AMSRD ARL HR SC K MCDOWELL (3 CPS) K OIE (3 CPS) AMSRD ARL HR SE S KERICK (3 CPS)

28
INTENTIONALLY LEFT BLANK.