assessment of cost of cultivation of agricultural
TRANSCRIPT


1
Assessment of Cost of Cultivation of Agricultural
and Horticultural Crops in Tripura
1. Introduction
Tripura is one of the seven states in the north eastern part of India located between 22 degree
and 56 minutes and 24 degree and 32 minutes north latitude and between 90 degree and 09 minutes
and 92 degree and 20 minutes east latitude.
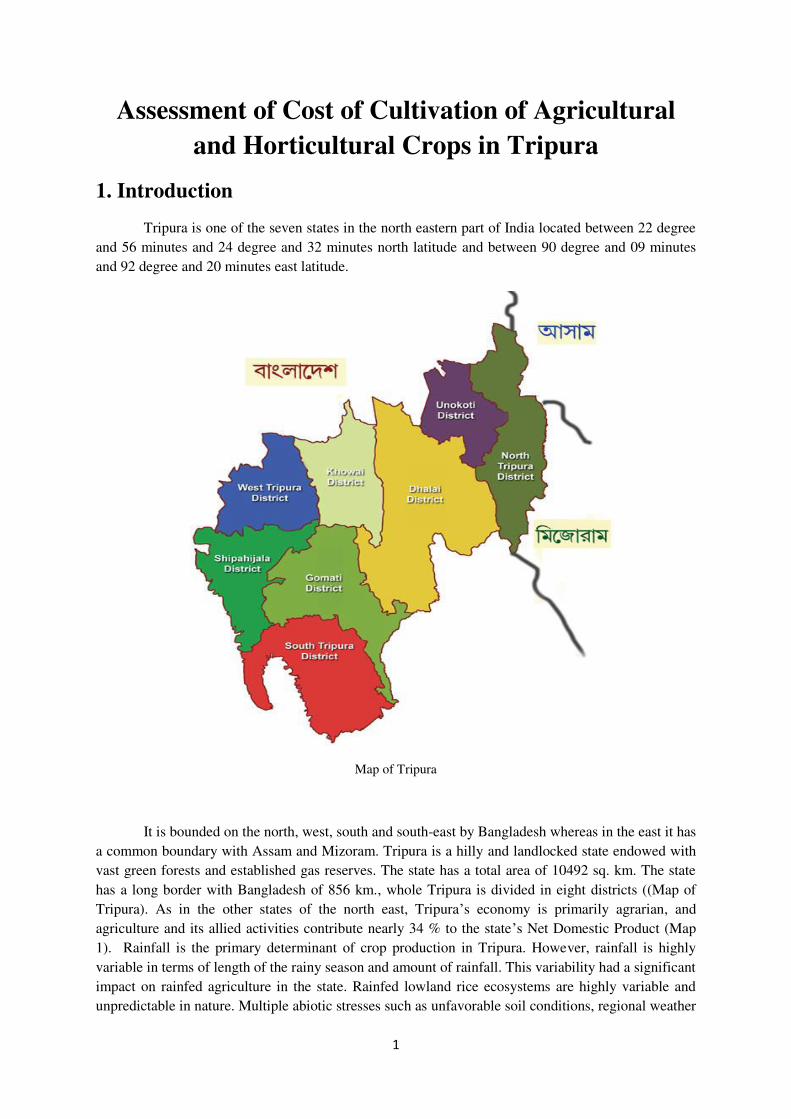
Map of Tripura
It is bounded on the north, west, south and south-east by Bangladesh whereas in the east it has
a common boundary with Assam and Mizoram. Tripura is a hilly and landlocked state endowed with
vast green forests and established gas reserves. The state has a total area of 10492 sq. km. The state
has a long border with Bangladesh of 856 km., whole Tripura is divided in eight districts ((Map of
Tripura). As in the other states of the north east, Tripura’s economy is primarily agrarian, and
agriculture and its allied activities contribute nearly 34 % to the state’s Net Domestic Product (Map
1). Rainfall is the primary determinant of crop production in Tripura. However, rainfall is highly
variable in terms of length of the rainy season and amount of rainfall. This variability had a significant
impact on rainfed agriculture in the state. Rainfed lowland rice ecosystems are highly variable and
unpredictable in nature. Multiple abiotic stresses such as unfavorable soil conditions, regional weather
2
patterns, topography, pests and weeds all contribute to the complexity of the ecosystem. The income
of most farmers is low and they are challenged by erratic yields. The average of rainfall over a long
period of time is showing that the amount of rainfall is sufficient for growing of at least two crops in a
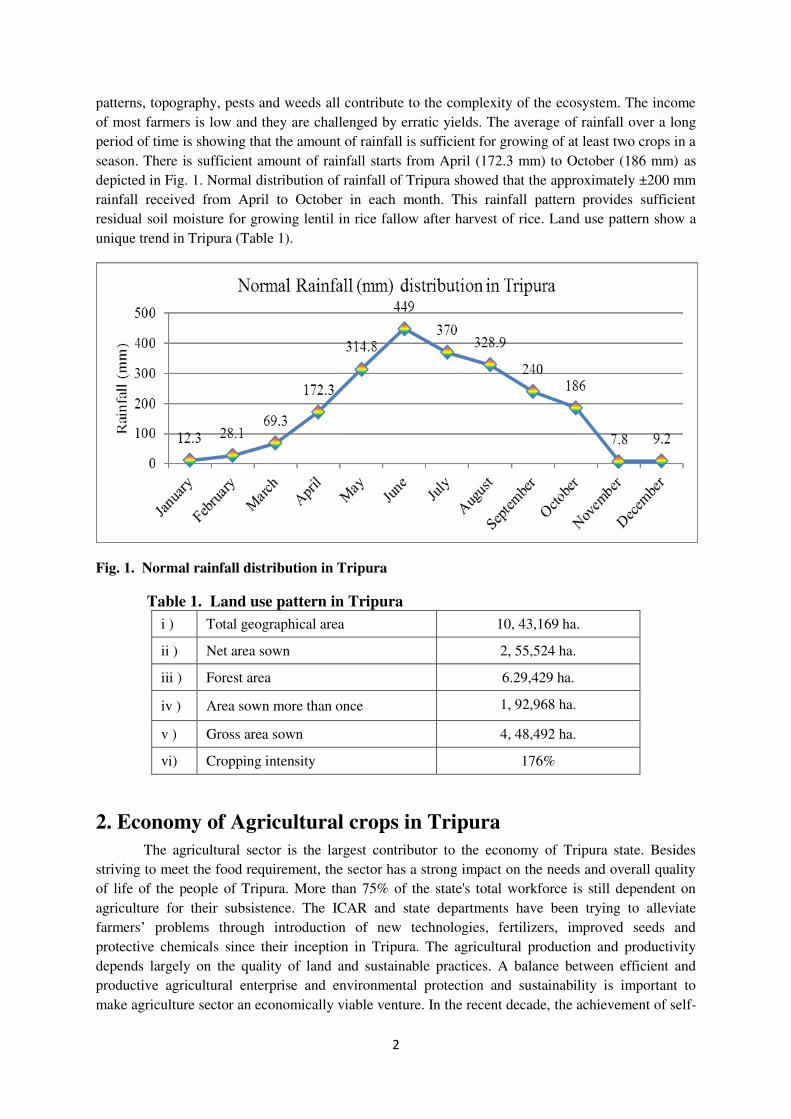
season. There is sufficient amount of rainfall starts from April (172.3 mm) to October (186 mm) as
depicted in Fig. 1. Normal distribution of rainfall of Tripura showed that the approximately ±200 mm
rainfall received from April to October in each month. This rainfall pattern provides sufficient
residual soil moisture for growing lentil in rice fallow after harvest of rice. Land use pattern show a
unique trend in Tripura (Table 1).
Fig. 1. Normal rainfall distribution in Tripura
Table 1. Land use pattern in Tripura
i ) Total geographical area 10, 43,169 ha.
ii ) Net area sown 2, 55,524 ha.
iii ) Forest area 6.29,429 ha.
iv ) Area sown more than once 1, 92,968 ha.
v ) Gross area sown 4, 48,492 ha.
vi) Cropping intensity 176%
2. Economy of Agricultural crops in Tripura
The agricultural sector is the largest contributor to the economy of Tripura state. Besides
striving to meet the food requirement, the sector has a strong impact on the needs and overall quality
of life of the people of Tripura. More than 75% of the state's total workforce is still dependent on
agriculture for their subsistence. The ICAR and state departments have been trying to alleviate
farmers’ problems through introduction of new technologies, fertilizers, improved seeds and
protective chemicals since their inception in Tripura. The agricultural production and productivity
depends largely on the quality of land and sustainable practices. A balance between efficient and
productive agricultural enterprise and environmental protection and sustainability is important to
make agriculture sector an economically viable venture. In the recent decade, the achievement of self-

3
sufficiency in food production in various states was accorded high priority in the food policies of the
country. Tripura, one among the north eastern states of India is also successful in achieving self-
sufficiency in various sectors by increasing its food production in manifolds. But, it has not yet solved
the problem of chronic food security at the household level and year to year fluctuations in food
production.
During the past two decades or so, agriculture sector has experienced many changes in its
production, consumption, distribution and trade regimes due to the changed global economic scenario.
In this ambience, the importance of accurate and up to date information on the economics of
agricultural crops can hardly be overemphasized. The knowledge of the cost and return structure of
different crops is crucial for policy formulation, selecting appropriate production strategies and
identifying regional comparative advantages in crop production. The reliable information on cost and
return of various crops helps the farmers in allocating the scarce resources most optimally. Besides,
such information is of critical importance to the financial and insurance institutions to make
provisions for farm credit and fix insurance premium.
Agriculture in Tripura has traversed a long way during the past decades. The growing
unavailability of landholdings, almost stagnant productivity of all the agriculture and horticulture
crops, livelihood security concerns, increasing incomes, changing consumption patterns and
availability of newer technological options have tempted the farmers to shift to new crops or follow
modern production technology in the state. The major crops of Tripura are grouped broadly under
agriculture crops, vegetable crops and fruit crops, but, area, production and productivity vary from
one agri sub-division to other agri sub-division. The area, production and yield of different agriculture
crops and vegetable are depicted in the following Table 2-6.
Cost of cultivation surveys are carried out to collect data on the various inputs used for the
cultivation of crop. Cost of cultivation surveys are very intensive surveys and is one of the most
important mechanisms for data generation on cost structure of crops. Under these surveys the data are
collected through an inquiry based method, where information on the inputs used for the cultivation of
various crops are obtained by direct inquiry from the farmers or more precisely through the personal
interview method. The farmer is visited repeatedly to record the information on input use correctly
and properly throughout the growth stage of the particular crop i.e. from planting to till the time of
harvest, as the use of input is a continuous process which goes on from beginning to end. Through
these surveys a huge volume of data is generated and the data so collected is generally used to work
out cost per unit area or cost per unit weight. This particular aspect of cost of cultivation surveys is a
problem area, but despite the fact these surveys have been carried out across all the districts of
Tripura. The main objective of the study was to assess actual cost of cultivation incurred by the
farmers for different agricultural and Horticultural crops in the state.
4
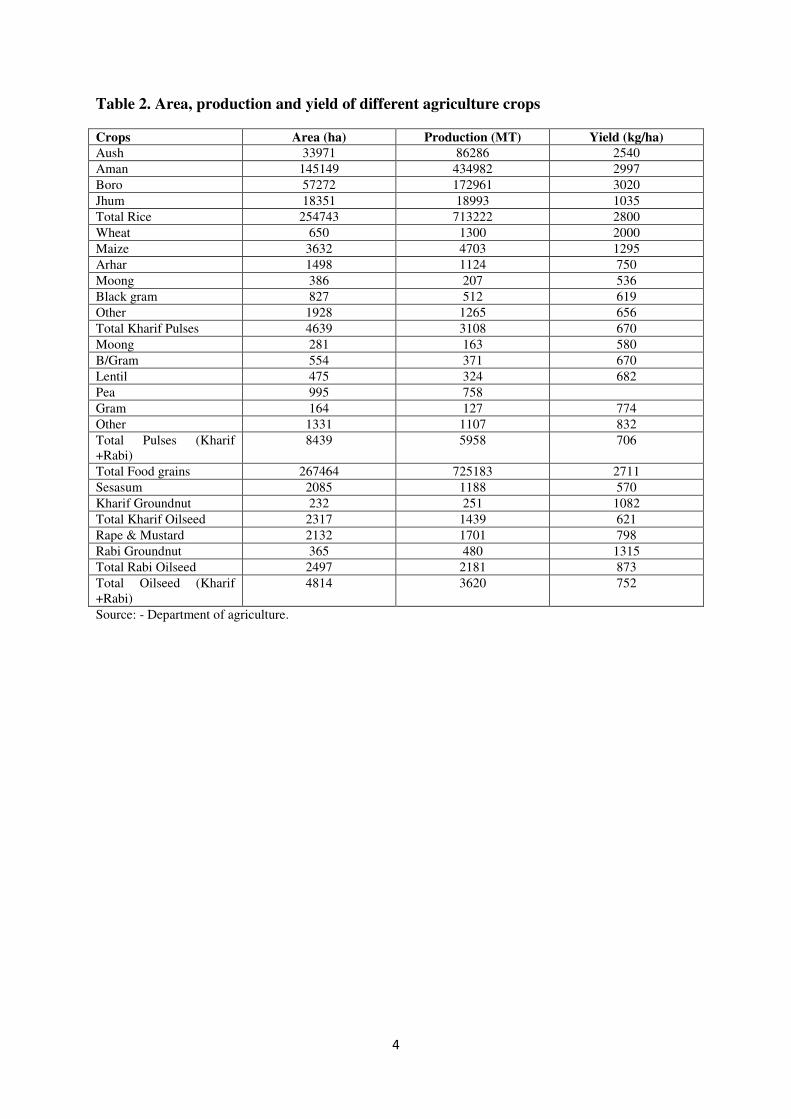
Table 2. Area, production and yield of different agriculture crops
Crops Area (ha) Production (MT) Yield (kg/ha)
Aush 33971 86286 2540
Aman 145149 434982 2997
Boro 57272 172961 3020
Jhum 18351 18993 1035
Total Rice 254743 713222 2800
Wheat 650 1300 2000
Maize 3632 4703 1295
Arhar 1498 1124 750
Moong 386 207 536
Black gram 827 512 619
Other 1928 1265 656
Total Kharif Pulses 4639 3108 670
Moong 281 163 580
B/Gram 554 371 670
Lentil 475 324 682
Pea 995 758
Gram 164 127 774
Other 1331 1107 832
Total Pulses (Kharif
+Rabi)
8439 5958 706
Total Food grains 267464 725183 2711
Sesasum 2085 1188 570
Kharif Groundnut 232 251 1082
Total Kharif Oilseed 2317 1439 621
Rape & Mustard 2132 1701 798
Rabi Groundnut 365 480 1315
Total Rabi Oilseed 2497 2181 873
Total Oilseed (Kharif
+Rabi)
4814 3620 752
Source: - Department of agriculture.
5
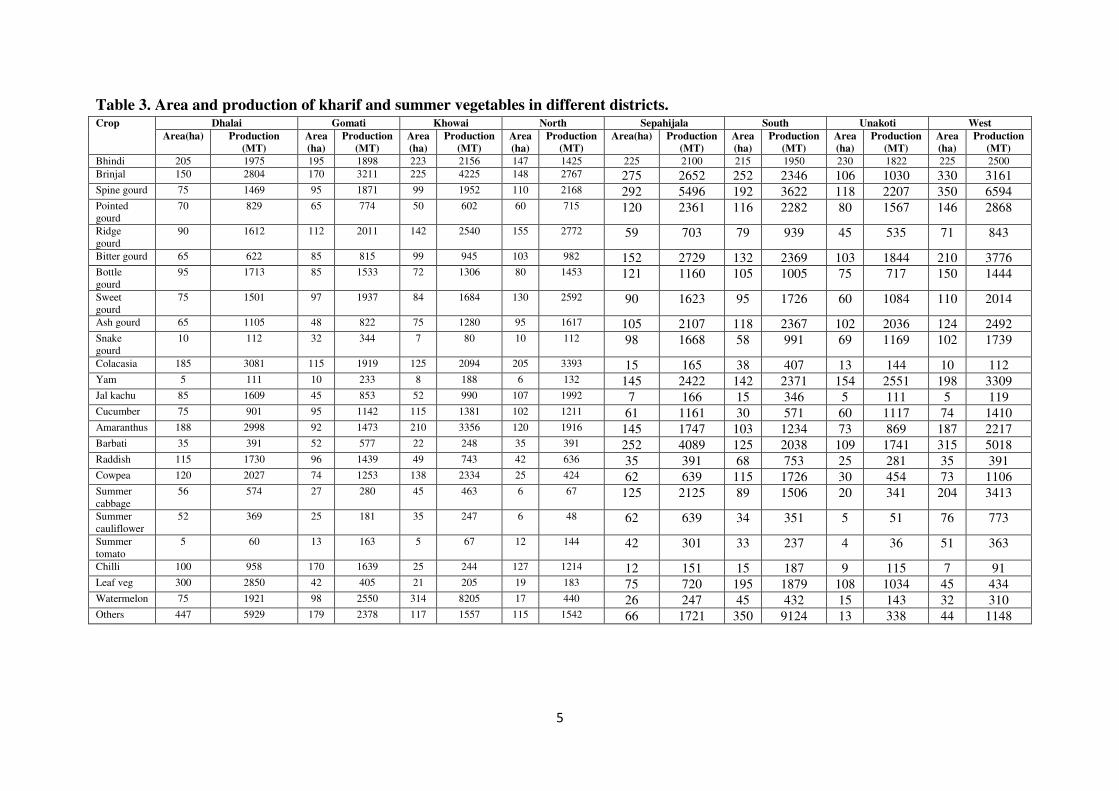
Table 3. Area and production of kharif and summer vegetables in different districts. Crop Dhalai Gomati Khowai North Sepahijala South Unakoti West
Area(ha) Production
(MT)
Area
(ha)
Production
(MT)
Area
(ha)
Production
(MT)
Area
(ha)
Production
(MT)
Area(ha) Production
(MT)
Area
(ha)
Production
(MT)
Area
(ha)
Production
(MT)
Area
(ha)
Production
(MT)
Bhindi 205 1975 195 1898 223 2156 147 1425 225 2100 215 1950 230 1822 225 2500
Brinjal 150 2804 170 3211 225 4225 148 2767 275 2652 252 2346 106 1030 330 3161 Spine gourd 75 1469 95 1871 99 1952 110 2168 292 5496 192 3622 118 2207 350 6594 Pointed
gourd
70 829 65 774 50 602 60 715 120 2361 116 2282 80 1567 146 2868
Ridge
gourd
90 1612 112 2011 142 2540 155 2772 59 703 79 939 45 535 71 843
Bitter gourd 65 622 85 815 99 945 103 982 152 2729 132 2369 103 1844 210 3776 Bottle
gourd
95 1713 85 1533 72 1306 80 1453 121 1160 105 1005 75 717 150 1444
Sweet
gourd
75 1501 97 1937 84 1684 130 2592 90 1623 95 1726 60 1084 110 2014
Ash gourd 65 1105 48 822 75 1280 95 1617 105 2107 118 2367 102 2036 124 2492 Snake
gourd
10 112 32 344 7 80 10 112 98 1668 58 991 69 1169 102 1739
Colacasia 185 3081 115 1919 125 2094 205 3393 15 165 38 407 13 144 10 112 Yam 5 111 10 233 8 188 6 132 145 2422 142 2371 154 2551 198 3309 Jal kachu 85 1609 45 853 52 990 107 1992 7 166 15 346 5 111 5 119 Cucumber 75 901 95 1142 115 1381 102 1211 61 1161 30 571 60 1117 74 1410 Amaranthus 188 2998 92 1473 210 3356 120 1916 145 1747 103 1234 73 869 187 2217 Barbati 35 391 52 577 22 248 35 391 252 4089 125 2038 109 1741 315 5018 Raddish 115 1730 96 1439 49 743 42 636 35 391 68 753 25 281 35 391 Cowpea 120 2027 74 1253 138 2334 25 424 62 639 115 1726 30 454 73 1106 Summer
cabbage
56 574 27 280 45 463 6 67 125 2125 89 1506 20 341 204 3413
Summer
cauliflower
52 369 25 181 35 247 6 48 62 639 34 351 5 51 76 773
Summer
tomato
5 60 13 163 5 67 12 144 42 301 33 237 4 36 51 363
Chilli 100 958 170 1639 25 244 127 1214 12 151 15 187 9 115 7 91 Leaf veg 300 2850 42 405 21 205 19 183 75 720 195 1879 108 1034 45 434 Watermelon 75 1921 98 2550 314 8205 17 440 26 247 45 432 15 143 32 310 Others 447 5929 179 2378 117 1557 115 1542 66 1721 350 9124 13 338 44 1148

6
Table 4. Area and production of winter vegetables
Crop Dhalai Gomati Khowai North Sepahijala South Unakoti West
Area
(ha)
Production
(MT)
Area
(ha)
Production
(MT)
Area
(ha)
Production
(MT)
Area
(ha)
Production
(MT)
Area
(ha)
Production
(MT)
Area
(ha)
Production
(MT)
Area
(ha)
Production
(MT)
Area (ha) Production
(MT)
Cabbage 355 9936 385 10776 345 9657 265 7417 425 11896 475 13295 185 5178 530 14835
Cauliflower 275 6045 295 6484 320 7034 235 5165 395 8682 380 8352 170 3737 475 10441
Brinjal 182 2233 295 3620 245 3006 195 2393 285 3497 365 4479 142 1742 355 4356
Raddish 242 4896 275 5563 275 5563 445 9002 365 7384 312 6312 345 6979 395 7991
Tomato 195 4797 225 5535 195 4797 175 4305 280 6888 260 6396 125 3075 295 7257
Gardenpea 56 216 65 250 45 173 46 177 65 250 85 327 22 85 75 289
Cucumber 95 808 86 731 91 774 75 638 115 978 95 808 45 383 135 1148
Knolkhol 34 389 30 343 24 275 57 652 25 286 35 400 42 480 30 343
French bean 45 170 95 358 59 222 68 256 75 283 105 396 48 181 95 358
Carrot 48 575 45 539 44 527 35 419 60 719 50 559 25 299 65 779
Capsicum 28 218 15 117 10 78 19 148 15 117 17 132 15 117 17 132
7
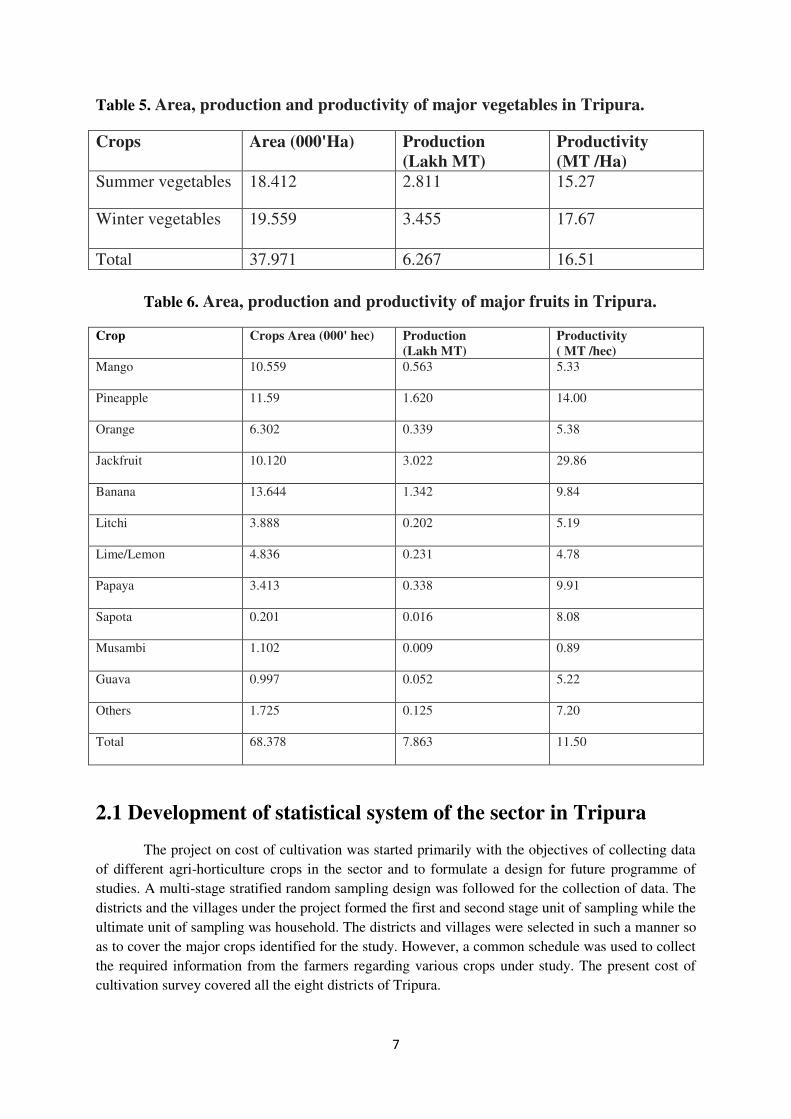
Table 5. Area, production and productivity of major vegetables in Tripura.
Crops Area (000'Ha) Production
(Lakh MT)
Productivity
(MT /Ha)
Summer vegetables
18.412 2.811 15.27
Winter vegetables
19.559 3.455 17.67
Total 37.971 6.267 16.51
Table 6. Area, production and productivity of major fruits in Tripura.
Crop Crops Area (000' hec) Production
(Lakh MT)
Productivity
( MT /hec)
Mango
10.559 0.563 5.33
Pineapple
11.59 1.620 14.00
Orange
6.302 0.339 5.38
Jackfruit
10.120 3.022 29.86
Banana
13.644 1.342 9.84
Litchi
3.888 0.202 5.19
Lime/Lemon
4.836 0.231 4.78
Papaya
3.413 0.338 9.91
Sapota
0.201 0.016 8.08
Musambi
1.102 0.009 0.89
Guava
0.997 0.052 5.22
Others
1.725 0.125 7.20
Total
68.378 7.863 11.50
2.1 Development of statistical system of the sector in Tripura
The project on cost of cultivation was started primarily with the objectives of collecting data
of different agri-horticulture crops in the sector and to formulate a design for future programme of
studies. A multi-stage stratified random sampling design was followed for the collection of data. The
districts and the villages under the project formed the first and second stage unit of sampling while the
ultimate unit of sampling was household. The districts and villages were selected in such a manner so
as to cover the major crops identified for the study. However, a common schedule was used to collect
the required information from the farmers regarding various crops under study. The present cost of
cultivation survey covered all the eight districts of Tripura.
8
2.2 Need for statistical standards
Cost of cultivation surveys are an important data source for decision making at the macro as
well as micro level. Accuracy of information generated out of these surveys is of paramount
importance and this can be ensured by proper planning of the survey, so that the sampling as well as
non-sampling errors are minimized. Proper designing of the survey is of utmost importance and
judicious use of the information available from other surveys and censuses serve the purpose in an
efficient manner. Cost of production studies are undertaken with a view to get information for a class
of cultivators belonging to a particular region or an area called as the population. The number of
farmers in all over the state is expected to be very large and surveying such a large population
involves both cost and time. Hence, sample-based information can be used to draw inferences about
the population with the use of precise sampling techniques. A multistage random sampling has been
used for the present study covering all the eight districts of Tripura, where the household is the
ultimate sampling unit along with districts and villages as first and second stage unit of sampling
respectively.
2.3 Need for precise survey
The information on costs and returns from all crops and initiatives for different regions of the
state is yet to be ascertained and documented on scientific lines at the state level. The more apparent
climatic changes have started impacting agriculture in a big way. Ecological amplitude and niches of
all the crops are getting shifted which have direct implications for the structure of cost and returns of
these crops. New diseases and insect pests are emerging in these crops. Resultantly, the economy of
the small and marginal farmers is being influenced in a big way by these changes. In addition to these,
the farmers of the state face errant natural vagaries such as torrential rains, hail storms and droughts
that wreck the small holders’ economy frequently. Thus, at times the farmers demand the support and
compensation from the state for their unforeseen crop losses. Also, many a time the Government
requires precise information on the costs of cultivation of crops that enter international market so as to
rationalize the duty structure. Since the ground realities in farming are changing very fast, there is a
need to keep track of the changing production costs. In order to meet this requirement, one needs the
most recent cost of cultivation data of major crops, especially agri and horticulture crops grown in the
state so that if the situation demands the farming community be provided appropriate support under
Market Intervention Scheme (MIS). However, such information is not available with any agency in
the state. Therefore, to fill this void the present project was sanctioned by the Directorate of
Economics & Statistics, Planning (Statistics) Department, and Government of Tripura. The specific
objectives of this project are as under:
To estimate the cost of cultivation of major agriculture and horticulture crops in the state and
work out their profitability.
To supply the policy inputs based on these studies to the administrators, policy makers and
planners in the state.
To find out the technological gap of cost of cultivation between marginal farmers & medium
land holding farmers.
3. Methodology
The methodology being followed in present study regarding the production behavior of all
types of horticultural and agricultural crops in Tripura includes both primary and secondary data. The

9
study includes all the eight districts of Tripura. The primary data was collected through a structured
schedule questionnaire containing relevant questions regarding the production behavior of all types of
horticultural and agricultural crops and various costs involved in the production process of various
crops under different villages of every subdivision and sectors (Annexure I and II). The secondary
data was collected from Governmental and Nongovernmental source such as Directorate of
Economics and Statistics, District Agricultural office, Department of Agricultural Statistics and
various governmental bulletins. In order to compute the costs and returns, the standard methodology
used by the Commission for Agricultural Costs and Prices (CACP), New Delhi and The Manual
published by the Central Statistical organization was followed. The standard farm management costs
were computed to fulfill the objectives of the investigation. Data on various aspects of the cost and
returns of selected crops were collected using rapid rural appraisal in the sample villages using
specially designed schedules for this purpose. The data were tabulated and analyzed using appropriate
tools to arrive at the conclusions of the study.
3.1 Selection of study area and method of sampling
Farm level data were collected from eight districts of Tripura. The districts were randomly
selected for investigation because very few attempts have been made earlier in Tripura to investigate
the pattern of growth rate in area, production and productivity of various crop and nature of instability
and variability in production.
A multistage stratified random sampling technique was used to select the ultimate unit of
sample i.e. farmer respondents. Both primary and secondary data were collected for the study.
Primary data have been collected from sample respondent from each and every sector of 8 districts in
Tripura. Under the sampling technique followed for the present study the districts and villages
constituted the first and second stage unit of sampling respectively and the household is the ultimate
sampling unit. A household can be defined as a group of people who share food regularly, and usually
live in the same house or group of houses. A household is classified as farm/farmer household if it
possess some land and if at least one of its member is engaged in agricultural activities. For the
purpose of economic analysis, the farm household is ascertained as the sum of all the productive
activities of its members, remunerated and unremunerated.
Table 7. Financial and Economic Measures based on Stock and Flows
Assets Total stock of resources and products on a given date.
Liabilities Total stock of debts on a given date
Net worth Assets minus Liabilities on a given date. It represents a measure of potential
income.
Gross Income Inflow of value of products during a given period.
Cost Outflow of value of resources used during a given period
Net Income Gross income minus cost during a given period of time represents current benefits.
3.2. Data collection method Interview and observation method were considered as appropriate tools for the present study.
Interview method was considered for the following reasons:
a) To get complete and reliable information of the field situation.
b) To get the information about cost of cultivation of every crop.
c) To get information about economic profit of farmer.
10
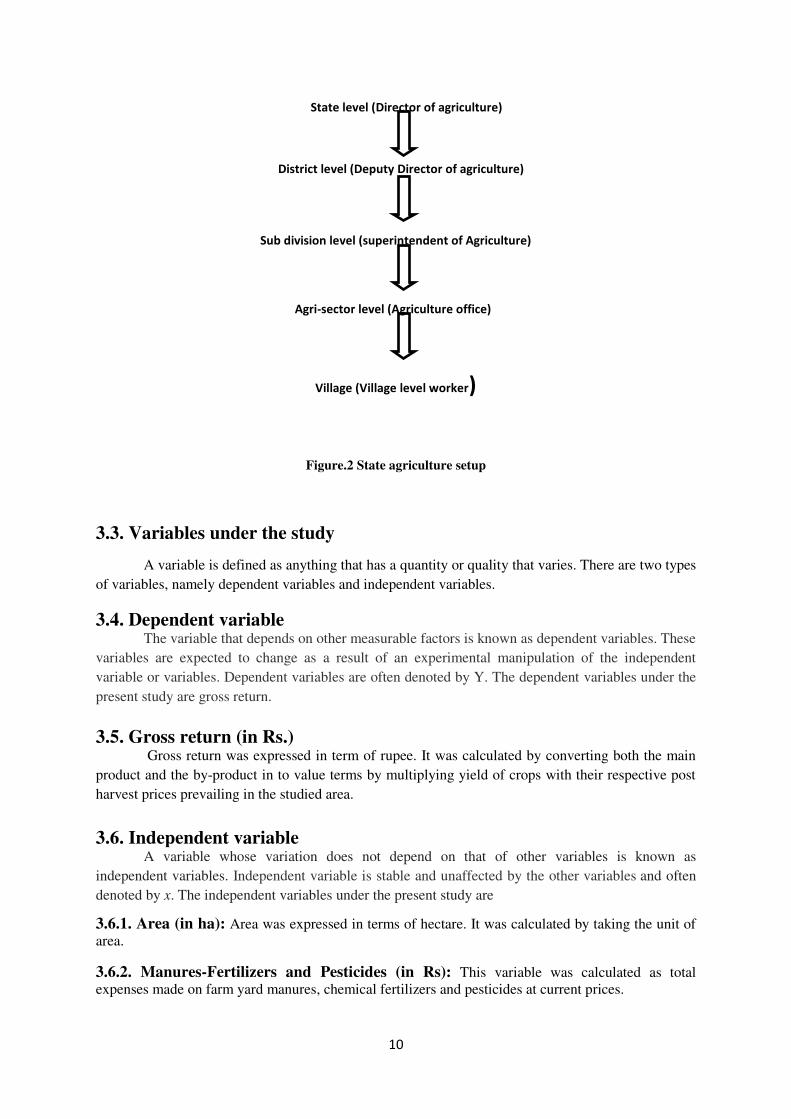
Figure.2 State agriculture setup
3.3. Variables under the study
A variable is defined as anything that has a quantity or quality that varies. There are two types
of variables, namely dependent variables and independent variables.
3.4. Dependent variable The variable that depends on other measurable factors is known as dependent variables. These
variables are expected to change as a result of an experimental manipulation of the independent
variable or variables. Dependent variables are often denoted by Y. The dependent variables under the
present study are gross return.
3.5. Gross return (in Rs.) Gross return was expressed in term of rupee. It was calculated by converting both the main
product and the by-product in to value terms by multiplying yield of crops with their respective post
harvest prices prevailing in the studied area.
3.6. Independent variable A variable whose variation does not depend on that of other variables is known as
independent variables. Independent variable is stable and unaffected by the other variables and often
denoted by x. The independent variables under the present study are
3.6.1. Area (in ha): Area was expressed in terms of hectare. It was calculated by taking the unit of
area.
3.6.2. Manures-Fertilizers and Pesticides (in Rs): This variable was calculated as total
expenses made on farm yard manures, chemical fertilizers and pesticides at current prices.
State level (Director of agriculture)
District level (Deputy Director of agriculture)
Village (Village level worker)
Sub division level (superintendent of Agriculture)
Agri-sector level (Agriculture office)

11
3.6.3. Seeds and planting material (in Rs): This variable was calculated as total expenses made
on seeds at current prices. The cost of vegetable seeds, grafted fruit plants and suckers for banana and
pineapple were considered at the current approved price.
3.6.4. Human labour: Labour units are standard units for the measurement of the stock of labour in
the household, family or hired labour. They are calculated by assigning the appropriate labour unit
equivalent to each household member and multiplying that by the percentage of time the member was
available for work in the farm household during the previous year.
3.6.5. Machine labour: It refers to the machine labour charges incurred through the use of various
farm machineries such as tractor, power tillers etc.
3.7. Methods of measurement of cost items Method of measurement of cost items will depend on the item on which cost is measured.
Given below are some of the methods of valuation of items of cost.
3.7.1. Purchased price: This is a method of valuation of item of cost on the basis of current price
as actual purchase price. It is used for those items of cost which have both short life span and whose
values do not change substantially during short time periods. For example, inputs like fertilizers,
chemicals, feeds and seeds can be evaluated on the basis of purchase price.
3.7.2. Net selling price: It is the selling price minus cost of marketing. Used for farm products sold.
3.7.3. Imputed value: The family labour is an important input in the enterprise, but no money is
paid by the farmer to his family members for the work done on the farm. Cost assessment in respect
of such items is made by using imputed value of cost. Family labour cost is generally imputed on the
basis of prevailing wage rate in the locality. It may be noted that the family of a farmer may comprise
male, female or young children all of which may be doing some work on the farm.
3.7.4. Replacement cost less depreciation: It is generally used for property whose value changes
appreciably from year to year.
3.7.5. Allocation of joint costs: In case more than one crop is grown on a farm it is very important
to determine cost incurred on various items as are used on individual crops. While correct assessment
of crop specific costs are impossible, reasonably good estimates of costs can be obtained by following
the standard procedures of allocation of joint costs.
3.7.6. Depreciation of farm buildings: It can be charged to the individual enterprise in proportion
to the total area under the enterprise in case the building is used for different enterprises. However, if
the building is used for single enterprise, the entire depreciation can be charged to that particular
enterprise only.
3.7.7. Depreciation of farm machinery, tools and implements: Like the farm buildings here
also the depreciation or minor repairs can be charged to individual enterprise in proportion to the area
under a given enterprise. Alternatively, time spent on individual enterprise by a given machine / tool
and implement can form the basis for charging depreciation.

12
3.7.8. Taxes and rental for land: These can be allocated to the different enterprises in proportion
to the land occupied by the individual enterprise.
3.7.9. Maintenance of farm animal costs: These would be allocated on the basis of proportion of
time the animal labour is used for the respective enterprise.
3.8. Classification of cost items
There are several cost components involved in the crop production which constitute the cost
of production of a particular crop. Accurate measurement of all the components of costs is thus of
crucial importance for correct assessment of cost of production of any particular crop.
Costs incurred on a farm can be classified as cash cost or non-cash cost. Cash Costs are the
costs for which farmer spends money for acquisition of material inputs like seeds, fertilizer, chemicals
or labour inputs like hired labour etc. On the other hand, non-cash costs are attributable to items of
cost, which do not require spending money. These may be items of cost like family labour, payments
made in kind, home grown seeds, manure etc, exchange labour, depreciation, interest on operating
capital etc.
Another way of classifying costs are treating them as variable or fixed costs, although some
of the costs may be treated as fixed or variable depending on the time at which they are incurred. This
is due to the fact that in short term some of the costs are variable while others are fixed. However, in
the long run all costs are variable.
3.8.1. Fixed cost: These costs are related to fixed resources and are overhead costs. They remain
constant irrespective of the yields obtained. Fixed cost considered for cost of production calculation of
crops includes land rent, interest on fixed capital, depreciation of building and farm machineries, taxes
and wages of the permanent laboures. In the present study, the land revenue was not taken into
consideration for cost of cultivation calculation as the land area belonging to each farmer under the
study was less than one ha and mostly acquired through inheritance.
3.8.1.1. Depreciation: In the present study, depreciation charges of fixed assets are worked out by
the Straight Line Method using the formula:
Original cost – Junk value
Depreciation = ⎯⎯⎯⎯⎯⎯⎯⎯⎯⎯⎯⎯⎯
Life of the asset
3.8.1.2. Rental Value of Land: A number of alternative procedures to compute rental value for
owned land have been suggested in various literatures. The important methods among them are -
a) An appropriate rate of interest on the value of land.
b) Market rent
c) A fixed proportion of the output.
In the present study the land rent was not taken into consideration for cost of cultivation
calculation as the land area belonging to each farmer under the study was own land and mostly
acquired through inheritance.

13
3.9. Variable cost
These costs are related to the variable resources and change with the output. The variable
costs are nil, if there is no production on the farm. They change with the quantity of production. In the
beginning, as the production increases variable costs rise quite rapidly, but with further rise in
production variable costs do not increase proportionately with the production and in later part the
variable costs start rising more rapidly than the production. The variable cost includes all the current
supplies such as seeds, fertilizers, irrigation, insecticides, hired labour charges, interest on working
capital.
3.9.1. Cost of seed and planting material (in Rs.): It is calculated by multiplying the amount of
seeds or numbers of plants used in the farm for respective crops with their respective current market
prices.
3.9.2. Cost of manure and fertilizers (in Rs.): It is also calculated by multiplying the amount of
manures and fertilizers used in the farm with their respective current market prices.
3.9.3. Cost of herbicides and pesticides (in Rs.): It is calculated by multiplying the amount of
herbicides and pesticides used in the particular farm with their respective current market prices.
3.9.4. Human labour cost (in Rs.): It was expressed in terms of rupees by converting one
standard man day equal to Rs.300. Eight hours of an adult man’s work was considered as standard
man-day. It includes hired labour and imputed cost on family labour etc. The child and women
labours were converted in to man labour days by taking ratio of 1:0.75:0.5 for men, women and child
labour respectively. Different labour unit equivalents are assigned to men and women in some
countries justifying the lower pays to women. It is observed that men and women doing the same
work do not show any significant difference in work efficiency, therefore, labour flow (inputs) should
not be weighted by labour units equivalents. If actual hours are measured, and not days, the lower
productivity of youth and old people will be reflected in the shorter hour worked.
3.9.5. Machine labour cost (in Rs.): It was measured in terms of rupee by counting machine cost
per hour at Rs. 300.
3.9.6. Irrigation charges (in Rs.): Irrigation charges are calculated by considering the method of
irrigation for the particular farm under study. When irrigation in the crop fields requires operation of
pump sets then the irrigation charges are calculated considering the operation cost and fuel cost etc.
3.9.7. Fixed cost (in Rs): The fixed cost (Cost B) related to different crops under the present study
includes land rent, depreciation value and others. Land revenue was not included in the calculation of
fixed cost, as most of the farmers under study have less than 1 ha of land as their operational holding
for particular crops.
3.9.8. Total cost: Both the fixed and variable cost together form the total cost of production of each
unit of crop. Even when the variable costs are nil, the total cost remains there in the form of fixed
costs. Total cost includes total economic cost of production and is made up of variable costs, which
vary according to the quantity of a good produced and include inputs such as labor and raw materials,
plus fixed costs, which are independent of the quality of a good produced and include inputs that
cannot be varied in the short term such as building and machinery.
Total cost/unit = Fixed cost/unit + Variable cost/unit
14
Thus, labour employed on a daily basis is variable while a permanent farm labour is to be
considered fixed for a short period of time. Variable costs vary directly with the production. The
greater the production, greater are the variable costs. Variable costs may be either cash costs or non
cash costs. Examples of variable cash costs are seeds, fruit crop planting materials, fertilizers,
pesticides, hired labour etc. On the other hand, payments made in kind are the variable non-cash costs.
Care need to be taken that the payments made in kind are accounting for only once. Unpaid family
labour is considered as a variable cost only if there are alternative employment opportunities. In case
alternative employment opportunities do not exist the unpaid family labour cost need not be included.
Again whether or not to include the unpaid family labour cost will depend on the objective of the
study. Thus, if farms of different labour sources are to be compared, ignoring the unpaid family labour
cost will underestimate the cost. The land rent paid is an example of fixed cash cost. Land rent paid in
kind, depreciation of farm machinery, tools and equipments, farm buildings and the cost of
maintaining farm work animals are the examples of fixed non-cash costs.
3.10. Cost structure Costs are generated following certain cost concepts. These cost concepts and item of cost
included under the present study are given bellow:
3.10.1. COST A: All the costs related to labour, planting material/seeds and inputs etc.
I. Value of human labour
II. Value of hired bullock labour
III. Value of hired machinery charges
IV. Value of seed(both farm produced and purchased)
V. Value of insecticides
VI. Cost of manures
VII. Cost of fertilizer
VIII. Irrigation charges
IX. Miscellaneous expenses
3.10.2. Cost B: Fixed Cost (Land rent, depreciation and other) which has been estimated as per the
provision.
3.10.3. Cost C: Total Cost (Cost A+ Cost B)
3.10.4. Gross Return: Total income generated from the sale of farm produce including both the
main product and the by product. Gross rate of return is the total rate of return on an investment
before the deduction of any fees or expenses. The gross rate of return is quoted over a specific period
of time, such as a month, quarter or year.
3.10.5. Net Return: Net return is calculated by deducing all incurred expenses from the gross return
of a particular farm. It is the entity’s income remaining after the deductions of all expenses i.e. total
cost.
Net return = (Gross return – Total cost)
3.10.6. Benefit cost ratio (BC ratio): The benefit-cost ratio is calculated by dividing the total
value of benefits by the total value of the cost. The particular crop is considered to be profitable when
the benefit-cost ratio is equal to or greater than one i.e. BCR ≥ 1.
BC Ratio = (Gross Return/Total Cost)
15
3.11. Crops under the study: Various agricultural and horticultural crops widely grown in
Tripura have been taken into consideration under the present study.
3.11.1. Paddy: Paddy is the staple food of India. It is one of the most widely adaptable crops in India
It covers wide range of area among all the crops but due to low benefit the area of rice is reducing day
by day. Most of the farmers grow the low yielding old rice varieties with traditional system of
cultivation. Most of the farmers in Tripura grow paddy as a main crop.
3.11.2. Maize: Maize is one of the cereal crop cultivated in Tripura. The production of Maize
in Tripura is low due to low interest of farmer of the crop. Maize is grown under the agri-sub
division of Panisagar, Kumarghat, Kailashahar, Padmabill, Tulashikhar, and Sabroom.
3.11.3. Ground Nut: Ground nut is one of the important oil seed crop cultivated in Tripura climatic
condition. Farmer’s of Tripura presently grown ground nut for homestead purpose only.
3.11.4. Sesame: The crop is mostly cultivated by small and marginal farmers under rainfed
conditions. An integrated effort with support services would help the farmers realise higher yields and
returns for their efforts.
3.11.5. Mustard: Mustard is one of the most important oilseed crops in Tripura cultivated mainly as
a rainfed crop, grown either as line sowing or broadcast.
3.11.6. Lentil: Lentil was sown under different methods of establishments in Tripura condition.
Farmers recently attempt to cultivate it on large scale in different region of Tripura.
3.11.8. Horticultural crops
Fruit crops of Tripura
Tripura state is blessed with such favourable agro climatic conditions that it can nurse various
kinds of fruit plants. Bananas, Pineapple, Mango, Mandarin Orange, Musambi, Guava, Jackfruit,
Lime and Lemon etc. are the major fruit crops which are grown by the farmer. However, systematic
plantation of fruit crops is not found in most of the villages in the state. Recently, under various
developmental schemes new orchards have been established in various agri-sectors. Most of the fruit
crops are grown in sloppy land and upland of the state. Farmers do not apply much fertilizer in fruit
crops. Many of them are getting the facilities from government sector as beneficiary. Very few
farmers are following prescribed amount of fertilizer and method. In Tripura most of the month wet
with rain so farmer do not irrigate fruit plants.
In Teliamura subdivision Mousambi, Mango and banana are cultivated and Orange is
specially grown in Mungiyakami agri sector. Mango and Cashew nut are cultivated in private and
government orchard under the Belonia agri subdivision. In Panisagar Subdivision the local people are
growing their own orchard on a huge manner they are growing different fruit crops there specially
Mango (Amrapali), Orange etc. Banana and Mango are grown in most of the agri subdivision.
Pineapple is specially grown in Sabroom, Padmabil, Tulashikhar, Kanchanpur agri subdivision. In
West district, Amrapali mango, Mosambi, Guava, Banana and Pineapple etc. are commonly grown.
3.10.9. Winter vegetable crop
3.10.9.1. Cabbage & Cauliflower: In case of cauliflower the farmers were applying less of both
nitrogen and potash as against the recommendations. However, in cabbage the use of all the three
nutrients of nitrogen, phosphorus and potash was much less than the recommended doses.From
Khowai, Amarpur, Teliamura, Panisagar, Kumarghat, Kanchanpur, Sabroom, Belonia, Rupaichari

16
Subdivision was selected for studying the costs and returns of cabbage and cauliflower as this belt has
emerged as the major season production centre of these crops.
3.10.9.2. Potato: Khowai, Teliamura, Tulashikhar, Shabroom and Beloniya were chosen for
estimating the costs and returns of potato crop because the former is known for production of seed
potato throughout the country and they are contributor to the potato production in the state. The FYM
application was well below the recommendation. The farmers were found to use imbalanced doses of
fertilizers in this crop. Especially in Khowai, the farmers were applying higher phosphorus, potash
and double times higher nitrogen as per the recommended doses.
3.10.9.3. Radish: Reddish is grown in few pockets of Tripura as mainly Winter vegetable crops,
mainly in South region of Tripura i.e. Belonia, Rupaichari, Hrishyamukh, Sabroom, part of
Kailashahar and Jirania. Being short duration vegetable crop, it is highly profitable in term of
growing with low inputs of fertilizers n irrigation implements. It is popular table crop used for salad &
culinary purpose.
3.10.9.4. French bean: French bean is an important and highly profitable vegetable crop of North
Eastern Hill Region of India. It occupies an important position among various Khariff pulses. The
productivity of French bean will meet the increasing demand for green vegetables of the region.
3.10.9.5. Cucumber: Cucumber is a very high value vegetable crop in the state. This crop is grown
in winter as well as in summer season.
3.10.9.6. Tomato: Tomato is cultivated mainly during winter season. This crop is also very
profitable for the farmers, though, cost of cultivation is high due to its pest and disease management
and staking.
3.10.9.7. Capsicum: This crop is high value crop and is sold at very high rate in the market.
Growing season is winter. Only selected farmers grow this crop. Rate of capsicum seed is also high
and along with management cost, its cultivation cost is very high. However, return is also high.
3.10.10. Summer Vegetable
3.10.10.1. Brinjal, Bhindi and Chilly: These vegetable crops are widely cultivated crops in
Tripura. Almost in all agri subdivision these are common crop grown by farmers round the year and
also have good market facility so farmers are interested in these crops.
3.10.10.2. Pointed gourd and Spine gourd: These crops are mostly cultivated in Teliamura Sub
division, Melaghar Subdivision, Satchan agri subdivision. The cost of cultivation of these crops is
very high due to high rate of stacking fencing and planting material. But its market rate and yield is so
high which is influencing the farmers for growing these crops.
3.10.10.3. Ridge gourd: This vegetable crop is one of the highest growing crops in Tripura. It is
extensively grown in south Tripura mainly Hrishyamukh, Belonia, Rajnagar, Rupaichari, Sabroom
and other parts of Tripura. It is an important commercial crop fetching good yield and investment
returns to the farmers. Now days it is growing throughout the year where irrigation facility is
available. Usually this vegetable crop has creeping nature, hence require good support for its vine for
good quality and high yield.

17
3.10.10.4. Bottle gourd and pumpkin: Though these crops are grown in winter as well as in
summer season. Farmers get very good return from these two crops.
3.10.10.5. Bittergourd: Bittergourd is a profitable crop grown in late winter and summer season.
Table 8. List of Districts, Agri-Subdivision and sector in Tripura
SL.No. District SL.
No.
Agri-subdivision SL.
No.
Sector
1.
2.
3.
4.
KHOWAI
WEST
SEPAHIJALA
GOMATI
1
2
3
4
5
6
7
8
9
10
11
Khowai
Tulashikhar
Teliamura
Manwdi
Jirania
Dukli
Mohanpur
Bishalgarh
Melagarh
Matabari
Amarpur
1.
2.
3.
4.
5.
6.
7.
8
9.
10.
11.
12.
13.
14.
15.
16.
17.
18.
19.
20.
23.
24.
25.
26.
27.
28.
29.
30.
31.
32.
33.
34.
35.
Gonki.
Singhicherra
Chebri
Hatkata
Ampura
Rajnagar
Bachaibari
Teliamura
Krishnapur
Mungiakami
Gilatali
Mandwi
Sumily
Jirania
Belbari
Badharghat
Sekherkote
Mohanpur
Lefunga
Hezamara
Bishalgarh
Bishramganj
Madhupur
Charilam
Jampuijala
Boxanagar
Kathalia
Melagarh
Killa
Matabari
Kakraban
Amarpur
Ampi
Tuidu

18
36.
37.
38.
Karbook
Chechua
Natunbazar
SL.No. District SL.
No.
Agri-subdivision SL.
No.
Sector
5.
6.
7.
8.
SOUTH
DHALAI
UNOKATI
NORTH
12
13
14
15.
16.
17.
18.
19.
20.
21.
Bagafa
Satchand
Rajnagar
Salema
Gandacherra
Chawmanu
Kumarghat
Kadamtala
Kanchanpur
Panisagar
39.
40.
41.
42.
43.
44.
45.
46.
47.
48.
49.
50.
51.
52.
53.
54.
55.
56.
57.
58.
59.
60.
61.
62.
63
64.
65.
66.
67.
68.
Bagafa
Sabroom
Krishnanagar
Rupaichari
Belonia
Rajnagar
Hrishyamukh
Salema
Durgachowmuni
Ambasa
Kamalpur
Gandacherra
Tuichakma
Rasyabari
Chawmanu
Manu
Chailengta
Kameshwar
Gournagar
Kumarghat
Kailashahar
Pecharthal
Fatikray
Kadamtala
Jubarajnagar
Dosda
Jampui
Kanchanpur
Panisagar
Damcherra

19
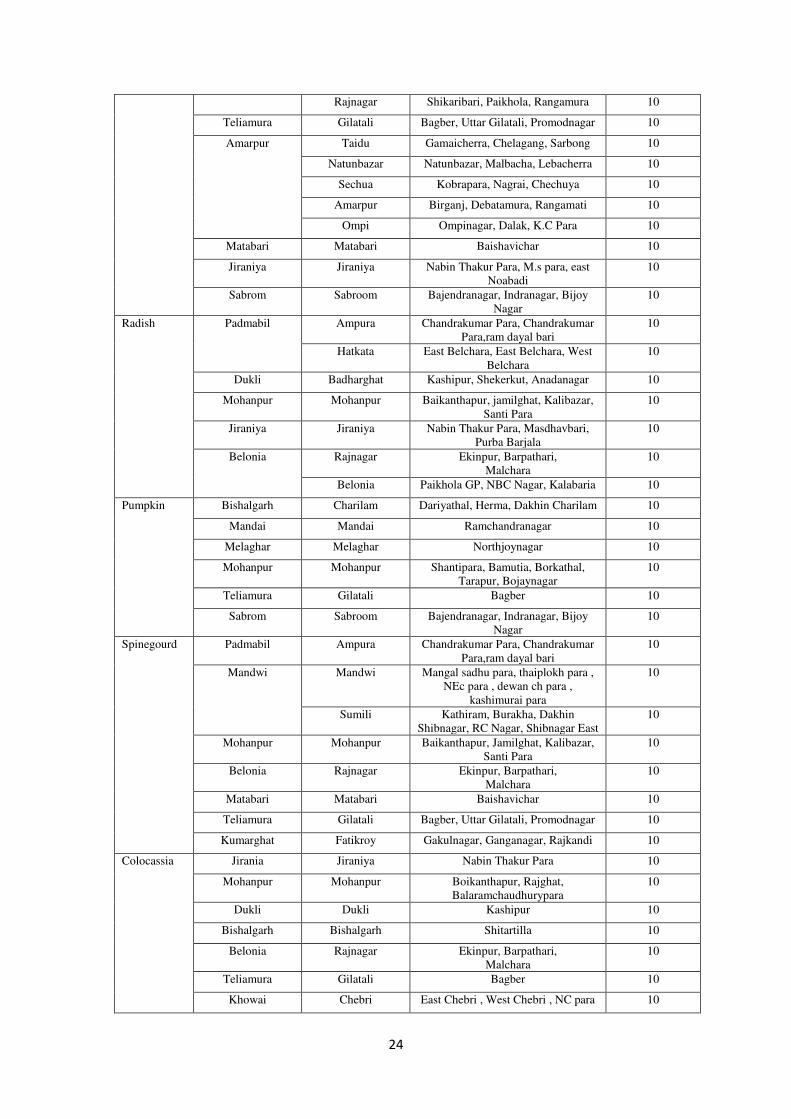
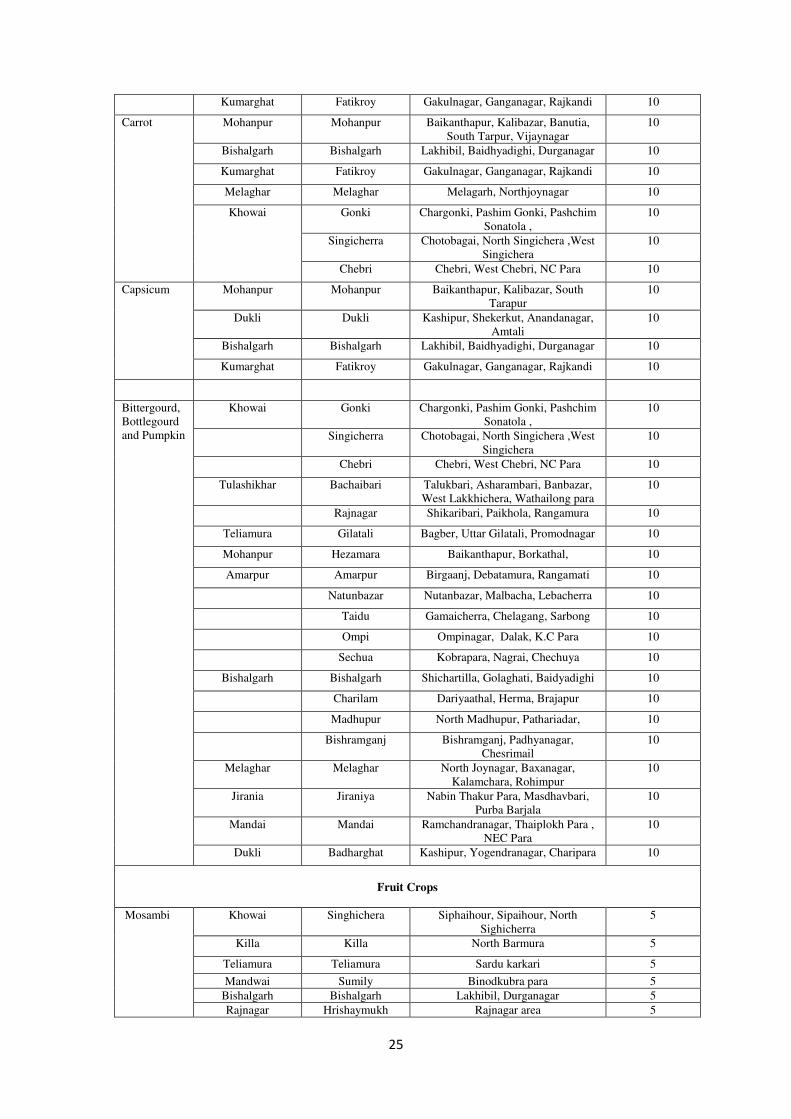
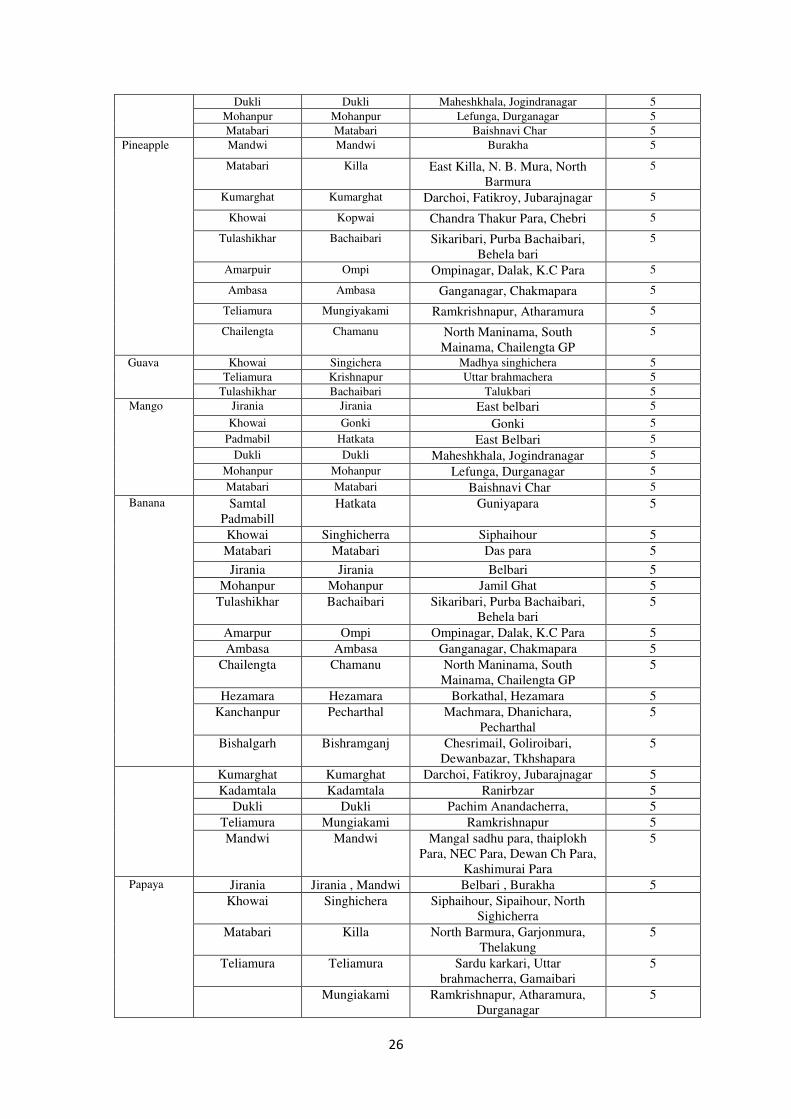
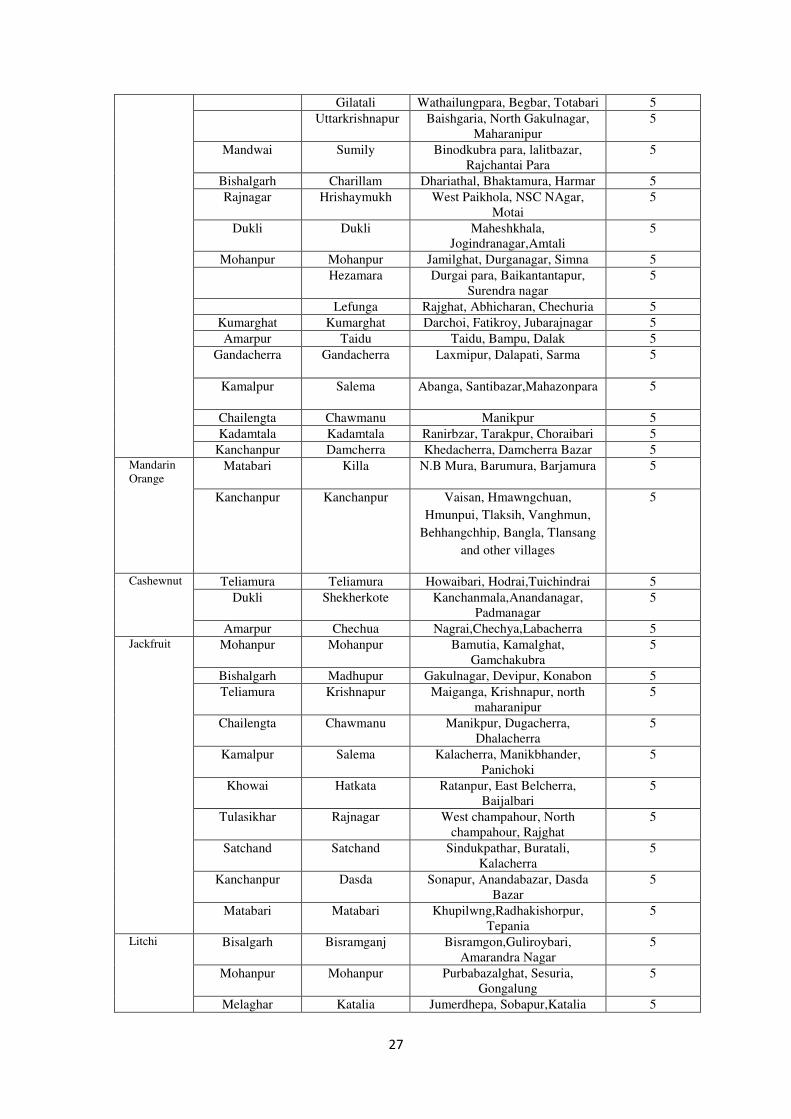
Table 9. List of agri-subdivision, agri-sector and sample villages with number of farmers
selected for each crop.
Name of the
Crop
Agri Subdivision Agri Sector Village No of Farmer
Paddy Khowai Gonki Chargonki, East Sonatala, Madhya
Gonki
10
Singichera East Singhicherra, Choto Bagai ,
KMC Nagar
10
Chebri East Chebri , West Chebri , NC
para ,
10
Tulashikhar Bachaibari Asharambari, Banbazar, West
Lakkhichera
10
Rajnagar Shikaribari, Holongmwtai, West
Champahour
10
Mohanpur Mohanpur Jamilghat, Kamalghat, Santipara 10
Lefunga Lefunga, Baganpara,
Sukumany Para
10
Padmabill Hatkata East Belchara, Monaicherra,
Gonyaman
10
Ampura Chandrakumar Para, Upendrabari,
Paglabari
10
Teliamura Gilatali Bagber, Uttar Gilatali ,Promodnagar 10
Teliamura Gamaibari, Khaisyamngal,
Madhyacherra,
10
Mongiakami Atharamura, Mungiakami, Longtarai 10
Uttar Krishnapur Uttar Krishnapur, Chakmaghat,
Kakrachera,
10
Bishalgarh Bishalgarh Sichartilla, Gakulnagar,
Laxmibill
10
Charilam Dariyaathal, South Charilam, Herma 10
Bishramganj Bishramganj, Masterpara,
Dewanbazar
10
Madhupur Noth Madhupur, Debipur,Kunaboon 10
Mohanpur Mohanpur Jamilghat 10
Shantipara 10
Lefunga Bagan Para, Borkathal, Gamchakobra 10
Hezamara
Hezamara Baikantapur. Surendra Nagar, Purba
Takanari,
10
Amarpur Amarpur Birgaanj, Debatamura, Rangamati 10
Natunbazar Nutanbazar, Malbacha, Lebacherra 10
Taidu Gamaicherra,Chelagang, Sarbong 10
Ampi Ampinagar, Dalak, K.C Para 10
Chechuya Kobrapara, Nagrai, chechuya 10
Sabroom Krishnanagar Srinagar, Krishnanagar,
Madhur nagar
10
Sabroom Bajendra Nagar, Indranagar, Bijoy
Nagar
10
Satchand Sinduk pathar, Manu Bazar,
Maicherra
10
Belonia Rajnagar Paikhola, Rangamura 10
Hrishyamukh Motai, Krishnagar, Aboynagar 10
Panisagar Panisagar West Panisagar, Bagbasa
Yuvrajnagar
10
10
Kanchanpur Pechartall Pechartall, Masmara 10
Kanchanpur South Laljuri,Kanchancherra,
Santipur
10
Dasda Radhamadhabpur, Dhanicherra,
Anandabazar
10
Kumarghat Kumarghat Dudhpur, Sonaimuri, Bathcherra 10

20
Fatikroy Fatikroy 10
Matabari Matabari Gakulpur, Gorgi, Murapara 10
Kakrabon Kakrabon, Ushamara, Kushamura 10
Tepania Gourjanmura 10
Killa Killa North Barmura,Killa, Dewanbari 10
Jirania Jirania Thaiplok, Chargoria Jirania 10
Dukli Sekhercot Pachim Anandanagr, Bikramnagar,
Suryamoni
10
Melaghar Melaghar Telgasia, Bordwali, Durlobhnagar 10
Boxanagar Madhya Boxnagar, Kalsimura,
Kulubari
10
Katalia Subashnagar, Gundhi Khala, Kathalia 10
Mandwi
Padmabill
Mandwi Burakha, Kathiram, Mandwi 10
Sumily Lakhxmipur, East Noabadi, East DB
Nagar
10
Maize Hatkata East Belchara 10
Kailashahar Kailashahar Guldharpur 10
Kumarghat Kumarghat Dudhpur 10
Fatikroy Fatikroy 10
Panisagar Kameshwar Guldharpur 10
Tulasikhar Rajnagar Sikharibari 10
Sabroom Krishnanagr Srinagar 10
Satchand Sindukpathar 10
Krishnanagar Srinagar 10
Groundnut Sabroom Satchand Sinduk pather 10
Tulashikhar Bachaibari Talukbari 10
Rajnagar Sikharibari 10
Teliamura Telimura Sardukarkari 10
Mustard Kailashahar Kailashahar Guldharpur 10
Kumarghat Kumarghat Dudhpur 10
Fatikroy Fatikroy 10
Teliamura Teliamura North Gakulnagar 10
Sesame Panisagar Kameshwar Yubrajnagar 10
Kanchanpur Pecharthall Pecharthall 10
Kailashahar Kailashahar Guldharpur 10
Sabroom Satchand Srinagar 10
Teliamura Mungiakami Ramkrishnapur 10
Lentil Hezamara Hezamara Durgaipara, Borkathal 10
Melaghar Melaghar Durlob narayan 10
Amarpur Ompi Ompinagar 10
Teliamura Teliamura Sardukarkari 10
Rajnagar Hrishyamukh Matai, Jaikatpur 10
Mohanpur Mohanpur Bamutiya 10
Vegetable Crops
French bean Melaghar,
Bishwalgarh,
Khowai,Mohanpur,
Jirania
Melaghar,
Bishwalgarh,
Khowai,Mohanpur,
Jirania
Durlob Nagar, Srichurtiila, Gonki,
Jamilghat, Subhasnagar
10
Cauliflower Khowai Gonki Chargonki, Paschim Sonatola,
Pashchim Gonki, Jambura, Dakhin
Sonatola
10
Amarpur Amarpur Birgaanj, Debatamura, Rangamati 10
Natunbazar Nutanbazar, Malbacha, Lebacherra 10
Taidu Gamaicherra 10
Sechua Kobrapara, Nagrai, chechuya 10
Teliamura Teliamura Uttarbrahmacharra, Gamaibari,
Khaisyamngal
10
Dukli Sekherkot Pachim Anandanagar, Bikramnagar,
Suryamoni
10
Bishalgarh Madhupur Uttar Madhupur, Debipur, Kunaboon 10
21
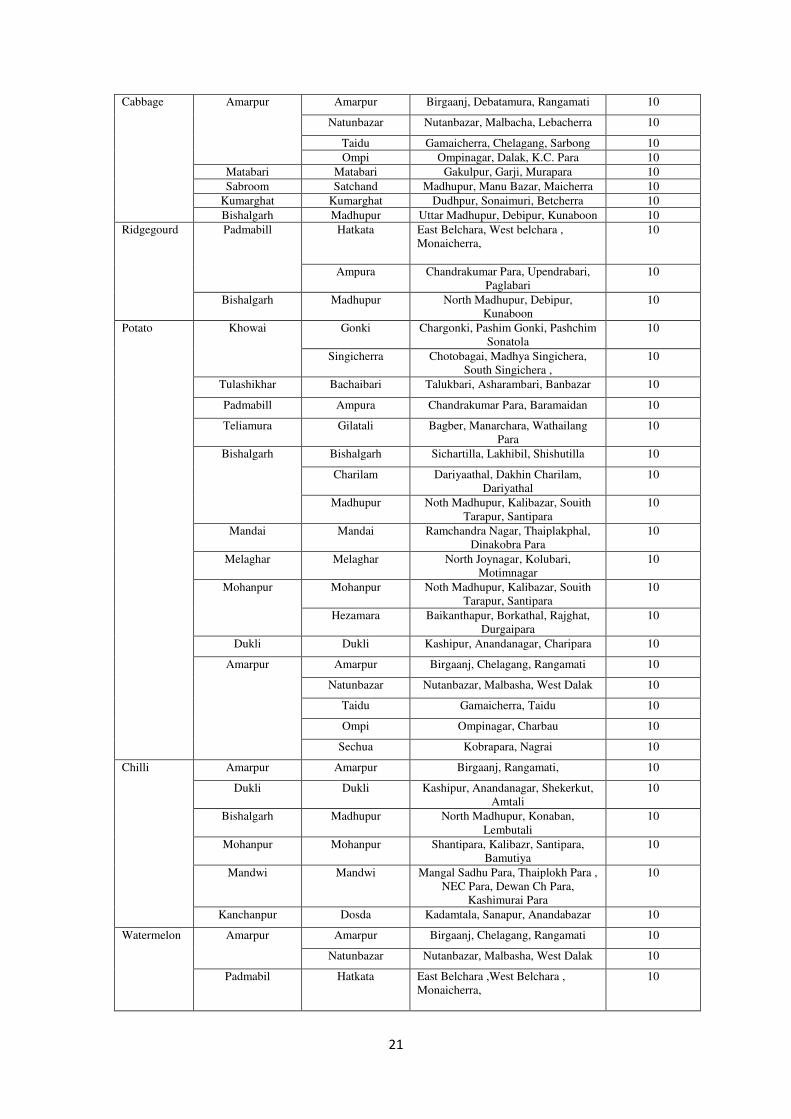
Cabbage Amarpur Amarpur Birgaanj, Debatamura, Rangamati 10
Natunbazar Nutanbazar, Malbacha, Lebacherra 10
Taidu Gamaicherra, Chelagang, Sarbong 10
Ompi Ompinagar, Dalak, K.C. Para 10
Matabari Matabari Gakulpur, Garji, Murapara 10
Sabroom Satchand Madhupur, Manu Bazar, Maicherra 10
Kumarghat Kumarghat Dudhpur, Sonaimuri, Betcherra 10
Bishalgarh Madhupur Uttar Madhupur, Debipur, Kunaboon 10
Ridgegourd Padmabill Hatkata East Belchara, West belchara ,
Monaicherra,
10
Ampura Chandrakumar Para, Upendrabari,
Paglabari
10
Bishalgarh Madhupur North Madhupur, Debipur,
Kunaboon
10
Potato Khowai Gonki Chargonki, Pashim Gonki, Pashchim
Sonatola
10
Singicherra Chotobagai, Madhya Singichera,
South Singichera ,
10
Tulashikhar Bachaibari Talukbari, Asharambari, Banbazar 10
Padmabill Ampura Chandrakumar Para, Baramaidan 10
Teliamura Gilatali Bagber, Manarchara, Wathailang
Para
10
Bishalgarh Bishalgarh Sichartilla, Lakhibil, Shishutilla 10
Charilam Dariyaathal, Dakhin Charilam,
Dariyathal
10
Madhupur Noth Madhupur, Kalibazar, Souith
Tarapur, Santipara
10
Mandai Mandai Ramchandra Nagar, Thaiplakphal,
Dinakobra Para
10
Melaghar Melaghar North Joynagar, Kolubari,
Motimnagar
10
Mohanpur Mohanpur Noth Madhupur, Kalibazar, Souith
Tarapur, Santipara
10
Hezamara Baikanthapur, Borkathal, Rajghat,
Durgaipara
10
Dukli Dukli Kashipur, Anandanagar, Charipara 10
Amarpur Amarpur Birgaanj, Chelagang, Rangamati 10
Natunbazar Nutanbazar, Malbasha, West Dalak 10
Taidu Gamaicherra, Taidu 10
Ompi Ompinagar, Charbau 10
Sechua Kobrapara, Nagrai 10
Chilli Amarpur Amarpur Birgaanj, Rangamati, 10
Dukli Dukli Kashipur, Anandanagar, Shekerkut,
Amtali
10
Bishalgarh Madhupur North Madhupur, Konaban,
Lembutali
10
Mohanpur Mohanpur Shantipara, Kalibazr, Santipara,
Bamutiya
10
Mandwi Mandwi Mangal Sadhu Para, Thaiplokh Para ,
NEC Para, Dewan Ch Para,
Kashimurai Para
10
Kanchanpur Dosda Kadamtala, Sanapur, Anandabazar 10
Watermelon Amarpur Amarpur Birgaanj, Chelagang, Rangamati 10
Natunbazar Nutanbazar, Malbasha, West Dalak 10
Padmabil Hatkata East Belchara ,West Belchara ,
Monaicherra,
10
22
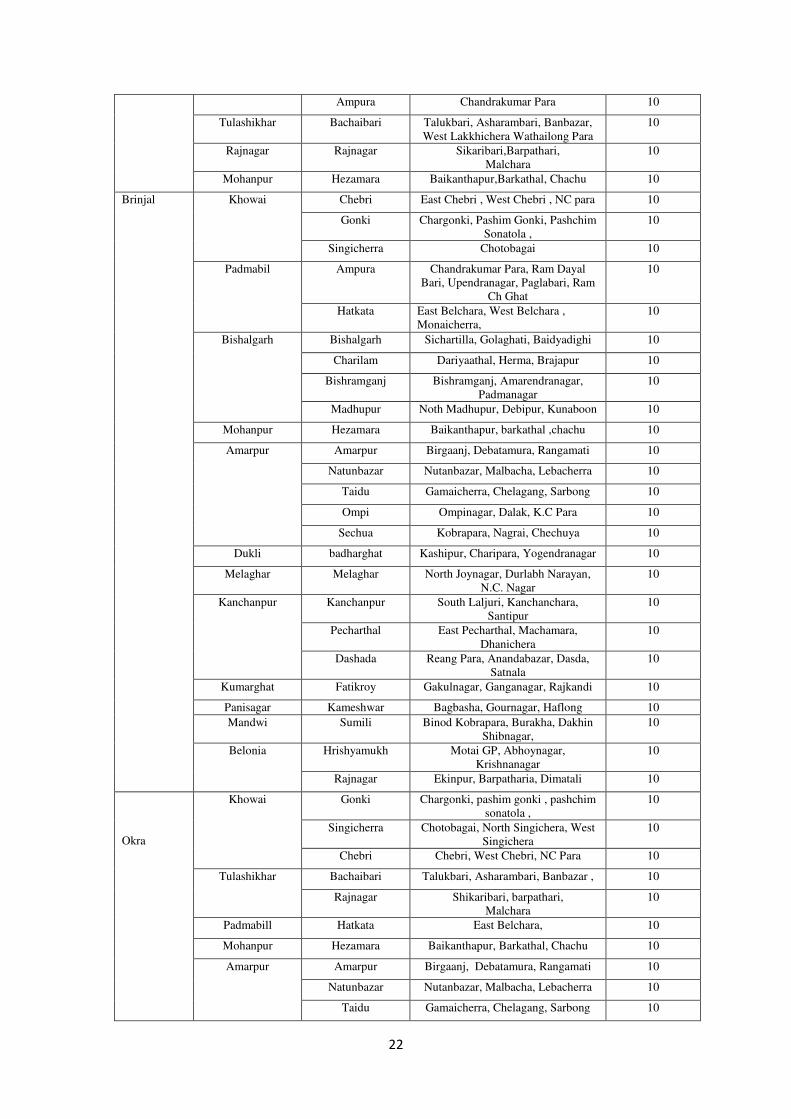
Ampura Chandrakumar Para 10
Tulashikhar Bachaibari Talukbari, Asharambari, Banbazar,
West Lakkhichera Wathailong Para
10
Rajnagar Rajnagar Sikaribari,Barpathari,
Malchara
10
Mohanpur Hezamara Baikanthapur,Barkathal, Chachu 10
Brinjal Khowai Chebri East Chebri , West Chebri , NC para 10
Gonki Chargonki, Pashim Gonki, Pashchim
Sonatola ,
10
Singicherra Chotobagai 10
Padmabil Ampura Chandrakumar Para, Ram Dayal
Bari, Upendranagar, Paglabari, Ram
Ch Ghat
10
Hatkata East Belchara, West Belchara ,
Monaicherra,
10
Bishalgarh Bishalgarh Sichartilla, Golaghati, Baidyadighi 10
Charilam Dariyaathal, Herma, Brajapur 10
Bishramganj Bishramganj, Amarendranagar,
Padmanagar
10
Madhupur Noth Madhupur, Debipur, Kunaboon 10
Mohanpur Hezamara Baikanthapur, barkathal ,chachu 10
Amarpur Amarpur Birgaanj, Debatamura, Rangamati 10
Natunbazar Nutanbazar, Malbacha, Lebacherra 10
Taidu Gamaicherra, Chelagang, Sarbong 10
Ompi Ompinagar, Dalak, K.C Para 10
Sechua Kobrapara, Nagrai, Chechuya 10
Dukli badharghat Kashipur, Charipara, Yogendranagar 10
Melaghar Melaghar North Joynagar, Durlabh Narayan,
N.C. Nagar
10
Kanchanpur Kanchanpur South Laljuri, Kanchanchara,
Santipur
10
Pecharthal East Pecharthal, Machamara,
Dhanichera
10
Dashada Reang Para, Anandabazar, Dasda,
Satnala
10
Kumarghat Fatikroy Gakulnagar, Ganganagar, Rajkandi 10
Panisagar Kameshwar Bagbasha, Gournagar, Haflong 10
Mandwi Sumili Binod Kobrapara, Burakha, Dakhin
Shibnagar,
10
Belonia Hrishyamukh Motai GP, Abhoynagar,
Krishnanagar
10
Rajnagar Ekinpur, Barpatharia, Dimatali 10
Okra
Khowai Gonki Chargonki, pashim gonki , pashchim
sonatola ,
10
Singicherra Chotobagai, North Singichera, West
Singichera
10
Chebri Chebri, West Chebri, NC Para 10
Tulashikhar Bachaibari Talukbari, Asharambari, Banbazar , 10
Rajnagar Shikaribari, barpathari,
Malchara
10
Padmabill Hatkata East Belchara, 10
Mohanpur Hezamara Baikanthapur, Barkathal, Chachu 10
Amarpur
Amarpur Birgaanj, Debatamura, Rangamati 10
Natunbazar Nutanbazar, Malbacha, Lebacherra 10
Taidu Gamaicherra, Chelagang, Sarbong 10
23
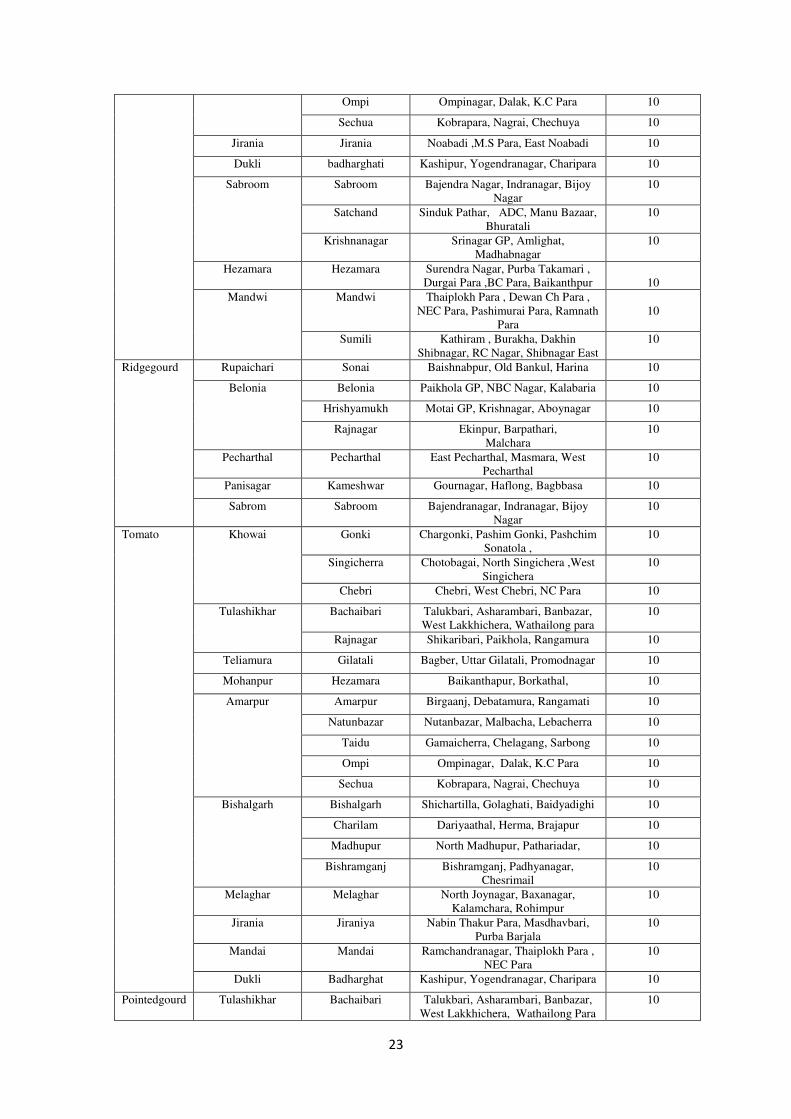
Ompi Ompinagar, Dalak, K.C Para 10
Sechua Kobrapara, Nagrai, Chechuya 10
Jirania Jirania Noabadi ,M.S Para, East Noabadi 10
Dukli badharghati Kashipur, Yogendranagar, Charipara 10
Sabroom Sabroom Bajendra Nagar, Indranagar, Bijoy
Nagar
10
Satchand Sinduk Pathar, ADC, Manu Bazaar,
Bhuratali
10
Krishnanagar Srinagar GP, Amlighat,
Madhabnagar
10
Hezamara Hezamara Surendra Nagar, Purba Takamari ,
Durgai Para ,BC Para, Baikanthpur
10
Mandwi Mandwi Thaiplokh Para , Dewan Ch Para ,
NEC Para, Pashimurai Para, Ramnath
Para
10
Sumili Kathiram , Burakha, Dakhin
Shibnagar, RC Nagar, Shibnagar East
10
Ridgegourd Rupaichari Sonai Baishnabpur, Old Bankul, Harina 10
Belonia Belonia Paikhola GP, NBC Nagar, Kalabaria 10
Hrishyamukh Motai GP, Krishnagar, Aboynagar 10
Rajnagar Ekinpur, Barpathari,
Malchara
10
Pecharthal Pecharthal East Pecharthal, Masmara, West
Pecharthal
10
Panisagar Kameshwar Gournagar, Haflong, Bagbbasa 10
Sabrom Sabroom Bajendranagar, Indranagar, Bijoy
Nagar
10
Tomato Khowai Gonki Chargonki, Pashim Gonki, Pashchim
Sonatola ,
10
Singicherra Chotobagai, North Singichera ,West
Singichera
10
Chebri Chebri, West Chebri, NC Para 10
Tulashikhar Bachaibari Talukbari, Asharambari, Banbazar,
West Lakkhichera, Wathailong para
10
Rajnagar Shikaribari, Paikhola, Rangamura 10
Teliamura Gilatali Bagber, Uttar Gilatali, Promodnagar 10
Mohanpur Hezamara Baikanthapur, Borkathal, 10
Amarpur Amarpur Birgaanj, Debatamura, Rangamati 10
Natunbazar Nutanbazar, Malbacha, Lebacherra 10
Taidu Gamaicherra, Chelagang, Sarbong 10
Ompi Ompinagar, Dalak, K.C Para 10
Sechua Kobrapara, Nagrai, Chechuya 10
Bishalgarh Bishalgarh Shichartilla, Golaghati, Baidyadighi 10
Charilam Dariyaathal, Herma, Brajapur 10
Madhupur North Madhupur, Pathariadar, 10
Bishramganj Bishramganj, Padhyanagar,
Chesrimail
10
Melaghar Melaghar North Joynagar, Baxanagar,
Kalamchara, Rohimpur
10
Jirania Jiraniya Nabin Thakur Para, Masdhavbari,
Purba Barjala
10
Mandai Mandai Ramchandranagar, Thaiplokh Para ,
NEC Para
10
Dukli Badharghat Kashipur, Yogendranagar, Charipara 10
Pointedgourd Tulashikhar Bachaibari Talukbari, Asharambari, Banbazar,
West Lakkhichera, Wathailong Para
10
24
Rajnagar Shikaribari, Paikhola, Rangamura 10
Teliamura Gilatali Bagber, Uttar Gilatali, Promodnagar 10
Amarpur Taidu Gamaicherra, Chelagang, Sarbong 10
Natunbazar Natunbazar, Malbacha, Lebacherra 10
Sechua Kobrapara, Nagrai, Chechuya 10
Amarpur Birganj, Debatamura, Rangamati 10
Ompi Ompinagar, Dalak, K.C Para 10
Matabari Matabari Baishavichar 10
Jiraniya Jiraniya Nabin Thakur Para, M.s para, east
Noabadi
10
Sabrom Sabroom Bajendranagar, Indranagar, Bijoy
Nagar
10
Radish Padmabil Ampura Chandrakumar Para, Chandrakumar
Para,ram dayal bari
10
Hatkata East Belchara, East Belchara, West
Belchara
10
Dukli Badharghat Kashipur, Shekerkut, Anadanagar 10
Mohanpur Mohanpur Baikanthapur, jamilghat, Kalibazar,
Santi Para
10
Jiraniya Jiraniya Nabin Thakur Para, Masdhavbari,
Purba Barjala
10
Belonia Rajnagar Ekinpur, Barpathari,
Malchara
10
Belonia Paikhola GP, NBC Nagar, Kalabaria 10
Pumpkin Bishalgarh Charilam Dariyathal, Herma, Dakhin Charilam 10
Mandai Mandai Ramchandranagar 10
Melaghar Melaghar Northjoynagar 10
Mohanpur Mohanpur Shantipara, Bamutia, Borkathal,
Tarapur, Bojaynagar
10
Teliamura Gilatali Bagber 10
Sabrom Sabroom Bajendranagar, Indranagar, Bijoy
Nagar
10
Spinegourd Padmabil Ampura Chandrakumar Para, Chandrakumar
Para,ram dayal bari
10
Mandwi Mandwi
Mangal sadhu para, thaiplokh para ,
NEc para , dewan ch para ,
kashimurai para
10
Sumili Kathiram, Burakha, Dakhin
Shibnagar, RC Nagar, Shibnagar East
10
Mohanpur Mohanpur Baikanthapur, Jamilghat, Kalibazar,
Santi Para
10
Belonia Rajnagar Ekinpur, Barpathari,
Malchara
10
Matabari Matabari Baishavichar 10
Teliamura Gilatali Bagber, Uttar Gilatali, Promodnagar 10
Kumarghat Fatikroy Gakulnagar, Ganganagar, Rajkandi 10
Colocassia Jirania Jiraniya Nabin Thakur Para 10
Mohanpur Mohanpur Boikanthapur, Rajghat,
Balaramchaudhurypara
10
Dukli Dukli Kashipur 10
Bishalgarh Bishalgarh Shitartilla 10
Belonia Rajnagar Ekinpur, Barpathari,
Malchara
10
Teliamura Gilatali Bagber 10
Khowai Chebri East Chebri , West Chebri , NC para 10
25
Kumarghat Fatikroy Gakulnagar, Ganganagar, Rajkandi 10
Carrot Mohanpur Mohanpur Baikanthapur, Kalibazar, Banutia,
South Tarpur, Vijaynagar
10
Bishalgarh Bishalgarh Lakhibil, Baidhyadighi, Durganagar 10
Kumarghat Fatikroy Gakulnagar, Ganganagar, Rajkandi 10
Melaghar Melaghar Melagarh, Northjoynagar 10
Khowai Gonki Chargonki, Pashim Gonki, Pashchim
Sonatola ,
10
Singicherra Chotobagai, North Singichera ,West
Singichera
10
Chebri Chebri, West Chebri, NC Para 10
Capsicum Mohanpur Mohanpur Baikanthapur, Kalibazar, South
Tarapur
10
Dukli Dukli Kashipur, Shekerkut, Anandanagar,
Amtali
10
Bishalgarh Bishalgarh Lakhibil, Baidhyadighi, Durganagar 10
Kumarghat Fatikroy Gakulnagar, Ganganagar, Rajkandi 10
Bittergourd,
Bottlegourd
and Pumpkin
Khowai Gonki Chargonki, Pashim Gonki, Pashchim
Sonatola ,
10
Singicherra Chotobagai, North Singichera ,West
Singichera
10
Chebri Chebri, West Chebri, NC Para 10
Tulashikhar Bachaibari Talukbari, Asharambari, Banbazar,
West Lakkhichera, Wathailong para
10
Rajnagar Shikaribari, Paikhola, Rangamura 10
Teliamura Gilatali Bagber, Uttar Gilatali, Promodnagar 10
Mohanpur Hezamara Baikanthapur, Borkathal, 10
Amarpur Amarpur Birgaanj, Debatamura, Rangamati 10
Natunbazar Nutanbazar, Malbacha, Lebacherra 10
Taidu Gamaicherra, Chelagang, Sarbong 10
Ompi Ompinagar, Dalak, K.C Para 10
Sechua Kobrapara, Nagrai, Chechuya 10
Bishalgarh Bishalgarh Shichartilla, Golaghati, Baidyadighi 10
Charilam Dariyaathal, Herma, Brajapur 10
Madhupur North Madhupur, Pathariadar, 10
Bishramganj Bishramganj, Padhyanagar,
Chesrimail
10
Melaghar Melaghar North Joynagar, Baxanagar,
Kalamchara, Rohimpur
10
Jirania Jiraniya Nabin Thakur Para, Masdhavbari,
Purba Barjala
10
Mandai Mandai Ramchandranagar, Thaiplokh Para ,
NEC Para
10
Dukli Badharghat Kashipur, Yogendranagar, Charipara 10
Fruit Crops
Mosambi
Khowai Singhichera Siphaihour, Sipaihour, North
Sighicherra
5
Killa Killa North Barmura 5
Teliamura Teliamura Sardu karkari 5
Mandwai Sumily Binodkubra para 5
Bishalgarh Bishalgarh Lakhibil, Durganagar 5
Rajnagar Hrishaymukh Rajnagar area 5
26
Dukli Dukli Maheshkhala, Jogindranagar 5
Mohanpur Mohanpur Lefunga, Durganagar 5
Matabari Matabari Baishnavi Char 5
Pineapple Mandwi Mandwi Burakha 5
Matabari Killa East Killa, N. B. Mura, North
Barmura
5
Kumarghat Kumarghat Darchoi, Fatikroy, Jubarajnagar 5
Khowai Kopwai Chandra Thakur Para, Chebri 5
Tulashikhar Bachaibari Sikaribari, Purba Bachaibari,
Behela bari
5
Amarpuir Ompi Ompinagar, Dalak, K.C Para 5
Ambasa Ambasa Ganganagar, Chakmapara 5
Teliamura Mungiyakami Ramkrishnapur, Atharamura 5
Chailengta Chamanu North Maninama, South
Mainama, Chailengta GP
5
Guava Khowai Singichera Madhya singhichera 5
Teliamura Krishnapur Uttar brahmachera 5
Tulashikhar Bachaibari Talukbari 5
Mango Jirania Jirania East belbari 5
Khowai Gonki Gonki 5
Padmabil Hatkata East Belbari 5
Dukli Dukli Maheshkhala, Jogindranagar 5
Mohanpur Mohanpur Lefunga, Durganagar 5
Matabari Matabari Baishnavi Char 5
Banana Samtal
Padmabill
Hatkata Guniyapara 5
Khowai Singhicherra Siphaihour 5
Matabari Matabari Das para 5
Jirania Jirania Belbari 5
Mohanpur Mohanpur Jamil Ghat 5
Tulashikhar Bachaibari Sikaribari, Purba Bachaibari,
Behela bari
5
Amarpur Ompi Ompinagar, Dalak, K.C Para 5
Ambasa Ambasa Ganganagar, Chakmapara 5
Chailengta Chamanu North Maninama, South
Mainama, Chailengta GP
5
Hezamara Hezamara Borkathal, Hezamara 5
Kanchanpur Pecharthal Machmara, Dhanichara,
Pecharthal
5
Bishalgarh Bishramganj Chesrimail, Goliroibari,
Dewanbazar, Tkhshapara
5
Kumarghat Kumarghat Darchoi, Fatikroy, Jubarajnagar 5
Kadamtala Kadamtala Ranirbzar 5
Dukli Dukli Pachim Anandacherra, 5
Teliamura Mungiakami Ramkrishnapur 5
Mandwi Mandwi
Mangal sadhu para, thaiplokh
Para, NEC Para, Dewan Ch Para,
Kashimurai Para
5
Papaya Jirania Jirania , Mandwi Belbari , Burakha 5
Khowai Singhichera Siphaihour, Sipaihour, North
Sighicherra
Matabari Killa North Barmura, Garjonmura,
Thelakung
5
Teliamura Teliamura Sardu karkari, Uttar
brahmacherra, Gamaibari
5
Mungiakami Ramkrishnapur, Atharamura,
Durganagar
5
27
Gilatali Wathailungpara, Begbar, Totabari 5
Uttarkrishnapur Baishgaria, North Gakulnagar,
Maharanipur
5
Mandwai Sumily Binodkubra para, lalitbazar,
Rajchantai Para
5
Bishalgarh Charillam Dhariathal, Bhaktamura, Harmar 5
Rajnagar Hrishaymukh West Paikhola, NSC NAgar,
Motai
5
Dukli Dukli Maheshkhala,
Jogindranagar,Amtali
5
Mohanpur Mohanpur Jamilghat, Durganagar, Simna 5
Hezamara Durgai para, Baikantantapur,
Surendra nagar
5
Lefunga Rajghat, Abhicharan, Chechuria 5
Kumarghat Kumarghat Darchoi, Fatikroy, Jubarajnagar 5
Amarpur Taidu Taidu, Bampu, Dalak 5
Gandacherra Gandacherra Laxmipur, Dalapati, Sarma 5
Kamalpur Salema Abanga, Santibazar,Mahazonpara 5
Chailengta Chawmanu Manikpur 5
Kadamtala Kadamtala Ranirbzar, Tarakpur, Choraibari 5
Kanchanpur Damcherra Khedacherra, Damcherra Bazar 5 Mandarin
Orange Matabari Killa N.B Mura, Barumura, Barjamura 5
Kanchanpur Kanchanpur Vaisan, Hmawngchuan,
Hmunpui, Tlaksih, Vanghmun,
Behhangchhip, Bangla, Tlansang
and other villages
5
Cashewnut Teliamura Teliamura Howaibari, Hodrai,Tuichindrai 5
Dukli Shekherkote Kanchanmala,Anandanagar,
Padmanagar
5
Amarpur Chechua Nagrai,Chechya,Labacherra 5 Jackfruit Mohanpur Mohanpur Bamutia, Kamalghat,
Gamchakubra
5
Bishalgarh Madhupur Gakulnagar, Devipur, Konabon 5
Teliamura Krishnapur Maiganga, Krishnapur, north
maharanipur
5
Chailengta Chawmanu Manikpur, Dugacherra,
Dhalacherra
5
Kamalpur Salema Kalacherra, Manikbhander,
Panichoki
5
Khowai Hatkata Ratanpur, East Belcherra,
Baijalbari
5
Tulasikhar Rajnagar West champahour, North
champahour, Rajghat
5
Satchand Satchand Sindukpathar, Buratali,
Kalacherra
5
Kanchanpur Dasda Sonapur, Anandabazar, Dasda
Bazar
5
Matabari Matabari Khupilwng,Radhakishorpur,
Tepania
5
Litchi Bisalgarh Bisramganj Bisramgon,Guliroybari,
Amarandra Nagar
5
Mohanpur Mohanpur Purbabazalghat, Sesuria,
Gongalung
5
Melaghar Katalia Jumerdhepa, Sobapur,Katalia 5

28
Amarpur Ampi Ampinagar, Paharpur, Kobrapara 5
Jirania Jirania Belbari, Champaknagar,
Noyabadi
5
Panisagar Panisagar Panisagar, Yubrajnagar, Tilthai,
Katali
5
Mohanpur Mohanpur Lembucherra,
Balaramchaudhurypara
5
Ber Dukli Dukli Charipara, Maheshkala,
Sherkerkote
5
Mohanpur Mohanpur Kalagachia, Brahmakunda,
Sonaram
5
Melaghar Kalamcherra Kulobari, Boxanagar, Kalsimura 5
Khowai Hatkata East Belcherra, Baisalbari,
Padmabill Para
5
Matabari Matabari Baishavichar 5 Lemon Bisalgarh Jampuijalla Gabordi, Takarjalla, Jampuijallla 5
Amarpur Ampi Ampinagar, Lebacherra,
Kobrapara
5
Kanchanpur Kanchanpur Vangmun,Hmanpui, Shabul 5
Khowai Singicherra West singhicherra, north
singicherra, Chotobagai
5
Teliamura Mungiakami Baganbazar, Durgapur,
Triprapara
5
Teliamura Howaibari, Tuichindrai, Hadrai 5
Uttarkrishnapur Baishgaria, Maharanipur,
Maiganga
5
Gilatali Wothailungpara,Tutabari,
Moracharra
5
Melaghar Jhumerdhepha Bagbasa, Taksapara, Bagmara 5
Matabari Killa Garjanmura, Atarabola, N.B mura 5
Gandacherra Gandacherra Laxmipur, Dalapati, Sarma 5
Kamalpur Salema Abanga, Santibazar,Mahazonpara 5
Ambassa Ambassa Bagmar,Gurudhan
para,Karmapara
5
Chalengta Chailenta Gainama,South Chailenta, North
Mainama
5
Kumarghat Fatikroy Ganganagar, Gakulnagar, Rajkadi 5
Satchand Sabroom Chotakhil, Thaibong, Jalapha 5
Lime Teliamura Mungiakami Baganbazar, Durgapur,
Triprapara
5
Teliamura Howaibari, Tuichindrai, Hadrai 5
Gilatali Wothailungpara,Tutabari,
Moracharra
5
Bisalgarh Jampuijalla Gabordi, Takarjalla, Jampuijallla 5
Amarpur Ampi Ampinagar, Lebacherra,
Kobrapara
5
Kanchanpur Pecherthal Machmara, Krishnatilla, Masli 5
Satchand Krishnagar Kalibazar, Amilghat, Srinagar 5
Matabari Killa N.B Mura, Barumura, Barjamura 5
Gandacherra Gandacherra Laxmipur, Laxmipur, Dalapati,
Sarma
5
Raishyabari Potacherra, Ratannagar,
Ramaibari
5
29
Kanchanpur Kanchanpur Vangmun,Hmanpui, Shabul 5
Khowai Singicherra West singhicherra, north
singicherra, Chotobagai
5
Ambassa Ambassa Bagmar,Gurudhan
para,Karmapara
5
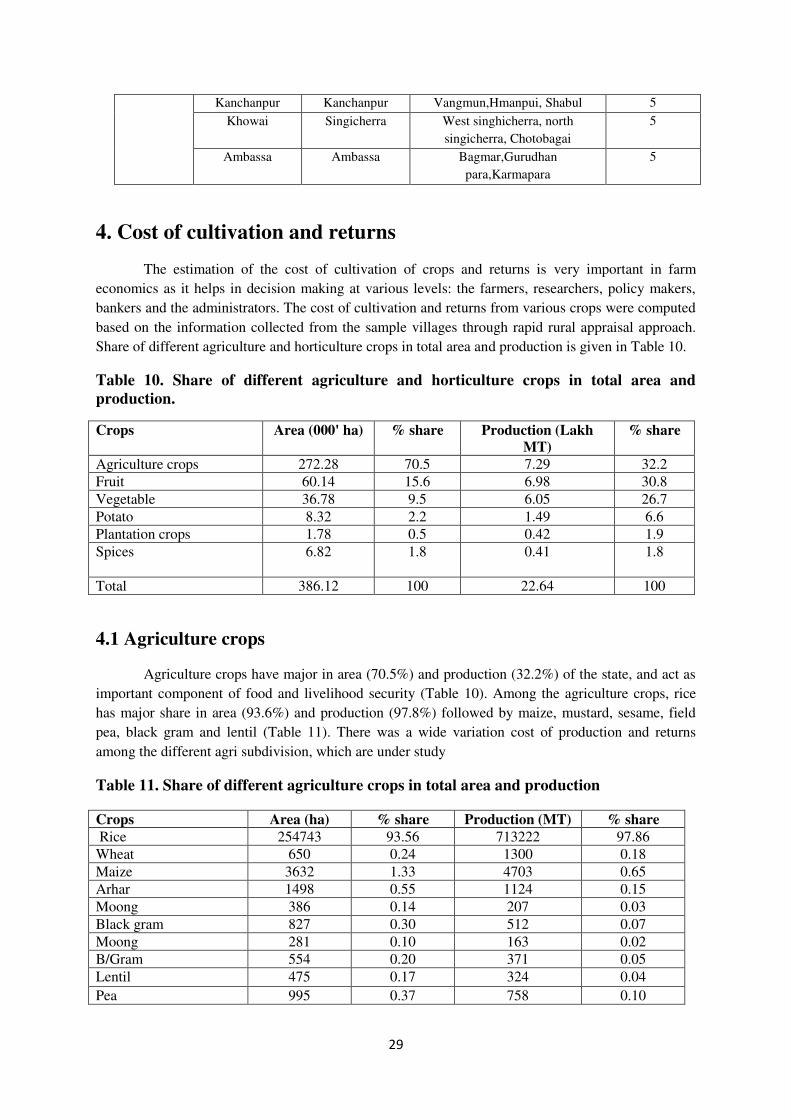
4. Cost of cultivation and returns
The estimation of the cost of cultivation of crops and returns is very important in farm
economics as it helps in decision making at various levels: the farmers, researchers, policy makers,
bankers and the administrators. The cost of cultivation and returns from various crops were computed
based on the information collected from the sample villages through rapid rural appraisal approach.
Share of different agriculture and horticulture crops in total area and production is given in Table 10.
Table 10. Share of different agriculture and horticulture crops in total area and
production.
Crops Area (000' ha) % share Production (Lakh
MT)
% share
Agriculture crops 272.28 70.5 7.29 32.2
Fruit 60.14 15.6 6.98 30.8
Vegetable 36.78 9.5 6.05 26.7
Potato 8.32 2.2 1.49 6.6
Plantation crops 1.78 0.5 0.42 1.9
Spices 6.82 1.8 0.41 1.8
Total 386.12 100 22.64 100
4.1 Agriculture crops
Agriculture crops have major in area (70.5%) and production (32.2%) of the state, and act as
important component of food and livelihood security (Table 10). Among the agriculture crops, rice
has major share in area (93.6%) and production (97.8%) followed by maize, mustard, sesame, field
pea, black gram and lentil (Table 11). There was a wide variation cost of production and returns
among the different agri subdivision, which are under study
Table 11. Share of different agriculture crops in total area and production
Crops Area (ha) % share Production (MT) % share
Rice 254743 93.56 713222 97.86
Wheat 650 0.24 1300 0.18
Maize 3632 1.33 4703 0.65
Arhar 1498 0.55 1124 0.15
Moong 386 0.14 207 0.03
Black gram 827 0.30 512 0.07
Moong 281 0.10 163 0.02
B/Gram 554 0.20 371 0.05
Lentil 475 0.17 324 0.04
Pea 995 0.37 758 0.10
30
Gram 164 0.06 127 0.02
Sesasum 2085 0.77 1188 0.16
Groundnut 597 0.22 731 0.10
Rape & Mustard 2132 0.78 1701 0.23
Other 3259 1.20 2372 0.33
Total 272278 100 728803 100
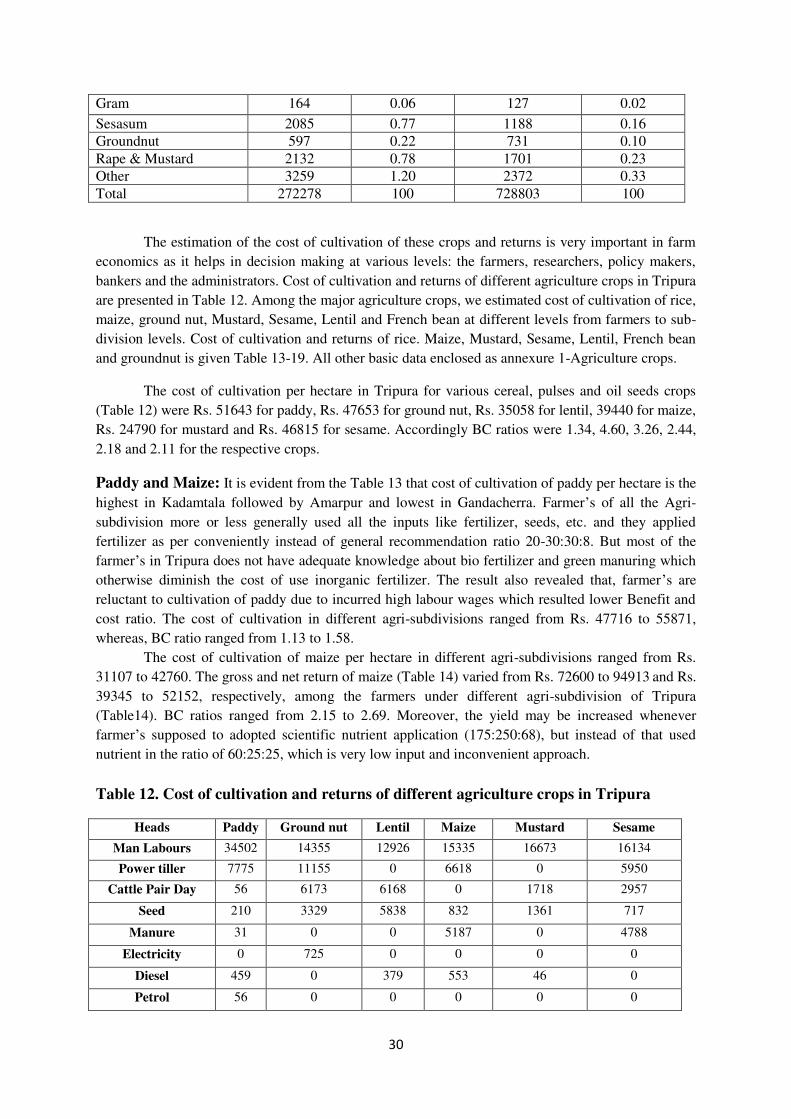
The estimation of the cost of cultivation of these crops and returns is very important in farm
economics as it helps in decision making at various levels: the farmers, researchers, policy makers,
bankers and the administrators. Cost of cultivation and returns of different agriculture crops in Tripura
are presented in Table 12. Among the major agriculture crops, we estimated cost of cultivation of rice,
maize, ground nut, Mustard, Sesame, Lentil and French bean at different levels from farmers to sub-
division levels. Cost of cultivation and returns of rice. Maize, Mustard, Sesame, Lentil, French bean
and groundnut is given Table 13-19. All other basic data enclosed as annexure 1-Agriculture crops.
The cost of cultivation per hectare in Tripura for various cereal, pulses and oil seeds crops
(Table 12) were Rs. 51643 for paddy, Rs. 47653 for ground nut, Rs. 35058 for lentil, 39440 for maize,
Rs. 24790 for mustard and Rs. 46815 for sesame. Accordingly BC ratios were 1.34, 4.60, 3.26, 2.44,
2.18 and 2.11 for the respective crops.
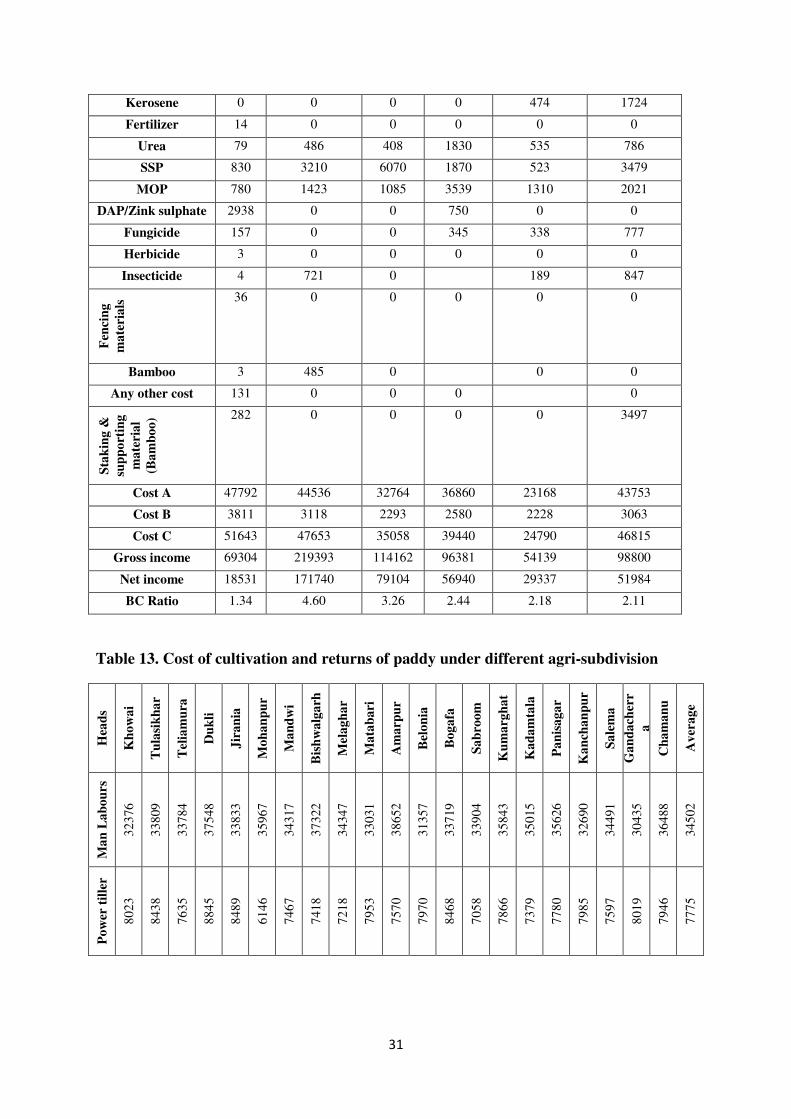
Paddy and Maize: It is evident from the Table 13 that cost of cultivation of paddy per hectare is the
highest in Kadamtala followed by Amarpur and lowest in Gandacherra. Farmer’s of all the Agri-
subdivision more or less generally used all the inputs like fertilizer, seeds, etc. and they applied
fertilizer as per conveniently instead of general recommendation ratio 20-30:30:8. But most of the
farmer’s in Tripura does not have adequate knowledge about bio fertilizer and green manuring which
otherwise diminish the cost of use inorganic fertilizer. The result also revealed that, farmer’s are
reluctant to cultivation of paddy due to incurred high labour wages which resulted lower Benefit and
cost ratio. The cost of cultivation in different agri-subdivisions ranged from Rs. 47716 to 55871,
whereas, BC ratio ranged from 1.13 to 1.58.
The cost of cultivation of maize per hectare in different agri-subdivisions ranged from Rs.
31107 to 42760. The gross and net return of maize (Table 14) varied from Rs. 72600 to 94913 and Rs.
39345 to 52152, respectively, among the farmers under different agri-subdivision of Tripura
(Table14). BC ratios ranged from 2.15 to 2.69. Moreover, the yield may be increased whenever
farmer’s supposed to adopted scientific nutrient application (175:250:68), but instead of that used
nutrient in the ratio of 60:25:25, which is very low input and inconvenient approach.
Table 12. Cost of cultivation and returns of different agriculture crops in Tripura
Heads Paddy Ground nut Lentil Maize Mustard Sesame
Man Labours 34502 14355 12926 15335 16673 16134
Power tiller 7775 11155 0 6618 0 5950
Cattle Pair Day 56 6173 6168 0 1718 2957
Seed 210 3329 5838 832 1361 717
Manure 31 0 0 5187 0 4788
Electricity 0 725 0 0 0 0
Diesel 459 0 379 553 46 0
Petrol 56 0 0 0 0 0
31
Kerosene 0 0 0 0 474 1724
Fertilizer 14 0 0 0 0 0
Urea 79 486 408 1830 535 786
SSP 830 3210 6070 1870 523 3479
MOP 780 1423 1085 3539 1310 2021
DAP/Zink sulphate 2938 0 0 750 0 0
Fungicide 157 0 0 345 338 777
Herbicide 3 0 0 0 0 0
Insecticide 4 721 0 189 847
Fen
cin
g
ma
teri
als
36 0 0 0 0 0
Bamboo 3 485 0 0 0
Any other cost 131 0 0 0 0
Sta
kin
g &
sup
po
rtin
g
ma
teri
al
(Ba
mb
oo
) 282 0 0 0 0 3497
Cost A 47792 44536 32764 36860 23168 43753
Cost B 3811 3118 2293 2580 2228 3063
Cost C 51643 47653 35058 39440 24790 46815
Gross income 69304 219393 114162 96381 54139 98800
Net income 18531 171740 79104 56940 29337 51984
BC Ratio 1.34 4.60 3.26 2.44 2.18 2.11
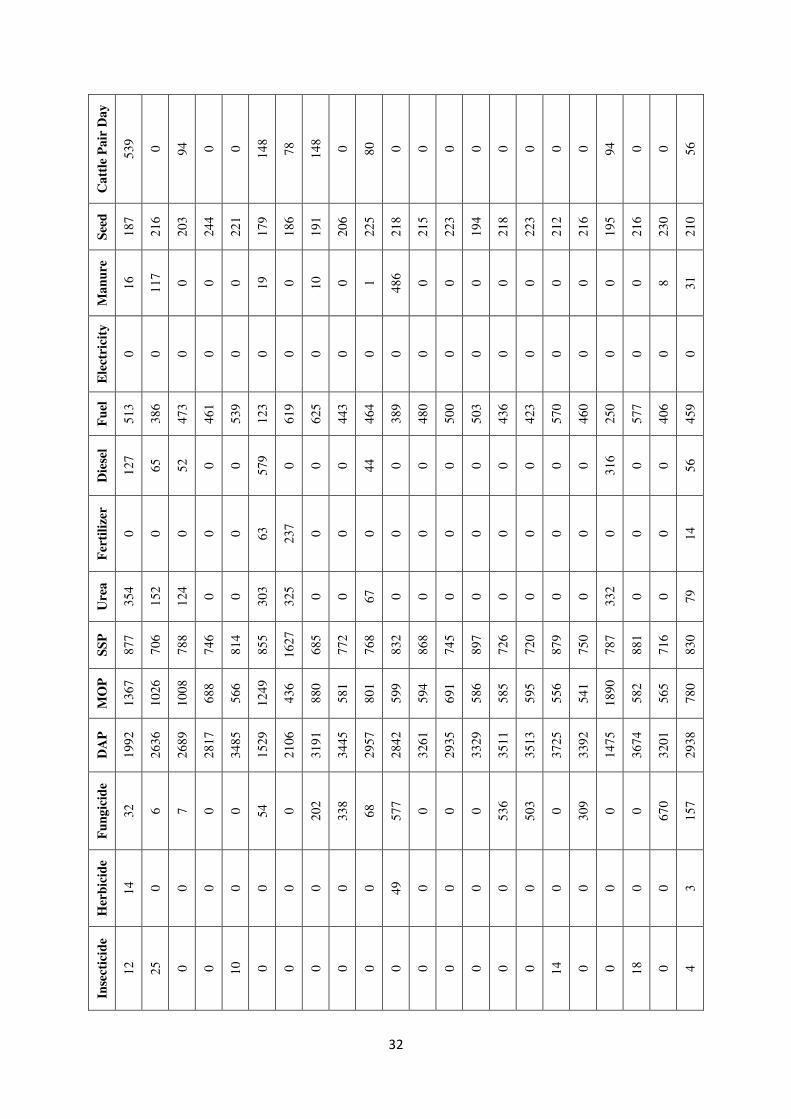
Table 13. Cost of cultivation and returns of paddy under different agri-subdivision
Hea
ds
Kh
ow
ai
Tu
lasi
kh
ar
Tel
iam
ura
Du
kli
Jir
an
ia
Mo
ha
np
ur
Ma
nd
wi
Bis
hw
alg
arh
Mel
ag
ha
r
Ma
tab
ari
Am
arp
ur
Bel
on
ia
Bo
ga
fa
Sa
bro
om
Ku
ma
rgh
at
Ka
da
mta
la
Pa
nis
ag
ar
Ka
nch
an
pu
r
Sa
lem
a
Ga
nd
ach
err
a
Ch
am
an
u
Av
era
ge
Ma
n L
ab
ou
rs
32
376
33
809
33
784
37
548
33
833
35
967
34
317
37
322
34
347
33
031
38
652
31
357
33
719
33
904
35
843
35
015
35
626
32
690
34
491
30
435
36
488
34
502
Po
wer
til
ler
80
23
84
38
76
35
88
45
84
89
61
46
74
67
74
18
72
18
79
53
75
70
79
70
84
68
70
58
78
66
73
79
77
80
79
85
75
97
80
19
79
46
77
75
32
Ca
ttle
Pa
ir D
ay
53
9
0
94
0
0
14
8
78
14
8
0
80
0
0
0
0
0
0
0
0
94
0
0
56
See
d
18
7
21
6
20
3
24
4
22
1
17
9
18
6
19
1
20
6
22
5
21
8
21
5
22
3
19
4
21
8
22
3
21
2
21
6
19
5
21
6
23
0
21
0
Ma
nu
re
16
11
7
0
0
0
19
0
10
0
1
48
6
0
0
0
0
0
0
0
0
0
8
31
Ele
ctri
city
0
0
0
0
0
0
0
0
0
0
0
0
0
0
0
0
0
0
0
0
0
0
Fu
el
51
3
38
6
47
3
46
1
53
9
12
3
61
9
62
5
44
3
46
4
38
9
48
0
50
0
50
3
43
6
42
3
57
0
46
0
25
0
57
7
40
6
45
9
Die
sel
12
7
65
52
0
0
57
9
0
0
0
44
0
0
0
0
0
0
0
0
31
6
0
0
56
Fer
tili
zer
0
0
0
0
0
63
23
7
0
0
0
0
0
0
0
0
0
0
0
0
0
0
14
Ure
a
35
4
15
2
12
4
0
0
30
3
32
5
0
0
67
0
0
0
0
0
0
0
0
33
2
0
0
79
SS
P
87
7
70
6
78
8
74
6
81
4
85
5
16
27
68
5
77
2
76
8
83
2
86
8
74
5
89
7
72
6
72
0
87
9
75
0
78
7
88
1
71
6
83
0
MO
P
13
67
10
26
10
08
68
8
56
6
12
49
43
6
88
0
58
1
80
1
59
9
59
4
69
1
58
6
58
5
59
5
55
6
54
1
18
90
58
2
56
5
78
0
DA
P
19
92
26
36
26
89
28
17
34
85
15
29
21
06
31
91
34
45
29
57
28
42
32
61
29
35
33
29
35
11
35
13
37
25
33
92
14
75
36
74
32
01
29
38
Fu
ng
icid
e
32
6
7
0
0
54
0
20
2
33
8
68
57
7
0
0
0
53
6
50
3
0
30
9
0
0
67
0
15
7
Her
bic
ide
14
0
0
0
0
0
0
0
0
0
49
0
0
0
0
0
0
0
0
0
0
3
Inse
ctic
ide
12
25
0
0
10
0
0
0
0
0
0
0
0
0
0
0
14
0
0
18
0
4

33
Fen
cin
g m
ate
ria
ls
8
0
0
0
72
17
2
0
0
0
0
0
0
0
0
0
0
28
5
29
0
19
4
0
36
Ba
mb
oo
0
0
12
0
0
0
52
0
0
0
0
0
0
0
0
0
0
0
0
0
0
3
An
y o
ther
co
st
12
0
61
0
0
0
86
39
38
4
20
1
0
35
3
0
51
5
33
0
33
7
0
20
5
78
0
15
3
13
1
Co
st A
46
44
9
47
58
2
46
93
0
51
34
9
48
02
9
47
38
6
47
53
6
50
71
1
47
73
4
46
66
0
52
21
4
45
09
8
47
28
1
46
98
6
50
05
1
48
70
8
49
64
7
46
57
7
47
50
5
44
59
6
50
38
3
48
06
4
Co
st B
32
51
.43
33
30
.74
32
85
.1
35
94
.43
33
62
.03
33
17
.02
33
27
.52
35
49
.77
33
41
.38
32
66
.2
36
54
.98
31
56
.86
33
09
.67
32
89
.02
35
03
.57
34
09
.56
34
75
.29
32
60
.39
33
25
.35
31
21
.72
35
26
.81
33
64
.48
Co
st C
49
70
0.4
3
50
91
2.7
4
50
21
5.1
54
94
3.4
3
51
39
1.0
3
50
70
3.0
2
50
86
3.5
2
54
26
0.7
7
51
07
5.3
8
49
92
6.2
55
86
8.9
8
48
25
4.8
6
50
59
0.6
7
50
27
5.0
2
53
55
4.5
7
52
11
7.5
6
53
12
2.2
9
49
83
7.3
9
50
83
0.3
5
47
71
7.7
2
53
90
9.8
1
51
42
8.4
8
Gro
ss i
nco
me
60
82
1
69
49
4
67
53
6
69
48
1
72
71
4
58
82
0
66
79
5
66
66
1
75
13
6
69
11
1
68
16
9
70
71
1
66
95
7
70
98
6
73
92
0
71
41
1
78
82
5
72
12
0
66
55
4
75
24
4
63
92
2
69
30
4
Net
in
com
e
11
12
0.5
7
18
58
1.2
6
17
32
0.9
14
53
7.5
7
21
32
2.9
7
81
16
.98
15
93
1.4
8
12
40
0.2
3
24
06
0.6
2
19
18
4.8
12
30
0.0
2
22
45
6.1
4
16
36
6.3
3
20
71
0.9
8
20
36
5.4
3
19
29
3.4
4
25
70
2.7
1
22
28
2.6
1
15
72
3.6
5
27
52
6.2
8
10
01
2.1
9
17
87
5.5
2
BC
Ra
tio
1.1
3
1.3
6
1.3
6
1.2
6
1.4
1
1.1
6
1.3
1
1.2
3
1.4
8
1.4
1
1.2
2
1.4
7
1.2
6
1.5
1
1.3
9
1.3
8
1.4
8
1.4
5
1.2
8
1.5
8
1.1
4
1.3
4
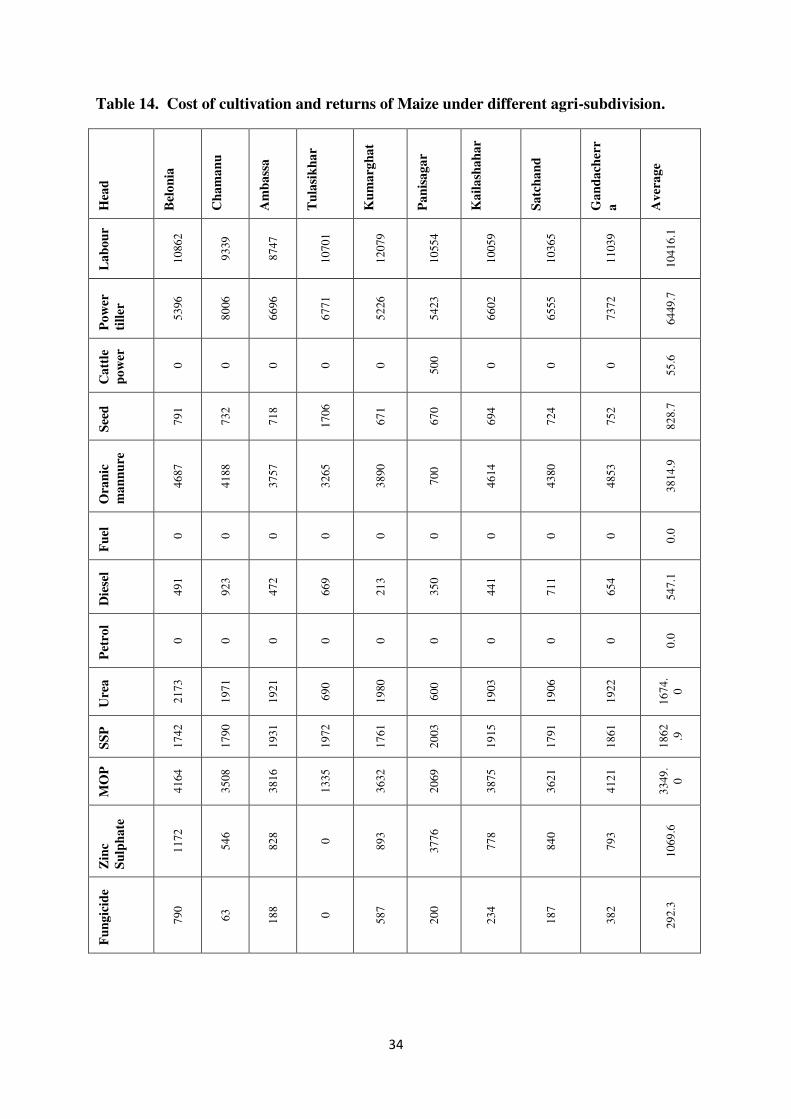
34
Table 14. Cost of cultivation and returns of Maize under different agri-subdivision. H
ead
Bel
on
ia
Ch
am
an
u
Am
ba
ssa
Tu
lasi
kh
ar
Ku
ma
rgh
at
Pa
nis
ag
ar
Ka
ila
sha
ha
r
Sa
tch
an
d
Ga
nd
ach
err
a
Av
era
ge
La
bo
ur
10
86
2
93
39
87
47
10
70
1
12
07
9
10
55
4
10
05
9
10
36
5
11
03
9
10
41
6.1
Po
wer
till
er
53
96
80
06
66
96
67
71
52
26
54
23
66
02
65
55
73
72
64
49
.7
Ca
ttle
po
wer
0
0
0
0
0
50
0
0
0
0
55
.6
See
d
79
1
73
2
71
8
17
06
67
1
67
0
69
4
72
4
75
2
82
8.7
Ora
nic
ma
nn
ure
46
87
41
88
37
57
32
65
38
90
70
0
46
14
43
80
48
53
38
14
.9
Fu
el
0
0
0
0
0
0
0
0
0
0.0
Die
sel
49
1
92
3
47
2
66
9
21
3
35
0
44
1
71
1
65
4
54
7.1
Pet
rol
0
0
0
0
0
0
0
0
0
0.0
Ure
a
21
73
19
71
19
21
69
0
19
80
60
0
19
03
19
06
19
22
16
74
.
0
SS
P
17
42
17
90
19
31
19
72
17
61
20
03
19
15
17
91
18
61
18
62
.9
MO
P
41
64
35
08
38
16
13
35
36
32
20
69
38
75
36
21
41
21
33
49
.
0
Zin
c
Su
lph
ate
11
72
54
6
82
8
0
89
3
37
76
77
8
84
0
79
3
10
69
.6
Fu
ng
icid
e
79
0
63
18
8
0
58
7
20
0
23
4
18
7
38
2
29
2.3
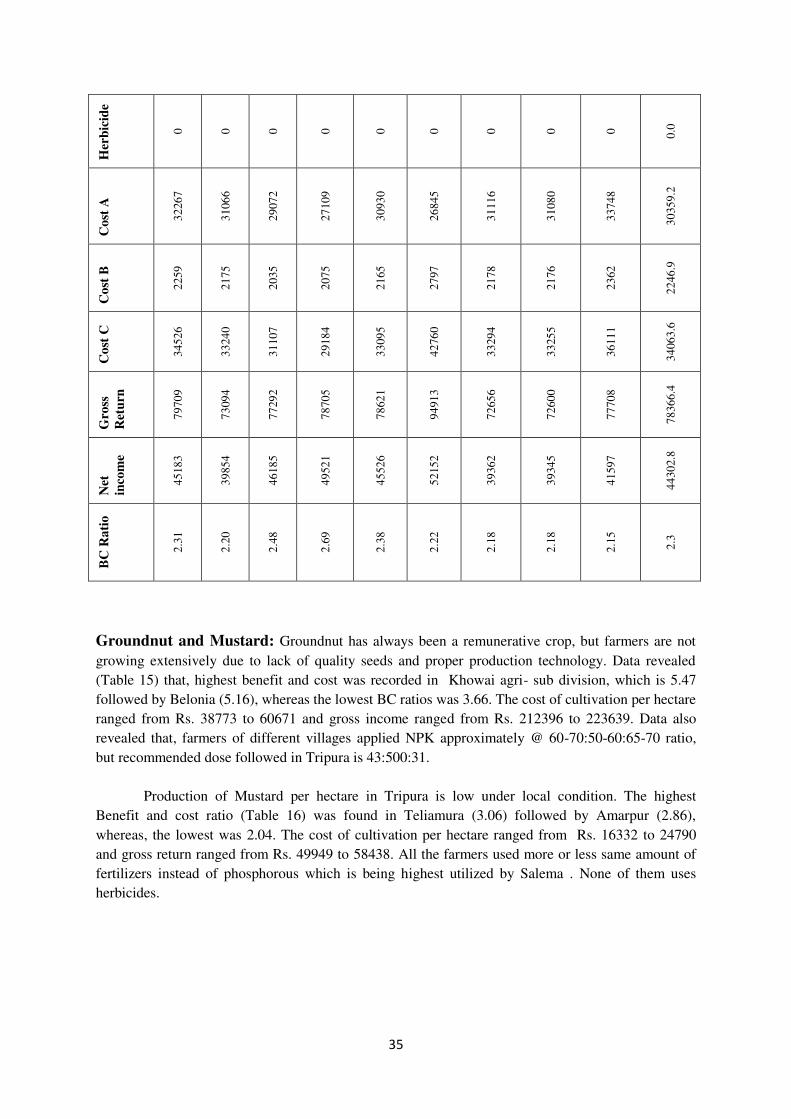
35
Her
bic
ide
0
0
0
0
0
0
0
0
0
0.0
Co
st A
32
26
7
31
06
6
29
07
2
27
10
9
30
93
0
26
84
5
31
11
6
31
08
0
33
74
8
30
35
9.2
Co
st B
22
59
21
75
20
35
20
75
21
65
27
97
21
78
21
76
23
62
22
46
.9
Co
st C
34
52
6
33
24
0
31
10
7
29
18
4
33
09
5
42
76
0
33
29
4
33
25
5
36
11
1
34
06
3.6
Gro
ss
Ret
urn
79
70
9
73
09
4
77
29
2
78
70
5
78
62
1
94
91
3
72
65
6
72
60
0
77
70
8
78
36
6.4
Net
inco
me
45
18
3
39
85
4
46
18
5
49
52
1
45
52
6
52
15
2
39
36
2
39
34
5
41
59
7
44
30
2.8
BC
Ra
tio
2.3
1
2.2
0
2.4
8
2.6
9
2.3
8
2.2
2
2.1
8
2.1
8
2.1
5
2.3
Groundnut and Mustard: Groundnut has always been a remunerative crop, but farmers are not
growing extensively due to lack of quality seeds and proper production technology. Data revealed
(Table 15) that, highest benefit and cost was recorded in Khowai agri- sub division, which is 5.47
followed by Belonia (5.16), whereas the lowest BC ratios was 3.66. The cost of cultivation per hectare
ranged from Rs. 38773 to 60671 and gross income ranged from Rs. 212396 to 223639. Data also
revealed that, farmers of different villages applied NPK approximately @ 60-70:50-60:65-70 ratio,
but recommended dose followed in Tripura is 43:500:31.
Production of Mustard per hectare in Tripura is low under local condition. The highest
Benefit and cost ratio (Table 16) was found in Teliamura (3.06) followed by Amarpur (2.86),
whereas, the lowest was 2.04. The cost of cultivation per hectare ranged from Rs. 16332 to 24790
and gross return ranged from Rs. 49949 to 58438. All the farmers used more or less same amount of
fertilizers instead of phosphorous which is being highest utilized by Salema . None of them uses
herbicides.
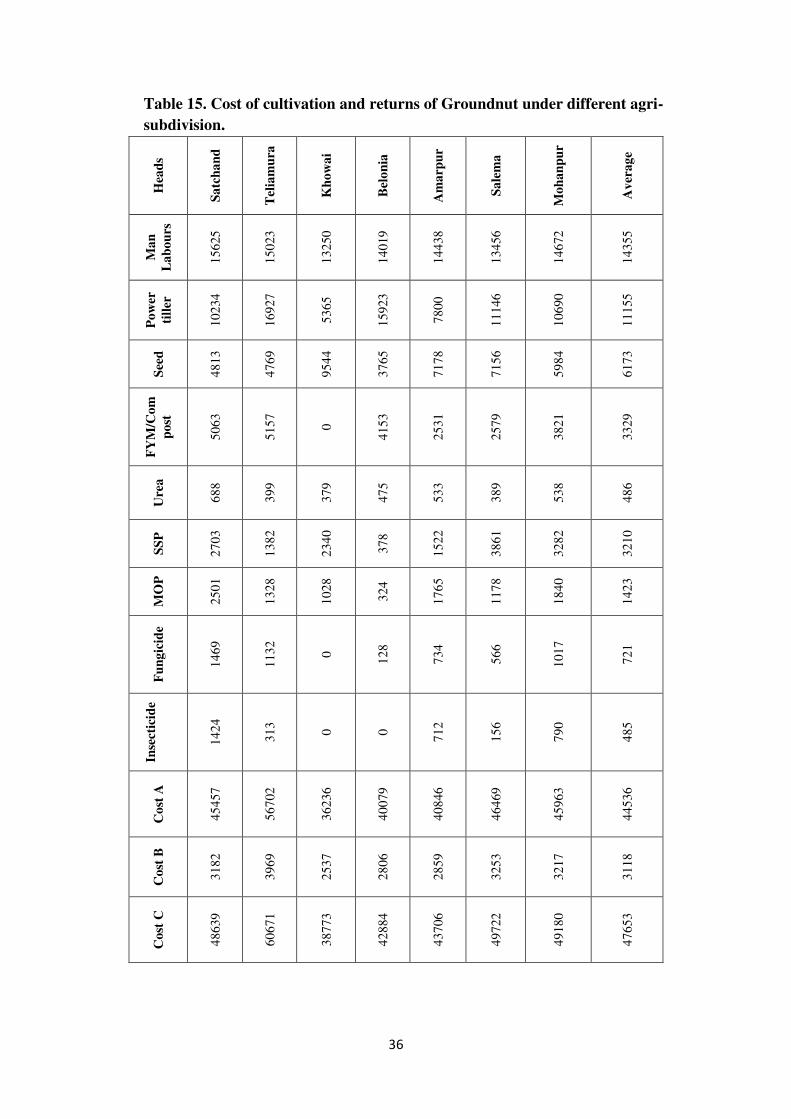
36
Table 15. Cost of cultivation and returns of Groundnut under different agri-
subdivision.
Hea
ds
Sa
tch
an
d
Tel
iam
ura
Kh
ow
ai
Bel
on
ia
Am
arp
ur
Sa
lem
a
Mo
ha
np
ur
Av
era
ge
Ma
n
La
bo
urs
15
625
15
023
13
250
14
019
14
438
13
456
14
672
14
355
Po
wer
till
er
10
234
16
927
53
65
15
923
78
00
11
146
10
690
11
155
See
d
48
13
47
69
95
44
37
65
71
78
71
56
59
84
61
73
FY
M/C
om
po
st
50
63
51
57
0
41
53
25
31
25
79
38
21
33
29
Ure
a
68
8
39
9
37
9
47
5
53
3
38
9
53
8
48
6
SS
P
27
03
13
82
23
40
37
8
15
22
38
61
32
82
32
10
MO
P
25
01
13
28
10
28
32
4
17
65
11
78
18
40
14
23
Fu
ng
icid
e
14
69
11
32
0
12
8
73
4
56
6
10
17
72
1
Inse
ctic
ide
14
24
31
3
0
0
71
2
15
6
79
0
48
5
Co
st A
45
457
56
702
36
236
40
079
40
846
46
469
45
963
44
536
Co
st B
31
82
39
69
25
37
28
06
28
59
32
53
32
17
31
18
Co
st C
48
639
60
671
38
773
42
884
43
706
49
722
49
180
47
653

37
Gro
ss
inco
me
22
363
9
22
239
6
21
239
6
22
139
2
21
801
7
21
739
6
22
051
7
21
939
3
Net
inco
me
17
500
0
16
172
5
17
362
3
17
850
7
17
431
2
16
767
4
17
133
7
17
174
0
BC
Ra
tio
4.5
9
3.6
6
5.4
7
5.1
6
4.9
8
4.3
7
4.4
8
4.6
0
Table 16. Cost of cultivation and returns of Mustard under different agri-
subdivision.
Hea
ds
Am
arp
ur
Kh
ow
ai
Ku
ma
rgh
at
Ka
nch
an
pu
r
Sa
tch
an
d
Tel
iam
ura
Sa
lem
a
Ga
nd
ach
erra
Av
era
ge
Ma
n
La
bo
urs
13
133
16
671
11
711
19
279
12
016
10
737
14
776
15
063
16
673
Ca
ttle
Pa
ir
Da
y
0
0
61
13
0
0
0
10
00
0
17
18
See
d
14
42
12
63
19
19
11
09
14
05
14
72
20
9
20
71
13
61
Die
sel
0
0
0
0
0
0
36
8
0
46
Ker
ose
ne
48
9
54
9
54
1
57
2
50
2
52
9
0
61
2
47
4
Ure
a
49
6
36
8
51
1
50
6
54
5
50
8
71
8
63
2
53
5
SS
P
59
7
51
4
54
8
44
8
52
5
49
8
43
2
62
2
52
3
MO
P
11
89
94
5
96
3
11
15
11
66
11
15
12
00
13
92
13
10
Fu
ng
icid
e
35
8
39
5
61
0
48
6
30
1
23
7
0
31
8
33
8

38
Inse
ctic
ide
13
2
21
1
26
8
42
2
11
7
16
7
0
19
3
18
9
Co
st A
17
836
20
916
23
182
23
937
16
576
15
263
18
703
20
902
23
168
Co
st B
12
49
14
64
16
23
16
76
60
09
10
68
22
71
14
63
22
28
Co
st C
19
085
22
380
24
805
25
613
17
737
16
332
20
974
22
365
24
790
Gro
ss
inco
me
54
626
52
788
50
629
58
438
50
102
49
949
51
650
54
928
54
139
Net
inco
me
35
541
30
408
25
734
32
825
32
365
33
617
30
676
32
563
29
337
BC
Ra
tio
2.8
6
2.3
6
2.0
4
2.2
8
2.8
2
3.0
6
2.4
6
2.4
6
2.1
8
Sesame and Lentil: Data on cost of cultivation of sesame per hectare (Table17) showed that it
ranged from Rs. 41162.9 to 53741.82, whereas, gross income raged from Rs. 50089.29 to 54873.1.
The BC ratio of sesame varied from 2.0 to 2.3. Farmers of all the Agri-subdivision more or less
generally used all the inputs like fertilizer, seeds, herbicides, fungicides fertilizer etc. and they applied
fertilizer excessively instead of general recommendation ratio 20-30:30:0.
The production of Lentil in Tripura condition is low due to lack of proper technological interventions
and area expansion with high yielding varieties. The cost of cultivation per hectare ranged from Rs.
31623 to 38771, whereas, gross return ranged from Rs. 103993 to 120000. The BC ratio varied from
3.09-3.85.
Table 17. Cost of cultivation and returns of Sesame under different agri-subdivision.
Hea
ds
Tel
iam
ura
Sa
tch
an
d
Ka
da
mta
la
Am
arp
ur
Pa
nis
ag
ar
Ku
ma
rgh
at
Av
era
ge
Ma
n
La
bo
urs
15
234
13
375
17
370
13
500
18
776
18
549
16
134
Po
wer
till
er
58
52
51
54
63
06
53
38
56
35
74
14
59
50
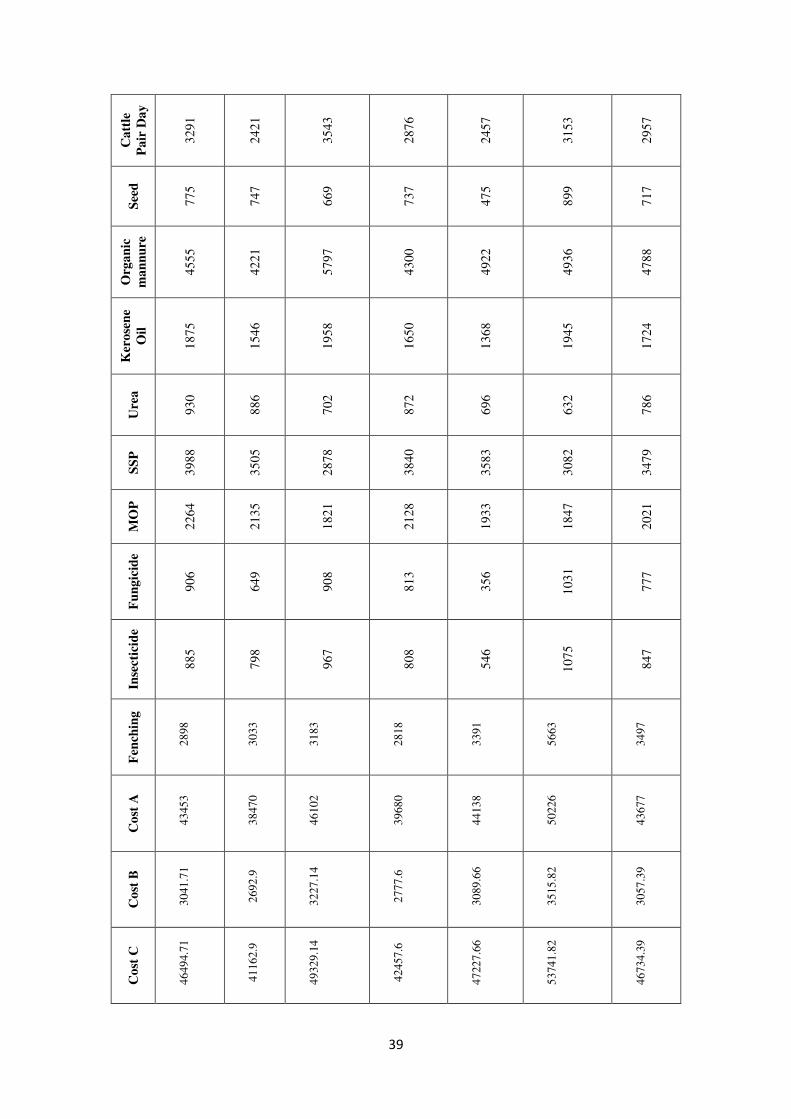
39
Ca
ttle
Pa
ir D
ay
32
91
24
21
35
43
28
76
24
57
31
53
29
57
See
d
77
5
74
7
66
9
73
7
47
5
89
9
71
7
Org
an
ic
ma
nn
ure
45
55
42
21
57
97
43
00
49
22
49
36
47
88
Ker
ose
ne
Oil
18
75
15
46
19
58
16
50
13
68
19
45
17
24
Ure
a
93
0
88
6
70
2
87
2
69
6
63
2
78
6
SS
P
39
88
35
05
28
78
38
40
35
83
30
82
34
79
MO
P
22
64
21
35
18
21
21
28
19
33
18
47
20
21
Fu
ng
icid
e
90
6
64
9
90
8
81
3
35
6
10
31
77
7
Inse
ctic
ide
88
5
79
8
96
7
80
8
54
6
10
75
84
7
Fen
chin
g
28
98
30
33
31
83
28
18
33
91
56
63
34
97
Co
st A
43
45
3
38
47
0
46
10
2
39
68
0
44
13
8
50
22
6
43
67
7
Co
st B
30
41
.71
26
92
.9
32
27
.14
27
77
.6
30
89
.66
35
15
.82
30
57
.39
Co
st C
46
49
4.7
1
41
16
2.9
49
32
9.1
4
42
45
7.6
47
22
7.6
6
53
74
1.8
2
46
73
4.3
9

40
Gro
ss
inco
me
96
58
4
96
03
6
99
50
8
96
39
2
99
15
6
10
51
22
98
80
0
Net
inco
me
50
08
9.2
9
54
87
3.1
50
17
8.8
6
53
93
4.4
51
92
8.3
4
51
38
0.1
8
52
06
5.6
1
BC
Ra
tio
2.1
2.3
2.0
2.3
2.1
2.0
2.1
Table 18. Cost of cultivation and returns of Lentil under different agri-subdivision
Hea
ds
Am
ba
ssa
Ch
am
an
u
Ku
ma
rgh
at
Sa
tch
an
d
Du
kli
Mo
ha
np
ur
Am
arp
ur
Tel
iam
ura
Av
era
ge
Ma
n
La
bo
urs
12
355
13
125
12
448
13
627
13
125
12
250
13
230
13
250
12
926
Ca
ttle
Pa
ir
Da
y
78
13
67
19
55
99
65
57
53
65
53
65
65
63
53
65
61
68
See
d
54
22
31
77
34
32
41
84
49
54
50
63
10
93
0
95
44
58
38
Die
sel
48
3
54
1
34
3
48
4
29
2
24
0
32
0
33
0
37
9
Ure
a
39
0
50
3
42
8
49
0
34
4
35
3
37
5
37
9
40
8
SS
P
47
65
73
31
60
06
74
38
59
25
59
23
48
36
63
40
60
70
MO
P
97
1
12
65
12
98
12
99
10
23
93
2
86
6
10
28
10
85
Co
st A
32
199
32
660
29
554
34
079
31
028
30
125
36
234
36
234
32
764
Co
st B
22
54
22
86
20
69
23
86
21
72
21
09
25
36
25
36
22
93
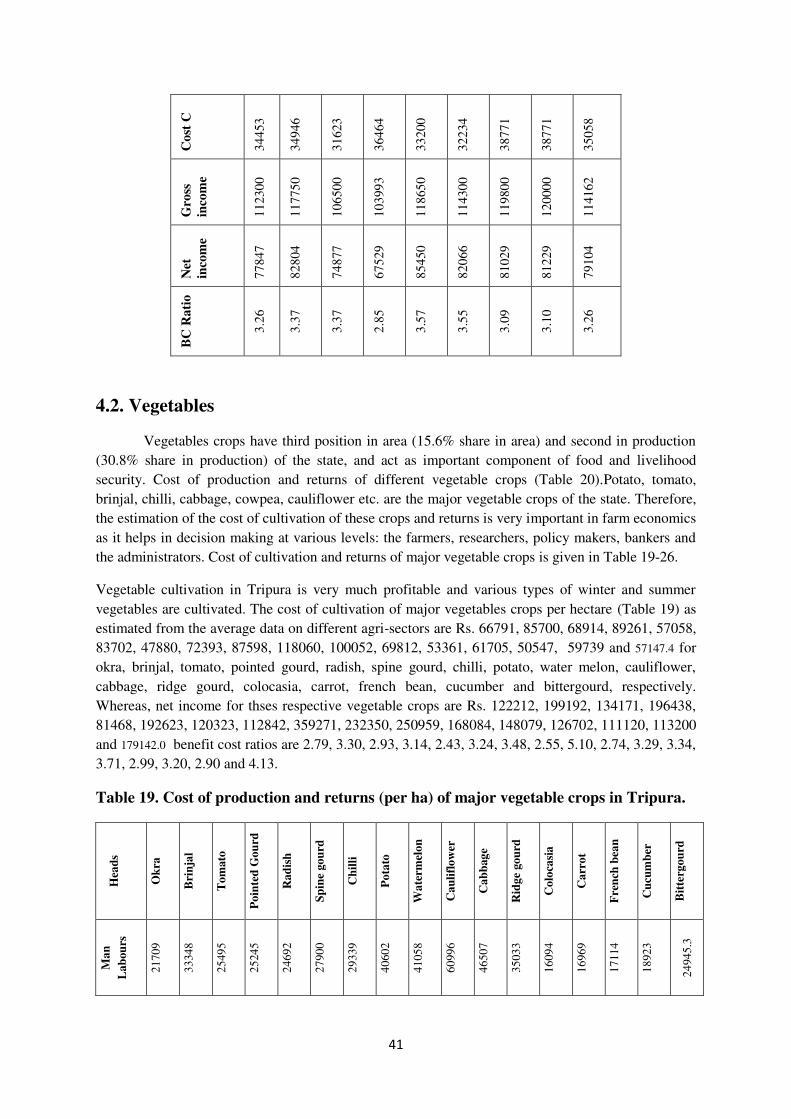
41
Co
st C
34
453
34
946
31
623
36
464
33
200
32
234
38
771
38
771
35
058
Gro
ss
inco
me
11
230
0
11
775
0
10
650
0
10
399
3
11
865
0
11
430
0
11
980
0
12
000
0
11
416
2
Net
inco
me
77
847
82
804
74
877
67
529
85
450
82
066
81
029
81
229
79
104
BC
Ra
tio
3.2
6
3.3
7
3.3
7
2.8
5
3.5
7
3.5
5
3.0
9
3.1
0
3.2
6
4.2. Vegetables
Vegetables crops have third position in area (15.6% share in area) and second in production
(30.8% share in production) of the state, and act as important component of food and livelihood
security. Cost of production and returns of different vegetable crops (Table 20).Potato, tomato,
brinjal, chilli, cabbage, cowpea, cauliflower etc. are the major vegetable crops of the state. Therefore,
the estimation of the cost of cultivation of these crops and returns is very important in farm economics
as it helps in decision making at various levels: the farmers, researchers, policy makers, bankers and
the administrators. Cost of cultivation and returns of major vegetable crops is given in Table 19-26.
Vegetable cultivation in Tripura is very much profitable and various types of winter and summer
vegetables are cultivated. The cost of cultivation of major vegetables crops per hectare (Table 19) as
estimated from the average data on different agri-sectors are Rs. 66791, 85700, 68914, 89261, 57058,
83702, 47880, 72393, 87598, 118060, 100052, 69812, 53361, 61705, 50547, 59739 and 57147.4 for
okra, brinjal, tomato, pointed gourd, radish, spine gourd, chilli, potato, water melon, cauliflower,
cabbage, ridge gourd, colocasia, carrot, french bean, cucumber and bittergourd, respectively.
Whereas, net income for thses respective vegetable crops are Rs. 122212, 199192, 134171, 196438,
81468, 192623, 120323, 112842, 359271, 232350, 250959, 168084, 148079, 126702, 111120, 113200
and 179142.0 benefit cost ratios are 2.79, 3.30, 2.93, 3.14, 2.43, 3.24, 3.48, 2.55, 5.10, 2.74, 3.29, 3.34,
3.71, 2.99, 3.20, 2.90 and 4.13.
Table 19. Cost of production and returns (per ha) of major vegetable crops in Tripura.
Hea
ds
Ok
ra
Bri
nja
l
To
mato
Po
inte
d G
ou
rd
Ra
dis
h
Sp
ine
go
urd
Ch
illi
Po
tato
Wa
term
elo
n
Ca
uli
flo
wer
Ca
bb
ag
e
Rid
ge
go
urd
Co
loca
sia
Ca
rro
t
Fre
nch
bea
n
Cu
cum
ber
Bit
terg
ou
rd
Ma
n
La
bou
rs
21
70
9
33
34
8
25
49
5
25
24
5
24
69
2
27
90
0
29
33
9
40
60
2
41
05
8
60
99
6
46
50
7
35
03
3
16
09
4
16
96
9
17
11
4
18
92
3
24
94
5.3

42
Po
wer
till
er
56
53
78
71
58
27
55
09
59
84
56
41
51
56
57
11
61
58
52
43
54
85
39
59
61
72
68
97
61
49
58
10
45
20
9.2
Ca
ttle
Pa
ir
Da
y
12
3
0
26
79
0
21
39
0
0
0
0
26
03
27
56
61
72
0
0
22
10
00
See
d
15
47
1
32
8
90
02
13
22
0
75
07
14
58
3
59
5
11
89
5
13
66
12
57
5
12
65
5
10
05
6
13
54
7
13
21
12
22
6
94
77
13
01
9
.9
Ma
nu
re
73
2
16
28
7
78
3
48
1
10
22
48
2
11
98
15
28
34
51
26
98
41
39
65
24
45
94
23
37
65
03
75
7
43
1.2
Ele
ctri
icit
y
0
0
0
0
0
0
0
0
18
0
15
7
57
2
0
0
0
0
0
Die
sel
16
88
15
44
11
35
98
2
12
42
14
36
69
8
48
9
67
1
10
0
47
0
0
10
39
0
14
08
95
2.1
Ver
mic
om
po
st
0
0
0
0
0
0
0
0
12
98
7
22
61
20
12
0
0
0
0
0
0
Ure
a
39
05
17
24
38
37
14
30
23
08
74
9
17
48
11
56
65
8
12
85
23
09
10
86
0
42
74
22
2
13
27
13
30
.1
SS
P
42
94
33
86
40
94
17
28
33
46
16
06
15
47
25
59
15
48
54
63
46
10
21
71
0
14
87
6
13
40
34
58
15
27
.8
MO
P
24
67
44
87
27
75
16
57
30
90
19
75
22
44
25
93
21
72
15
57
10
72
14
05
32
92
36
79
86
9
43
88
14
57
.4
DA
P
89
7
27
44
16
20
0
0
24
0
0
0
47
3
12
94
14
7
0
0
40
5
0
0
Bio
zin
e
0
0
0
0
0
0
0
0
0
0
0
24
7
0
0
0
0
0
Fu
ng
icid
e
16
25
17
11
18
01
13
64
67
2
38
9
39
2
33
0
0
14
20
88
7
0
0
15
56
41
2
31
8
13
63
.8
Her
bic
ide
22
20
24
61
53
57
15
59
0
10
27
0
0
0
22
4
13
4
27
52
0
0
0
0
0
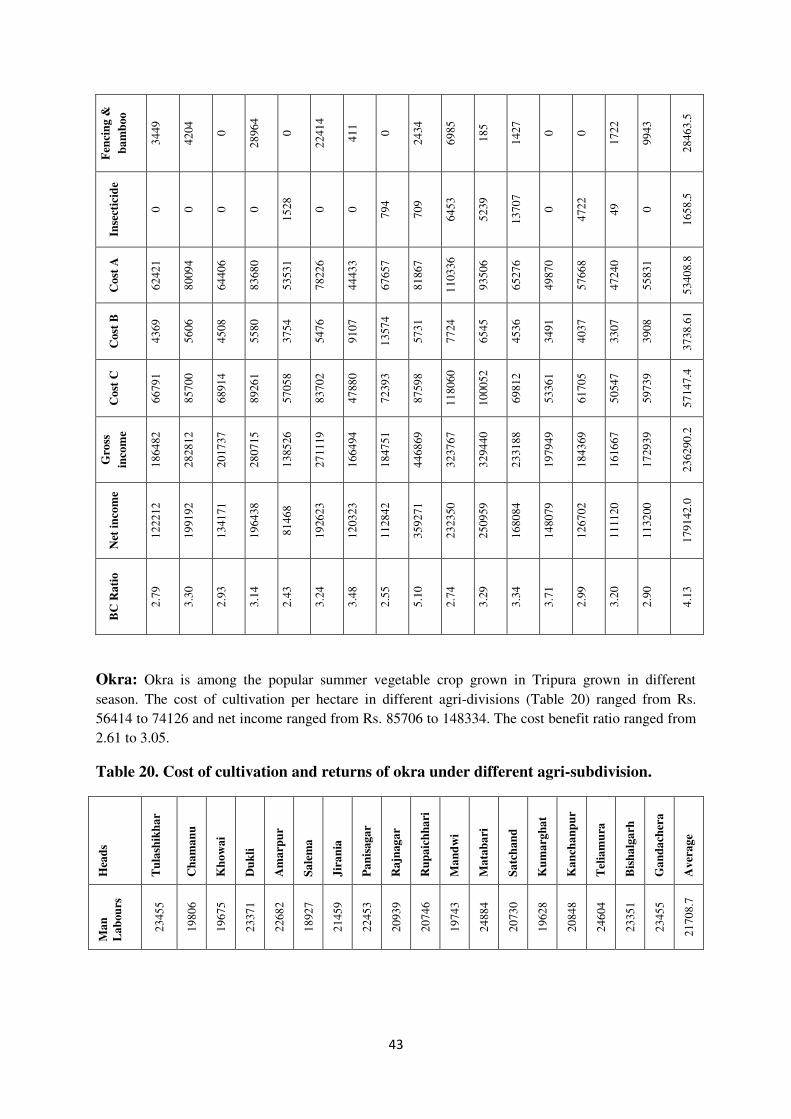
43
Fen
cin
g &
ba
mb
oo
34
49
42
04
0
28
96
4
0
22
41
4
41
1
0
24
34
69
85
18
5
14
27
0
0
17
22
99
43
28
46
3.5
Inse
ctic
ide
0
0
0
0
15
28
0
0
79
4
70
9
64
53
52
39
13
70
7
0
47
22
49
0
16
58
.5
Co
st A
62
42
1
80
09
4
64
40
6
83
68
0
53
53
1
78
22
6
44
43
3
67
65
7
81
86
7
11
03
36
93
50
6
65
27
6
49
87
0
57
66
8
47
24
0
55
83
1
53
40
8.8
Co
st B
43
69
56
06
45
08
55
80
37
54
54
76
91
07
13
57
4
57
31
77
24
65
45
45
36
34
91
40
37
33
07
39
08
37
38
.61
Co
st C
66
79
1
85
70
0
68
91
4
89
26
1
57
05
8
83
70
2
47
88
0
72
39
3
87
59
8
11
80
60
10
00
52
69
81
2
53
36
1
61
70
5
50
54
7
59
73
9
57
14
7.4
Gro
ss
inco
me
18
64
82
28
28
12
20
17
37
28
07
15
13
85
26
27
11
19
16
64
94
18
47
51
44
68
69
32
37
67
32
94
40
23
31
88
19
79
49
18
43
69
16
16
67
17
29
39
23
62
90
.2
Net
in
com
e
12
22
12
19
91
92
13
41
71
19
64
38
81
46
8
19
26
23
12
03
23
11
28
42
35
92
71
23
23
50
25
09
59
16
80
84
14
80
79
12
67
02
11
11
20
11
32
00
17
91
42
.0
BC
Ra
tio
2.7
9
3.3
0
2.9
3
3.1
4
2.4
3
3.2
4
3.4
8
2.5
5
5.1
0
2.7
4
3.2
9
3.3
4
3.7
1
2.9
9
3.2
0
2.9
0
4.1
3
Okra: Okra is among the popular summer vegetable crop grown in Tripura grown in different
season. The cost of cultivation per hectare in different agri-divisions (Table 20) ranged from Rs.
56414 to 74126 and net income ranged from Rs. 85706 to 148334. The cost benefit ratio ranged from
2.61 to 3.05.
Table 20. Cost of cultivation and returns of okra under different agri-subdivision.
Hea
ds
Tu
lash
ikh
ar
Ch
am
an
u
Kh
ow
ai
Du
kli
Am
arp
ur
Sa
lem
a
Jir
an
ia
Pa
nis
ag
ar
Ra
jnag
ar
Ru
pa
ich
ha
ri
Ma
nd
wi
Ma
tab
ari
Sa
tch
an
d
Ku
ma
rgh
at
Ka
nch
an
pu
r
Tel
iam
ura
Bis
ha
lga
rh
Ga
nd
ach
era
Av
era
ge
Ma
n
La
bou
rs
23
45
5
19
80
6
19
67
5
23
37
1
22
68
2
18
92
7
21
45
9
22
45
3
20
93
9
20
74
6
19
74
3
24
88
4
20
73
0
19
62
8
20
84
8
24
60
4
23
35
1
23
45
5
21
70
8.7
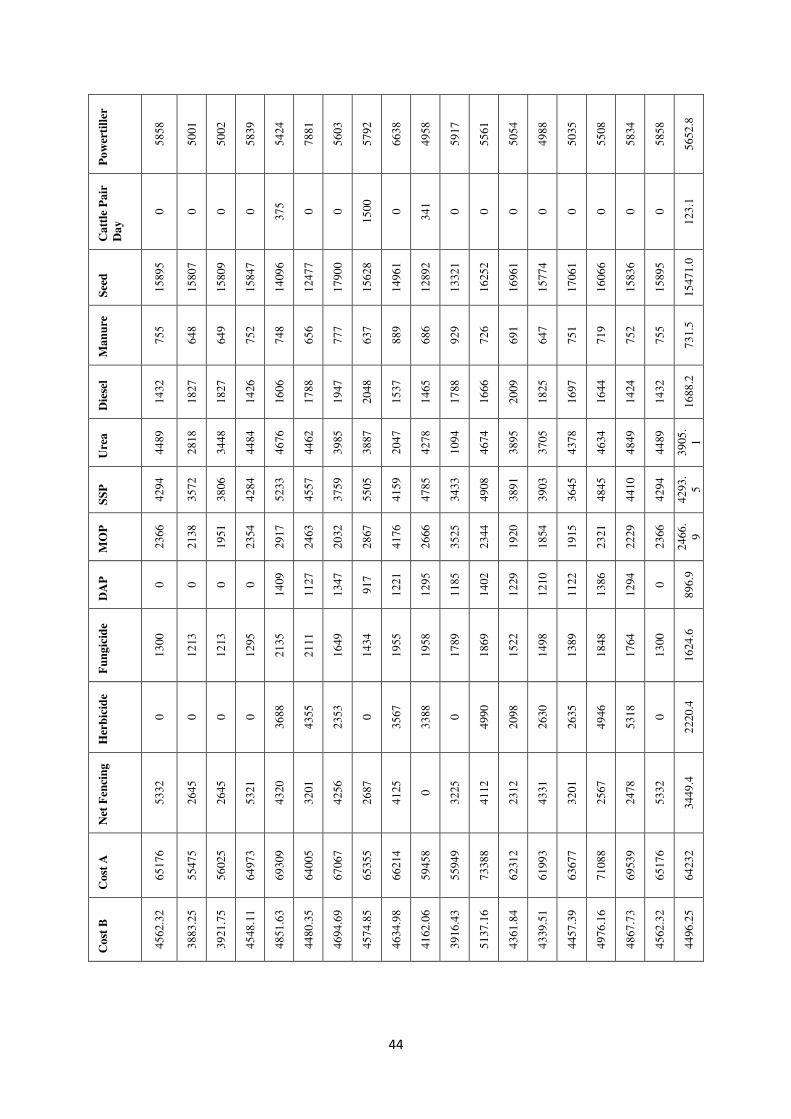
44
Po
wer
till
er
58
58
50
01
50
02
58
39
54
24
78
81
56
03
57
92
66
38
49
58
59
17
55
61
50
54
49
88
50
35
55
08
58
34
58
58
56
52
.8
Ca
ttle
Pa
ir
Da
y
0
0
0
0
37
5
0
0
15
00
0
34
1
0
0
0
0
0
0
0
0
12
3.1
See
d
15
89
5
15
80
7
15
80
9
15
84
7
14
09
6
12
47
7
17
90
0
15
62
8
14
96
1
12
89
2
13
32
1
16
25
2
16
96
1
15
77
4
17
06
1
16
06
6
15
83
6
15
89
5
15
47
1.0
Ma
nu
re
75
5
64
8
64
9
75
2
74
8
65
6
77
7
63
7
88
9
68
6
92
9
72
6
69
1
64
7
75
1
71
9
75
2
75
5
73
1.5
Die
sel
14
32
18
27
18
27
14
26
16
06
17
88
19
47
20
48
15
37
14
65
17
88
16
66
20
09
18
25
16
97
16
44
14
24
14
32
16
88
.2
Ure
a
44
89
28
18
34
48
44
84
46
76
44
62
39
85
38
87
20
47
42
78
10
94
46
74
38
95
37
05
43
78
46
34
48
49
44
89
39
05
.
1
SS
P
42
94
35
72
38
06
42
84
52
33
45
57
37
59
55
05
41
59
47
85
34
33
49
08
38
91
39
03
36
45
48
45
44
10
42
94
42
93
.
5
MO
P
23
66
21
38
19
51
23
54
29
17
24
63
20
32
28
67
41
76
26
66
35
25
23
44
19
20
18
54
19
15
23
21
22
29
23
66
24
66
.
9
DA
P
0
0
0
0
14
09
11
27
13
47
91
7
12
21
12
95
11
85
14
02
12
29
12
10
11
22
13
86
12
94
0
89
6.9
Fu
ng
icid
e
13
00
12
13
12
13
12
95
21
35
21
11
16
49
14
34
19
55
19
58
17
89
18
69
15
22
14
98
13
89
18
48
17
64
13
00
16
24
.6
Her
bic
ide
0
0
0
0
36
88
43
55
23
53
0
35
67
33
88
0
49
90
20
98
26
30
26
35
49
46
53
18
0
22
20
.4
Net
Fen
cin
g
53
32
26
45
26
45
53
21
43
20
32
01
42
56
26
87
41
25
0
32
25
41
12
23
12
43
31
32
01
25
67
24
78
53
32
34
49
.4
Co
st A
65
17
6
55
47
5
56
02
5
64
97
3
69
30
9
64
00
5
67
06
7
65
35
5
66
21
4
59
45
8
55
94
9
73
38
8
62
31
2
61
99
3
63
67
7
71
08
8
69
53
9
65
17
6
64
23
2
Co
st B
45
62
.32
38
83
.25
39
21
.75
45
48
.11
48
51
.63
44
80
.35
46
94
.69
45
74
.85
46
34
.98
41
62
.06
39
16
.43
51
37
.16
43
61
.84
43
39
.51
44
57
.39
49
76
.16
48
67
.73
45
62
.32
44
96
.25
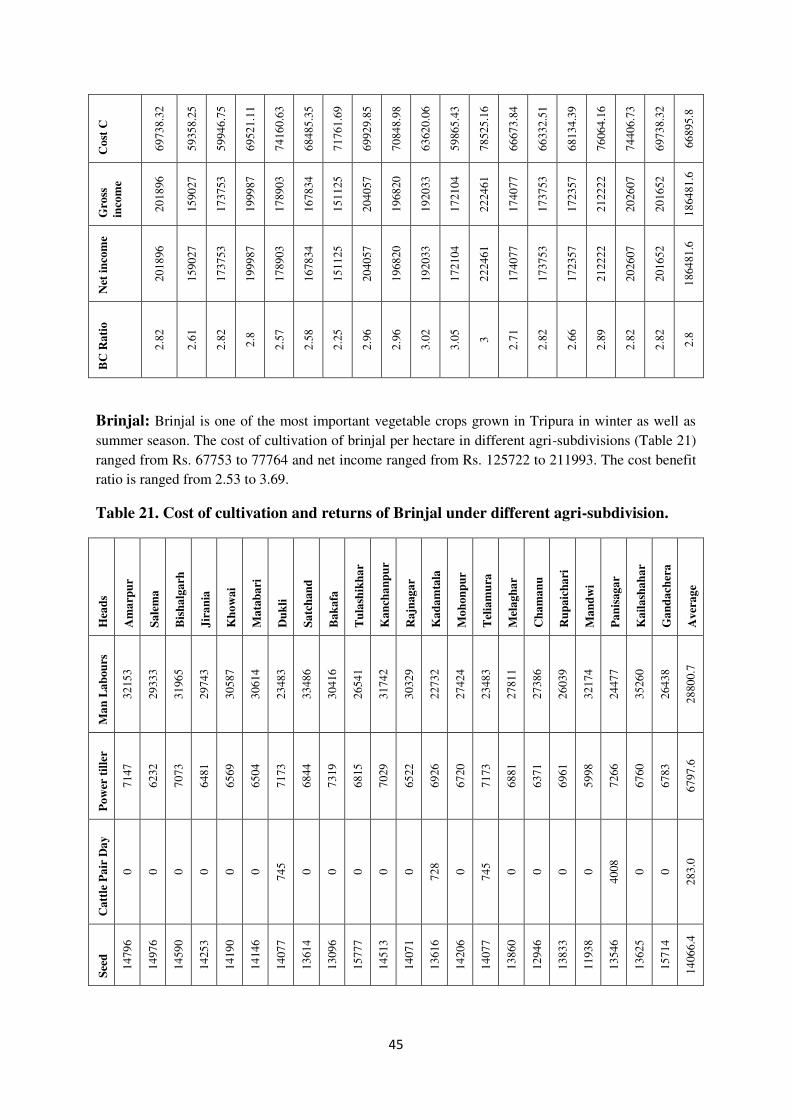
45
Co
st C
69
73
8.3
2
59
35
8.2
5
59
94
6.7
5
69
52
1.1
1
74
16
0.6
3
68
48
5.3
5
71
76
1.6
9
69
92
9.8
5
70
84
8.9
8
63
62
0.0
6
59
86
5.4
3
78
52
5.1
6
66
67
3.8
4
66
33
2.5
1
68
13
4.3
9
76
06
4.1
6
74
40
6.7
3
69
73
8.3
2
66
89
5.8
Gro
ss
inco
me
20
18
96
15
90
27
17
37
53
19
99
87
17
89
03
16
78
34
15
11
25
20
40
57
19
68
20
19
20
33
17
21
04
22
24
61
17
40
77
17
37
53
17
23
57
21
22
22
20
26
07
20
16
52
18
64
81
.6
Net
in
com
e
20
18
96
15
90
27
17
37
53
19
99
87
17
89
03
16
78
34
15
11
25
20
40
57
19
68
20
19
20
33
17
21
04
22
24
61
17
40
77
17
37
53
17
23
57
21
22
22
20
26
07
20
16
52
18
64
81
.6
BC
Ra
tio
2.8
2
2.6
1
2.8
2
2.8
2.5
7
2.5
8
2.2
5
2.9
6
2.9
6
3.0
2
3.0
5
3
2.7
1
2.8
2
2.6
6
2.8
9
2.8
2
2.8
2
2.8
Brinjal: Brinjal is one of the most important vegetable crops grown in Tripura in winter as well as
summer season. The cost of cultivation of brinjal per hectare in different agri-subdivisions (Table 21)
ranged from Rs. 67753 to 77764 and net income ranged from Rs. 125722 to 211993. The cost benefit
ratio is ranged from 2.53 to 3.69.
Table 21. Cost of cultivation and returns of Brinjal under different agri-subdivision.
Hea
ds
Am
arp
ur
Sa
lem
a
Bis
ha
lga
rh
Jir
an
ia
Kh
ow
ai
Ma
tab
ari
Du
kli
Sa
tch
an
d
Ba
ka
fa
Tu
lash
ikh
ar
Ka
nch
an
pu
r
Ra
jnag
ar
Ka
da
mta
la
Mo
hon
pu
r
Tel
iam
ura
Mel
ag
ha
r
Ch
am
an
u
Ru
pa
ich
ari
Ma
nd
wi
Pa
nis
ag
ar
Ka
ila
sha
ha
r
Ga
nd
ach
era
Av
era
ge
Ma
n L
ab
ou
rs
32
15
3
29
33
3
31
96
5
29
74
3
30
58
7
30
61
4
23
48
3
33
48
6
30
41
6
26
54
1
31
74
2
30
32
9
22
73
2
27
42
4
23
48
3
27
81
1
27
38
6
26
03
9
32
17
4
24
47
7
35
26
0
26
43
8
28
80
0.7
Po
wer
til
ler
71
47
62
32
70
73
64
81
65
69
65
04
71
73
68
44
73
19
68
15
70
29
65
22
69
26
67
20
71
73
68
81
63
71
69
61
59
98
72
66
67
60
67
83
67
97
.6
Ca
ttle
Pa
ir D
ay
0
0
0
0
0
0
74
5
0
0
0
0
0
72
8
0
74
5
0
0
0
0
40
08
0
0
28
3.0
See
d
14
79
6
14
97
6
14
59
0
14
25
3
14
19
0
14
14
6
14
07
7
13
61
4
13
09
6
15
77
7
14
51
3
14
07
1
13
61
6
14
20
6
14
07
7
13
86
0
12
94
6
13
83
3
11
93
8
13
54
6
13
62
5
15
71
4
14
06
6.4
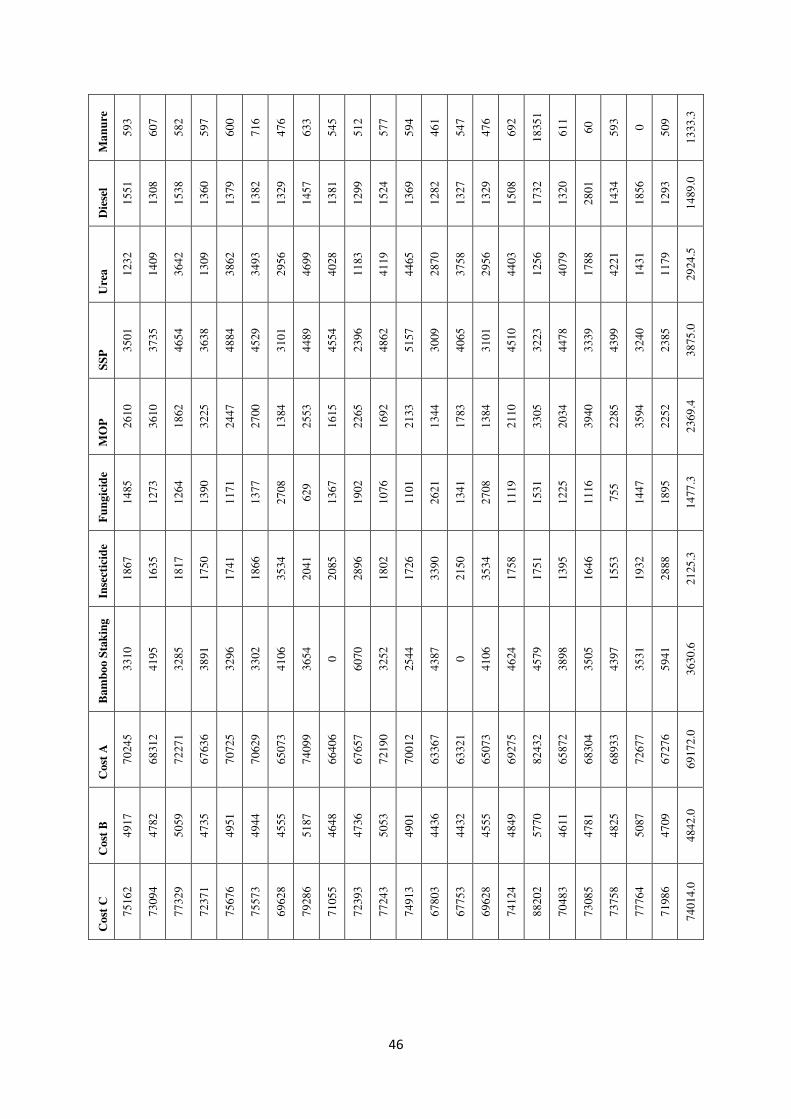
46
Ma
nu
re
59
3
60
7
58
2
59
7
60
0
71
6
47
6
63
3
54
5
51
2
57
7
59
4
46
1
54
7
47
6
69
2
18
35
1
61
1
60
59
3
0
50
9
13
33
.3
Die
sel
15
51
13
08
15
38
13
60
13
79
13
82
13
29
14
57
13
81
12
99
15
24
13
69
12
82
13
27
13
29
15
08
17
32
13
20
28
01
14
34
18
56
12
93
14
89
.0
Ure
a
12
32
14
09
36
42
13
09
38
62
34
93
29
56
46
99
40
28
11
83
41
19
44
65
28
70
37
58
29
56
44
03
12
56
40
79
17
88
42
21
14
31
11
79
29
24
.5
SS
P 35
01
37
35
46
54
36
38
48
84
45
29
31
01
44
89
45
54
23
96
48
62
51
57
30
09
40
65
31
01
45
10
32
23
44
78
33
39
43
99
32
40
23
85
38
75
.0
MO
P
26
10
36
10
18
62
32
25
24
47
27
00
13
84
25
53
16
15
22
65
16
92
21
33
13
44
17
83
13
84
21
10
33
05
20
34
39
40
22
85
35
94
22
52
23
69
.4
Fu
ng
icid
e
14
85
12
73
12
64
13
90
11
71
13
77
27
08
62
9
13
67
19
02
10
76
11
01
26
21
13
41
27
08
11
19
15
31
12
25
11
16
75
5
14
47
18
95
14
77
.3
Inse
ctic
ide
18
67
16
35
18
17
17
50
17
41
18
66
35
34
20
41
20
85
28
96
18
02
17
26
33
90
21
50
35
34
17
58
17
51
13
95
16
46
15
53
19
32
28
88
21
25
.3
Ba
mb
oo S
tak
ing
33
10
41
95
32
85
38
91
32
96
33
02
41
06
36
54
0
60
70
32
52
25
44
43
87
0
41
06
46
24
45
79
38
98
35
05
43
97
35
31
59
41
36
30
.6
Co
st A
70
24
5
68
31
2
72
27
1
67
63
6
70
72
5
70
62
9
65
07
3
74
09
9
66
40
6
67
65
7
72
19
0
70
01
2
63
36
7
63
32
1
65
07
3
69
27
5
82
43
2
65
87
2
68
30
4
68
93
3
72
67
7
67
27
6
69
17
2.0
Co
st B
49
17
47
82
50
59
47
35
49
51
49
44
45
55
51
87
46
48
47
36
50
53
49
01
44
36
44
32
45
55
48
49
57
70
46
11
47
81
48
25
50
87
47
09
48
42
.0
Co
st C
75
16
2
73
09
4
77
32
9
72
37
1
75
67
6
75
57
3
69
62
8
79
28
6
71
05
5
72
39
3
77
24
3
74
91
3
67
80
3
67
75
3
69
62
8
74
12
4
88
20
2
70
48
3
73
08
5
73
75
8
77
76
4
71
98
6
74
01
4.0

47
Gro
ss i
nco
me
25
29
15
24
29
89
25
42
93
25
49
96
24
76
27
27
87
99
22
82
20
25
99
19
22
86
36
23
82
05
25
20
24
24
20
27
21
84
53
21
50
29
22
82
20
26
19
37
22
33
18
19
15
94
27
61
31
25
64
27
28
46
70
23
70
05
24
42
47
.0
Net
in
com
e
17
77
53
16
98
95
17
69
64
18
26
25
17
19
51
20
32
26
16
93
14
18
06
33
16
22
30
16
58
12
17
47
81
16
71
14
15
06
50
14
72
75
15
85
92
19
26
62
13
51
15
12
57
22
20
78
27
18
74
94
21
19
93
16
50
19
17
20
29
.4
B.C
Ra
tio
3.3
6
3.3
2
3.2
9
3.5
2
3.2
7
3.6
9
3.2
8
3.2
8
3.2
2
3.2
9
3.2
6
3.2
3
3.2
2
3.1
7
3.2
8
3.5
3
2.5
3
2.7
2
3.7
8
3.4
8
3.6
6
3.2
9
3.3
Tomato: Tomato is cultivated in most of the regions of Tripura during winter. The cost of cultivation
of tomato per hectare in Tripura (Table 22) ranges from Rs. 65242 to 71027 and net income ranges
from Rs 122732 to 147945. Whereas, BC ratio ranged from 2.69 to 3.07. Despites of different
constraints faced by tomato growers, the production results show the most profitable.
Table 22. Cost of cultivation and returns of Tomato under different agri-subdivision
Hea
ds
Bis
hw
alg
arh
Sa
lem
a
Jir
an
ia
Kh
ow
ai
Sa
tch
an
d
Tel
iam
ura
Du
kli
Ka
da
mta
la
Ku
ma
rgh
at
Ba
ga
fa
Ka
nch
an
pu
r
Ch
am
an
u
Ru
pa
ich
ha
ri
Ra
jnag
ar
Mel
ag
ha
r
Pa
nis
ag
ar
Am
arp
ur
Ga
nd
ach
era
Av
era
ge
Ma
n
La
bou
rs
24
36
3
24
43
1
24
50
1
24
63
7
24
74
1
24
13
7
27
13
3
27
25
8
24
53
9
24
44
8
24
34
4
26
67
5
25
29
5
25
29
5
27
81
8
28
01
6
26
63
7
24
63
6
25
49
4.7
Po
wer
til
ler
58
58
58
75
58
91
59
24
59
48
58
04
53
90
53
48
58
99
58
79
58
54
52
97
65
33
65
33
57
32
59
00
53
02
59
24
58
27
.3
Ca
ttle
Pa
ir
Da
y 46
93
49
91
47
11
47
56
47
91
46
18
0
0
47
86
49
97
46
87
0
0
0
0
43
8
0
47
56
26
79
.1
See
d
86
43
82
82
86
89
87
25
87
48
85
69
93
86
94
94
87
20
82
87
86
44
92
32
95
53
95
53
10
00
8
95
60
92
19
87
15
90
01
.5
Ma
nu
re
87
4
86
1
87
8
88
3
88
6
86
5
62
8
68
6
88
1
86
1
87
3
61
9
70
8
70
8
68
7
69
8
61
8
88
2
78
3.1

48
Die
sel
10
97
11
09
11
02
11
07
11
10
10
88
11
14
11
99
11
05
11
10
10
97
10
97
12
41
12
41
12
14
12
03
10
95
11
06
11
35
.3
Ure
a
40
84
38
36
33
67
33
74
33
80
40
71
34
80
44
51
48
08
45
94
47
60
44
63
42
26
12
55
44
67
46
46
24
36
33
73
38
37
.3
SS
P
45
58
43
59
42
67
42
87
43
01
45
25
33
49
37
62
48
77
46
80
48
31
36
26
39
03
27
86
41
71
41
34
29
95
42
85
40
94
.
2
MO
P
29
75
30
25
32
71
32
95
33
13
29
33
26
22
23
16
27
26
27
05
26
98
22
54
21
31
32
27
20
62
21
97
29
13
32
94
27
75
.
4
Fu
ng
icid
e
15
77
15
97
15
80
15
88
15
94
15
62
14
58
14
84
15
96
16
04
15
81
14
41
21
66
21
66
16
46
15
01
14
26
15
87
16
19
.7
Inse
ctic
ide
17
18
17
61
17
59
17
70
17
77
17
00
16
40
16
08
16
98
17
21
16
81
15
61
23
47
25
97
17
85
18
80
16
43
17
69
18
00
.8
Sta
kin
g w
ith
Ba
mb
oo
44
66
43
60
44
90
45
07
45
17
44
33
68
12
64
72
45
02
43
62
44
67
66
84
61
34
61
97
67
90
61
10
66
91
44
38
53
57
.3
Co
st A
64
90
5
64
48
7
64
50
7
64
85
3
65
10
7
64
30
4
63
01
1
64
07
7
66
13
9
65
24
9
65
51
6
62
94
9
64
23
7
61
55
8
66
38
0
66
28
2
60
97
4
64
76
6
64
40
5.6
Co
st B
45
43
45
14
45
15
45
40
45
57
45
01
44
11
44
85
46
30
45
67
45
86
44
06
44
97
43
09
46
47
46
40
42
68
45
34
45
08
.3
Co
st C
69
44
8
69
00
1
69
02
2
69
39
3
69
66
4
68
80
6
67
42
2
68
56
2
70
76
9
69
81
6
70
10
2
67
35
5
68
73
4
65
86
7
71
02
7
70
92
2
65
24
2
69
30
0
68
91
4.0
Gro
ss
inco
me
20
27
70
20
31
53
20
43
45
20
11
28
20
09
48
20
58
30
19
07
33
19
12
95
21
75
19
20
83
73
21
49
20
19
23
36
20
93
89
20
99
51
19
67
23
19
08
64
19
09
03
20
00
93
20
17
37
.4
Net
in
com
e
13
41
70
13
41
52
13
62
67
13
35
10
13
30
76
13
70
24
12
47
00
12
27
32
14
67
50
13
85
56
14
48
17
12
49
80
14
06
55
14
79
45
13
03
43
12
45
82
12
82
52
13
25
61
13
41
70
.7
BC
Ra
tio
2.9
2
2.9
4
2.9
6
2.9
0
2.8
8
2.9
9
2.8
3
2.7
9
3.0
7
2.9
8
3.0
7
2.8
6
3.0
5
3.1
9
2.7
7
2.6
9
2.9
3
2.8
9
2.9
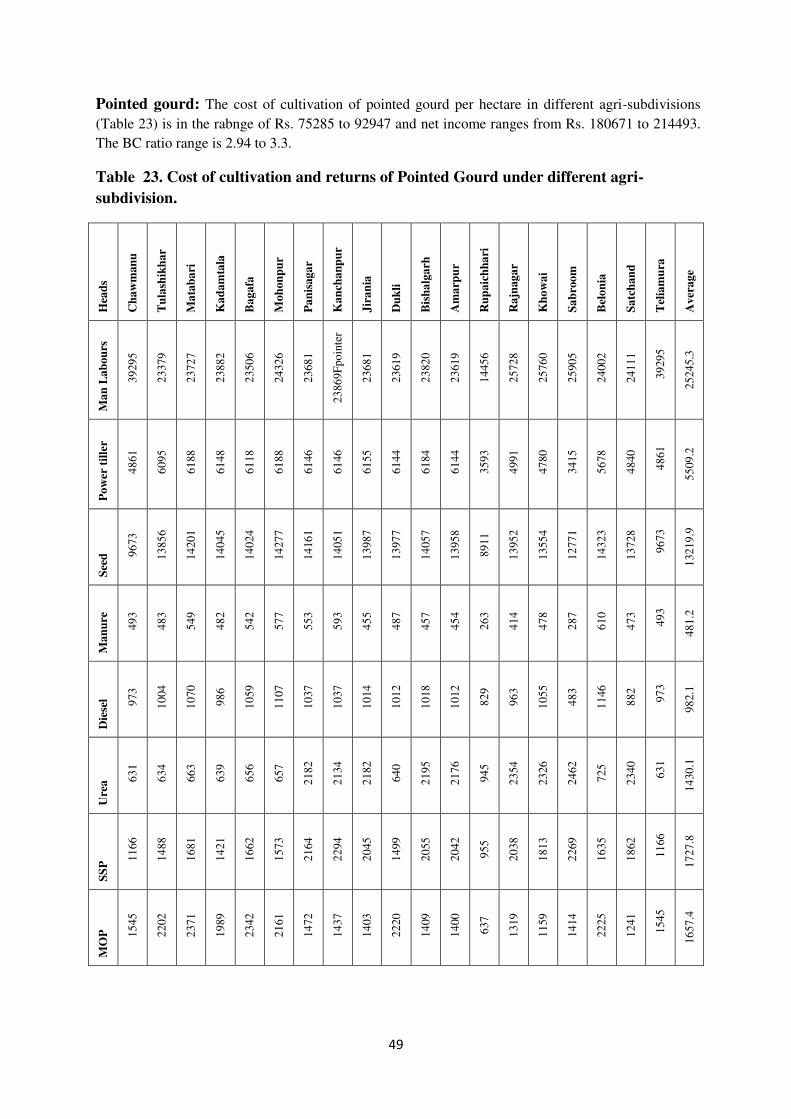
49
Pointed gourd: The cost of cultivation of pointed gourd per hectare in different agri-subdivisions
(Table 23) is in the rabnge of Rs. 75285 to 92947 and net income ranges from Rs. 180671 to 214493.
The BC ratio range is 2.94 to 3.3.
Table 23. Cost of cultivation and returns of Pointed Gourd under different agri-
subdivision.
Hea
ds
Ch
aw
man
u
Tu
lash
ikh
ar
Ma
tab
ari
Ka
da
mta
la
Ba
ga
fa
Mo
hon
pu
r
Pa
nis
ag
ar
Ka
nch
an
pu
r
Jir
an
ia
Du
kli
Bis
ha
lga
rh
Am
arp
ur
Ru
pa
ich
ha
ri
Ra
jnag
ar
Kh
ow
ai
Sa
bro
om
Bel
on
ia
Sa
tch
an
d
Tel
iam
ura
Av
era
ge
Ma
n L
ab
ou
rs
39
29
5
23
37
9
23
72
7
23
88
2
23
50
6
24
32
6
23
68
1
23
86
9F
po
inte
r
23
68
1
23
61
9
23
82
0
23
61
9
14
45
6
25
72
8
25
76
0
25
90
5
24
00
2
24
11
1
39
29
5
25
24
5.3
Po
wer
til
ler
48
61
60
95
61
88
61
48
61
18
61
88
61
46
61
46
61
55
61
44
61
84
61
44
35
93
49
91
47
80
34
15
56
78
48
40
48
61
55
09
.2
See
d 96
73
13
85
6
14
20
1
14
04
5
14
02
4
14
27
7
14
16
1
14
05
1
13
98
7
13
97
7
14
05
7
13
95
8
89
11
13
95
2
13
55
4
12
77
1
14
32
3
13
72
8
96
73
13
21
9.9
Ma
nu
re
49
3
48
3
54
9
48
2
54
2
57
7
55
3
59
3
45
5
48
7
45
7
45
4
26
3
41
4
47
8
28
7
61
0
47
3
49
3
48
1.2
Die
sel 97
3
10
04
10
70
98
6
10
59
11
07
10
37
10
37
10
14
10
12
10
18
10
12
82
9
96
3
10
55
48
3
11
46
88
2
97
3
98
2.1
Ure
a 63
1
63
4
66
3
63
9
65
6
65
7
21
82
21
34
21
82
64
0
21
95
21
76
94
5
23
54
23
26
24
62
72
5
23
40
63
1
14
30
.1
SS
P 11
66
14
88
16
81
14
21
16
62
15
73
21
64
22
94
20
45
14
99
20
55
20
42
95
5
20
38
18
13
22
69
16
35
18
62
11
66
17
27
.8
MO
P
15
45
22
02
23
71
19
89
23
42
21
61
14
72
14
37
14
03
22
20
14
09
14
00
63
7
13
19
11
59
14
14
22
25
12
41
15
45
16
57
.4

50
Fu
ng
icid
e
11
82
15
68
15
63
15
65
15
44
15
05
16
07
16
96
15
58
15
81
15
66
15
55
26
2
12
30
13
06
12
58
11
84
10
01
11
82
13
63
.8
Inse
ctic
ide
11
37
18
64
18
67
18
46
18
43
18
67
17
99
18
79
17
01
18
79
17
09
16
98
47
0
13
65
14
15
14
24
14
81
12
31
11
37
15
58
.5
Ba
mb
oo
23
74
9
31
20
2
31
64
0
31
52
7
31
24
6
30
89
8
31
56
1
31
56
1
31
56
8
31
49
3
31
73
6
31
49
3
14
67
8
29
80
3
33
22
1
24
64
8
24
07
6
30
45
8
23
74
9
28
96
3.5
Co
st A
84
70
3
83
77
5
85
52
1
84
53
0
84
54
3
85
13
6
86
36
4
86
69
7
85
74
9
84
55
1
86
20
6
85
55
1
75
28
5
84
15
6
86
86
6
76
33
7
77
08
5
82
16
7
84
70
3
83
68
0.3
Co
st B
59
29
58
64
59
86
59
17
59
18
59
59
60
45
60
69
60
02
59
19
60
34
59
89
0
58
91
60
81
53
44
53
96
57
52
59
29
55
80
.2
cost
C
90
63
3
89
64
0
91
50
7
90
44
8
90
46
1
91
09
5
92
40
9
92
76
6
91
75
1
90
46
9
92
24
0
91
53
9
75
28
5
90
04
7
92
94
7
81
68
1
82
48
1
87
91
9
90
63
3
89
26
0.6
Gro
ss i
nco
me
29
91
97
27
90
21
28
29
38
28
12
06
28
42
61
26
73
72
28
95
76
27
69
79
28
71
49
28
21
98
28
14
67
28
17
58
25
59
56
27
42
22
27
87
91
27
42
38
28
14
00
27
66
52
29
91
97
28
07
14
.6
Net
in
com
e
21
44
93
19
52
45
19
74
18
19
65
72
19
97
19
18
22
36
20
32
12
19
02
82
20
14
01
19
76
47
19
52
61
19
62
07
18
06
71
18
41
74
19
19
25
19
25
58
20
43
15
19
44
85
21
44
93
19
64
37
.6
BC
ra
tio
3.3
0
3.1
1
3.0
9
3.1
1
3.1
4
2.9
4
3.1
3
2.9
9
3.1
3
3.1
2
3.0
5
3.0
8
3.4
0
3.0
5
3.0
0
3.3
6
3.4
1
3.1
5
3.3
0
3.2
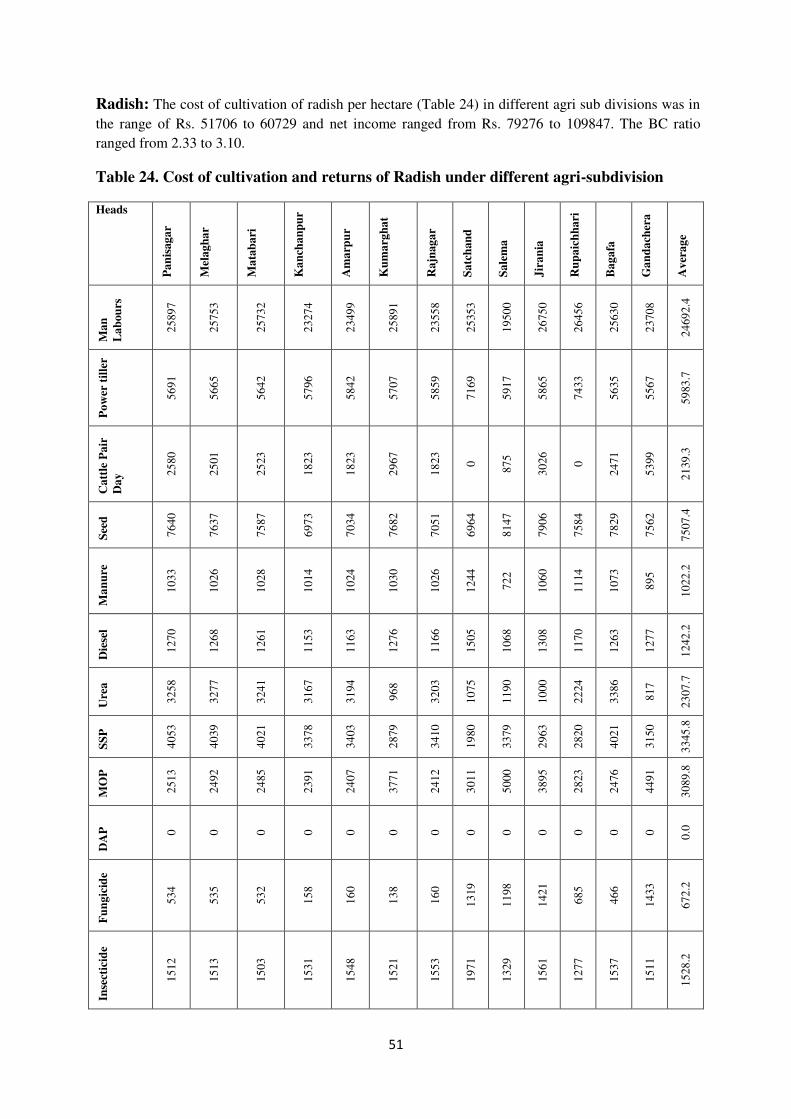
51
Radish: The cost of cultivation of radish per hectare (Table 24) in different agri sub divisions was in
the range of Rs. 51706 to 60729 and net income ranged from Rs. 79276 to 109847. The BC ratio
ranged from 2.33 to 3.10.
Table 24. Cost of cultivation and returns of Radish under different agri-subdivision
Heads
Pa
nis
ag
ar
Mel
ag
ha
r
Ma
tab
ari
Ka
nch
an
pu
r
Am
arp
ur
Ku
ma
rgh
at
Ra
jnag
ar
Sa
tch
an
d
Sa
lem
a
Jir
an
ia
Ru
pa
ich
ha
ri
Ba
ga
fa
Ga
nd
ach
era
Av
era
ge
Ma
n
La
bou
rs
25
89
7
25
75
3
25
73
2
23
27
4
23
49
9
25
89
1
23
55
8
25
35
3
19
50
0
26
75
0
26
45
6
25
63
0
23
70
8
24
69
2.4
Po
wer
til
ler
56
91
56
65
56
42
57
96
58
42
57
07
58
59
71
69
59
17
58
65
74
33
56
35
55
67
59
83
.7
Ca
ttle
Pa
ir
Da
y 25
80
25
01
25
23
18
23
18
23
29
67
18
23
0
87
5
30
26
0
24
71
53
99
21
39
.3
See
d
76
40
76
37
75
87
69
73
70
34
76
82
70
51
69
64
81
47
79
06
75
84
78
29
75
62
75
07
.4
Ma
nu
re
10
33
10
26
10
28
10
14
10
24
10
30
10
26
12
44
72
2
10
60
11
14
10
73
89
5
10
22
.2
Die
sel
12
70
12
68
12
61
11
53
11
63
12
76
11
66
15
05
10
68
13
08
11
70
12
63
12
77
12
42
.2
Ure
a
32
58
32
77
32
41
31
67
31
94
96
8
32
03
10
75
11
90
10
00
22
24
33
86
81
7
23
07
.7
SS
P
40
53
40
39
40
21
33
78
34
03
28
79
34
10
19
80
33
79
29
63
28
20
40
21
31
50
33
45
.8
MO
P
25
13
24
92
24
85
23
91
24
07
37
71
24
12
30
11
50
00
38
95
28
23
24
76
44
91
30
89
.8
DA
P
0
0
0
0
0
0
0
0
0
0
0
0
0
0.0
Fu
ng
icid
e
53
4
53
5
53
2
15
8
16
0
13
8
16
0
13
19
11
98
14
21
68
5
46
6
14
33
67
2.2
Inse
ctic
ide
15
12
15
13
15
03
15
31
15
48
15
21
15
53
19
71
13
29
15
61
12
77
15
37
15
11
15
28
.2
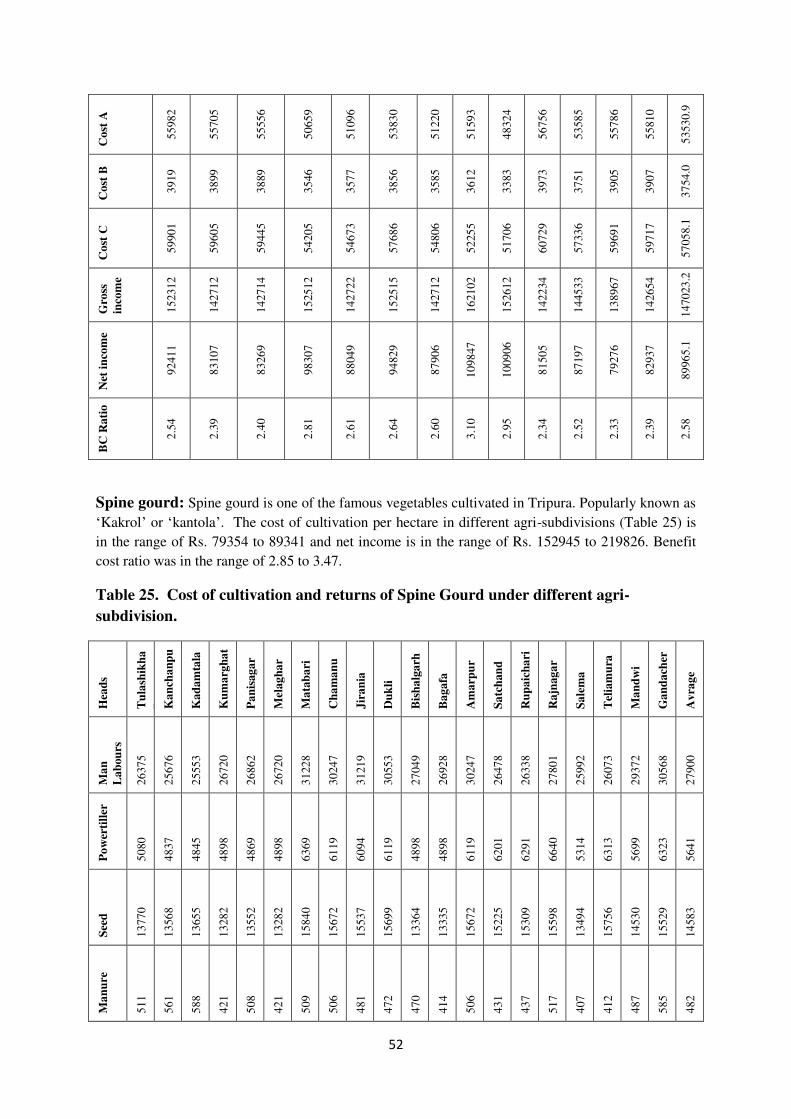
52
Co
st A
55
98
2
55
70
5
55
55
6
50
65
9
51
09
6
53
83
0
51
22
0
51
59
3
48
32
4
56
75
6
53
58
5
55
78
6
55
81
0
53
53
0.9
Co
st B
39
19
38
99
38
89
35
46
35
77
38
56
35
85
36
12
33
83
39
73
37
51
39
05
39
07
37
54
.0
Co
st C
59
90
1
59
60
5
59
44
5
54
20
5
54
67
3
57
68
6
54
80
6
52
25
5
51
70
6
60
72
9
57
33
6
59
69
1
59
71
7
57
05
8.1
Gro
ss
inco
me
15
23
12
14
27
12
14
27
14
15
25
12
14
27
22
15
25
15
14
27
12
16
21
02
15
26
12
14
22
34
14
45
33
13
89
67
14
26
54
14
70
23
.2
Net
in
com
e
92
41
1
83
10
7
83
26
9
98
30
7
88
04
9
94
82
9
87
90
6
10
98
47
10
09
06
81
50
5
87
19
7
79
27
6
82
93
7
89
96
5.1
BC
Ra
tio
2.5
4
2.3
9
2.4
0
2.8
1
2.6
1
2.6
4
2.6
0
3.1
0
2.9
5
2.3
4
2.5
2
2.3
3
2.3
9
2.5
8
Spine gourd: Spine gourd is one of the famous vegetables cultivated in Tripura. Popularly known as
‘Kakrol’ or ‘kantola’. The cost of cultivation per hectare in different agri-subdivisions (Table 25) is
in the range of Rs. 79354 to 89341 and net income is in the range of Rs. 152945 to 219826. Benefit
cost ratio was in the range of 2.85 to 3.47.
Table 25. Cost of cultivation and returns of Spine Gourd under different agri-
subdivision.
Hea
ds
Tu
lash
ikh
a
r Ka
nch
an
pu
r Ka
da
mta
la
Ku
ma
rgh
at
Pa
nis
ag
ar
Mel
ag
ha
r
Ma
tab
ari
Ch
am
an
u
Jir
an
ia
Du
kli
Bis
ha
lga
rh
Ba
ga
fa
Am
arp
ur
Sa
tch
an
d
Ru
pa
ich
ari
Ra
jnag
ar
Sa
lem
a
Tel
iam
ura
Ma
nd
wi
Ga
nd
ach
er
a
Av
rag
e
Ma
n
La
bou
rs
26
37
5
25
67
6
25
55
3
26
72
0
26
86
2
26
72
0
31
22
8
30
24
7
31
21
9
30
55
3
27
04
9
26
92
8
30
24
7
26
47
8
26
33
8
27
80
1
25
99
2
26
07
3
29
37
2
30
56
8
27
90
0
Po
wer
till
er
50
80
48
37
48
45
48
98
48
69
48
98
63
69
61
19
60
94
61
19
48
98
48
98
61
19
62
01
62
91
66
40
53
14
63
13
56
99
63
23
56
41
See
d
13
77
0
13
56
8
13
65
5
13
28
2
13
55
2
13
28
2
15
84
0
15
67
2
15
53
7
15
69
9
13
36
4
13
33
5
15
67
2
15
22
5
15
30
9
15
59
8
13
49
4
15
75
6
14
53
0
15
52
9
14
58
3
Ma
nu
re
51
1
56
1
58
8
42
1
50
8
42
1
50
9
50
6
48
1
47
2
47
0
41
4
50
6
43
1
43
7
51
7
40
7
41
2
48
7
58
5
48
2

53
Die
sel
13
17
13
78
13
80
13
19
12
72
13
19
16
12
15
87
15
28
15
87
13
19
12
81
15
87
14
97
15
19
15
11
12
86
15
94
14
02
14
16
14
36
Ure
a
72
1
97
2
10
76
55
8
55
4
55
8
75
1
74
4
76
0
74
5
57
4
55
8
74
4
65
0
51
4
20
30
66
2
47
1
62
9
70
9
74
9
SS
P
14
62
15
64
16
75
11
89
13
15
11
89
18
91
19
53
20
83
18
91
12
26
11
89
19
53
13
75
12
61
22
53
16
87
11
62
15
94
21
99
16
06
MO
P
19
67
16
95
16
96
18
44
20
18
18
44
24
12
23
97
24
88
23
54
18
96
18
44
23
97
16
61
16
36
13
22
17
06
16
40
20
41
26
33
19
75
DA
P
0
0
48
1
0
0
0
0
0
0
0
0
0
0
0
0
0
0
0
0
0
24
Fu
ng
icid
e
28
6
38
0
38
2
33
3
31
1
33
3
40
8
40
0
58
4
40
0
33
3
31
2
40
0
22
5
22
5
57
8
23
0
25
4
60
3
81
0
38
9
Inse
ctic
ide
93
6
98
7
98
9
97
9
97
3
97
9
11
75
10
83
11
96
10
83
97
9
97
9
10
83
91
9
93
3
10
40
85
8
95
1
11
71
12
53
10
27
Ba
mb
oo
22
91
3
22
13
5
22
16
9
22
62
2
22
40
5
22
62
2
21
30
1
21
21
2
19
17
4
21
21
2
22
62
2
22
55
1
21
21
2
25
48
5
25
69
9
23
06
8
23
69
7
25
77
9
21
63
4
18
76
7
22
41
4
Co
st A
75
33
6
73
75
4
74
49
1
74
16
3
74
63
8
74
16
3
83
49
6
81
92
1
81
14
5
82
11
5
74
73
0
74
28
9
81
92
1
80
14
6
80
16
3
82
35
7
75
33
4
80
40
5
79
16
3
80
79
2
78
22
6
Co
st B
52
74
51
63
52
14
51
91
52
25
51
91
58
45
57
34
56
80
57
48
52
31
52
00
57
34
56
10
56
11
57
65
52
73
56
28
55
41
56
55
54
76
Co
st C
80
61
0
78
91
7
79
70
5
79
35
4
79
86
3
79
35
4
89
34
1
87
65
5
86
82
5
87
86
3
79
96
1
79
48
9
87
65
5
85
75
6
85
77
4
88
12
2
80
60
7
86
03
3
84
70
4
86
44
8
83
70
2
Gro
ss
inco
me
26
25
66
24
91
81
22
74
36
26
56
79
27
21
55
26
56
79
30
30
97
29
85
30
30
09
71
29
26
75
26
80
67
27
13
60
29
85
30
27
05
81
27
06
07
25
80
64
25
47
95
24
19
63
25
53
44
29
50
93
27
11
19
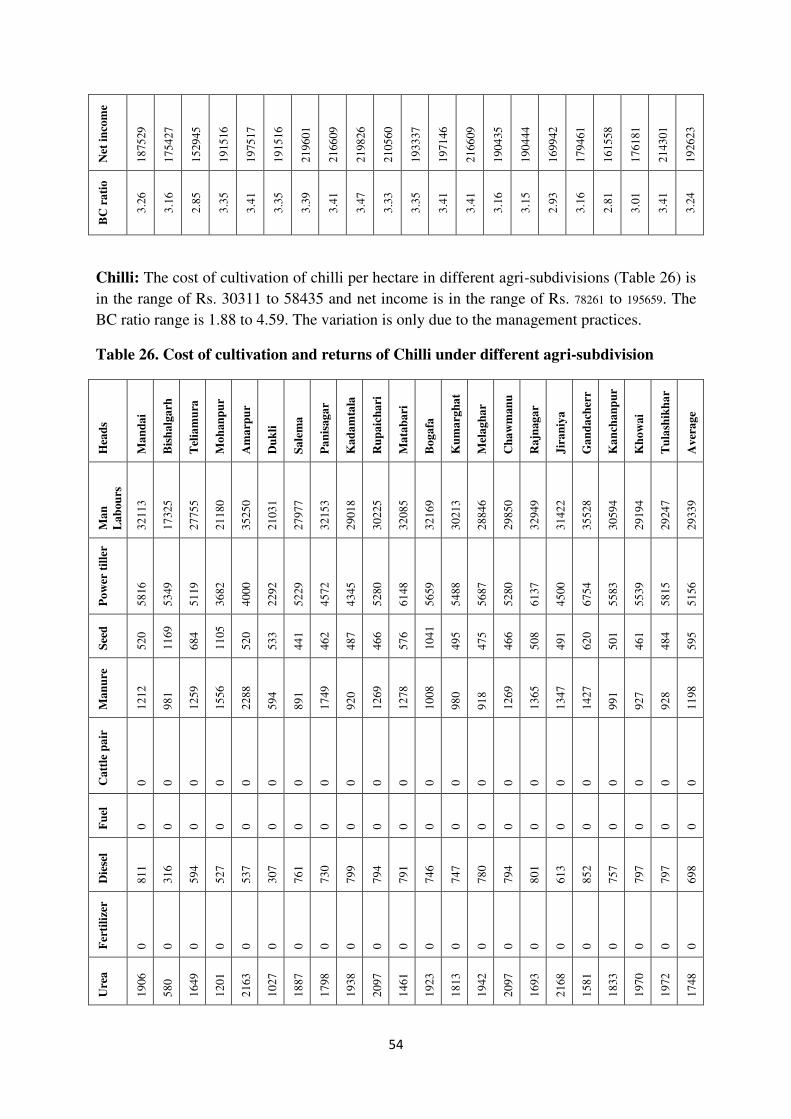
54
Net
in
com
e
18
75
29
17
54
27
15
29
45
19
15
16
19
75
17
19
15
16
21
96
01
21
66
09
21
98
26
21
05
60
19
33
37
19
71
46
21
66
09
19
04
35
19
04
44
16
99
42
17
94
61
16
15
58
17
61
81
21
43
01
19
26
23
BC
ra
tio
3.2
6
3.1
6
2.8
5
3.3
5
3.4
1
3.3
5
3.3
9
3.4
1
3.4
7
3.3
3
3.3
5
3.4
1
3.4
1
3.1
6
3.1
5
2.9
3
3.1
6
2.8
1
3.0
1
3.4
1
3.2
4
Chilli: The cost of cultivation of chilli per hectare in different agri-subdivisions (Table 26) is
in the range of Rs. 30311 to 58435 and net income is in the range of Rs. 78261 to 195659. The
BC ratio range is 1.88 to 4.59. The variation is only due to the management practices.
Table 26. Cost of cultivation and returns of Chilli under different agri-subdivision
Hea
ds
Ma
nd
ai
Bis
ha
lga
rh
Tel
iam
ura
Mo
han
pu
r
Am
arp
ur
Du
kli
Sa
lem
a
Pa
nis
ag
ar
Ka
da
mta
la
Ru
pa
ich
ari
Ma
tab
ari
Bo
ga
fa
Ku
ma
rgh
at
Mel
ag
ha
r
Ch
aw
man
u
Ra
jnag
ar
Jir
an
iya
Ga
nd
ach
err
a
Ka
nch
an
pu
r
Kh
ow
ai
Tu
lash
ikh
ar
Av
era
ge
Ma
n
La
bou
rs
32
11
3
17
32
5
27
75
5
21
18
0
35
25
0
21
03
1
27
97
7
32
15
3
29
01
8
30
22
5
32
08
5
32
16
9
30
21
3
28
84
6
29
85
0
32
94
9
31
42
2
35
52
8
30
59
4
29
19
4
29
24
7
29
33
9
Po
wer
til
ler
58
16
53
49
51
19
36
82
40
00
22
92
52
29
45
72
43
45
52
80
61
48
56
59
54
88
56
87
52
80
61
37
45
00
67
54
55
83
55
39
58
15
51
56
See
d
52
0
11
69
68
4
11
05
52
0
53
3
44
1
46
2
48
7
46
6
57
6
10
41
49
5
47
5
46
6
50
8
49
1
62
0
50
1
46
1
48
4
59
5
Ma
nu
re
12
12
98
1
12
59
15
56
22
88
59
4
89
1
17
49
92
0
12
69
12
78
10
08
98
0
91
8
12
69
13
65
13
47
14
27
99
1
92
7
92
8
11
98
Ca
ttle
pa
ir
0
0
0
0
0
0
0
0
0
0
0
0
0
0
0
0
0
0
0
0
0
0
Fu
el
0
0
0
0
0
0
0
0
0
0
0
0
0
0
0
0
0
0
0
0
0
0
Die
sel
81
1
31
6
59
4
52
7
53
7
30
7
76
1
73
0
79
9
79
4
79
1
74
6
74
7
78
0
79
4
80
1
61
3
85
2
75
7
79
7
79
7
69
8
Fer
tili
zer
0
0
0
0
0
0
0
0
0
0
0
0
0
0
0
0
0
0
0
0
0
0
Ure
a
19
06
58
0
16
49
12
01
21
63
10
27
18
87
17
98
19
38
20
97
14
61
19
23
18
13
19
42
20
97
16
93
21
68
15
81
18
33
19
70
19
72
17
48
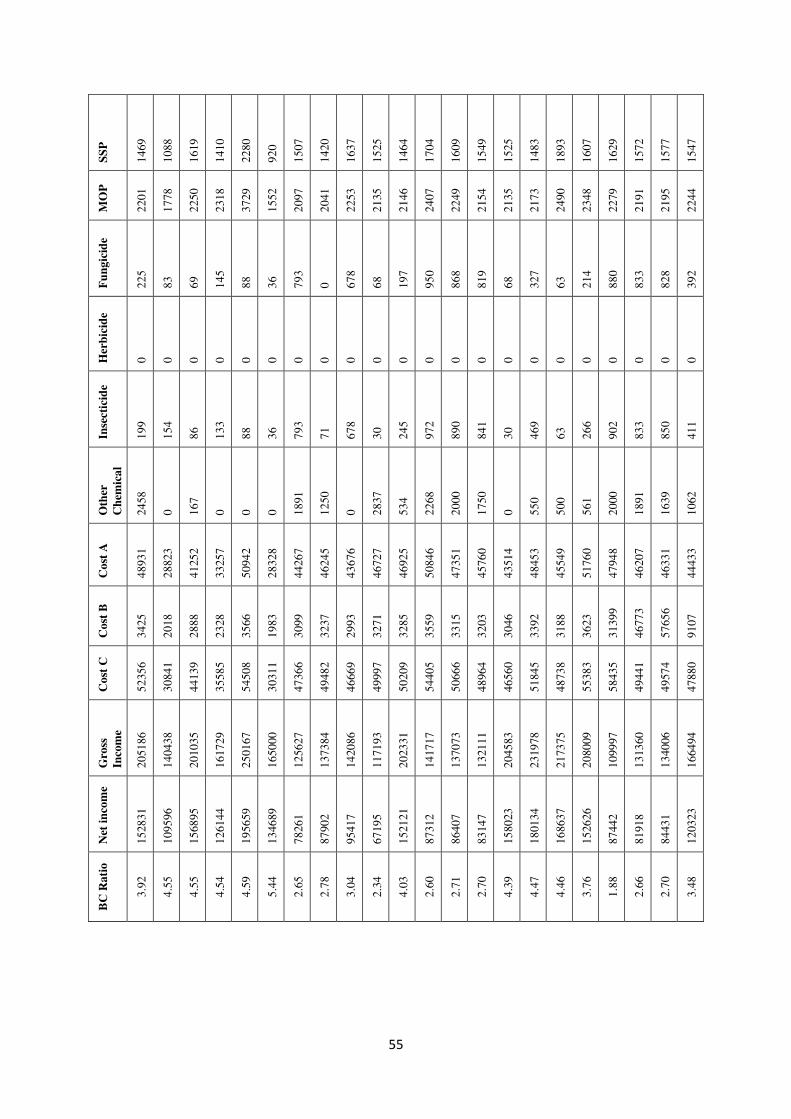
55
SS
P
14
69
10
88
16
19
14
10
22
80
92
0
15
07
14
20
16
37
15
25
14
64
17
04
16
09
15
49
15
25
14
83
18
93
16
07
16
29
15
72
15
77
15
47
MO
P
22
01
17
78
22
50
23
18
37
29
15
52
20
97
20
41
22
53
21
35
21
46
24
07
22
49
21
54
21
35
21
73
24
90
23
48
22
79
21
91
21
95
22
44
Fu
ng
icid
e
22
5
83
69
14
5
88
36
79
3
0
67
8
68
19
7
95
0
86
8
81
9
68
32
7
63
21
4
88
0
83
3
82
8
39
2
Her
bic
ide
0
0
0
0
0
0
0
0
0
0
0
0
0
0
0
0
0
0
0
0
0
0
Inse
ctic
ide
19
9
15
4
86
13
3
88
36
79
3
71
67
8
30
24
5
97
2
89
0
84
1
30
46
9
63
26
6
90
2
83
3
85
0
41
1
Oth
er
Ch
emic
al
24
58
0
16
7
0
0
0
18
91
12
50
0
28
37
53
4
22
68
20
00
17
50
0
55
0
50
0
56
1
20
00
18
91
16
39
10
62
Co
st A
48
93
1
28
82
3
41
25
2
33
25
7
50
94
2
28
32
8
44
26
7
46
24
5
43
67
6
46
72
7
46
92
5
50
84
6
47
35
1
45
76
0
43
51
4
48
45
3
45
54
9
51
76
0
47
94
8
46
20
7
46
33
1
44
43
3
Co
st B
34
25
20
18
28
88
23
28
35
66
19
83
30
99
32
37
29
93
32
71
32
85
35
59
33
15
32
03
30
46
33
92
31
88
36
23
31
39
9
46
77
3
57
65
6
91
07
Co
st C
52
35
6
30
84
1
44
13
9
35
58
5
54
50
8
30
31
1
47
36
6
49
48
2
46
66
9
49
99
7
50
20
9
54
40
5
50
66
6
48
96
4
46
56
0
51
84
5
48
73
8
55
38
3
58
43
5
49
44
1
49
57
4
47
88
0
Gro
ss
Inco
me
20
51
86
14
04
38
20
10
35
16
17
29
25
01
67
16
50
00
12
56
27
13
73
84
14
20
86
11
71
93
20
23
31
14
17
17
13
70
73
13
21
11
20
45
83
23
19
78
21
73
75
20
80
09
10
99
97
13
13
60
13
40
06
16
64
94
Net
in
com
e
15
28
31
10
95
96
15
68
95
12
61
44
19
56
59
13
46
89
78
26
1
87
90
2
95
41
7
67
19
5
15
21
21
87
31
2
86
40
7
83
14
7
15
80
23
18
01
34
16
86
37
15
26
26
87
44
2
81
91
8
84
43
1
12
03
23
BC
Ra
tio
3.9
2
4.5
5
4.5
5
4.5
4
4.5
9
5.4
4
2.6
5
2.7
8
3.0
4
2.3
4
4.0
3
2.6
0
2.7
1
2.7
0
4.3
9
4.4
7
4.4
6
3.7
6
1.8
8
2.6
6
2.7
0
3.4
8

56
Potato: Potato is main tuber crop grown in the state during October to January-February. The cost of
cultivation per hectare (Table 27) in different agri-subdivisions ranges from Rs. 66482.2 to 74826.0
and net income ranges from Rs. 85953 to 153879. The BC ratio ranges from 2.03 to 3.07.
Table 27. Cost of cultivation and returns of Potato under different agri-subdivision.
Hea
ds
Bis
ha
lga
rh
Kh
ow
ai
Sa
lem
a
Du
kli
Tel
iam
ura
Ch
aw
man
u
Sa
tch
an
Jir
an
iya
Ka
nch
an
pu
r
Ka
da
mta
la
Ma
nd
ai
Ma
tab
ari
Mel
ag
ha
r
Mo
han
pu
r
Pa
nis
ag
ar
Ru
pa
ich
ari
Ga
nd
ach
erra
Bo
ga
fa
Am
arp
ur
Av
era
ge
Ma
n L
ab
ou
rs
36
90
2
42
38
5
39
29
6
40
50
0
49
23
9
41
25
0
41
44
0
40
67
1
40
78
4
40
80
7
39
93
8
39
82
4
36
81
3
39
75
0
41
14
8
41
52
1
41
60
9.1
41
06
5.9
36
49
7.4
40
60
2
PT
55
61
52
86
55
05
68
52
53
14
59
38
55
23
55
30
55
44
57
06
57
68
54
26
61
72
60
16
54
83
60
11
55
54
.3
54
75
.4
58
45
.9
57
11
See
d
tub
er
11
80
6
11
78
2
12
44
9
10
40
8
11
56
5
11
55
0
12
76
5
12
73
5
12
57
8
11
16
3
12
27
0
12
80
6
11
72
6
11
00
0
12
63
0
11
13
1
12
23
3.1
4
12
34
4.9
11
05
6.5
11
89
5
Ma
nu
re
41
7
22
7
39
3
70
08
87
8
86
3
38
0
37
8
38
0
67
20
89
5
38
9
67
0
90
0
38
2
67
39
34
1.7
37
1.9
70
9.4
15
28
Die
sel
34
3
57
1
34
3
83
3
53
0
54
6
32
8
32
3
32
6
77
0
65
8
32
8
60
0
54
6
32
4
77
6
32
9.7
32
5.5
48
1.9
48
9
Ure
a
14
14
14
37
15
30
35
4
12
14
10
35
15
52
15
22
15
39
40
7
71
4
15
35
92
5
10
35
15
40
39
3
15
33
.5
15
41
.7
74
4.8
11
56
SS
P
27
38
23
10
24
74
88
9
42
91
45
00
24
15
24
09
24
12
10
41
24
47
24
39
25
38
45
00
24
13
98
3
23
78
.2
23
54
.3
30
87
.3
25
59
MO
P
26
26
23
43
27
77
12
41
35
03
28
75
28
38
27
96
28
37
14
65
25
06
27
96
31
41
28
75
28
29
13
61
28
62
.3
28
09
.1
27
95
.6
25
93
Fu
ng
icid
e
70
4
22
4
61
8
0
0
0
61
4
61
4
60
9
0
0
61
4
0
27
5
76
4
0
62
0.4
60
5.1
0
33
0
Inse
ctic
ide
67
3
14
35
65
5
48
3
15
82
13
75
63
6
62
6
61
9
50
4
52
9
59
2
69
3
13
75
63
3
48
3
64
2.5
63
2.6
91
4.2
79
4
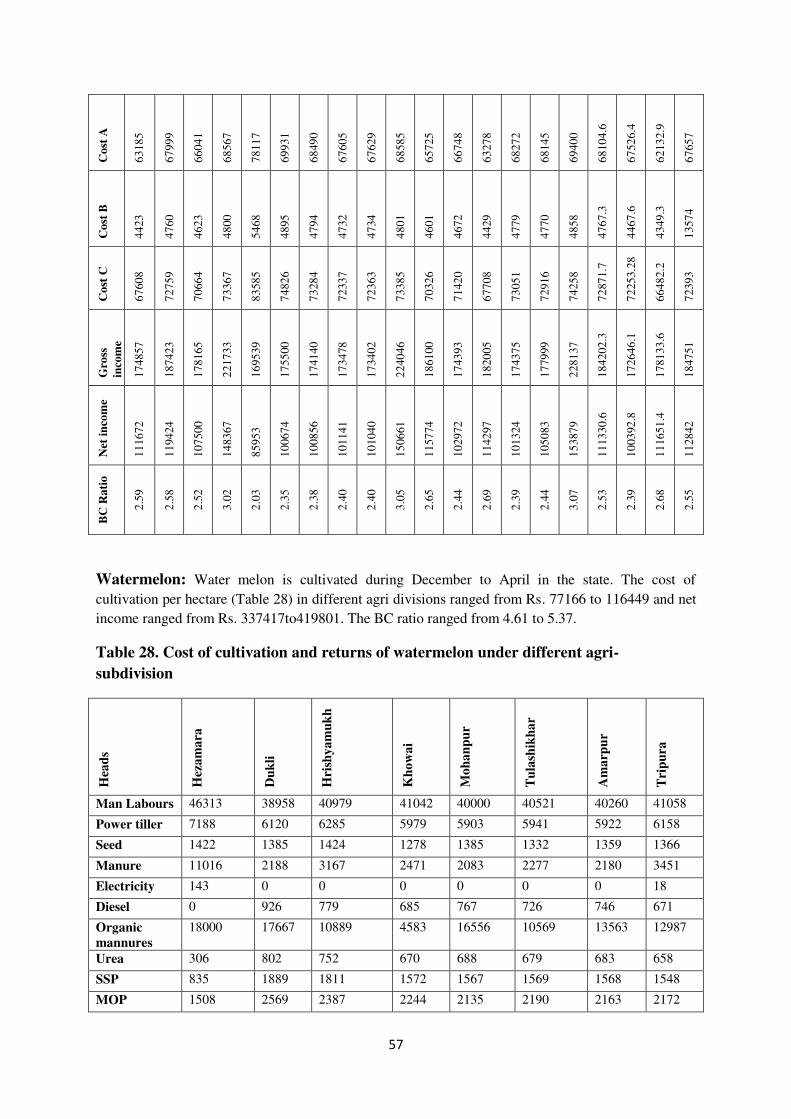
57
Co
st A
63
18
5
67
99
9
66
04
1
68
56
7
78
11
7
69
93
1
68
49
0
67
60
5
67
62
9
68
58
5
65
72
5
66
74
8
63
27
8
68
27
2
68
14
5
69
40
0
68
10
4.6
67
52
6.4
62
13
2.9
67
65
7
Co
st B
44
23
47
60
46
23
48
00
54
68
48
95
47
94
47
32
47
34
48
01
46
01
46
72
44
29
47
79
47
70
48
58
47
67
.3
44
67
.6
43
49
.3
13
57
4
Co
st C
67
60
8
72
75
9
70
66
4
73
36
7
83
58
5
74
82
6
73
28
4
72
33
7
72
36
3
73
38
5
70
32
6
71
42
0
67
70
8
73
05
1
72
91
6
74
25
8
72
87
1.7
72
25
3.2
8
66
48
2.2
72
39
3
Gro
ss
inco
me
17
48
57
18
74
23
17
81
65
22
17
33
16
95
39
17
55
00
17
41
40
17
34
78
17
34
02
22
40
46
18
61
00
17
43
93
18
20
05
17
43
75
17
79
99
22
81
37
18
42
02
.3
17
26
46
.1
17
81
33
.6
18
47
51
Net
in
com
e
11
16
72
11
94
24
10
75
00
14
83
67
85
95
3
10
06
74
10
08
56
10
11
41
10
10
40
15
06
61
11
57
74
10
29
72
11
42
97
10
13
24
10
50
83
15
38
79
11
13
30
.6
10
03
92
.8
11
16
51
.4
11
28
42
BC
Ra
tio
2.5
9
2.5
8
2.5
2
3.0
2
2.0
3
2.3
5
2.3
8
2.4
0
2.4
0
3.0
5
2.6
5
2.4
4
2.6
9
2.3
9
2.4
4
3.0
7
2.5
3
2.3
9
2.6
8
2.5
5
Watermelon: Water melon is cultivated during December to April in the state. The cost of
cultivation per hectare (Table 28) in different agri divisions ranged from Rs. 77166 to 116449 and net
income ranged from Rs. 337417to419801. The BC ratio ranged from 4.61 to 5.37.
Table 28. Cost of cultivation and returns of watermelon under different agri-
subdivision
Hea
ds
Hez
am
ara
Du
kli
Hri
shy
am
uk
h
Kh
ow
ai
Mo
ha
np
ur
Tu
lash
ikh
ar
Am
arp
ur
Tri
pu
ra
Man Labours 46313 38958 40979 41042 40000 40521 40260 41058
Power tiller 7188 6120 6285 5979 5903 5941 5922 6158
Seed 1422 1385 1424 1278 1385 1332 1359 1366
Manure 11016 2188 3167 2471 2083 2277 2180 3451
Electricity 143 0 0 0 0 0 0 18
Diesel 0 926 779 685 767 726 746 671
Organic
mannures
18000 17667 10889 4583 16556 10569 13563 12987
Urea 306 802 752 670 688 679 683 658
SSP 835 1889 1811 1572 1567 1569 1568 1548
MOP 1508 2569 2387 2244 2135 2190 2163 2172

58
Insecticide 1332 798 955 655 416 536 476 709
Bamboo 1301 12833 10167 10938 7500 9219 8359 8638
Net 19469 0 0 0 0 0 0 2434
Cost A 108831 86136 79595 72118 79000 75559 77279 81867
Cost B 7618 6030 5572 5048 5530 5289 5410 5731
Cost C 116449 92166 85167 77166 84530 80848 82689 87598
Gross income 536250 462500 449375 414583 433333 423958 428646 446869
Net Income 419801 370334 364208 337417 348804 343110 345957 359271
BC Ratio 4.61 5.02 5.28 5.37 5.13 5.24 5.18 5.10
Cauliflower: Cauliflower season is Ocotober to February in the state. The cost of cultivation per
hectare (Table 29) in different agri-subdivisions varied from Rs. 108829 to 152395 and net income
varied from Rs. 106941 to 282225. The BC ratio ranges from 1.93 to 3.86.
Table 29. Cost of cultivation and returns of Cauliflower under different agri-
subdivision.
Hea
ds
Ba
ga
fa
du
kli
kh
ow
ai
Sa
tch
an
d
Tel
iam
ura
ku
ma
rgh
at
Am
arp
ur
Bis
hw
alg
arh
Ru
pa
ich
ari
ka
nch
an
pu
r
Ma
tab
ari
Mel
ag
ha
r
Av
earg
e
Ma
n
La
bou
rs
54
17
3
56
80
1
51
94
0
51
94
0
62
96
0
56
80
1
76
43
2
54
13
3
56
25
0
60
52
1
75
00
0
75
00
0
60
99
5.9
po
wer
til
ler
50
51
30
00
52
13
52
13
30
00
30
00
90
00
50
60
30
00
30
00
30
00
96
88
47
68
.8
Ca
ttle
Pa
ir
Da
y
12
32
36
61
43
06
43
06
31
48
36
61
0
0
37
50
46
55
37
50
0
27
05
.8
See
d
14
12
8
12
69
1
14
85
1
14
85
1
11
34
6
12
69
1
10
89
14
11
0
13
00
0
16
13
9
13
00
0
13
00
0
12
57
4.
7
Ma
nu
re
61
87
82
4
25
00
25
00
51
5
82
4
27
7
61
88
11
88
88
0
11
88
15
00
0
31
72
.6
Ker
ose
ne
10
0
0
0
0
0
0
0
10
0
0
0
0
10
00
10
0.0
Die
sel
41
41
32
60
21
04
21
04
0
32
60
0
41
63
50
00
31
04
0
0
22
61
.3
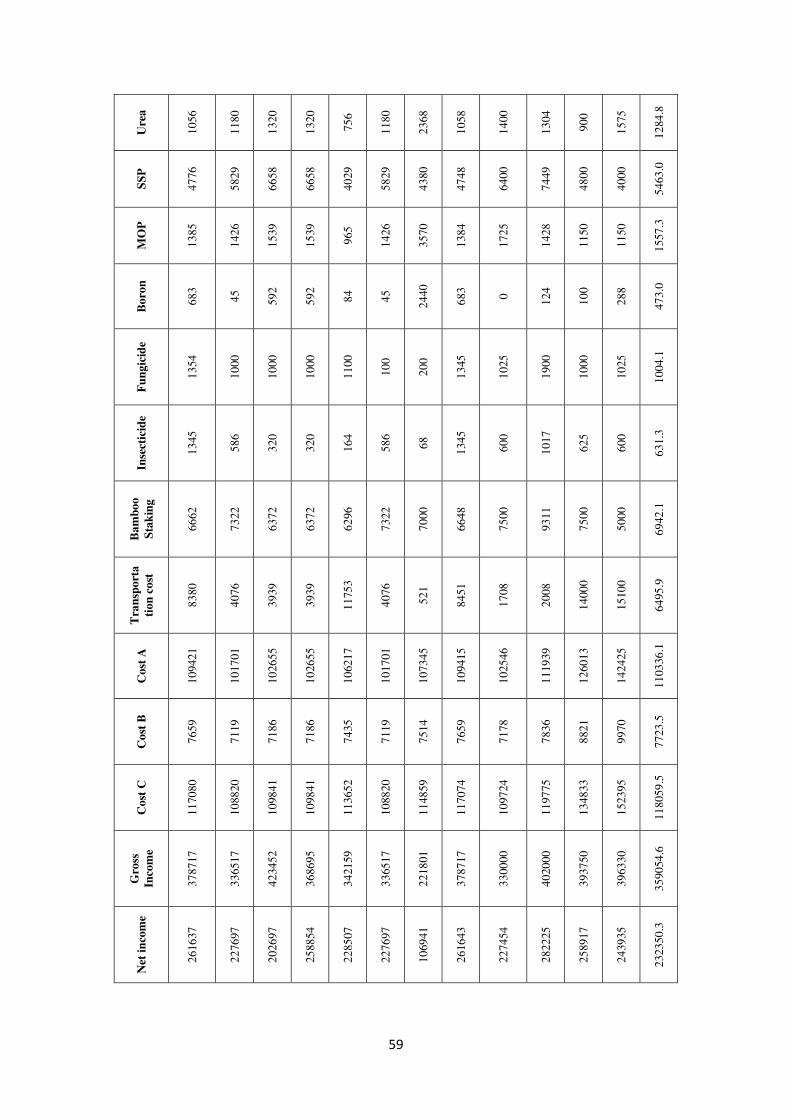
59
Ure
a
10
56
11
80
13
20
13
20
75
6
11
80
23
68
10
58
14
00
13
04
90
0
15
75
12
84
.8
SS
P
47
76
58
29
66
58
66
58
40
29
58
29
43
80
47
48
64
00
74
49
48
00
40
00
54
63
.0
MO
P
13
85
14
26
15
39
15
39
96
5
14
26
35
70
13
84
17
25
14
28
11
50
11
50
15
57
.3
Bo
ron
68
3
45
59
2
59
2
84
45
24
40
68
3
0
12
4
10
0
28
8
47
3.0
Fu
ng
icid
e
13
54
10
00
10
00
10
00
11
00
10
0
20
0
13
45
10
25
19
00
10
00
10
25
10
04
.1
Inse
ctic
ide
13
45
58
6
32
0
32
0
16
4
58
6
68
13
45
60
0
10
17
62
5
60
0
63
1.3
Ba
mb
oo
Sta
kin
g
66
62
73
22
63
72
63
72
62
96
73
22
70
00
66
48
75
00
93
11
75
00
50
00
69
42
.1
Tra
nsp
ort
a
tio
n c
ost
83
80
40
76
39
39
39
39
11
75
3
40
76
52
1
84
51
17
08
20
08
14
00
0
15
10
0
64
95
.9
Co
st A
10
94
21
10
17
01
10
26
55
10
26
55
10
62
17
10
17
01
10
73
45
10
94
15
10
25
46
11
19
39
12
60
13
14
24
25
11
03
36
.1
Co
st B
76
59
71
19
71
86
71
86
74
35
71
19
75
14
76
59
71
78
78
36
88
21
99
70
77
23
.5
Co
st C
11
70
80
10
88
20
10
98
41
10
98
41
11
36
52
10
88
20
11
48
59
11
70
74
10
97
24
11
97
75
13
48
33
15
23
95
11
80
59
.5
Gro
ss
Inco
me
37
87
17
33
65
17
42
34
52
36
86
95
34
21
59
33
65
17
22
18
01
37
87
17
33
00
00
40
20
00
39
37
50
39
63
30
35
90
54
.6
Net
in
com
e
26
16
37
22
76
97
20
26
97
25
88
54
22
85
07
22
76
97
10
69
41
26
16
43
22
74
54
28
22
25
25
89
17
24
39
35
23
23
50
.3
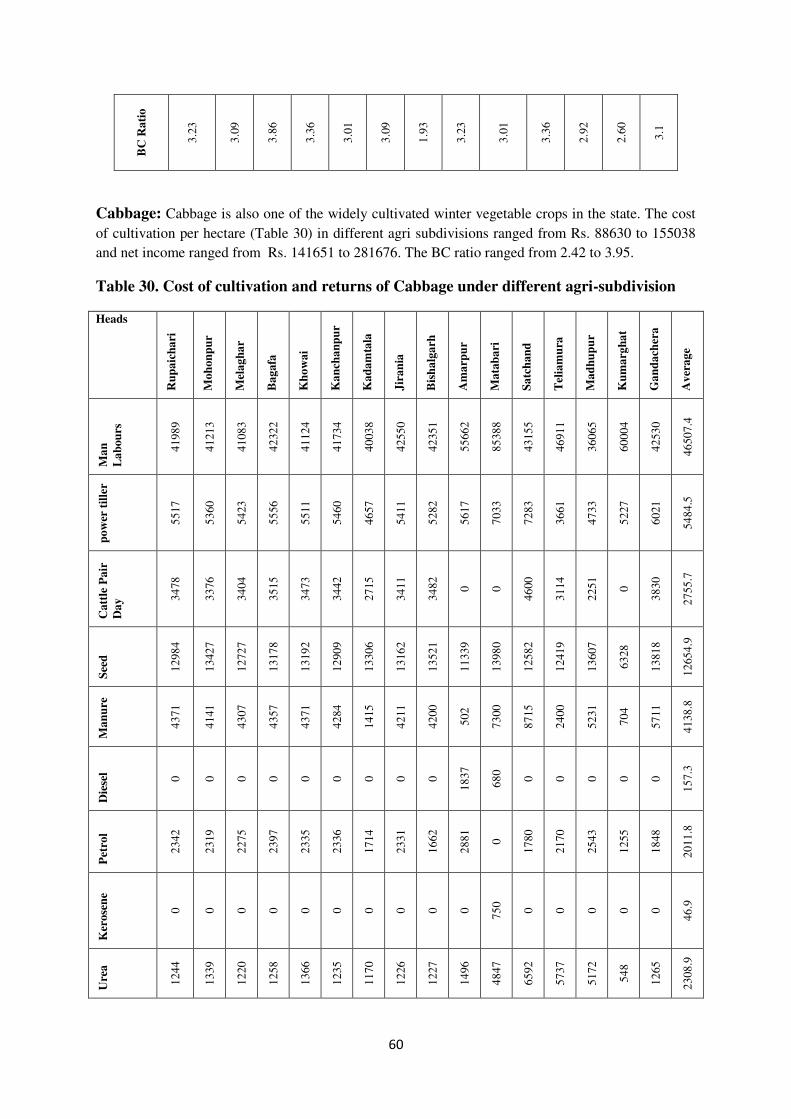
60
BC
Ra
tio
3.2
3
3.0
9
3.8
6
3.3
6
3.0
1
3.0
9
1.9
3
3.2
3
3.0
1
3.3
6
2.9
2
2.6
0
3.1
Cabbage: Cabbage is also one of the widely cultivated winter vegetable crops in the state. The cost
of cultivation per hectare (Table 30) in different agri subdivisions ranged from Rs. 88630 to 155038
and net income ranged from Rs. 141651 to 281676. The BC ratio ranged from 2.42 to 3.95.
Table 30. Cost of cultivation and returns of Cabbage under different agri-subdivision
Heads
Ru
pa
ich
ari
Mo
hon
pu
r
Mel
ag
ha
r
Ba
ga
fa
Kh
ow
ai
Ka
nch
an
pu
r
Ka
da
mta
la
Jir
an
ia
Bis
ha
lga
rh
Am
arp
ur
Ma
tab
ari
Sa
tch
an
d
Tel
iam
ura
Ma
dh
up
ur
Ku
ma
rgh
at
Ga
nd
ach
era
Av
era
ge
Ma
n
La
bou
rs
41
98
9
41
21
3
41
08
3
42
32
2
41
12
4
41
73
4
40
03
8
42
55
0
42
35
1
55
66
2
85
38
8
43
15
5
46
91
1
36
06
5
60
00
4
42
53
0
46
50
7.4
po
wer
til
ler
55
17
53
60
54
23
55
56
55
11
54
60
46
57
54
11
52
82
56
17
70
33
72
83
36
61
47
33
52
27
60
21
54
84
.5
Ca
ttle
Pa
ir
Da
y 34
78
33
76
34
04
35
15
34
73
34
42
27
15
34
11
34
82
0
0
46
00
31
14
22
51
0
38
30
27
55
.7
See
d
12
98
4
13
42
7
12
72
7
13
17
8
13
19
2
12
90
9
13
30
6
13
16
2
13
52
1
11
33
9
13
98
0
12
58
2
12
41
9
13
60
7
63
28
13
81
8
12
65
4.9
Ma
nu
re
43
71
41
41
43
07
43
57
43
71
42
84
14
15
42
11
42
00
50
2
73
00
87
15
24
00
52
31
70
4
57
11
41
38
.8
Die
sel
0
0
0
0
0
0
0
0
0
18
37
68
0
0
0
0
0
0
15
7.3
Pet
rol
23
42
23
19
22
75
23
97
23
35
23
36
17
14
23
31
16
62
28
81
0
17
80
21
70
25
43
12
55
18
48
20
11
.8
Ker
ose
ne
0
0
0
0
0
0
0
0
0
0
75
0
0
0
0
0
0
46
.9
Ure
a
12
44
13
39
12
20
12
58
13
66
12
35
11
70
12
26
12
27
14
96
48
47
65
92
57
37
51
72
54
8
12
65
23
08
.9
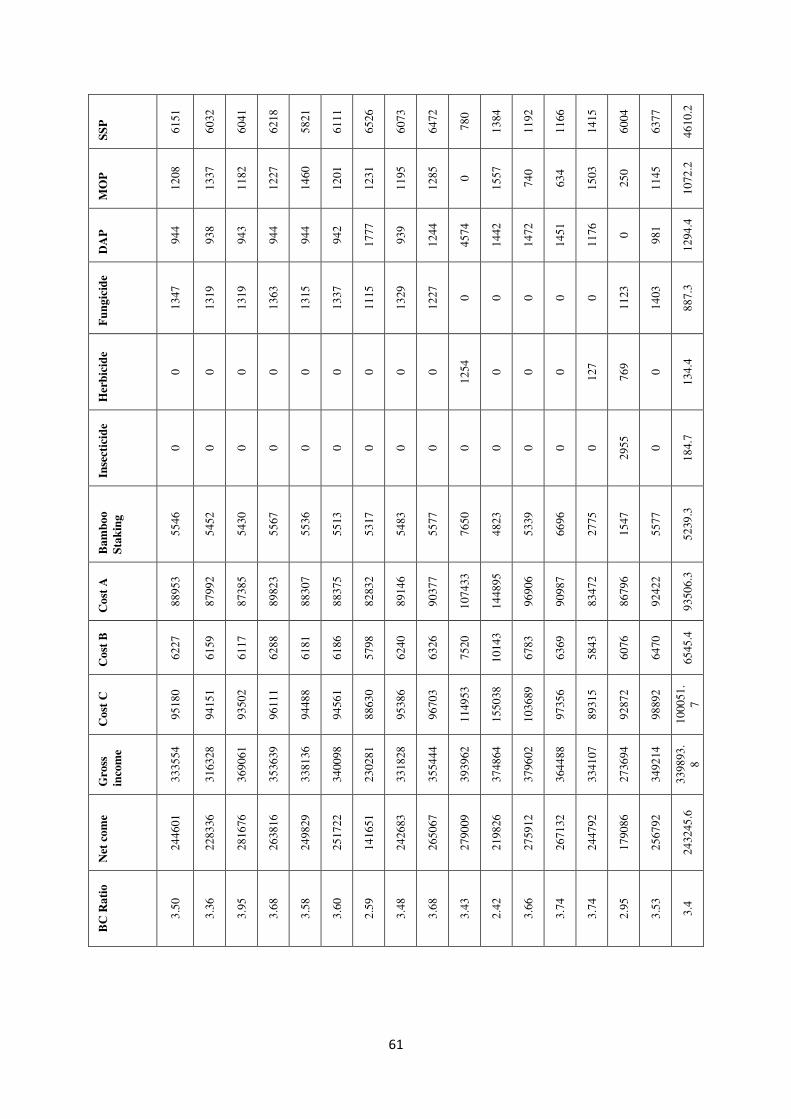
61
SS
P
61
51
60
32
60
41
62
18
58
21
61
11
65
26
60
73
64
72
78
0
13
84
11
92
11
66
14
15
60
04
63
77
46
10
.2
MO
P
12
08
13
37
11
82
12
27
14
60
12
01
12
31
11
95
12
85
0
15
57
74
0
63
4
15
03
25
0
11
45
10
72
.2
DA
P
94
4
93
8
94
3
94
4
94
4
94
2
17
77
93
9
12
44
45
74
14
42
14
72
14
51
11
76
0
98
1
12
94
.4
Fu
ng
icid
e
13
47
13
19
13
19
13
63
13
15
13
37
11
15
13
29
12
27
0
0
0
0
0
11
23
14
03
88
7.3
Her
bic
ide
0
0
0
0
0
0
0
0
0
12
54
0
0
0
12
7
76
9
0
13
4.4
Inse
ctic
ide
0
0
0
0
0
0
0
0
0
0
0
0
0
0
29
55
0
18
4.7
Ba
mb
oo
Sta
kin
g
55
46
54
52
54
30
55
67
55
36
55
13
53
17
54
83
55
77
76
50
48
23
53
39
66
96
27
75
15
47
55
77
52
39
.3
Co
st A
88
95
3
87
99
2
87
38
5
89
82
3
88
30
7
88
37
5
82
83
2
89
14
6
90
37
7
10
74
33
14
48
95
96
90
6
90
98
7
83
47
2
86
79
6
92
42
2
93
50
6.3
Co
st B
62
27
61
59
61
17
62
88
61
81
61
86
57
98
62
40
63
26
75
20
10
14
3
67
83
63
69
58
43
60
76
64
70
65
45
.4
Co
st C
95
18
0
94
15
1
93
50
2
96
11
1
94
48
8
94
56
1
88
63
0
95
38
6
96
70
3
11
49
53
15
50
38
10
36
89
97
35
6
89
31
5
92
87
2
98
89
2
10
00
51
.
7
Gro
ss
inco
me
33
35
54
31
63
28
36
90
61
35
36
39
33
81
36
34
00
98
23
02
81
33
18
28
35
54
44
39
39
62
37
48
64
37
96
02
36
44
88
33
41
07
27
36
94
34
92
14
33
98
93
.
8
Net
co
me
24
46
01
22
83
36
28
16
76
26
38
16
24
98
29
25
17
22
14
16
51
24
26
83
26
50
67
27
90
09
21
98
26
27
59
12
26
71
32
24
47
92
17
90
86
25
67
92
24
32
45
.6
BC
Ra
tio
3.5
0
3.3
6
3.9
5
3.6
8
3.5
8
3.6
0
2.5
9
3.4
8
3.6
8
3.4
3
2.4
2
3.6
6
3.7
4
3.7
4
2.9
5
3.5
3
3.4
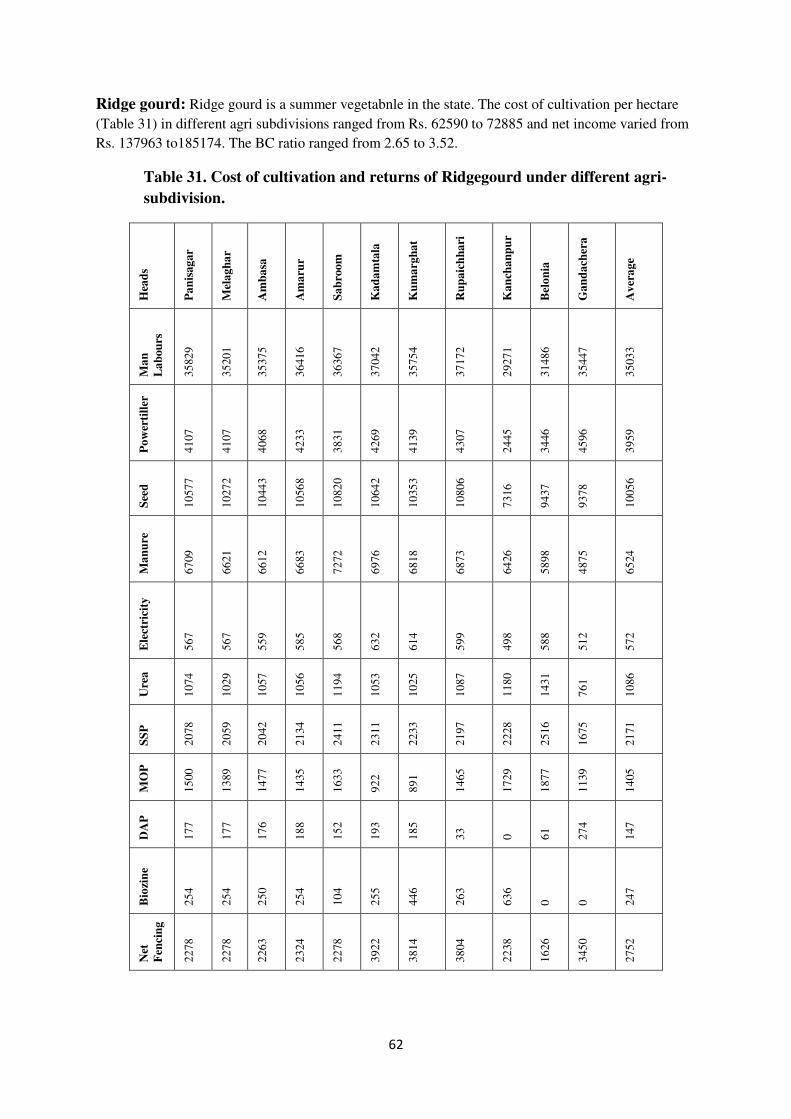
62
Ridge gourd: Ridge gourd is a summer vegetabnle in the state. The cost of cultivation per hectare
(Table 31) in different agri subdivisions ranged from Rs. 62590 to 72885 and net income varied from
Rs. 137963 to185174. The BC ratio ranged from 2.65 to 3.52.
Table 31. Cost of cultivation and returns of Ridgegourd under different agri-
subdivision.
Hea
ds
Pa
nis
ag
ar
Mel
ag
ha
r
Am
ba
sa
Am
aru
r
Sa
bro
om
Ka
da
mta
la
Ku
ma
rgh
at
Ru
pa
ich
ha
ri
Ka
nch
an
pu
r
Bel
on
ia
Ga
nd
ach
era
Av
era
ge
Ma
n
La
bou
rs
35
82
9
35
20
1
35
37
5
36
41
6
36
36
7
37
04
2
35
75
4
37
17
2
29
27
1
31
48
6
35
44
7
35
03
3
Po
wer
till
er
41
07
41
07
40
68
42
33
38
31
42
69
41
39
43
07
24
45
34
46
45
96
39
59
See
d
10
57
7
10
27
2
10
44
3
10
56
8
10
82
0
10
64
2
10
35
3
10
80
6
73
16
94
37
93
78
10
05
6
Ma
nu
re
67
09
66
21
66
12
66
83
72
72
69
76
68
18
68
73
64
26
58
98
48
75
65
24
Ele
ctri
city
56
7
56
7
55
9
58
5
56
8
63
2
61
4
59
9
49
8
58
8
51
2
57
2
Ure
a
10
74
10
29
10
57
10
56
11
94
10
53
10
25
10
87
11
80
14
31
76
1
10
86
SS
P
20
78
20
59
20
42
21
34
24
11
23
11
22
33
21
97
22
28
25
16
16
75
21
71
MO
P
15
00
13
89
14
77
14
35
16
33
92
2
89
1
14
65
17
29
18
77
11
39
14
05
DA
P
17
7
17
7
17
6
18
8
15
2
19
3
18
5
33
0
61
27
4
14
7
Bio
zin
e
25
4
25
4
25
0
25
4
10
4
25
5
44
6
26
3
63
6
0
0
24
7
Net
Fen
cin
g
22
78
22
78
22
63
23
24
22
78
39
22
38
14
38
04
22
38
16
26
34
50
27
52

63
Sta
kin
g
13
94
13
36
13
66
32
40
12
89
13
22
13
34
12
87
11
39
19
87
0
14
27
An
y O
ther
Ch
emic
al
39
70
8
39
27
7
39
44
2
57
65
36
06
37
84
39
09
38
77
38
77
38
77
36
54
13
70
7
Co
st A
66
68
1
65
91
5
66
12
3
65
82
1
66
19
3
66
63
4
64
51
6
67
09
8
69
02
7
58
36
6
61
66
1
65
27
6
Co
st B
46
68
46
14
46
29
46
07
47
87
47
57
46
39
48
02
38
57
42
25
43
16
45
36
Co
st C
71
34
9
70
52
9
70
75
1
70
42
9
70
98
0
71
39
2
69
15
5
71
90
0
72
88
5
62
59
0
65
97
7
69
81
2
Gro
ss
inco
me
24
54
70
23
64
52
24
92
46
23
98
52
24
35
11
23
49
19
23
93
06
24
51
75
19
29
17
21
88
11
21
94
08
23
31
88
Net
in
com
e
18
05
74
17
27
53
18
51
74
17
41
61
17
25
31
16
35
27
17
01
51
17
42
98
13
79
63
16
00
42
15
77
47
16
80
84
BC
Ra
tio
3.4
4
3.3
5
3.5
2
3.4
1
3.4
3
3.2
9
3.4
6
3.4
1
2.6
5
3.5
0
3.3
3
3.3
4
Colocasia: it is cultivated during February to December. The cost of cultivation per hectare (Table
32) in different agri subdivisions varied from Rs. 47448 to 57780 and net income ranged from Rs.
127135 to 171000. The BC ratio ranged from 3.39 to 3.89.
Table 32. Cost of cultivation and returns of Colocassia under different agri-
subdivision.
Hea
ds
Bis
ha
lga
rh
Ku
ma
rgh
at
Jir
an
ia
Sa
tch
an
d
Pa
nis
ag
ar
Tel
iam
ura
Am
arp
ur
Mel
ag
ha
r
Av
era
ge
Man
Labours
14063 14844 15000 16875 17813 17344 17813 15000 16094
Powertiller 7500 6250 3750 3750 7500 5625 7500 7500 6172
Cattle Pair
Day
7500 6250 3750 3750 7500 5625 7500 7500 6172
Seed
/Rhizomes
12875 12500 15625 15625 12625 14125 12500 12500 13547
Manure 4688 4688 4219 4688 4500 4594 4688 4688 4594
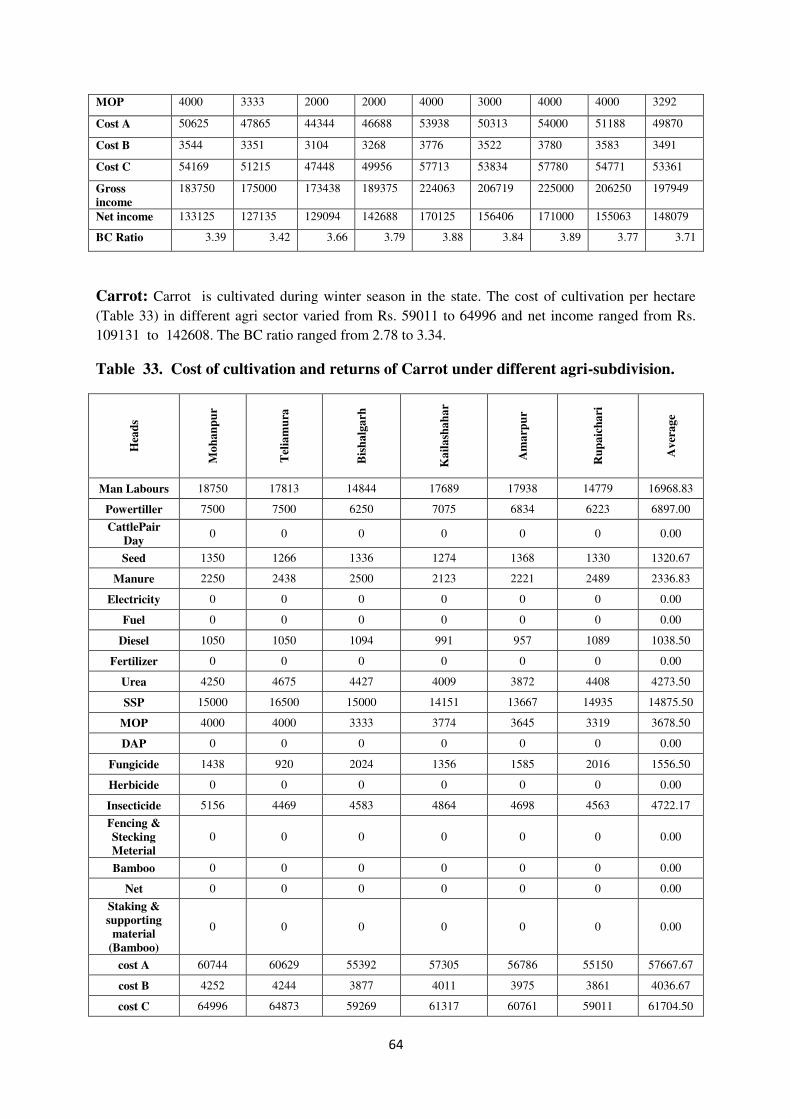
64
MOP 4000 3333 2000 2000 4000 3000 4000 4000 3292
Cost A 50625 47865 44344 46688 53938 50313 54000 51188 49870
Cost B 3544 3351 3104 3268 3776 3522 3780 3583 3491
Cost C 54169 51215 47448 49956 57713 53834 57780 54771 53361
Gross
income
183750 175000 173438 189375 224063 206719 225000 206250 197949
Net income 133125 127135 129094 142688 170125 156406 171000 155063 148079
BC Ratio 3.39 3.42 3.66 3.79 3.88 3.84 3.89 3.77 3.71
Carrot: Carrot is cultivated during winter season in the state. The cost of cultivation per hectare
(Table 33) in different agri sector varied from Rs. 59011 to 64996 and net income ranged from Rs.
109131 to 142608. The BC ratio ranged from 2.78 to 3.34.
Table 33. Cost of cultivation and returns of Carrot under different agri-subdivision.
Hea
ds
Mo
han
pu
r
Tel
iam
ura
Bis
ha
lga
rh
Ka
ila
sha
ha
r
Am
arp
ur
Ru
pa
ich
ari
Av
era
ge
Man Labours 18750 17813 14844 17689 17938 14779 16968.83
Powertiller 7500 7500 6250 7075 6834 6223 6897.00
CattlePair
Day 0 0 0 0 0 0 0.00
Seed 1350 1266 1336 1274 1368 1330 1320.67
Manure 2250 2438 2500 2123 2221 2489 2336.83
Electricity 0 0 0 0 0 0 0.00
Fuel 0 0 0 0 0 0 0.00
Diesel 1050 1050 1094 991 957 1089 1038.50
Fertilizer 0 0 0 0 0 0 0.00
Urea 4250 4675 4427 4009 3872 4408 4273.50
SSP 15000 16500 15000 14151 13667 14935 14875.50
MOP 4000 4000 3333 3774 3645 3319 3678.50
DAP 0 0 0 0 0 0 0.00
Fungicide 1438 920 2024 1356 1585 2016 1556.50
Herbicide 0 0 0 0 0 0 0.00
Insecticide 5156 4469 4583 4864 4698 4563 4722.17
Fencing &
Stecking
Meterial
0 0 0 0 0 0 0.00
Bamboo 0 0 0 0 0 0 0.00
Net 0 0 0 0 0 0 0.00
Staking &
supporting
material
(Bamboo)
0 0 0 0 0 0 0.00
cost A 60744 60629 55392 57305 56786 55150 57667.67
cost B 4252 4244 3877 4011 3975 3861 4036.67
cost C 64996 64873 59269 61317 60761 59011 61704.50

65
Gross income 191250 198000 198000 180425 174260 164281 184369.3
3
Net income 130506 137371 142608 123119 117474 109131 126701.5
0
BC Ratio 2.94 3.05 3.34 2.94 2.87 2.78 2.99
French bean: It is a winter vegetabkle grown inbthe state. The cost of cultivation per hectare (Table
34) in didffrent agri-sub divisions varied from Rs. 31944 to 83179 and net income varied form Rs.
26181to 145009. The BC ratio ranged from 1.82 to 4.23.
Table 34. Cost of cultivation and returns of French bean under different Agri-
subdivision.
Hea
ds
Bis
hw
alg
arh
Kh
ow
ai
Mo
han
pu
r
Jir
an
ia
Ka
nch
an
pu
r
Ka
da
mta
la
Sa
lem
a
Ch
au
ma
nu
Tel
iam
ura
Av
era
ge
Ma
n
lab
ou
r 21563 17813 20156 18281 34688 7813 12305 10156 11250 17114
Po
wer
till
er 9375 12500 7031 5469 10938 5208 1953 1302 1563 6149
See
d/P
lan
ti
ng
Met
eria
l 12500 15625 10000 11303 19250 9625 10000 8333 13400 12226
FY
M/C
om
po
st
22500 7500 4688 5156 8438 3750 1758 1922 2813 6503
Ure
a 150 225 150 188 450 188 94 250 300 222
SS
P 2125 1063 1063 1063 2550 1063 797 1063 1275 1340
MO
P 1150 575 575 719 1725 958 539 719 863 869
DA
P 0 1000 500 0 0 0 313 833 1000 405
Pla
nt
Pro
tect
ion
Ch
emic
al
0 0 0 688 1375 0 0 0 0 229
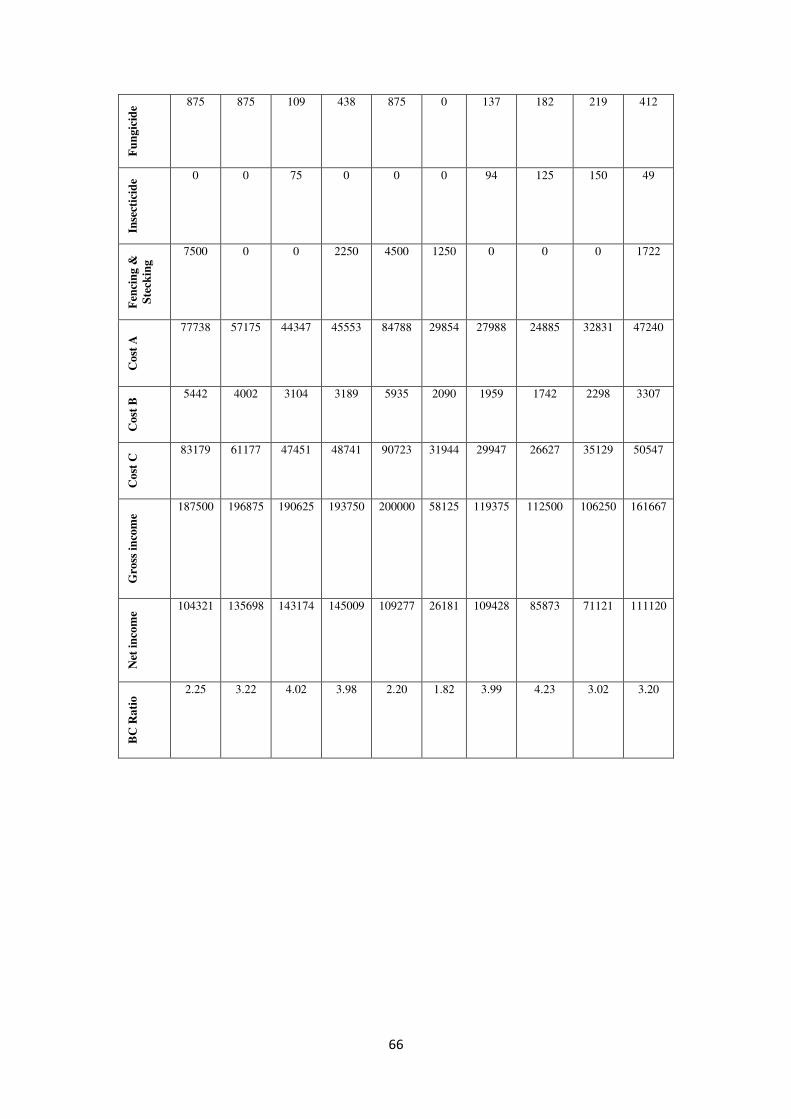
66
Fu
ng
icid
e
875 875 109 438 875 0 137 182 219 412
Inse
ctic
ide 0 0 75 0 0 0 94 125 150 49
Fen
cin
g &
Ste
ckin
g 7500 0 0 2250 4500 1250 0 0 0 1722
Co
st A
77738 57175 44347 45553 84788 29854 27988 24885 32831 47240
Co
st B
5442 4002 3104 3189 5935 2090 1959 1742 2298 3307
Co
st C
83179 61177 47451 48741 90723 31944 29947 26627 35129 50547
Gro
ss i
nco
me
187500 196875 190625 193750 200000 58125 119375 112500 106250 161667
Net
in
com
e
104321 135698 143174 145009 109277 26181 109428 85873 71121 111120
BC
Ra
tio 2.25 3.22 4.02 3.98 2.20 1.82 3.99 4.23 3.02 3.20
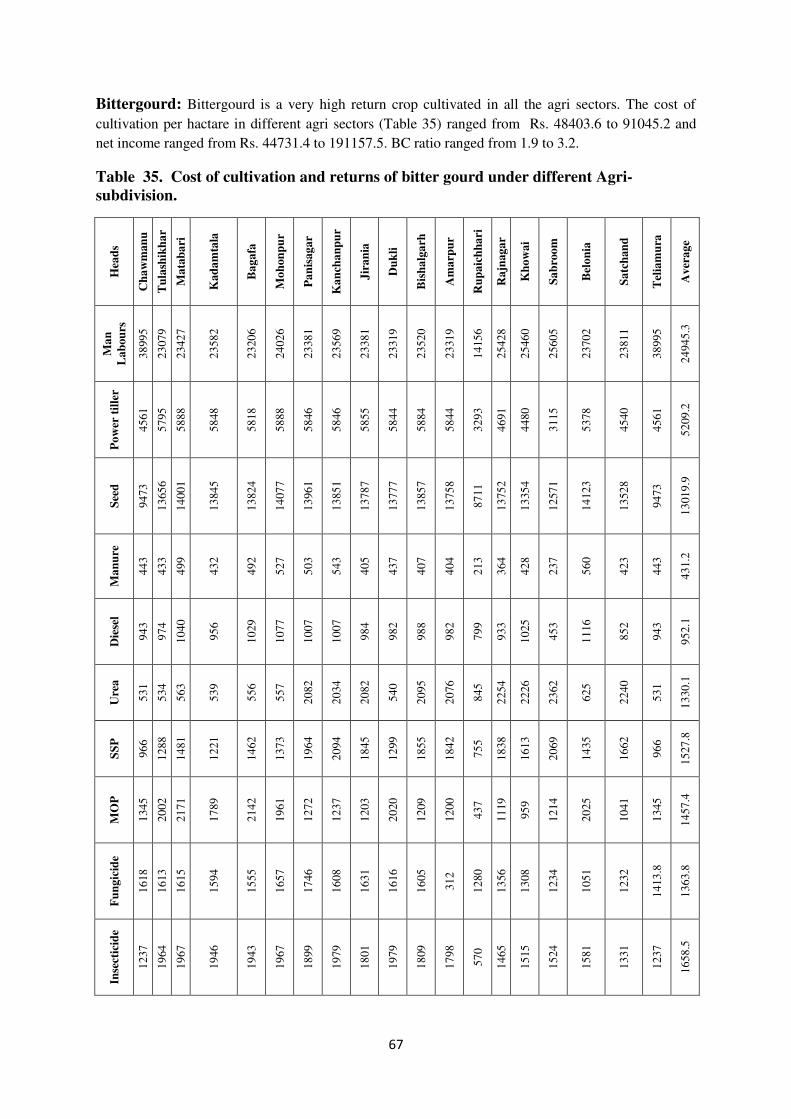
67
Bittergourd: Bittergourd is a very high return crop cultivated in all the agri sectors. The cost of
cultivation per hactare in different agri sectors (Table 35) ranged from Rs. 48403.6 to 91045.2 and
net income ranged from Rs. 44731.4 to 191157.5. BC ratio ranged from 1.9 to 3.2.
Table 35. Cost of cultivation and returns of bitter gourd under different Agri-
subdivision.
Hea
ds
Ch
aw
man
u
Tu
lash
ikh
ar
Ma
tab
ari
Ka
da
mta
la
Ba
ga
fa
Mo
hon
pu
r
Pa
nis
ag
ar
Ka
nch
an
pu
r
Jir
an
ia
Du
kli
Bis
ha
lga
rh
Am
arp
ur
Ru
pa
ich
ha
ri
Ra
jnag
ar
Kh
ow
ai
Sa
bro
om
Bel
on
ia
Sa
tch
an
d
Tel
iam
ura
Av
era
ge
Ma
n
La
bou
rs
38
99
5
23
07
9
23
42
7
23
58
2
23
20
6
24
02
6
23
38
1
23
56
9
23
38
1
23
31
9
23
52
0
23
31
9
14
15
6
25
42
8
25
46
0
25
60
5
23
70
2
23
81
1
38
99
5
24
94
5.3
Po
wer
til
ler
45
61
57
95
58
88
58
48
58
18
58
88
58
46
58
46
58
55
58
44
58
84
58
44
32
93
46
91
44
80
31
15
53
78
45
40
45
61
52
09
.2
See
d
94
73
13
65
6
14
00
1
13
84
5
13
82
4
14
07
7
13
96
1
13
85
1
13
78
7
13
77
7
13
85
7
13
75
8
87
11
13
75
2
13
35
4
12
57
1
14
12
3
13
52
8
94
73
13
01
9.9
Ma
nu
re
44
3
43
3
49
9
43
2
49
2
52
7
50
3
54
3
40
5
43
7
40
7
40
4
21
3
36
4
42
8
23
7
56
0
42
3
44
3
43
1.2
Die
sel
94
3
97
4
10
40
95
6
10
29
10
77
10
07
10
07
98
4
98
2
98
8
98
2
79
9
93
3
10
25
45
3
11
16
85
2
94
3
95
2.1
Ure
a
53
1
53
4
56
3
53
9
55
6
55
7
20
82
20
34
20
82
54
0
20
95
20
76
84
5
22
54
22
26
23
62
62
5
22
40
53
1
13
30
.1
SS
P
96
6
12
88
14
81
12
21
14
62
13
73
19
64
20
94
18
45
12
99
18
55
18
42
75
5
18
38
16
13
20
69
14
35
16
62
96
6
15
27
.8
MO
P
13
45
20
02
21
71
17
89
21
42
19
61
12
72
12
37
12
03
20
20
12
09
12
00
43
7
11
19
95
9
12
14
20
25
10
41
13
45
14
57
.4
Fu
ng
icid
e
16
18
16
13
16
15
15
94
15
55
16
57
17
46
16
08
16
31
16
16
16
05
31
2
12
80
13
56
13
08
12
34
10
51
12
32
14
13
.8
13
63
.8
Inse
ctic
ide
12
37
19
64
19
67
19
46
19
43
19
67
18
99
19
79
18
01
19
79
18
09
17
98
57
0
14
65
15
15
15
24
15
81
13
31
12
37
16
58
.5

68
Ba
mb
oo
23
24
9
30
70
2
31
14
0
31
02
7
30
74
6
30
39
8
31
06
1
31
06
1
31
06
8
30
99
3
31
23
6
30
99
3
14
17
8
29
30
3
32
72
1
24
14
8
23
57
6
29
95
8
23
24
9
28
46
3.5
Co
st A
83
36
1.0
82
04
0.0
83
79
2.0
82
77
9.0
82
77
3.0
83
50
8.0
84
72
2.0
84
82
9.0
84
04
2.0
82
80
6.0
84
46
5.0
82
52
8.0
45
23
7.0
82
50
3.0
85
08
9.0
74
53
2.0
75
17
2.0
80
61
8.0
83
15
6.8
80
35
8.8
Co
st B
58
35
.3
57
42
.8
58
65
.4
57
94
.5
57
94
.1
58
45
.6
59
30
.5
59
38
.0
58
82
.9
57
96
.4
59
12
.6
57
77
.0
31
66
.6
57
75
.2
59
56
.2
52
17
.2
52
62
.0
56
43
.3
58
21
.0
56
25
.1
cost
C
89
19
6.3
87
78
2.8
89
65
7.4
88
57
3.5
88
56
7.1
89
35
3.6
90
65
2.5
90
76
7.0
89
92
4.9
88
60
2.4
90
37
7.6
88
30
5.0
48
40
3.6
88
27
8.2
91
04
5.2
79
74
9.2
80
43
4.0
86
26
1.3
88
97
7.8
85
98
3.9
Gro
ss
inco
me
28
12
50
.0
25
57
50
.0
24
02
25
.0
24
06
00
.0
23
11
35
.0
21
91
20
.0
24
03
45
.0
20
80
50
.0
21
54
75
.0
23
10
45
.0
28
15
35
.0
20
13
00
.0
93
13
5.0
21
34
50
.0
26
13
75
.0
24
36
75
.0
23
11
35
.0
21
53
40
.0
28
05
75
.0
23
62
90
.3
Net
in
com
e
19
20
53
.7
16
79
67
.2
15
05
67
.6
15
20
26
.5
14
25
67
.9
12
97
66
.4
14
96
92
.5
11
72
83
.0
12
55
50
.1
14
24
42
.6
19
11
57
.5
11
29
95
.0
44
73
1.4
12
51
71
.8
17
03
29
.8
16
39
25
.8
15
07
01
.0
12
90
78
.7
19
15
97
.2
15
03
06
.3
BC
ra
tio
3.2
2.9
2.7
2.7
2.6
2.5
2.7
2.3
2.4
2.6
3.1
2.3
1.9
2.4
2.9
3.1
2.9
2.5
3.2
2.7
Bottlegourd: Bottle gourd is also a popular vegetable grown in fall and winter season in Tripura.
The cost of cultivation per nhactare in different agri sectors (Table 36) ranged from Rs. 47119.6 to
87693.8 and net income ranged from Rs. 45744.4 to 125726.8. BC ratio ranged from 1.4 to 2.4.
Table 36. Cost of cultivation and returns of bottle gourd under different Agri-
subdivision.
Hea
ds
Ch
aw
man
u
Tu
lash
ikh
ar
Ma
tab
ari
Ka
da
mta
la
Ba
ga
fa
Mo
hon
pu
r
Pa
nis
ag
ar
Ka
nch
an
pu
r
Jir
an
ia
Du
kli
Bis
ha
lga
rh
Am
arp
ur
Ru
pa
ich
ha
ri
Ra
jnag
ar
Kh
ow
ai
Sa
bro
om
Bel
on
ia
Sa
tch
an
d
Tel
iam
ura
Av
era
ge
Ma
n
La
bou
rs
39
00
5.0
23
08
9.0
23
43
7.0
23
59
2.0
23
21
6.0
24
03
6.0
23
39
1.0
23
57
9.0
23
39
1.0
23
32
9.0
23
53
0.0
23
32
9.0
14
16
6.0
25
43
8.0
25
47
0.0
25
61
5.0
23
71
2.0
23
82
1.0
39
00
5.0
24
95
5.3

69
Po
wer
til
ler
44
11
.0
56
45
.0
57
38
.0
56
98
.0
56
68
.0
57
38
.0
56
96
.0
56
96
.0
57
05
.0
56
94
.0
57
34
.0
56
94
.0
31
43
.0
45
41
.0
43
30
.0
29
65
.0
52
28
.0
43
90
.0
44
11
.0
50
59
.2
See
d
89
73
.0
13
15
6.0
13
50
1.0
13
34
5.0
13
32
4.0
13
57
7.0
13
46
1.0
13
35
1.0
13
28
7.0
13
27
7.0
13
35
7.0
13
25
8.0
82
11
.0
13
25
2.0
12
85
4.0
12
07
1.0
13
62
3.0
13
02
8.0
89
73
.0
12
51
9.9
Ma
nu
re
43
3.0
42
3.0
48
9.0
42
2.0
48
2.0
51
7.0
49
3.0
53
3.0
39
5.0
42
7.0
39
7.0
39
4.0
20
3.0
35
4.0
41
8.0
22
7.0
55
0.0
41
3.0
43
3.0
42
1.2
Die
sel
84
3.0
87
4.0
94
0.0
85
6.0
92
9.0
97
7.0
90
7.0
90
7.0
88
4.0
88
2.0
88
8.0
88
2.0
69
9.0
83
3.0
92
5.0
35
3.0
10
16
.0
75
2.0
84
3.0
85
2.1
Ure
a
63
1.0
63
4.0
66
3.0
63
9.0
65
6.0
65
7.0
21
82
.0
21
34
.0
21
82
.0
64
0.0
21
95
.0
21
76
.0
94
5.0
23
54
.0
23
26
.0
24
62
.0
72
5.0
23
40
.0
63
1.0
14
30
.1
SS
P
86
6.0
11
88
.0
13
81
.0
11
21
.0
13
62
.0
12
73
.0
18
64
.0
19
94
.0
17
45
.0
11
99
.0
17
55
.0
17
42
.0
65
5.0
17
38
.0
15
13
.0
19
69
.0
13
35
.0
15
62
.0
86
6.0
14
27
.8
MO
P
11
95
.0
18
52
.0
20
21
.0
16
39
.0
19
92
.0
18
11
.0
11
22
.0
10
87
.0
10
53
.0
18
70
.0
10
59
.0
10
50
.0
28
7.0
96
9.0
80
9.0
10
64
.0
18
75
.0
89
1.0
11
95
.0
13
07
.4
Fu
ng
icid
e
11
18
.0
11
13
.0
11
15
.0
10
94
.0
10
55
.0
11
57
.0
12
46
.0
11
08
.0
11
31
.0
11
16
.0
11
05
.0
-188
.0
78
0.0
85
6.0
80
8.0
73
4.0
55
1.0
73
2.0
91
3.8
86
3.8
Inse
ctic
ide
83
7.0
15
64
.0
15
67
.0
15
46
.0
15
43
.0
15
67
.0
14
99
.0
15
79
.0
14
01
.0
15
79
.0
14
09
.0
13
98
.0
17
0.0
10
65
.0
11
15
.0
11
24
.0
11
81
.0
93
1.0
83
7.0
12
58
.5
Ba
mb
oo
23
84
9.0
31
30
2.0
31
74
0.0
31
62
7.0
31
34
6.0
30
99
8.0
31
66
1.0
31
66
1.0
31
66
8.0
31
59
3.0
31
83
6.0
31
59
3.0
14
77
8.0
29
90
3.0
33
32
1.0
24
74
8.0
24
17
6.0
30
55
8.0
23
84
9.0
29
06
3.5
Co
st A
82
16
1.0
80
84
0.0
82
59
2.0
82
30
8.0
81
57
3.0
82
30
8.0
83
52
2.0
83
62
9.0
82
84
2.0
81
60
6.0
83
26
5.0
81
32
8.0
44
03
7.0
81
30
3.0
83
88
9.0
73
33
2.0
73
97
2.0
79
41
8.0
81
95
6.8
79
15
8.8
Co
st B
57
51
.3
56
58
.8
57
81
.4
57
61
.6
57
10
.1
57
61
.6
58
46
.5
58
54
.0
57
98
.9
57
12
.4
58
28
.6
56
93
.0
30
82
.6
56
91
.2
58
72
.2
51
33
.2
51
78
.0
55
59
.3
57
37
.0
55
41
.1

70
cost
C
87
91
2.3
86
49
8.8
88
37
3.4
88
06
9.6
87
28
3.1
88
06
9.6
89
36
8.5
89
48
3.0
88
64
0.9
87
31
8.4
89
09
3.6
87
02
1.0
47
11
9.6
86
99
4.2
89
76
1.2
78
46
5.2
79
15
0.0
84
97
7.3
87
69
3.8
84
69
9.9
Gro
ss
inco
me
14
54
04
.0
18
49
82
.0
19
59
34
.0
18
75
00
.0
12
13
55
.0
20
75
00
.0
17
32
62
.0
18
42
56
.0
17
25
00
.0
19
57
50
.0
20
18
75
.0
16
24
56
.0
92
86
4.0
19
32
60
.0
21
54
88
.0
19
24
56
.0
19
13
45
.0
17
42
56
.0
18
75
32
.0
17
78
93
.4
Net
in
com
e
57
49
1.7
98
48
3.2
10
75
60
.6
99
43
0.4
34
07
1.9
11
94
30
.4
83
89
3.5
94
77
3.0
83
85
9.1
10
84
31
.6
11
27
81
.5
75
43
5.0
45
74
4.4
10
62
65
.8
12
57
26
.8
11
39
90
.8
11
21
95
.0
89
27
8.7
99
83
8.2
93
19
3.5
BC
ra
tio
1.7
2.1
2.2
2.1
1.4
2.4
1.9
2.1
1.9
2.2
2.3
1.9
2.0
2.2
2.4
2.5
2.4
2.1
2.1
2.1
Pumpkin: Bottle gourd is also a popular vegetable grown in fall and winter season in Tripura. The
cost of cultivation per nhactare in different agri sectors (Table 37) ranged from Rs. 21233.1to
57516.8 and gross income ranged from Rs. 63323.9 to 122370.4. BC ratio ranged from 2.2 to 3.4.
Table 37. Cost of cultivation and returns of pumpkin under different Agri-subdivision.
Hea
ds
Ch
aw
man
u
Tu
lash
ikh
ar
Ma
tab
ari
Ka
da
mta
la
Ba
ga
fa
Mo
hon
pu
r
Pa
nis
ag
ar
Ka
nch
an
pu
r
Jir
an
ia
Du
kli
Bis
ha
lga
rh
Am
arp
ur
Ru
pa
ich
ha
ri
Ra
jnag
ar
Kh
ow
ai
Sa
bro
om
Bel
on
ia
Sa
tch
an
d
Tel
iam
ura
Av
era
ge
Ma
n
La
bou
rs
39
90
5.0
23
98
9.0
24
33
7.0
24
49
2.0
24
11
6.0
24
93
6.0
24
29
1.0
24
47
9.0
24
29
1.0
24
22
9.0
24
43
0.0
24
22
9.0
15
06
6.0
26
33
8.0
26
37
0.0
26
51
5.0
24
61
2.0
24
72
1.0
39
90
5.0
25
85
5.3
Po
wer
til
ler
44
06
.0
56
40
.0
57
33
.0
56
93
.0
56
63
.0
57
33
.0
56
91
.0
56
91
.0
57
00
.0
56
89
.0
57
29
.0
56
89
.0
31
38
.0
45
36
.0
43
25
.0
29
60
.0
52
23
.0
43
85
.0
44
06
.0
50
54
.2
See
d
89
63
.0
13
14
6.0
13
49
1.0
13
33
5.0
13
31
4.0
13
56
7.0
13
45
1.0
13
34
1.0
13
27
7.0
13
26
7.0
13
34
7.0
13
24
8.0
82
01
.0
13
24
2.0
12
84
4.0
12
06
1.0
13
61
3.0
13
01
8.0
89
63
.0
12
50
9.9
Ma
nu
re
44
5.0
43
5.0
50
1.0
43
4.0
49
4.0
52
9.0
50
5.0
54
5.0
40
7.0
43
9.0
40
9.0
40
6.0
21
5.0
36
6.0
43
0.0
23
9.0
56
2.0
42
5.0
44
5.0
43
3.2
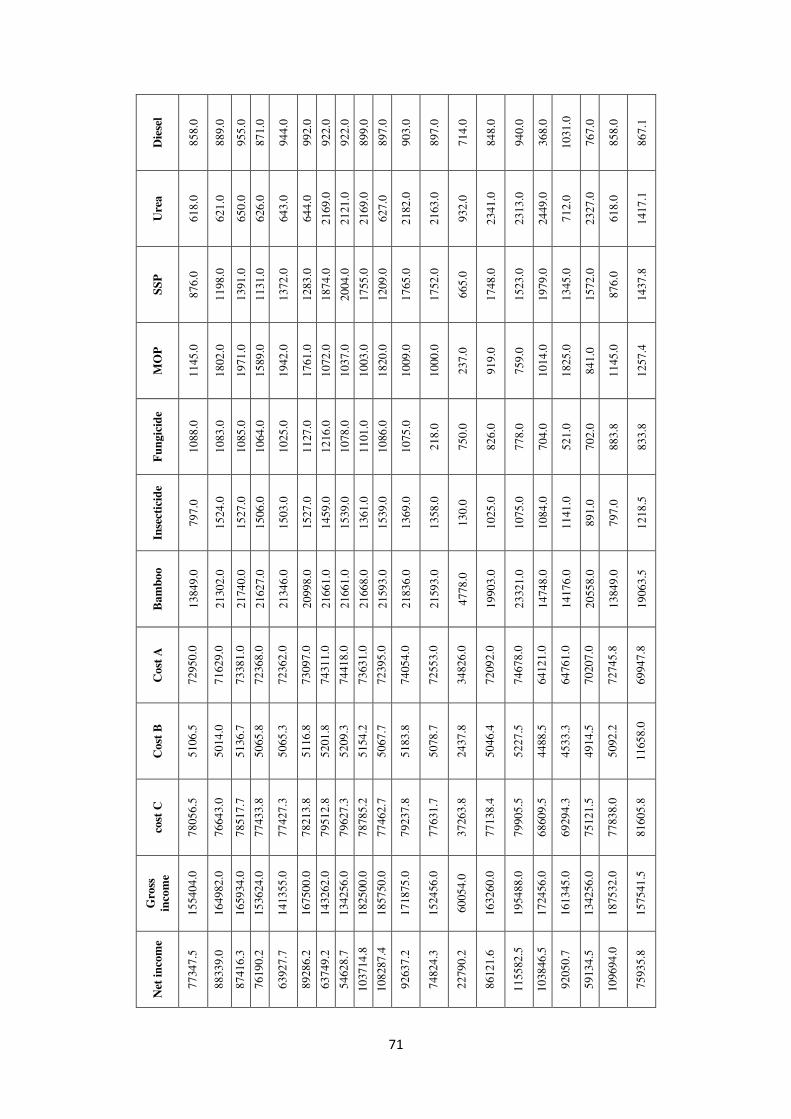
71
Die
sel
85
8.0
88
9.0
95
5.0
87
1.0
94
4.0
99
2.0
92
2.0
92
2.0
89
9.0
89
7.0
90
3.0
89
7.0
71
4.0
84
8.0
94
0.0
36
8.0
10
31
.0
76
7.0
85
8.0
86
7.1
Ure
a
61
8.0
62
1.0
65
0.0
62
6.0
64
3.0
64
4.0
21
69
.0
21
21
.0
21
69
.0
62
7.0
21
82
.0
21
63
.0
93
2.0
23
41
.0
23
13
.0
24
49
.0
71
2.0
23
27
.0
61
8.0
14
17
.1
SS
P
87
6.0
11
98
.0
13
91
.0
11
31
.0
13
72
.0
12
83
.0
18
74
.0
20
04
.0
17
55
.0
12
09
.0
17
65
.0
17
52
.0
66
5.0
17
48
.0
15
23
.0
19
79
.0
13
45
.0
15
72
.0
87
6.0
14
37
.8
MO
P
11
45
.0
18
02
.0
19
71
.0
15
89
.0
19
42
.0
17
61
.0
10
72
.0
10
37
.0
10
03
.0
18
20
.0
10
09
.0
10
00
.0
23
7.0
91
9.0
75
9.0
10
14
.0
18
25
.0
84
1.0
11
45
.0
12
57
.4
Fu
ng
icid
e
10
88
.0
10
83
.0
10
85
.0
10
64
.0
10
25
.0
11
27
.0
12
16
.0
10
78
.0
11
01
.0
10
86
.0
10
75
.0
21
8.0
75
0.0
82
6.0
77
8.0
70
4.0
52
1.0
70
2.0
88
3.8
83
3.8
Inse
ctic
ide
79
7.0
15
24
.0
15
27
.0
15
06
.0
15
03
.0
15
27
.0
14
59
.0
15
39
.0
13
61
.0
15
39
.0
13
69
.0
13
58
.0
13
0.0
10
25
.0
10
75
.0
10
84
.0
11
41
.0
89
1.0
79
7.0
12
18
.5
Ba
mb
oo
13
84
9.0
21
30
2.0
21
74
0.0
21
62
7.0
21
34
6.0
20
99
8.0
21
66
1.0
21
66
1.0
21
66
8.0
21
59
3.0
21
83
6.0
21
59
3.0
47
78
.0
19
90
3.0
23
32
1.0
14
74
8.0
14
17
6.0
20
55
8.0
13
84
9.0
19
06
3.5
Co
st A
72
95
0.0
71
62
9.0
73
38
1.0
72
36
8.0
72
36
2.0
73
09
7.0
74
31
1.0
74
41
8.0
73
63
1.0
72
39
5.0
74
05
4.0
72
55
3.0
34
82
6.0
72
09
2.0
74
67
8.0
64
12
1.0
64
76
1.0
70
20
7.0
72
74
5.8
69
94
7.8
Co
st B
51
06
.5
50
14
.0
51
36
.7
50
65
.8
50
65
.3
51
16
.8
52
01
.8
52
09
.3
51
54
.2
50
67
.7
51
83
.8
50
78
.7
24
37
.8
50
46
.4
52
27
.5
44
88
.5
45
33
.3
49
14
.5
50
92
.2
11
65
8.0
cost
C
78
05
6.5
76
64
3.0
78
51
7.7
77
43
3.8
77
42
7.3
78
21
3.8
79
51
2.8
79
62
7.3
78
78
5.2
77
46
2.7
79
23
7.8
77
63
1.7
37
26
3.8
77
13
8.4
79
90
5.5
68
60
9.5
69
29
4.3
75
12
1.5
77
83
8.0
81
60
5.8
Gro
ss
inco
me
15
54
04
.0
16
49
82
.0
16
59
34
.0
15
36
24
.0
14
13
55
.0
16
75
00
.0
14
32
62
.0
13
42
56
.0
18
25
00
.0
18
57
50
.0
17
18
75
.0
15
24
56
.0
60
05
4.0
16
32
60
.0
19
54
88
.0
17
24
56
.0
16
13
45
.0
13
42
56
.0
18
75
32
.0
15
75
41
.5
Net
in
com
e
77
34
7.5
88
33
9.0
87
41
6.3
76
19
0.2
63
92
7.7
89
28
6.2
63
74
9.2
54
62
8.7
10
37
14
.8
10
82
87
.4
92
63
7.2
74
82
4.3
22
79
0.2
86
12
1.6
11
55
82
.5
10
38
46
.5
92
05
0.7
59
13
4.5
10
96
94
.0
75
93
5.8
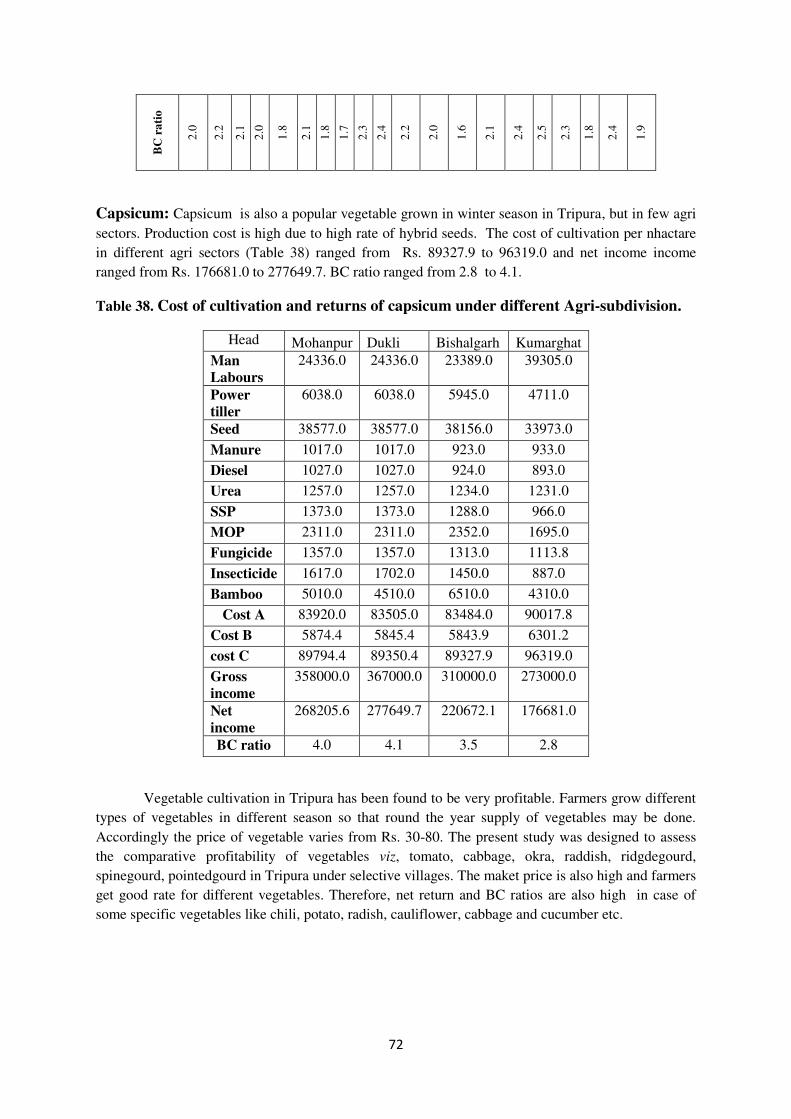
72
BC
ra
tio
2.0
2.2
2.1
2.0
1.8
2.1
1.8
1.7
2.3
2.4
2.2
2.0
1.6
2.1
2.4
2.5
2.3
1.8
2.4
1.9
Capsicum: Capsicum is also a popular vegetable grown in winter season in Tripura, but in few agri
sectors. Production cost is high due to high rate of hybrid seeds. The cost of cultivation per nhactare
in different agri sectors (Table 38) ranged from Rs. 89327.9 to 96319.0 and net income income
ranged from Rs. 176681.0 to 277649.7. BC ratio ranged from 2.8 to 4.1.
Table 38. Cost of cultivation and returns of capsicum under different Agri-subdivision.
Head Mohanpur Dukli Bishalgarh Kumarghat
Man
Labours
24336.0 24336.0 23389.0 39305.0
Power
tiller
6038.0 6038.0 5945.0 4711.0
Seed 38577.0 38577.0 38156.0 33973.0
Manure 1017.0 1017.0 923.0 933.0
Diesel 1027.0 1027.0 924.0 893.0
Urea 1257.0 1257.0 1234.0 1231.0
SSP 1373.0 1373.0 1288.0 966.0
MOP 2311.0 2311.0 2352.0 1695.0
Fungicide 1357.0 1357.0 1313.0 1113.8
Insecticide 1617.0 1702.0 1450.0 887.0
Bamboo 5010.0 4510.0 6510.0 4310.0
Cost A 83920.0 83505.0 83484.0 90017.8
Cost B 5874.4 5845.4 5843.9 6301.2
cost C 89794.4 89350.4 89327.9 96319.0
Gross
income
358000.0 367000.0 310000.0 273000.0
Net
income
268205.6 277649.7 220672.1 176681.0
BC ratio 4.0 4.1 3.5 2.8
Vegetable cultivation in Tripura has been found to be very profitable. Farmers grow different
types of vegetables in different season so that round the year supply of vegetables may be done.
Accordingly the price of vegetable varies from Rs. 30-80. The present study was designed to assess
the comparative profitability of vegetables viz, tomato, cabbage, okra, raddish, ridgdegourd,
spinegourd, pointedgourd in Tripura under selective villages. The maket price is also high and farmers
get good rate for different vegetables. Therefore, net return and BC ratios are also high in case of
some specific vegetables like chili, potato, radish, cauliflower, cabbage and cucumber etc.
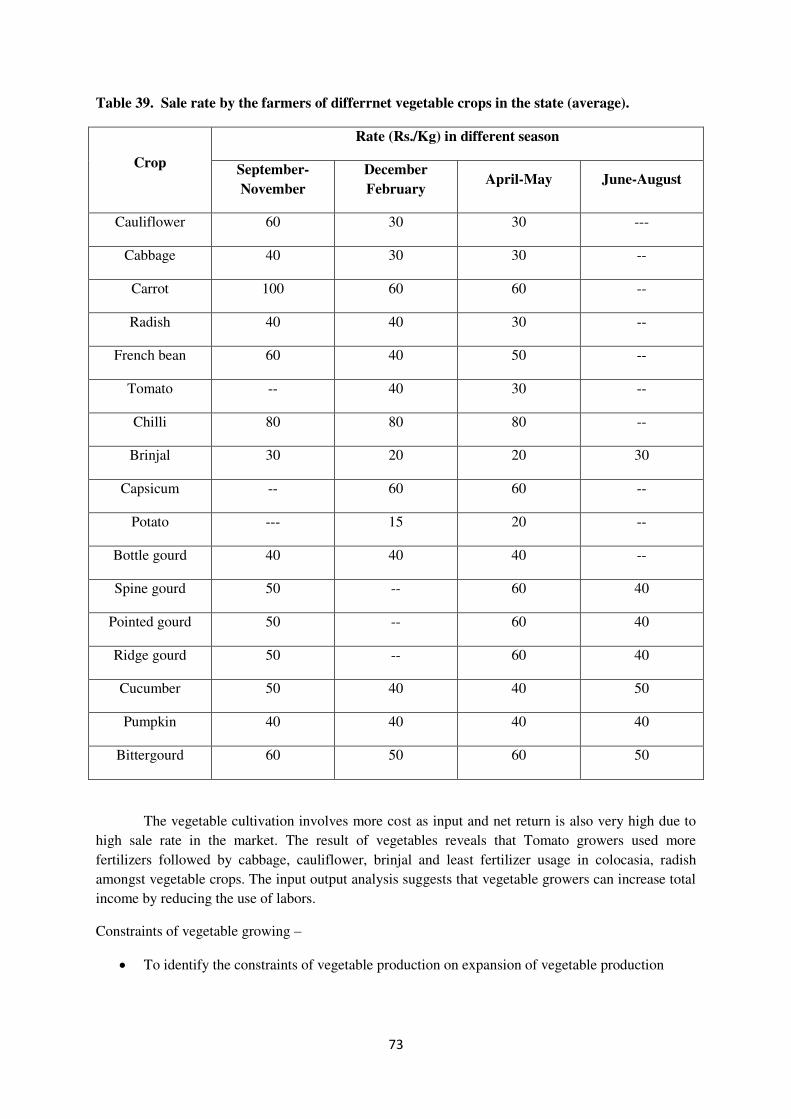
73
Table 39. Sale rate by the farmers of differrnet vegetable crops in the state (average).
Crop
Rate (Rs./Kg) in different season
September-
November
December
February April-May June-August
Cauliflower 60 30 30 ---
Cabbage 40 30 30 --
Carrot 100 60 60 --
Radish 40 40 30 --
French bean 60 40 50 --
Tomato -- 40 30 --
Chilli 80 80 80 --
Brinjal 30 20 20 30
Capsicum -- 60 60 --
Potato --- 15 20 --
Bottle gourd 40 40 40 --
Spine gourd 50 -- 60 40
Pointed gourd 50 -- 60 40
Ridge gourd 50 -- 60 40
Cucumber 50 40 40 50
Pumpkin 40 40 40 40
Bittergourd 60 50 60 50
The vegetable cultivation involves more cost as input and net return is also very high due to
high sale rate in the market. The result of vegetables reveals that Tomato growers used more
fertilizers followed by cabbage, cauliflower, brinjal and least fertilizer usage in colocasia, radish
amongst vegetable crops. The input output analysis suggests that vegetable growers can increase total
income by reducing the use of labors.
Constraints of vegetable growing –
To identify the constraints of vegetable production on expansion of vegetable production
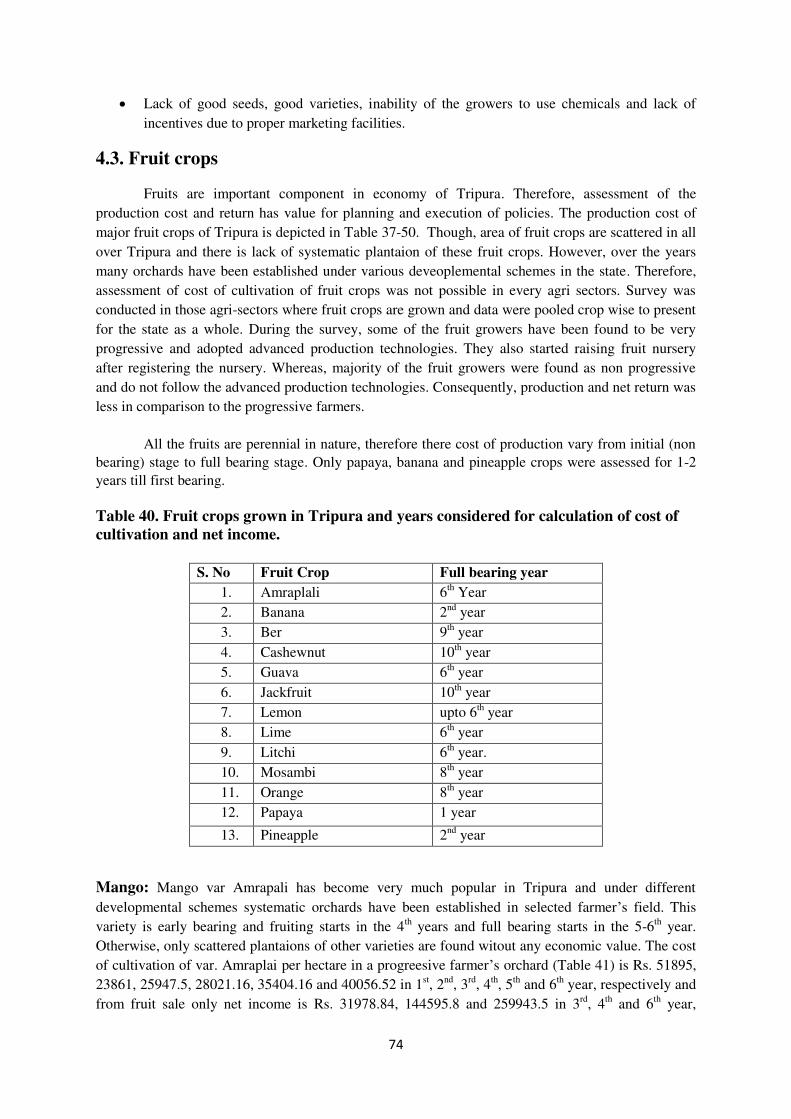
74
Lack of good seeds, good varieties, inability of the growers to use chemicals and lack of
incentives due to proper marketing facilities.
4.3. Fruit crops
Fruits are important component in economy of Tripura. Therefore, assessment of the
production cost and return has value for planning and execution of policies. The production cost of
major fruit crops of Tripura is depicted in Table 37-50. Though, area of fruit crops are scattered in all
over Tripura and there is lack of systematic plantaion of these fruit crops. However, over the years
many orchards have been established under various deveoplemental schemes in the state. Therefore,
assessment of cost of cultivation of fruit crops was not possible in every agri sectors. Survey was
conducted in those agri-sectors where fruit crops are grown and data were pooled crop wise to present
for the state as a whole. During the survey, some of the fruit growers have been found to be very
progressive and adopted advanced production technologies. They also started raising fruit nursery
after registering the nursery. Whereas, majority of the fruit growers were found as non progressive
and do not follow the advanced production technologies. Consequently, production and net return was
less in comparison to the progressive farmers.
All the fruits are perennial in nature, therefore there cost of production vary from initial (non
bearing) stage to full bearing stage. Only papaya, banana and pineapple crops were assessed for 1-2
years till first bearing.
Table 40. Fruit crops grown in Tripura and years considered for calculation of cost of
cultivation and net income.
S. No Fruit Crop Full bearing year
1. Amraplali 6th Year
2. Banana 2nd
year
3. Ber 9th year
4. Cashewnut 10th year
5. Guava 6th year
6. Jackfruit 10th year
7. Lemon upto 6th year
8. Lime 6th year
9. Litchi 6th year.
10. Mosambi 8th year
11. Orange 8th year
12. Papaya 1 year
13. Pineapple 2nd
year
Mango: Mango var Amrapali has become very much popular in Tripura and under different
developmental schemes systematic orchards have been established in selected farmer’s field. This
variety is early bearing and fruiting starts in the 4th years and full bearing starts in the 5-6
th year.
Otherwise, only scattered plantaions of other varieties are found witout any economic value. The cost
of cultivation of var. Amraplai per hectare in a progreesive farmer’s orchard (Table 41) is Rs. 51895,
23861, 25947.5, 28021.16, 35404.16 and 40056.52 in 1st, 2
nd, 3
rd, 4
th, 5
th and 6
th year, respectively and
from fruit sale only net income is Rs. 31978.84, 144595.8 and 259943.5 in 3rd
, 4th and 6
th year,
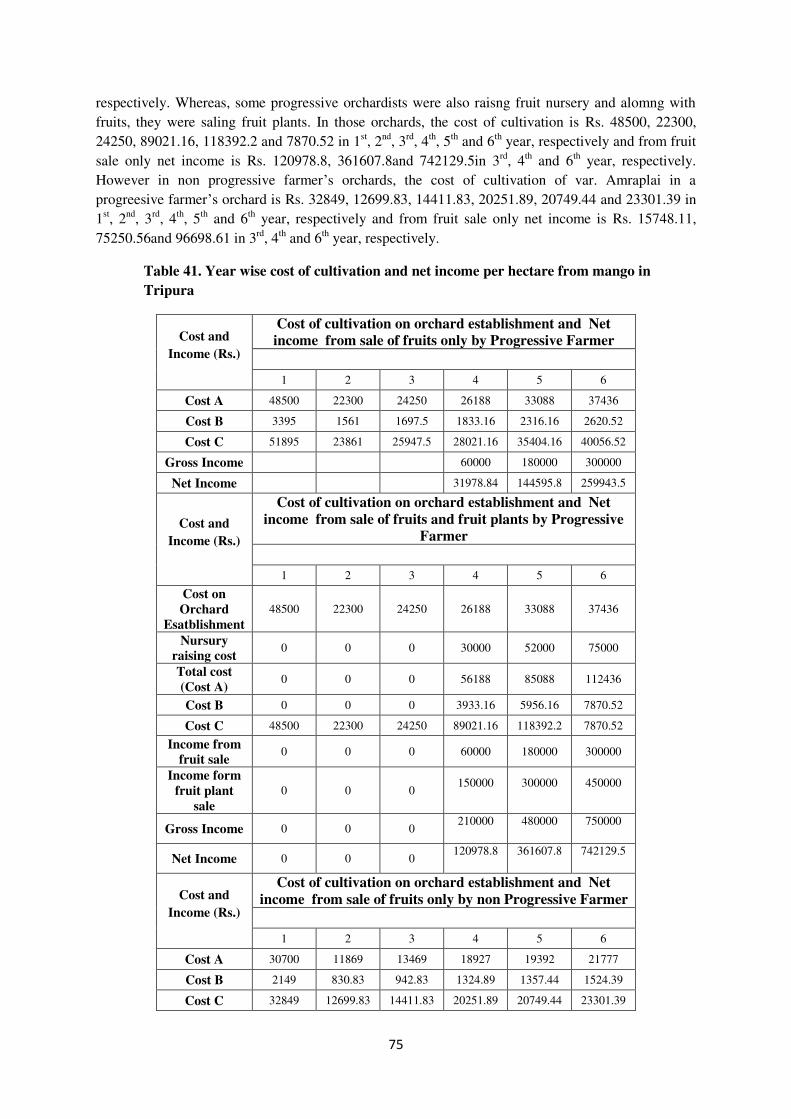
75
respectively. Whereas, some progressive orchardists were also raisng fruit nursery and alomng with
fruits, they were saling fruit plants. In those orchards, the cost of cultivation is Rs. 48500, 22300,
24250, 89021.16, 118392.2 and 7870.52 in 1st, 2
nd, 3
rd, 4
th, 5
th and 6
th year, respectively and from fruit
sale only net income is Rs. 120978.8, 361607.8and 742129.5in 3rd
, 4th and 6
th year, respectively.
However in non progressive farmer’s orchards, the cost of cultivation of var. Amraplai in a
progreesive farmer’s orchard is Rs. 32849, 12699.83, 14411.83, 20251.89, 20749.44 and 23301.39 in
1st, 2
nd, 3
rd, 4
th, 5
th and 6
th year, respectively and from fruit sale only net income is Rs. 15748.11,
75250.56and 96698.61 in 3rd
, 4th and 6
th year, respectively.
Table 41. Year wise cost of cultivation and net income per hectare from mango in
Tripura
Cost and
Income (Rs.)
Cost of cultivation on orchard establishment and Net
income from sale of fruits only by Progressive Farmer
1 2 3 4 5 6
Cost A 48500 22300 24250 26188 33088 37436
Cost B 3395 1561 1697.5 1833.16 2316.16 2620.52
Cost C 51895 23861 25947.5 28021.16 35404.16 40056.52
Gross Income
60000 180000 300000
Net Income
31978.84 144595.8 259943.5
Cost and
Income (Rs.)
Cost of cultivation on orchard establishment and Net
income from sale of fruits and fruit plants by Progressive
Farmer
1 2 3 4 5 6
Cost on
Orchard
Esatblishment
48500 22300 24250 26188 33088 37436
Nursury
raising cost 0 0 0 30000 52000 75000
Total cost
(Cost A) 0 0 0 56188 85088 112436
Cost B 0 0 0 3933.16 5956.16 7870.52
Cost C 48500 22300 24250 89021.16 118392.2 7870.52
Income from
fruit sale 0 0 0 60000 180000 300000
Income form
fruit plant
sale
0 0 0 150000 300000 450000
Gross Income 0 0 0 210000 480000 750000
Net Income 0 0 0 120978.8 361607.8 742129.5
Cost and
Income (Rs.)
Cost of cultivation on orchard establishment and Net
income from sale of fruits only by non Progressive Farmer
1 2 3 4 5 6
Cost A 30700 11869 13469 18927 19392 21777
Cost B 2149 830.83 942.83 1324.89 1357.44 1524.39
Cost C 32849 12699.83 14411.83 20251.89 20749.44 23301.39

76
Gross Income 0 0 0 36000 96000 120000
Net Income 0 0 0 15748.11 75250.56 96698.61
Banana: In Tripura banana varieties Sabri, Champa aand Gopi are very popular. One piece of var.
Sabri banana costs around Rs. 10-15. The cost of cultivation of banana per hectare (Table 42) is Rs.
220724.9 and 87403.4 in progressive and non progressive farmer’s orchards, respectively. The net
income from one hectare is Rs. 467275.1 and 254596.6 in progressive and non progressive farmer’s
orchards, respectively.
Table 42. Cost of cultivation and Net imcone from banana cultivation in Tripura.
Cost and Income (Rs.) Progressive Non Progressive
Cost A 220713.9 87392.4
Cost B 15449.97 6117.468
Cost C 220724.9 87403.4
Income from Fruits 640000 310000
Income from Sucker sale 48000 32000
Gross Income 688000 342000
Net Income 467275.1 254596.6
Ber: In Tripura ber is also very profitable, however, systematic orchards are not found in every agri-
sector. Under various schemes orchards have been established in selected farmer’s field. The cost of
cultivation per hactare in progressive farmer’s orchards (Table 43) is Rs. 43335, 11027.74, 13931.72,
17041.46, 18094.88, 19442.11, 18372.11, 19067.61 and 19992.252 in 1st, 2
nd, 3
rd, 4
th, 5
th, 6
th , 7
th, 8
th
and 9th years, respectively and from fruit sale only net income is Rs. 12958.54, 29905.12, 70557.89,
101627.9, 112932.4 and 160007.8 in 4th, 5
th, 6
th , 7
th, 8
th and 9
th years, respectively, form sale of
fruits. Some progressiave farmers were also raising fruit nursery and the cost of cultivation for
orchard establishment and nursery raising is 40500, 10306.3, 13020.3, 15926.6, 30934.88, 37632.11,
53682.11, 54377.61 and 55302.2 in 1st, 2
nd, 3
rd, 4
th, 5
th, 6
th , 7
th, 8
th and 9
th years, respectively. The net
income per hectare is 30000, 67065.12, 127367.9, 191317.9, 202622.4 and 249697.8 in 4th, 5
th, 6
th,
7th, 8
th and 9
th years, respectively. Whereas, the cost of cultivation in non progressive farmer’s
orchard is 24824, 8162.067, 9178.567, 10442.45, 10870.45, 11385.44, 11064.44, 11706.44 and
12562.44 in 1st, 2
nd, 3
rd, 4
th, 5
th, 6
th , 7
th, 8
th and 9
th years, respectively and net income is 14129.55,
16114.56, 28935.56, 48293.56 and 62437.56 in 5th, 6
th , 7
th, 8
th and 9
th years, respectively.
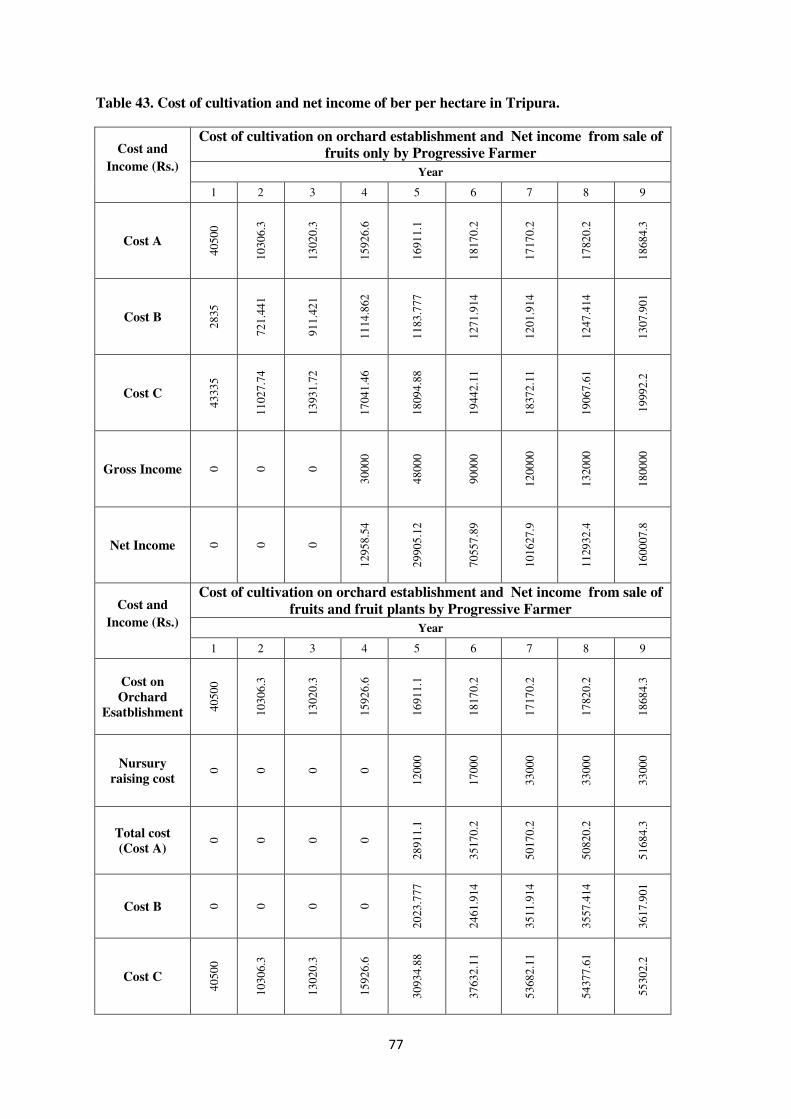
77
Table 43. Cost of cultivation and net income of ber per hectare in Tripura.
Cost and
Income (Rs.)
Cost of cultivation on orchard establishment and Net income from sale of
fruits only by Progressive Farmer
Year
1 2 3 4 5 6 7 8 9
Cost A
40
50
0
10
30
6.3
13
02
0.3
15
92
6.6
16
91
1.1
18
17
0.2
17
17
0.2
17
82
0.2
18
68
4.3
Cost B
28
35
72
1.4
41
91
1.4
21
11
14
.862
11
83
.777
12
71
.914
12
01
.914
12
47
.414
13
07
.901
Cost C
43
33
5
11
02
7.7
4
13
93
1.7
2
17
04
1.4
6
18
09
4.8
8
19
44
2.1
1
18
37
2.1
1
19
06
7.6
1
19
99
2.2
Gross Income 0
0
0
30
00
0
48
00
0
90
00
0
12
00
00
13
20
00
18
00
00
Net Income 0
0
0
12
95
8.5
4
29
90
5.1
2
70
55
7.8
9
10
16
27
.9
11
29
32
.4
16
00
07
.8
Cost and
Income (Rs.)
Cost of cultivation on orchard establishment and Net income from sale of
fruits and fruit plants by Progressive Farmer
Year
1 2 3 4 5 6 7 8 9
Cost on
Orchard
Esatblishment 40
50
0
10
30
6.3
13
02
0.3
15
92
6.6
16
91
1.1
18
17
0.2
17
17
0.2
17
82
0.2
18
68
4.3
Nursury
raising cost
0
0
0
0
12
00
0
17
00
0
33
00
0
33
00
0
33
00
0
Total cost
(Cost A)
0
0
0
0
28
91
1.1
35
17
0.2
50
17
0.2
50
82
0.2
51
68
4.3
Cost B 0
0
0
0
20
23
.777
24
61
.914
35
11
.914
35
57
.414
36
17
.901
Cost C
40
50
0
10
30
6.3
13
02
0.3
15
92
6.6
30
93
4.8
8
37
63
2.1
1
53
68
2.1
1
54
37
7.6
1
55
30
2.2
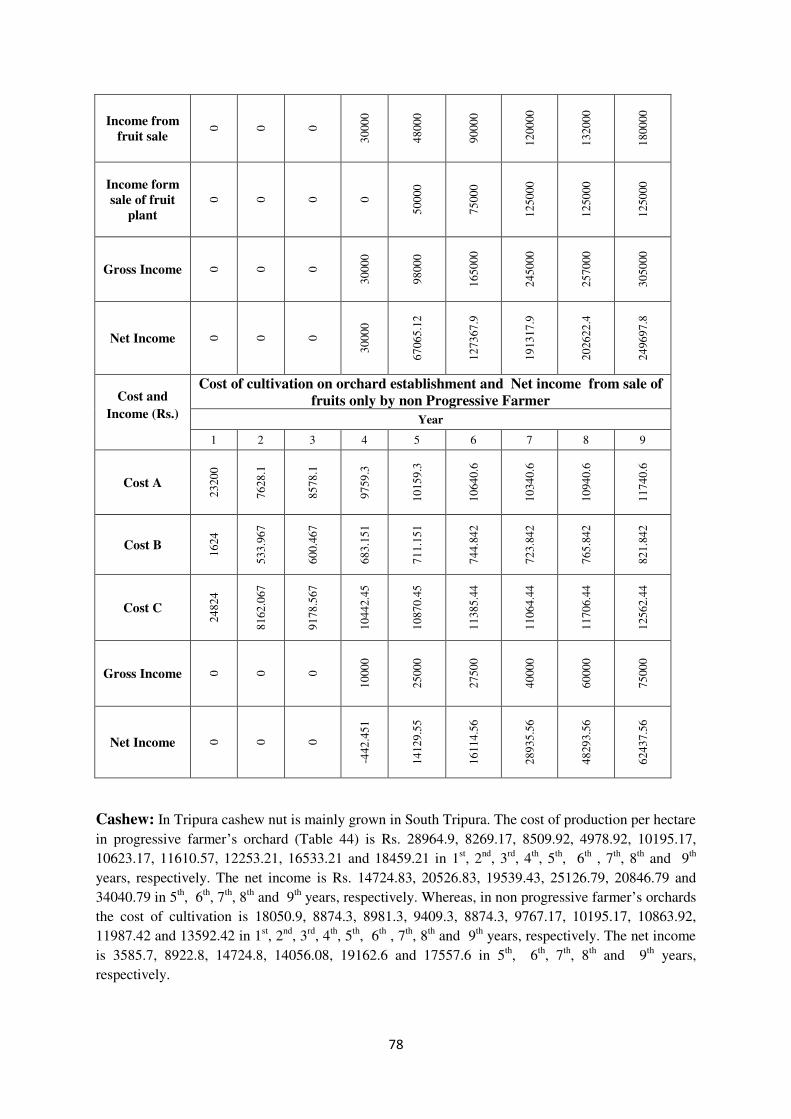
78
Income from
fruit sale
0
0
0
30
00
0
48
00
0
90
00
0
12
00
00
13
20
00
18
00
00
Income form
sale of fruit
plant 0
0
0
0
50
00
0
75
00
0
12
50
00
12
50
00
12
50
00
Gross Income 0
0
0
30
00
0
98
00
0
16
50
00
24
50
00
25
70
00
30
50
00
Net Income 0
0
0
30
00
0
67
06
5.1
2
12
73
67
.9
19
13
17
.9
20
26
22
.4
24
96
97
.8
Cost and
Income (Rs.)
Cost of cultivation on orchard establishment and Net income from sale of
fruits only by non Progressive Farmer
Year
1 2 3 4 5 6 7 8 9
Cost A
23
20
0
76
28
.1
85
78
.1
97
59
.3
10
15
9.3
10
64
0.6
10
34
0.6
10
94
0.6
11
74
0.6
Cost B
16
24
53
3.9
67
60
0.4
67
68
3.1
51
71
1.1
51
74
4.8
42
72
3.8
42
76
5.8
42
82
1.8
42
Cost C
24
82
4
81
62
.067
91
78
.567
10
44
2.4
5
10
87
0.4
5
11
38
5.4
4
11
06
4.4
4
11
70
6.4
4
12
56
2.4
4
Gross Income 0
0
0
10
00
0
25
00
0
27
50
0
40
00
0
60
00
0
75
00
0
Net Income 0
0
0
-442
.45
1
14
12
9.5
5
16
11
4.5
6
28
93
5.5
6
48
29
3.5
6
62
43
7.5
6
Cashew: In Tripura cashew nut is mainly grown in South Tripura. The cost of production per hectare
in progressive farmer’s orchard (Table 44) is Rs. 28964.9, 8269.17, 8509.92, 4978.92, 10195.17,
10623.17, 11610.57, 12253.21, 16533.21 and 18459.21 in 1st, 2
nd, 3
rd, 4
th, 5
th, 6
th , 7
th, 8
th and 9
th
years, respectively. The net income is Rs. 14724.83, 20526.83, 19539.43, 25126.79, 20846.79 and
34040.79 in 5th, 6
th, 7
th, 8
th and 9
th years, respectively. Whereas, in non progressive farmer’s orchards
the cost of cultivation is 18050.9, 8874.3, 8981.3, 9409.3, 8874.3, 9767.17, 10195.17, 10863.92,
11987.42 and 13592.42 in 1st, 2
nd, 3
rd, 4
th, 5
th, 6
th , 7
th, 8
th and 9
th years, respectively. The net income
is 3585.7, 8922.8, 14724.8, 14056.08, 19162.6 and 17557.6 in 5th, 6
th, 7
th, 8
th and 9
th years,
respectively.

79
Table 44. Cost of cultivation and Net income from Cahewnut per hectare from fruit sale in
Tripura.
Cost
and
Income
(Rs.)
Progressive farmer
Year
1 2 3 4 5 6 7 8 9 10
Cost A 27070 7728.2 7953.2 4653.2 9528.2 9928.2 10851 11451.6 15451.6 17251.6
Cost B 1894.9 540.974 556.724 325.724 666.974 694.974 759.57 801.612 1081.612 1207.612
Cost C 28964.9 8269.174 8509.924 4978.924 10195.17 10623.17 11610.57 12253.21 16533.21 18459.21
Gross
Income 0 0 0 0 24920 31150 31150 37380 37380 52500
Net
Income 0 0 0 0 14724.83 20526.83 19539.43 25126.79 20846.79 34040.79
Cost
and
Income
(Rs.)
Non Progressive farmer
Year
1 2 3 4 5 6 7 8 9 10
Cost A 16870 8293.7 8393.7 8793.7 8293.7 9128.2 9528.2 10153.2 11203.2 12703.2
Cost B 1180.9 580.559 587.559 615.559 580.559 638.974 666.974 710.724 784.224 889.224
Cost C 18050.9 8874.259 8981.259 9409.259 8874.259 9767.174 10195.17 10863.92 11987.42 13592.42
Gross
Income 0 0 0 0 12460
18690 24920 24920 31150 31150
Net
Income 0 0 0 0 3585.741 8922.826 14724.83 14056.08 19162.58 17557.58
Guava: In Tripura guava is also not cultivated in systematic orchards in all the agri sectors. However,
under various schemes systematic orchards have been established in selected farmer’s fields. The cost
of cultivation per hectare in progressive farmer’s orchards (Table 45) is 59968, 17796.5, 22721.5,
24975, 21921.1 and 23371.1 in 1st, 2
nd, 3
rd, 4
th, 5
th and 6
th years, respectively. In some progressive
farmer’s orchards, the cost of cultivation of orchard and fruit nursery establishment and management
cost is 64093, 18969.5, 24239.25, 32428.49, 32584.82 and 38630.321 in 1st, 2
nd, 3
rd, 4
th, 5
th and 6
th
years, respectively and net income per hectare is 77571.51, 209915.2 and 326369.7 in 4th, 5
th and 6
th
years, respectively. Whereas in non progressive farmner’s orchards, the cost of cultivation is 28560,
8753.7, 9235.3, 9735.3, 1197.3 and 11535.3 in 1st, 2
nd, 3
rd, 4
th, 5
th and 6
th years, respectively. Net
income is 26264.7, 94802.7 and 108464.7 in in 4th, 5
th and 6
th years, respectively.
Table 45. Cost of cultivation and Net income from guava per hacatre in Tripura.
Cost and
Income (Rs.)
Cost of cultivation on orchard establishment and Net income
from sale of fruits only by Progressive Farmer
Year
1 2 3 4 5 6
Cost A 59900 17728.5 22653.5 24907 21853.1 23303.1
Cost B 4193 1240.995 1585.745 1743.49 1529.717 1631.217
Cost C 59968 17796.5 22721.5 24975 21921.1 23371.1
Gross Income 0 0 0 60000 180000 240000
Net Income 0 0 0 35025 158078.9 216628.9
Cost and Cost of cultivation on orchard establishment and Net income
from sale of fruits and fruit plants by Progressive Farmer
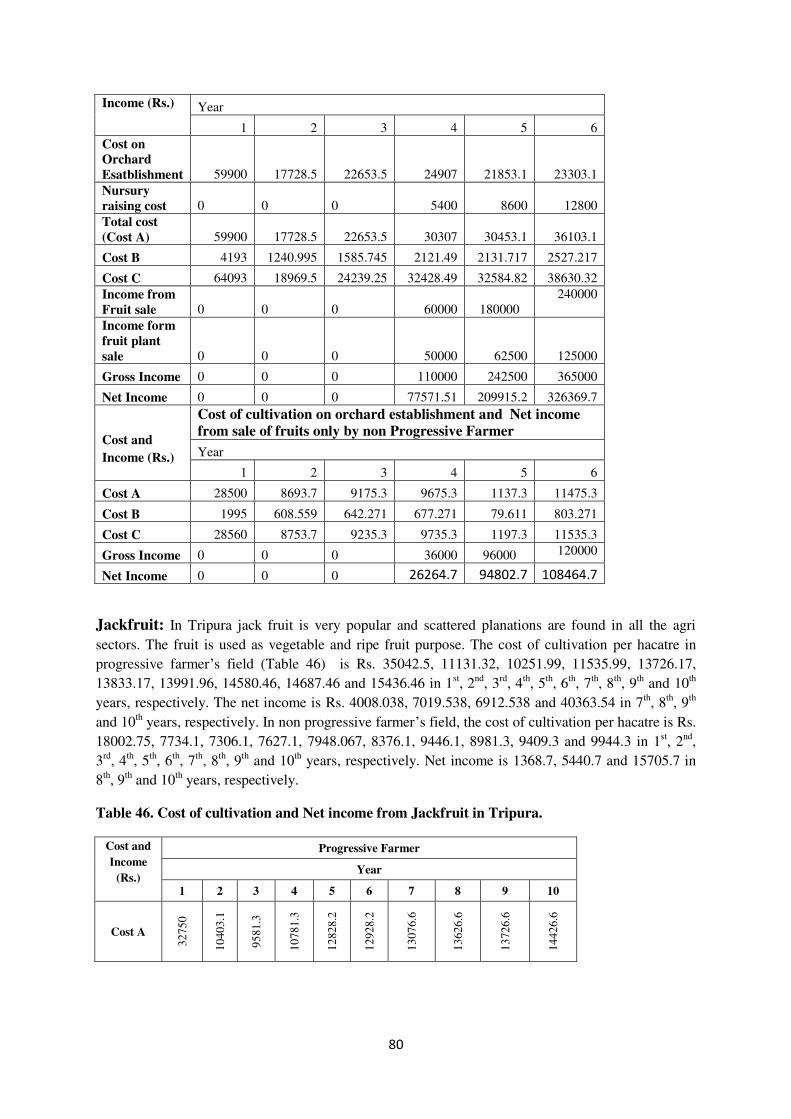
80
Income (Rs.) Year
1 2 3 4 5 6
Cost on
Orchard
Esatblishment 59900 17728.5 22653.5 24907 21853.1 23303.1
Nursury
raising cost 0 0 0 5400 8600 12800
Total cost
(Cost A) 59900 17728.5 22653.5 30307 30453.1 36103.1
Cost B 4193 1240.995 1585.745 2121.49 2131.717 2527.217
Cost C 64093 18969.5 24239.25 32428.49 32584.82 38630.32
Income from
Fruit sale 0 0 0 60000 180000
240000
Income form
fruit plant
sale 0 0 0 50000 62500 125000
Gross Income 0 0 0 110000 242500 365000
Net Income 0 0 0 77571.51 209915.2 326369.7
Cost and
Income (Rs.)
Cost of cultivation on orchard establishment and Net income
from sale of fruits only by non Progressive Farmer
Year
1 2 3 4 5 6
Cost A 28500 8693.7 9175.3 9675.3 1137.3 11475.3
Cost B 1995 608.559 642.271 677.271 79.611 803.271
Cost C 28560 8753.7 9235.3 9735.3 1197.3 11535.3
Gross Income 0 0 0 36000 96000 120000
Net Income 0 0 0 26264.7 94802.7 108464.7
Jackfruit: In Tripura jack fruit is very popular and scattered planations are found in all the agri
sectors. The fruit is used as vegetable and ripe fruit purpose. The cost of cultivation per hacatre in
progressive farmer’s field (Table 46) is Rs. 35042.5, 11131.32, 10251.99, 11535.99, 13726.17,
13833.17, 13991.96, 14580.46, 14687.46 and 15436.46 in 1st, 2
nd, 3
rd, 4
th, 5
th, 6
th, 7
th, 8
th, 9
th and 10
th
years, respectively. The net income is Rs. 4008.038, 7019.538, 6912.538 and 40363.54 in 7th, 8
th, 9
th
and 10th years, respectively. In non progressive farmer’s field, the cost of cultivation per hacatre is Rs.
18002.75, 7734.1, 7306.1, 7627.1, 7948.067, 8376.1, 9446.1, 8981.3, 9409.3 and 9944.3 in 1st, 2
nd,
3rd
, 4th, 5
th, 6
th, 7
th, 8
th, 9
th and 10
th years, respectively. Net income is 1368.7, 5440.7 and 15705.7 in
8th, 9
th and 10
th years, respectively.
Table 46. Cost of cultivation and Net income from Jackfruit in Tripura.
Cost and
Income
(Rs.)
Progressive Farmer
Year
1 2 3 4 5 6 7 8 9 10
Cost A
32
75
0
10
40
3.1
95
81
.3
10
78
1.3
12
82
8.2
12
92
8.2
13
07
6.6
13
62
6.6
13
72
6.6
14
42
6.6
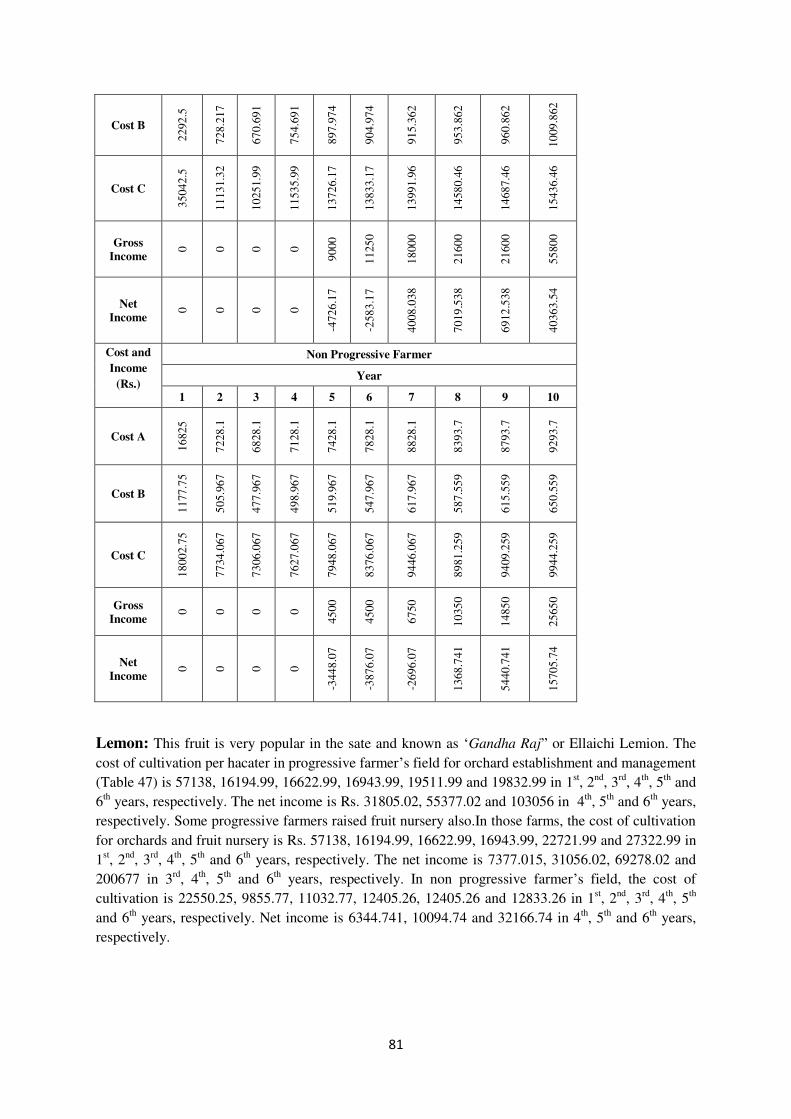
81
Cost B
22
92
.5
72
8.2
17
67
0.6
91
75
4.6
91
89
7.9
74
90
4.9
74
91
5.3
62
95
3.8
62
96
0.8
62
10
09
.862
Cost C 3
504
2.5
11
13
1.3
2
10
25
1.9
9
11
53
5.9
9
13
72
6.1
7
13
83
3.1
7
13
99
1.9
6
14
58
0.4
6
14
68
7.4
6
15
43
6.4
6
Gross
Income
0
0
0
0
90
00
11
25
0
18
00
0
21
60
0
21
60
0
55
80
0
Net
Income
0
0
0
0
-472
6.1
7
-258
3.1
7
40
08
.038
70
19
.538
69
12
.538
40
36
3.5
4
Cost and
Income
(Rs.)
Non Progressive Farmer
Year
1 2 3 4 5 6 7 8 9 10
Cost A
16
82
5
72
28
.1
68
28
.1
71
28
.1
74
28
.1
78
28
.1
88
28
.1
83
93
.7
87
93
.7
92
93
.7
Cost B
11
77
.75
50
5.9
67
47
7.9
67
49
8.9
67
51
9.9
67
54
7.9
67
61
7.9
67
58
7.5
59
61
5.5
59
65
0.5
59
Cost C
18
00
2.7
5
77
34
.067
73
06
.067
76
27
.067
79
48
.067
83
76
.067
94
46
.067
89
81
.259
94
09
.259
99
44
.259
Gross
Income
0
0
0
0
45
00
45
00
67
50
10
35
0
14
85
0
25
65
0
Net
Income
0
0
0
0
-344
8.0
7
-387
6.0
7
-269
6.0
7
13
68
.741
54
40
.741
15
70
5.7
4
Lemon: This fruit is very popular in the sate and known as ‘Gandha Raj” or Ellaichi Lemion. The
cost of cultivation per hacater in progressive farmer’s field for orchard establishment and management
(Table 47) is 57138, 16194.99, 16622.99, 16943.99, 19511.99 and 19832.99 in 1st, 2
nd, 3
rd, 4
th, 5
th and
6th years, respectively. The net income is Rs. 31805.02, 55377.02 and 103056 in 4
th, 5
th and 6
th years,
respectively. Some progressive farmers raised fruit nursery also.In those farms, the cost of cultivation
for orchards and fruit nursery is Rs. 57138, 16194.99, 16622.99, 16943.99, 22721.99 and 27322.99 in
1st, 2
nd, 3
rd, 4
th, 5
th and 6
th years, respectively. The net income is 7377.015, 31056.02, 69278.02 and
200677 in 3rd
, 4th, 5
th and 6
th years, respectively. In non progressive farmer’s field, the cost of
cultivation is 22550.25, 9855.77, 11032.77, 12405.26, 12405.26 and 12833.26 in 1st, 2
nd, 3
rd, 4
th, 5
th
and 6th years, respectively. Net income is 6344.741, 10094.74 and 32166.74 in 4
th, 5
th and 6
th years,
respectively.

82
Table 47. Cost of cultivation and net income from lemon in Tripura.
Cost and
Income (Rs.)
Cost of cultivation on orchard establishment and Net
income from sale of fruits only by Progressive Farmer
Year
1 2 3 4 5 6
Cost A 53400 15135.5 15535.5 15835.5 18235.5 18535.5
Cost B 3738 1059.485 1087.485 1108.485 1276.485 1297.485
Cost C 57138 16194.99 16622.99 16943.99 19511.99 19832.99
Gross
Income
24000 48000 72000 120000
Net Income
-33138 31805.02 55377.02 103056
Cost and
Income (Rs.)
Cost of cultivation on orchard establishment and Net
income from sale of fruits and fruit plants by Progressive
Farmer
Year
1 2 3 4 5 6
Cost of
orchard
establishment 53400 15135.5 15535.5 15835.5 18235.5 18535.5
Cost of
raising of
fruit plants 0 0 0 0
3000 7000
Cost A 53400 15135.5 15535.5 15835.5 21235.5 25535.5
Cost B 3738 1059.485 1087.485 1108.485 1486.485 1787.485
Cost C 57138 16194.99 16622.99 16943.99 22721.99 27322.99
Income from
sale of fruits
24000 48000 72000 120000
Income from
sale of fruit
plants
0 0
20000 108000
Gross
Income
24000 48000 92000 228000
Net Income
7377.015 31056.02 69278.02 200677
Cost and
Income (Rs.)
Cost of cultivation on orchard establishment and Net
income from sale of fruits only by non Progressive Farmer
Year
1 2 3 4 5 6
Cost A 21075 9211 10311 11593.7 11593.7 11993.7
Cost B 1475.25 644.77 721.77 811.559 811.559 839.559
Cost C 22550.25 9855.77 11032.77 12405.26 12405.26 12833.26
Gross
Income
7500 18750 22500 45000
Net Income
-3532.77 6344.741 10094.74 32166.74
Lime: In Tripura lime is also a popular fruit and cultivated in all the agri-sectors. In progressive
farmer’s field the cost of cultivation for eastblishment of orchard and fruit production per hacatare
(Table 48) is Rs. 38734, 12569.29, 12997.29, 14379.73, 15663.73 and 15873.99 in 1st, 2
nd, 3
rd, 4
th, 5
th
and 6th years, respectively. The net income is Rs. 18502.71, 44120.27, 141836.3 and 209126 in 4
th,
5th and 6
th years, respectively. Some progressive farmers raised fruit nursery also. In those farms, the
cost of cultivation for orchards and fruit nursery is Rs. 38734, 12569.29, 12997.29, 14379.73,
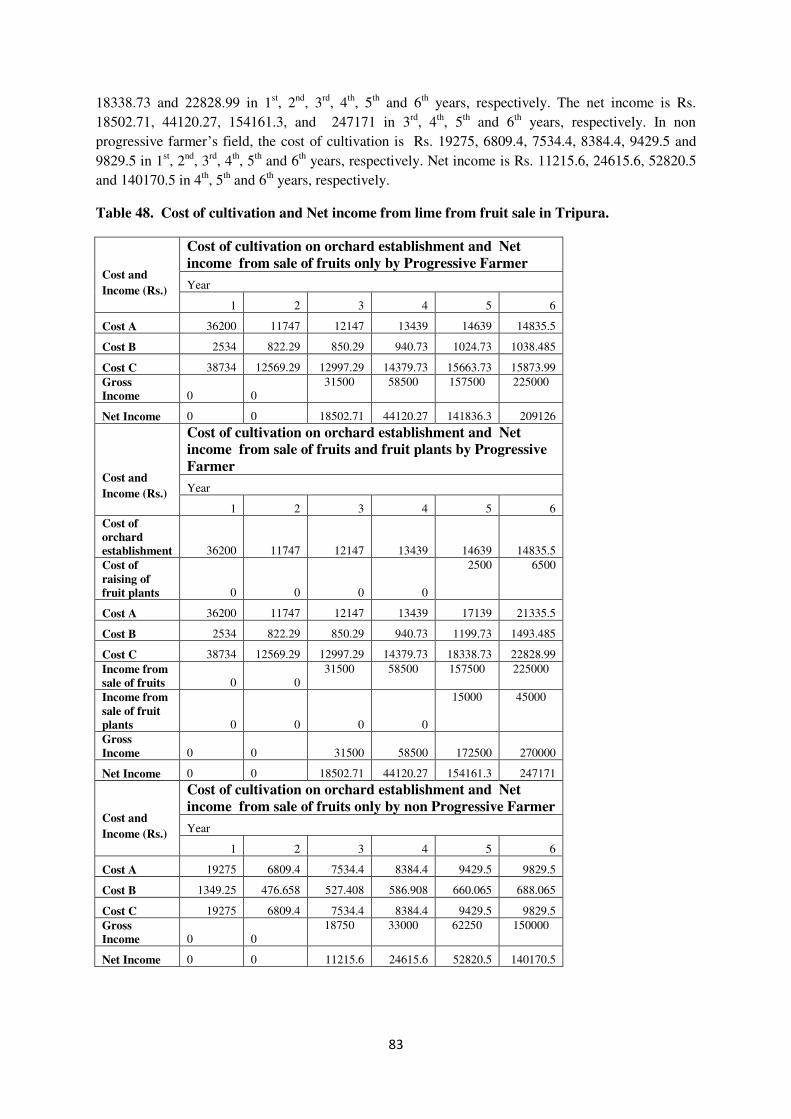
83
18338.73 and 22828.99 in 1st, 2
nd, 3
rd, 4
th, 5
th and 6
th years, respectively. The net income is Rs.
18502.71, 44120.27, 154161.3, and 247171 in 3rd
, 4th, 5
th and 6
th years, respectively. In non
progressive farmer’s field, the cost of cultivation is Rs. 19275, 6809.4, 7534.4, 8384.4, 9429.5 and
9829.5 in 1st, 2
nd, 3
rd, 4
th, 5
th and 6
th years, respectively. Net income is Rs. 11215.6, 24615.6, 52820.5
and 140170.5 in 4th, 5
th and 6
th years, respectively.
Table 48. Cost of cultivation and Net income from lime from fruit sale in Tripura.
Cost and
Income (Rs.)
Cost of cultivation on orchard establishment and Net
income from sale of fruits only by Progressive Farmer
Year
1 2 3 4 5 6
Cost A 36200 11747 12147 13439 14639 14835.5
Cost B 2534 822.29 850.29 940.73 1024.73 1038.485
Cost C 38734 12569.29 12997.29 14379.73 15663.73 15873.99
Gross
Income 0 0
31500 58500 157500 225000
Net Income 0 0 18502.71 44120.27 141836.3 209126
Cost and
Income (Rs.)
Cost of cultivation on orchard establishment and Net
income from sale of fruits and fruit plants by Progressive
Farmer
Year
1 2 3 4 5 6
Cost of
orchard
establishment 36200 11747 12147 13439 14639 14835.5
Cost of
raising of
fruit plants 0 0 0 0
2500 6500
Cost A 36200 11747 12147 13439 17139 21335.5
Cost B 2534 822.29 850.29 940.73 1199.73 1493.485
Cost C 38734 12569.29 12997.29 14379.73 18338.73 22828.99
Income from
sale of fruits 0 0
31500 58500 157500 225000
Income from
sale of fruit
plants 0 0 0 0
15000 45000
Gross
Income 0 0 31500 58500 172500 270000
Net Income 0 0 18502.71 44120.27 154161.3 247171
Cost and
Income (Rs.)
Cost of cultivation on orchard establishment and Net
income from sale of fruits only by non Progressive Farmer
Year
1 2 3 4 5 6
Cost A 19275 6809.4 7534.4 8384.4 9429.5 9829.5
Cost B 1349.25 476.658 527.408 586.908 660.065 688.065
Cost C 19275 6809.4 7534.4 8384.4 9429.5 9829.5
Gross
Income 0 0
18750 33000 62250 150000
Net Income 0 0 11215.6 24615.6 52820.5 140170.5
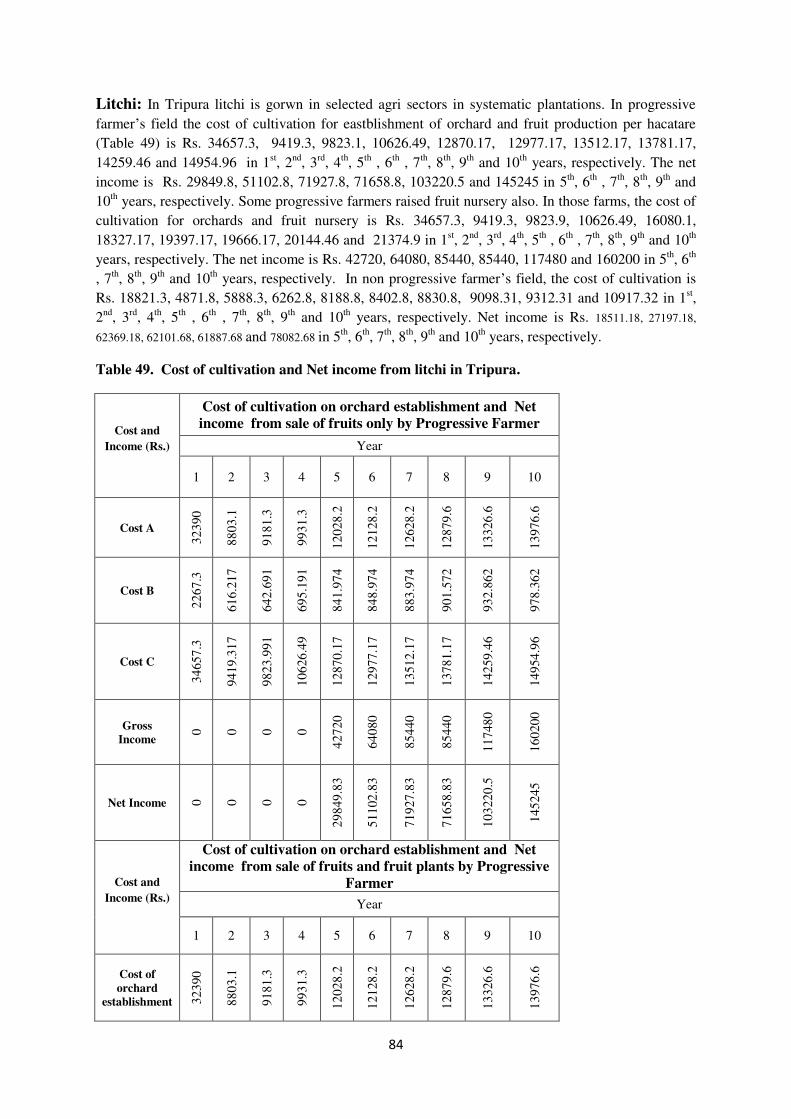
84
Litchi: In Tripura litchi is gorwn in selected agri sectors in systematic plantations. In progressive
farmer’s field the cost of cultivation for eastblishment of orchard and fruit production per hacatare
(Table 49) is Rs. 34657.3, 9419.3, 9823.1, 10626.49, 12870.17, 12977.17, 13512.17, 13781.17,
14259.46 and 14954.96 in 1st, 2
nd, 3
rd, 4
th, 5
th , 6
th , 7
th, 8
th, 9
th and 10
th years, respectively. The net
income is Rs. 29849.8, 51102.8, 71927.8, 71658.8, 103220.5 and 145245 in 5th, 6
th , 7
th, 8
th, 9
th and
10th years, respectively. Some progressive farmers raised fruit nursery also. In those farms, the cost of
cultivation for orchards and fruit nursery is Rs. 34657.3, 9419.3, 9823.9, 10626.49, 16080.1,
18327.17, 19397.17, 19666.17, 20144.46 and 21374.9 in 1st, 2
nd, 3
rd, 4
th, 5
th , 6
th , 7
th, 8
th, 9
th and 10
th
years, respectively. The net income is Rs. 42720, 64080, 85440, 85440, 117480 and 160200 in 5th, 6
th
, 7th, 8
th, 9
th and 10
th years, respectively. In non progressive farmer’s field, the cost of cultivation is
Rs. 18821.3, 4871.8, 5888.3, 6262.8, 8188.8, 8402.8, 8830.8, 9098.31, 9312.31 and 10917.32 in 1st,
2nd
, 3rd
, 4th, 5
th , 6
th , 7
th, 8
th, 9
th and 10
th years, respectively. Net income is Rs. 18511.18, 27197.18,
62369.18, 62101.68, 61887.68 and 78082.68 in 5th, 6
th, 7
th, 8
th, 9
th and 10
th years, respectively.
Table 49. Cost of cultivation and Net income from litchi in Tripura.
Cost and
Income (Rs.)
Cost of cultivation on orchard establishment and Net
income from sale of fruits only by Progressive Farmer
Year
1 2 3 4 5 6 7 8 9 10
Cost A
32
390
88
03
.1
91
81
.3
99
31
.3
12
028
.2
12
128
.2
12
628
.2
12
879
.6
13
326
.6
13
976
.6
Cost B
22
67
.3
61
6.2
17
64
2.6
91
69
5.1
91
84
1.9
74
84
8.9
74
88
3.9
74
90
1.5
72
93
2.8
62
97
8.3
62
Cost C
34
657
.3
94
19
.31
7
98
23
.99
1
10
626
.49
12
870
.17
12
977
.17
13
512
.17
13
781
.17
14
259
.46
14
954
.96
Gross
Income
0
0
0
0
42
720
64
080
85
440
85
440
11
748
0
16
020
0
Net Income 0
0
0
0
29
849
.83
51
102
.83
71
927
.83
71
658
.83
10
322
0.5
14
524
5
Cost and
Income (Rs.)
Cost of cultivation on orchard establishment and Net
income from sale of fruits and fruit plants by Progressive
Farmer
Year
1 2 3 4 5 6 7 8 9 10
Cost of
orchard
establishment 32
390
88
03
.1
91
81
.3
99
31
.3
12
028
.2
12
128
.2
12
628
.2
12
879
.6
13
326
.6
13
976
.6
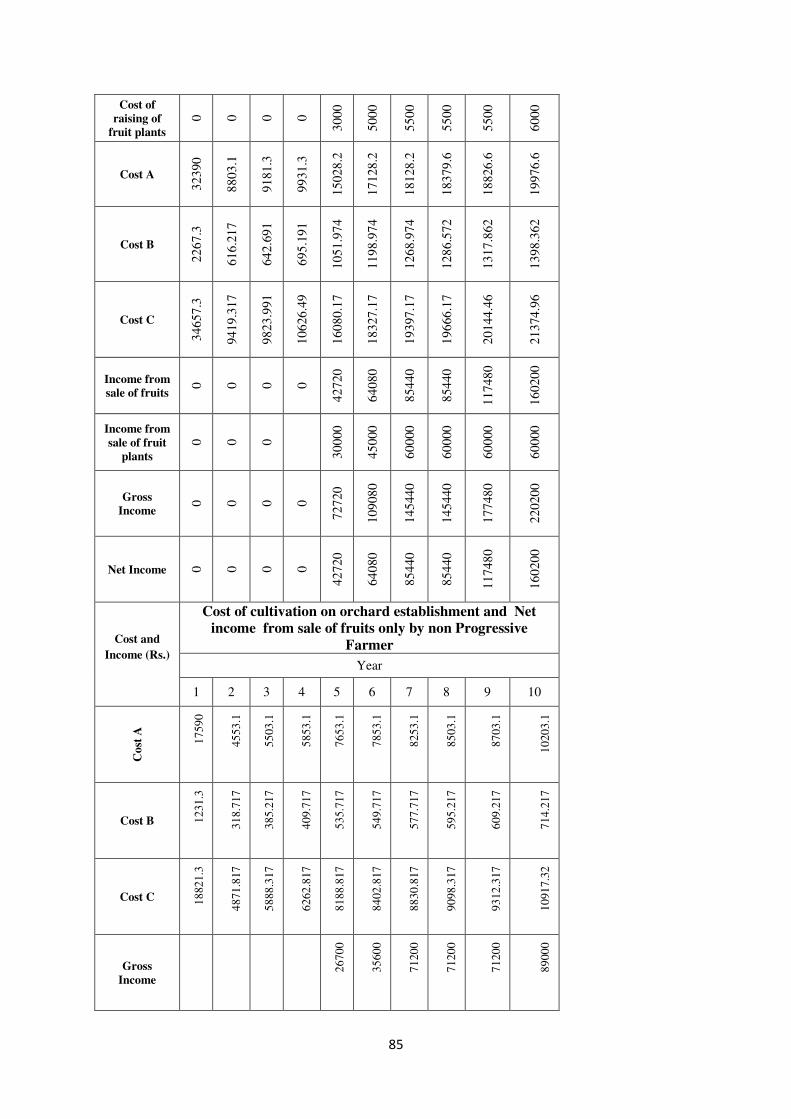
85
Cost of
raising of
fruit plants
0
0
0
0
30
00
50
00
55
00
55
00
55
00
60
00
Cost A
32
390
88
03
.1
91
81
.3
99
31
.3
15
028
.2
17
128
.2
18
128
.2
18
379
.6
18
826
.6
19
976
.6
Cost B
22
67
.3
61
6.2
17
64
2.6
91
69
5.1
91
10
51
.97
4
11
98
.97
4
12
68
.97
4
12
86
.57
2
13
17
.86
2
13
98
.36
2
Cost C
34
657
.3
94
19
.31
7
98
23
.99
1
10
626
.49
16
080
.17
18
327
.17
19
397
.17
19
666
.17
20
144
.46
21
374
.96
Income from
sale of fruits
0
0
0
0
42
720
64
080
85
440
85
440
11
748
0
16
020
0
Income from
sale of fruit
plants
0
0
0
30
000
45
000
60
000
60
000
60
000
60
000
Gross
Income
0
0
0
0
72
720
10
908
0
14
544
0
14
544
0
17
748
0
22
020
0
Net Income 0
0
0
0
42
720
64
080
85
440
85
440
11
748
0
16
020
0
Cost and
Income (Rs.)
Cost of cultivation on orchard establishment and Net
income from sale of fruits only by non Progressive
Farmer
Year
1 2 3 4 5 6 7 8 9 10
Co
st A
17
59
0
45
53
.1
55
03
.1
58
53
.1
76
53
.1
78
53
.1
82
53
.1
85
03
.1
87
03
.1
10
20
3.1
Cost B 12
31
.3
31
8.7
17
38
5.2
17
40
9.7
17
53
5.7
17
54
9.7
17
57
7.7
17
59
5.2
17
60
9.2
17
71
4.2
17
Cost C 18
82
1.3
48
71
.817
58
88
.317
62
62
.817
81
88
.817
84
02
.817
88
30
.817
90
98
.317
93
12
.317
10
91
7.3
2
Gross
Income
26
70
0
35
60
0
71
20
0
71
20
0
71
20
0
89
00
0

86
Net Income
18
51
1.1
8
27
19
7.1
8
62
36
9.1
8
62
10
1.6
8
61
88
7.6
8
78
08
2.6
8
Mosambi: In Tripura mosambi is gorwn in many of the agri sectors in systematic plantations. In
progressive farmer’s field the cost of cultivation for eastblishment of orchard and fruit production per
hactare (Table 50) is Rs. 78217, 22012.04, 21988.29, 26943.88, 47873.3, 49651.64, 57675.57 and
57996.57 in 1st, 2
nd, 3
rd, 4
th, 5
th , 6
th , 7
th and 8
th years, respectively. The net income is Rs. 14526.7,
63148.36, 386324.4 and 578003.4 in 5th, 6
th , 7
th, and 8
th years, respectively. Some progressive
farmers raised fruit nursery also. In those farms, the cost of cultivation for orchards and fruit nursery
is Rs. 78217, 22012.04, 21988.29, 29618.88, 53223.3, 62491.64, 70515.57 and 70836.57 in 1st, 2
nd,
3rd
, 4th, 5
th , 6
th , 7
th and 8
th, years, respectively. The net income is Rs. 20781.12, 84176.7, 200308.4,
523484.4 and 715163.4 in 4th, 5
th, 6
th , 7
th, 8
th, years, respectively. In non progressive farmer’s field,
the cost of cultivation is Rs. 29478.5, 8681.98, 9056.48, 10027.72, 12347.27, 12507.77, 1372.5 and
13463.6 in 1st, 2
nd, 3
rd, 4
th, 5
th , 6
th , 7
th, and 8
th years, respectively. Net income is Rs. 6010.0, 31737.86
and 68808.86 in 5th, 6
th, 7
th and 8
th years, respectively.
Table 50. Cost of cultivation and net income from mosambi per hectare in Tripura.
Cost and
Income (Rs.)
Cost of cultivation on orchard establishment and Net income from sale of
fruits only by Progressive Farmer
Year
1 2 3 4 5 6 7 8
Cost A 73100 20572 20549.8 25181.2 44741.4 46403.4 53902.4 54202.4
Cost B 5117 1440.04 1438.486 1762.684 3131.898 3248.238 3773.168 3794.168
Cost C 78217 22012.04 21988.29 26943.88 47873.3 49651.64 57675.57 57996.57
Gross Income
20400 62400 112800 444000 636000
Net Income
-6543.88 14526.7 63148.36 386324.4 578003.4
Cost and
Income (Rs.)
Cost of cultivation on orchard establishment and Net income from sale of
fruits and fruit plants by Progressive Farmer
Year
1 2 3 4 5 6 7 8
Cost of
orchard
establishment 73100 20572 20549.8 25181.2 44741.4 46403.4 53902.4 54202.4
Cost of
raising of
fruit plants 0 0 0
2500 5000 12000 12000 12000
Cost A 73100 20572 20549.8 27681.2 49741.4 58403.4 65902.4 66202.4
Cost B 5117 1440.04 1438.486 1937.684 3481.898 4088.238 4613.168 4634.168
Cost C 78217 22012.04 21988.29 29618.88 53223.3 62491.64 70515.57 70836.57
Income from
sale of fruits 0 0 0
20400 62400 112800 444000 636000
Income from
sale of fruit
plants 0 0 0
30000 75000 150000 150000 150000
Gross Income 0 0 0 50400 137400 262800 594000 786000
Net Income 0 0 0 20781.12 84176.7 200308.4 523484.4 715163.4
Cost and Cost of cultivation on orchard establishment and Net income from sale of
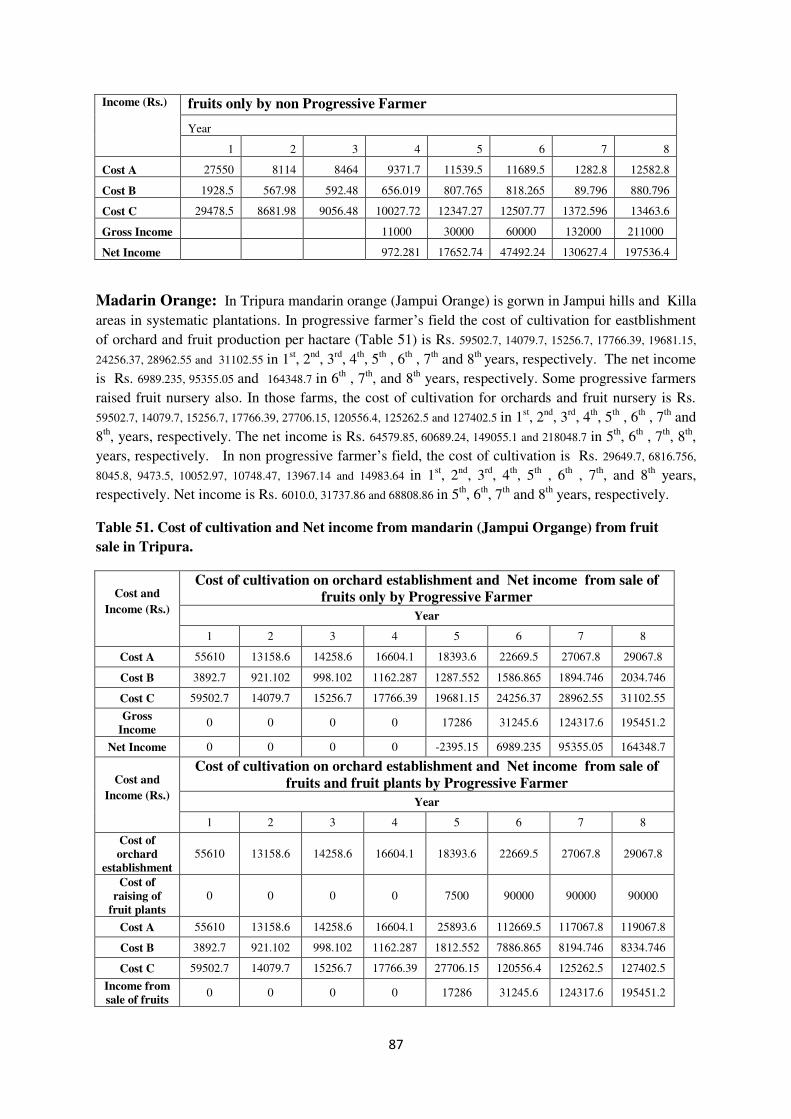
87
Income (Rs.) fruits only by non Progressive Farmer
Year
1 2 3 4 5 6 7 8
Cost A 27550 8114 8464 9371.7 11539.5 11689.5 1282.8 12582.8
Cost B 1928.5 567.98 592.48 656.019 807.765 818.265 89.796 880.796
Cost C 29478.5 8681.98 9056.48 10027.72 12347.27 12507.77 1372.596 13463.6
Gross Income
11000 30000 60000 132000 211000
Net Income
972.281 17652.74 47492.24 130627.4 197536.4
Madarin Orange: In Tripura mandarin orange (Jampui Orange) is gorwn in Jampui hills and Killa
areas in systematic plantations. In progressive farmer’s field the cost of cultivation for eastblishment
of orchard and fruit production per hactare (Table 51) is Rs. 59502.7, 14079.7, 15256.7, 17766.39, 19681.15,
24256.37, 28962.55 and 31102.55 in 1st, 2
nd, 3
rd, 4
th, 5
th , 6
th , 7
th and 8
th years, respectively. The net income
is Rs. 6989.235, 95355.05 and 164348.7 in 6th , 7
th, and 8
th years, respectively. Some progressive farmers
raised fruit nursery also. In those farms, the cost of cultivation for orchards and fruit nursery is Rs.
59502.7, 14079.7, 15256.7, 17766.39, 27706.15, 120556.4, 125262.5 and 127402.5 in 1st, 2
nd, 3
rd, 4
th, 5
th , 6
th , 7
th and
8th, years, respectively. The net income is Rs. 64579.85, 60689.24, 149055.1 and 218048.7 in 5
th, 6
th , 7
th, 8
th,
years, respectively. In non progressive farmer’s field, the cost of cultivation is Rs. 29649.7, 6816.756,
8045.8, 9473.5, 10052.97, 10748.47, 13967.14 and 14983.64 in 1st, 2
nd, 3
rd, 4
th, 5
th , 6
th , 7
th, and 8
th years,
respectively. Net income is Rs. 6010.0, 31737.86 and 68808.86 in 5th, 6
th, 7
th and 8
th years, respectively.
Table 51. Cost of cultivation and Net income from mandarin (Jampui Organge) from fruit
sale in Tripura.
Cost and
Income (Rs.)
Cost of cultivation on orchard establishment and Net income from sale of
fruits only by Progressive Farmer
Year
1 2 3 4 5 6 7 8
Cost A 55610 13158.6 14258.6 16604.1 18393.6 22669.5 27067.8 29067.8
Cost B 3892.7 921.102 998.102 1162.287 1287.552 1586.865 1894.746 2034.746
Cost C 59502.7 14079.7 15256.7 17766.39 19681.15 24256.37 28962.55 31102.55
Gross
Income 0 0 0 0 17286 31245.6 124317.6 195451.2
Net Income 0 0 0 0 -2395.15 6989.235 95355.05 164348.7
Cost and
Income (Rs.)
Cost of cultivation on orchard establishment and Net income from sale of
fruits and fruit plants by Progressive Farmer
Year
1 2 3 4 5 6 7 8
Cost of
orchard
establishment
55610 13158.6 14258.6 16604.1 18393.6 22669.5 27067.8 29067.8
Cost of
raising of
fruit plants
0 0 0 0 7500 90000 90000 90000
Cost A 55610 13158.6 14258.6 16604.1 25893.6 112669.5 117067.8 119067.8
Cost B 3892.7 921.102 998.102 1162.287 1812.552 7886.865 8194.746 8334.746
Cost C 59502.7 14079.7 15256.7 17766.39 27706.15 120556.4 125262.5 127402.5
Income from
sale of fruits 0 0 0 0 17286 31245.6 124317.6 195451.2
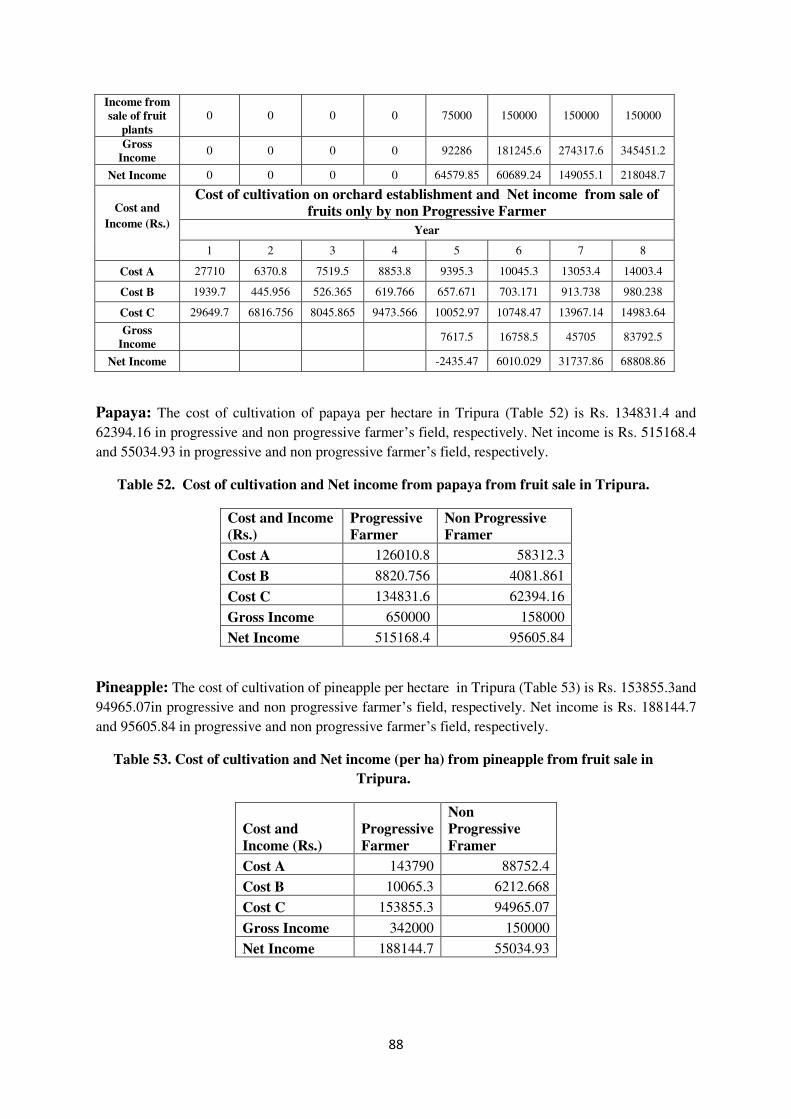
88
Income from
sale of fruit
plants
0 0 0 0 75000 150000 150000 150000
Gross
Income 0 0 0 0 92286 181245.6 274317.6 345451.2
Net Income 0 0 0 0 64579.85 60689.24 149055.1 218048.7
Cost and
Income (Rs.)
Cost of cultivation on orchard establishment and Net income from sale of
fruits only by non Progressive Farmer
Year
1 2 3 4 5 6 7 8
Cost A 27710 6370.8 7519.5 8853.8 9395.3 10045.3 13053.4 14003.4
Cost B 1939.7 445.956 526.365 619.766 657.671 703.171 913.738 980.238
Cost C 29649.7 6816.756 8045.865 9473.566 10052.97 10748.47 13967.14 14983.64
Gross
Income 7617.5 16758.5 45705 83792.5
Net Income
-2435.47 6010.029 31737.86 68808.86
Papaya: The cost of cultivation of papaya per hectare in Tripura (Table 52) is Rs. 134831.4 and
62394.16 in progressive and non progressive farmer’s field, respectively. Net income is Rs. 515168.4
and 55034.93 in progressive and non progressive farmer’s field, respectively.
Table 52. Cost of cultivation and Net income from papaya from fruit sale in Tripura.
Cost and Income
(Rs.)
Progressive
Farmer
Non Progressive
Framer
Cost A 126010.8 58312.3
Cost B 8820.756 4081.861
Cost C 134831.6 62394.16
Gross Income 650000 158000
Net Income 515168.4 95605.84
Pineapple: The cost of cultivation of pineapple per hectare in Tripura (Table 53) is Rs. 153855.3and
94965.07in progressive and non progressive farmer’s field, respectively. Net income is Rs. 188144.7
and 95605.84 in progressive and non progressive farmer’s field, respectively.
Table 53. Cost of cultivation and Net income (per ha) from pineapple from fruit sale in
Tripura.
Cost and
Income (Rs.)
Progressive
Farmer
Non
Progressive
Framer
Cost A 143790 88752.4
Cost B 10065.3 6212.668
Cost C 153855.3 94965.07
Gross Income 342000 150000
Net Income 188144.7 55034.93

89
5. Summary and Conclusion
The analysis showed that paddy is the principal crop raised in the command and non -
command areas. It showed that the percentage of area under paddy cultivation in the
command area is higher than in the non -command area as a result of assured water. Among
the field crops, the percentage of area under Paddy cultivation is the highest followed by
sesame, Maize, Blackgram, Mustard, Lentil, Ground nut, Arhar and among the vegetables,
Potato, okra, tomato, brinjal, chilly, cucurbites, Leafy vegetables, colocassia, carrot, Radish,
cole crops, etc.
Horticulture sector has been the single largest provider of employment to the rural
people of the State. Among the important horticultural crops Mango (var. Amrapali),
mosambi, mandarin orange, lime, pineapple, banana, jackfruit etc. Grown in best Tripura is
widely acclaimed as the best in the country.At present, some orchard growers of tripura
replaced the fruit crops like orange, mango, Mosambi etc by arecanut.In Jampui agri-sec, this
condition is happing now-a- days.
The cost of cultivation of cereal crops showed that higher BC ratios were recorded in ground
nut, followed by lentil. Wheras, paddy gave only 1.34. However, paddy is the prime crop in Tripura
cultivated extensively. Technological interventions are required for increasing the net profit from
paddy such as higher yielding varieties or hybrids, SRI and soil health card based fertilizer and
integrated pest management.
Vegetable cultivation is profitable in Tripura and farmers have adopted high yielgding
varieties as per the recommendations in the state. Farmers has also adopted recommended fertilizer
schedule. However, non progressive farmers do not follwe the improved package of practices for
higher production. Systamatic plantations of fruit crops are found in the state in all the agri sectors.
Under various developmetal schemes systematic orchards have been established in selected farmer’s
field especially for mango, mosambi, banana, ber, guava, papaya and cashewnut. Plantations of
pineppale are found in al most all the agri sectors. Whereas, mandarin orange orchards are restricted
in Jampui hill and Kill agri subdivisions. The cost of cultivation for fruit production is high in the
initial years without any return, but in the bearing states it has been estimated that the net retun is very
high especially in progressive farmer’s orchards. This is because these farmers have adopted the
improved production technologies.

1
Annexure I
Cost of cultivation and net return from cereal and vegetable crops in different district of
Tripura
Table 54. Cost of cultivation and net return from paddy in different district of Tripura.
Cro
ps:
Pa
dd
y
Kh
ow
ai
Wes
t
Sep
ah
ija
la
Go
ma
ti
So
uth
Un
ok
oti
No
rth
Dh
ala
i
Hea
ds
Kh
ow
ai
Tel
iam
ura
Tu
lasi
kh
ar
Av
era
ge
Mo
han
pu
r
Jir
an
ia
Du
kli
Av
era
ge
Bis
ha
lga
rh
Mel
ag
ha
r
Av
era
ge
Ma
tab
ari
Am
arp
ur
Av
era
ge
Bel
on
ia
Sa
bro
om
Bo
ga
fa
Av
era
ge
Ku
ma
rgh
at
Ka
nch
an
pu
r
Ka
da
mta
la
Pa
nis
ag
ar
Av
era
ge
Ga
nd
ach
erra
Ch
aw
man
u
Sa
lem
a
Av
era
ge
Co
st A
43
07
8
46
93
1
47
58
9
45
86
6
47
38
5
48
03
0
51
34
8
48
92
1
50
71
2
47
51
9
49
11
6
46
66
2
52
21
3
49
43
8
45
09
8
46
98
6
49
72
1
47
26
8
49
78
8
46
41
3
48
46
0
49
63
6
48
17
0
44
59
5
45
20
6
48
72
5
46
17
5
Co
st B
92
10
27
54
33
31
50
98
33
17
33
62
35
94
34
24
35
50
33
26
34
38
24
33
36
55
30
44
30
63
32
89
34
80
32
77
34
85
32
60
34
10
34
75
33
82
31
22
81
80
34
11
49
04
Co
st C
53
96
8
49
68
5
50
92
1
51
52
5
50
70
2
51
39
2
54
94
2
52
34
5
54
26
1
50
84
5
52
55
3
49
09
5
55
86
8
52
48
2
48
16
0
46
94
3
53
20
2
49
43
5
53
27
3
49
67
3
51
87
0
53
11
1
51
55
1
47
71
6
55
87
1
52
13
6
51
90
8
Gro
ss i
nco
me
60
82
1
67
53
6
70
49
4
66
28
4
58
82
0
72
71
4
69
48
1
67
00
5
66
66
1
75
13
6
70
89
9
69
11
1
68
16
9
68
64
0
70
71
1
70
98
6
66
95
7
69
55
1
73
92
0
72
12
0
71
41
1
78
82
5
74
11
9
75
24
4
63
92
2
66
55
4
68
57
3
Net
in
com
e
13
19
8
17
85
0
19
57
3
16
87
4
81
18
21
32
2
14
53
9
14
66
0
12
40
0
24
29
1
18
34
6
20
01
5
12
30
1
16
15
8
22
55
1
20
96
2
13
75
5
19
08
9
20
64
7
22
44
7
19
54
1
25
71
4
22
56
7
27
52
8
23
05
1
14
41
8
21
66
6
BC
Ra
tio
1.1
3
1.3
6
1.3
8
1.2
9
1.1
6
1.4
1
1.2
6
1.2
8
1.2
3
1.4
8
1.3
6
1.4
1
1.2
2
1.3
2
1.4
7
1.5
1
1.2
6
1.4
1
1.3
9
1.4
5
1.3
8
1.4
8
1.4
4
1.5
8
1.1
4
1.2
8
1.3
3
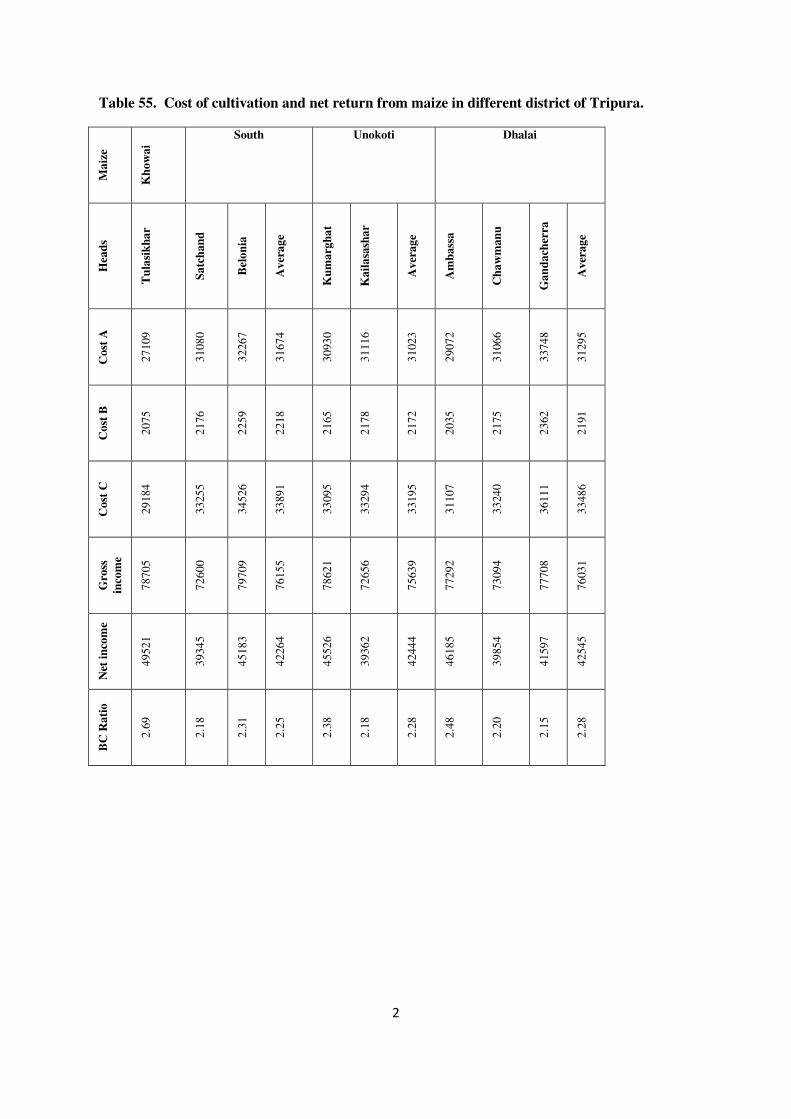
2
Table 55. Cost of cultivation and net return from maize in different district of Tripura. M
aiz
e
Kh
ow
ai
South Unokoti Dhalai
Hea
ds
Tu
lasi
kh
ar
Sa
tch
an
d
Bel
on
ia
Av
era
ge
Ku
ma
rgh
at
Ka
ila
sash
ar
Av
era
ge
Am
ba
ssa
Ch
aw
man
u
Ga
nd
ach
erra
Av
era
ge
Co
st A
27
10
9
31
08
0
32
26
7
31
67
4
30
93
0
31
11
6
31
02
3
29
07
2
31
06
6
33
74
8
31
29
5
Co
st B
20
75
21
76
22
59
22
18
21
65
21
78
21
72
20
35
21
75
23
62
21
91
Co
st C
29
18
4
33
25
5
34
52
6
33
89
1
33
09
5
33
29
4
33
19
5
31
10
7
33
24
0
36
11
1
33
48
6
Gro
ss
inco
me
78
70
5
72
60
0
79
70
9
76
15
5
78
62
1
72
65
6
75
63
9
77
29
2
73
09
4
77
70
8
76
03
1
Net
in
com
e
49
52
1
39
34
5
45
18
3
42
26
4
45
52
6
39
36
2
42
44
4
46
18
5
39
85
4
41
59
7
42
54
5
BC
Ra
tio
2.6
9
2.1
8
2.3
1
2.2
5
2.3
8
2.1
8
2.2
8
2.4
8
2.2
0
2.1
5
2.2
8

3
Table 56. Cost of cultivation and net return from ground nut in different district of Tripura. G
rou
nd
nu
t Khowai West Gomati South Dhalai
Hea
ds
Kh
ow
ai
Tel
iam
ura
Av
era
ge
Mo
han
pu
r
Am
arp
ur
Bel
on
ia
Sa
tch
an
d
Av
era
ge
Sa
lem
a
Co
st A
36
23
6
56
70
2
46
46
9
45
96
3
40
84
6
40
07
9
45
45
7
42
76
8
46
46
9
Co
st B
25
37
39
69
32
53
32
17
28
59
28
06
31
82
29
94
32
53
Co
st C
38
77
3
60
67
1
49
72
2
49
18
0
43
70
6
42
88
4
48
63
9
45
76
2
49
72
2
Gro
ss
inco
me
21
23
96
22
23
96
21
73
96
22
05
17
21
80
17
22
13
92
22
36
39
22
25
16
21
73
96
Net
in
com
e
17
36
23
16
17
25
16
76
74
17
13
37
17
43
12
17
85
07
17
50
00
17
67
54
16
76
74
BC
Ra
tio
5.4
7
3.6
6
4.5
7
4.4
8
4.9
8
5.1
6
4.5
9
4.8
8
4.3
7
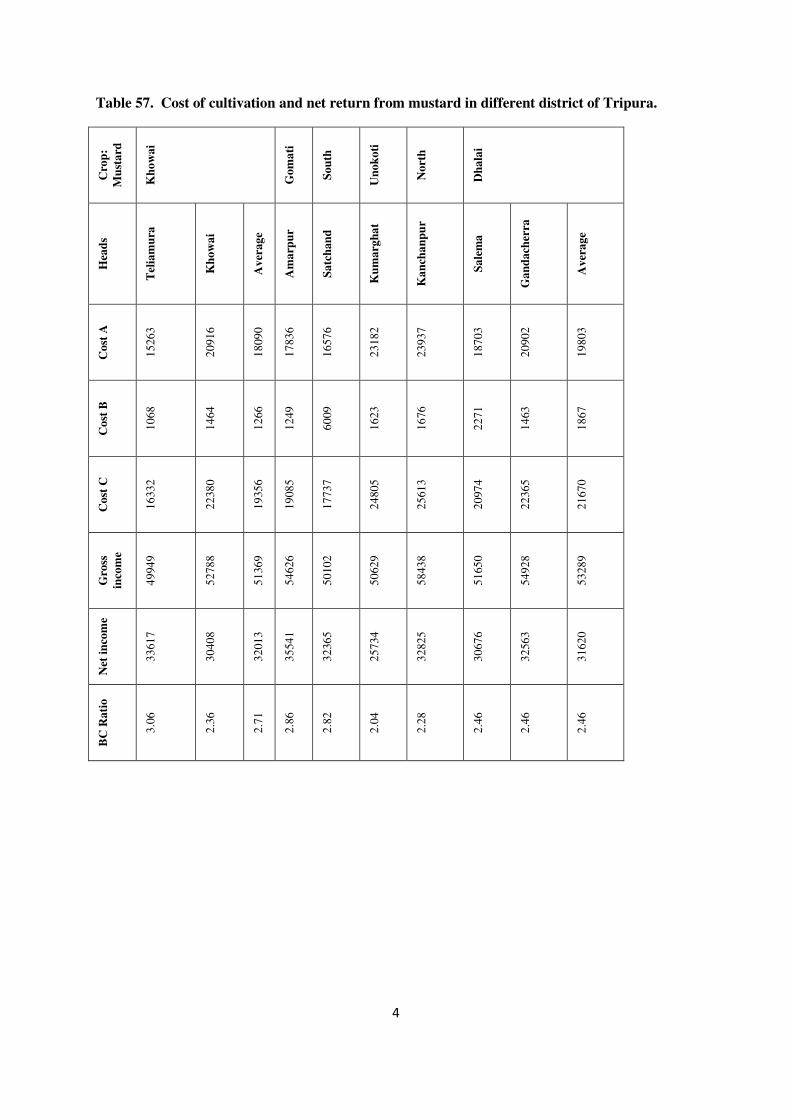
4
Table 57. Cost of cultivation and net return from mustard in different district of Tripura. C
rop
:
Mu
sta
rd
Kh
ow
ai
Go
ma
ti
So
uth
Un
ok
oti
No
rth
Dh
ala
i
Hea
ds
Tel
iam
ura
Kh
ow
ai
Av
era
ge
Am
arp
ur
Sa
tch
an
d
Ku
ma
rgh
at
Ka
nch
an
pu
r
Sa
lem
a
Ga
nd
ach
erra
Av
era
ge
Co
st A
15
26
3
20
91
6
18
09
0
17
83
6
16
57
6
23
18
2
23
93
7
18
70
3
20
90
2
19
80
3
Co
st B
10
68
14
64
12
66
12
49
60
09
16
23
16
76
22
71
14
63
18
67
Co
st C
16
33
2
22
38
0
19
35
6
19
08
5
17
73
7
24
80
5
25
61
3
20
97
4
22
36
5
21
67
0
Gro
ss
inco
me
49
94
9
52
78
8
51
36
9
54
62
6
50
10
2
50
62
9
58
43
8
51
65
0
54
92
8
53
28
9
Net
in
com
e
33
61
7
30
40
8
32
01
3
35
54
1
32
36
5
25
73
4
32
82
5
30
67
6
32
56
3
31
62
0
BC
Ra
tio
3.0
6
2.3
6
2.7
1
2.8
6
2.8
2
2.0
4
2.2
8
2.4
6
2.4
6
2.4
6
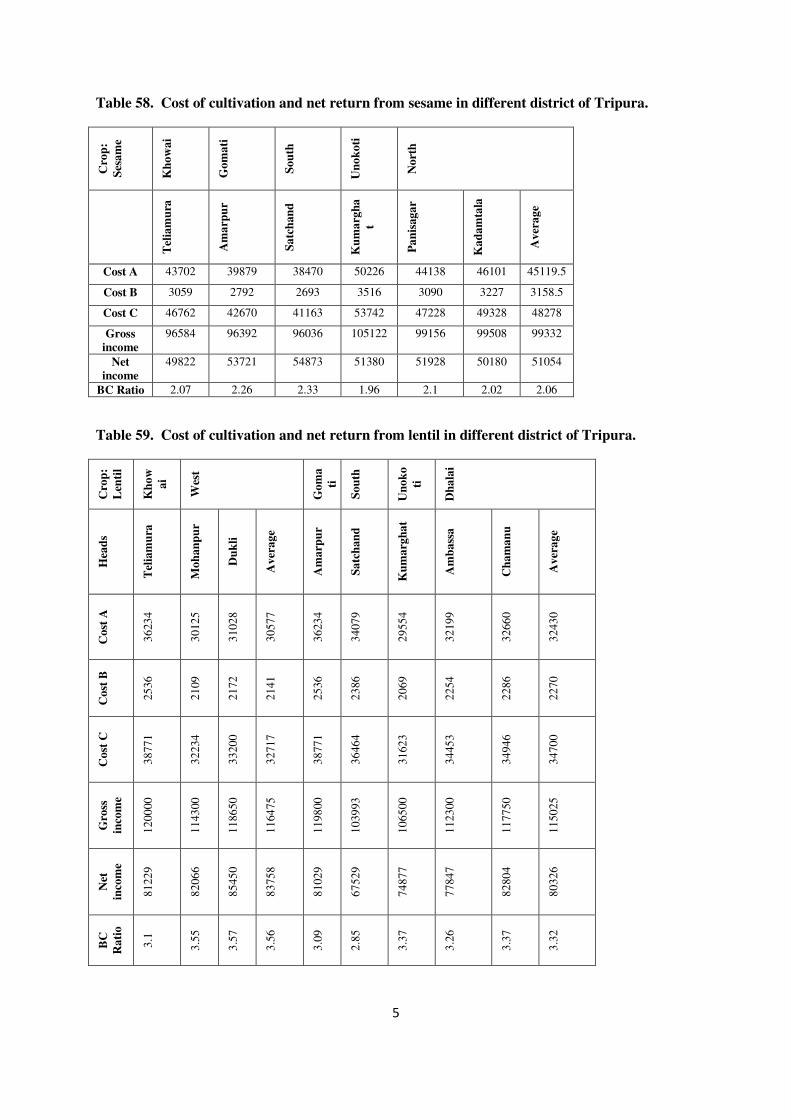
5
Table 58. Cost of cultivation and net return from sesame in different district of Tripura. C
rop
:
Ses
am
e
Kh
ow
ai
Go
ma
ti
So
uth
Un
ok
oti
No
rth
Tel
iam
ura
Am
arp
ur
Sa
tch
an
d
Ku
ma
rgh
a
t
Pa
nis
ag
ar
Ka
da
mta
la
Av
era
ge
Cost A 43702 39879 38470 50226 44138 46101 45119.5
Cost B 3059 2792 2693 3516 3090 3227 3158.5
Cost C 46762 42670 41163 53742 47228 49328 48278
Gross
income
96584 96392 96036 105122 99156 99508 99332
Net
income
49822 53721 54873 51380 51928 50180 51054
BC Ratio 2.07 2.26 2.33 1.96 2.1 2.02 2.06
Table 59. Cost of cultivation and net return from lentil in different district of Tripura.
Cro
p:
Len
til
Kh
ow
ai
Wes
t
Go
ma
ti
So
uth
Un
ok
o
ti
Dh
ala
i
Hea
ds
Tel
iam
ura
Mo
han
pu
r
Du
kli
Av
era
ge
Am
arp
ur
Sa
tch
an
d
Ku
ma
rgh
at
Am
ba
ssa
Ch
am
an
u
Av
era
ge
Co
st A
36
23
4
30
12
5
31
02
8
30
57
7
36
23
4
34
07
9
29
55
4
32
19
9
32
66
0
32
43
0
Co
st B
25
36
21
09
21
72
21
41
25
36
23
86
20
69
22
54
22
86
22
70
Co
st C
38
77
1
32
23
4
33
20
0
32
71
7
38
77
1
36
46
4
31
62
3
34
45
3
34
94
6
34
70
0
Gro
ss
inco
me
12
00
00
11
43
00
11
86
50
11
64
75
11
98
00
10
39
93
10
65
00
11
23
00
11
77
50
11
50
25
Net
inco
me
81
22
9
82
06
6
85
45
0
83
75
8
81
02
9
67
52
9
74
87
7
77
84
7
82
80
4
80
32
6
BC
Ra
tio
3.1
3.5
5
3.5
7
3.5
6
3.0
9
2.8
5
3.3
7
3.2
6
3.3
7
3.3
2
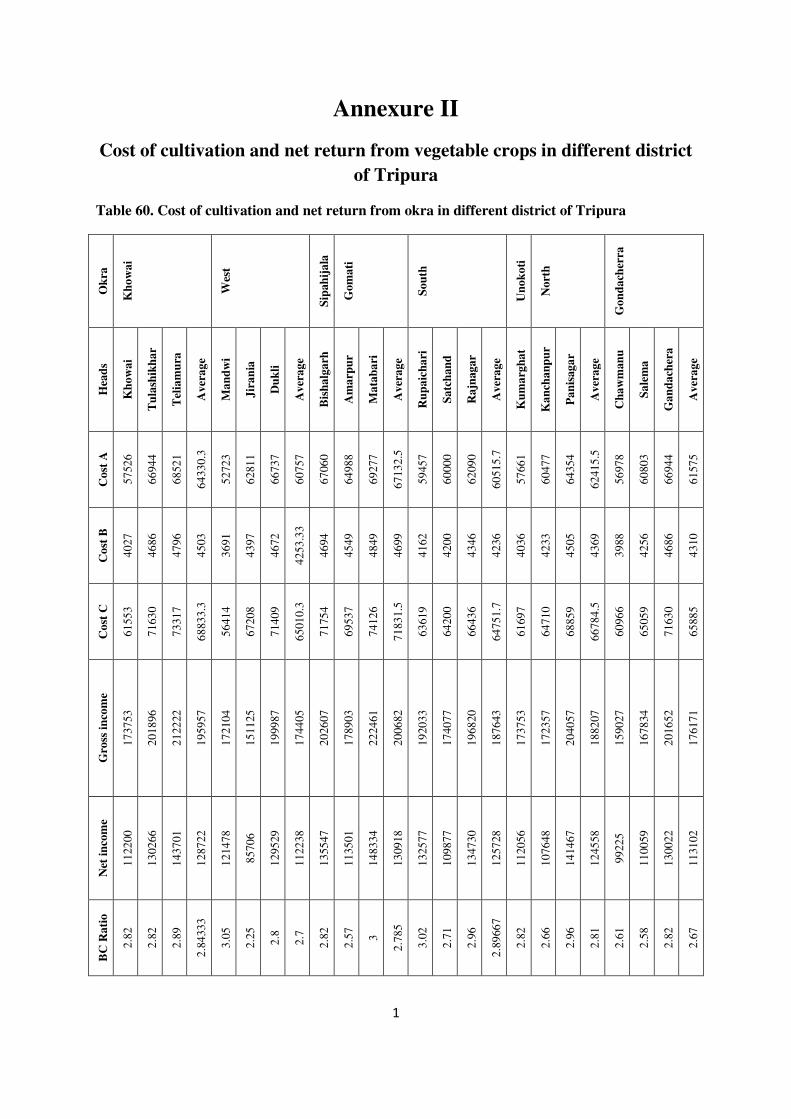
1
Annexure II
Cost of cultivation and net return from vegetable crops in different district
of Tripura
Table 60. Cost of cultivation and net return from okra in different district of Tripura
Ok
ra
Kh
ow
ai
Wes
t
Sip
ah
ija
la
Go
ma
ti
So
uth
Un
ok
oti
No
rth
Go
nd
ach
erra
Hea
ds
Kh
ow
ai
Tu
lash
ikh
ar
Tel
iam
ura
Av
era
ge
Ma
nd
wi
Jir
an
ia
Du
kli
Av
era
ge
Bis
ha
lga
rh
Am
arp
ur
Ma
tab
ari
Av
era
ge
Ru
pa
ich
ari
Sa
tch
an
d
Ra
jnag
ar
Av
era
ge
Ku
ma
rgh
at
Ka
nch
an
pu
r
Pa
nis
ag
ar
Av
era
ge
Ch
aw
man
u
Sa
lem
a
Ga
nd
ach
era
Av
era
ge
Co
st A
57
52
6
66
94
4
68
52
1
64
33
0.3
52
72
3
62
81
1
66
73
7
60
75
7
67
06
0
64
98
8
69
27
7
67
13
2.5
59
45
7
60
00
0
62
09
0
60
51
5.7
57
66
1
60
47
7
64
35
4
62
41
5.5
56
97
8
60
80
3
66
94
4
61
57
5
Co
st B
40
27
46
86
47
96
45
03
36
91
43
97
46
72
42
53
.33
46
94
45
49
48
49
46
99
41
62
42
00
43
46
42
36
40
36
42
33
45
05
43
69
39
88
42
56
46
86
43
10
Co
st C
61
55
3
71
63
0
73
31
7
68
83
3.3
56
41
4
67
20
8
71
40
9
65
01
0.3
71
75
4
69
53
7
74
12
6
71
83
1.5
63
61
9
64
20
0
66
43
6
64
75
1.7
61
69
7
64
71
0
68
85
9
66
78
4.5
60
96
6
65
05
9
71
63
0
65
88
5
Gro
ss i
nco
me
17
37
53
20
18
96
21
22
22
19
59
57
17
21
04
15
11
25
19
99
87
17
44
05
20
26
07
17
89
03
22
24
61
20
06
82
19
20
33
17
40
77
19
68
20
18
76
43
17
37
53
17
23
57
20
40
57
18
82
07
15
90
27
16
78
34
20
16
52
17
61
71
Net
in
com
e
11
22
00
13
02
66
14
37
01
12
87
22
12
14
78
85
70
6
12
95
29
11
22
38
13
55
47
11
35
01
14
83
34
13
09
18
13
25
77
10
98
77
13
47
30
12
57
28
11
20
56
10
76
48
14
14
67
12
45
58
99
22
5
11
00
59
13
00
22
11
31
02
BC
Ra
tio
2.8
2
2.8
2
2.8
9
2.8
433
3
3.0
5
2.2
5
2.8
2.7
2.8
2
2.5
7
3
2.7
85
3.0
2
2.7
1
2.9
6
2.8
966
7
2.8
2
2.6
6
2.9
6
2.8
1
2.6
1
2.5
8
2.8
2
2.6
7
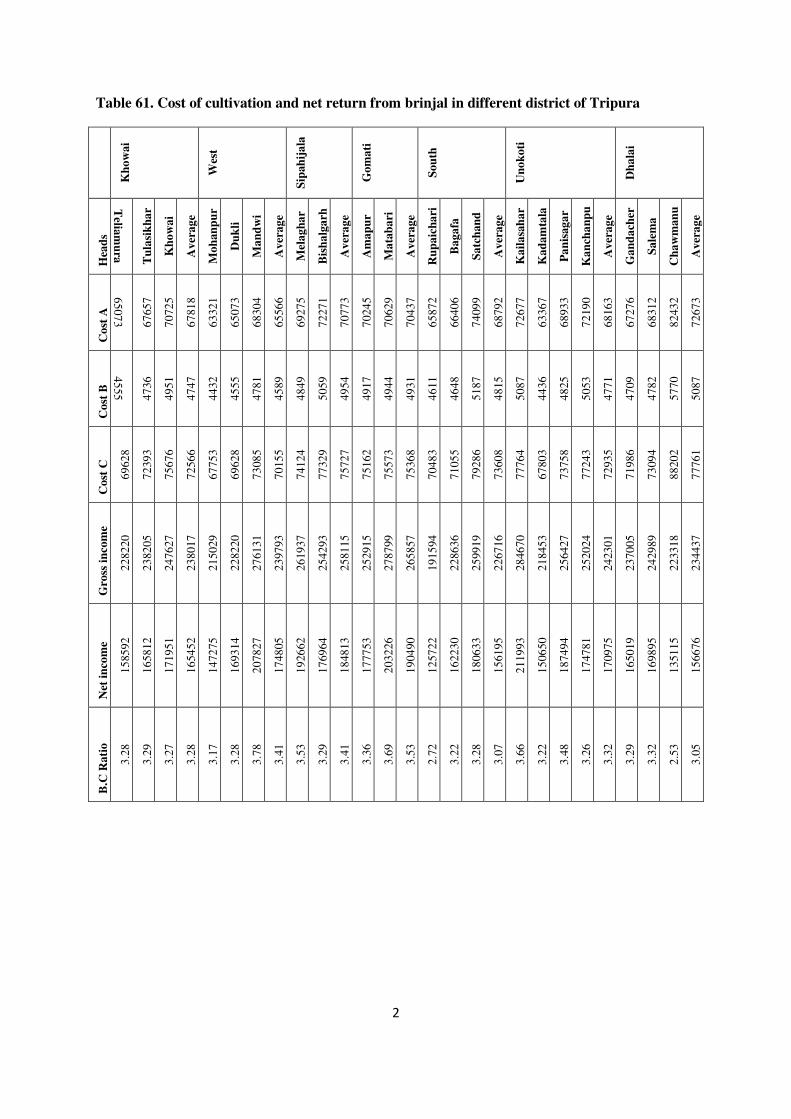
2
Table 61. Cost of cultivation and net return from brinjal in different district of Tripura
Kh
ow
ai
Wes
t
Sip
ah
ija
la
Go
ma
ti
So
uth
Un
ok
oti
Dh
ala
i
Hea
ds
Telia
mu
ra T
ula
sik
ha
r
Kh
ow
ai
Av
era
ge
Mo
han
pu
r
Du
kli
Ma
nd
wi
Av
era
ge
Mel
ag
ha
r
Bis
ha
lga
rh
Av
era
ge
Am
ap
ur
Ma
tab
ari
Av
era
ge
Ru
pa
ich
ari
Ba
ga
fa
Sa
tch
an
d
Av
era
ge
Ka
ila
sah
ar
Ka
da
mta
la
Pa
nis
ag
ar
Ka
nch
an
pu
r A
ver
ag
e
Ga
nd
ach
er
a
Sa
lem
a
Ch
aw
man
u
Av
era
ge
Co
st A
65
07
3 6
765
7
70
72
5
67
81
8
63
32
1
65
07
3
68
30
4
65
56
6
69
27
5
72
27
1
70
77
3
70
24
5
70
62
9
70
43
7
65
87
2
66
40
6
74
09
9
68
79
2
72
67
7
63
36
7
68
93
3
72
19
0
68
16
3
67
27
6
68
31
2
82
43
2
72
67
3
Co
st B
45
55 4
736
49
51
47
47
44
32
45
55
47
81
45
89
48
49
50
59
49
54
49
17
49
44
49
31
46
11
46
48
51
87
48
15
50
87
44
36
48
25
50
53
47
71
47
09
47
82
57
70
50
87
Co
st C
69
62
8
72
39
3
75
67
6
72
56
6
67
75
3
69
62
8
73
08
5
70
15
5
74
12
4
77
32
9
75
72
7
75
16
2
75
57
3
75
36
8
70
48
3
71
05
5
79
28
6
73
60
8
77
76
4
67
80
3
73
75
8
77
24
3
72
93
5
71
98
6
73
09
4
88
20
2
77
76
1
Gro
ss i
nco
me
22
82
20
23
82
05
24
76
27
23
80
17
21
50
29
22
82
20
27
61
31
23
97
93
26
19
37
25
42
93
25
81
15
25
29
15
27
87
99
26
58
57
19
15
94
22
86
36
25
99
19
22
67
16
28
46
70
21
84
53
25
64
27
25
20
24
24
23
01
23
70
05
24
29
89
22
33
18
23
44
37
Net
in
com
e
15
85
92
16
58
12
17
19
51
16
54
52
14
72
75
16
93
14
20
78
27
17
48
05
19
26
62
17
69
64
18
48
13
17
77
53
20
32
26
19
04
90
12
57
22
16
22
30
18
06
33
15
61
95
21
19
93
15
06
50
18
74
94
17
47
81
17
09
75
16
50
19
16
98
95
13
51
15
15
66
76
B.C
Ra
tio
3.2
8
3.2
9
3.2
7
3.2
8
3.1
7
3.2
8
3.7
8
3.4
1
3.5
3
3.2
9
3.4
1
3.3
6
3.6
9
3.5
3
2.7
2
3.2
2
3.2
8
3.0
7
3.6
6
3.2
2
3.4
8
3.2
6
3.3
2
3.2
9
3.3
2
2.5
3
3.0
5
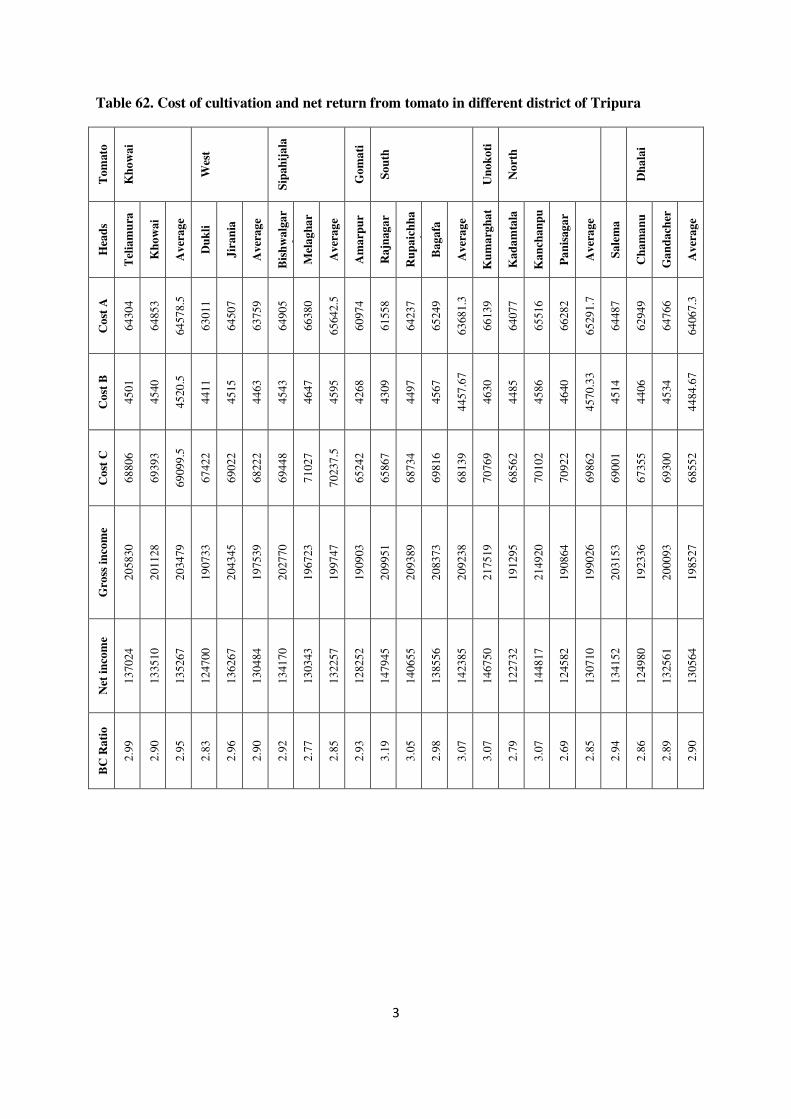
3
Table 62. Cost of cultivation and net return from tomato in different district of Tripura T
om
ato
Kh
ow
ai
Wes
t
Sip
ah
ija
la
Go
ma
ti
So
uth
Un
ok
oti
No
rth
Dh
ala
i
Hea
ds
Tel
iam
ura
Kh
ow
ai
Av
era
ge
Du
kli
Jir
an
ia
Av
era
ge
Bis
hw
alg
ar
h
Mel
ag
ha
r
Av
era
ge
Am
arp
ur
Ra
jnag
ar
Ru
pa
ich
ha
ri
Ba
ga
fa
Av
era
ge
Ku
ma
rgh
at
Ka
da
mta
la
Ka
nch
an
pu
r P
an
isag
ar
Av
era
ge
Sa
lem
a
Ch
am
an
u
Ga
nd
ach
er
a
Av
era
ge
Co
st A
64
30
4
64
85
3
64
57
8.5
63
01
1
64
50
7
63
75
9
64
90
5
66
38
0
65
64
2.5
60
97
4
61
55
8
64
23
7
65
24
9
63
68
1.3
66
13
9
64
07
7
65
51
6
66
28
2
65
29
1.7
64
48
7
62
94
9
64
76
6
64
06
7.3
Co
st B
45
01
45
40
45
20
.5
44
11
45
15
44
63
45
43
46
47
45
95
42
68
43
09
44
97
45
67
44
57
.67
46
30
44
85
45
86
46
40
45
70
.33
45
14
44
06
45
34
44
84
.67
Co
st C
68
80
6
69
39
3
69
09
9.5
67
42
2
69
02
2
68
22
2
69
44
8
71
02
7
70
23
7.5
65
24
2
65
86
7
68
73
4
69
81
6
68
13
9
70
76
9
68
56
2
70
10
2
70
92
2
69
86
2
69
00
1
67
35
5
69
30
0
68
55
2
Gro
ss i
nco
me
20
58
30
20
11
28
20
34
79
19
07
33
20
43
45
19
75
39
20
27
70
19
67
23
19
97
47
19
09
03
20
99
51
20
93
89
20
83
73
20
92
38
21
75
19
19
12
95
21
49
20
19
08
64
19
90
26
20
31
53
19
23
36
20
00
93
19
85
27
Net
in
com
e
13
70
24
13
35
10
13
52
67
12
47
00
13
62
67
13
04
84
13
41
70
13
03
43
13
22
57
12
82
52
14
79
45
14
06
55
13
85
56
14
23
85
14
67
50
12
27
32
14
48
17
12
45
82
13
07
10
13
41
52
12
49
80
13
25
61
13
05
64
BC
Ra
tio
2.9
9
2.9
0
2.9
5
2.8
3
2.9
6
2.9
0
2.9
2
2.7
7
2.8
5
2.9
3
3.1
9
3.0
5
2.9
8
3.0
7
3.0
7
2.7
9
3.0
7
2.6
9
2.8
5
2.9
4
2.8
6
2.8
9
2.9
0
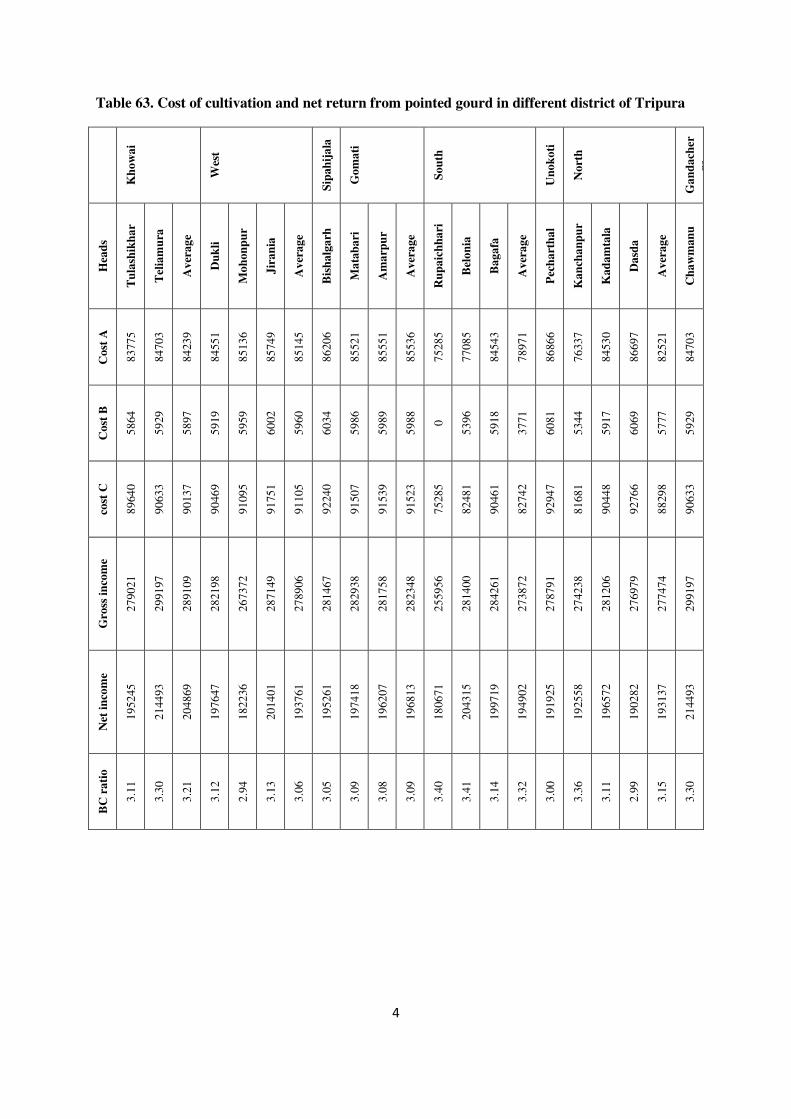
4
Table 63. Cost of cultivation and net return from pointed gourd in different district of Tripura
Kh
ow
ai
Wes
t
Sip
ah
ija
la
Go
ma
ti
So
uth
Un
ok
oti
No
rth
Ga
nd
ach
er
ra
Hea
ds
Tu
lash
ikh
ar
Tel
iam
ura
Av
era
ge
Du
kli
Mo
hon
pu
r
Jir
an
ia
Av
era
ge
Bis
ha
lga
rh
Ma
tab
ari
Am
arp
ur
Av
era
ge
Ru
pa
ich
ha
ri
Bel
on
ia
Ba
ga
fa
Av
era
ge
Pec
ha
rth
al
Ka
nch
an
pu
r
Ka
da
mta
la
Da
sda
Av
era
ge
Ch
aw
man
u
Co
st A
83
77
5
84
70
3
84
23
9
84
55
1
85
13
6
85
74
9
85
14
5
86
20
6
85
52
1
85
55
1
85
53
6
75
28
5
77
08
5
84
54
3
78
97
1
86
86
6
76
33
7
84
53
0
86
69
7
82
52
1
84
70
3
Co
st B
58
64
59
29
58
97
59
19
59
59
60
02
59
60
60
34
59
86
59
89
59
88
0
53
96
59
18
37
71
60
81
53
44
59
17
60
69
57
77
59
29
cost
C
89
64
0
90
63
3
90
13
7
90
46
9
91
09
5
91
75
1
91
10
5
92
24
0
91
50
7
91
53
9
91
52
3
75
28
5
82
48
1
90
46
1
82
74
2
92
94
7
81
68
1
90
44
8
92
76
6
88
29
8
90
63
3
Gro
ss i
nco
me
27
90
21
29
91
97
28
91
09
28
21
98
26
73
72
28
71
49
27
89
06
28
14
67
28
29
38
28
17
58
28
23
48
25
59
56
28
14
00
28
42
61
27
38
72
27
87
91
27
42
38
28
12
06
27
69
79
27
74
74
29
91
97
Net
in
com
e
19
52
45
21
44
93
20
48
69
19
76
47
18
22
36
20
14
01
19
37
61
19
52
61
19
74
18
19
62
07
19
68
13
18
06
71
20
43
15
19
97
19
19
49
02
19
19
25
19
25
58
19
65
72
19
02
82
19
31
37
21
44
93
BC
ra
tio
3.1
1
3.3
0
3.2
1
3.1
2
2.9
4
3.1
3
3.0
6
3.0
5
3.0
9
3.0
8
3.0
9
3.4
0
3.4
1
3.1
4
3.3
2
3.0
0
3.3
6
3.1
1
2.9
9
3.1
5
3.3
0

5
Table 64. Cost of cultivation and net return from radish in different district of Tripura
Kh
ow
ai
Wes
t
Sip
ah
ija
la
Go
ma
ti
So
uth
Un
ok
oti
No
rth
Ga
nd
ach
erra
Hea
ds
Tel
iam
ura
Jir
an
ia
Mel
ag
ha
r
Am
arp
ur
Ma
tab
ari
Av
era
ge
Sa
tch
an
d
Ru
pa
ich
ha
ri
Ba
ga
fa
Av
era
ge
Ku
ma
rgh
at
Ka
nch
an
pu
r
Pa
nis
ag
ar
Av
era
ge
Sa
lem
a
Ga
nd
ach
era
Av
era
ge
Co
st A
51
22
0
56
75
6
55
70
5
51
09
6
55
55
6
53
32
6
51
59
3
53
58
5
55
78
6
53
65
4.7
53
83
0
50
65
9
55
98
2
53
32
0.5
48
32
4
55
81
0
52
06
7
Co
st B
35
85
39
73
38
99
35
77
38
89
37
33
36
12
37
51
39
05
37
56
38
56
35
46
39
19
37
32
.5
33
83
39
07
36
45
Co
st C
54
80
6
60
72
9
59
60
5
54
67
3
59
44
5
57
05
9
52
25
5
57
33
6
59
69
1
56
42
7.3
57
68
6
54
20
5
59
90
1
57
05
3
51
70
6
59
71
7
55
71
1.5
Gro
ss
inco
me
14
27
12
14
22
34
14
27
12
14
27
22
14
27
14
14
27
18
14
00
00
14
45
33
13
82
96
14
09
43
15
25
15
13
00
00
12
30
77
12
65
39
11
66
67
14
26
54
12
96
61
Net
in
com
e
87
90
6
81
50
5
83
10
7
88
04
9
83
26
9
85
65
9
87
74
5
87
19
7
78
60
5
84
51
5.7
94
82
9
75
79
5
63
17
6
69
48
5.5
64
96
1
82
93
7
73
94
9
BC
Ra
tio
2.6
0
2.3
4
2.3
9
2.6
1
2.4
0
2.5
1
2.6
8
2.5
2
2.3
2
2.5
1
2.6
4
2.4
0
2.0
5
2.2
3
2.2
6
2.3
9
2.3
3
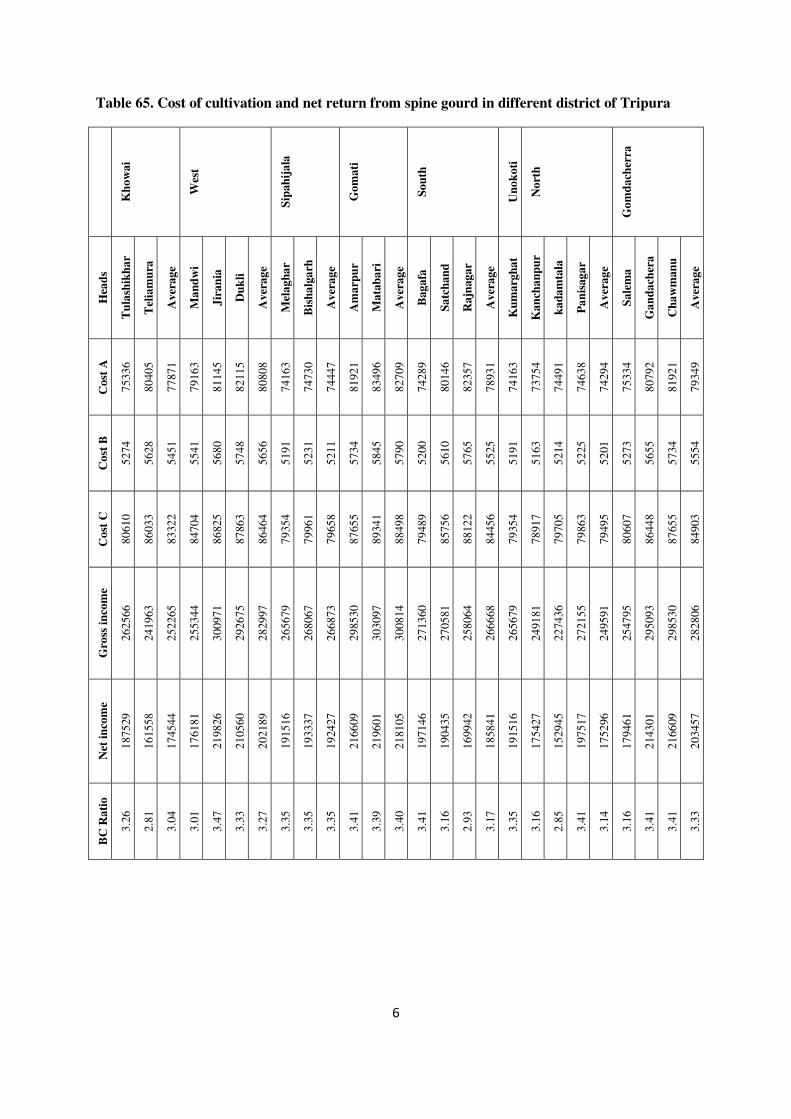
6
Table 65. Cost of cultivation and net return from spine gourd in different district of Tripura
Kh
ow
ai
Wes
t
Sip
ah
ija
la
Go
ma
ti
So
uth
Un
ok
oti
No
rth
Go
md
ach
erra
Hea
ds
Tu
lash
ikh
ar
Tel
iam
ura
Av
era
ge
Ma
nd
wi
Jir
an
ia
Du
kli
Av
era
ge
Mel
ag
ha
r
Bis
ha
lga
rh
Av
era
ge
Am
arp
ur
Ma
tab
ari
Av
era
ge
Ba
ga
fa
Sa
tch
an
d
Ra
jnag
ar
Av
era
ge
Ku
ma
rgh
at
Ka
nch
an
pu
r
ka
da
mta
la
Pa
nis
ag
ar
Av
era
ge
Sa
lem
a
Ga
nd
ach
era
Ch
aw
man
u
Av
era
ge
Co
st A
75
33
6
80
40
5
77
87
1
79
16
3
81
14
5
82
11
5
80
80
8
74
16
3
74
73
0
74
44
7
81
92
1
83
49
6
82
70
9
74
28
9
80
14
6
82
35
7
78
93
1
74
16
3
73
75
4
74
49
1
74
63
8
74
29
4
75
33
4
80
79
2
81
92
1
79
34
9
Co
st B
52
74
56
28
54
51
55
41
56
80
57
48
56
56
51
91
52
31
52
11
57
34
58
45
57
90
52
00
56
10
57
65
55
25
51
91
51
63
52
14
52
25
52
01
52
73
56
55
57
34
55
54
Co
st C
80
61
0
86
03
3
83
32
2
84
70
4
86
82
5
87
86
3
86
46
4
79
35
4
79
96
1
79
65
8
87
65
5
89
34
1
88
49
8
79
48
9
85
75
6
88
12
2
84
45
6
79
35
4
78
91
7
79
70
5
79
86
3
79
49
5
80
60
7
86
44
8
87
65
5
84
90
3
Gro
ss i
nco
me
26
25
66
24
19
63
25
22
65
25
53
44
30
09
71
29
26
75
28
29
97
26
56
79
26
80
67
26
68
73
29
85
30
30
30
97
30
08
14
27
13
60
27
05
81
25
80
64
26
66
68
26
56
79
24
91
81
22
74
36
27
21
55
24
95
91
25
47
95
29
50
93
29
85
30
28
28
06
Net
in
com
e
18
75
29
16
15
58
17
45
44
17
61
81
21
98
26
21
05
60
20
21
89
19
15
16
19
33
37
19
24
27
21
66
09
21
96
01
21
81
05
19
71
46
19
04
35
16
99
42
18
58
41
19
15
16
17
54
27
15
29
45
19
75
17
17
52
96
17
94
61
21
43
01
21
66
09
20
34
57
BC
Ra
tio
3.2
6
2.8
1
3.0
4
3.0
1
3.4
7
3.3
3
3.2
7
3.3
5
3.3
5
3.3
5
3.4
1
3.3
9
3.4
0
3.4
1
3.1
6
2.9
3
3.1
7
3.3
5
3.1
6
2.8
5
3.4
1
3.1
4
3.1
6
3.4
1
3.4
1
3.3
3

7
Table 66. Cost of cultivation and net return from chilli in different district of Tripura K
ho
wa
i
Wes
t
Sip
ah
ilja
la
Go
ma
ti
So
uth
Un
ok
oti
No
rth
Ga
nd
ach
erra
Tel
iam
ura
Kh
ow
ai
Tu
lash
ikh
ar
Av
era
ge
Du
kli
Mo
han
pu
r
Ma
nd
ai
Av
era
ge
Bis
ha
lga
rh
Mel
ag
ha
r
Av
era
ge
Ma
tab
ari
Am
arp
ur
Av
era
ge
Ru
pa
ich
ari
Ra
jnag
ar
Bo
ga
fa
Av
era
ge
Ku
ma
rgh
at
Ka
da
mta
la
Pa
nis
ag
ar
Ka
nch
an
pu
r
Av
era
ge
Ch
aw
man
u
Sa
lem
a
Ga
nd
ach
erra
Av
era
ge
Co
st A
41
25
2
46
20
7
46
33
1
44
59
7
28
32
8
33
25
7
48
93
1
36
83
9
28
82
3
45
76
0
37
29
2
46
92
5
50
94
2
48
93
4
46
72
7
48
45
3
50
84
6
48
67
5
47
35
1
43
67
6
46
24
5
47
94
8
45
95
6
43
51
4
44
26
7
51
76
0
46
51
4
Co
st B
28
88
46
77
3
57
65
6
35
77
2
19
83
23
28
34
25
25
79
20
18
32
03
26
11
32
85
35
66
34
26
32
71
33
92
35
59
34
07
33
15
29
93
32
37
31
39
9
12
54
3
30
46
30
99
36
23
32
56
Co
st C
44
13
9
49
44
1
49
57
4
47
71
8
30
31
1
35
58
5
52
35
6
39
41
7
30
84
1
48
96
4
39
90
3
50
20
9
54
50
8
52
35
9
49
99
7
51
84
5
54
40
5
52
08
2
50
66
6
46
66
9
49
48
2
58
43
5
51
52
9
46
56
0
47
36
6
55
38
3
49
77
0
Gro
ss I
nco
me
20
10
35
13
13
60
13
40
06
15
54
67
16
50
00
16
17
29
20
51
86
17
73
05
14
04
38
13
21
11
13
62
75
20
23
31
25
01
67
22
62
49
11
71
93
23
19
78
14
17
17
16
36
29
13
70
73
14
20
86
13
73
84
10
99
97
12
98
22
20
45
83
12
56
27
20
80
09
17
94
06
Net
in
com
e
15
68
95
81
91
8
84
43
1
10
77
48
13
46
89
12
61
44
15
28
31
13
78
88
10
95
96
83
14
7
96
37
2
15
21
21
19
56
59
17
38
90
67
19
5
18
01
34
87
31
2
11
15
47
86
40
7
95
41
7
87
90
2
87
44
2
90
25
4
15
80
23
78
26
1
15
26
26
12
96
37
BC
Ra
tio
4.5
5
2.6
6
2.7
0
3.3
0
5.4
4
4.5
4
3.9
2
4.6
3
4.5
5
2.7
0
3.6
3
4.0
3
4.5
9
4.3
1
2.3
4
4.4
7
2.6
0
3.1
4
2.7
1
3.0
4
2.7
8
1.8
8
2.5
7
4.3
9
2.6
5
3.7
6
3.6
0

8
Table 67. Cost of cultivation and net return from potato in different district of Tripura
Kh
ow
ai
Wes
t
Sip
ah
ija
la
Go
ma
ti
So
uth
No
rth
Ga
nd
ach
erra
Kh
ow
ai
Tel
iam
ura
Av
era
ge
Ma
nd
ai
Jir
an
iya
Du
kli
Av
era
ge
Bis
ha
lga
rh
Mel
ag
ha
r
Av
era
ge
Am
arp
ur
Ma
tab
ari
Av
era
ge
Bo
ga
fa
Sa
tch
an
Ru
pa
ich
ari
Av
era
ge
Ka
nch
an
pu
r
Pa
nis
ag
ar
Ka
da
mta
la
Av
era
ge
Sa
lem
a
Ga
nd
ach
erra
Ch
aw
man
u
Av
era
ge
Co
st A
67
99
9
78
11
7
73
05
8
65
72
5
67
60
5
68
56
7
67
29
9
63
18
5
63
27
8
63
23
2
62
13
3
66
74
8
64
44
0
67
52
6
68
49
0
69
40
0
68
47
2
67
62
9
68
14
5
68
58
5
68
12
0
66
04
1
68
10
5
69
93
1
68
02
6
Co
st B
47
60
54
68
51
14
46
01
47
32
48
00
47
11
44
23
44
29
44
26
43
49
46
72
45
11
44
68
47
94
48
58
47
07
47
34
47
70
48
01
47
68
46
23
47
67
48
95
47
62
Co
st C
72
75
9
83
58
5
78
17
2
70
32
6
72
33
7
73
36
7
72
01
0
67
60
8
67
70
8
67
65
8
66
48
2
71
42
0
68
95
1
72
25
3
73
28
4
74
25
8
73
26
5
72
36
3
72
91
6
73
38
5
72
88
8
70
66
4
72
87
2
74
82
6
72
78
7
Gro
ss i
nco
me
18
74
23
16
95
39
17
84
81
18
61
00
17
34
78
22
17
33
19
37
70
17
48
57
18
20
05
17
84
31
17
81
34
17
43
93
17
62
63
17
26
46
17
41
40
22
81
37
19
16
41
17
34
02
17
79
99
22
40
46
19
18
16
17
81
65
18
42
02
17
55
00
17
92
89
Net
in
com
e
11
94
24
85
95
3
10
26
89
11
57
74
10
11
41
14
83
67
12
17
61
11
16
72
11
42
97
11
29
85
11
16
51
10
29
72
10
73
12
10
03
93
10
08
56
15
38
79
11
83
76
10
10
40
10
50
83
15
06
61
11
89
28
10
75
00
11
13
31
10
06
74
10
65
02
BC
Ra
tio
2.5
8
2.0
3
2.3
1
2.6
5
2.4
0
3.0
2
2.6
9
2.5
9
2.6
9
2.6
4
2.6
8
2.4
4
2.5
6
2.3
9
2.3
8
3.0
7
2.6
1
2.4
0
2.4
4
3.0
5
2.6
3
2.5
2
2.5
3
2.3
5
2.4
7
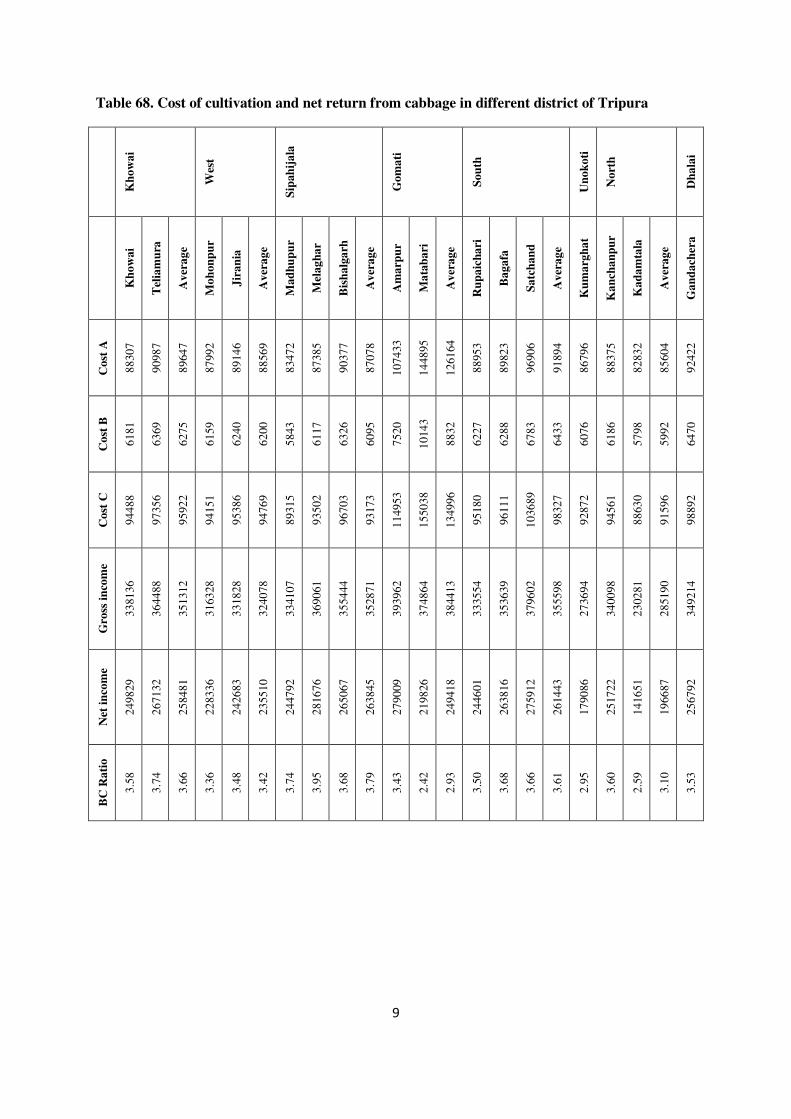
9
Table 68. Cost of cultivation and net return from cabbage in different district of Tripura
Kh
ow
ai
Wes
t
Sip
ah
ija
la
Go
ma
ti
So
uth
Un
ok
oti
No
rth
Dh
ala
i
Kh
ow
ai
Tel
iam
ura
Av
era
ge
Mo
hon
pu
r
Jir
an
ia
Av
era
ge
Ma
dh
up
ur
Mel
ag
ha
r
Bis
ha
lga
rh
Av
era
ge
Am
arp
ur
Ma
tab
ari
Av
era
ge
Ru
pa
ich
ari
Ba
ga
fa
Sa
tch
an
d
Av
era
ge
Ku
ma
rgh
at
Ka
nch
an
pu
r
Ka
da
mta
la
Av
era
ge
Ga
nd
ach
era
Co
st A
88
30
7
90
98
7
89
64
7
87
99
2
89
14
6
88
56
9
83
47
2
87
38
5
90
37
7
87
07
8
10
74
33
14
48
95
12
61
64
88
95
3
89
82
3
96
90
6
91
89
4
86
79
6
88
37
5
82
83
2
85
60
4
92
42
2
Co
st B
61
81
63
69
62
75
61
59
62
40
62
00
58
43
61
17
63
26
60
95
75
20
10
14
3
88
32
62
27
62
88
67
83
64
33
60
76
61
86
57
98
59
92
64
70
Co
st C
94
48
8
97
35
6
95
92
2
94
15
1
95
38
6
94
76
9
89
31
5
93
50
2
96
70
3
93
17
3
11
49
53
15
50
38
13
49
96
95
18
0
96
11
1
10
36
89
98
32
7
92
87
2
94
56
1
88
63
0
91
59
6
98
89
2
Gro
ss i
nco
me
33
81
36
36
44
88
35
13
12
31
63
28
33
18
28
32
40
78
33
41
07
36
90
61
35
54
44
35
28
71
39
39
62
37
48
64
38
44
13
33
35
54
35
36
39
37
96
02
35
55
98
27
36
94
34
00
98
23
02
81
28
51
90
34
92
14
Net
in
com
e
24
98
29
26
71
32
25
84
81
22
83
36
24
26
83
23
55
10
24
47
92
28
16
76
26
50
67
26
38
45
27
90
09
21
98
26
24
94
18
24
46
01
26
38
16
27
59
12
26
14
43
17
90
86
25
17
22
14
16
51
19
66
87
25
67
92
BC
Ra
tio
3.5
8
3.7
4
3.6
6
3.3
6
3.4
8
3.4
2
3.7
4
3.9
5
3.6
8
3.7
9
3.4
3
2.4
2
2.9
3
3.5
0
3.6
8
3.6
6
3.6
1
2.9
5
3.6
0
2.5
9
3.1
0
3.5
3

10
Table 69. Cost of cultivation and net return from cauliflower in different district of Tripura
Kh
ow
ai
Wes
t
Sip
ah
ija
lla
Go
ma
ti
So
uth
Un
ok
oti
No
rth
Hea
ds
kh
ow
ai
Tel
iam
ura
Av
era
ge
du
kli
Bis
hw
alg
arh
Mel
ag
ha
r
Av
era
ge
Am
arp
ur
Ma
tab
ari
Av
era
ge
Ru
pa
ich
ari
Sa
tch
an
d
Ba
ga
fa
Av
era
ge
ku
ma
rgh
at
ka
nch
an
pu
r
Co
st A
10
26
55
10
62
17
10
44
36
10
17
01
10
94
15
14
24
25
12
59
20
10
73
45
12
60
13
11
66
79
10
25
46
10
26
55
10
94
21
10
48
74
10
17
01
11
19
39
Co
st B
71
86
74
35
73
10
.5
71
19
76
59
99
70
88
14
.5
75
14
88
21
81
67
.5
71
78
71
86
76
59
73
41
71
19
78
36
Co
st C
10
98
41
11
36
52
11
17
47
10
88
20
11
70
74
15
23
95
13
47
35
11
48
59
13
48
33
12
48
46
10
97
24
10
98
41
11
70
80
11
22
15
10
88
20
11
97
75
Gro
ss
inco
me
42
34
52
34
21
59
38
28
06
33
65
17
37
87
17
39
63
30
38
75
24
22
18
01
39
37
50
30
77
76
33
00
00
36
86
95
37
87
17
35
91
37
33
65
17
40
20
00
Net
in
com
e
20
26
97
22
85
07
21
56
02
22
76
97
26
16
43
24
39
35
25
27
89
10
69
41
25
89
17
18
29
29
22
74
54
25
88
54
26
16
37
24
93
15
22
76
97
28
22
25
BC
Ra
tio
3.8
6
3.0
1
3.4
35
3.0
9
3.2
3
2.6
2.9
15
1.9
3
2.9
2
2.4
25
3.0
1
3.3
6
3.2
3
3.2
3.0
9
3.3
6
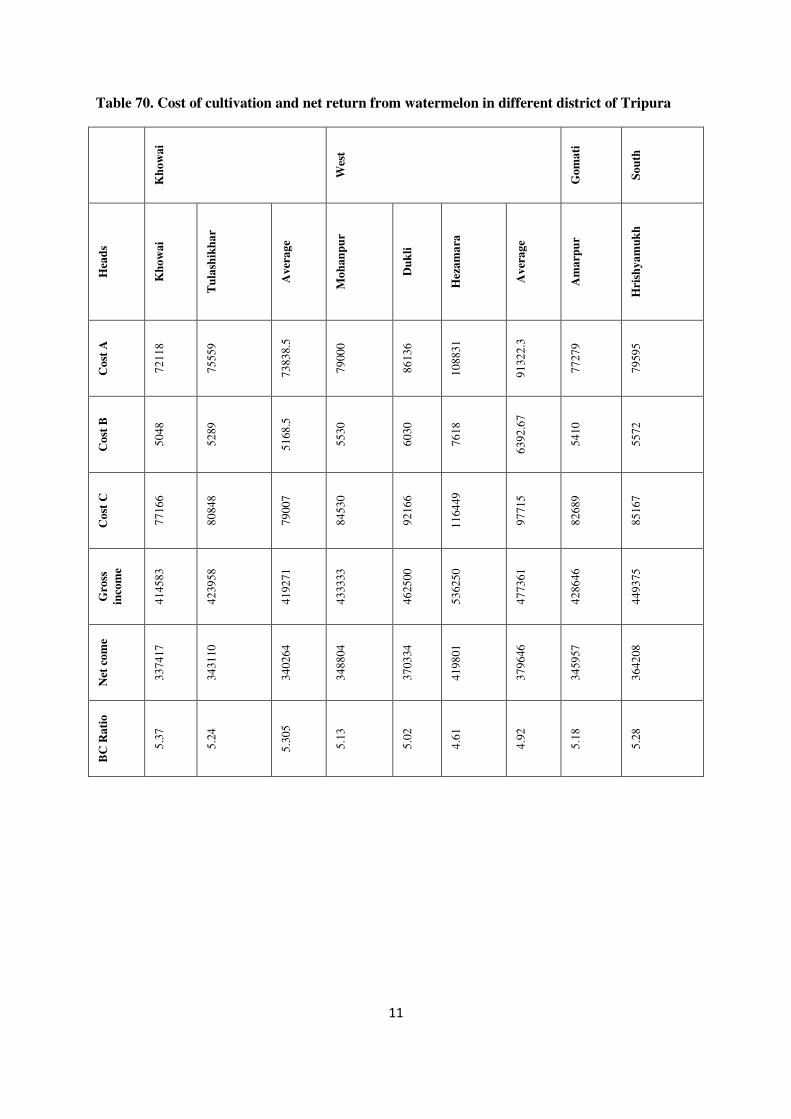
11
Table 70. Cost of cultivation and net return from watermelon in different district of Tripura
Kh
ow
ai
Wes
t
Go
ma
ti
So
uth
Hea
ds
Kh
ow
ai
Tu
lash
ikh
ar
Av
era
ge
Mo
han
pu
r
Du
kli
Hez
am
ara
Av
era
ge
Am
arp
ur
Hri
shy
am
uk
h
Co
st A
72
11
8
75
55
9
73
83
8.5
79
00
0
86
13
6
10
88
31
91
32
2.3
77
27
9
79
59
5
Co
st B
50
48
52
89
51
68
.5
55
30
60
30
76
18
63
92
.67
54
10
55
72
Co
st C
77
16
6
80
84
8
79
00
7
84
53
0
92
16
6
11
64
49
97
71
5
82
68
9
85
16
7
Gro
ss
inco
me
41
45
83
42
39
58
41
92
71
43
33
33
46
25
00
53
62
50
47
73
61
42
86
46
44
93
75
Net
co
me
33
74
17
34
31
10
34
02
64
34
88
04
37
03
34
41
98
01
37
96
46
34
59
57
36
42
08
BC
Ra
tio
5.3
7
5.2
4
5.3
05
5.1
3
5.0
2
4.6
1
4.9
2
5.1
8
5.2
8

12
Table 71. Cost of cultivation and net return from ridge gourd in different district of Tripura
Sip
ah
ija
la
Go
ma
ti
So
uth
Un
ok
oti
No
rth
Dh
ala
i
Hea
ds
Mel
ag
ha
r
Am
aru
r
Bel
on
ia
Sa
bro
om
Ru
pa
ich
ha
ri
Av
era
ge
Ku
ma
rgh
at
Ka
da
mta
la
Pa
nis
ag
ar
Ka
nch
an
pu
r
Av
era
ge
Ga
nd
ach
era
Am
ba
sa
Av
era
ge
Co
st A
65
91
5
65
82
1
58
36
6
66
19
3
67
09
8
63
88
6
64
51
6
66
63
4
66
68
1
69
02
7
67
44
7
61
66
1
66
12
3
63
89
2
Co
st B
46
14
46
07
42
25
47
87
48
02
46
05
46
39
47
57
46
68
38
57
44
27
43
16
46
29
44
73
Co
st C
70
52
9
70
42
9
62
59
0
70
98
0
71
90
0
68
49
0
69
15
5
71
39
2
71
34
9
72
88
5
71
87
5
65
97
7
70
75
1
68
36
4
Gro
ss
inco
me
23
64
52
23
98
52
21
88
11
24
35
11
24
51
75
23
58
32
23
93
06
23
49
19
24
54
70
19
29
17
22
44
35
21
94
08
24
92
46
23
43
27
Net
co
me
17
27
53
17
41
61
16
00
42
17
25
31
17
42
98
16
89
57
17
01
51
16
35
27
18
05
74
13
79
63
16
06
88
15
77
47
18
51
74
17
14
61
BC
Ra
tio
3.3
5
3.4
1
3.5
0
3.4
3
3.4
1
3.4
5
3.4
6
3.2
9
3.4
4
2.6
5
3.1
3
3.3
3
3.5
2
3.4
3
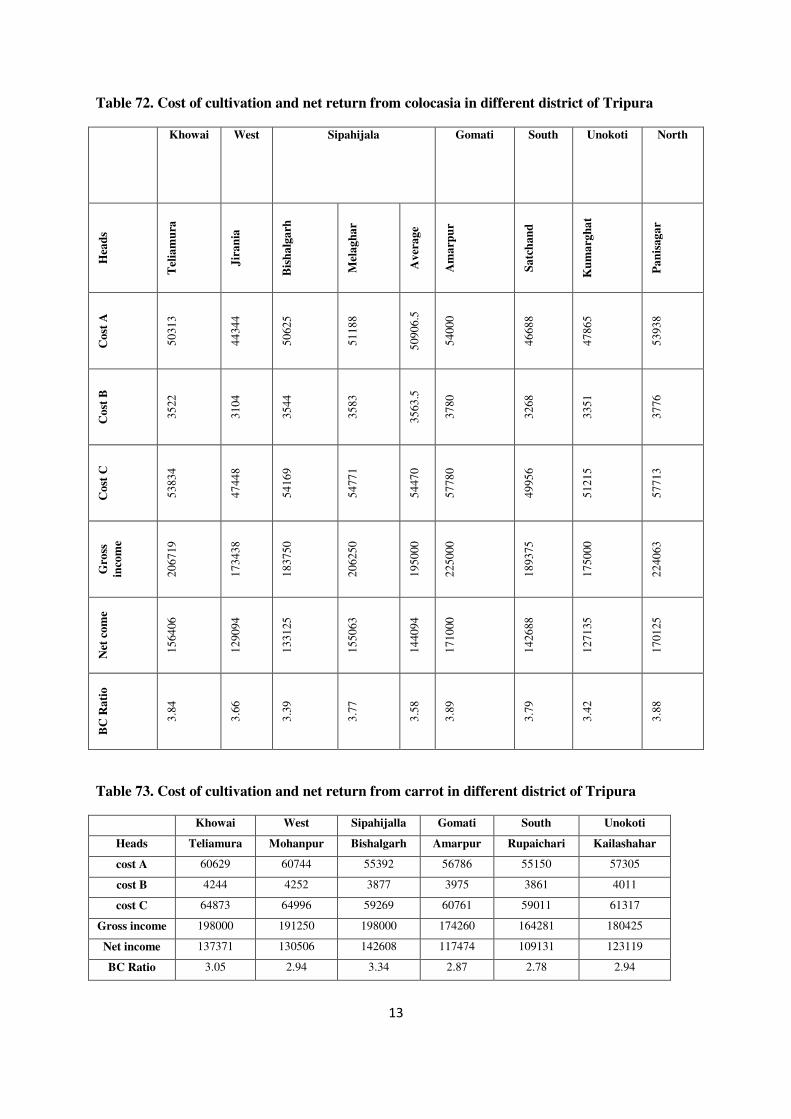
13
Table 72. Cost of cultivation and net return from colocasia in different district of Tripura
Khowai West Sipahijala Gomati South Unokoti North
Hea
ds
Tel
iam
ura
Jir
an
ia
Bis
ha
lga
rh
Mel
ag
ha
r
Av
era
ge
Am
arp
ur
Sa
tch
an
d
Ku
ma
rgh
at
Pa
nis
ag
ar
Co
st A
50
31
3
44
34
4
50
62
5
51
18
8
50
90
6.5
54
00
0
46
68
8
47
86
5
53
93
8
Co
st B
35
22
31
04
35
44
35
83
35
63
.5
37
80
32
68
33
51
37
76
Co
st C
53
83
4
47
44
8
54
16
9
54
77
1
54
47
0
57
78
0
49
95
6
51
21
5
57
71
3
Gro
ss
inco
me
20
67
19
17
34
38
18
37
50
20
62
50
19
50
00
22
50
00
18
93
75
17
50
00
22
40
63
Net
co
me
15
64
06
12
90
94
13
31
25
15
50
63
14
40
94
17
10
00
14
26
88
12
71
35
17
01
25
BC
Ra
tio
3.8
4
3.6
6
3.3
9
3.7
7
3.5
8
3.8
9
3.7
9
3.4
2
3.8
8
Table 73. Cost of cultivation and net return from carrot in different district of Tripura
Khowai West Sipahijalla Gomati South Unokoti
Heads Teliamura Mohanpur Bishalgarh Amarpur Rupaichari Kailashahar
cost A 60629 60744 55392 56786 55150 57305
cost B 4244 4252 3877 3975 3861 4011
cost C 64873 64996 59269 60761 59011 61317
Gross income 198000 191250 198000 174260 164281 180425
Net income 137371 130506 142608 117474 109131 123119
BC Ratio 3.05 2.94 3.34 2.87 2.78 2.94
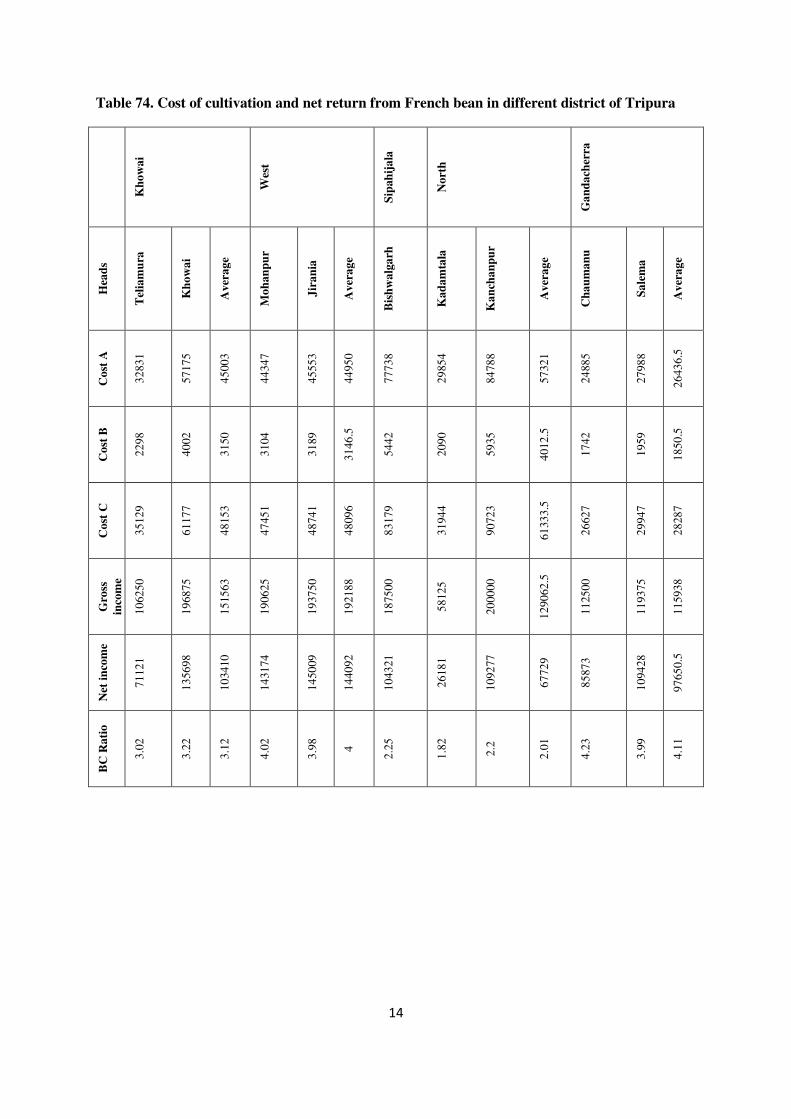
14
Table 74. Cost of cultivation and net return from French bean in different district of Tripura
Kh
ow
ai
Wes
t
Sip
ah
ija
la
No
rth
Ga
nd
ach
erra
Hea
ds
Tel
iam
ura
Kh
ow
ai
Av
era
ge
Mo
han
pu
r
Jir
an
ia
Av
era
ge
Bis
hw
alg
arh
Ka
da
mta
la
Ka
nch
an
pu
r
Av
era
ge
Ch
au
ma
nu
Sa
lem
a
Av
era
ge
Co
st A
32
83
1
57
17
5
45
00
3
44
34
7
45
55
3
44
95
0
77
73
8
29
85
4
84
78
8
57
32
1
24
88
5
27
98
8
26
43
6.5
Co
st B
22
98
40
02
31
50
31
04
31
89
31
46
.5
54
42
20
90
59
35
40
12
.5
17
42
19
59
18
50
.5
Co
st C
35
12
9
61
17
7
48
15
3
47
45
1
48
74
1
48
09
6
83
17
9
31
94
4
90
72
3
61
33
3.5
26
62
7
29
94
7
28
28
7
Gro
ss
inco
me
10
62
50
19
68
75
15
15
63
19
06
25
19
37
50
19
21
88
18
75
00
58
12
5
20
00
00
12
90
62
.5
11
25
00
11
93
75
11
59
38
Net
in
com
e
71
12
1
13
56
98
10
34
10
14
31
74
14
50
09
14
40
92
10
43
21
26
18
1
10
92
77
67
72
9
85
87
3
10
94
28
97
65
0.5
BC
Ra
tio
3.0
2
3.2
2
3.1
2
4.0
2
3.9
8
4
2.2
5
1.8
2
2.2
2.0
1
4.2
3
3.9
9
4.1
1

1
Annexure III
A. List of representative farmer selected from different districts of Tripura for cereal and vegetable crops
I. Paddy
Hea
d
Wes
t
Sep
ah
ija
la
Go
ma
ti
So
uth
Tri
pu
ra
Kh
ow
ai
Dh
ala
i
No
rth
Un
ak
oti
Sa
mir
Da
s
Su
ku
ma
r
da
s
Su
kan
ta
da
s
Su
raj
Deb
ba
rma
Ma
dh
an
deb
ba
rma
Jy
oti
sh
deb
ba
rma
Ta
pan
Dey
Ba
da
l
Deb
na
th
Sw
ap
an
Deb
an
th
Arj
un
Da
tta
Am
al
Pa
ul
Alo
k
Ma
jum
dh
a
r Nid
ha
n D
as
Su
bra
ta
Pa
l
Dil
ip s
il
Ma
nk
um
ar
Deb
ba
rma
Pra
nk
um
ar
Da
s
Bir
end
ra
Da
s
Ra
nji
t D
as
Nil
ka
nta
Da
s
Su
dh
ir
ran
jan
Da
s
Ga
uta
m
Ch
ow
dh
ur
y
Ta
hir
My
ea
Ha
rip
ad
a
Sa
ha
Ma
n
La
bou
rs
32
81
3
37
96
9
35
25
0
37
96
9
35
62
5
33
18
8
37
03
1
38
43
8
35
62
5
33
75
0
37
50
0
43
12
5
27
65
6
30
12
3
33
75
0
29
68
8
37
50
0
37
03
1
35
90
6
33
60
9
33
46
9
37
03
1
32
90
6
33
03
1
Po
wer
till
er
59
38
12
50
0
65
63
87
81
67
19
65
63
89
06
98
44
53
13
81
25
67
50
86
44
10
93
8
89
84
83
33
65
63
93
75
82
03
71
25
75
00
11
25
0
75
00
75
00
65
63
Ca
ttle
Pa
ir
Da
y
0
0
0
0
0
0
0
0
0
0
0
0
28
13
21
09
16
25
0
0
0
0
0
0
0
0
0

2
See
d
37
5
25
0
26
3
18
8
14
1
10
5
31
3
31
9
16
7
20
9
25
0
25
0
75
45
0
75
20
8
31
3
18
8
15
0
18
8
17
5
16
1
18
8
16
7
Fu
el
53
8
53
8
26
9
0
0
0
42
3
43
3
26
9
43
7
44
5
28
1
16
80
15
45
13
44
40
3
84
4
42
2
38
5
40
3
40
3
41
2
40
3
35
8
Die
sel
0
0
0
26
9
33
6
40
3
0
0
0
0
0
0
0
0
0
0
0
0
0
0
0
0
0
Ure
a
0
0
0
81
6
17
2
30
9
0
0
0
0
0
0
93
0
10
63
57
3
0
0
0
0
0
0
0
0
0
SS
P
51
6
79
1
73
9
53
1
93
0
15
1
75
8
77
6
48
1
85
6
93
8
75
0
40
0
57
5
42
5
74
5
78
8
56
3
71
5
67
9
72
2
72
2
61
1
69
7
MO
P
79
7
74
4
11
16
32
70
30
55
11
48
55
8
66
7
70
8
53
5
59
8
42
5
30
00
22
50
33
54
53
1
10
63
79
7
61
6
55
8
63
8
63
8
56
0
63
8
DA
P
23
00
27
31
29
47
0
0
33
21
34
00
24
92
33
65
34
50
25
88
0
0
0
23
96
28
75
17
97
34
21
33
42
34
50
34
50
33
27
34
50
Fu
ng
icid
e
0
0
0
0
0
0
0
0
0
0
0
0
0
0
0
0
0
0
45
0
43
8
50
0
50
0
46
5
46
9
An
y o
ther
cost
0
0
0
0
0
0
19
1
21
0
0
43
8
65
6
0
0
0
0
0
0
0
15
0
94
15
0
53
6
18
8
12
5
Co
st A
43
27
5
55
52
2
47
14
5
51
82
4
46
97
7
41
86
6
51
50
0
54
08
5
45
05
4
47
71
4
50
58
6
56
06
3
47
49
1
59
16
4
49
47
9
40
53
3
52
75
6
49
00
0
48
91
9
46
81
0
50
75
6
50
94
0
46
49
4
45
59
8
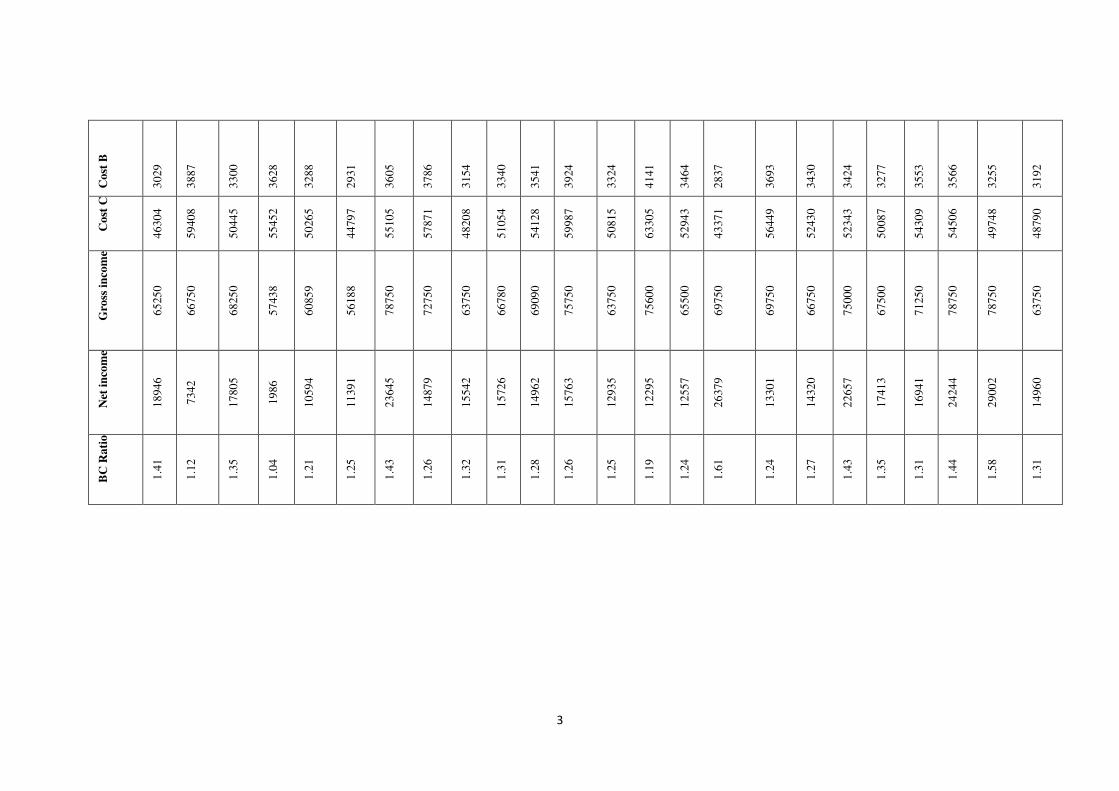
3
Co
st B
30
29
38
87
33
00
36
28
32
88
29
31
36
05
37
86
31
54
33
40
35
41
39
24
33
24
41
41
34
64
28
37
36
93
34
30
34
24
32
77
35
53
35
66
32
55
31
92
Co
st C
46
30
4
59
40
8
50
44
5
55
45
2
50
26
5
44
79
7
55
10
5
57
87
1
48
20
8
51
05
4
54
12
8
59
98
7
50
81
5
63
30
5
52
94
3
43
37
1
56
44
9
52
43
0
52
34
3
50
08
7
54
30
9
54
50
6
49
74
8
48
79
0
Gro
ss i
nco
me
65
25
0
66
75
0
68
25
0
57
43
8
60
85
9
56
18
8
78
75
0
72
75
0
63
75
0
66
78
0
69
09
0
75
75
0
63
75
0
75
60
0
65
50
0
69
75
0
69
75
0
66
75
0
75
00
0
67
50
0
71
25
0
78
75
0
78
75
0
63
75
0
Net
in
com
e
18
94
6
73
42
17
80
5
19
86
10
59
4
11
39
1
23
64
5
14
87
9
15
54
2
15
72
6
14
96
2
15
76
3
12
93
5
12
29
5
12
55
7
26
37
9
13
30
1
14
32
0
22
65
7
17
41
3
16
94
1
24
24
4
29
00
2
14
96
0
BC
Ra
tio
1.4
1
1.1
2
1.3
5
1.0
4
1.2
1
1.2
5
1.4
3
1.2
6
1.3
2
1.3
1
1.2
8
1.2
6
1.2
5
1.1
9
1.2
4
1.6
1
1.2
4
1.2
7
1.4
3
1.3
5
1.3
1
1.4
4
1.5
8
1.3
1
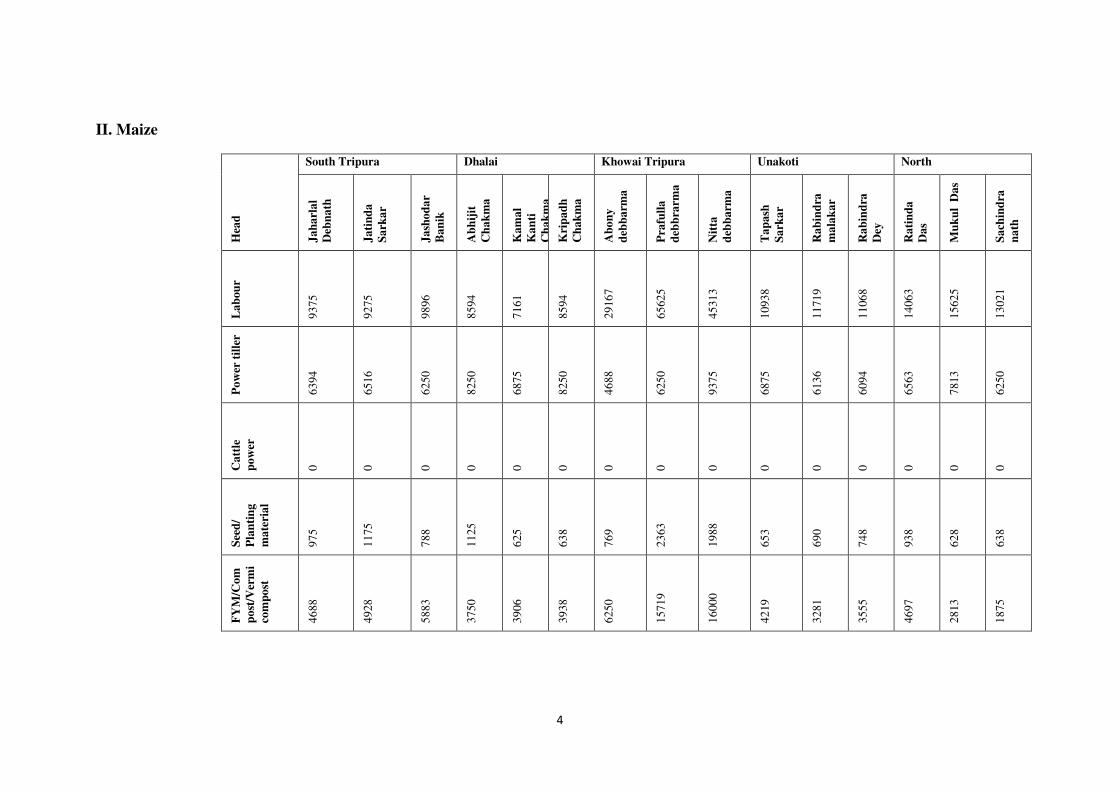
4
II. Maize
Hea
d
South Tripura Dhalai Khowai Tripura Unakoti North
Ja
ha
rla
l
Deb
na
th
Ja
tin
da
Sa
rka
r
Ja
sho
da
r
Ba
nik
Ab
hij
it
Ch
ak
ma
Ka
ma
l
Ka
nti
Ch
ak
ma
Kri
pa
dh
Ch
ak
ma
Ab
on
y
deb
ba
rma
Pra
full
a
deb
bra
rma
Nit
ta
deb
ba
rma
Ta
pa
sh
Sa
rka
r
Ra
bin
dra
ma
lak
ar
Ra
bin
dra
Dey
Ra
tin
da
Da
s
Mu
ku
l D
as
Sa
chin
dra
na
th
La
bou
r
93
75
92
75
98
96
85
94
71
61
85
94
29
16
7
65
62
5
45
31
3
10
93
8
11
71
9
11
06
8
14
06
3
15
62
5
13
02
1
Po
wer
til
ler
63
94
65
16
62
50
82
50
68
75
82
50
46
88
62
50
93
75
68
75
61
36
60
94
65
63
78
13
62
50
Ca
ttle
po
wer
0
0
0
0
0
0
0
0
0
0
0
0
0
0
0
See
d/
Pla
nti
ng
ma
teri
al
97
5
11
75
78
8
11
25
62
5
63
8
76
9
23
63
19
88
65
3
69
0
74
8
93
8
62
8
63
8
FY
M/C
om
po
st/V
erm
i
com
po
st
46
88
49
28
58
83
37
50
39
06
39
38
62
50
15
71
9
16
00
0
42
19
32
81
35
55
46
97
28
13
18
75
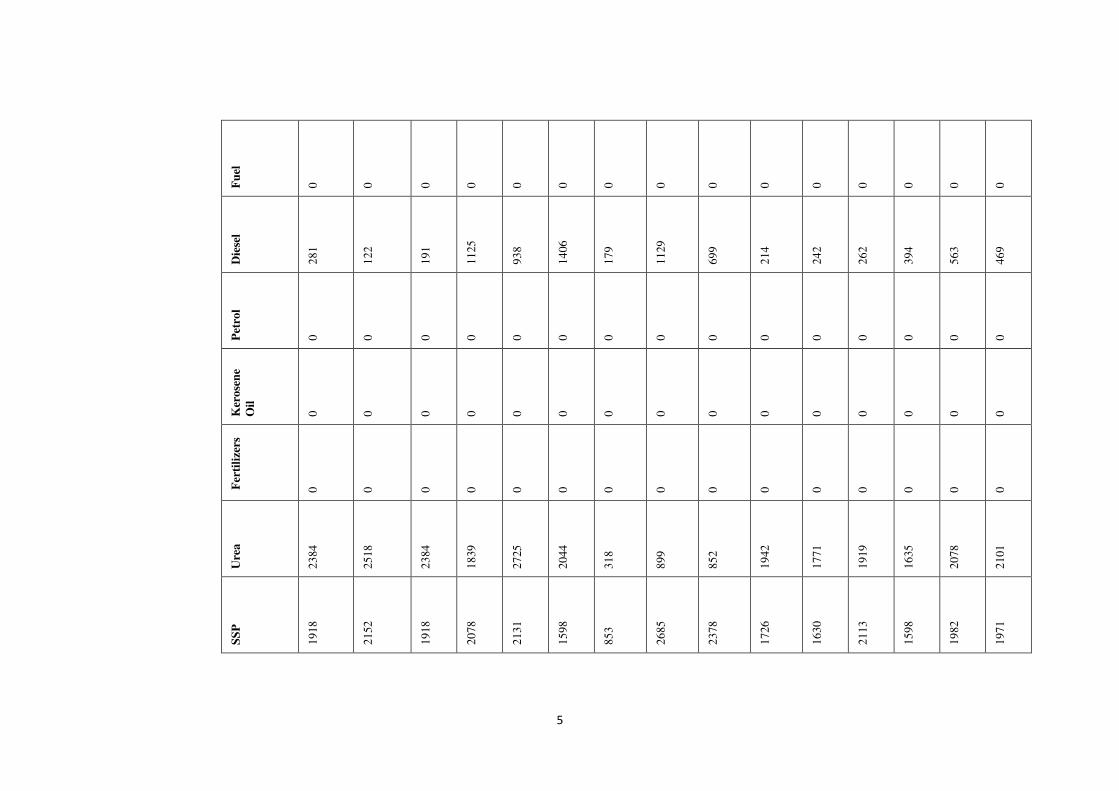
5
Fu
el
0
0
0
0
0
0
0
0
0
0
0
0
0
0
0
Die
sel
28
1
12
2
19
1
11
25
93
8
14
06
17
9
11
29
69
9
21
4
24
2
26
2
39
4
56
3
46
9
Pet
rol
0
0
0
0
0
0
0
0
0
0
0
0
0
0
0
Ker
ose
ne
Oil
0
0
0
0
0
0
0
0
0
0
0
0
0
0
0
Fer
tili
zers
0
0
0
0
0
0
0
0
0
0
0
0
0
0
0
Ure
a
23
84
25
18
23
84
18
39
27
25
20
44
31
8
89
9
85
2
19
42
17
71
19
19
16
35
20
78
21
01
SS
P
19
18
21
52
19
18
20
78
21
31
15
98
85
3
26
85
23
78
17
26
16
30
21
13
15
98
19
82
19
71

6
MO
P
57
50
55
00
35
94
53
91
35
94
35
94
67
1
17
54
15
81
30
19
35
94
38
93
33
06
35
94
35
94
Zin
c
Su
lph
ate
15
00
16
20
87
5
70
0
41
7
50
0
0
0
0
75
0
50
0
81
3
93
5
87
5
62
5
Oth
er
0
0
0
0
0
0
0
0
0
0
0
0
0
0
0
Pla
nt
pro
tect
ion
chem
ica
ls
0
0
0
0
0
0
0
0
0
0
0
0
0
0
0
Fu
ng
icid
e
11
75
94
1
52
6
0
0
0
0
0
0
58
8
68
8
78
1
68
8
62
5
26
0
Her
bic
ide
0
0
0
0
0
0
0
0
0
0
0
0
0
0
0
Inse
ctic
ide
0
0
0
0
0
0
0
0
0
0
0
0
0
0
0

7
Co
st A
34
44
0
34
74
7
32
30
5
32
85
2
28
37
2
30
56
1
42
89
3
96
42
3
78
18
5
30
92
2
30
25
1
31
24
4
34
81
5
36
60
4
30
80
3
Co
st B
24
11
24
32
22
61
23
00
19
86
21
39
30
03
67
50
54
73
21
65
21
18
21
87
24
37
25
62
21
56
Co
st C
36
85
1
37
17
9
34
56
6
35
15
1
30
35
8
32
70
0
45
89
6
10
31
73
83
65
8
33
08
6
32
36
8
33
43
1
37
25
2
39
16
6
32
95
9
Gro
ss
inco
me
83
02
5
85
67
9
74
06
3
75
00
0
62
50
0
75
00
0
14
06
25
26
93
75
31
25
00
10
02
50
75
37
5
75
93
8
80
62
5
84
37
5
75
18
8
Net
in
com
e
46
17
4
48
50
0
39
49
7
39
84
9
32
14
2
42
30
0
94
72
9
16
62
02
22
88
42
67
16
4
43
00
7
42
50
7
43
37
3
45
20
9
42
22
9
BC
Ra
tio 2.2
5
2.3
0
2.1
4
2.1
3
2.0
6
2.2
9
3.0
6
2.6
1
3.7
4
3.0
3
2.3
3
2.2
7
2.1
6
2.1
5
2.2
8

8
III. Ground Nut
Hea
ds
Go
ma
ti
So
uth
Tri
pu
ra
Kh
ow
ai
Dh
ala
i
Du
lal
Da
s
Ra
mes
h
Da
s
Ba
bu
l D
as
Jib
on
Ra
njo
n
Tri
pu
ra
Ta
pan
Deb
na
th
An
u D
att
a
Nim
oy
Ra
nk
ho
l
Ka
rna
sil
Kis
ho
r
Jam
ati
ya
Da
ya
l
may
a
Ka
ipen
g
Ra
bin
dra
Ch
Da
s
Sa
nji
t D
as
Kis
ho
r D
as
Ma
n
La
bou
rs
15
78
1
15
12
4
15
62
5
20
31
3
19
65
6
15
62
5
26
56
3
21
87
5
21
09
4
14
78
0
16
01
2
15
91
2
PT
84
89
94
89
26
04
2
13
02
1
13
02
1
26
04
2
26
04
2
13
02
1
13
02
1
10
48
9
11
49
4
11
39
4
See
d
63
34
72
09
48
13
42
00
50
75
48
13
45
50
45
50
47
25
82
40
83
61
82
61
FY
M/C
om
po
st/
28
13
23
50
27
20
51
56
46
93
50
63
46
88
46
88
46
92
27
13
36
10
35
10
Die
sel
87
5
76
5
86
4
89
1
75
9
93
8
14
06
84
4
71
3
58
7
78
7
58
7
Ure
a
43
2
40
5
57
6
40
1
43
0
68
8
55
0
34
4
37
2
54
12
35
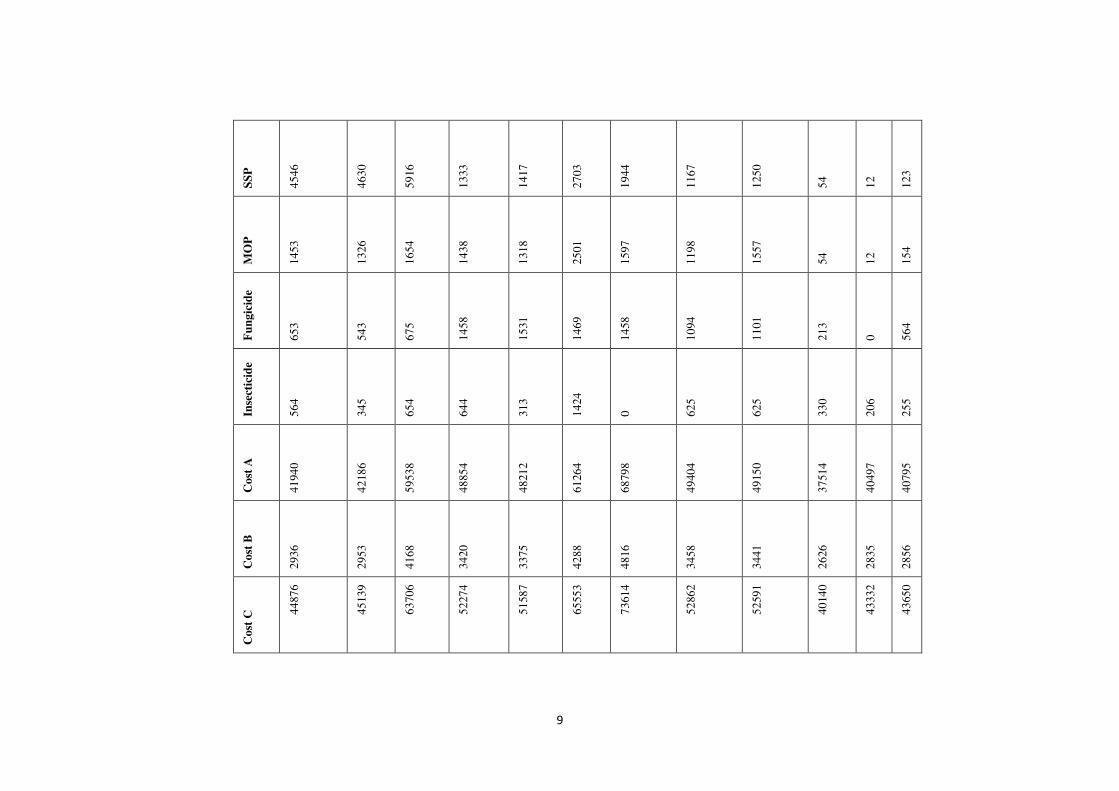
9
SS
P
45
46
46
30
59
16
13
33
14
17
27
03
19
44
11
67
12
50
54
12
12
3
MO
P
14
53
13
26
16
54
14
38
13
18
25
01
15
97
11
98
15
57
54
12
15
4
Fu
ng
icid
e
65
3
54
3
67
5
14
58
15
31
14
69
14
58
10
94
11
01
21
3
0
56
4
Inse
ctic
ide
56
4
34
5
65
4
64
4
31
3
14
24
0
62
5
62
5
33
0
20
6
25
5
Co
st A
41
94
0
42
18
6
59
53
8
48
85
4
48
21
2
61
26
4
68
79
8
49
40
4
49
15
0
37
51
4
40
49
7
40
79
5
Co
st B
29
36
29
53
41
68
34
20
33
75
42
88
48
16
34
58
34
41
26
26
28
35
28
56
Co
st C
44
87
6
45
13
9
63
70
6
52
27
4
51
58
7
65
55
3
73
61
4
52
86
2
52
59
1
40
14
0
43
33
2
43
65
0
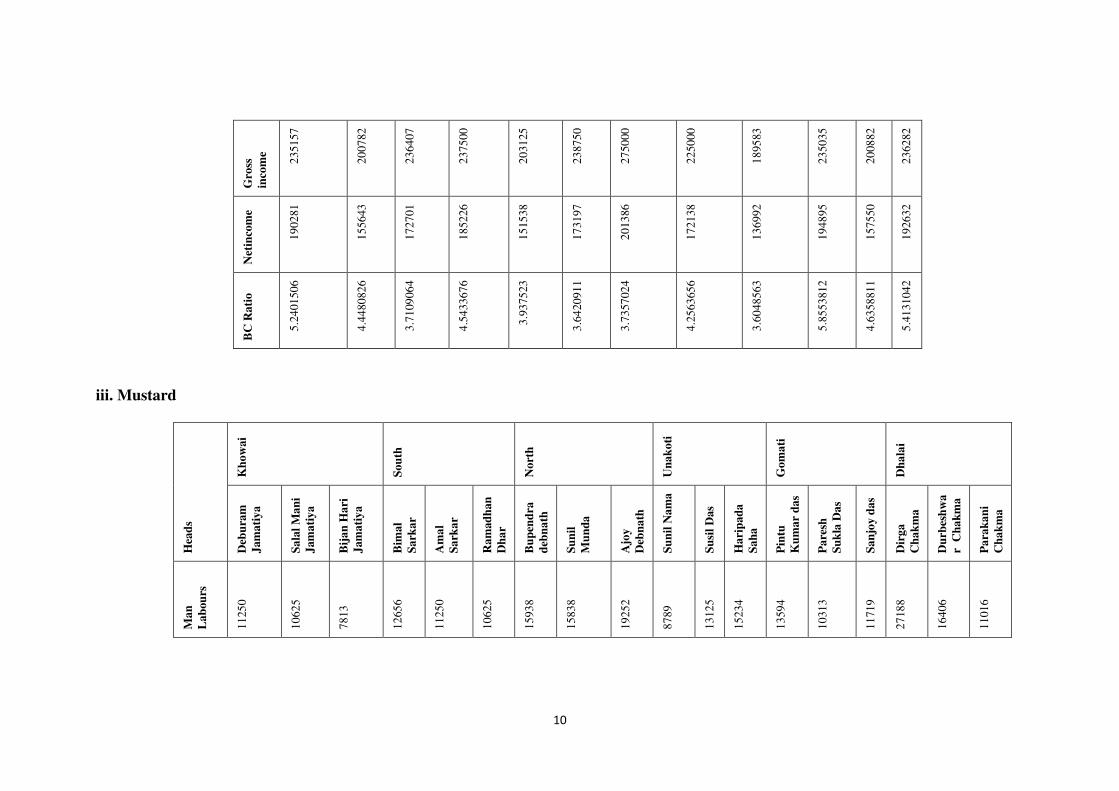
10
Gro
ss
inco
me
23
51
57
20
07
82
23
64
07
23
75
00
20
31
25
23
87
50
27
50
00
22
50
00
18
95
83
23
50
35
20
08
82
23
62
82
Net
inco
me
19
02
81
15
56
43
17
27
01
18
52
26
15
15
38
17
31
97
20
13
86
17
21
38
13
69
92
19
48
95
15
75
50
19
26
32
BC
Ra
tio
5.2
401
50
6
4.4
480
82
6
3.7
109
06
4
4.5
433
67
6
3.9
375
23
3.6
420
91
1
3.7
357
02
4
4.2
563
65
6
3.6
048
56
3
5.8
553
81
2
4.6
358
81
1
5.4
131
04
2
iii. Mustard
Hea
ds
Kh
ow
ai
So
uth
No
rth
Un
ak
oti
Go
ma
ti
Dh
ala
i
Deb
ura
m
Jam
ati
ya
Sa
lal
Ma
ni
Jam
ati
ya
Bij
an
Ha
ri
Jam
ati
ya
Bim
al
Sa
rka
r
Am
al
Sa
rka
r
Ra
mad
han
Dh
ar
Bu
pen
dra
deb
na
th
Su
nil
Mu
nd
a
Ajo
y
Deb
na
th
Su
nil
Na
ma
Su
sil
Da
s
Ha
rip
ad
a
Sa
ha
Pin
tu
Ku
ma
r d
as
Pa
resh
Su
kla
Da
s
Sa
njo
y d
as
Dir
ga
Ch
ak
ma
Du
rbes
hw
a
r C
ha
km
a
Pa
rak
an
i
Ch
ak
ma
Ma
n
La
bou
rs
11
25
0
10
62
5
78
13
12
65
6
11
25
0
10
62
5
15
93
8
15
83
8
19
25
2
87
89
13
12
5
15
23
4
13
59
4
10
31
3
11
71
9
27
18
8
16
40
6
11
01
6
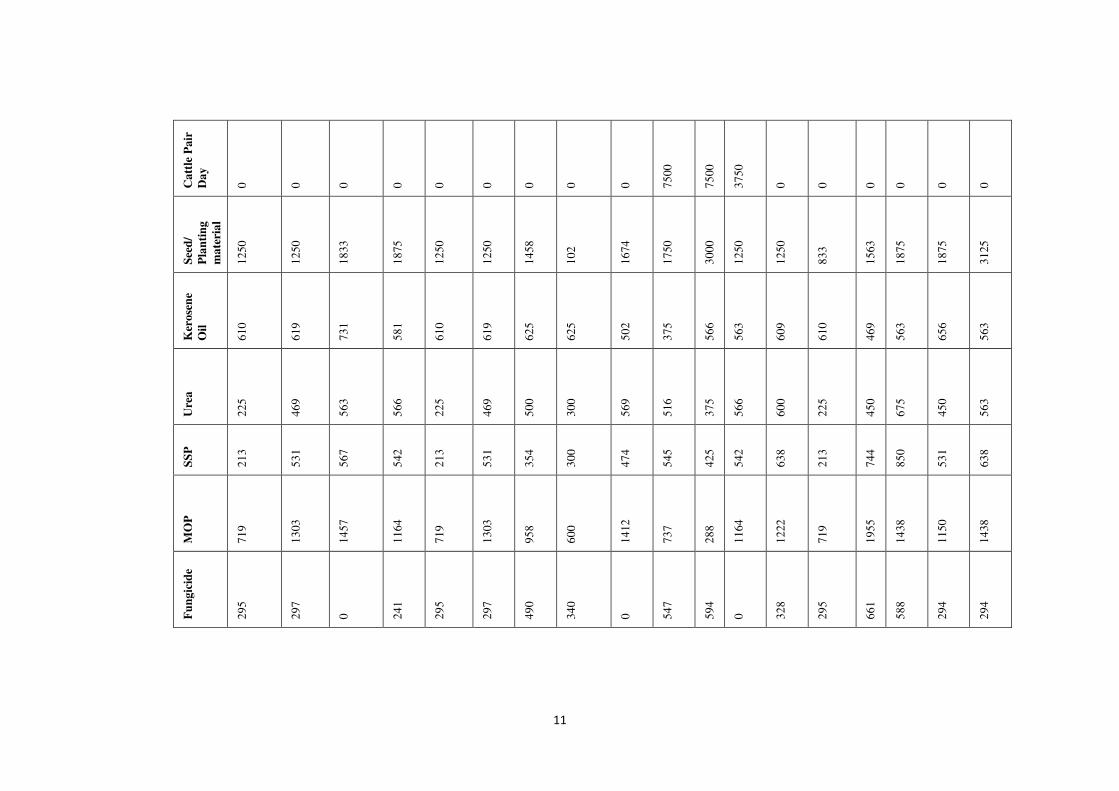
11
Ca
ttle
Pa
ir
Da
y
0
0
0
0
0
0
0
0
0
75
00
75
00
37
50
0
0
0
0
0
0
See
d/
Pla
nti
ng
ma
teri
al
12
50
12
50
18
33
18
75
12
50
12
50
14
58
10
2
16
74
17
50
30
00
12
50
12
50
83
3
15
63
18
75
18
75
31
25
Ker
ose
ne
Oil
61
0
61
9
73
1
58
1
61
0
61
9
62
5
62
5
50
2
37
5
56
6
56
3
60
9
61
0
46
9
56
3
65
6
56
3
Ure
a
22
5
46
9
56
3
56
6
22
5
46
9
50
0
30
0
56
9
51
6
37
5
56
6
60
0
22
5
45
0
67
5
45
0
56
3
SS
P
21
3
53
1
56
7
54
2
21
3
53
1
35
4
30
0
47
4
54
5
42
5
54
2
63
8
21
3
74
4
85
0
53
1
63
8
MO
P
71
9
13
03
14
57
11
64
71
9
13
03
95
8
60
0
14
12
73
7
28
8
11
64
12
22
71
9
19
55
14
38
11
50
14
38
Fu
ng
icid
e
29
5
29
7
0
24
1
29
5
29
7
49
0
34
0
0
54
7
59
4
0
32
8
29
5
66
1
58
8
29
4
29
4

12
Inse
ctic
ide
0
29
2
38
0
50
0
0
29
2
0
0
98
2
0
0
93
8
50
0
0
43
8
0
0
0
Co
st A
14
56
0
15
38
6
13
34
3
18
12
6
14
56
0
15
38
6
20
32
3
18
10
5
24
86
6
20
75
8
25
87
3
24
00
7
18
74
1
13
20
6
17
99
8
33
17
5
21
36
3
17
63
4
Co
st B
10
19
10
77
93
4
12
69
10
19
10
77
14
23
12
67
17
41
14
53
18
11
16
80
13
12
92
4
12
60
23
22
14
95
12
34
Co
st C
15
58
0
16
46
3
14
27
7
19
39
4
15
58
0
16
46
3
21
74
6
19
37
2
26
60
7
22
21
1
27
68
4
25
68
7
20
05
2
14
13
1
19
25
8
35
49
7
22
85
8
18
86
9
Gro
ss
Inco
me
50
34
8
50
53
1
49
91
9
49
21
9
50
34
8
50
53
1
50
53
1
65
00
0
64
59
0
49
21
9
50
75
0
54
68
8
49
65
6
50
31
3
49
87
5
98
00
0
50
31
3
50
31
3
Net
in
com
e
34
76
8
34
06
8
35
64
2
29
82
5
34
76
8
34
06
8
28
78
5
45
62
8
37
98
3
27
00
8
23
06
6
29
00
1
29
60
4
36
18
2
30
61
7
62
50
3
27
45
5
31
44
4
BC
Ra
tio
3.2
3
3.0
7
3.5
0
2.5
4
3.2
3
3.0
7
2.3
2
3.3
6
2.4
3
2.2
2
1.8
3
2.1
3
2.4
8
3.5
6
2.5
9
2.7
6
2.2
0
2.6
7
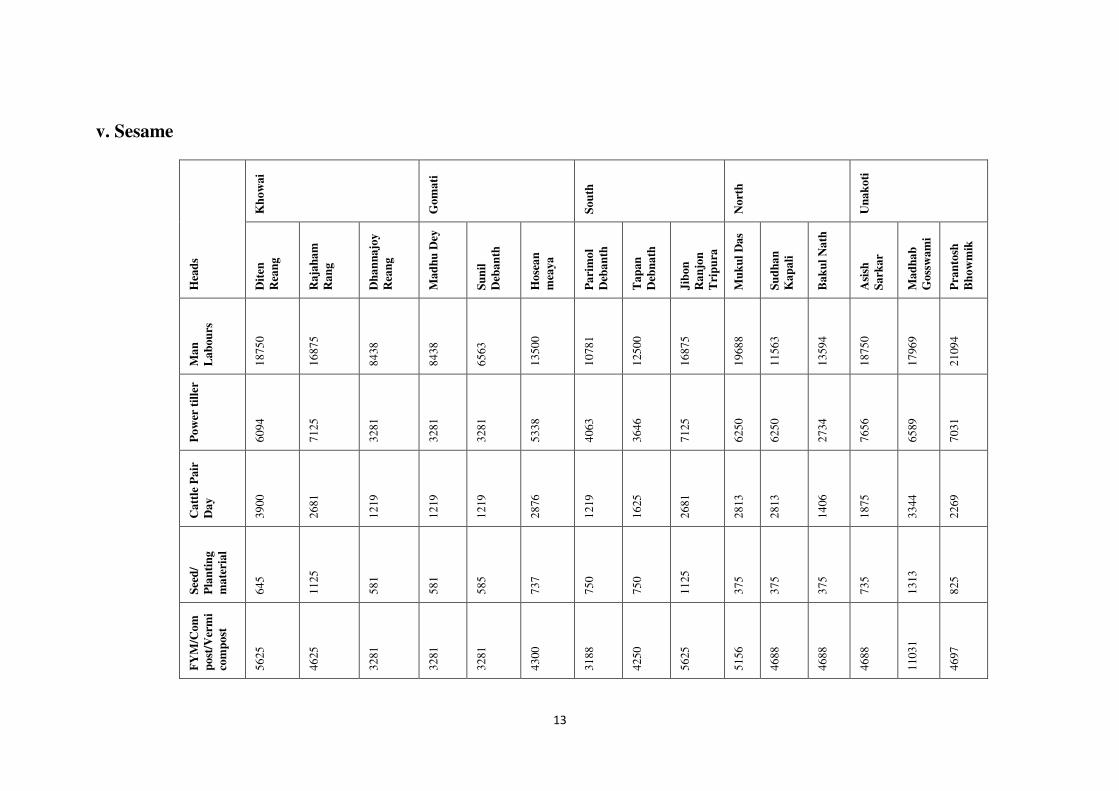
13
v. Sesame
Hea
ds
Kh
ow
ai
Go
ma
ti
So
uth
No
rth
Un
ak
oti
Dit
en
Rea
ng
Ra
jah
am
Ra
ng
Dh
an
na
joy
Rea
ng
Ma
dh
u D
ey
Su
nil
Deb
an
th
Ho
sea
n
mea
ya
Pa
rim
ol
Deb
an
th
Ta
pan
Deb
na
th
Jib
on
Ra
njo
n
Tri
pu
ra
Mu
ku
l D
as
Su
dh
an
Ka
pa
li
Ba
ku
l N
ath
Asi
sh
Sa
rka
r
Ma
dh
ab
Go
ssw
am
i
Pra
nto
sh
Bh
ow
mik
Ma
n
La
bou
rs
18
75
0
16
87
5
84
38
84
38
65
63
13
50
0
10
78
1
12
50
0
16
87
5
19
68
8
11
56
3
13
59
4
18
75
0
17
96
9
21
09
4
Po
wer
til
ler
60
94
71
25
32
81
32
81
32
81
53
38
40
63
36
46
71
25
62
50
62
50
27
34
76
56
65
89
70
31
Ca
ttle
Pa
ir
Da
y
39
00
26
81
12
19
12
19
12
19
28
76
12
19
16
25
26
81
28
13
28
13
14
06
18
75
33
44
22
69
See
d/
Pla
nti
ng
ma
teri
al
64
5
11
25
58
1
58
1
58
5
73
7
75
0
75
0
11
25
37
5
37
5
37
5
73
5
13
13
82
5
FY
M/C
om
po
st/V
erm
i
com
po
st
56
25
46
25
32
81
32
81
32
81
43
00
31
88
42
50
56
25
51
56
46
88
46
88
46
88
11
03
1
46
97
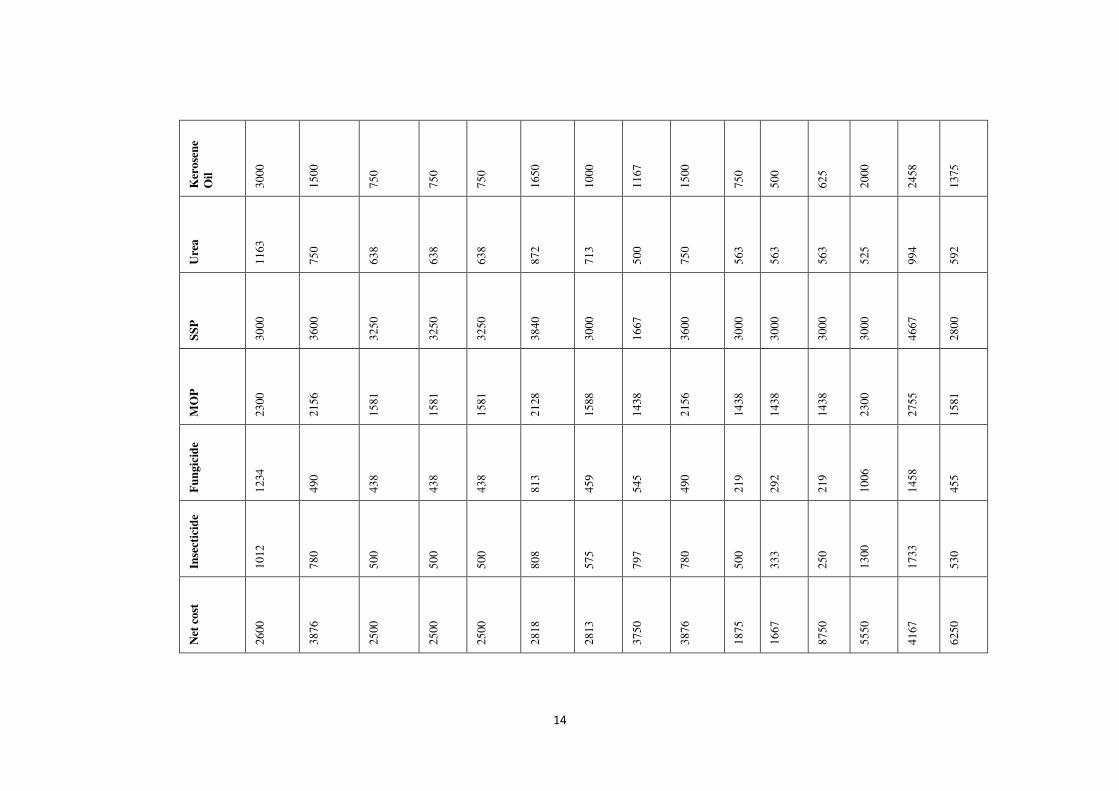
14
Ker
ose
ne
Oil
30
00
15
00
75
0
75
0
75
0
16
50
10
00
11
67
15
00
75
0
50
0
62
5
20
00
24
58
13
75
Ure
a
11
63
75
0
63
8
63
8
63
8
87
2
71
3
50
0
75
0
56
3
56
3
56
3
52
5
99
4
59
2
SS
P
30
00
36
00
32
50
32
50
32
50
38
40
30
00
16
67
36
00
30
00
30
00
30
00
30
00
46
67
28
00
MO
P
23
00
21
56
15
81
15
81
15
81
21
28
15
88
14
38
21
56
14
38
14
38
14
38
23
00
27
55
15
81
Fu
ng
icid
e
12
34
49
0
43
8
43
8
43
8
81
3
45
9
54
5
49
0
21
9
29
2
21
9
10
06
14
58
45
5
Inse
ctic
ide
10
12
78
0
50
0
50
0
50
0
80
8
57
5
79
7
78
0
50
0
33
3
25
0
13
00
17
33
53
0
Net
co
st
26
00
38
76
25
00
25
00
25
00
28
18
28
13
37
50
38
76
18
75
16
67
87
50
55
50
41
67
62
50

15
Co
st a
49
32
2
46
58
4
26
45
6
26
45
6
24
58
5
39
87
9
30
14
8
32
63
4
46
58
4
42
62
5
33
47
9
37
64
1
49
38
5
58
47
7
49
49
9
Co
st B
34
53
32
61
18
52
18
52
17
21
27
92
21
10
22
84
32
61
29
84
23
44
26
35
34
57
40
93
34
65
Co
st C
52
77
5
49
84
5
28
30
8
28
30
8
26
30
6
42
67
0
32
25
8
34
91
8
49
84
5
45
60
9
35
82
3
40
27
5
52
84
2
62
57
0
52
96
4
Yie
ld
10
13
35
96
75
0
94
50
0
94
50
0
95
62
5
96
39
2
10
01
25
79
31
3
96
75
0
10
09
38
97
96
9
98
56
3
92
03
1
16
40
73
89
06
3
Net
in
com
e
48
56
0
46
90
5
66
19
2
66
19
2
69
31
9
53
72
2
67
86
7
44
39
5
46
90
5
55
32
9
62
14
6
58
28
8
39
18
9
10
15
03
36
09
9
BC
Ra
tio
1.9
2
1.9
4
3.3
4
3.3
4
3.6
4
2.2
6
3.1
0
2.2
7
1.9
4
2.2
1
2.7
3
2.4
5
1.7
4
2.6
2
1.6
8

16
vi. Lentil
Hea
ds
Dh
ala
i
No
rth
So
uth
Tri
pu
ra
Wes
t
Tri
pu
ra
Go
ma
ti
Kh
ow
ai
Tri
pu
ra
So
na
llax
mi
Mo
lsom
An
il R
ema
Sa
bit
a
Mo
lsom
Go
urd
han
Ch
ow
dh
ury
Bij
oy
Sa
rka
r
Ra
nji
t
Sa
rka
r
Pra
mod
Pa
ul
Ta
pan
Deb
na
th
Jib
an
Ra
njo
n
Tri
pu
ra
Din
esh
Deb
ba
rma
Nir
ma
l
Deb
ba
ma
Su
shil
Deb
ba
rma
Mri
tun
joy
Ru
dra
Pa
ul
Ba
da
l D
eb
An
an
ta
Ka
loi
Sa
tya
Ku
ma
r
Ra
nk
ha
l
Bir
ku
ma
r
Ra
nk
ha
l
Bis
wa
jit
Da
s
Ma
n
La
bou
rs
13
02
5
15
00
0
10
31
3
12
65
6
12
65
6
93
75
13
12
5
13
12
5
13
59
4
13
12
5
87
50
14
06
3
12
02
5
14
00
0
14
06
3
13
12
5
15
00
0
14
06
3
Ca
ttle
Pa
ir
Da
y
13
42
2
62
50
12
50
0
62
50
70
31
26
04
70
31
70
31
70
31
62
50
41
67
31
25
12
42
2
52
50
31
25
70
31
62
50
31
25
See
d
13
24
2
48
75
18
00
45
00
56
25
19
20
60
94
60
94
60
94
58
13
52
50
41
25
12
24
2
38
75
52
50
60
94
48
75
52
50
Die
sel
23
8
28
8
11
50
28
8
28
8
38
3
28
8
28
8
28
8
28
8
19
2
14
4
20
0
20
0
25
9
28
8
28
8
25
9
Ure
a
44
9
37
5
37
5
31
9
41
3
37
5
46
9
46
9
46
9
42
2
27
5
33
8
40
4
33
0
37
5
46
9
37
5
37
5

17
SS
P
44
9
63
75
63
75
55
78
58
44
46
04
79
69
79
69
79
69
81
02
42
50
58
44
40
4
63
30
63
75
79
69
63
75
63
75
MO
P
44
9
10
06
14
38
86
3
10
78
95
8
12
58
12
58
12
58
89
8
95
8
86
3
40
4
96
1
10
06
12
58
10
06
10
06
Co
st A
40
65
9
34
16
9
33
95
0
30
45
3
32
93
4
20
22
0
36
23
3
36
23
3
36
70
2
34
89
7
23
84
2
28
50
0
38
10
0
30
94
6
30
45
3
36
23
3
34
16
9
30
45
3
Co
st B
28
46
23
92
23
77
21
32
23
05
14
15
25
36
25
36
25
69
24
43
16
69
19
95
26
67
21
66
21
32
25
36
23
92
21
32
Co
st C
43
50
5
36
56
1
36
32
7
32
58
5
35
24
0
21
63
5
38
76
9
38
76
9
39
27
1
37
34
0
25
51
1
30
49
5
40
76
7
33
11
2
32
58
4
38
76
9
36
56
1
32
58
4
Gro
ss
inco
me
12
27
49
12
37
50
82
50
0
10
87
50
10
87
50
97
50
0
12
37
50
12
37
50
11
62
50
11
62
50
11
25
00
11
40
00
12
29
82
12
39
83
82
73
3
12
37
50
12
37
50
11
25
00
Net
in
com
e
79
24
4
87
18
9
46
17
3
76
16
5
73
51
0
75
86
5
84
98
1
84
98
1
76
97
9
78
91
0
86
98
9
83
50
5
82
21
5
90
87
1
50
14
9
84
98
1
87
18
9
79
91
6
BC
Ra
tio
2.8
2
3.3
8
2.2
7
3.3
4
3.0
9
4.5
1
3.1
9
3.1
9
2.9
6
3.1
1
4.4
1
3.7
4
3.0
2
3.7
4
2.5
4
3.1
9
3.3
8
3.4
5
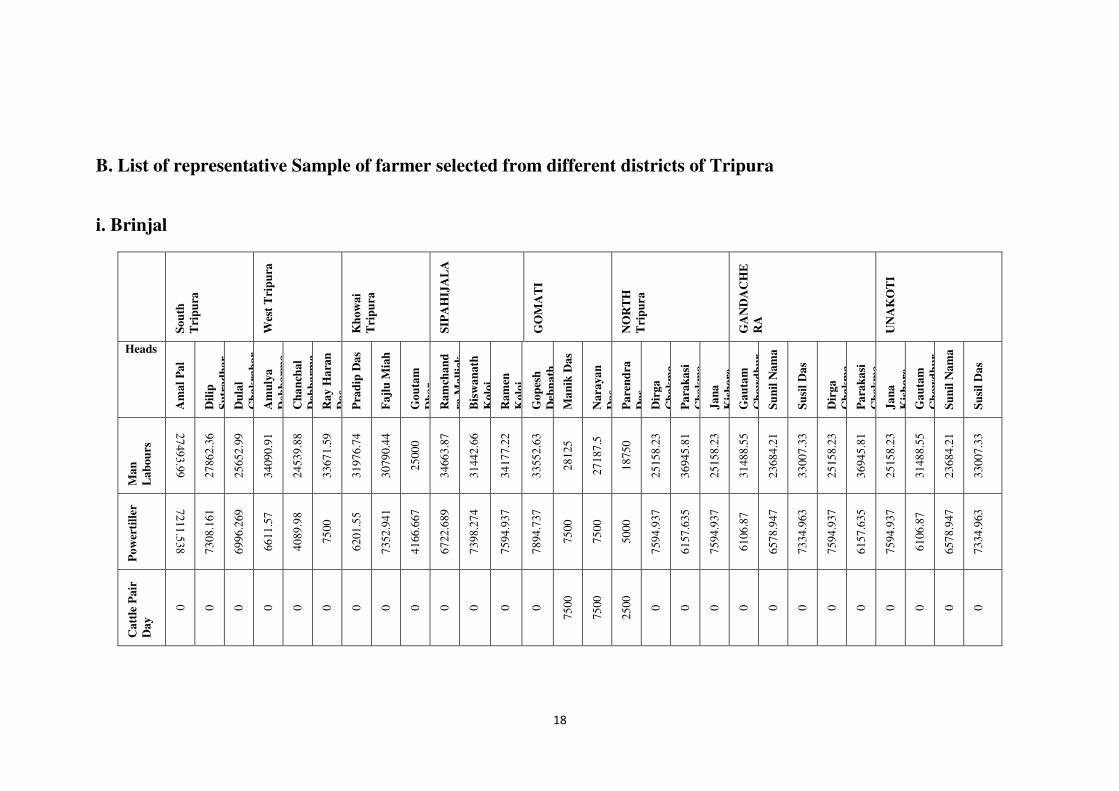
18
B. List of representative Sample of farmer selected from different districts of Tripura
i. Brinjal
So
uth
Tri
pu
ra
Wes
t T
rip
ura
Kh
ow
ai
Tri
pu
ra
SIP
AH
IJA
LA
GO
MA
TI
NO
RT
H
Tri
pu
ra
GA
ND
AC
HE
RA
UN
AK
OT
I
Heads
Am
al
Pa
l
Dil
ip
Su
tra
dh
ar
Du
lal
Ch
ak
rab
or
Am
uly
a
Deb
ba
rma
Ch
an
chal
Deb
ba
rma
Ra
y H
ara
n
Da
s
Pra
dip
Da
s
Fa
jlu
Mia
h
Go
uta
m
Dh
ar
Ra
mch
an
d
ra M
all
ick
Bis
wa
na
th
Ko
loi
Ra
men
Ko
loi
Go
pes
h
Deb
na
th
Ma
nik
Da
s
Na
raya
n
Da
s
Pa
ren
dra
Da
s
Dir
ga
Ch
ak
ma
Pa
rak
asi
Ch
ak
ma
Ja
na
Kis
ho
re
Ga
uta
m
Ch
ow
dh
ur
Su
nil
Na
ma
Su
sil
Da
s
Dir
ga
Ch
ak
ma
Pa
rak
asi
Ch
ak
ma
Ja
na
Kis
ho
re
Ga
uta
m
Ch
ow
dh
ur
Su
nil
Na
ma
Su
sil
Da
s
Ma
n
La
bou
rs
27
49
3.9
9 2
786
2.3
6
25
65
2.9
9
34
09
0.9
1
24
53
9.8
8
33
67
1.5
9
31
97
6.7
4
30
79
0.4
4
25
00
0
34
66
3.8
7
31
44
2.6
6
34
17
7.2
2
33
55
2.6
3
28
12
5
27
18
7.5
18
75
0
25
15
8.2
3
36
94
5.8
1
25
15
8.2
3
31
48
8.5
5
23
68
4.2
1
33
00
7.3
3
25
15
8.2
3
36
94
5.8
1
25
15
8.2
3
31
48
8.5
5
23
68
4.2
1
33
00
7.3
3
Po
wer
till
er 7
211
.538 7
308
.161
69
96
.269
66
11
.57
40
89
.98
75
00
62
01
.55
73
52
.941
41
66
.667
67
22
.689
73
98
.274
75
94
.937
78
94
.737
75
00
75
00
50
00
75
94
.937
61
57
.635
75
94
.937
61
06
.87
65
78
.947
73
34
.963
75
94
.937
61
57
.635
75
94
.937
61
06
.87
65
78
.947
73
34
.963
Ca
ttle
Pa
ir
Da
y
0 0
0
0
0
0
0
0
0
0
0
0
0
75
00
75
00
25
00
0
0
0
0
0
0
0
0
0
0
0
0
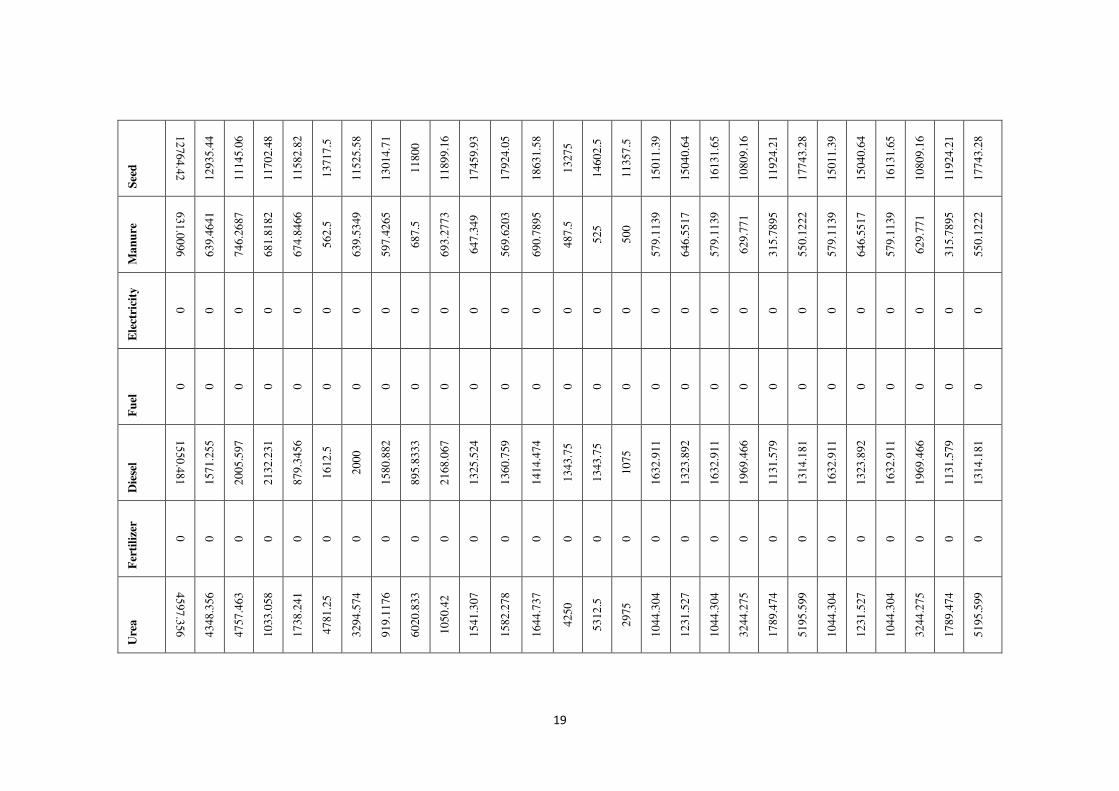
19
See
d
12
76
4.4
2 1
293
5.4
4
11
14
5.0
6
11
70
2.4
8
11
58
2.8
2
13
71
7.5
11
52
5.5
8
13
01
4.7
1
11
80
0
11
89
9.1
6
17
45
9.9
3
17
92
4.0
5
18
63
1.5
8
13
27
5
14
60
2.5
11
35
7.5
15
01
1.3
9
15
04
0.6
4
16
13
1.6
5
10
80
9.1
6
11
92
4.2
1
17
74
3.2
8
15
01
1.3
9
15
04
0.6
4
16
13
1.6
5
10
80
9.1
6
11
92
4.2
1
17
74
3.2
8
Ma
nu
re
63
1.0
096
63
9.4
641
74
6.2
687
68
1.8
182
67
4.8
466
56
2.5
63
9.5
349
59
7.4
265
68
7.5
69
3.2
773
64
7.3
49
56
9.6
203
69
0.7
895
48
7.5
52
5
50
0
57
9.1
139
64
6.5
517
57
9.1
139
62
9.7
71
31
5.7
895
55
0.1
222
57
9.1
139
64
6.5
517
57
9.1
139
62
9.7
71
31
5.7
895
55
0.1
222
Ele
ctri
city
0 0
0
0
0
0
0
0
0
0
0
0
0
0
0
0
0
0
0
0
0
0
0
0
0
0
0
0
Fu
el
0 0
0
0
0
0
0
0
0
0
0
0
0
0
0
0
0
0
0
0
0
0
0
0
0
0
0
0
Die
sel
15
50
.481 1
571
.255
20
05
.597
21
32
.231
87
9.3
456
16
12
.5
20
00
15
80
.882
89
5.8
333
21
68
.067
13
25
.524
13
60
.759
14
14
.474
13
43
.75
13
43
.75
10
75
16
32
.911
13
23
.892
16
32
.911
19
69
.466
11
31
.579
13
14
.181
16
32
.911
13
23
.892
16
32
.911
19
69
.466
11
31
.579
13
14
.181
Fer
tili
zer
0 0
0
0
0
0
0
0
0
0
0
0
0
0
0
0
0
0
0
0
0
0
0
0
0
0
0
0
Ure
a
45
97
.356 4
348
.356
47
57
.463
10
33
.058
17
38
.241
47
81
.25
32
94
.574
91
9.1
176
60
20
.833
10
50
.42
15
41
.307
15
82
.278
16
44
.737
42
50
53
12
.5
29
75
10
44
.304
12
31
.527
10
44
.304
32
44
.275
17
89
.474
51
95
.599
10
44
.304
12
31
.527
10
44
.304
32
44
.275
17
89
.474
51
95
.599

20
SS
P
50
48
.077 4
384
.896
52
23
.881
28
09
.917
41
71
.779
48
00
37
20
.93
36
45
.833
60
00
28
57
.143
37
73
.12
38
73
.418
40
26
.316
45
00
54
00
30
00
26
89
.873
29
31
.034
26
89
.873
36
64
.122
18
94
.737
52
81
.174
26
89
.873
29
31
.034
26
89
.873
36
64
.122
18
94
.737
52
81
.174
MO
P
21
15
.385 1
948
.843
22
38
.806
23
80
.165
58
89
.571
22
00
14
88
.372
22
05
.882
40
00
24
20
.168
32
55
.24
30
37
.975
34
73
.684
20
00
24
00
17
33
.333
33
41
.772
29
55
.665
33
41
.772
14
65
.649
10
10
.526
19
55
.99
33
41
.772
29
55
.665
33
41
.772
14
65
.649
10
10
.526
19
55
.99
Fu
ng
icid
e
99
5.1
923 1
008
.526
10
81
.701
15
20
.661
94
0.6
953
58
2.1
875
57
0.5
426
19
73
.039
95
8.3
333
15
46
.218
14
18
.002
11
64
.557
15
13
.158
23
0
23
2.3
058
10
78
.125
17
46
.835
16
99
.507
10
48
.101
56
1.8
321
39
47
.368
11
24
.694
17
46
.835
16
99
.507
10
48
.101
56
1.8
321
39
47
.368
11
24
.694
Inse
ctic
ide 1
652
.644 1
674
.787
21
37
.749
22
72
.727
13
49
.693
17
18
.75
21
31
.783
23
59
.069
13
75
23
10
.924
16
95
.438
13
92
.405
18
09
.211
13
75
13
81
.875
11
45
.833
20
88
.608
27
09
.36
20
88
.608
20
99
.237
63
15
.789
13
44
.743
20
88
.608
27
09
.36
20
88
.608
20
99
.237
63
15
.789
13
44
.743
Ba
mb
oo
42
06
.731 3
654
.08
41
97
.761
49
58
.678
67
48
.466
31
25
0
36
76
.471
45
83
.333
50
42
.017
24
66
.091
25
31
.646
26
31
.579
43
75
37
50
37
50
42
40
.506
49
26
.108
47
46
.835
0
0
0
42
40
.506
49
26
.108
47
46
.835
0
0
0
cost
A
68
26
6.8
3
67
33
6.1
8
66
18
3.5
4
70
19
4.2
1
62
60
5.3
2
74
27
1.2
7
63
54
9.6
1
68
11
5.8
1
65
48
7.5
71
37
3.9
5
72
42
2.9
3
75
20
8.8
6
77
28
2.8
9
74
96
1.2
5
77
13
5.4
3
52
86
4.7
9
65
12
8.4
8
76
56
7.7
3
66
05
6.3
3
62
03
8.9
3
58
59
2.6
3
74
85
2.0
8
65
12
8.4
8
76
56
7.7
3
66
05
6.3
3
62
03
8.9
3
58
59
2.6
3
74
85
2.0
8
cost
B
47
78
.678
47
13
.532
46
32
.847
49
13
.595
43
82
.372
51
98
.989
44
48
.473
47
68
.107
45
84
.125
49
96
.176
50
69
.605
52
64
.62
54
09
.803
52
47
.288
53
99
.48
37
00
.535
45
58
.994
53
59
.741
46
23
.943
43
42
.725
41
01
.484
52
39
.645
45
58
.994
53
59
.741
46
23
.943
43
42
.725
41
01
.484
52
39
.645
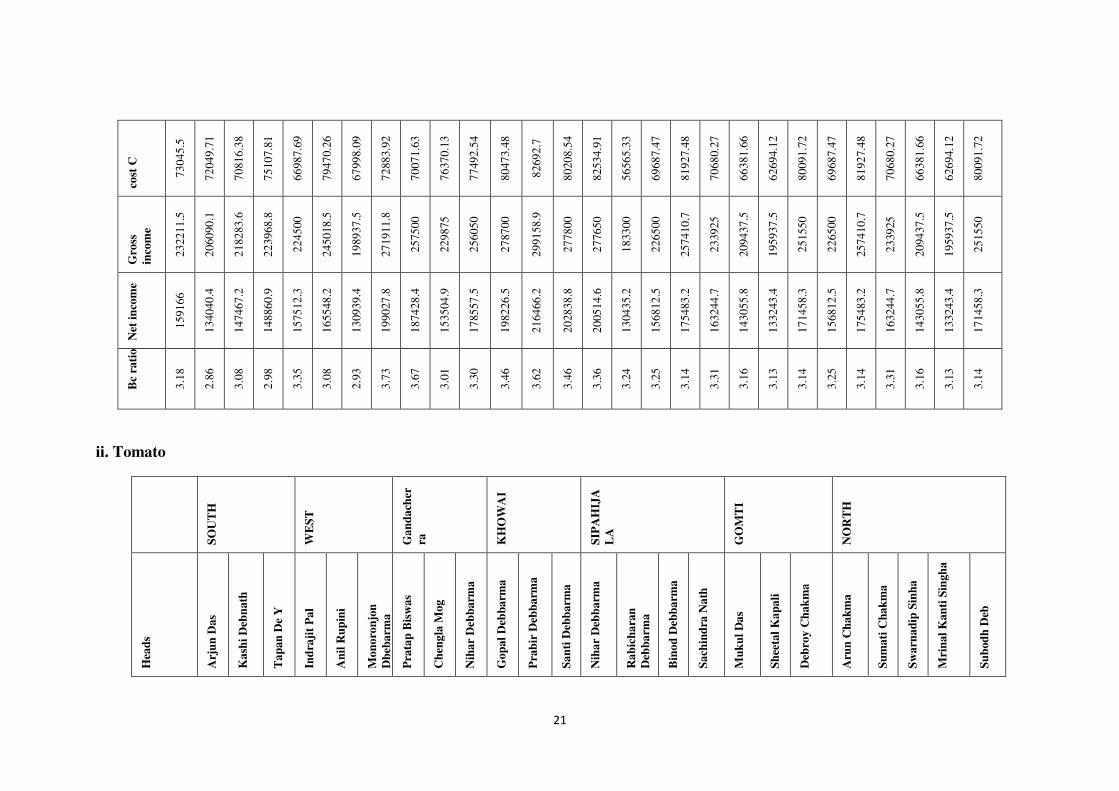
21
cost
C
73
04
5.5
72
04
9.7
1
70
81
6.3
8
75
10
7.8
1
66
98
7.6
9
79
47
0.2
6
67
99
8.0
9
72
88
3.9
2
70
07
1.6
3
76
37
0.1
3
77
49
2.5
4
80
47
3.4
8
82
69
2.7
80
20
8.5
4
82
53
4.9
1
56
56
5.3
3
69
68
7.4
7
81
92
7.4
8
70
68
0.2
7
66
38
1.6
6
62
69
4.1
2
80
09
1.7
2
69
68
7.4
7
81
92
7.4
8
70
68
0.2
7
66
38
1.6
6
62
69
4.1
2
80
09
1.7
2
Gro
ss
inco
me
23
22
11
.5
20
60
90
.1
21
82
83
.6
22
39
68
.8
22
45
00
24
50
18
.5
19
89
37
.5
27
19
11
.8
25
75
00
22
98
75
25
60
50
27
87
00
29
91
58
.9
27
78
00
27
76
50
18
33
00
22
65
00
25
74
10
.7
23
39
25
20
94
37
.5
19
59
37
.5
25
15
50
22
65
00
25
74
10
.7
23
39
25
20
94
37
.5
19
59
37
.5
25
15
50
Net
in
com
e
15
91
66
13
40
40
.4
14
74
67
.2
14
88
60
.9
15
75
12
.3
16
55
48
.2
13
09
39
.4
19
90
27
.8
18
74
28
.4
15
35
04
.9
17
85
57
.5
19
82
26
.5
21
64
66
.2
20
28
38
.8
20
05
14
.6
13
04
35
.2
15
68
12
.5
17
54
83
.2
16
32
44
.7
14
30
55
.8
13
32
43
.4
17
14
58
.3
15
68
12
.5
17
54
83
.2
16
32
44
.7
14
30
55
.8
13
32
43
.4
17
14
58
.3
Bc
rati
o
3.1
8
2.8
6
3.0
8
2.9
8
3.3
5
3.0
8
2.9
3
3.7
3
3.6
7
3.0
1
3.3
0
3.4
6
3.6
2
3.4
6
3.3
6
3.2
4
3.2
5
3.1
4
3.3
1
3.1
6
3.1
3
3.1
4
3.2
5
3.1
4
3.3
1
3.1
6
3.1
3
3.1
4
ii. Tomato
SO
UT
H
WE
ST
Ga
nd
ach
er
ra
KH
OW
AI
SIP
AH
IJA
LA
GO
MT
I
NO
RT
H
Hea
ds
Arj
un
Da
s
Ka
shi
Deb
na
th
Ta
pan
De
Y
Ind
raji
t P
al
An
il R
up
ini
Mo
no
ron
jon
Db
eba
rma
Pra
tap
Bis
wa
s
Ch
eng
la M
og
Nih
ar
Deb
ba
rma
Go
pa
l D
ebb
arm
a
Pra
bir
Deb
ba
rma
Sa
nti
Deb
ba
rma
Nih
ar
Deb
ba
rma
Ra
bic
ha
ran
Deb
ba
rma
Bin
od
Deb
ba
rma
Sa
chin
dra
Na
th
Mu
ku
l D
as
Sh
eeta
l K
ap
ali
Deb
roy
Ch
ak
ma
Aru
n C
ha
km
a
Su
ma
ti C
ha
km
a
Sw
arn
ad
ip S
inh
a
Mri
na
l K
an
ti S
ingh
a
Su
bod
h D
eb
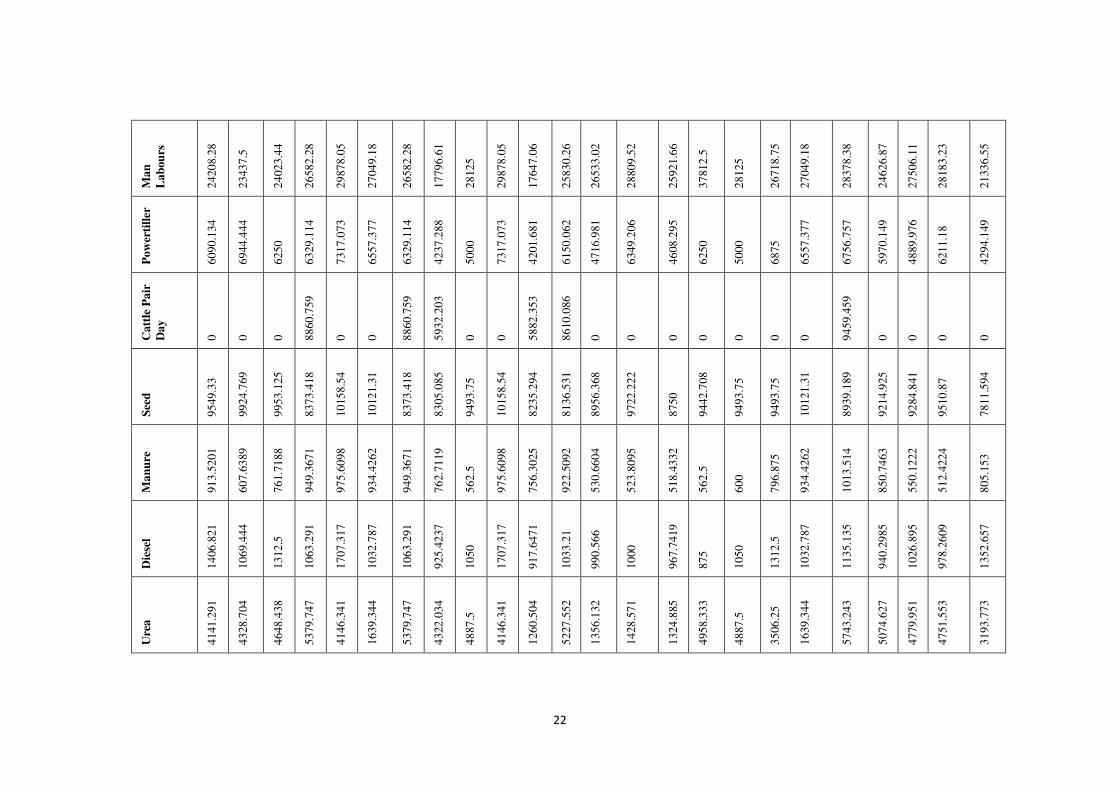
22
Ma
n
La
bou
rs
24
20
8.2
8
23
43
7.5
24
02
3.4
4
26
58
2.2
8
29
87
8.0
5
27
04
9.1
8
26
58
2.2
8
17
79
6.6
1
28
12
5
29
87
8.0
5
17
64
7.0
6
25
83
0.2
6
26
53
3.0
2
28
80
9.5
2
25
92
1.6
6
37
81
2.5
28
12
5
26
71
8.7
5
27
04
9.1
8
28
37
8.3
8
24
62
6.8
7
27
50
6.1
1
28
18
3.2
3
21
33
6.5
5
Po
wer
till
er
60
90
.134
69
44
.444
62
50
63
29
.114
73
17
.073
65
57
.377
63
29
.114
42
37
.288
50
00
73
17
.073
42
01
.681
61
50
.062
47
16
.981
63
49
.206
46
08
.295
62
50
50
00
68
75
65
57
.377
67
56
.757
59
70
.149
48
89
.976
62
11
.18
42
94
.149
Ca
ttle
Pa
ir
Da
y
0
0
0
88
60
.759
0
0
88
60
.759
59
32
.203
0
0
58
82
.353
86
10
.086
0
0
0
0
0
0
0
94
59
.459
0
0
0
0
See
d
95
49
.33
99
24
.769
99
53
.125
83
73
.418
10
15
8.5
4
10
12
1.3
1
83
73
.418
83
05
.085
94
93
.75
10
15
8.5
4
82
35
.294
81
36
.531
89
56
.368
97
22
.222
87
50
94
42
.708
94
93
.75
94
93
.75
10
12
1.3
1
89
39
.189
92
14
.925
92
84
.841
95
10
.87
78
11
.594
Ma
nu
re
91
3.5
201
60
7.6
389
76
1.7
188
94
9.3
671
97
5.6
098
93
4.4
262
94
9.3
671
76
2.7
119
56
2.5
97
5.6
098
75
6.3
025
92
2.5
092
53
0.6
604
52
3.8
095
51
8.4
332
56
2.5
60
0
79
6.8
75
93
4.4
262
10
13
.514
85
0.7
463
55
0.1
222
51
2.4
224
80
5.1
53
Die
sel
14
06
.821
10
69
.444
13
12
.5
10
63
.291
17
07
.317
10
32
.787
10
63
.291
92
5.4
237
10
50
17
07
.317
91
7.6
471
10
33
.21
99
0.5
66
10
00
96
7.7
419
87
5
10
50
13
12
.5
10
32
.787
11
35
.135
94
0.2
985
10
26
.895
97
8.2
609
13
52
.657
Ure
a
41
41
.291
43
28
.704
46
48
.438
53
79
.747
41
46
.341
16
39
.344
53
79
.747
43
22
.034
48
87
.5
41
46
.341
12
60
.504
52
27
.552
13
56
.132
14
28
.571
13
24
.885
49
58
.333
48
87
.5
35
06
.25
16
39
.344
57
43
.243
50
74
.627
47
79
.951
47
51
.553
31
93
.773

23
SS
P
43
84
.896
33
33
.333
41
25
54
68
.354
42
92
.683
41
80
.328
54
68
.354
40
67
.797
36
00
42
92
.683
28
57
.143
53
13
.653
24
05
.66
26
98
.413
23
50
.23
40
00
36
00
42
00
41
80
.328
58
37
.838
53
73
.134
35
20
.782
37
26
.708
32
85
.024
MO
P
21
43
.727
18
51
.852
25
00
32
40
.506
26
66
.667
39
34
.426
32
40
.506
23
05
.085
24
00
26
66
.667
34
28
.571
31
48
.831
33
96
.226
30
47
.619
33
17
.972
20
00
24
00
24
00
39
34
.426
34
59
.459
23
88
.06
23
47
.188
19
87
.578
18
89
.426
Fu
ng
icid
e
15
92
.692
24
86
.343
21
89
.063
17
73
.418
19
74
.309
13
57
.377
17
73
.418
13
85
.169
14
59
.375
19
74
.309
13
52
.941
17
23
.247
13
56
.132
14
60
.317
13
24
.885
14
59
.375
15
17
.75
19
55
.563
13
57
.377
18
93
.243
12
54
.627
14
27
.262
14
50
.311
14
03
.757
Inse
ctic
ide
17
25
.7
26
93
.981
23
71
.875
19
21
.519
21
39
.187
14
68
.852
19
21
.519
15
00
.847
15
81
.25
21
39
.187
16
47
.059
18
67
.159
14
91
.745
17
77
.778
16
12
.903
15
81
.25
16
44
.5
21
18
.875
14
68
.852
20
51
.351
12
08
.358
15
46
.455
15
71
.429
15
20
.988
Ba
mb
oo
54
81
.121
57
87
.037
78
12
.5
37
97
.468
58
53
.659
55
73
.77
37
97
.468
47
45
.763
68
75
58
53
.659
37
81
.513
36
90
.037
64
85
.849
87
30
.159
63
36
.406
83
33
.333
68
75
48
75
55
73
.77
40
54
.054
50
74
.627
67
23
.716
85
40
.373
37
57
.381
Co
st A
61
63
7.5
2
62
46
5.0
5
65
94
7.6
6
73
73
9.2
4
71
10
9.4
3
63
84
9.1
8
73
73
9.2
4
56
28
6.0
2
65
03
4.3
8
71
10
9.4
3
51
96
8.0
7
71
65
3.1
4
58
21
9.3
4
65
54
7.6
2
57
03
3.4
1
77
27
5
65
19
3.5
64
25
2.5
6
63
84
9.1
8
78
72
1.6
2
61
97
6.4
2
63
60
3.3
67
42
3.9
1
50
65
0.4
6
Co
st B
43
14
.626
43
72
.553
46
16
.336
51
61
.747
49
77
.66
44
69
.443
51
61
.747
39
40
.021
45
52
.406
49
77
.66
36
37
.765
50
15
.72
40
75
.354
45
88
.333
39
92
.339
54
09
.25
45
63
.545
44
97
.679
44
69
.443
55
10
.514
43
38
.349
44
52
.231
47
19
.674
35
45
.532
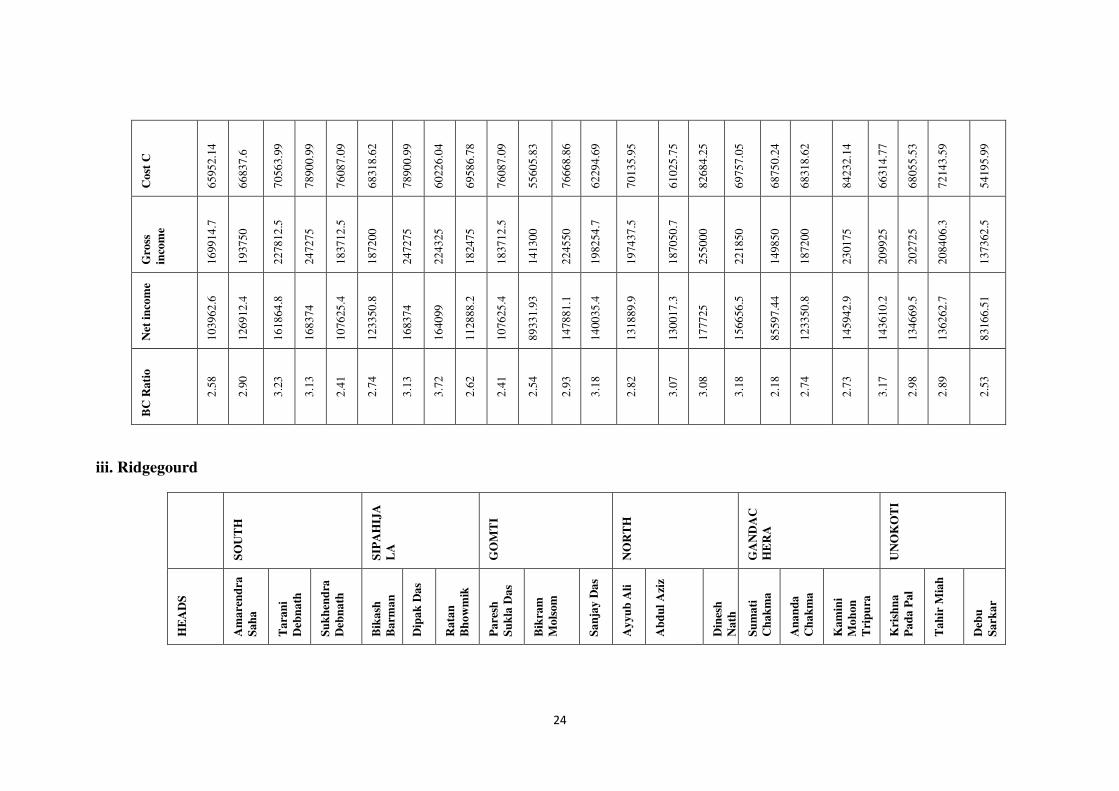
24
Co
st C
65
95
2.1
4
66
83
7.6
70
56
3.9
9
78
90
0.9
9
76
08
7.0
9
68
31
8.6
2
78
90
0.9
9
60
22
6.0
4
69
58
6.7
8
76
08
7.0
9
55
60
5.8
3
76
66
8.8
6
62
29
4.6
9
70
13
5.9
5
61
02
5.7
5
82
68
4.2
5
69
75
7.0
5
68
75
0.2
4
68
31
8.6
2
84
23
2.1
4
66
31
4.7
7
68
05
5.5
3
72
14
3.5
9
54
19
5.9
9
Gro
ss
inco
me
16
99
14
.7
19
37
50
22
78
12
.5
24
72
75
18
37
12
.5
18
72
00
24
72
75
22
43
25
18
24
75
18
37
12
.5
14
13
00
22
45
50
19
82
54
.7
19
74
37
.5
18
70
50
.7
25
50
00
22
18
50
14
98
50
18
72
00
23
01
75
20
99
25
20
27
25
20
84
06
.3
13
73
62
.5
Net
in
com
e
10
39
62
.6
12
69
12
.4
16
18
64
.8
16
83
74
10
76
25
.4
12
33
50
.8
16
83
74
16
40
99
11
28
88
.2
10
76
25
.4
89
33
1.9
3
14
78
81
.1
14
00
35
.4
13
18
89
.9
13
00
17
.3
17
77
25
15
66
56
.5
85
59
7.4
4
12
33
50
.8
14
59
42
.9
14
36
10
.2
13
46
69
.5
13
62
62
.7
83
16
6.5
1
BC
Ra
tio
2.5
8
2.9
0
3.2
3
3.1
3
2.4
1
2.7
4
3.1
3
3.7
2
2.6
2
2.4
1
2.5
4
2.9
3
3.1
8
2.8
2
3.0
7
3.0
8
3.1
8
2.1
8
2.7
4
2.7
3
3.1
7
2.9
8
2.8
9
2.5
3
iii. Ridgegourd
SO
UT
H
SIP
AH
IJA
LA
GO
MT
I
NO
RT
H
GA
ND
AC
HE
RA
UN
OK
OT
I
HE
AD
S
Am
are
nd
ra
Sa
ha
Ta
ran
i
Deb
na
th
Su
kh
end
ra
Deb
na
th
Bik
ash
Ba
rma
n
Dip
ak
Da
s
Ra
tan
Bh
ow
mik
Pa
resh
Su
kla
Da
s
Bik
ram
Mo
lsom
Sa
nja
y D
as
Ay
yu
b A
li
Ab
du
l A
ziz
Din
esh
Na
th
Su
ma
ti
Ch
ak
ma
An
an
da
Ch
ak
ma
Ka
min
i
Mo
hon
Tri
pu
ra
Kri
shn
a
Pa
da P
al
Ta
hir
Mia
h
Deb
u
Sa
rka
r
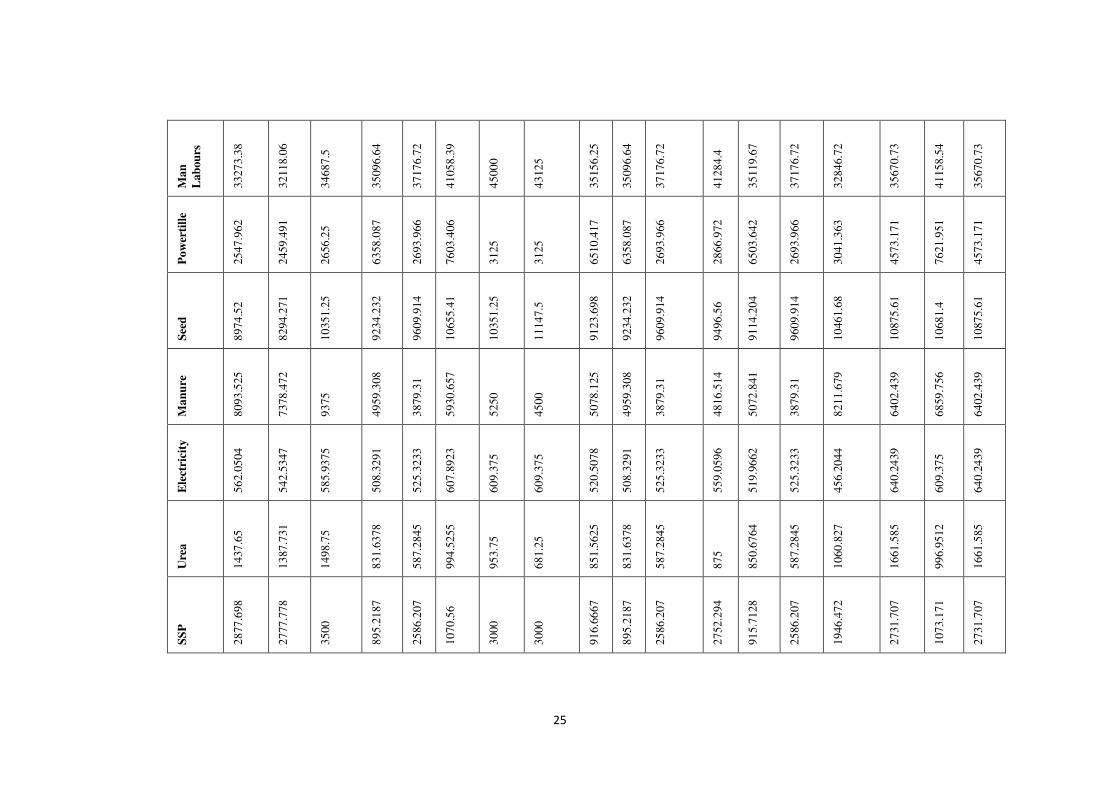
25
Ma
n
La
bou
rs
33
27
3.3
8
32
11
8.0
6
34
68
7.5
35
09
6.6
4
37
17
6.7
2
41
05
8.3
9
45
00
0
43
12
5
35
15
6.2
5
35
09
6.6
4
37
17
6.7
2
41
28
4.4
35
11
9.6
7
37
17
6.7
2
32
84
6.7
2
35
67
0.7
3
41
15
8.5
4
35
67
0.7
3
Po
wer
till
e
25
47
.962
24
59
.491
26
56
.25
63
58
.087
26
93
.966
76
03
.406
31
25
31
25
65
10
.417
63
58
.087
26
93
.966
28
66
.972
65
03
.642
26
93
.966
30
41
.363
45
73
.171
76
21
.951
45
73
.171
See
d
89
74
.52
82
94
.271
10
35
1.2
5
92
34
.232
96
09
.914
10
65
5.4
1
10
35
1.2
5
11
14
7.5
91
23
.698
92
34
.232
96
09
.914
94
96
.56
91
14
.204
96
09
.914
10
46
1.6
8
10
87
5.6
1
10
68
1.4
10
87
5.6
1
Ma
nu
re
80
93
.525
73
78
.472
93
75
49
59
.308
38
79
.31
59
30
.657
52
50
45
00
50
78
.125
49
59
.308
38
79
.31
48
16
.514
50
72
.841
38
79
.31
82
11
.679
64
02
.439
68
59
.756
64
02
.439
Ele
ctri
city
56
2.0
504
54
2.5
347
58
5.9
375
50
8.3
291
52
5.3
233
60
7.8
923
60
9.3
75
60
9.3
75
52
0.5
078
50
8.3
291
52
5.3
233
55
9.0
596
51
9.9
662
52
5.3
233
45
6.2
044
64
0.2
439
60
9.3
75
64
0.2
439
Ure
a
14
37
.65
13
87
.731
14
98
.75
83
1.6
378
58
7.2
845
99
4.5
255
95
3.7
5
68
1.2
5
85
1.5
625
83
1.6
378
58
7.2
845
87
5
85
0.6
764
58
7.2
845
10
60
.827
16
61
.585
99
6.9
512
16
61
.585
SS
P
28
77
.698
27
77
.778
35
00
89
5.2
187
25
86
.207
10
70
.56
30
00
30
00
91
6.6
667
89
5.2
187
25
86
.207
27
52
.294
91
5.7
128
25
86
.207
19
46
.472
27
31
.707
10
73
.171
27
31
.707
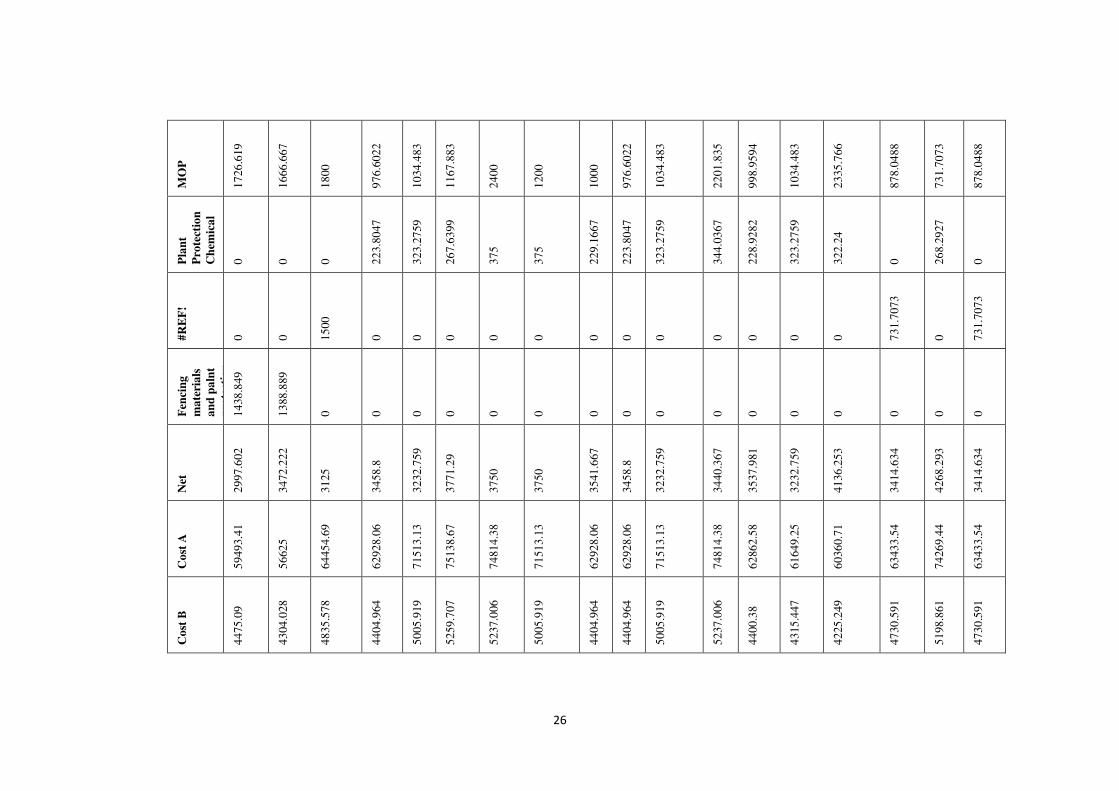
26
MO
P
17
26
.619
16
66
.667
18
00
97
6.6
022
10
34
.483
11
67
.883
24
00
12
00
10
00
97
6.6
022
10
34
.483
22
01
.835
99
8.9
594
10
34
.483
23
35
.766
87
8.0
488
73
1.7
073
87
8.0
488
Pla
nt
Pro
tect
ion
Ch
emic
al
0
0
0
22
3.8
047
32
3.2
759
26
7.6
399
37
5
37
5
22
9.1
667
22
3.8
047
32
3.2
759
34
4.0
367
22
8.9
282
32
3.2
759
32
2.2
4
0
26
8.2
927
0
#R
EF
!
0
0
15
00
0
0
0
0
0
0
0
0
0
0
0
0
73
1.7
073
0
73
1.7
073
Fen
cin
g
ma
teri
als
an
d p
aln
t
pro
tect
ion
14
38
.849
13
88
.889
0
0
0
0
0
0
0
0
0
0
0
0
0
0
0
0
Net
29
97
.602
34
72
.222
31
25
34
58
.8
32
32
.759
37
71
.29
37
50
37
50
35
41
.667
34
58
.8
32
32
.759
34
40
.367
35
37
.981
32
32
.759
41
36
.253
34
14
.634
42
68
.293
34
14
.634
Co
st A
59
49
3.4
1
56
62
5
64
45
4.6
9
62
92
8.0
6
71
51
3.1
3
75
13
8.6
7
74
81
4.3
8
71
51
3.1
3
62
92
8.0
6
62
92
8.0
6
71
51
3.1
3
74
81
4.3
8
62
86
2.5
8
61
64
9.2
5
60
36
0.7
1
63
43
3.5
4
74
26
9.4
4
63
43
3.5
4
Co
st B
44
75
.09
43
04
.028
48
35
.578
44
04
.964
50
05
.919
52
59
.707
52
37
.006
50
05
.919
44
04
.964
44
04
.964
50
05
.919
52
37
.006
44
00
.38
43
15
.447
42
25
.249
47
30
.591
51
98
.861
47
30
.591
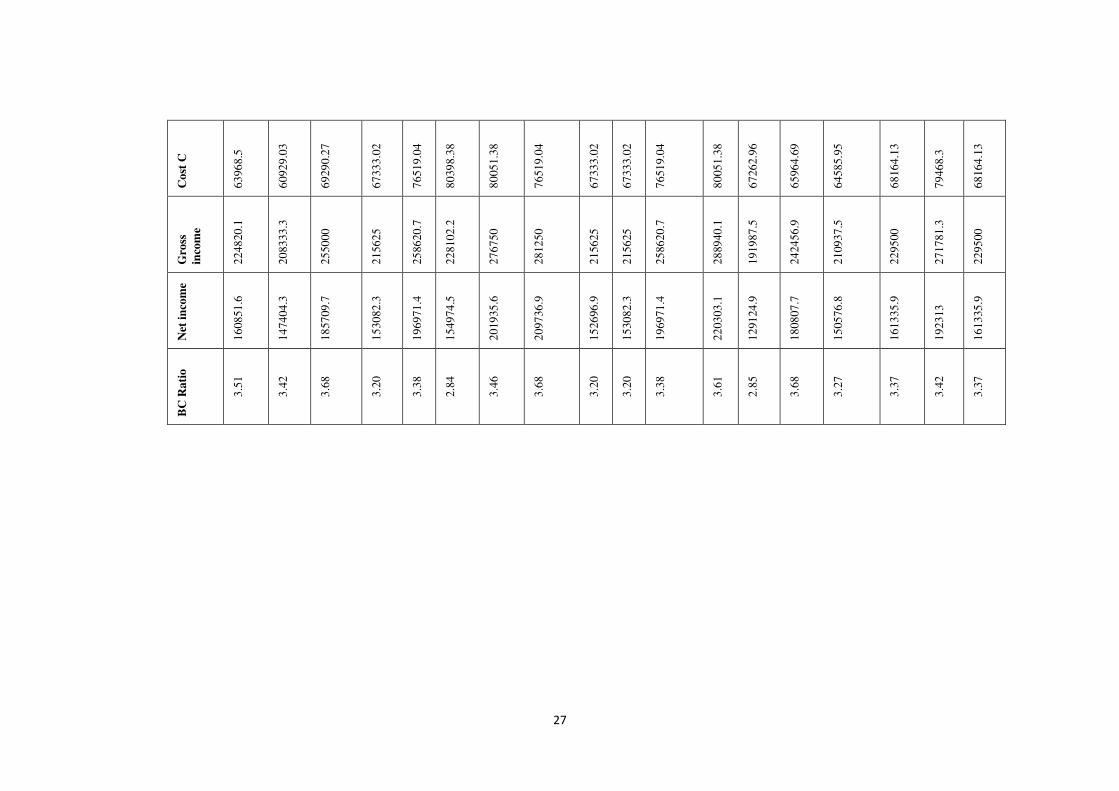
27
Co
st C
63
96
8.5
60
92
9.0
3
69
29
0.2
7
67
33
3.0
2
76
51
9.0
4
80
39
8.3
8
80
05
1.3
8
76
51
9.0
4
67
33
3.0
2
67
33
3.0
2
76
51
9.0
4
80
05
1.3
8
67
26
2.9
6
65
96
4.6
9
64
58
5.9
5
68
16
4.1
3
79
46
8.3
68
16
4.1
3
Gro
ss
inco
me
22
48
20
.1
20
83
33
.3
25
50
00
21
56
25
25
86
20
.7
22
81
02
.2
27
67
50
28
12
50
21
56
25
21
56
25
25
86
20
.7
28
89
40
.1
19
19
87
.5
24
24
56
.9
21
09
37
.5
22
95
00
27
17
81
.3
22
95
00
Net
in
com
e
16
08
51
.6
14
74
04
.3
18
57
09
.7
15
30
82
.3
19
69
71
.4
15
49
74
.5
20
19
35
.6
20
97
36
.9
15
26
96
.9
15
30
82
.3
19
69
71
.4
22
03
03
.1
12
91
24
.9
18
08
07
.7
15
05
76
.8
16
13
35
.9
19
23
13
16
13
35
.9
BC
Ra
tio
3.5
1
3.4
2
3.6
8
3.2
0
3.3
8
2.8
4
3.4
6
3.6
8
3.2
0
3.2
0
3.3
8
3.6
1
2.8
5
3.6
8
3.2
7
3.3
7
3.4
2
3.3
7

28
iv. Spinegourd
SO
UT
H
WE
ST
KH
OW
AI
SIP
AH
IJA
LA
GO
MA
TI
NO
RT
H
DH
AL
AI
Hea
ds
Uch
oi
Mog
Pra
ka
sh D
as
Go
pa
l S
ak
rar
Nir
ma
l S
ark
ar
Utt
am
Sa
kra
r
Dij
ala
l D
as
Ra
nja
n D
as
Ab
du
l S
att
ar
Kh
itis
h
Deb
ba
rma
Ta
pan
Da
s
Jy
oti
sh
Deb
ba
rma
Pa
rim
al
Da
s
Jh
uta
n
Da
sgu
pta
La
lit
Mo
ho
n
Jam
ati
a
Ra
mes
h D
as
Th
ak
urm
an
i
Na
th
Ra
ffiq
ueu
dd
in
Ash
ari
lal
Na
th
Bir
end
ra
Ch
ak
ma
Na
ku
l
Ch
ak
ma
Aru
n C
ha
km
a
Ma
n
La
bou
rs
28
36
9
28
83
0.2
1
30
00
0
28
91
5.6
6
30
00
0
28
70
8.1
3
20
49
6.8
9
26
31
5.7
9
26
07
3.1
2
27
97
2.0
3
25
36
4.9
25
33
7.8
4
27
97
2.0
3
28
23
5.2
9
28
57
1.4
3
25
36
4.9
25
33
8
27
97
2.0
3
27
97
2.0
3
35
23
2.8
4
25
35
1.3
6
Po
wer
till
er
59
10
60
06
.295
62
50
48
19
.277
50
00
47
84
.689
74
53
.416
43
85
.965
63
12
.504
46
62
.005
53
39
.979
53
34
.282
46
62
.005
47
05
.882
47
61
.905
53
39
.979
53
34
46
62
.005
46
62
.005
81
69
.935
53
37
.129
See
d
13
29
8
14
41
5.1
1
14
06
2.5
13
85
5.4
2
14
37
5
13
75
5.9
8
15
52
7.9
5
12
60
9.6
5
15
75
5.9
6
13
40
3.2
6
13
34
9.9
5
13
33
5.7
13
40
3.2
6
13
52
9.4
1
13
69
0.4
8
13
34
9.9
5
13
33
6
14
27
7.3
9
14
27
7.3
9
18
38
2.3
5
13
34
2.8
2
Ma
nu
re
35
5
36
0.3
777
37
5
36
1.4
458
37
5
35
8.8
517
55
9.0
062
32
8.9
474
41
2.1
431
34
9.6
503
53
3.9
979
53
3.4
282
34
9.6
503
35
2.9
412
35
7.1
429
53
3.9
979
53
3
83
9.1
608
83
9.1
608
61
2.7
451
53
3.7
129
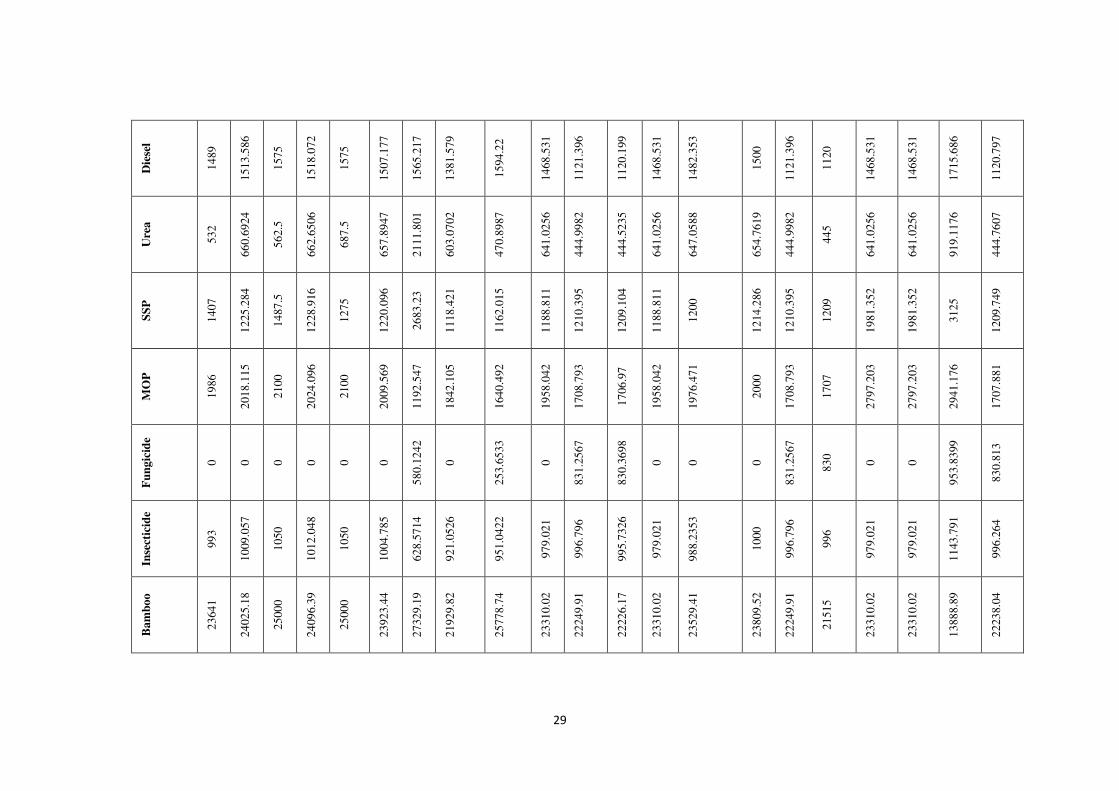
29
Die
sel
14
89
15
13
.586
15
75
15
18
.072
15
75
15
07
.177
15
65
.217
13
81
.579
15
94
.22
14
68
.531
11
21
.396
11
20
.199
14
68
.531
14
82
.353
15
00
11
21
.396
11
20
14
68
.531
14
68
.531
17
15
.686
11
20
.797
Ure
a
53
2
66
0.6
924
56
2.5
66
2.6
506
68
7.5
65
7.8
947
21
11
.801
60
3.0
702
47
0.8
987
64
1.0
256
44
4.9
982
44
4.5
235
64
1.0
256
64
7.0
588
65
4.7
619
44
4.9
982
44
5
64
1.0
256
64
1.0
256
91
9.1
176
44
4.7
607
SS
P
14
07
12
25
.284
14
87
.5
12
28
.916
12
75
12
20
.096
26
83
.23
11
18
.421
11
62
.015
11
88
.811
12
10
.395
12
09
.104
11
88
.811
12
00
12
14
.286
12
10
.395
12
09
19
81
.352
19
81
.352
31
25
12
09
.749
MO
P
19
86
20
18
.115
21
00
20
24
.096
21
00
20
09
.569
11
92
.547
18
42
.105
16
40
.492
19
58
.042
17
08
.793
17
06
.97
19
58
.042
19
76
.471
20
00
17
08
.793
17
07
27
97
.203
27
97
.203
29
41
.176
17
07
.881
Fu
ng
icid
e
0
0
0
0
0
0
58
0.1
242
0
25
3.6
533
0
83
1.2
567
83
0.3
698
0
0
0
83
1.2
567
83
0
0
0
95
3.8
399
83
0.8
13
Inse
ctic
ide
99
3
10
09
.057
10
50
10
12
.048
10
50
10
04
.785
62
8.5
714
92
1.0
526
95
1.0
422
97
9.0
21
99
6.7
96
99
5.7
326
97
9.0
21
98
8.2
353
10
00
99
6.7
96
99
6
97
9.0
21
97
9.0
21
11
43
.791
99
6.2
64
Ba
mb
oo
23
64
1
24
02
5.1
8
25
00
0
24
09
6.3
9
25
00
0
23
92
3.4
4
27
32
9.1
9
21
92
9.8
2
25
77
8.7
4
23
31
0.0
2
22
24
9.9
1
22
22
6.1
7
23
31
0.0
2
23
52
9.4
1
23
80
9.5
2
22
24
9.9
1
21
51
5
23
31
0.0
2
23
31
0.0
2
13
88
8.8
9
22
23
8.0
4
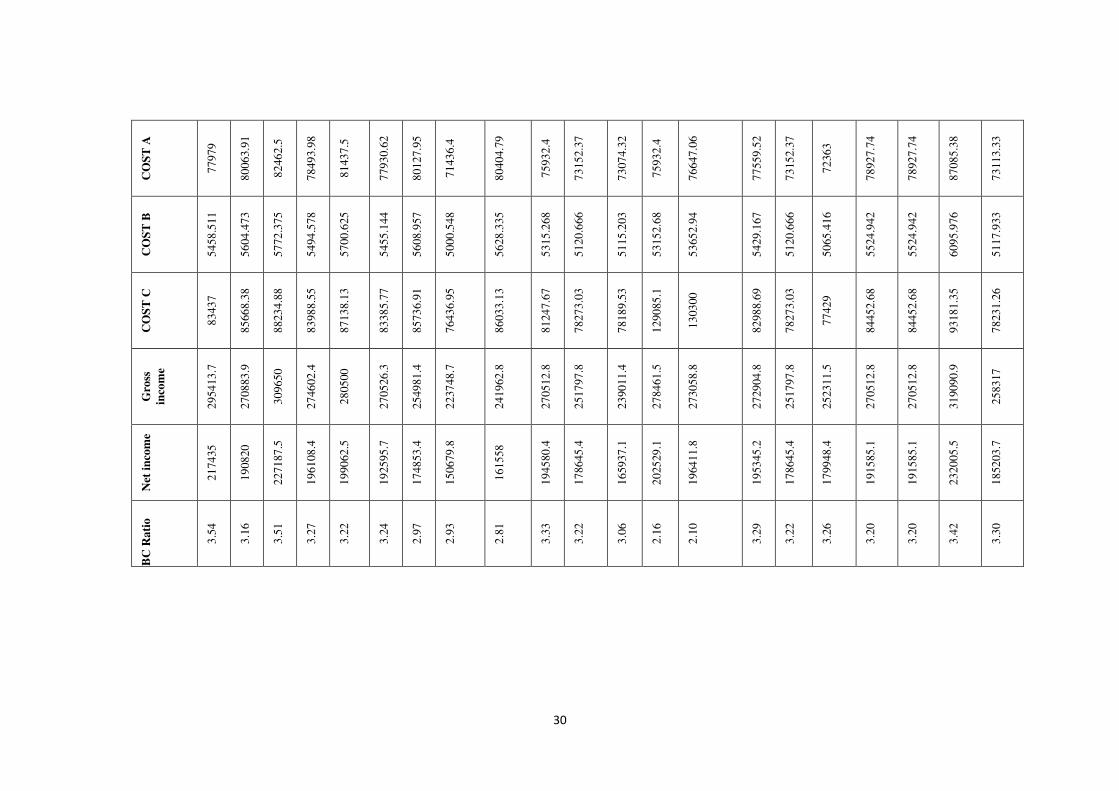
30
CO
ST
A
77
97
9
80
06
3.9
1
82
46
2.5
78
49
3.9
8
81
43
7.5
77
93
0.6
2
80
12
7.9
5
71
43
6.4
80
40
4.7
9
75
93
2.4
73
15
2.3
7
73
07
4.3
2
75
93
2.4
76
64
7.0
6
77
55
9.5
2
73
15
2.3
7
72
36
3
78
92
7.7
4
78
92
7.7
4
87
08
5.3
8
73
11
3.3
3
CO
ST
B
54
58
.511
56
04
.473
57
72
.375
54
94
.578
57
00
.625
54
55
.144
56
08
.957
50
00
.548
56
28
.335
53
15
.268
51
20
.666
51
15
.203
53
15
2.6
8
53
65
2.9
4
54
29
.167
51
20
.666
50
65
.416
55
24
.942
55
24
.942
60
95
.976
51
17
.933
CO
ST
C
83
43
7
85
66
8.3
8
88
23
4.8
8
83
98
8.5
5
87
13
8.1
3
83
38
5.7
7
85
73
6.9
1
76
43
6.9
5
86
03
3.1
3
81
24
7.6
7
78
27
3.0
3
78
18
9.5
3
12
90
85
.1
13
03
00
82
98
8.6
9
78
27
3.0
3
77
42
9
84
45
2.6
8
84
45
2.6
8
93
18
1.3
5
78
23
1.2
6
Gro
ss
inco
me
29
54
13
.7
27
08
83
.9
30
96
50
27
46
02
.4
28
05
00
27
05
26
.3
25
49
81
.4
22
37
48
.7
24
19
62
.8
27
05
12
.8
25
17
97
.8
23
90
11
.4
27
84
61
.5
27
30
58
.8
27
29
04
.8
25
17
97
.8
25
23
11
.5
27
05
12
.8
27
05
12
.8
31
90
90
.9
25
83
17
Net
in
com
e
21
74
35
19
08
20
22
71
87
.5
19
61
08
.4
19
90
62
.5
19
25
95
.7
17
48
53
.4
15
06
79
.8
16
15
58
19
45
80
.4
17
86
45
.4
16
59
37
.1
20
25
29
.1
19
64
11
.8
19
53
45
.2
17
86
45
.4
17
99
48
.4
19
15
85
.1
19
15
85
.1
23
20
05
.5
18
52
03
.7
BC
Ra
tio
3.5
4
3.1
6
3.5
1
3.2
7
3.2
2
3.2
4
2.9
7
2.9
3
2.8
1
3.3
3
3.2
2
3.0
6
2.1
6
2.1
0
3.2
9
3.2
2
3.2
6
3.2
0
3.2
0
3.4
2
3.3
0

31
v. Okra
CROP- SOUTH WEST KHOWAI NORTH GANDACHERA UNOKOTI
Heads
Du
rgac
har
a
n D
as
Am
al P
al
Par
esh
Das
Arp
an
Sar
kar
Ram
esh
Deb
bar
ma
Rab
ind
ra
Deb
bar
ma
San
tosh
Das
Rab
i
Ch
and
ra
Deb
bar
ma
Su
kd
ev
Deb
bar
ma
Har
ipad
Nat
h
Yo
ges
h
Sin
ha
Sac
hin
and
a
n S
ark
ar
Ind
rajo
y
Ch
akm
a
Ch
and
ra
Dev
i
Ch
akm
a
Bir
end
ra
Ch
akm
a
Pra
lad
Sar
kar
Har
ipad
a
Sah
a
Kri
shn
a
Pad
a P
aul
Ma
n
La
bou
rs
25
86
2.0
7
20
46
2.6
3
22
65
6.2
5
26
57
9.3
5
17
18
7.5
25
86
2.0
7
22
40
2.6
24
69
8.1
3
21
34
3.8
7
42
93
8.9
3
33
79
9.5
3
31
64
0.6
3
25
31
2.5
27
38
0.9
5
21
34
3.8
7
25
31
2.5
24
96
9.1
7
25
37
5.9
4
Po
wer
till
er
43
10
.345
59
31
.198
62
50
61
63
.328
62
50
43
10
.345
51
94
.805
60
98
.305
63
24
.111
31
96
.565
40
79
.254
41
01
.563
62
50
63
49
.206
63
24
.111
62
50
61
65
.228
50
12
.531
Ca
ttle
Pa
ir
Da
y
0
0
0
0
0
0
0
0
0
28
62
.595
11
65
.501
11
71
.875
0
0
0
0
0
0
See
d
14
22
4.1
4
12
38
4.3
4
16
25
0
15
16
1.7
9
12
87
5
14
22
4.1
4
18
70
1.3
16
83
1.3
2
16
12
6.4
8
99
23
.664
12
12
1.2
1
12
18
7.5
17
25
0
15
61
9.0
5
16
12
6.4
8
17
25
0
17
75
5.8
6
17
55
6.3
9
Ma
nu
re
58
1.8
966
88
9.6
797
78
1.2
5
73
9.5
994
68
7.5
58
1.8
966
87
6.6
234
73
1.7
966
80
6.3
241
0
0
0
75
0
76
1.9
048
80
6.3
241
75
0
88
7.7
928
84
5.8
647

32
Die
sel
27
15
.517
74
7.3
31
13
12
.5
19
41
.448
13
12
.5
27
15
.517
16
36
.364
15
36
.773
99
6.0
474
0
0
0
15
75
20
00
99
6.0
474
15
75
15
53
.637
15
78
.947
Fer
tili
zer
0
0
0
0
0
0
0
0
0
38
16
.794
99
4.5
61
10
00
0
0
0
0
0
0
Ure
a
18
31
.897
42
85
.291
53
12
.5
52
38
.829
46
04
.167
18
31
.897
48
57
.143
49
76
.217
47
03
.557
0
0
0
51
00
15
87
.302
47
03
.557
51
00
56
59
.679
51
12
.782
SS
P
69
82
.759
34
87
.544
50
00
44
37
.596
45
00
69
82
.759
37
40
.26
46
83
.498
45
53
.36
10
68
.702
97
9.0
21
98
4.3
75
48
00
32
38
.095
45
53
.36
48
00
44
38
.964
48
12
.03
MO
P
17
24
.138
20
87
.782
25
00
24
65
.331
30
00
17
24
.138
20
77
.922
23
41
.749
22
76
.68
48
85
.496
62
16
.006
62
50
24
00
38
09
.524
22
76
.68
24
00
19
72
.873
24
06
.015
DA
P
0
0
0
0
0
0
0
0
0
13
16
.794
89
3.5
509
89
8.4
375
0
0
0
0
0
0
Fu
ng
icid
e
12
67
.241
12
45
.552
17
50
12
94
.299
87
5
12
67
.241
10
90
.909
12
80
.644
14
94
.071
0
28
59
.363
28
75
13
12
.5
13
33
.333
14
94
.071
13
12
.5
12
94
.698
13
15
.789
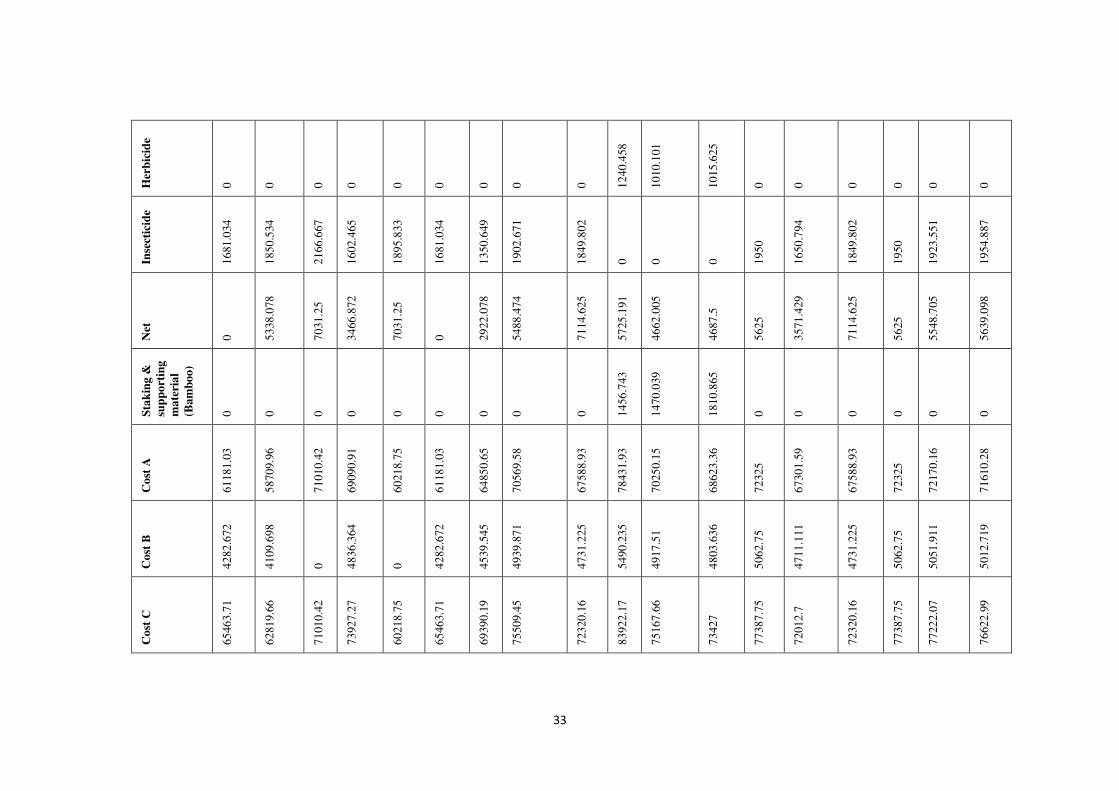
33
Her
bic
ide
0
0
0
0
0
0
0
0
0
12
40
.458
10
10
.101
10
15
.625
0
0
0
0
0
0
Inse
ctic
ide
16
81
.034
18
50
.534
21
66
.667
16
02
.465
18
95
.833
16
81
.034
13
50
.649
19
02
.671
18
49
.802
0
0
0
19
50
16
50
.794
18
49
.802
19
50
19
23
.551
19
54
.887
Net
0
53
38
.078
70
31
.25
34
66
.872
70
31
.25
0
29
22
.078
54
88
.474
71
14
.625
57
25
.191
46
62
.005
46
87
.5
56
25
35
71
.429
71
14
.625
56
25
55
48
.705
56
39
.098
Sta
kin
g &
sup
po
rtin
g
ma
teri
al
(Ba
mb
oo
)
0
0
0
0
0
0
0
0
0
14
56
.743
14
70
.039
18
10
.865
0
0
0
0
0
0
Co
st A
61
18
1.0
3
58
70
9.9
6
71
01
0.4
2
69
09
0.9
1
60
21
8.7
5
61
18
1.0
3
64
85
0.6
5
70
56
9.5
8
67
58
8.9
3
78
43
1.9
3
70
25
0.1
5
68
62
3.3
6
72
32
5
67
30
1.5
9
67
58
8.9
3
72
32
5
72
17
0.1
6
71
61
0.2
8
Co
st B
42
82
.672
41
09
.698
0
48
36
.364
0
42
82
.672
45
39
.545
49
39
.871
47
31
.225
54
90
.235
49
17
.51
48
03
.636
50
62
.75
47
11
.111
47
31
.225
50
62
.75
50
51
.911
50
12
.719
Co
st C
65
46
3.7
1
62
81
9.6
6
71
01
0.4
2
73
92
7.2
7
60
21
8.7
5
65
46
3.7
1
69
39
0.1
9
75
50
9.4
5
72
32
0.1
6
83
92
2.1
7
75
16
7.6
6
73
42
7
77
38
7.7
5
72
01
2.7
72
32
0.1
6
77
38
7.7
5
77
22
2.0
7
76
62
2.9
9
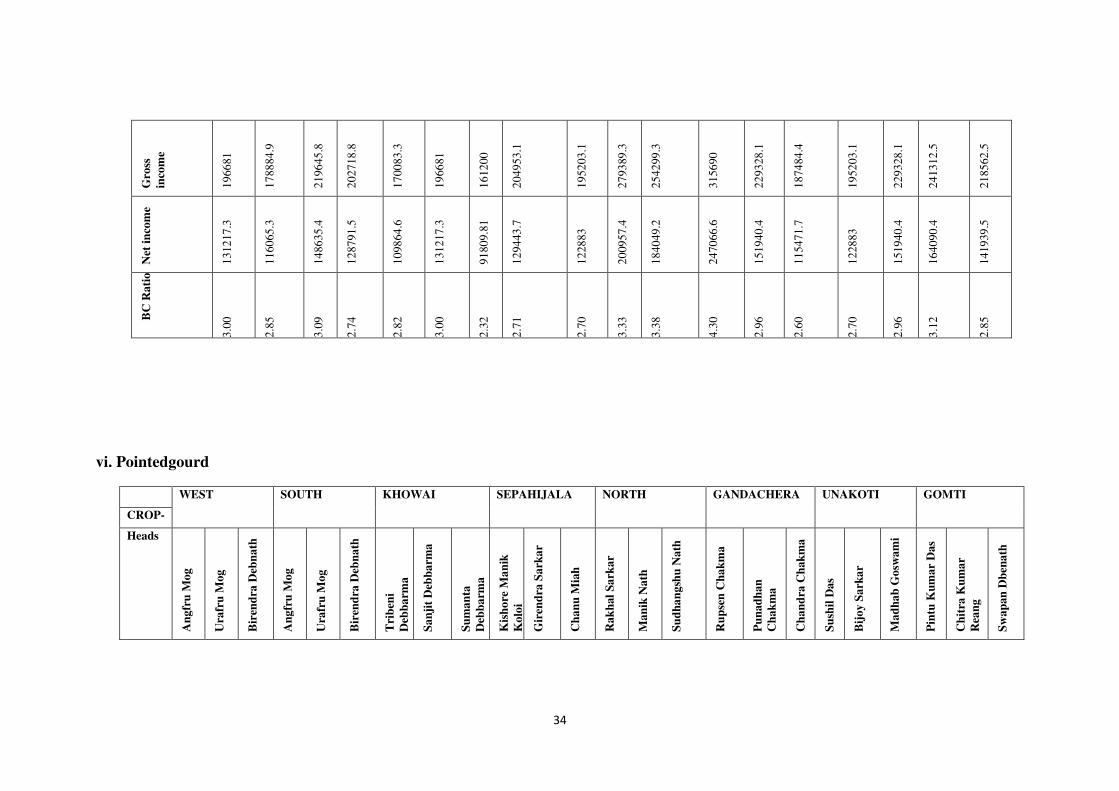
34
Gro
ss
inco
me
19
66
81
17
88
84
.9
21
96
45
.8
20
27
18
.8
17
00
83
.3
19
66
81
16
12
00
20
49
53
.1
19
52
03
.1
27
93
89
.3
25
42
99
.3
31
56
90
22
93
28
.1
18
74
84
.4
19
52
03
.1
22
93
28
.1
24
13
12
.5
21
85
62
.5
Net
in
com
e
13
12
17
.3
11
60
65
.3
14
86
35
.4
12
87
91
.5
10
98
64
.6
13
12
17
.3
91
80
9.8
1
12
94
43
.7
12
28
83
20
09
57
.4
18
40
49
.2
24
70
66
.6
15
19
40
.4
11
54
71
.7
12
28
83
15
19
40
.4
16
40
90
.4
14
19
39
.5
BC
Ra
tio
3.0
0
2.8
5
3.0
9
2.7
4
2.8
2
3.0
0
2.3
2
2.7
1
2.7
0
3.3
3
3.3
8
4.3
0
2.9
6
2.6
0
2.7
0
2.9
6
3.1
2
2.8
5
vi. Pointedgourd
WEST SOUTH KHOWAI SEPAHIJALA NORTH GANDACHERA UNAKOTI GOMTI
CROP-
Heads
An
gfr
u M
og
Ura
fru
Mog
Bir
end
ra D
ebn
ath
An
gfr
u M
og
Ura
fru
Mog
Bir
end
ra D
ebn
ath
Tri
ben
i
Deb
ba
rma
Sa
nji
t D
ebb
arm
a
Su
ma
nta
Deb
ba
rma
Kis
ho
re M
an
ik
Ko
loi
Gir
end
ra S
ark
ar
Ch
an
u M
iah
Ra
kh
al
Sa
rka
r
Ma
nik
Na
th
Su
dh
an
gsh
u N
ath
Ru
pse
n C
ha
km
a
Pu
nad
han
Ch
ak
ma
Ch
an
dra
Ch
ak
ma
Su
shil
Da
s
Bij
oy
Sa
rka
r
Ma
dh
ab
Go
swa
mi
Pin
tu K
um
ar
Da
s
Ch
itra
Ku
ma
r
Rea
ng
Sw
ap
an
Db
ena
th

35
Ma
n
La
bou
rs
30
00
0
25
44
6.4
3
28
12
5
30
00
0
25
44
6.4
3
28
12
5
22
46
3.3
3
22
96
8.7
5
23
78
1.9
23
11
6.4
4
25
31
2.5
22
46
3.3
3
23
88
1.6
4
22
46
3.3
3
21
09
3.7
5
22
96
8.7
5
24
63
5.0
4
23
99
2.8
9
26
66
1.5
1
20
94
6.4
7
26
62
0.3
7
25
31
2.5
21
09
3.7
5
24
02
3.4
4
Po
wer
till
er
62
50
53
57
.143
62
50
62
50
53
57
.143
62
50
62
50
62
50
77
33
.952
45
66
.21
50
00
62
50
77
66
.387
62
50
62
50
62
50
48
66
.18
47
39
.336
30
91
.19
46
54
.771
30
86
.42
50
00
62
50
78
12
.5
See
d
14
06
2.5
14
28
5.7
1
14
06
2.5
14
06
2.5
14
28
5.7
1
14
06
2.5
15
62
5
15
62
5
14
69
4.5
1
11
75
7.9
9
12
50
0
15
93
7.5
14
36
7.8
2
15
68
7.5
15
62
5
15
62
5
12
89
5.3
8
12
55
9.2
4
13
52
3.9
6
14
54
6.1
6
11
57
4.0
7
12
50
0
15
62
5
14
84
3.7
5
Ma
nu
re
37
5
40
1.7
857
54
6.8
75
37
5
40
1.7
857
54
6.8
75
56
2.5
65
6.2
5
46
4.0
371
56
5.0
685
37
5
60
9.3
75
58
2.4
79
51
5.6
25
56
2.5
65
6.2
5
72
9.9
27
71
0.9
005
20
8.6
553
38
4.0
186
27
7.7
778
37
5
56
2.5
46
8.7
5
Die
sel
15
75
11
25
13
12
.5
15
75
11
25
13
12
.5
10
50
10
50
12
99
.304
95
8.9
041
78
7.5
78
7.5
13
04
.753
10
50
10
50
10
50
10
21
.898
99
5.2
607
32
4.5
75
65
1.6
68
64
8.1
481
78
7.5
10
50
13
12
.5
Ure
a
19
12
.5
15
17
.857
21
25
19
12
.5
15
17
.857
21
25
62
5
62
5
61
8.7
162
68
4.9
315
23
37
.5
68
7.5
20
46
.443
19
12
.5
21
25
62
5
22
74
.939
22
15
.64
28
90
.263
23
73
.933
26
23
.457
23
37
.5
21
25
62
5
SS
P
21
00
17
14
.286
22
50
21
00
17
14
.286
22
50
15
93
.75
19
12
.5
17
09
.203
15
52
.511
16
50
17
00
24
23
.113
19
50
22
50
19
12
.5
16
05
.839
15
63
.981
25
96
.6
22
34
.29
29
62
.963
16
50
22
50
17
26
.563

36
MO
P
14
00
11
42
.857
15
00
14
00
11
42
.857
15
00
22
50
27
00
24
12
.993
21
91
.781
12
00
21
00
15
53
.277
12
00
15
00
27
00
11
67
.883
11
37
.441
17
31
.066
99
3.0
178
19
75
.309
12
00
15
00
24
37
.5
Fu
ng
icid
e
0
83
3.9
286
12
16
.146
0
83
3.9
286
12
16
.146
16
34
.5
18
97
.188
18
05
.878
13
32
.763
13
42
.625
14
59
.375
90
6.7
257
16
34
.5
16
34
.5
18
97
.188
13
06
.691
12
72
.63
14
43
.586
14
49
.185
10
81
.019
13
42
.625
16
34
.5
18
24
.219
Inse
ctic
ide
94
8.7
5
90
3.5
714
10
54
.167
94
8.7
5
90
3.5
714
10
54
.167
21
00
21
00
21
65
.507
14
06
.393
13
91
.5
21
00
13
75
.427
18
97
.5
18
97
.5
21
00
13
54
.258
13
18
.957
19
55
.178
15
70
.209
78
0.8
642
13
91
.5
18
97
.5
21
87
.5
Ba
mb
oo
25
00
0
25
44
6.4
3
28
12
5
25
00
0
25
44
6.4
3
28
12
5
34
37
5
34
37
5
30
93
5.8
1
27
96
8.0
4
30
62
5
34
37
5
31
06
5.5
5
34
37
5
34
37
5
34
37
5
29
80
5.3
5
29
02
8.4
4
26
27
5.1
2
32
58
3.4
20
06
1.7
3
30
62
5
34
37
5
31
25
0
CO
ST
A
83
62
3.7
5
78
17
5
86
56
7.1
9
83
62
3.7
5
78
17
5
86
56
7.1
9
88
52
9.0
8
90
15
9.6
9
87
62
1.8
1
76
10
1.0
3
82
52
1.6
3
88
46
9.5
8
87
27
3.6
1
88
93
5.9
5
88
36
3.2
5
90
15
9.6
9
81
66
3.3
8
79
53
4.7
2
80
70
1.7
82
38
7.1
2
71
69
2.1
3
82
52
1.6
3
88
36
3.2
5
88
51
1.7
2
CO
ST
B
58
53
.663
0
0
58
53
.663
0
0
61
97
.035
63
11
.178
61
33
.527
53
27
.072
57
76
.514
61
92
.87
61
09
.153
62
25
.517
61
85
.428
63
11
.178
57
16
.437
55
67
.43
56
49
.119
57
67
.099
50
18
.449
57
76
.514
61
85
.428
61
95
.82
CO
ST
C
89
47
7.4
1
78
17
5
86
56
7.1
9
89
47
7.4
1
78
17
5
86
56
7.1
9
94
72
6
96
47
0.8
7
93
75
5.3
4
81
42
8.1
88
29
8.1
4
94
66
2.4
5
93
38
2.7
6
95
16
1.4
7
94
54
8.6
8
96
47
0.8
7
87
37
9.8
2
85
10
2.1
5
86
35
0.8
2
88
15
4.2
2
76
71
0.5
8
88
29
8.1
4
94
54
8.6
8
94
70
7.5
4
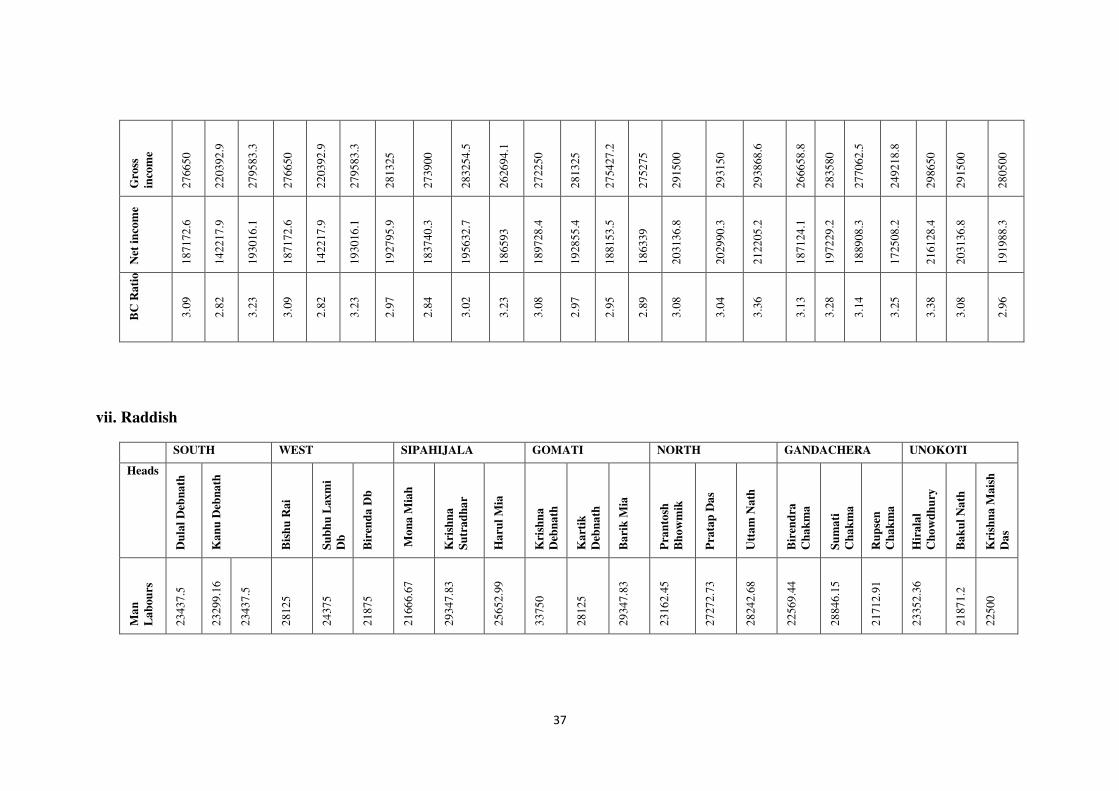
37
Gro
ss
inco
me
27
66
50
22
03
92
.9
27
95
83
.3
27
66
50
22
03
92
.9
27
95
83
.3
28
13
25
27
39
00
28
32
54
.5
26
26
94
.1
27
22
50
28
13
25
27
54
27
.2
27
52
75
29
15
00
29
31
50
29
38
68
.6
26
66
58
.8
28
35
80
27
70
62
.5
24
92
18
.8
29
86
50
29
15
00
28
05
00
Net
in
com
e
18
71
72
.6
14
22
17
.9
19
30
16
.1
18
71
72
.6
14
22
17
.9
19
30
16
.1
19
27
95
.9
18
37
40
.3
19
56
32
.7
18
65
93
18
97
28
.4
19
28
55
.4
18
81
53
.5
18
63
39
20
31
36
.8
20
29
90
.3
21
22
05
.2
18
71
24
.1
19
72
29
.2
18
89
08
.3
17
25
08
.2
21
61
28
.4
20
31
36
.8
19
19
88
.3
BC
Ra
tio
3.0
9
2.8
2
3.2
3
3.0
9
2.8
2
3.2
3
2.9
7
2.8
4
3.0
2
3.2
3
3.0
8
2.9
7
2.9
5
2.8
9
3.0
8
3.0
4
3.3
6
3.1
3
3.2
8
3.1
4
3.2
5
3.3
8
3.0
8
2.9
6
vii. Raddish
SOUTH WEST SIPAHIJALA GOMATI NORTH GANDACHERA UNOKOTI
Heads
Du
lal
Deb
na
th
Ka
nu
Deb
na
th
Bis
hu
Ra
i
Su
bh
u L
ax
mi
Db
Bir
end
a D
b
Mo
na
Mia
h
Kri
shn
a
Su
tra
dh
ar
Ha
rul
Mia
Kri
shn
a
Deb
na
th
Ka
rtik
Deb
na
th
Ba
rik
Mia
Pra
nto
sh
Bh
ow
mik
Pra
tap
Da
s
Utt
am
Na
th
Bir
end
ra
Ch
ak
ma
Su
ma
ti
Ch
ak
ma
Ru
pse
n
Ch
ak
ma
Hir
ala
l
Ch
ow
dh
ury
Ba
ku
l N
ath
Kri
shn
a M
ais
h
Da
s
Ma
n
La
bou
rs
23
43
7.5
23
29
9.1
6
23
43
7.5
28
12
5
24
37
5
21
87
5
21
66
6.6
7
29
34
7.8
3
25
65
2.9
9
33
75
0
28
12
5
29
34
7.8
3
23
16
2.4
5
27
27
2.7
3
28
24
2.6
8
22
56
9.4
4
28
84
6.1
5
21
71
2.9
1
23
35
2.3
6
21
87
1.2
22
50
0
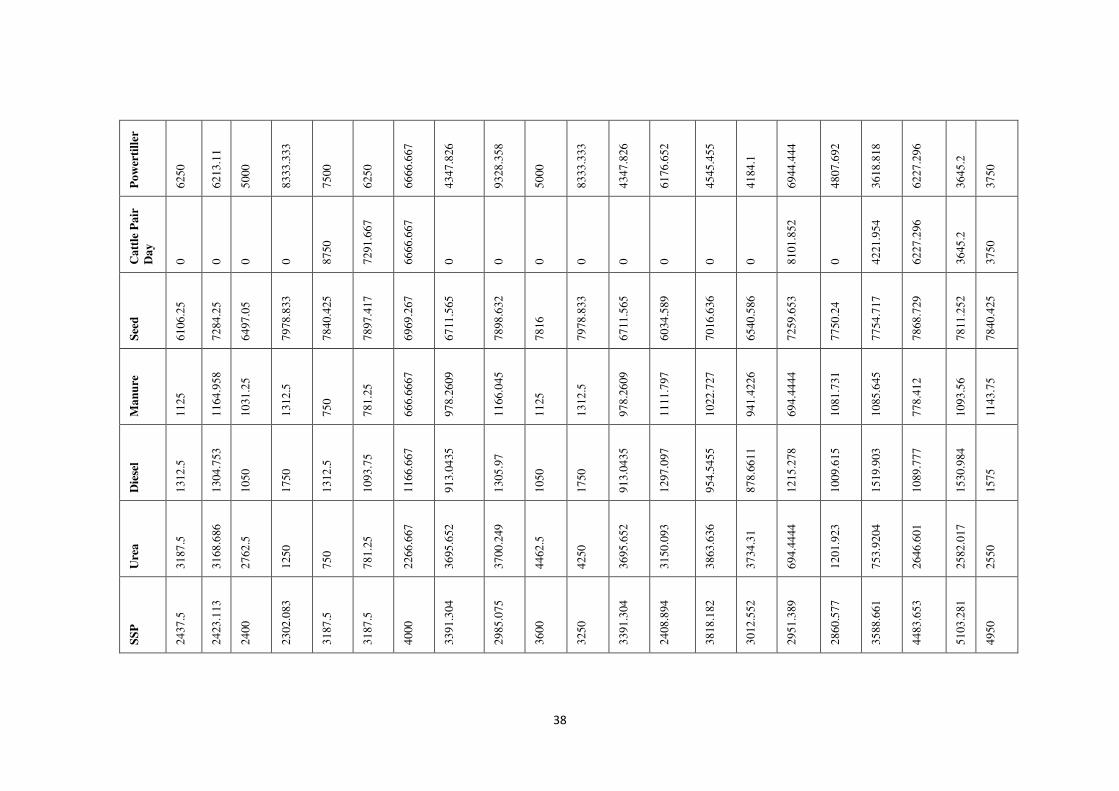
38
Po
wer
till
er
62
50
62
13
.11
50
00
83
33
.333
75
00
62
50
66
66
.667
43
47
.826
93
28
.358
50
00
83
33
.333
43
47
.826
61
76
.652
45
45
.455
41
84
.1
69
44
.444
48
07
.692
36
18
.818
62
27
.296
36
45
.2
37
50
Ca
ttle
Pa
ir
Da
y
0
0
0
0
87
50
72
91
.667
66
66
.667
0
0
0
0
0
0
0
0
81
01
.852
0
42
21
.954
62
27
.296
36
45
.2
37
50
See
d
61
06
.25
72
84
.25
64
97
.05
79
78
.833
78
40
.425
78
97
.417
69
69
.267
67
11
.565
78
98
.632
78
16
79
78
.833
67
11
.565
60
34
.589
70
16
.636
65
40
.586
72
59
.653
77
50
.24
77
54
.717
78
68
.729
78
11
.252
78
40
.425
Ma
nu
re
11
25
11
64
.958
10
31
.25
13
12
.5
75
0
78
1.2
5
66
6.6
667
97
8.2
609
11
66
.045
11
25
13
12
.5
97
8.2
609
11
11
.797
10
22
.727
94
1.4
226
69
4.4
444
10
81
.731
10
85
.645
77
8.4
12
10
93
.56
11
43
.75
Die
sel
13
12
.5
13
04
.753
10
50
17
50
13
12
.5
10
93
.75
11
66
.667
91
3.0
435
13
05
.97
10
50
17
50
91
3.0
435
12
97
.097
95
4.5
455
87
8.6
611
12
15
.278
10
09
.615
15
19
.903
10
89
.777
15
30
.984
15
75
Ure
a
31
87
.5
31
68
.686
27
62
.5
12
50
75
0
78
1.2
5
22
66
.667
36
95
.652
37
00
.249
44
62
.5
42
50
36
95
.652
31
50
.093
38
63
.636
37
34
.31
69
4.4
444
12
01
.923
75
3.9
204
26
46
.601
25
82
.017
25
50
SS
P
24
37
.5
24
23
.113
24
00
23
02
.083
31
87
.5
31
87
.5
40
00
33
91
.304
29
85
.075
36
00
32
50
33
91
.304
24
08
.894
38
18
.182
30
12
.552
29
51
.389
28
60
.577
35
88
.661
44
83
.653
51
03
.281
49
50
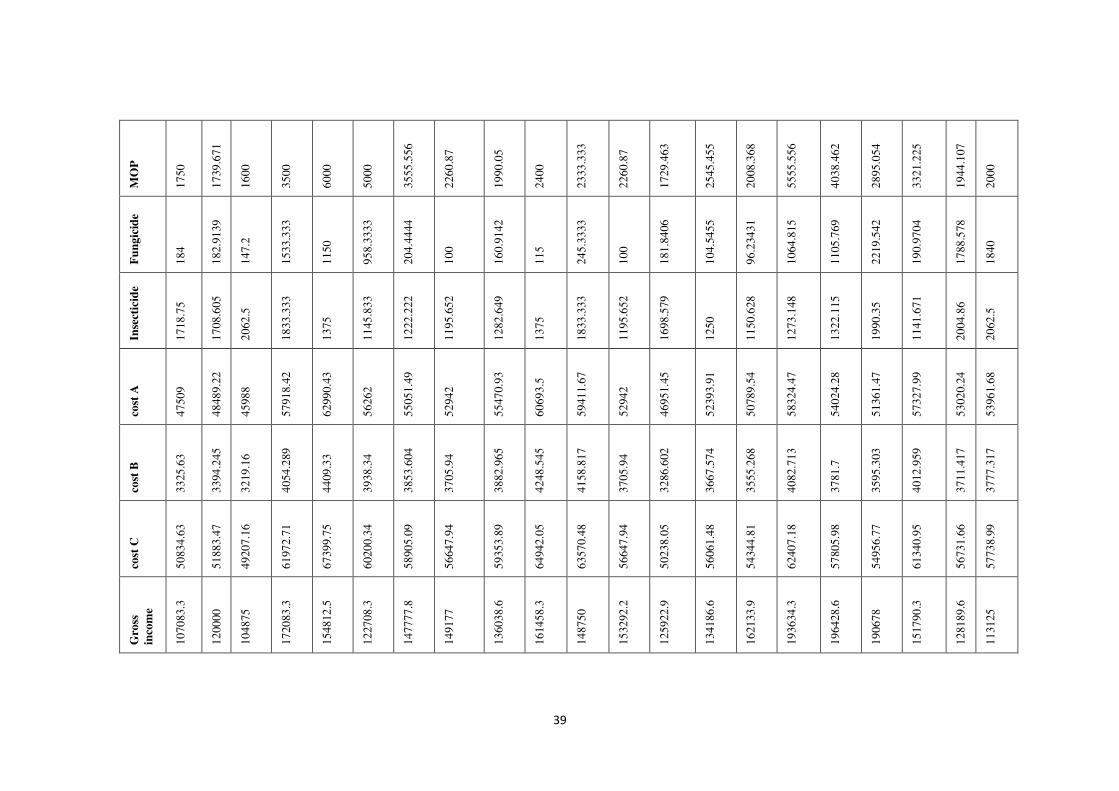
39
MO
P
17
50
17
39
.671
16
00
35
00
60
00
50
00
35
55
.556
22
60
.87
19
90
.05
24
00
23
33
.333
22
60
.87
17
29
.463
25
45
.455
20
08
.368
55
55
.556
40
38
.462
28
95
.054
33
21
.225
19
44
.107
20
00
Fu
ng
icid
e
18
4
18
2.9
139
14
7.2
15
33
.333
11
50
95
8.3
333
20
4.4
444
10
0
16
0.9
142
11
5
24
5.3
333
10
0
18
1.8
406
10
4.5
455
96
.234
31
10
64
.815
11
05
.769
22
19
.542
19
0.9
704
17
88
.578
18
40
Inse
ctic
ide
17
18
.75
17
08
.605
20
62
.5
18
33
.333
13
75
11
45
.833
12
22
.222
11
95
.652
12
82
.649
13
75
18
33
.333
11
95
.652
16
98
.579
12
50
11
50
.628
12
73
.148
13
22
.115
19
90
.35
11
41
.671
20
04
.86
20
62
.5
cost
A
47
50
9
48
48
9.2
2
45
98
8
57
91
8.4
2
62
99
0.4
3
56
26
2
55
05
1.4
9
52
94
2
55
47
0.9
3
60
69
3.5
59
41
1.6
7
52
94
2
46
95
1.4
5
52
39
3.9
1
50
78
9.5
4
58
32
4.4
7
54
02
4.2
8
51
36
1.4
7
57
32
7.9
9
53
02
0.2
4
53
96
1.6
8
cost
B
33
25
.63
33
94
.245
32
19
.16
40
54
.289
44
09
.33
39
38
.34
38
53
.604
37
05
.94
38
82
.965
42
48
.545
41
58
.817
37
05
.94
32
86
.602
36
67
.574
35
55
.268
40
82
.713
37
81
.7
35
95
.303
40
12
.959
37
11
.417
37
77
.317
cost
C
50
83
4.6
3
51
88
3.4
7
49
20
7.1
6
61
97
2.7
1
67
39
9.7
5
60
20
0.3
4
58
90
5.0
9
56
64
7.9
4
59
35
3.8
9
64
94
2.0
5
63
57
0.4
8
56
64
7.9
4
50
23
8.0
5
56
06
1.4
8
54
34
4.8
1
62
40
7.1
8
57
80
5.9
8
54
95
6.7
7
61
34
0.9
5
56
73
1.6
6
57
73
8.9
9
Gro
ss
inco
me
10
70
83
.3
12
00
00
10
48
75
17
20
83
.3
15
48
12
.5
12
27
08
.3
14
77
77
.8
14
91
77
13
60
38
.6
16
14
58
.3
14
87
50
15
32
92
.2
12
59
22
.9
13
41
86
.6
16
21
33
.9
19
36
34
.3
19
64
28
.6
19
06
78
15
17
90
.3
12
81
89
.6
11
31
25

40
Net
in
com
e
56
24
8.7
68
11
6.5
3
55
66
7.8
4
11
41
64
.9
91
82
2.0
8
66
44
6.3
3
92
72
6.2
9
96
23
4.9
5
80
56
7.6
3
10
07
64
.8
89
33
8.3
3
10
03
50
.2
78
97
1.4
4
81
79
2.7
1
11
13
44
.4
13
53
09
.8
14
24
04
.3
13
93
16
.5
94
46
2.3
6
75
16
9.3
1
59
16
3.3
3
BC
Ra
tio
2.1
1
2.3
1
2.1
3
2.7
8
2.3
0
2.0
4
2.5
1
2.6
3
2.2
9
2.4
9
2.3
4
2.7
1
2.5
1
2.3
9
2.9
8
3.1
0
3.4
0
3.4
7
2.4
7
2.2
6
1.9
6
viii. Cabbage
SOUTH DISTRICT WEST KHOWAI SIPAHIJALA GOMATI NORTH GANDACHERA UNAKOTI
Hea
ds
Pa
ngo
pa
l
Deb
na
th
Ba
pan
Da
s
Pa
rim
al
Deb
na
th
Ch
ait
ra
Mo
hon
Deb
ba
rma
Sa
uji
t
Deb
ba
rma
Su
ku
ma
r
Sa
rka
r
Nis
hik
an
ta
Bis
wa
s
Nir
an
jan
Deb
na
th
Du
lal
Deb
na
th
Ru
sma
t A
li
Ra
nja
n D
as
Ma
nso
or
Ali
Ba
da
l D
ebn
ath
Ta
pan
Dey
Nir
an
jan
Deb
na
th
Ha
rip
ad
Na
th
Yo
ges
h S
inh
a
Sa
chin
an
da
n
Sa
rka
r
Dir
gh
a
Ch
ak
ma
Du
rbes
hw
ar
Ch
ak
ma
Pa
rak
an
i
Ch
ak
ma
Ta
her
Miy
a
Go
uta
m
Ch
ow
dh
ury
Ha
rip
ad
a S
ah
a
Ma
n
La
bou
rs
44
06
2.5
42
36
7.7
9
41
56
8.4
40
19
3.8
4
44
06
2.5
42
11
4.7
42
93
8.9
3
44
06
2.5
41
96
4.2
9
60
93
7.5
41
66
6.6
7
56
25
0
31
64
0.6
3
47
87
2.3
4
33
86
2.6
8
42
93
8.9
3
33
79
9.5
3
31
64
0.6
3
42
36
7.7
9
40
17
8.5
7
31
54
2.0
6
42
93
8.9
3
46
87
5
41
66
6.7
po
wer
til
ler
96
87
.5
93
14
.904
91
39
.151
88
36
.944
96
87
.5
92
59
.259
31
96
.565
96
87
.5
92
26
.19
39
06
.25
91
60
.757
41
87
.5
41
01
.563
35
63
.83
40
86
.875
31
96
.565
40
79
.254
41
01
.563
93
14
.904
29
91
.071
40
88
.785
31
96
.565
40
26
.442
91
60
.8
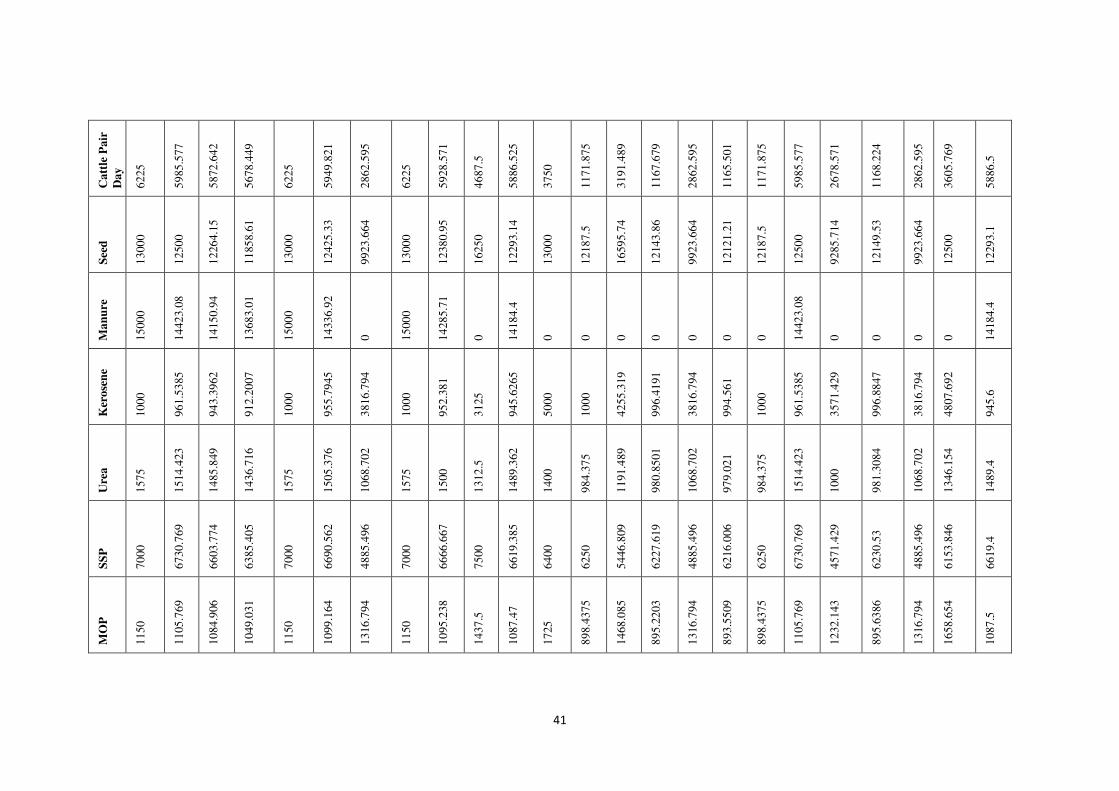
41
Ca
ttle
Pa
ir
Da
y
62
25
59
85
.577
58
72
.642
56
78
.449
62
25
59
49
.821
28
62
.595
62
25
59
28
.571
46
87
.5
58
86
.525
37
50
11
71
.875
31
91
.489
11
67
.679
28
62
.595
11
65
.501
11
71
.875
59
85
.577
26
78
.571
11
68
.224
28
62
.595
36
05
.769
58
86
.5
See
d
13
00
0
12
50
0
12
26
4.1
5
11
85
8.6
1
13
00
0
12
42
5.3
3
99
23
.664
13
00
0
12
38
0.9
5
16
25
0
12
29
3.1
4
13
00
0
12
18
7.5
16
59
5.7
4
12
14
3.8
6
99
23
.664
12
12
1.2
1
12
18
7.5
12
50
0
92
85
.714
12
14
9.5
3
99
23
.664
12
50
0
12
29
3.1
Ma
nu
re
15
00
0
14
42
3.0
8
14
15
0.9
4
13
68
3.0
1
15
00
0
14
33
6.9
2
0
15
00
0
14
28
5.7
1
0
14
18
4.4
0
0
0
0
0
0
0
14
42
3.0
8
0
0
0
0
14
18
4.4
Ker
ose
ne
10
00
96
1.5
385
94
3.3
962
91
2.2
007
10
00
95
5.7
945
38
16
.794
10
00
95
2.3
81
31
25
94
5.6
265
50
00
10
00
42
55
.319
99
6.4
191
38
16
.794
99
4.5
61
10
00
96
1.5
385
35
71
.429
99
6.8
847
38
16
.794
48
07
.692
94
5.6
Ure
a
15
75
15
14
.423
14
85
.849
14
36
.716
15
75
15
05
.376
10
68
.702
15
75
15
00
13
12
.5
14
89
.362
14
00
98
4.3
75
11
91
.489
98
0.8
501
10
68
.702
97
9.0
21
98
4.3
75
15
14
.423
10
00
98
1.3
084
10
68
.702
13
46
.154
14
89
.4
SS
P
70
00
67
30
.769
66
03
.774
63
85
.405
70
00
66
90
.562
48
85
.496
70
00
66
66
.667
75
00
66
19
.385
64
00
62
50
54
46
.809
62
27
.619
48
85
.496
62
16
.006
62
50
67
30
.769
45
71
.429
62
30
.53
48
85
.496
61
53
.846
66
19
.4
MO
P
11
50
11
05
.769
10
84
.906
10
49
.031
11
50
10
99
.164
13
16
.794
11
50
10
95
.238
14
37
.5
10
87
.47
17
25
89
8.4
375
14
68
.085
89
5.2
203
13
16
.794
89
3.5
509
89
8.4
375
11
05
.769
12
32
.143
89
5.6
386
13
16
.794
16
58
.654
10
87
.5

42
Bo
ron
28
7.5
27
6.4
423
27
1.2
264
26
2.2
577
28
7.5
27
4.7
909
0
28
7.5
27
3.8
095
12
5
27
1.8
676
0
28
75
0
28
64
.705
0
28
59
.363
28
75
27
6.4
423
0
28
66
.044
0
0
27
1.9
Fu
ng
icid
e
16
25
15
62
.5
15
33
.019
14
82
.326
16
25
15
53
.166
12
40
.458
16
25
15
47
.619
20
31
.25
15
36
.643
16
25
10
15
.625
13
82
.979
10
11
.988
12
40
.458
10
10
.101
10
15
.625
15
62
.5
11
60
.714
10
12
.461
12
40
.458
15
62
.5
15
36
.6
Ba
mb
oo
50
00
48
07
.692
47
16
.981
45
61
.003
50
00
47
78
.973
57
25
.191
50
00
53
57
.143
93
75
53
19
.149
75
00
46
87
.5
63
82
.979
46
70
.715
57
25
.191
46
62
.005
46
87
.5
48
07
.692
53
57
.143
46
72
.897
57
25
.191
72
11
.538
53
19
.1
tra
nsp
ort
22
50
.083
21
67
.388
21
25
.236
17
32
.697
22
50
.083
19
95
.739
14
56
.743
22
50
.083
21
47
.698
20
29
.17
21
33
.176
17
08
.333
16
44
.198
22
48
.227
16
38
.668
14
56
.743
14
70
.039
18
10
.865
21
67
.388
15
29
.762
14
23
.396
14
56
.743
17
86
.859
21
33
.2
CO
ST
A
10
78
62
.6
10
37
17
.9
10
17
59
.7
98
07
2.4
9
10
78
62
.6
10
29
39
.6
78
43
1.9
3
10
78
62
.6
10
33
26
.3
11
27
17
10
25
94
.2
10
25
45
.8
68
45
6.7
93
59
9.2
9
70
54
7.2
8
78
43
1.9
3
70
25
0.1
5
68
62
3.3
6
10
37
17
.9
73
55
6.5
5
68
02
7.7
6
78
43
1.9
3
91
53
4.4
6
10
25
94
.2
CO
ST
B
75
50
.381
72
60
.251
71
23
.177
68
65
.074
75
50
.381
72
05
.771
54
90
.235
75
50
.381
72
32
.839
78
90
.167
71
81
.592
71
78
.208
47
91
.969
65
51
.95
49
38
.309
54
90
.235
49
17
.51
48
03
.636
72
60
.251
51
48
.958
47
61
.943
54
90
.235
64
07
.412
71
81
.592
CO
ST
C
11
54
13
11
09
78
.1
10
88
82
.8
10
49
37
.6
11
54
13
11
01
45
.4
83
92
2.1
7
11
54
13
11
05
59
.1
12
06
06
.8
10
97
75
.8
10
97
24
73
24
8.6
7
10
01
51
.2
75
48
5.5
9
83
92
2.1
7
75
16
7.6
6
73
42
7
10
37
17
.9
73
55
6.5
5
68
02
7.7
6
83
92
2.2
97
94
1.8
7
10
97
75
.8
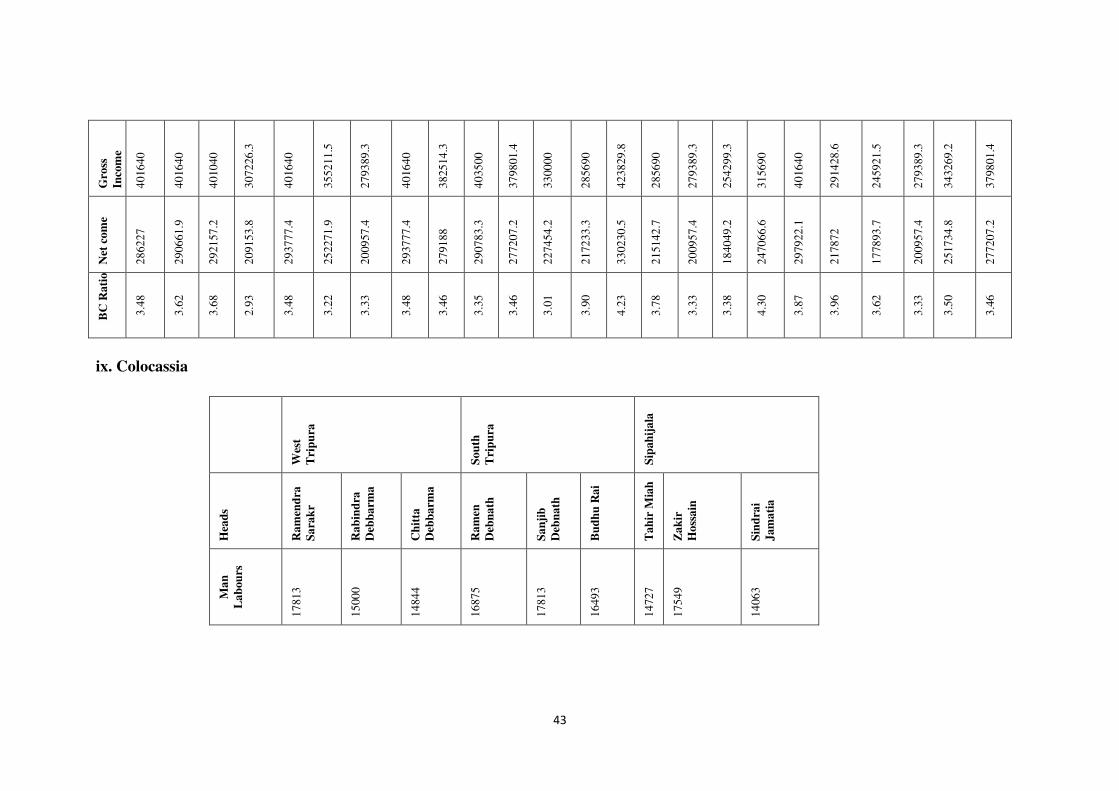
43
Gro
ss
Inco
me
40
16
40
40
16
40
40
10
40
30
72
26
.3
40
16
40
35
52
11
.5
27
93
89
.3
40
16
40
38
25
14
.3
40
35
00
37
98
01
.4
33
00
00
28
56
90
42
38
29
.8
28
56
90
27
93
89
.3
25
42
99
.3
31
56
90
40
16
40
29
14
28
.6
24
59
21
.5
27
93
89
.3
34
32
69
.2
37
98
01
.4
Net
co
me
28
62
27
29
06
61
.9
29
21
57
.2
20
91
53
.8
29
37
77
.4
25
22
71
.9
20
09
57
.4
29
37
77
.4
27
91
88
29
07
83
.3
27
72
07
.2
22
74
54
.2
21
72
33
.3
33
02
30
.5
21
51
42
.7
20
09
57
.4
18
40
49
.2
24
70
66
.6
29
79
22
.1
21
78
72
17
78
93
.7
20
09
57
.4
25
17
34
.8
27
72
07
.2
BC
Ra
tio
3.4
8
3.6
2
3.6
8
2.9
3
3.4
8
3.2
2
3.3
3
3.4
8
3.4
6
3.3
5
3.4
6
3.0
1
3.9
0
4.2
3
3.7
8
3.3
3
3.3
8
4.3
0
3.8
7
3.9
6
3.6
2
3.3
3
3.5
0
3.4
6
ix. Colocassia
Wes
t
Tri
pu
ra
So
uth
Tri
pu
ra
Sip
ah
ija
la
Hea
ds
Ra
men
dra
Sa
rak
r
Ra
bin
dra
Deb
ba
rma
Ch
itta
Deb
ba
rma
Ra
men
Deb
na
th
Sa
nji
b
Deb
na
th
Bu
dh
u R
ai
Ta
hir
Mia
h
Za
kir
Ho
ssa
in
Sin
dra
i
Jam
ati
a
Ma
n
La
bou
rs
17
81
3
15
00
0
14
84
4
16
87
5
17
81
3
16
49
3
14
72
7
17
54
9
14
06
3
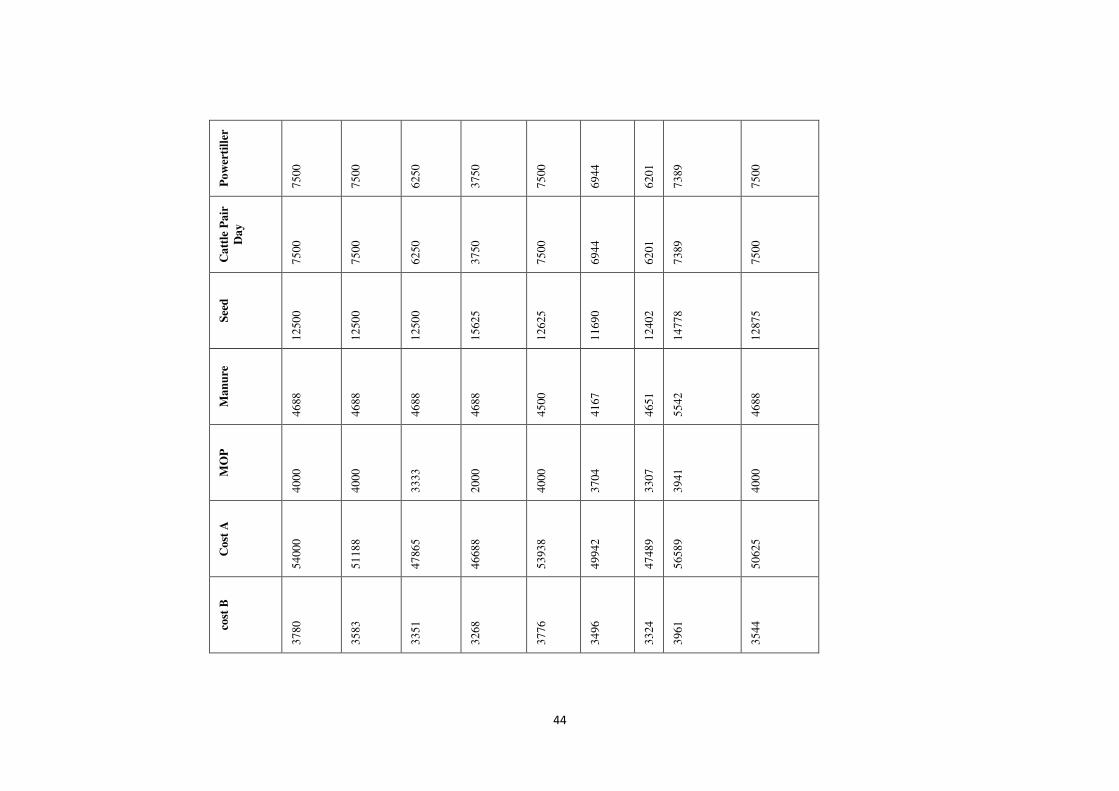
44
Po
wer
till
er
75
00
75
00
62
50
37
50
75
00
69
44
62
01
73
89
75
00
Ca
ttle
Pa
ir
Da
y
75
00
75
00
62
50
37
50
75
00
69
44
62
01
73
89
75
00
See
d
12
50
0
12
50
0
12
50
0
15
62
5
12
62
5
11
69
0
12
40
2
14
77
8
12
87
5
Ma
nu
re
46
88
46
88
46
88
46
88
45
00
41
67
46
51
55
42
46
88
MO
P
40
00
40
00
33
33
20
00
40
00
37
04
33
07
39
41
40
00
Co
st A
54
00
0
51
18
8
47
86
5
46
68
8
53
93
8
49
94
2
47
48
9
56
58
9
50
62
5
cost
B
37
80
35
83
33
51
32
68
37
76
34
96
33
24
39
61
35
44

45
Co
st C
57
78
0
54
77
1
51
21
5
49
95
6
57
71
3
53
43
8
50
81
3
60
55
0
54
16
9
Gro
ss
inco
me
22
50
00
20
62
50
17
50
00
18
93
75
22
40
63
18
31
60
15
81
23
17
66
01
18
37
50
Net
in
com
e
17
10
00
15
50
63
12
71
35
14
26
88
17
01
25
13
32
18
11
06
35
12
00
12
13
31
25
BC
Ra
tio
3.8
9
3.7
7
3.4
2
3.7
9
3.8
8
3.4
3
3.1
1
2.9
2
3.3
9
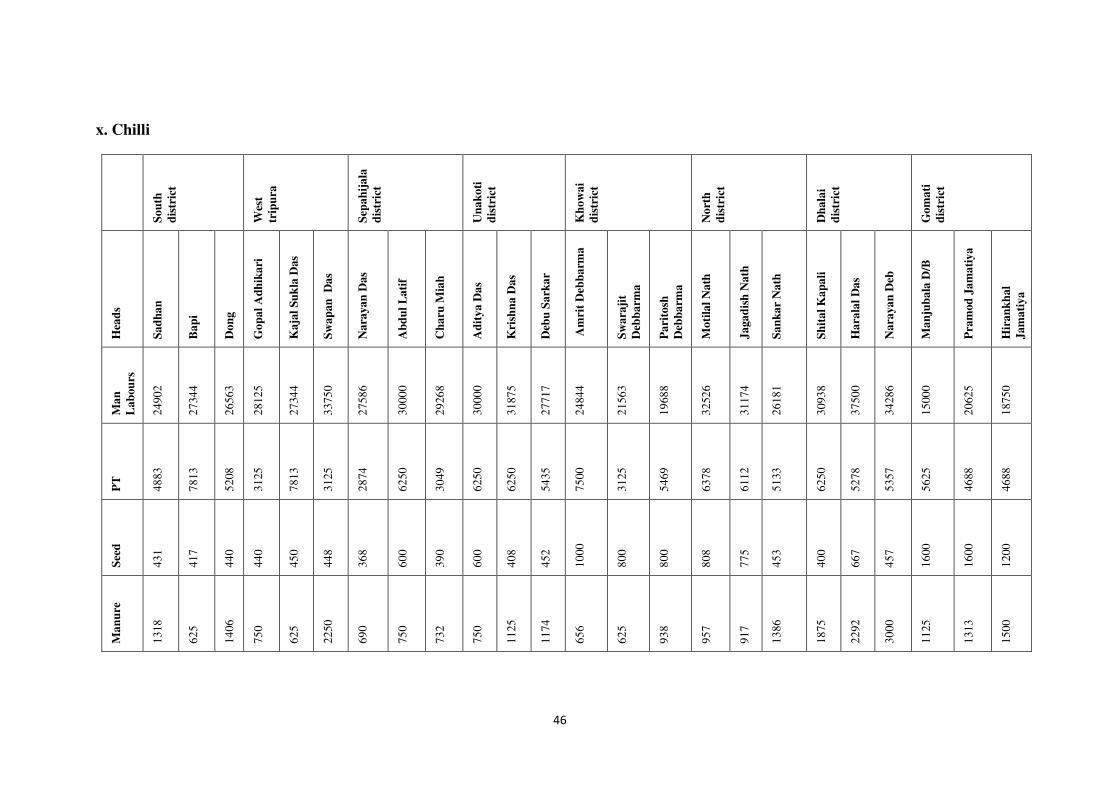
46
x. Chilli
S
ou
th
dis
tric
t
Wes
t
trip
ura
Sep
ah
ija
la
dis
tric
t
Un
ak
oti
dis
tric
t
Kh
ow
ai
dis
tric
t
No
rth
dis
tric
t
Dh
ala
i
dis
tric
t
Go
ma
ti
dis
tric
t
Hea
ds
Sa
dh
an
Ba
pi
Do
ng
Go
pa
l A
dh
ika
ri
Ka
jal
Su
kla
Da
s
Sw
ap
an
D
as
Na
raya
n D
as
Ab
du
l L
ati
f
Ch
aru
Mia
h
Ad
ity
a D
as
Kri
shn
a D
as
Deb
u S
ark
ar
Am
rit
Deb
ba
rma
Sw
ara
jit
Deb
ba
rma
Pa
rito
sh
Deb
ba
rma
Mo
tila
l N
ath
Ja
ga
dis
h N
ath
Sa
nk
ar
Na
th
Sh
ita
l K
ap
ali
Ha
rala
l D
as
Na
raya
n D
eb
Ma
nju
ba
la D
/B
Pra
mod
Ja
ma
tiy
a
Hir
an
kh
al
Jam
ati
ya
Ma
n
La
bou
rs
24
90
2
27
34
4
26
56
3
28
12
5
27
34
4
33
75
0
27
58
6
30
00
0
29
26
8
30
00
0
31
87
5
27
71
7
24
84
4
21
56
3
19
68
8
32
52
6
31
17
4
26
18
1
30
93
8
37
50
0
34
28
6
15
00
0
20
62
5
18
75
0
PT
48
83
78
13
52
08
31
25
78
13
31
25
28
74
62
50
30
49
62
50
62
50
54
35
75
00
31
25
54
69
63
78
61
12
51
33
62
50
52
78
53
57
56
25
46
88
46
88
See
d
43
1
41
7
44
0
44
0
45
0
44
8
36
8
60
0
39
0
60
0
40
8
45
2
10
00
80
0
80
0
80
8
77
5
45
3
40
0
66
7
45
7
16
00
16
00
12
00
Ma
nu
re
13
18
62
5
14
06
75
0
62
5
22
50
69
0
75
0
73
2
75
0
11
25
11
74
65
6
62
5
93
8
95
7
91
7
13
86
18
75
22
92
30
00
11
25
13
13
15
00
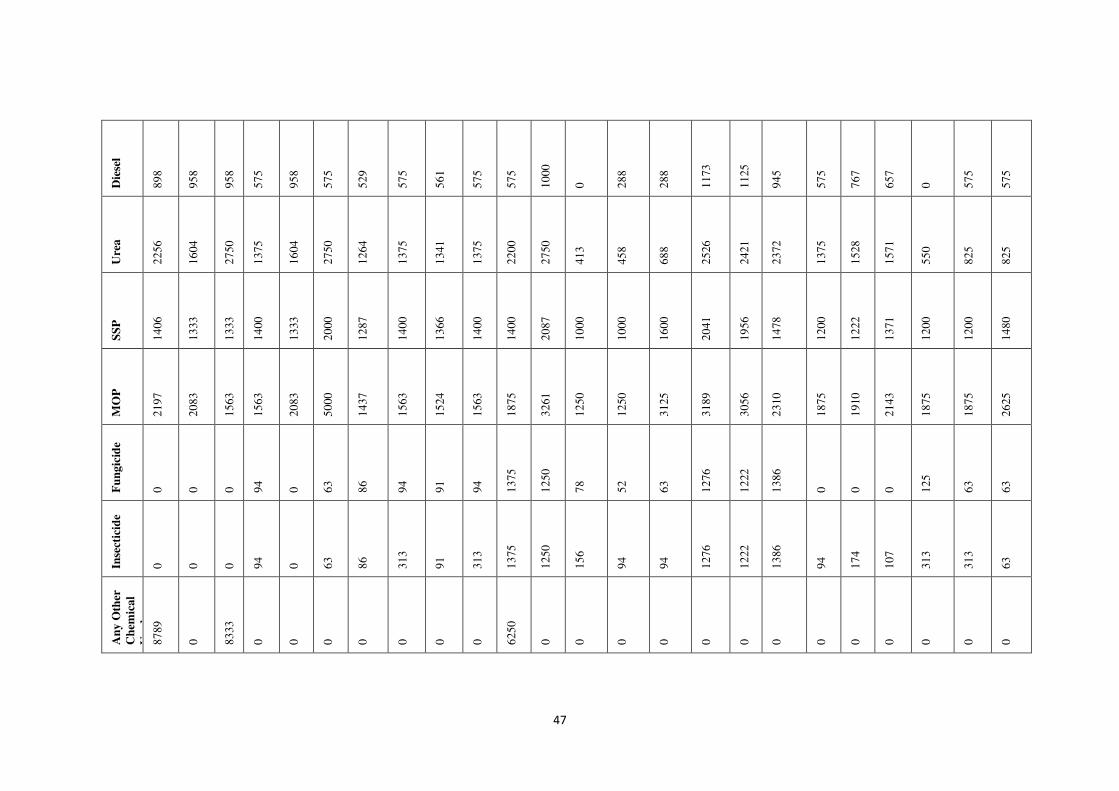
47
Die
sel
89
8
95
8
95
8
57
5
95
8
57
5
52
9
57
5
56
1
57
5
57
5
10
00
0
28
8
28
8
11
73
11
25
94
5
57
5
76
7
65
7
0
57
5
57
5
Ure
a
22
56
16
04
27
50
13
75
16
04
27
50
12
64
13
75
13
41
13
75
22
00
27
50
41
3
45
8
68
8
25
26
24
21
23
72
13
75
15
28
15
71
55
0
82
5
82
5
SS
P
14
06
13
33
13
33
14
00
13
33
20
00
12
87
14
00
13
66
14
00
14
00
20
87
10
00
10
00
16
00
20
41
19
56
14
78
12
00
12
22
13
71
12
00
12
00
14
80
MO
P
21
97
20
83
15
63
15
63
20
83
50
00
14
37
15
63
15
24
15
63
18
75
32
61
12
50
12
50
31
25
31
89
30
56
23
10
18
75
19
10
21
43
18
75
18
75
26
25
Fu
ng
icid
e
0
0
0
94
0
63
86
94
91
94
13
75
12
50
78
52
63
12
76
12
22
13
86
0
0
0
12
5
63
63
Inse
ctic
ide
0
0
0
94
0
63
86
31
3
91
31
3
13
75
12
50
15
6
94
94
12
76
12
22
13
86
94
17
4
10
7
31
3
31
3
63
An
y O
ther
Ch
emic
al
Use
d
87
89
0
83
33
0
0
0
0
0
0
0
62
50
0
0
0
0
0
0
0
0
0
0
0
0
0

48
CO
ST
A
47
08
2
42
17
7
48
55
5
37
54
0
42
21
0
50
02
3
36
20
7
42
91
9
38
41
5
42
91
9
54
70
8
46
37
6
36
89
7
29
25
4
32
75
0
52
14
7
49
98
0
52
27
1
44
58
1
51
33
6
48
95
0
27
41
3
33
07
5
31
76
8
CO
ST
B
0
0
0
26
28
29
55
35
02
25
34
30
04
26
89
30
04
38
30
32
46
25
83
20
48
22
93
36
50
34
99
30
12
31
21
35
94
34
27
19
19
23
15
22
24
CO
ST
C
47
08
2
42
17
7
48
55
5
40
16
8
45
16
5
53
52
5
38
74
1
45
92
3
41
10
4
45
92
3
58
53
8
49
62
2
39
48
0
31
30
2
35
04
3
55
79
8
53
47
9
55
28
3
47
70
2
54
93
0
52
37
7
29
33
1
35
39
0
33
99
1
Gro
ss
Inco
me
12
89
06
10
93
75
11
66
67
17
50
00
18
75
00
27
00
00
10
57
47
12
50
00
10
73
17
12
50
00
15
00
00
13
04
35
15
62
50
14
58
33
15
00
00
19
38
78
16
87
04
17
65
91
15
00
00
13
88
89
15
71
43
15
00
00
14
00
00
14
25
00
Net
in
com
e
81
82
5
67
19
8
68
11
2
13
48
32
14
23
35
21
64
75
67
00
6
79
07
7
66
21
3
79
07
7
91
46
2
80
81
2
11
67
70
11
45
31
11
49
58
13
80
80
11
52
26
12
13
09
10
22
98
83
95
9
10
47
66
12
06
69
10
46
10
10
85
09
BC
Ra
tio
2.7
4
2.5
9
2.4
0
4.3
6
4.1
5
5.0
4
2.7
3
2.7
2
2.6
1
2.7
2
2.5
6
2.6
3
3.9
6
4.6
6
4.2
8
3.4
7
3.1
5
3.1
9
3.1
4
2.5
3
3.0
0
5.1
1
3.9
6
4.1
9

49
xi. Potato D
HA
LA
I
DIS
TR
ICT
WE
ST
DIS
TR
ICT
KH
OW
AI
DIS
TR
ICT
NO
RT
H
DIS
TR
ICT
UN
AK
OT
I
DIS
TR
ICT
GO
MA
TI
DIS
TR
ICT
SE
PA
HIJ
A
LA
DIS
TR
ICT
SO
UT
H
DIS
TR
ICT
Hea
ds
Go
pa
l D
ebn
ath
Su
bal
Deb
na
th
Ra
mp
ad
a B
isw
as
Bis
hn
u D
b
Ra
men
dra
Db
Ra
bi
Ku
ma
r
Su
ku
ma
r
Pa
resh
Ra
nji
t D
/b
Pu
lin
e D
ebn
ath
Su
dam
Deb
na
th
Ab
du
l B
aid
ya
Su
ma
n D
as
Mir
jan
Mia
h
Am
rit
Ma
llic
k
Ka
rtik
Deb
na
th
Bin
da
ba
n
Deb
na
th
Ra
mch
ara
n
Dn
ath
Mu
ku
l D
as
Ra
kh
al
Sh
arm
a
Arj
un
Deb
na
th
Bir
end
ra D
eb
Kh
ok
ha
n D
as
Aa
ma
chi
Mog
Ma
n
La
bou
rs
40
31
3
38
57
1
40
00
0
41
73
9
39
70
6
42
18
8
58
12
5
56
78
6
52
00
0
42
18
8
45
00
0
40
00
0
40
00
0
37
50
0
41
25
0
47
00
0
38
75
0
39
52
1
36
00
0
41
73
9
39
70
6
37
50
0
41
25
0
38
33
3
PT
58
59
53
57
52
08
54
35
55
15
58
59
42
97
53
57
45
83
58
59
50
00
52
08
97
22
43
75
78
13
58
33
52
08
59
88
50
00
54
35
55
15
41
67
62
50
55
56
See
d
12
85
6
14
66
7
12
65
0
13
20
0
11
38
8
13
06
3
11
68
8
11
00
0
13
20
0
13
06
3
13
20
0
12
83
3
97
78
85
80
11
00
0
13
93
3
13
20
0
11
85
6
13
68
9
13
20
0
11
38
8
71
50
11
68
8
13
68
9
Ma
nu
re
0
0
62
5
63
3
78
5
0
93
8
10
71
10
00
0
25
0
50
0
83
3
80
00
10
00
0
0
62
5
89
8
0
63
3
78
5
66
67
10
00
0
79
11
Die
sel
21
6
32
9
19
2
20
0
54
1
38
8
28
8
82
1
61
3
38
8
15
3
19
2
51
1
11
50
71
9
15
3
19
2
27
5
30
7
20
0
54
1
95
8
71
9
76
7
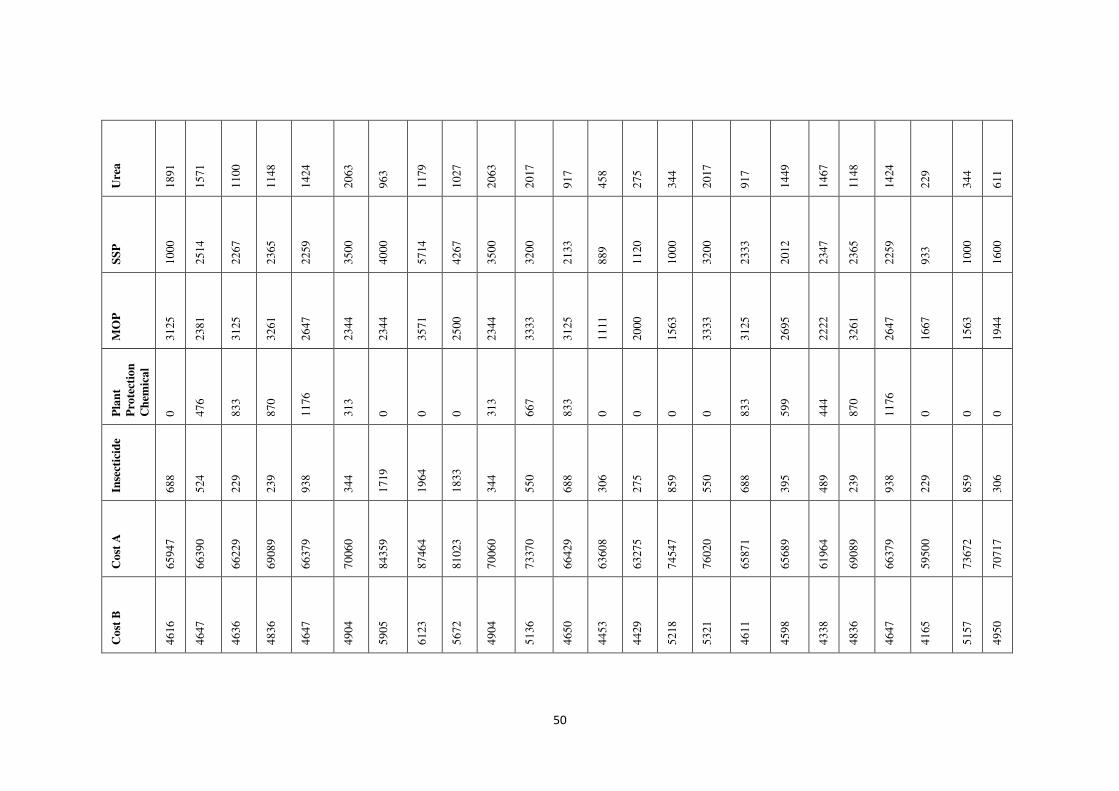
50
Ure
a
18
91
15
71
11
00
11
48
14
24
20
63
96
3
11
79
10
27
20
63
20
17
91
7
45
8
27
5
34
4
20
17
91
7
14
49
14
67
11
48
14
24
22
9
34
4
61
1
SS
P
10
00
25
14
22
67
23
65
22
59
35
00
40
00
57
14
42
67
35
00
32
00
21
33
88
9
11
20
10
00
32
00
23
33
20
12
23
47
23
65
22
59
93
3
10
00
16
00
MO
P
31
25
23
81
31
25
32
61
26
47
23
44
23
44
35
71
25
00
23
44
33
33
31
25
11
11
20
00
15
63
33
33
31
25
26
95
22
22
32
61
26
47
16
67
15
63
19
44
Pla
nt
Pro
tect
ion
Ch
emic
al
0
47
6
83
3
87
0
11
76
31
3
0
0
0
31
3
66
7
83
3
0
0
0
0
83
3
59
9
44
4
87
0
11
76
0
0
0
Inse
ctic
ide
68
8
52
4
22
9
23
9
93
8
34
4
17
19
19
64
18
33
34
4
55
0
68
8
30
6
27
5
85
9
55
0
68
8
39
5
48
9
23
9
93
8
22
9
85
9
30
6
Co
st A
65
94
7
66
39
0
66
22
9
69
08
9
66
37
9
70
06
0
84
35
9
87
46
4
81
02
3
70
06
0
73
37
0
66
42
9
63
60
8
63
27
5
74
54
7
76
02
0
65
87
1
65
68
9
61
96
4
69
08
9
66
37
9
59
50
0
73
67
2
70
71
7
Co
st B
46
16
46
47
46
36
48
36
46
47
49
04
59
05
61
23
56
72
49
04
51
36
46
50
44
53
44
29
52
18
53
21
46
11
45
98
43
38
48
36
46
47
41
65
51
57
49
50
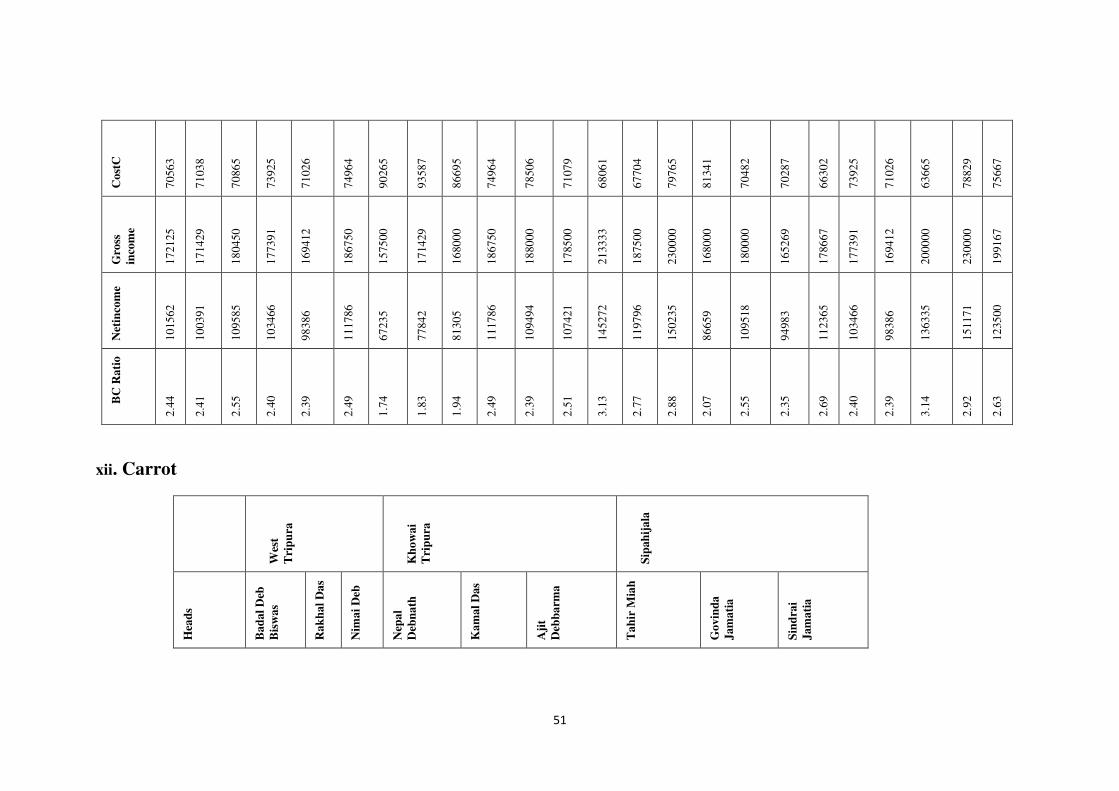
51
Co
stC
70
56
3
71
03
8
70
86
5
73
92
5
71
02
6
74
96
4
90
26
5
93
58
7
86
69
5
74
96
4
78
50
6
71
07
9
68
06
1
67
70
4
79
76
5
81
34
1
70
48
2
70
28
7
66
30
2
73
92
5
71
02
6
63
66
5
78
82
9
75
66
7
Gro
ss
inco
me
17
21
25
17
14
29
18
04
50
17
73
91
16
94
12
18
67
50
15
75
00
17
14
29
16
80
00
18
67
50
18
80
00
17
85
00
21
33
33
18
75
00
23
00
00
16
80
00
18
00
00
16
52
69
17
86
67
17
73
91
16
94
12
20
00
00
23
00
00
19
91
67
Net
inco
me
10
15
62
10
03
91
10
95
85
10
34
66
98
38
6
11
17
86
67
23
5
77
84
2
81
30
5
11
17
86
10
94
94
10
74
21
14
52
72
11
97
96
15
02
35
86
65
9
10
95
18
94
98
3
11
23
65
10
34
66
98
38
6
13
63
35
15
11
71
12
35
00
BC
Ra
tio
2.4
4
2.4
1
2.5
5
2.4
0
2.3
9
2.4
9
1.7
4
1.8
3
1.9
4
2.4
9
2.3
9
2.5
1
3.1
3
2.7
7
2.8
8
2.0
7
2.5
5
2.3
5
2.6
9
2.4
0
2.3
9
3.1
4
2.9
2
2.6
3
xii. Carrot
Wes
t
Tri
pu
ra
Kh
ow
ai
Tri
pu
ra
Sip
ah
ija
la
Hea
ds
Ba
da
l D
eb
Bis
wa
s
Ra
kh
al
Da
s
Nim
ai
Deb
Nep
al
Deb
na
th
Ka
ma
l D
as
Aji
t
Deb
ba
rma
Ta
hir
Mia
h
Go
vin
da
Jam
ati
a
Sin
dra
i
Jam
ati
a
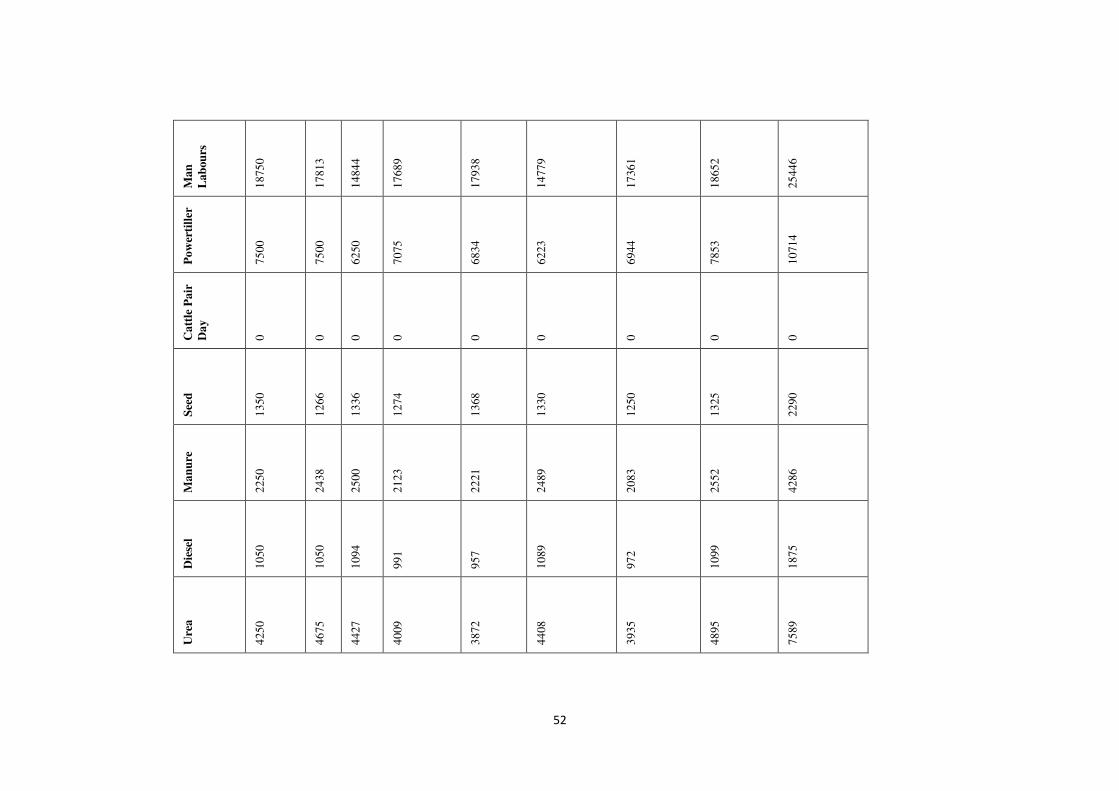
52
Ma
n
La
bou
rs
18
75
0
17
81
3
14
84
4
17
68
9
17
93
8
14
77
9
17
36
1
18
65
2
25
44
6
Po
wer
till
er
75
00
75
00
62
50
70
75
68
34
62
23
69
44
78
53
10
71
4
Ca
ttle
Pa
ir
Da
y
0
0
0
0
0
0
0
0
0
See
d
13
50
12
66
13
36
12
74
13
68
13
30
12
50
13
25
22
90
Ma
nu
re
22
50
24
38
25
00
21
23
22
21
24
89
20
83
25
52
42
86
Die
sel
10
50
10
50
10
94
99
1
95
7
10
89
97
2
10
99
18
75
Ure
a
42
50
46
75
44
27
40
09
38
72
44
08
39
35
48
95
75
89
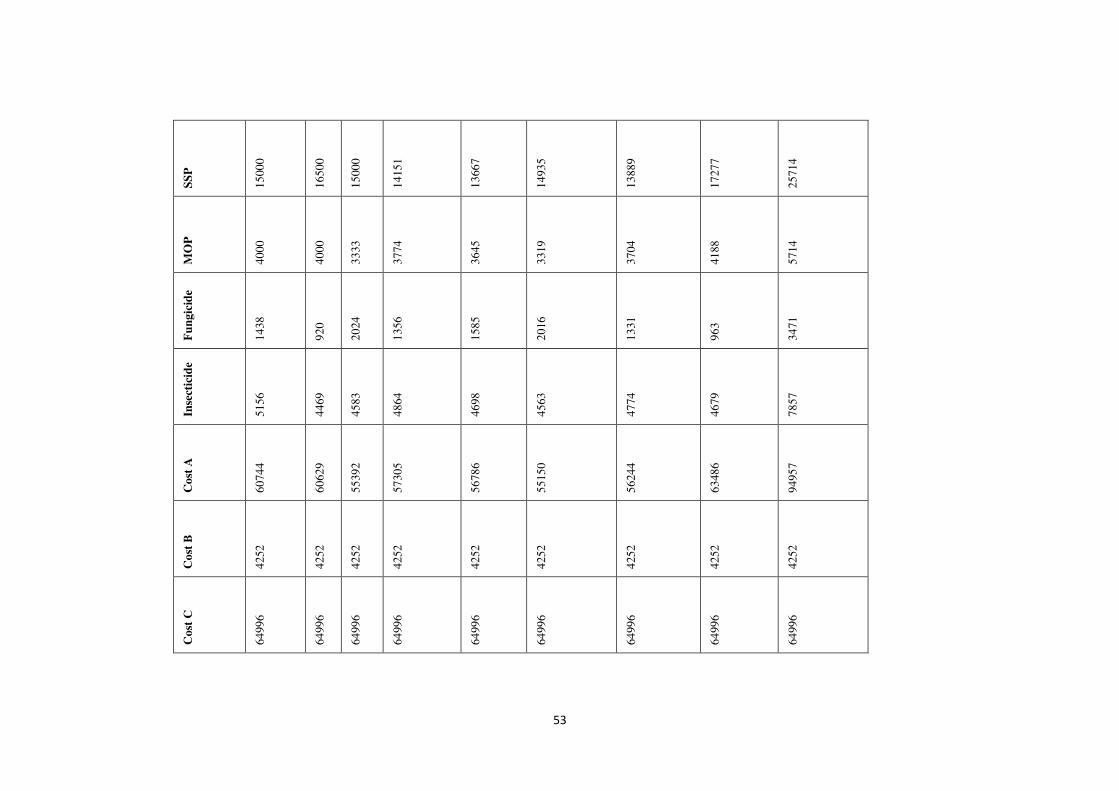
53
SS
P
15
00
0
16
50
0
15
00
0
14
15
1
13
66
7
14
93
5
13
88
9
17
27
7
25
71
4
MO
P
40
00
40
00
33
33
37
74
36
45
33
19
37
04
41
88
57
14
Fu
ng
icid
e
14
38
92
0
20
24
13
56
15
85
20
16
13
31
96
3
34
71
Inse
ctic
ide
51
56
44
69
45
83
48
64
46
98
45
63
47
74
46
79
78
57
Co
st A
60
74
4
60
62
9
55
39
2
57
30
5
56
78
6
55
15
0
56
24
4
63
48
6
94
95
7
Co
st B
42
52
42
52
42
52
42
52
42
52
42
52
42
52
42
52
42
52
Co
st C
64
99
6
64
99
6
64
99
6
64
99
6
64
99
6
64
99
6
64
99
6
64
99
6
64
99
6

54
Gro
ss
inco
me
19
12
50
19
80
00
19
80
00
18
04
25
17
42
60
16
42
81
17
12
75
20
04
97
25
07
14
Net
in
com
e
13
05
06
13
73
71
14
26
08
12
31
19
11
74
74
10
91
31
11
50
31
13
70
11
15
57
57
BC
Ra
tio
2.9
4
3.0
5
3.0
5
2.7
8
2.6
8
2.5
3
2.6
4
3.0
8
3.8
6
xiii.Frenchbean
Hea
ds
Bis
hw
alg
arh
Kh
ow
ai
Wes
t
No
rth
Sa
lem
a
Ch
am
an
u
Ba
nu
Bis
wa
s
Nid
ha
n D
as
Aji
t B
isw
as
Ra
jku
ma
r
Sin
gh
a
pa
ltu
Da
s
Ba
bu
l M
iya
Ma
np
ow
er
21
56
2
17
81
2
20
15
6
78
12
12
30
4
10
15
6

55
PT
93
75
12
50
0
70
31
52
08
19
53
13
02
See
d/P
lan
ti
ng
Met
eria
l
12
50
0
15
62
5
10
00
0
96
25
10
00
0
83
33
FY
M/C
om
po
st/V
erm
i
com
po
st
22
50
0
75
00
46
87
37
50
17
57
19
21
Ure
a
15
0
22
5
15
0
18
7
93
25
0
SS
P
21
25
10
62
10
62
10
62
79
6
10
62
MO
P
11
50
57
5
57
5
95
8
53
9
71
8
DA
P/
Su
lph
ur
0
10
00
50
0
0
31
2.5
83
3
Fu
ng
icid
e
M-4
5
(250
gm
)
87
5
87
5
10
9
0
13
6
18
2

56
Inse
ctic
ide
=R
oga
r
(100
ml)
0
0
75
0
93
.75
12
5
Fen
cin
g &
Ste
ckin
g
Met
eria
l
(Ba
mb
oo
s)
75
00
0
0
12
50
0
0
Co
st A
77
73
7
57
17
5
44
34
6
29
85
4
27
98
8
24
88
5
Co
st B
54
41
40
02
31
04
20
89
19
59
17
41
Co
st C
83
17
9
61
17
7
47
45
1
31
94
3
29
94
7
26
62
7
Gro
ss
Inco
me
18
75
00
19
68
75
19
06
25
17
95
14
20
93
75
11
25
00
Net
in
com
e
10
43
21
13
56
98
14
31
74
14
75
71
17
94
28
85
87
3
BC
Ra
tio
2.2
5
3.2
2
4.0
2
5.6
2
6.9
9
4.2
3
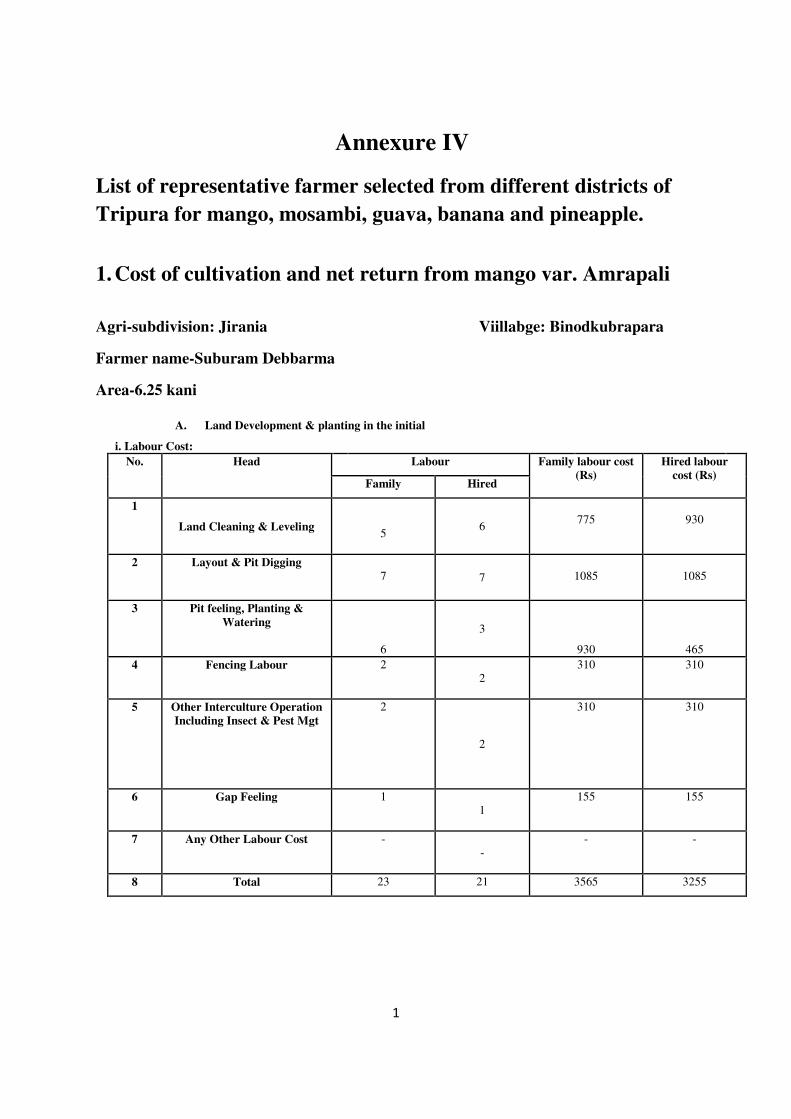
1
Annexure IV
List of representative farmer selected from different districts of
Tripura for mango, mosambi, guava, banana and pineapple.
1. Cost of cultivation and net return from mango var. Amrapali
Agri-subdivision: Jirania Viillabge: Binodkubrapara
Farmer name-Suburam Debbarma
Area-6.25 kani
A. Land Development & planting in the initial
i. Labour Cost:
No. Head Labour Family labour cost
(Rs)
Hired labour
cost (Rs) Family Hired
1
Land Cleaning & Leveling
5 6
775
930
2 Layout & Pit Digging
7 7
1085
1085
3 Pit feeling, Planting &
Watering
6
3
930
465
4 Fencing Labour 2
2
310 310
5 Other Interculture Operation
Including Insect & Pest Mgt
2
2
310 310
6 Gap Feeling 1
1
155 155
7 Any Other Labour Cost -
-
- -
8 Total 23 21 3565 3255
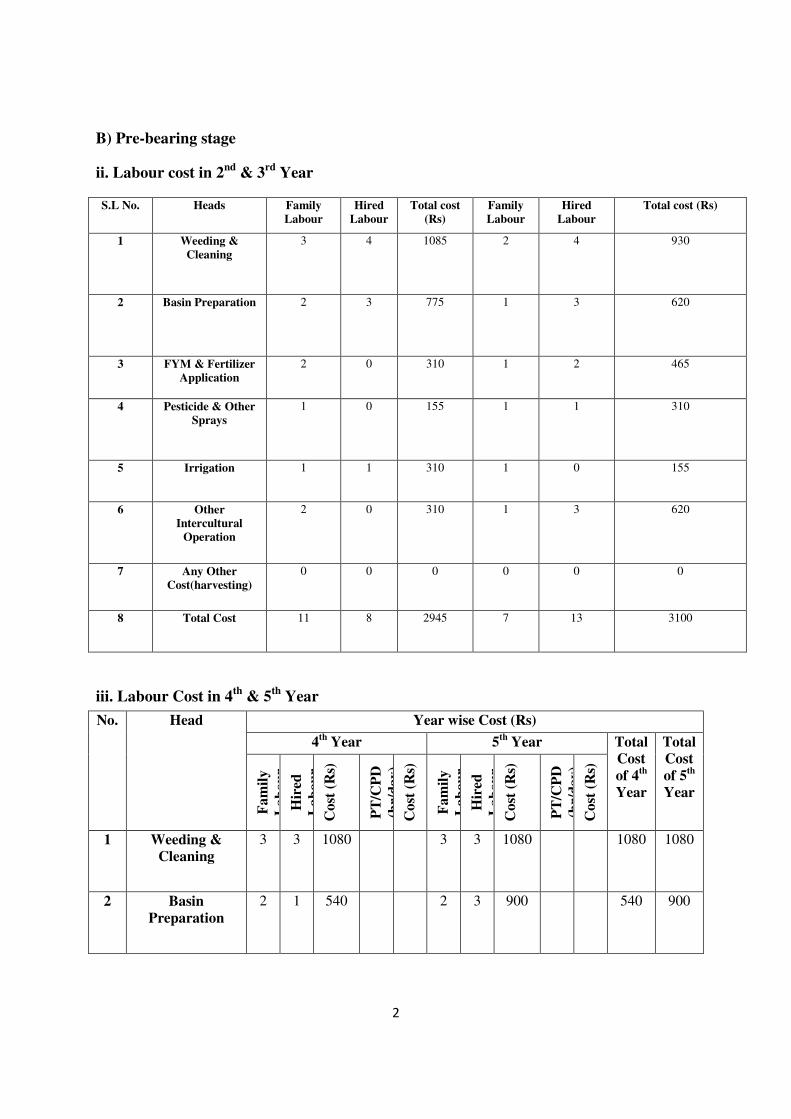
2
B) Pre-bearing stage
ii. Labour cost in 2nd
& 3rd
Year
S.L No. Heads Family
Labour
Hired
Labour
Total cost
(Rs)
Family
Labour
Hired
Labour
Total cost (Rs)
1 Weeding &
Cleaning
3 4 1085 2 4 930
2 Basin Preparation 2 3 775 1 3 620
3 FYM & Fertilizer
Application
2 0 310 1 2 465
4 Pesticide & Other
Sprays
1 0 155 1 1 310
5 Irrigation 1 1 310 1 0 155
6 Other
Intercultural
Operation
2 0 310 1 3 620
7 Any Other
Cost(harvesting)
0 0 0 0 0 0
8 Total Cost 11 8 2945 7 13 3100
iii. Labour Cost in 4th
& 5th
Year
No. Head Year wise Cost (Rs)
4th
Year 5th
Year Total
Cost
of 4th
Year
Total
Cost
of 5th
Year
Fa
mil
y
La
bo
ur
Hir
ed
La
bo
ur
Co
st (
Rs)
PT
/CP
D
(hr/
da
y)
Co
st (
Rs)
Fa
mil
y
La
bo
ur
Hir
ed
La
bo
ur
Co
st (
Rs)
PT
/CP
D
(hr/
da
y)
Co
st (
Rs)
1 Weeding &
Cleaning
3 3 1080 3 3 1080 1080 1080
2 Basin
Preparation
2 1 540 2 3 900 540 900

3
3 FYM &
Fertilizer
Application
2 1 540 1 1 360 540 360
4 Pesticide &
Other Sprays
1 1 360 1 1 360 360 360
5 Irrigation 2 0 360 1 2 540 360 540
6 Other
Intercultural
Operation
2 1 540 1 2 540 540 540
7 Any Other
Cost(harvesting)
2 0 360 1 0 180 360 180
8 Total Cost 0 3780 3960 3780 3960
iv. Labour cost in 6th
& 7th
yr
6th
7th
S.L Heads Family
Labour
Hired
Labour
Total Family
Labour
Hired
Labour
Total Total
Cost of
6th Year
Total
Cost of
7th Year
1 Weeding &
Cleaning
2 13 2700 11 1705 2700 1705
2 Basin Preparation 6 1080 0 5 775 1080 775
3 FYM & Fertilizer
Application
7 1260 6 930 1260 930
4 Pesticide & Other
Sprays
3 540 5 775 540 775
5 Irrigation 2 360 2 310 360 310
6 Other
Intercultural
Operation
9 1620 9 1395 1620 1395
7 Any Other
Cost(harvesting)
10 1800 10 1550 1800 1550
8 Total Cost 2 50 9360 0 48 7440 9360 7440
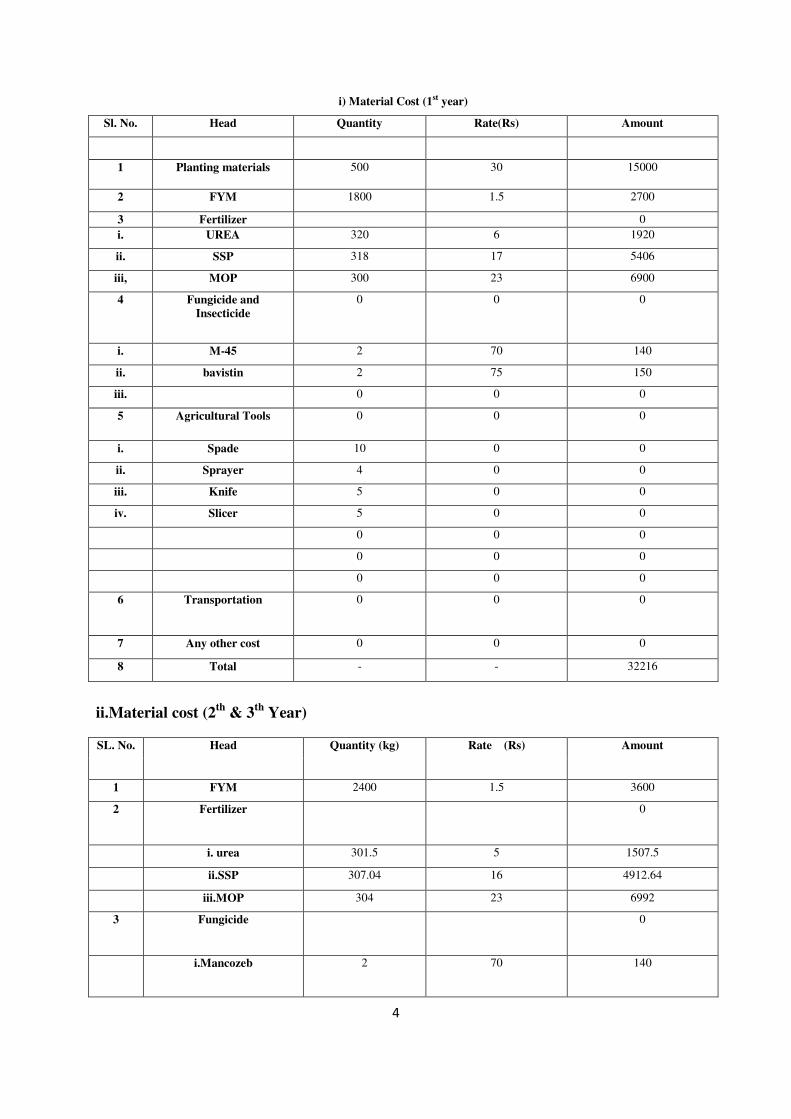
4
ii.Material cost (2th
& 3th
Year)
SL. No. Head Quantity (kg) Rate (Rs) Amount
1 FYM 2400 1.5 3600
2 Fertilizer 0
i. urea 301.5 5 1507.5
ii.SSP 307.04 16 4912.64
iii.MOP 304 23 6992
3 Fungicide 0
i.Mancozeb 2 70 140
i) Material Cost (1st year)
Sl. No. Head Quantity Rate(Rs) Amount
1 Planting materials 500 30 15000
2 FYM 1800 1.5 2700
3 Fertilizer 0
i. UREA 320 6 1920
ii. SSP 318 17 5406
iii, MOP 300 23 6900
4 Fungicide and
Insecticide
0 0 0
i. M-45 2 70 140
ii. bavistin 2 75 150
iii. 0 0 0
5 Agricultural Tools 0 0 0
i. Spade 10 0 0
ii. Sprayer 4 0 0
iii. Knife 5 0 0
iv. Slicer 5 0 0
0 0 0
0 0 0
0 0 0
6 Transportation 0 0 0
7 Any other cost 0 0 0
8 Total - - 32216
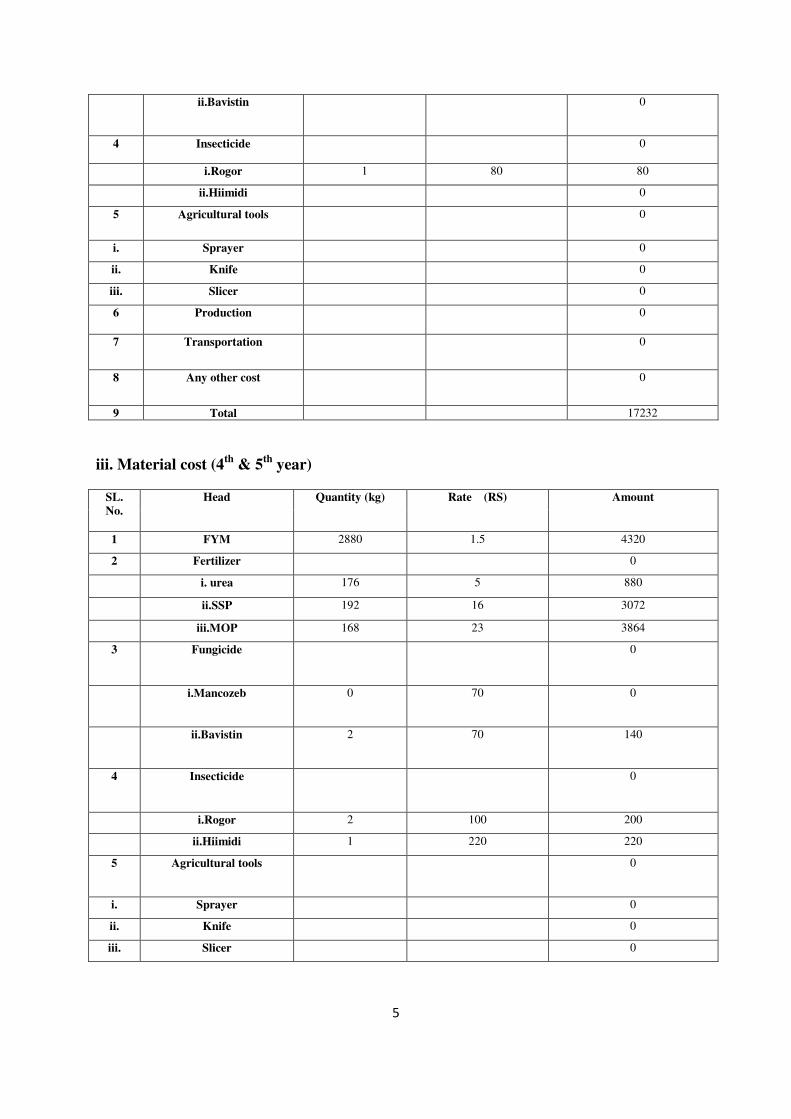
5
ii.Bavistin 0
4 Insecticide 0
i.Rogor 1 80 80
ii.Hiimidi 0
5 Agricultural tools 0
i. Sprayer 0
ii. Knife 0
iii. Slicer 0
6 Production 0
7 Transportation 0
8 Any other cost 0
9 Total 17232
iii. Material cost (4th
& 5th
year)
SL.
No.
Head Quantity (kg) Rate (RS) Amount
1 FYM 2880 1.5 4320
2 Fertilizer 0
i. urea 176 5 880
ii.SSP 192 16 3072
iii.MOP 168 23 3864
3 Fungicide 0
i.Mancozeb 0 70 0
ii.Bavistin 2 70 140
4 Insecticide 0
i.Rogor 2 100 200
ii.Hiimidi 1 220 220
5 Agricultural tools 0
i. Sprayer 0
ii. Knife 0
iii. Slicer 0

6
6 Transportation 0
7 Any other cost 0
9 Total 12696
iv. Material cost (6th
& 7th
Year)
SL.
No.
Head Quantity (kg) Rate (RS) Amount
1 FYM 3000 1.5 4500
2 Fertilizer 0
i. urea 187.2 5 936
ii.SSP 184 17 3128
iii.MOP 180.8 23 4158.4
3 Fungicide 0 0
i.Mancozeb 0 0 0
ii.Bavistin 1 70 70
4 Insecticide 0
i.Rogor 1 70 70
ii.Hiimidi 2 100 200
5 Agricultural tools 0
i. Sprayer 0
ii. Knife 0
iii. Slicer 0
6 Transportation 0
7 Any other cost 0
8 Production 1142 0
9 Total 13062

7
B.Production and Sale
No. Head Quantity Amount
(Rs.)
Quantity Amount
(Rs)
Quantity Amount (Rs)
1 Total
Production of
mango/ha.
1350 - 4000 - 5500 -
4 Sale rate of
grafted plant
- - - - - -
5 Income from
fruit sale @
(Rs. 30/kg)
- 40500 - 120000 - 165000
6 Gross income - 40500 - 120000 - 165000
7 Total 325500
C. Benefit and Cost Analysis
Sl.No Head Amount(Rs)
1 Gross income 325500
2 Total cost 92961.8
3 Net income 146961.8
4. BC Ratio 3.50
2. Cost of cultivation and net return from mosambi
Agri-subdivion: Matabari
Sector-Killa
Village: North Baramura
Name of the Farmer-Rajendra Kaloi
A. Land Development & planting in the initial
i. labour cost
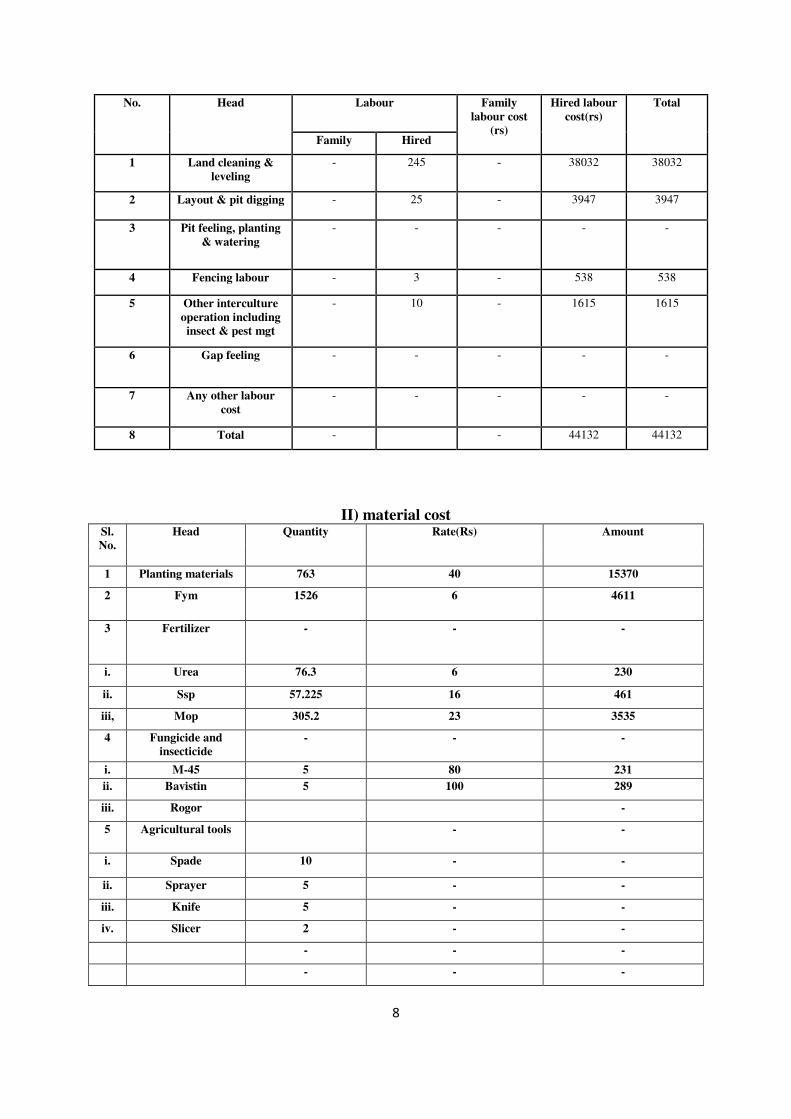
8
No. Head Labour Family
labour cost
(rs)
Hired labour
cost(rs)
Total
Family Hired
1 Land cleaning &
leveling
- 245 - 38032 38032
2 Layout & pit digging - 25 - 3947 3947
3 Pit feeling, planting
& watering
- - - - -
4 Fencing labour - 3 - 538 538
5 Other interculture
operation including
insect & pest mgt
- 10 - 1615 1615
6 Gap feeling - - - - -
7 Any other labour
cost
- - - - -
8 Total - - 44132 44132
II) material cost Sl.
No.
Head Quantity Rate(Rs) Amount
1 Planting materials 763 40 15370
2 Fym 1526 6 4611
3 Fertilizer - - -
i. Urea 76.3 6 230
ii. Ssp 57.225 16 461
iii, Mop 305.2 23 3535
4 Fungicide and
insecticide
- - -
i. M-45 5 80 231
ii. Bavistin 5 100 289
iii. Rogor -
5 Agricultural tools - -
i. Spade 10 - -
ii. Sprayer 5 - -
iii. Knife 5 - -
iv. Slicer 2 - -
- - -
- - -
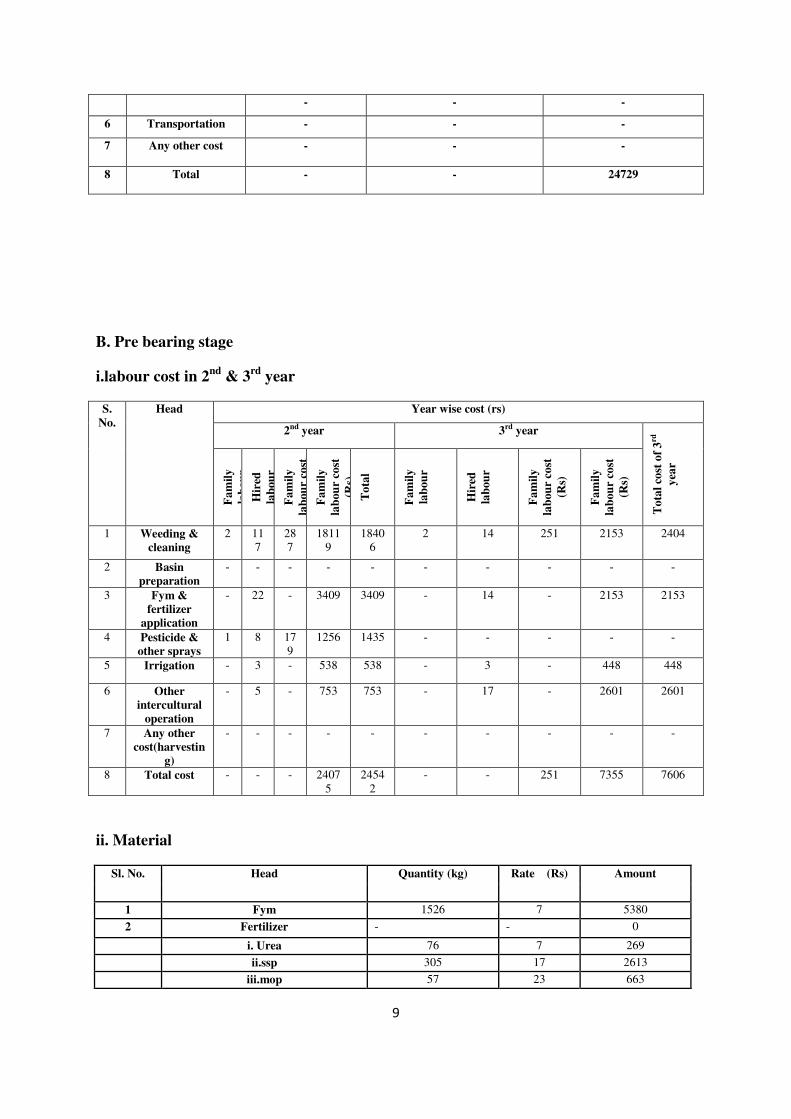
9
- - -
6 Transportation - - -
7 Any other cost - - -
8 Total - - 24729
B. Pre bearing stage
i.labour cost in 2nd
& 3rd
year
S.
No.
Head Year wise cost (rs)
2nd year 3rd year
To
tal
cost
of
3rd
yea
r
Fa
mil
y
lab
ou
r
Hir
ed
lab
ou
r
Fa
mil
y
lab
ou
r co
st
Fa
mil
y
lab
ou
r co
st
(Rs)
To
tal
Fa
mil
y
lab
ou
r
Hir
ed
lab
ou
r
Fa
mil
y
lab
ou
r co
st
(Rs)
Fa
mil
y
lab
ou
r co
st
(Rs)
1 Weeding &
cleaning
2 11
7
28
7
1811
9
1840
6
2 14 251 2153 2404
2 Basin
preparation
- - - - - - - - - -
3 Fym &
fertilizer
application
- 22 - 3409 3409 - 14 - 2153 2153
4 Pesticide &
other sprays
1 8 17
9
1256 1435 - - - - -
5 Irrigation - 3 - 538 538 - 3 - 448 448
6 Other
intercultural
operation
- 5 - 753 753 - 17 - 2601 2601
7 Any other
cost(harvestin
g)
- - - - - - - - - -
8 Total cost - - - 2407
5
2454
2
- - 251 7355 7606
ii. Material
Sl. No. Head Quantity (kg) Rate (Rs) Amount
1 Fym 1526 7 5380
2 Fertilizer - - 0
i. Urea 76 7 269
ii.ssp 305 17 2613
iii.mop 57 23 663

10
3 Fungicide - - -
i.mancozeb 3 100 197
ii.bavistin 2 100 150
4 Insecticide - - -
i.rogor - - -
ii.hiimidi - - -
5 Agricultural tools - - -
i. Sprayer - - -
ii. Knife - - -
iii. Slicer - - -
6 Production - - -
7 Transportation - - -
8 Any other cost - - -
9 Total - - 9272
iii. Labour cost in 4th
and 5th
year
No. Head Year wise cost (Rs)
4th year 5th year
To
tal
cost
of
5th
yea
r
Fa
mil
y
lab
ou
r
Hir
ed
lab
ou
r
Fa
mil
y
lab
ou
r co
st
(Rs)
Hir
ed
lab
ou
r co
st
To
tal
Fa
mil
y
lab
ou
r
Hir
ed
lab
ou
r
Fa
mil
y
lab
ou
r co
st
(Rs)
Hir
ed
lab
ou
r co
st
(Rs)
1 Weeding &
cleaning 3
22
39
5
34
09
38
03
2
20
32
3
30
50
33
73
2 Basin
preparation - - - - - - - - - -
3 Fym & fertilizer
application 3
8
43
1
12
56
16
86
1
11
14
4
17
04
18
48
4 Pesticide &
other sprays 2
8
25
1
12
56
15
07
- 5 -
80
7
80
7
5 Irrigation - - - - - - - - - -
6 Other
intercultural
operation
- 5 -
70
0
70
0
- 6 -
89
7
89
7
7 Any other
cost(harvesting) - 3 -
52
0
52
0
- 3 -
44
8
44
8
8
Total cost - -
10
76
71
40
82
16
- - -
69
07
73
73

11
iv. Material cost
Sl. No. Head Quantity (kg) Rate (Rs) Amount
1 Fym 1908 7 6725
2 Fertilizer - - -
i. Urea 76 6 238
ii.ssp 57 16 952
iii.mop 305 23 2870
3 Fungicide - - -
i.mancozeb 10 100 521
ii.bavistin 5 100 289
4 Insecticide - - -
i.rogor 5 100 289
ii.hiimidi 10 100 521
5 Agricultural tools - - -
i. Sprayer - - -
ii. Knife - - -
iii. Slicer - - -
6 Transportation - - -
7 Any other cost - - -
8 Production - - -
9 Total - - 12404
v. Labour cost in 6th
& 7th
year
No. Head
Family
labour
Hired
labour
Family
labour cost
(rs)
Hired
labour cost
(rs)
Total
1 Weeding & cleaning - 17 - 2691 2691
2 Basin preparation - 0 - - -
3 Fym & fertilizer
application
- 11 - 1704 1704
4 Pesticide & other sprays - 3 - 448 448
5 Irrigation - 5 - 807 807
6 Other intercultural
operation
- - - - -
7 Any other cost(harvesting) - 3 - 448 448
8 Total cost - - 6100 6100
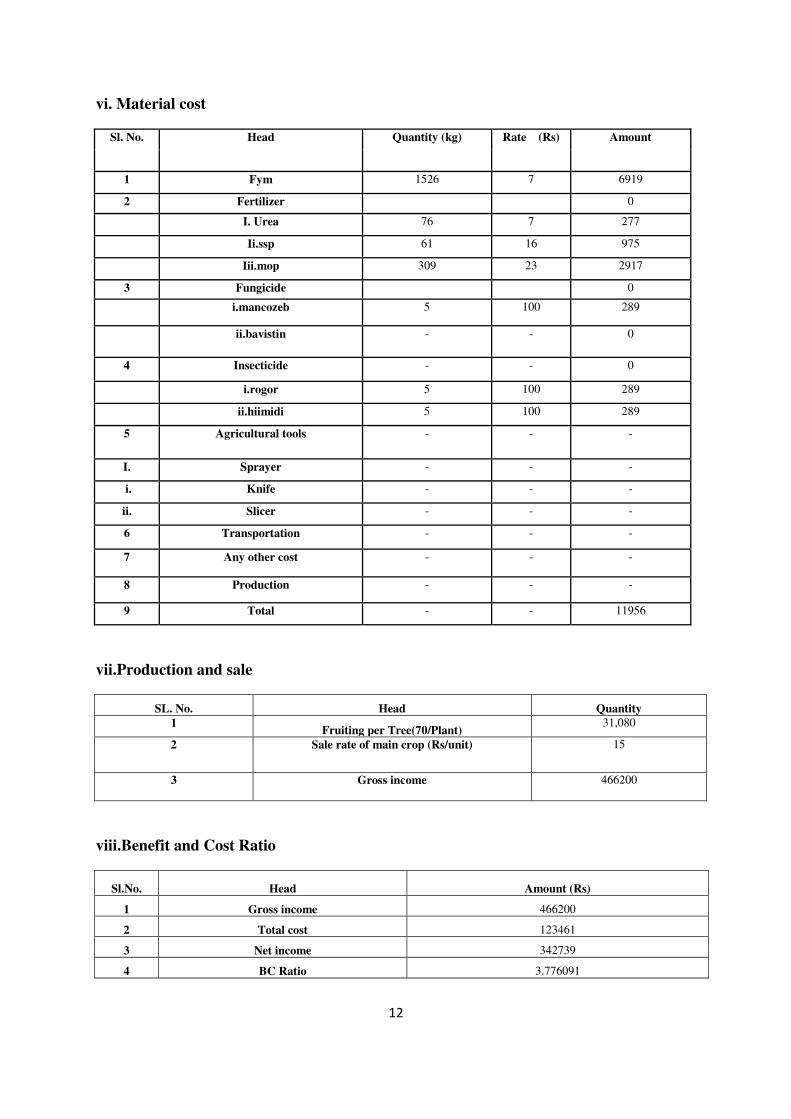
12
vi. Material cost
Sl. No. Head Quantity (kg) Rate (Rs) Amount
1 Fym 1526 7 6919
2 Fertilizer 0
I. Urea 76 7 277
Ii.ssp 61 16 975
Iii.mop 309 23 2917
3 Fungicide 0
i.mancozeb 5 100 289
ii.bavistin - - 0
4 Insecticide - - 0
i.rogor 5 100 289
ii.hiimidi 5 100 289
5 Agricultural tools - - -
I. Sprayer - - -
i. Knife - - -
ii. Slicer - - -
6 Transportation - - -
7 Any other cost - - -
8 Production - - -
9 Total - - 11956
vii.Production and sale
SL. No. Head Quantity
1 Fruiting per Tree(70/Plant)
31,080
2 Sale rate of main crop (Rs/unit) 15
3 Gross income 466200
viii.Benefit and Cost Ratio
Sl.No. Head Amount (Rs)
1 Gross income 466200
2 Total cost 123461
3 Net income 342739
4 BC Ratio 3.776091

13
3. Cost of cultivation and net return from guava
Name of the Farmer-Sunil Das
Agri-Subdivision: Rajnagar
Village: Radhanagar
A. Land development and planting in the initial year
No. Head Family Hired Family
labour
cost
Hired
labour
cost
Total
cost
(Rs)
1 Land Cleaning & Leveling 25 50 7500 15000 22500
2 Layout & Pit Digging 27.5 52.5 8250 15750 24000
3 Pit feeling, Planting & Watering 37.5 50 11250 15000 26250
4 Fencing Labour 30 25 9000 7500 16500
5 Other Interculture Operation Including Insect & Pest
Mgt
- 25 - 7500 7500
6 Gap Feeling - - - - -
7 Any Other Labour Cost - - - - -
8 Total 120 202.5 36000 60750 96750
B. Pre-bearing stage
i. Labour cost in 2nd
and 3rd
year
No.
Head 2nd Year 3rd Year Cost
Fa
mil
y L
ab
ou
r
Hir
ed L
ab
ou
r
Fa
mil
y l
ab
ou
r
cost
(R
s)
Hir
ed l
ab
ou
r
cost
(R
s)
Fa
mil
y L
ab
ou
r
Hir
ed L
ab
ou
r
Fa
mil
y l
ab
ou
r
cost
(R
s)
Hir
ed l
ab
ou
r
cost
(R
s)
2n
d Y
ear
3 r
d y
ear
1 Weeding & Cleaning - 25
-
62
50
- 25
0
62
50
62
50
62
50
2 Basin Preparation - - - - - - - - - -
3 FYM & Fertilizer
Application
- 25
-
62
50
- 22
-
55
00
62
50
55
00
4 Pesticide & Other
Sprays
- 25
-
62
50
- 28
-
68
75
62
50
68
75
5 Irrigation - 25
-
62
50
25
33
75
00
81
25
62
50
81
25
6 Other Intercultural
Operation pruning
- 50
-
12
50
0
- 50
-
12
50
0
12
50
0
12
50
0
7 Any Other
Cost(harvesting)
- - - - 0 - - - - - -
8 Total Cost
- - -
37
50
0
25
75
00
39
25
0
37
50
0
39
25
0
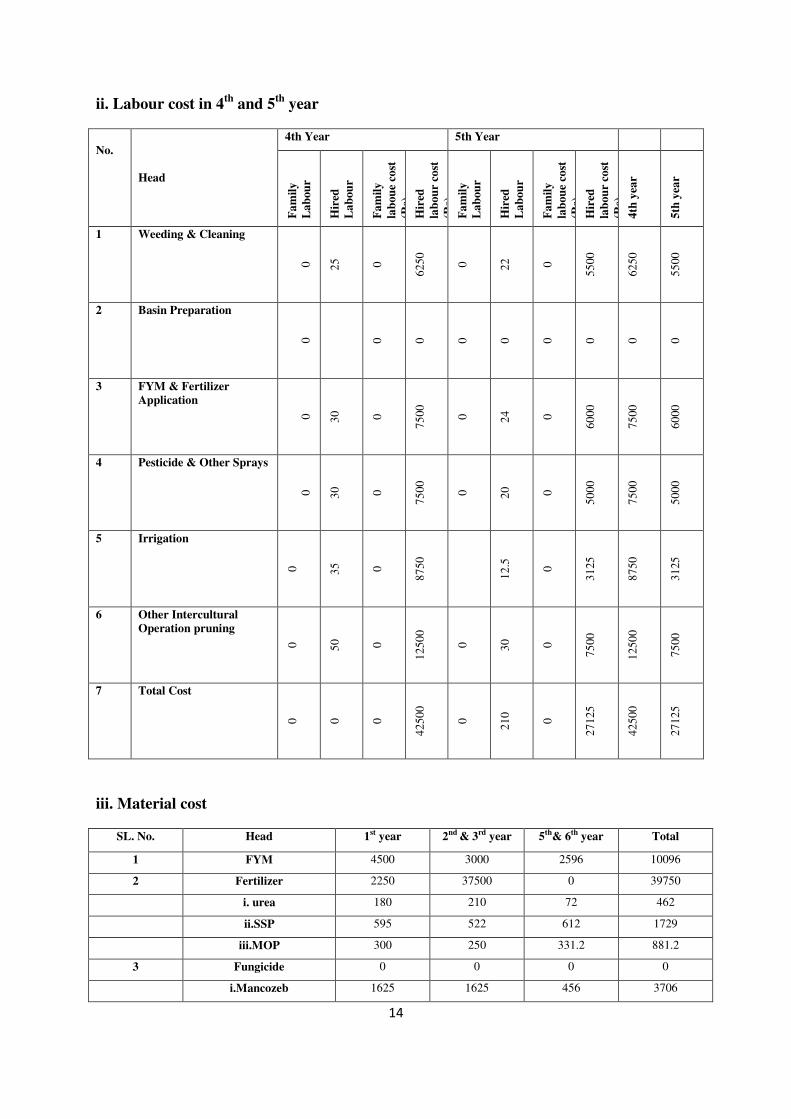
14
ii. Labour cost in 4th
and 5th
year
No.
Head
4th Year 5th Year
Fa
mil
y
La
bou
r
Hir
ed
La
bou
r
Fa
mil
y
lab
ou
e co
st
(Rs)
Hir
ed
lab
ou
r co
st
(Rs)
Fa
mil
y
La
bou
r
Hir
ed
La
bou
r
Fa
mil
y
lab
ou
e co
st
(Rs)
Hir
ed
lab
ou
r co
st
(Rs)
4th
yea
r
5th
yea
r
1 Weeding & Cleaning
0 2
5
0
62
50
0
22
0
55
00
62
50
55
00
2 Basin Preparation
0 0
0
0
0
0
0
0
0
3 FYM & Fertilizer
Application
0 3
0
0
75
00
0
24
0
60
00
75
00
60
00
4 Pesticide & Other Sprays
0 3
0
0
75
00
0
20
0
50
00
75
00
50
00
5 Irrigation
0
35
0
87
50
12
.5
0
31
25
87
50
31
25
6 Other Intercultural
Operation pruning
0
50
0
12
50
0
0
30
0
75
00
12
50
0
75
00
7 Total Cost
0
0
0
42
50
0
0
21
0
0
27
12
5
42
50
0
27
12
5
iii. Material cost
SL. No. Head 1st year 2nd & 3rd year 5th& 6th year Total
1 FYM 4500 3000 2596 10096
2 Fertilizer 2250 37500 0 39750
i. urea 180 210 72 462
ii.SSP 595 522 612 1729
iii.MOP 300 250 331.2 881.2
3 Fungicide 0 0 0 0
i.Mancozeb 1625 1625 456 3706
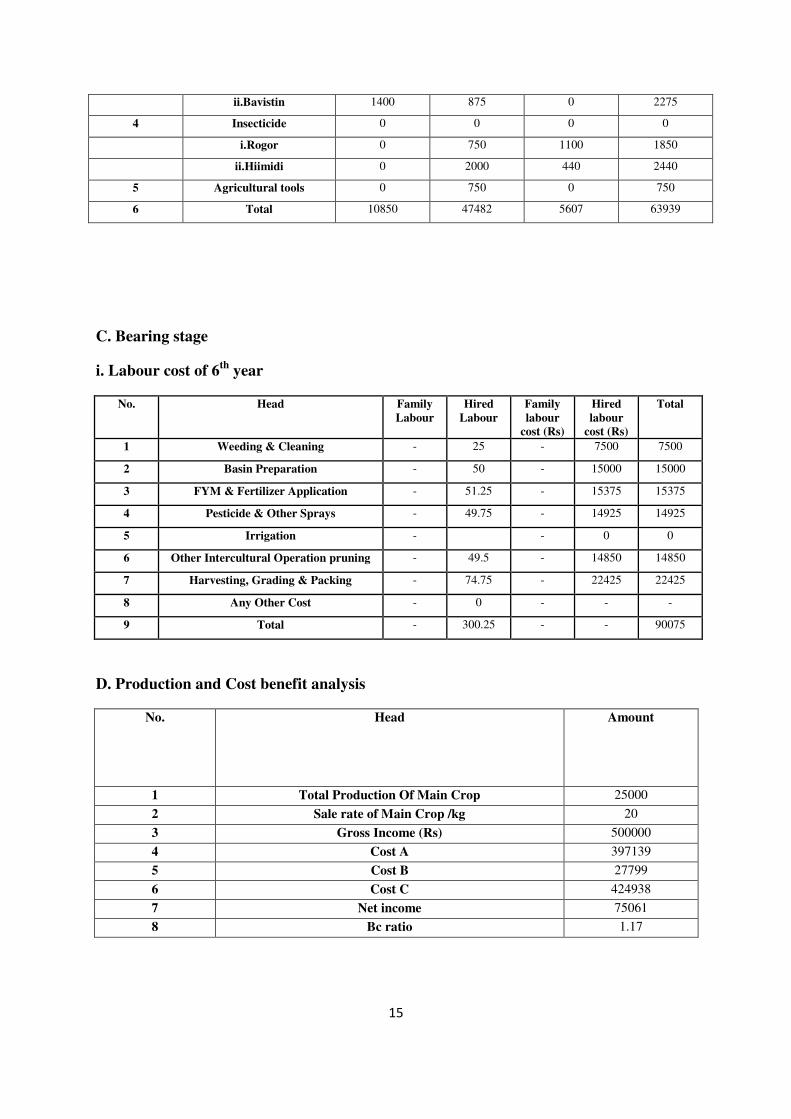
15
ii.Bavistin 1400 875 0 2275
4 Insecticide 0 0 0 0
i.Rogor 0 750 1100 1850
ii.Hiimidi 0 2000 440 2440
5 Agricultural tools 0 750 0 750
6 Total 10850 47482 5607 63939
C. Bearing stage
i. Labour cost of 6th
year
No. Head Family
Labour
Hired
Labour
Family
labour
cost (Rs)
Hired
labour
cost (Rs)
Total
1 Weeding & Cleaning - 25 - 7500 7500
2 Basin Preparation - 50 - 15000 15000
3 FYM & Fertilizer Application - 51.25 - 15375 15375
4 Pesticide & Other Sprays - 49.75 - 14925 14925
5 Irrigation - - 0 0
6 Other Intercultural Operation pruning - 49.5 - 14850 14850
7 Harvesting, Grading & Packing - 74.75 - 22425 22425
8 Any Other Cost - 0 - - -
9 Total - 300.25 - - 90075
D. Production and Cost benefit analysis
No. Head Amount
1 Total Production Of Main Crop 25000
2 Sale rate of Main Crop /kg 20
3 Gross Income (Rs) 500000
4 Cost A 397139
5 Cost B 27799
6 Cost C 424938
7 Net income 75061
8 Bc ratio 1.17
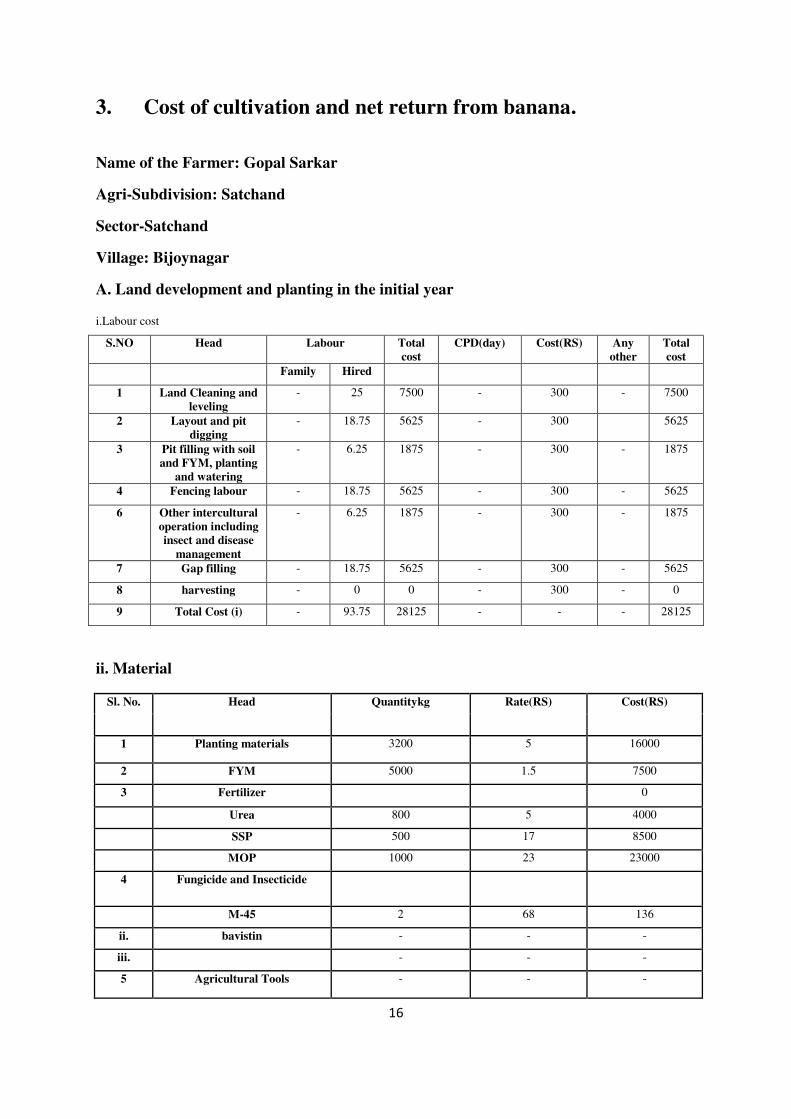
16
3. Cost of cultivation and net return from banana.
Name of the Farmer: Gopal Sarkar
Agri-Subdivision: Satchand
Sector-Satchand
Village: Bijoynagar
A. Land development and planting in the initial year
i.Labour cost
S.NO Head Labour Total
cost
CPD(day) Cost(RS) Any
other
Total
cost
Family Hired
1 Land Cleaning and
leveling
-
25 7500 - 300 - 7500
2 Layout and pit
digging
- 18.75 5625 - 300 5625
3 Pit filling with soil
and FYM, planting
and watering
- 6.25 1875 - 300 - 1875
4 Fencing labour - 18.75 5625 - 300 - 5625
6 Other intercultural
operation including
insect and disease
management
- 6.25 1875 - 300 - 1875
7 Gap filling - 18.75 5625 - 300 - 5625
8 harvesting - 0 0 - 300 - 0
9 Total Cost (i) - 93.75 28125 - - - 28125
ii. Material
Sl. No. Head Quantitykg Rate(RS) Cost(RS)
1 Planting materials 3200 5 16000
2 FYM 5000 1.5 7500
3 Fertilizer 0
Urea 800 5 4000
SSP 500 17 8500
MOP 1000 23 23000
4 Fungicide and Insecticide
M-45 2 68 136
ii. bavistin - - -
iii. - - -
5 Agricultural Tools - - -
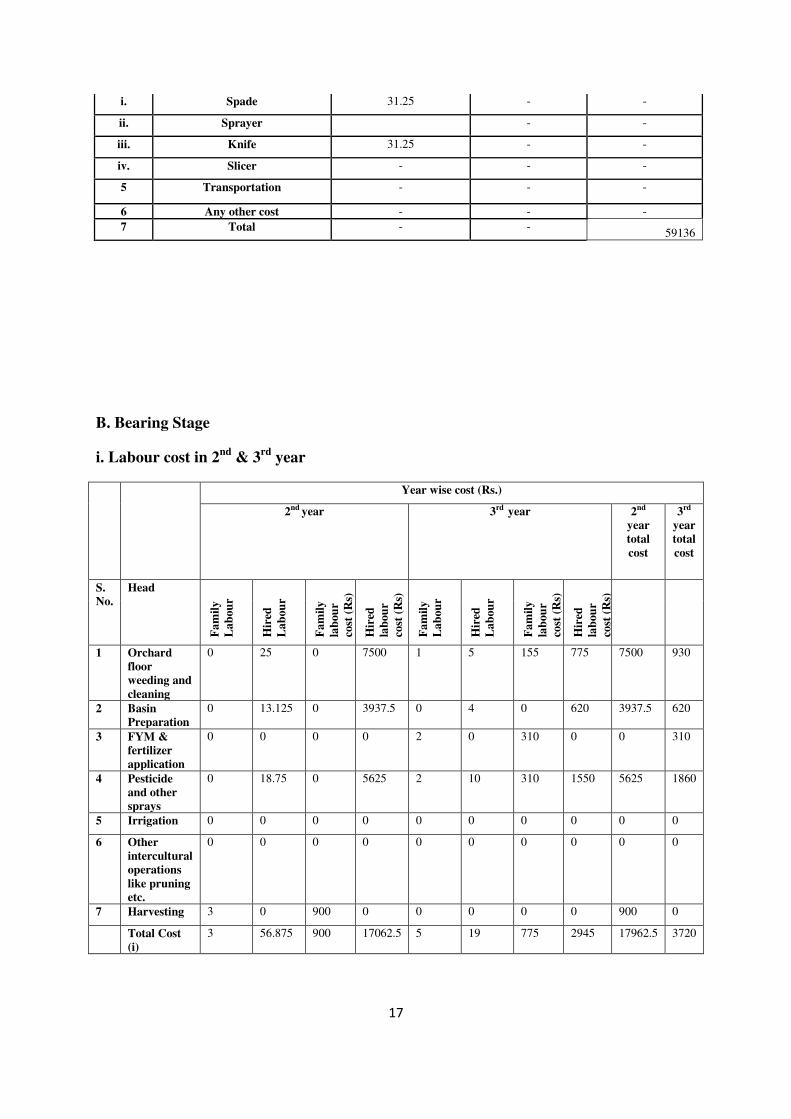
17
i. Spade 31.25 - -
ii. Sprayer - -
iii. Knife 31.25 - -
iv. Slicer - - -
5 Transportation - - -
6 Any other cost - - -
7 Total - - 59136
B. Bearing Stage
i. Labour cost in 2nd
& 3rd
year
Year wise cost (Rs.)
2nd year 3rd year 2nd
year
total
cost
3rd
year
total
cost
S.
No.
Head
Fa
mil
y
La
bou
r
Hir
ed
La
bou
r
Fa
mil
y
lab
ou
r
cost
(R
s)
Hir
ed
lab
ou
r
cost
(R
s)
Fa
mil
y
La
bou
r
Hir
ed
La
bou
r
Fa
mil
y
lab
ou
r
cost
(R
s)
Hir
ed
lab
ou
r
cost
(R
s)
1 Orchard
floor
weeding and
cleaning
0 25 0 7500 1 5 155 775 7500 930
2 Basin
Preparation
0 13.125 0 3937.5 0 4 0 620 3937.5 620
3 FYM &
fertilizer
application
0 0 0 0 2 0 310 0 0 310
4 Pesticide
and other
sprays
0 18.75 0 5625 2 10 310 1550 5625 1860
5 Irrigation 0 0 0 0 0 0 0 0 0 0
6 Other
intercultural
operations
like pruning
etc.
0 0 0 0 0 0 0 0 0 0
7 Harvesting 3 0 900 0 0 0 0 0 900 0
Total Cost
(i)
3 56.875 900 17062.5 5 19 775 2945 17962.5 3720
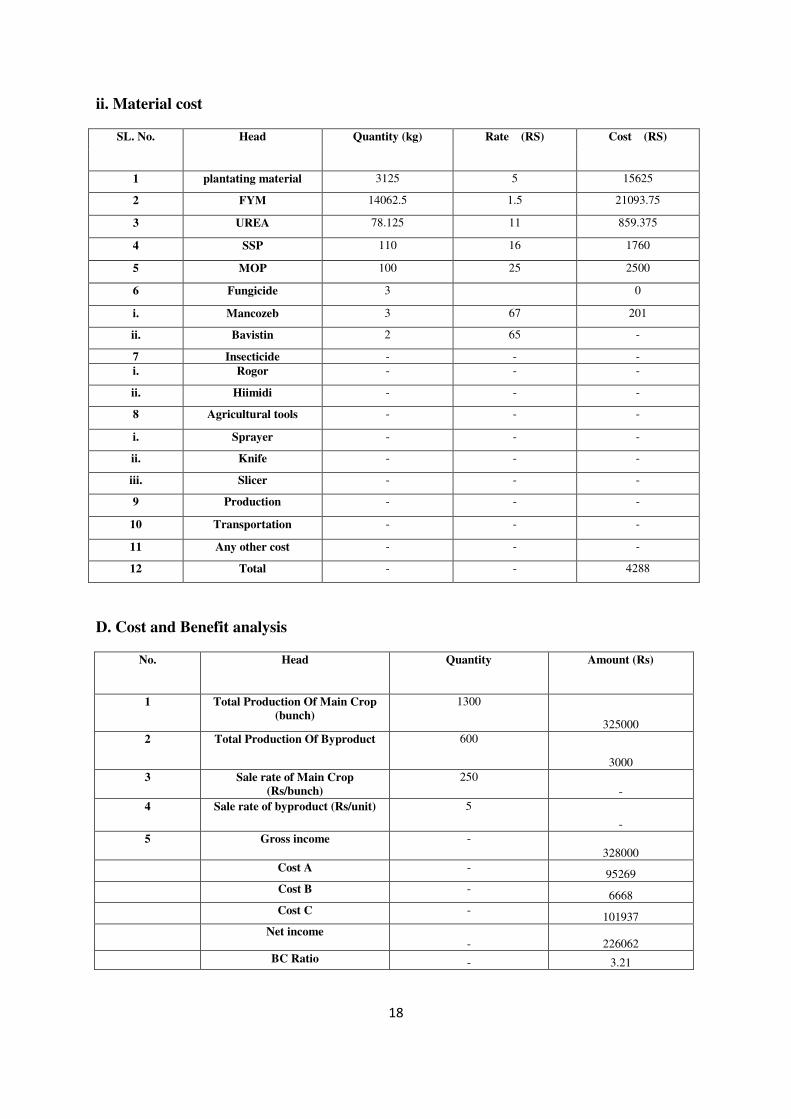
18
ii. Material cost
SL. No. Head Quantity (kg) Rate (RS) Cost (RS)
1 plantating material 3125 5 15625
2 FYM 14062.5 1.5 21093.75
3 UREA 78.125 11 859.375
4 SSP 110 16 1760
5 MOP 100 25 2500
6 Fungicide 3 0
i. Mancozeb 3 67 201
ii. Bavistin 2 65 -
7 Insecticide - - -
i. Rogor - - -
ii. Hiimidi - - -
8 Agricultural tools - - -
i. Sprayer - - -
ii. Knife - - -
iii. Slicer - - -
9 Production - - -
10 Transportation - - -
11 Any other cost - - -
12 Total - - 4288
D. Cost and Benefit analysis
No. Head Quantity Amount (Rs)
1 Total Production Of Main Crop
(bunch)
1300
325000
2 Total Production Of Byproduct 600
3000
3 Sale rate of Main Crop
(Rs/bunch)
250
-
4 Sale rate of byproduct (Rs/unit) 5
-
5 Gross income -
328000
Cost A - 95269
Cost B - 6668
Cost C - 101937
Net income - 226062
BC Ratio - 3.21
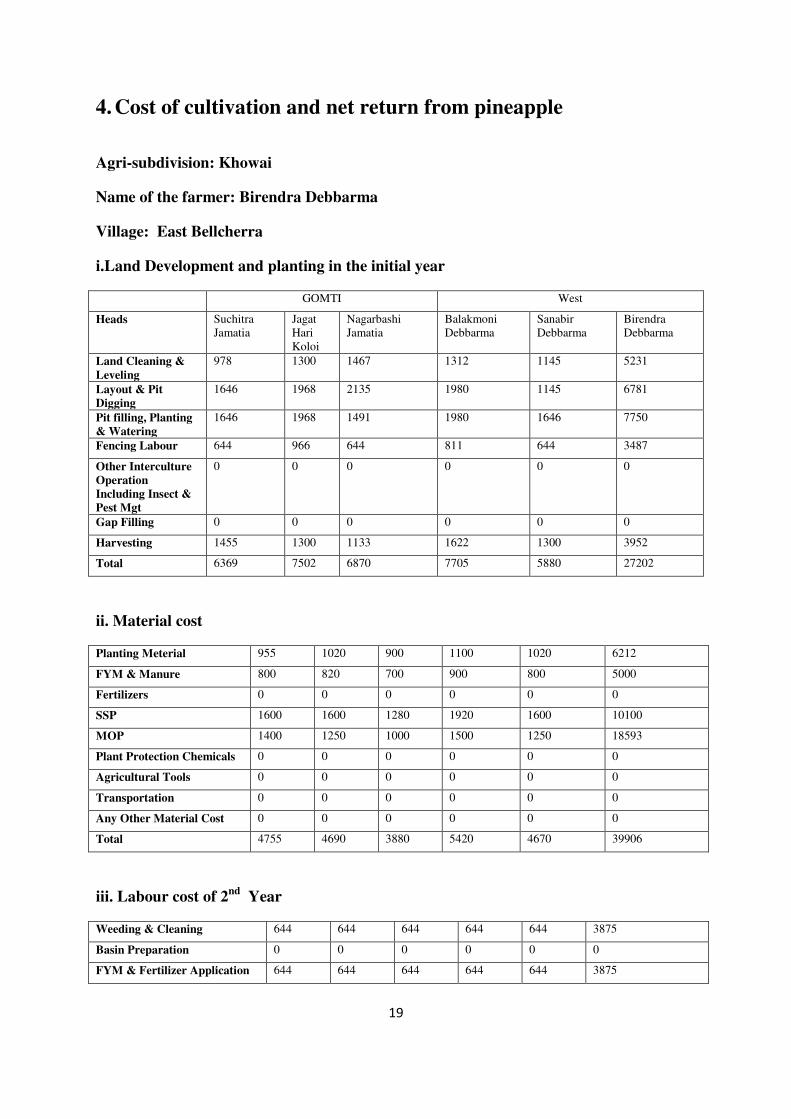
19
4. Cost of cultivation and net return from pineapple
Agri-subdivision: Khowai
Name of the farmer: Birendra Debbarma
Village: East Bellcherra
i.Land Development and planting in the initial year
GOMTI West
Heads Suchitra
Jamatia
Jagat
Hari
Koloi
Nagarbashi
Jamatia
Balakmoni
Debbarma
Sanabir
Debbarma
Birendra
Debbarma
Land Cleaning &
Leveling
978 1300 1467 1312 1145 5231
Layout & Pit
Digging
1646 1968 2135 1980 1145 6781
Pit filling, Planting
& Watering
1646 1968 1491 1980 1646 7750
Fencing Labour 644 966 644 811 644 3487
Other Interculture
Operation
Including Insect &
Pest Mgt
0 0 0 0 0 0
Gap Filling 0 0 0 0 0 0
Harvesting 1455 1300 1133 1622 1300 3952
Total 6369 7502 6870 7705 5880 27202
ii. Material cost
Planting Meterial 955 1020 900 1100 1020 6212
FYM & Manure 800 820 700 900 800 5000
Fertilizers 0 0 0 0 0 0
SSP 1600 1600 1280 1920 1600 10100
MOP 1400 1250 1000 1500 1250 18593
Plant Protection Chemicals 0 0 0 0 0 0
Agricultural Tools 0 0 0 0 0 0
Transportation 0 0 0 0 0 0
Any Other Material Cost 0 0 0 0 0 0
Total 4755 4690 3880 5420 4670 39906
iii. Labour cost of 2nd
Year
Weeding & Cleaning 644 644 644 644 644 3875
Basin Preparation 0 0 0 0 0 0
FYM & Fertilizer Application 644 644 644 644 644 3875
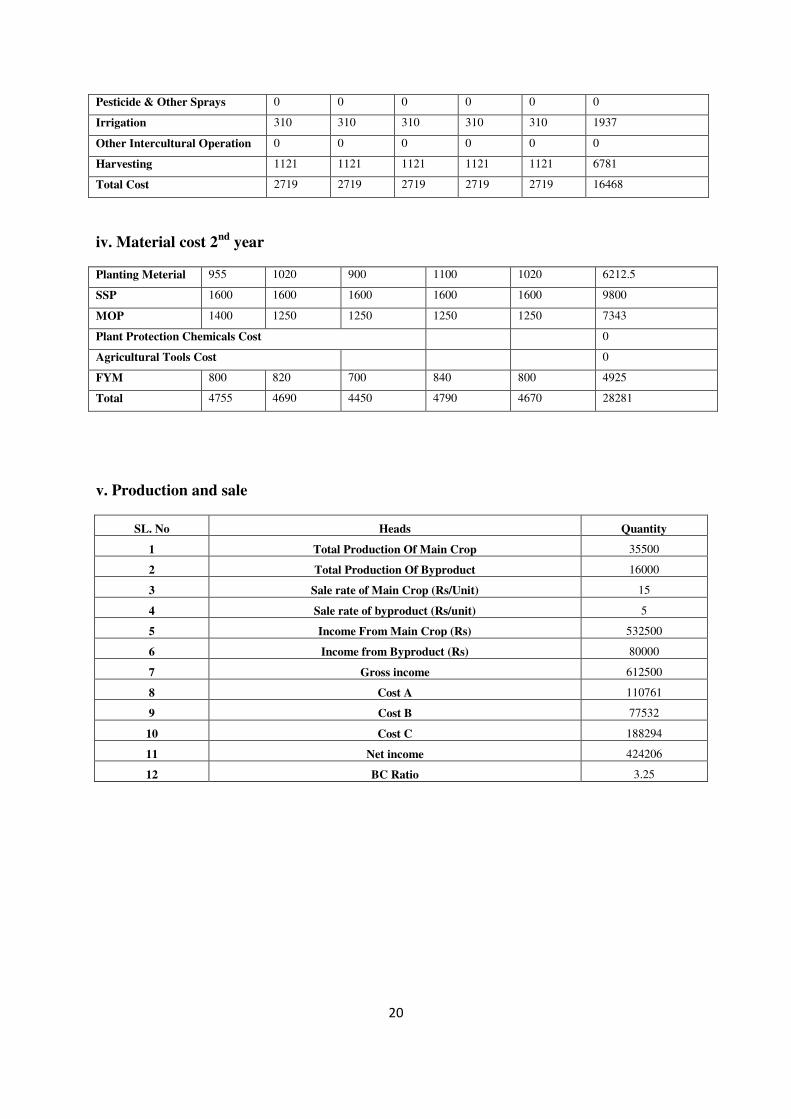
20
Pesticide & Other Sprays 0 0 0 0 0 0
Irrigation 310 310 310 310 310 1937
Other Intercultural Operation 0 0 0 0 0 0
Harvesting 1121 1121 1121 1121 1121 6781
Total Cost 2719 2719 2719 2719 2719 16468
iv. Material cost 2nd
year
Planting Meterial 955 1020 900 1100 1020 6212.5
SSP 1600 1600 1600 1600 1600 9800
MOP 1400 1250 1250 1250 1250 7343
Plant Protection Chemicals Cost 0
Agricultural Tools Cost 0
FYM 800 820 700 840 800 4925
Total 4755 4690 4450 4790 4670 28281
v. Production and sale
SL. No Heads Quantity
1 Total Production Of Main Crop 35500
2 Total Production Of Byproduct 16000
3 Sale rate of Main Crop (Rs/Unit) 15
4 Sale rate of byproduct (Rs/unit) 5
5 Income From Main Crop (Rs) 532500
6 Income from Byproduct (Rs) 80000
7 Gross income 612500
8 Cost A 110761
9 Cost B 77532
10 Cost C 188294
11 Net income 424206
12 BC Ratio 3.25

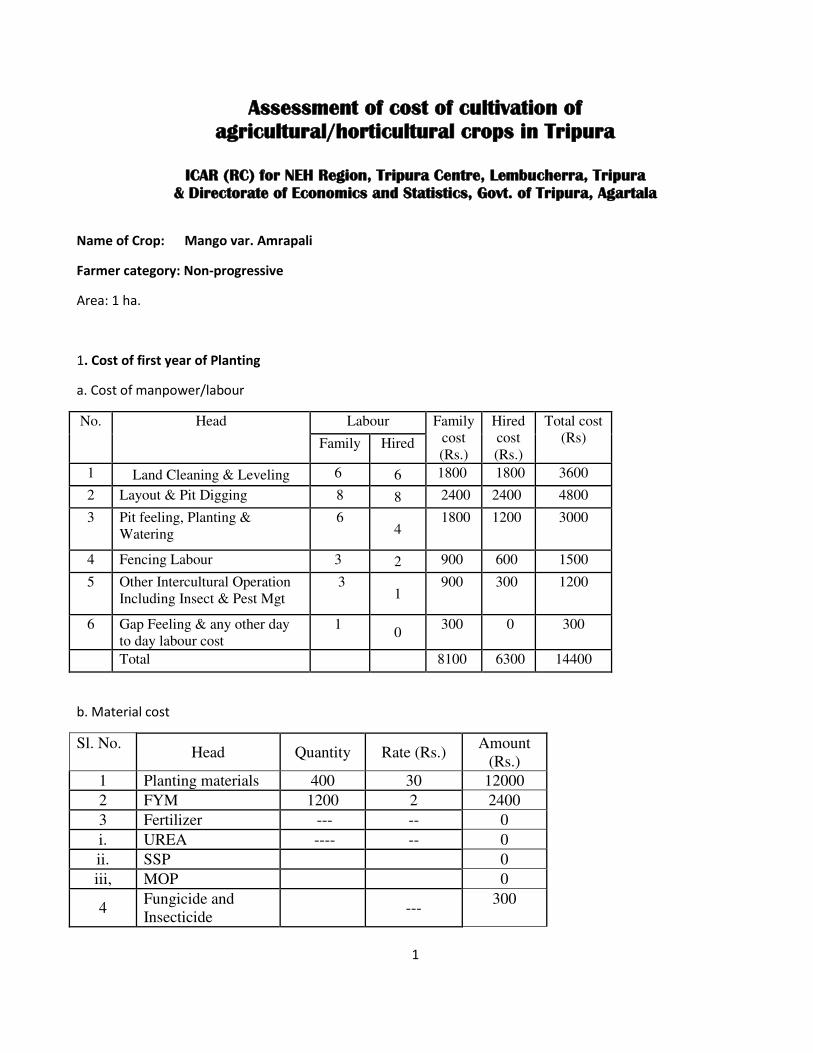
1
Assessment of cost of cultivation of
agricultural/horticultural crops in Tripura
ICAR (RC) for NEH Region, Tripura Centre, Lembucherra, Tripura
& Directorate of Economics and Statistics, Govt. of Tripura, Agartala
Name of Crop: Mango var. Amrapali
Farmer category: Non-progressive
Area: 1 ha.
1. Cost of first year of Planting
a. Cost of manpower/labour
No. Head Labour Family
cost
(Rs.)
Hired
cost
(Rs.)
Total cost
(Rs) Family Hired
1 Land Cleaning & Leveling 6 6 1800 1800 3600
2 Layout & Pit Digging 8 8 2400 2400 4800
3 Pit feeling, Planting &
Watering
6 4
1800 1200 3000
4 Fencing Labour 3 2 900 600 1500
5 Other Intercultural Operation
Including Insect & Pest Mgt
3 1
900 300 1200
6 Gap Feeling & any other day
to day labour cost
1 0
300 0 300
Total 8100 6300 14400
b. Material cost
Sl. No. Head Quantity Rate (Rs.)
Amount
(Rs.)
1 Planting materials 400 30 12000
2 FYM 1200 2 2400
3 Fertilizer --- -- 0
i. UREA ---- -- 0
ii. SSP 0
iii, MOP 0
4 Fungicide and
Insecticide ---
300

2
5 Agricultural Tools 700 700
6 Transportation 300 300
7 Any other cost 600
Total 16300
2. Pre-bearing Stage
a. Cost of manpower/labour
No. Head Year wise Cost (Rs)
2nd
Year 3rd
Year
Fam
ily
Lab
ou
r
Hir
ed
Lab
ou
r
Fam
ily
cost
(R
s)
Hir
ed c
ost
(Rs.
)
To
tal
cost
(Rs)
Fam
ily
Lab
ou
r
Hir
ed
Lab
ou
r
Fam
ily
cost
(R
s)
Hir
ed c
ost
(Rs.
)
To
tal
cost
(Rs)
1 Weeding &
Cleaning
3 4
900 1200 2100 3 4
900 1200 2100
2 Basin
Preparation
2 4
600 1200 1800 2 4
600 1200 1800
3 FYM &
Fertilizer
Application
2
1
600 300 900 2
2
600 600 1200
4 Pesticide &
Other Sprays 1 0
300 0 300 1 0
300 0 300
5 Irrigation 2
600 0 600 2 0 600 0 600
6 Other
Intercultural
Operation
2
0
600 0 600 2
0
600 0 600
7 Any Other
Cost(harvesting)
0 1
300 0 300 0 1
300 300 600
8 Total Cost 3900 2700 6600 3900 3300 7200
b. Material Cost
2nd
Year 3rd
Year
SL. No. Head Quantity
(kg)
Rate
(Rs.)
Amount
(Rs.)
Quantity
(kg)
Rate
(RS) Amount
(Rs.) (Rs.)
1 FYM 2000 2 4000 2000 2 4000
2 Fertilizer
0 0
i. urea 40 5.42 217 40 5.42 217
ii.SSP 40 10.23 409 40 10.23 409
iii.MOP 20 17.15 343 20 17.15 343
3 Pesticides
(Fungicide+Insecticide) 0 0 0
1+1 450+550 1000
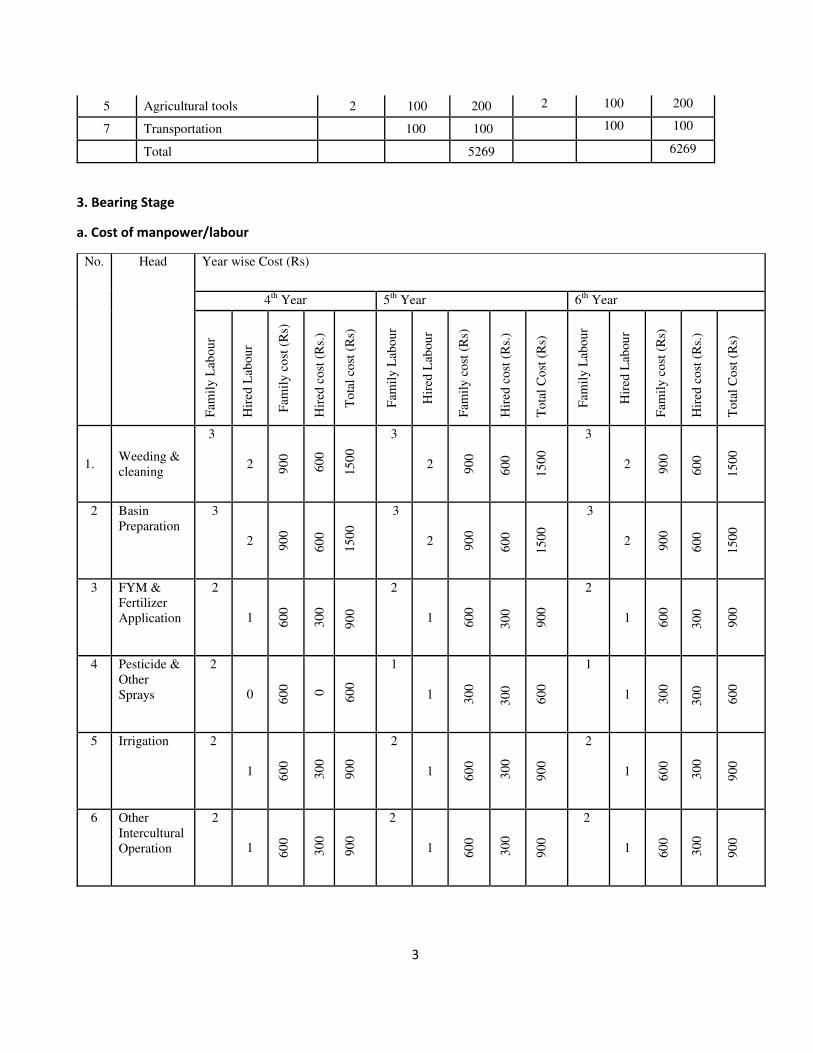
3
5 Agricultural tools 2 100 200 2 100 200
7 Transportation 100 100 100 100
Total 5269 6269
3. Bearing Stage
a. Cost of manpower/labour
No. Head Year wise Cost (Rs)
4th
Year 5th
Year 6th
Year
Fam
ily
Lab
ou
r
Hir
ed L
abou
r
Fam
ily
co
st (
Rs)
Hir
ed c
ost
(R
s.)
To
tal
cost
(R
s)
Fam
ily
Lab
ou
r
Hir
ed L
abou
r
Fam
ily
co
st (
Rs)
Hir
ed c
ost
(R
s.)
To
tal
Co
st (
Rs)
Fam
ily
Lab
ou
r
Hir
ed L
abou
r
Fam
ily
co
st (
Rs)
Hir
ed c
ost
(R
s.)
To
tal
Co
st (
Rs)
1. Weeding &
cleaning
3
2 90
0
60
0
15
00
3
2 90
0
60
0
15
00
3
2 90
0
60
0
15
00
2 Basin
Preparation
3
2 90
0
60
0
15
00
3
2 90
0
60
0
15
00
3
2 90
0
60
0
15
00
3 FYM &
Fertilizer
Application
2
1 60
0
30
0
90
0
2
1 60
0
30
0
90
0
2
1 60
0
30
0
90
0
4 Pesticide &
Other
Sprays
2
0 60
0
0
60
0
1
1 30
0
30
0
60
0
1
1 30
0
30
0
60
0
5 Irrigation 2
1 60
0
30
0
90
0
2
1 60
0
30
0
90
0
2
1 60
0
30
0
90
0
6 Other
Intercultural
Operation
2
1 60
0
30
0
90
0
2
1 60
0
30
0
90
0
2
1 60
0
30
0
90
0
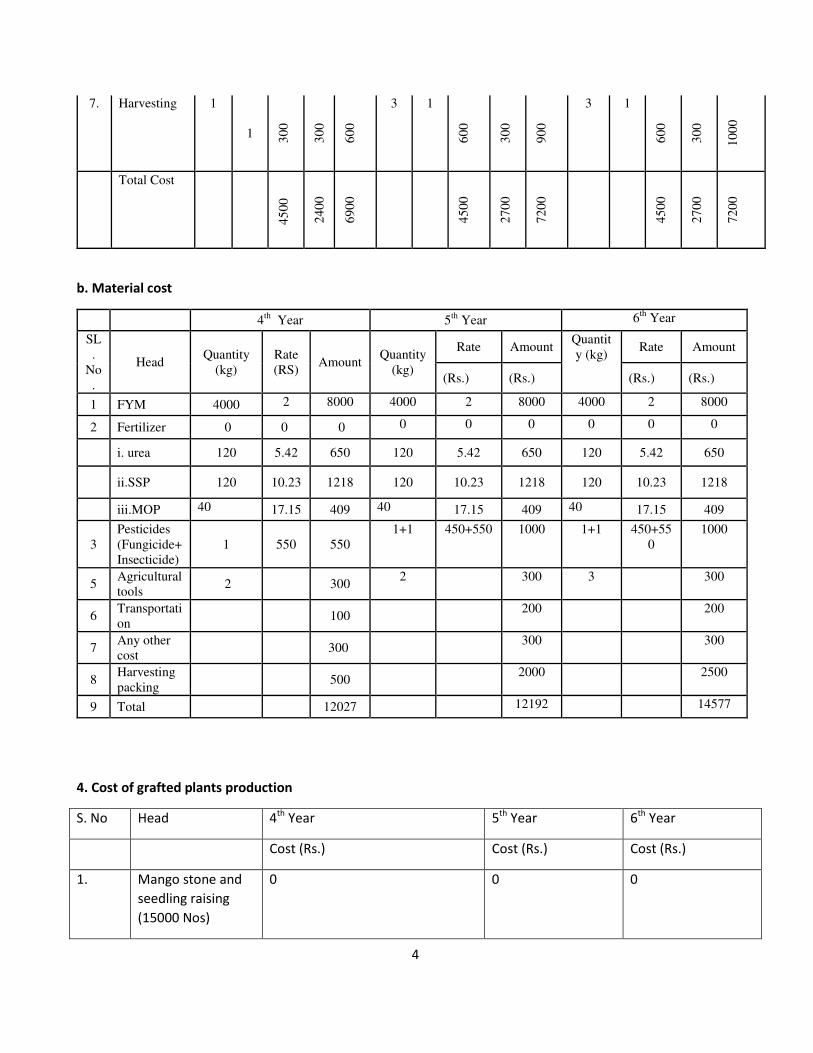
4
7. Harvesting 1
1 30
0
30
0
60
0
3 1
60
0
30
0
90
0
3 1
60
0
30
0
10
00
Total Cost
45
00
24
00
69
00
45
00
27
00
72
00
45
00
27
00
72
00
b. Material cost
4th
Year 5th
Year 6th
Year
SL
.
No
.
Head Quantity
(kg)
Rate
(RS) Amount
Quantity
(kg)
Rate Amount Quantit
y (kg) Rate Amount
(Rs.) (Rs.) (Rs.) (Rs.)
1 FYM 4000 2 8000 4000 2 8000 4000 2 8000
2 Fertilizer 0 0 0 0 0 0 0 0 0
i. urea 120 5.42 650 120 5.42 650 120 5.42 650
ii.SSP 120 10.23 1218 120 10.23 1218 120 10.23 1218
iii.MOP 40 17.15 409 40 17.15 409 40 17.15 409
3
Pesticides
(Fungicide+
Insecticide)
1 550 550
1+1 450+550 1000 1+1 450+55
0
1000
5 Agricultural
tools 2
300
2 300 3 300
6 Transportati
on 100
200 200
7 Any other
cost 300
300 300
8 Harvesting
packing 500
2000 2500
9 Total 12027 12192 14577
4. Cost of grafted plants production
S. No Head 4th
Year 5th
Year 6th
Year
Cost (Rs.) Cost (Rs.) Cost (Rs.)
1. Mango stone and
seedling raising
(15000 Nos)
0 0 0
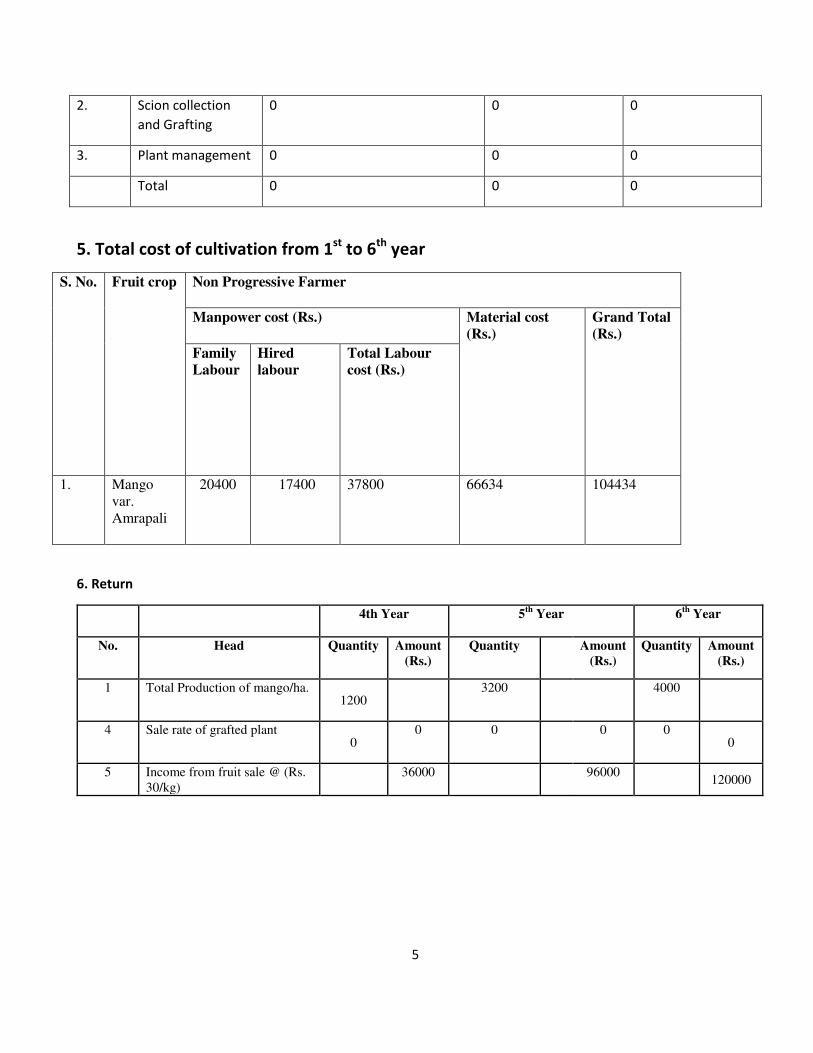
5
2. Scion collection
and Grafting
0 0 0
3. Plant management 0 0 0
Total 0 0 0
5. Total cost of cultivation from 1st
to 6th
year
S. No. Fruit crop Non Progressive Farmer
Manpower cost (Rs.) Material cost
(Rs.)
Grand Total
(Rs.)
Family
Labour
Hired
labour
Total Labour
cost (Rs.)
1. Mango
var.
Amrapali
20400 17400 37800 66634 104434
6. Return
4th Year 5th
Year 6th
Year
No. Head Quantity Amount
(Rs.)
Quantity Amount
(Rs.)
Quantity Amount
(Rs.)
1 Total Production of mango/ha. 1200
3200
4000
4 Sale rate of grafted plant 0
0 0
0 0 0
5 Income from fruit sale @ (Rs.
30/kg)
36000
96000 120000

6
Assessment of cost of cultivation of
agricultural/horticultural crops in Tripura
ICAR (RC) for NEH Region, Tripura Centre, Lembucherra, Tripura
& Directorate of Economics and Statistics, Govt. of Tripura, Agartala
Name of Crop: Mango var. Amrapali
Farmer category: Progressive
Area: 1 ha.
1. Cost of first year of Planting
a. Cost of manpower/labour
No. Head Labour PT
(hr)
Family
labour
cost
(Rs)
Hired
labour
cost
(Rs)
Total cost
(Rs) Family Hired
1 Land Cleaning & Leveling 2 10 4 600 3000 3600
2 Layout & Pit Digging 3 15 900 4500 5400
3 Pit feeling, Planting &
Watering
2 8
600 2400 3000
4 Fencing Labour 2 4 600 1200 1800
5 Other Interculture Operation
Including Insect & Pest Mgt
2 6
600 1800 2400
6 Gap Feeling & any other day to
day labour cost
1 2
300 600 900
Total 3600 13500 17100
b. Material cost
Sl. No.
Head Quantity Rate (Rs.) in
2014-15
Amount
(Rs.) in
2014-15
1 Planting materials 400 30 1200
2 FYM 2000 2 4500
3 Fertilizer --- -- 0
i. UREA ---- -- 0
ii. SSP 0
iii, MOP 0
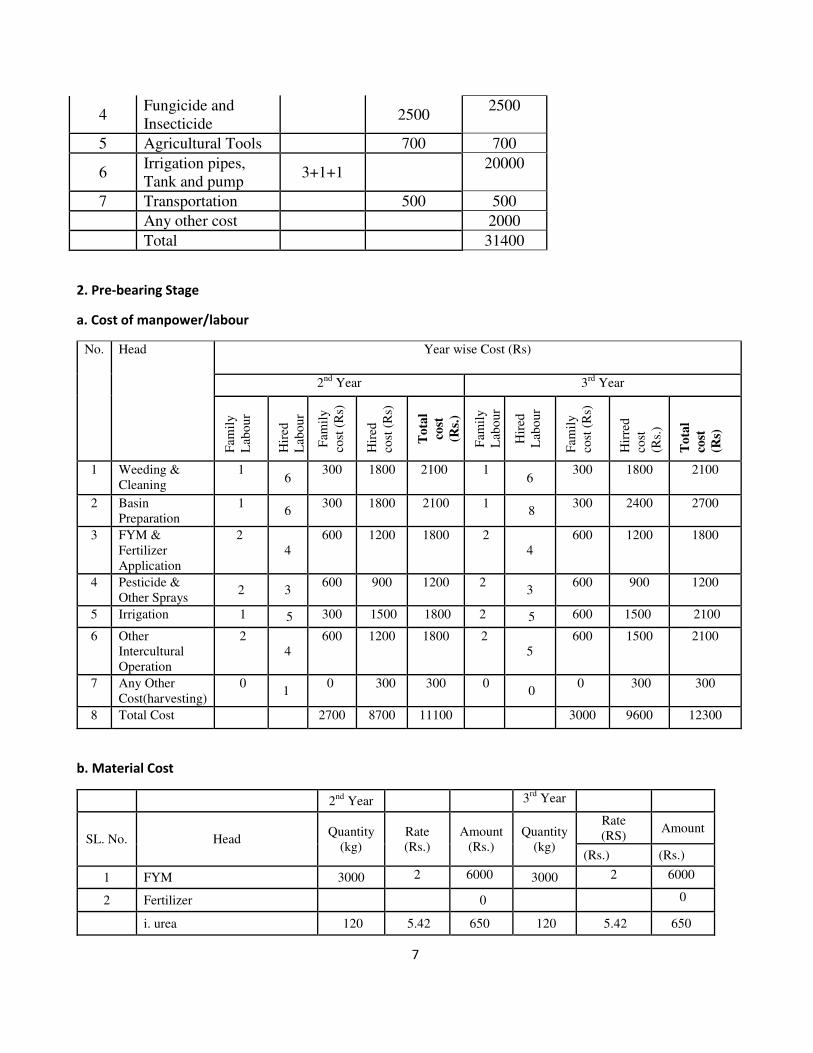
7
4 Fungicide and
Insecticide 2500
2500
5 Agricultural Tools 700 700
6 Irrigation pipes,
Tank and pump 3+1+1
20000
7 Transportation 500 500
Any other cost 2000
Total 31400
2. Pre-bearing Stage
a. Cost of manpower/labour
No. Head Year wise Cost (Rs)
2nd
Year 3rd
Year
Fam
ily
Lab
ou
r
Hir
ed
Lab
ou
r
Fam
ily
cost
(R
s)
Hir
ed
cost
(R
s)
To
tal
cost
(Rs.
)
Fam
ily
Lab
ou
r
Hir
ed
Lab
ou
r
Fam
ily
cost
(R
s)
Hir
red
cost
(Rs.
)
To
tal
cost
(Rs)
1 Weeding &
Cleaning
1 6
300 1800 2100 1 6
300 1800 2100
2 Basin
Preparation
1 6
300 1800 2100 1 8
300 2400 2700
3 FYM &
Fertilizer
Application
2
4
600 1200 1800 2
4
600 1200 1800
4 Pesticide &
Other Sprays 2 3
600 900 1200 2 3
600 900 1200
5 Irrigation 1 5 300 1500 1800 2 5 600 1500 2100
6 Other
Intercultural
Operation
2
4
600 1200 1800 2
5
600 1500 2100
7 Any Other
Cost(harvesting)
0 1
0 300 300 0 0
0 300 300
8 Total Cost 2700 8700 11100 3000 9600 12300
b. Material Cost
2nd
Year 3rd
Year
SL. No. Head Quantity
(kg)
Rate
(Rs.)
Amount
(Rs.)
Quantity
(kg)
Rate
(RS) Amount
(Rs.) (Rs.)
1 FYM 3000 2 6000 3000 2 6000
2 Fertilizer 0 0
i. urea 120 5.42 650 120 5.42 650
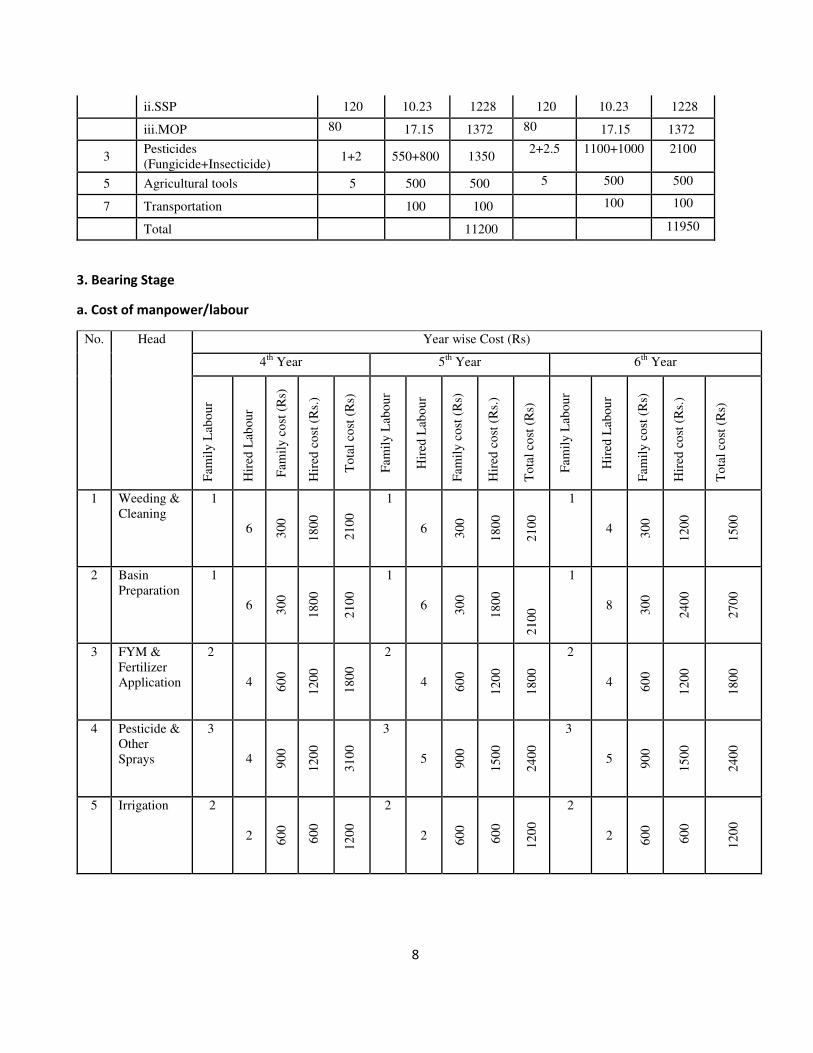
8
ii.SSP 120 10.23 1228 120 10.23 1228
iii.MOP 80 17.15 1372 80 17.15 1372
3 Pesticides
(Fungicide+Insecticide) 1+2 550+800 1350
2+2.5 1100+1000 2100
5 Agricultural tools 5 500 500 5 500 500
7 Transportation 100 100 100 100
Total 11200 11950
3. Bearing Stage
a. Cost of manpower/labour
No. Head Year wise Cost (Rs)
4th
Year 5th
Year 6th
Year
Fam
ily
Lab
ou
r
Hir
ed L
abou
r
Fam
ily
co
st (
Rs)
Hir
ed c
ost
(R
s.)
To
tal
cost
(R
s)
Fam
ily
Lab
ou
r
Hir
ed L
abou
r
Fam
ily
co
st (
Rs)
Hir
ed c
ost
(R
s.)
To
tal
cost
(R
s)
Fam
ily
Lab
ou
r
Hir
ed L
abou
r
Fam
ily
co
st (
Rs)
Hir
ed c
ost
(R
s.)
To
tal
cost
(R
s)
1 Weeding &
Cleaning
1
6 30
0
18
00
21
00
1
6 30
0
18
00
21
00
1
4 30
0
12
00
15
00
2 Basin
Preparation
1
6 30
0
18
00
21
00
1
6 30
0
18
00
21
00
1
8 30
0
24
00
27
00
3 FYM &
Fertilizer
Application
2
4 60
0
12
00
18
00
2
4 60
0
12
00
18
00
2
4 60
0
12
00
18
00
4 Pesticide &
Other
Sprays
3
4 90
0
12
00
31
00
3
5 90
0
15
00
24
00
3
5 90
0
15
00
24
00
5 Irrigation 2
2 60
0
60
0
12
00
2
2 60
0
60
0
12
00
2
2 60
0
60
0
12
00

9
6 Other
Intercultural
Operation
2
6 60
0
18
00
24
00
2
6 60
0
18
00
24
00
2
6 60
0
18
00
24
00
7. Harvesting 1
2 30
0
30
0
60
0
2 2.5
30
0
75
0
10
50
2 4
60
0
12
00
18
00
Total Cost
3
60
0
87
00
13
300
36
00
94
50
13
050
39
00
99
00
13
800
b. Material cost
4th
Year 5th
Year 6th
Year
SL
.
No
.
Head Quantity
(kg)
Rate
(RS) Amount
Quantit
y (kg)
Rate Amount Quanti
ty (kg) Rate Amount
(Rs.) (Rs.) (Rs.) (Rs.)
1 FYM 6000 2 12000 6000 2 12000 8000 2 16000
2 Fertilizer
i. urea 200 5.42 1084 200 5.42 1084 240 5.42 1301
ii.SSP 200 10.23 2046 200 10.23 2046 240 10.23 2455
iii.MOP 120 17.15 2058 120 17.15 2058 200 17.15 3430
3
Pesticides
(Fungicide +
Insecticide)
6+6 450+
550 6000
10+15 450+550 12750 12+15 450+550 13650
5 Agricultural
tools 5 500
5 500 5 500
6 Transportatio
n 300
300 300
7 Any other
cost 500
500 500
8 Harvesting
packing 400
800 1500
9 Total 12888 20038 23636
5. Total cost of cultivation from 1st
to 6th
year
S. No. Fruit crop Progressive Farmer
Manpower cost (Rs.) Material
cost (Rs.)
Grand Total
(Rs.)

10
Family
Labour
Hired
labour
Total
Labour
cost
(Rs.)
1. Mango var.
Amrapali
20400 59850 80250 111112 191362
4. Cost of grafted plants production
S. No Head 4th
Year
(5000 grafted plants)
5th
Year
(10000 grafted
plants)
6th
Year
(15000 grafted
plants)
Cost (Rs.) Cost (Rs.) Cost (Rs.)
1. Mango stone and
seedling raising
7000 12000 20000
2. Scion collection
and Grafting
20000 35000 50000
3. Plant management 3000 5000 5000
Total 30000 52000 75000
5. Return
4th Year 5th
Year 6th
Year
No. Head Quantity Amount
(Rs.)
Quantity Amount
(Rs.)
Quantity Amount
(Rs.)
1 Total Production of mango 2000
6000
10000
5 Income From fruit sale @ (Rs.
30/kg)
60000
180000 300000
6 Income from Plant sale @ (Rs.
30/plant )
150000
300000 450000
Total (Rs.) 210000 480000 750000
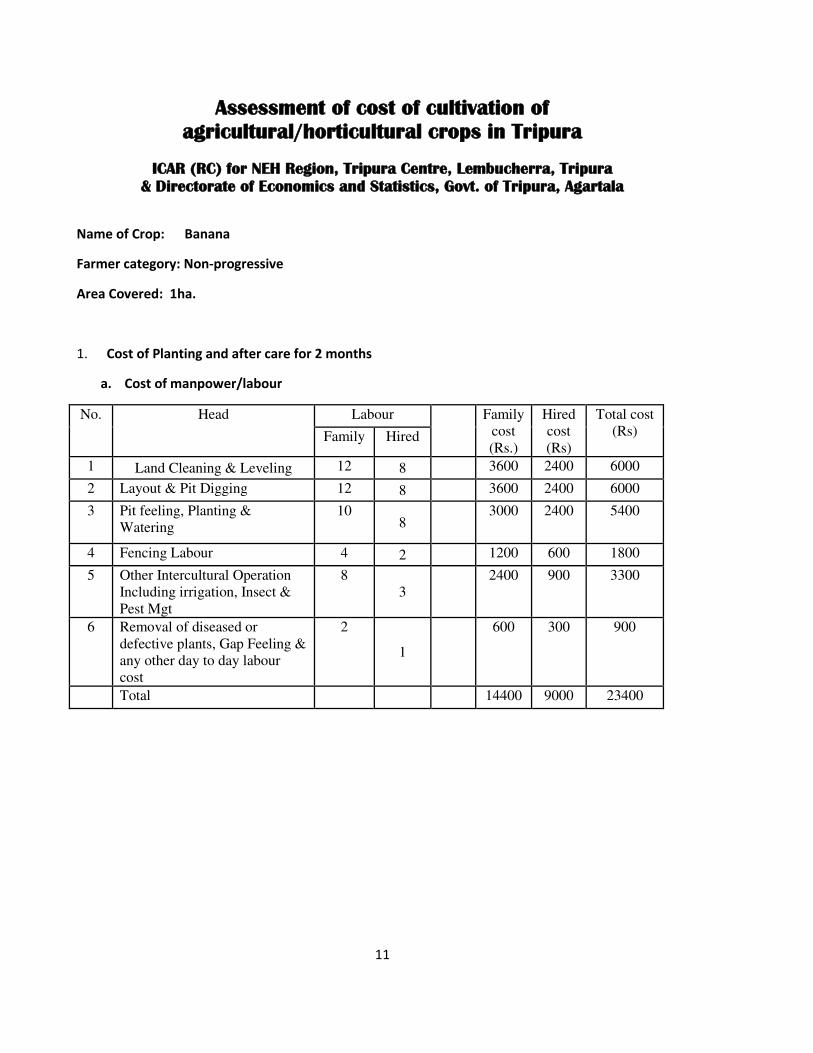
11
Assessment of cost of cultivation of
agricultural/horticultural crops in Tripura
ICAR (RC) for NEH Region, Tripura Centre, Lembucherra, Tripura
& Directorate of Economics and Statistics, Govt. of Tripura, Agartala
Name of Crop: Banana
Farmer category: Non-progressive
Area Covered: 1ha.
1. Cost of Planting and after care for 2 months
a. Cost of manpower/labour
No. Head Labour Family
cost
(Rs.)
Hired
cost
(Rs)
Total cost
(Rs) Family Hired
1 Land Cleaning & Leveling 12 8 3600 2400 6000
2 Layout & Pit Digging 12 8 3600 2400 6000
3 Pit feeling, Planting &
Watering
10 8
3000 2400 5400
4 Fencing Labour 4 2 1200 600 1800
5 Other Intercultural Operation
Including irrigation, Insect &
Pest Mgt
8
3
2400 900
3300
6 Removal of diseased or
defective plants, Gap Feeling &
any other day to day labour
cost
2
1
600 300 900
Total 14400 9000 23400

12
b. Material cost at planting
Sl. No. Head Quantity Nos. or kg Rate(RS) Amount
1 Planting materials 1600 10 16000
2 FYM 3200 2 6400
4 Fungicide and Insecticide 2+2 450+550 2000
5 Irrigation, pipes and
pump 2 500 1000
6 Agricultural Tools 5 300 1500
7 Transportation 0 1000
8 Fencing
2000
Total 29900
2. Cost for manpower for management of plantation and bearing plants
Year wise cost (Rs.)
Pre-bearing Stage Bearing Stage
S.
No.
Head Family
Labour
Hired
Labour
Family
cost
(Rs.)
Hired
cost
(Rs.)
Total
cost
(Rs.)
Family
Labour
Hired
Labour
Family
cost
(Rs.)
Hired
cost
(Rs.)
Total cost
(Rs.)
1 Orchard floor
weeding and
cleaning
6 4 1800 1200 3000 3 2 900
600 1500
2 Basin
Preparation 4 2 1200 600 1800 4 5 1200
1500 2700
3 FYM &
fertilizer
application
2 2 600 600 1200 1 0 300
0 300
4 Pesticide and
other sprays 1 1 300 300 600 1 0 300
0 300
5 Irrigation 1 1 300 300 600 5 0 1500 0 1500
6 Other
intercultural
operations like
staking, dries
leaf removal,
desukering,
etc.
1 1 300 300 600 6 4 1800
1200 2000
7 Harvesting and
post harvest
handling
0 0 0 0 0 8 3 2400
900 3300
Total Cost (i) 0 0 4500 3300 7800 0 0 8400 4200 11600
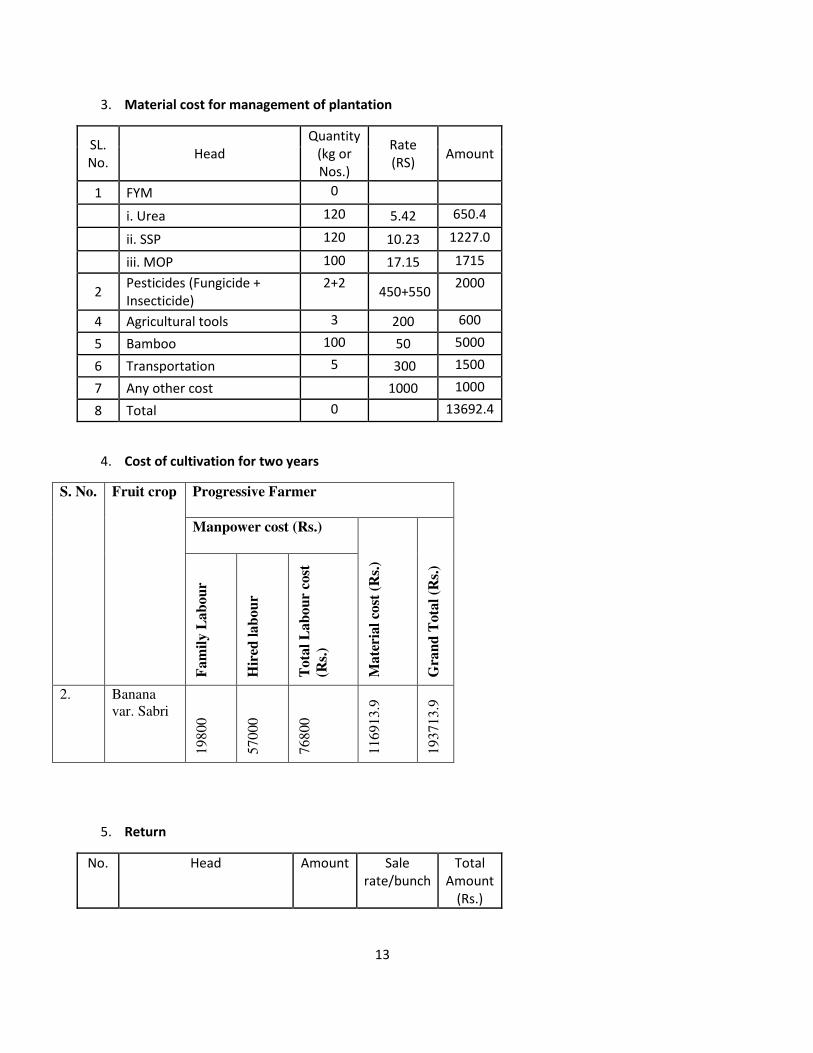
13
3. Material cost for management of plantation
SL.
No. Head
Quantity
(kg or
Nos.)
Rate
(RS) Amount
1 FYM 0
i. Urea 120 5.42 650.4
ii. SSP 120 10.23 1227.0
iii. MOP 100 17.15 1715
2 Pesticides (Fungicide +
Insecticide)
2+2 450+550
2000
4 Agricultural tools 3 200 600
5 Bamboo 100 50 5000
6 Transportation 5 300 1500
7 Any other cost 1000 1000
8 Total 0 13692.4
4. Cost of cultivation for two years
S. No. Fruit crop Progressive Farmer
Manpower cost (Rs.)
Mate
rial
cost
(R
s.)
Gra
nd
Tota
l (R
s.)
Fam
ily L
ab
ou
r
Hir
ed l
ab
ou
r
Tota
l L
ab
ou
r co
st
(Rs.
)
2. Banana
var. Sabri
19
80
0
57
00
0
76
80
0
11
69
13.9
19
37
13.9
5. Return
No. Head Amount Sale
rate/bunch
Total
Amount
(Rs.)

14
1 Total Production of Main
Crop/ha 1550 200 310000
2 Total Production of
Suckers@ (2 Nos/plant) 3200 10 32000
Total income 342000
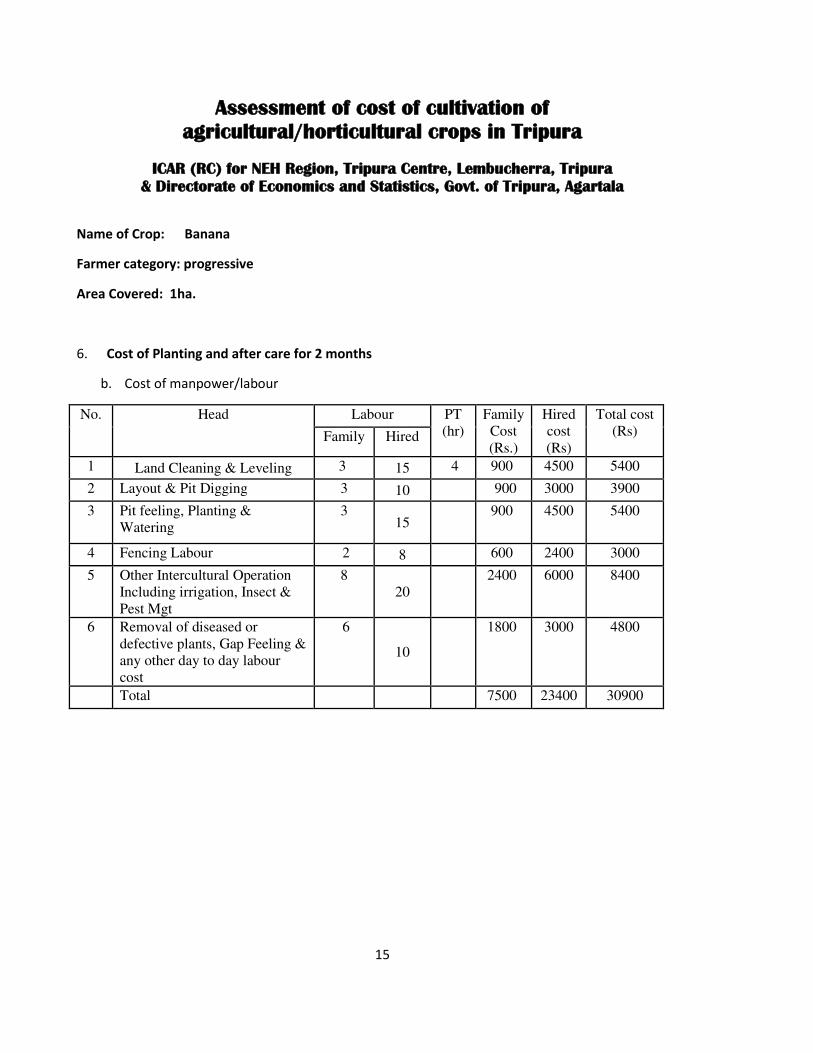
15
Assessment of cost of cultivation of
agricultural/horticultural crops in Tripura
ICAR (RC) for NEH Region, Tripura Centre, Lembucherra, Tripura
& Directorate of Economics and Statistics, Govt. of Tripura, Agartala
Name of Crop: Banana
Farmer category: progressive
Area Covered: 1ha.
6. Cost of Planting and after care for 2 months
b. Cost of manpower/labour
No. Head Labour PT
(hr)
Family
Cost
(Rs.)
Hired
cost
(Rs)
Total cost
(Rs) Family Hired
1 Land Cleaning & Leveling 3 15 4 900 4500 5400
2 Layout & Pit Digging 3 10 900 3000 3900
3 Pit feeling, Planting &
Watering
3 15
900 4500 5400
4 Fencing Labour 2 8 600 2400 3000
5 Other Intercultural Operation
Including irrigation, Insect &
Pest Mgt
8
20
2400 6000 8400
6 Removal of diseased or
defective plants, Gap Feeling &
any other day to day labour
cost
6
10
1800 3000 4800
Total 7500 23400 30900

16
b. Material cost at planting
Sl. No. Head Quantity Nos. or kg Rate(RS) Amount
1 Planting materials 1600 10 16000
2 FYM 16000 2 32000
4 Fungicide and Insecticide 5+5 450+550 5000
5 Irrigation, pipes and
pump 1+5+1 30000
6 Agricultural Tools 10 300 3000
7 Transportation 0 5000
8 Fencing
5000
Total 96000
7. Cost for management of Plantation and bearing plants
Year wise cost (Rs.)
Pre-bearing Stage Bearing Stage
S.
No.
Head
Family
Labour
Hired
Labour
Famil
y cost
(Rs.)
Hired
cost
(Rs.)
Total
cost
(Rs.)
Famil
y
Labou
r
Hired
Labour
Famil
y
cost
(Rs.)
Hired
cost
(Rs.)
Total cost
(Rs.)
1 Orchard floor
weeding and
cleaning
4 10 1200 3000 4200 4 12
1200 3600 4800
2 Basin
Preparation 4 10 1200 3000 4200 2 8
600 2400 3000
3 FYM & fertilizer
application 4 8 200 2400 3900 2 4
600 1200 1800
4 Pesticide and
other sprays 3 5 900 1500 2100 2 8
600 2400 3000
5 Irrigation 3 10 900 3000 3900 3 8 900 2400 3300
6 Other
intercultural
operations like
staking, dries leaf
removal,
desukering, etc.
2 10 600 3000 3600 3 6
900 1800 2700
7 Harvesting and
post harvest
handling
0 0 0 0 0 4 8
1200 2400 3600
Total Cost (i) 0 0 6300 17400 2190 0 0 6000 16200 22200
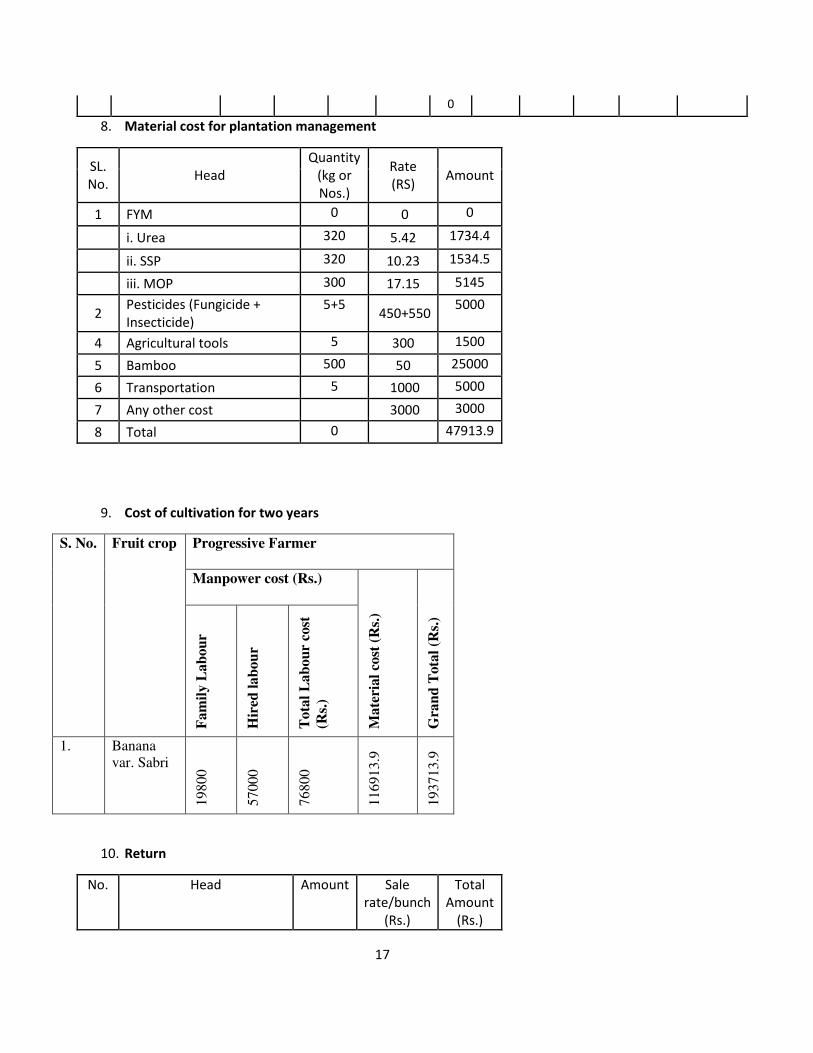
17
0
8. Material cost for plantation management
SL.
No. Head
Quantity
(kg or
Nos.)
Rate
(RS) Amount
1 FYM 0 0 0
i. Urea 320 5.42 1734.4
ii. SSP 320 10.23 1534.5
iii. MOP 300 17.15 5145
2 Pesticides (Fungicide +
Insecticide)
5+5 450+550
5000
4 Agricultural tools 5 300 1500
5 Bamboo 500 50 25000
6 Transportation 5 1000 5000
7 Any other cost 3000 3000
8 Total 0 47913.9
9. Cost of cultivation for two years
S. No. Fruit crop Progressive Farmer
Manpower cost (Rs.)
Mate
rial
cost
(R
s.)
Gra
nd
Tota
l (R
s.)
Fa
mil
y L
ab
ou
r
Hir
ed l
ab
ou
r
Tota
l L
ab
ou
r co
st
(Rs.
)
1. Banana
var. Sabri
19
80
0
57
00
0
76
80
0
11
69
13
.9
19
37
13
.9
10. Return
No. Head Amount Sale
rate/bunch
(Rs.)
Total
Amount
(Rs.)
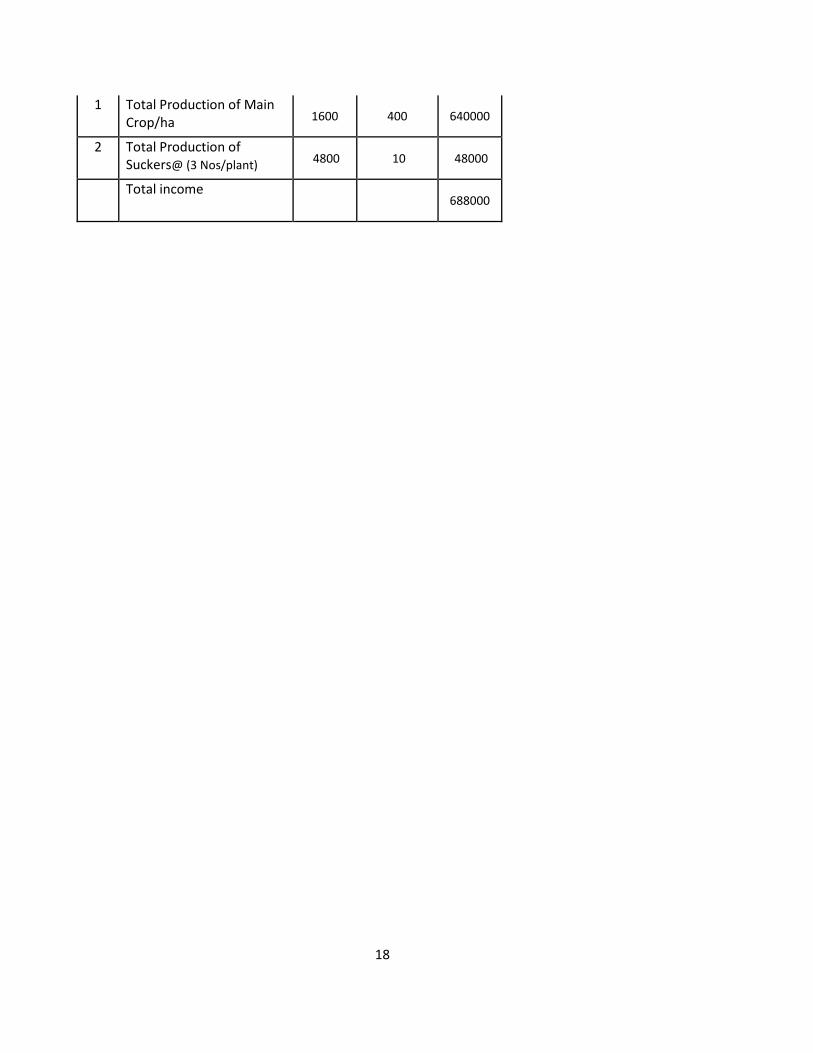
18
1 Total Production of Main
Crop/ha 1600 400 640000
2 Total Production of
Suckers@ (3 Nos/plant) 4800 10 48000
Total income 688000
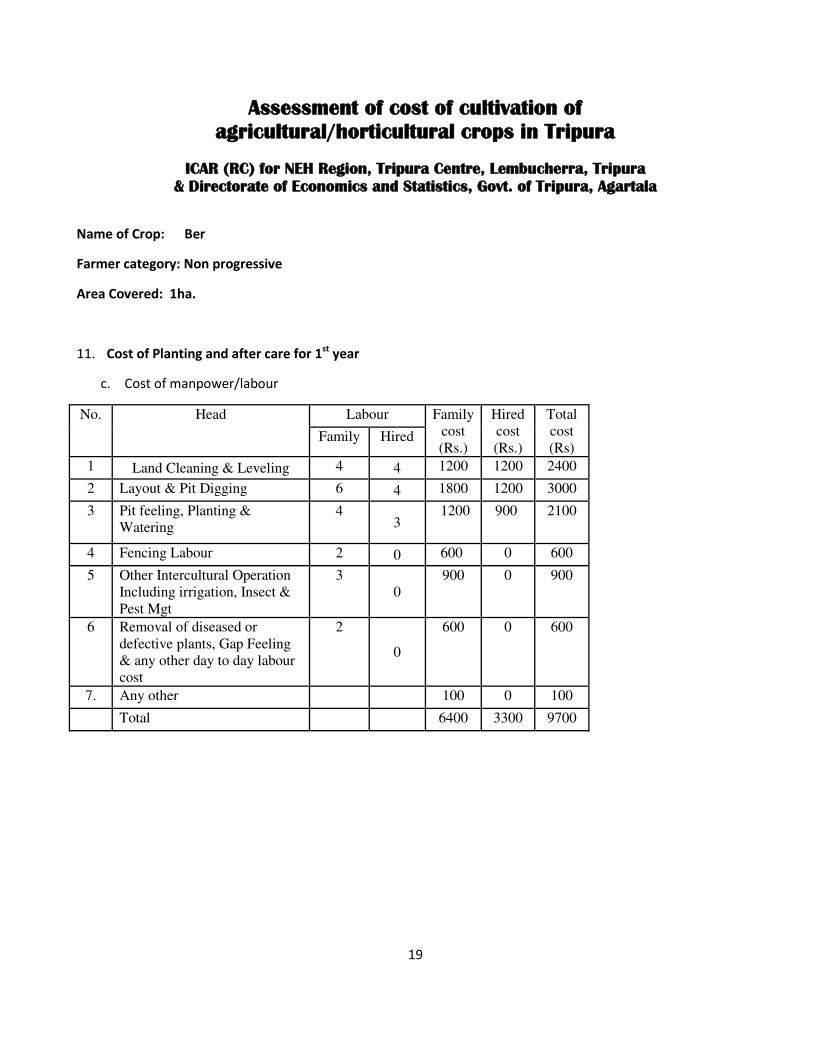
19
Assessment of cost of cultivation of
agricultural/horticultural crops in Tripura
ICAR (RC) for NEH Region, Tripura Centre, Lembucherra, Tripura
& Directorate of Economics and Statistics, Govt. of Tripura, Agartala
Name of Crop: Ber
Farmer category: Non progressive
Area Covered: 1ha.
11. Cost of Planting and after care for 1st
year
c. Cost of manpower/labour
No. Head Labour Family
cost
(Rs.)
Hired
cost
(Rs.)
Total
cost
(Rs) Family Hired
1 Land Cleaning & Leveling 4 4 1200 1200 2400
2 Layout & Pit Digging 6 4 1800 1200 3000
3 Pit feeling, Planting &
Watering
4 3
1200 900 2100
4 Fencing Labour 2 0 600 0 600
5 Other Intercultural Operation
Including irrigation, Insect &
Pest Mgt
3
0
900 0 900
6 Removal of diseased or
defective plants, Gap Feeling
& any other day to day labour
cost
2
0
600 0 600
7. Any other 100 0 100
Total 6400 3300 9700

20
b. Material cost
Sl. No. Head Quantity Nos. or kg Rate(RS) Amount
1 Planting materials 200 25 5000
2 FYM 600 2 1200
4 Fungicide and Insecticide 0.5+0.5 225+275 500
5 Irrigation, and pipes 1+3 5000
6 Agricultural Tools 3 100 300
7 Transportation 0 500
8 Fencing
1000
Total 13500
2. Pre-bearing Stage
a. Cost of manpower/labour
No. Head Year wise Cost (Rs)
2
nd Year 3
rd Year
Fam
ily
Lab
ou
r
Hir
ed
Lab
ou
r
Fam
ily
cost
(Rs)
H
ired
cost
(Rs.
)
To
tal
cost
(Rs)
F
amil
y
Lab
ou
r
Hir
ed
Lab
ou
r
Fam
ily
cost
(Rs.
)
Hired
cost
(Rs.)
Total
cost
(Rs)
1 Weeding &
Cleaning 3
2 900 600 1500 3
2 900 600 1500
2 Basin
Preparation 3
2 900 600 1500 3
2 900 600 1500
3 FYM &
Fertilizer
Application
1 0
300 0 300 1
1
300 300 600
4 Pesticide &
Other Sprays 1
0 300 0 300 1
0 300 0 300
5 Irrigation 1 0 300 0 300 1 1 300 300 600
6 Other
Intercultural
Operation like
pruning
1
0
300 0 300 1
1
300 300 600
7 Any Other Cost 200 0 200 200 0 200
8 Total Cost 3200 1200 4400 3200 2100 5300
b. Material Cost
2nd
Year 3rd
Year
SL. No. Head Quantity Rate Amount Quantity Rate Amount
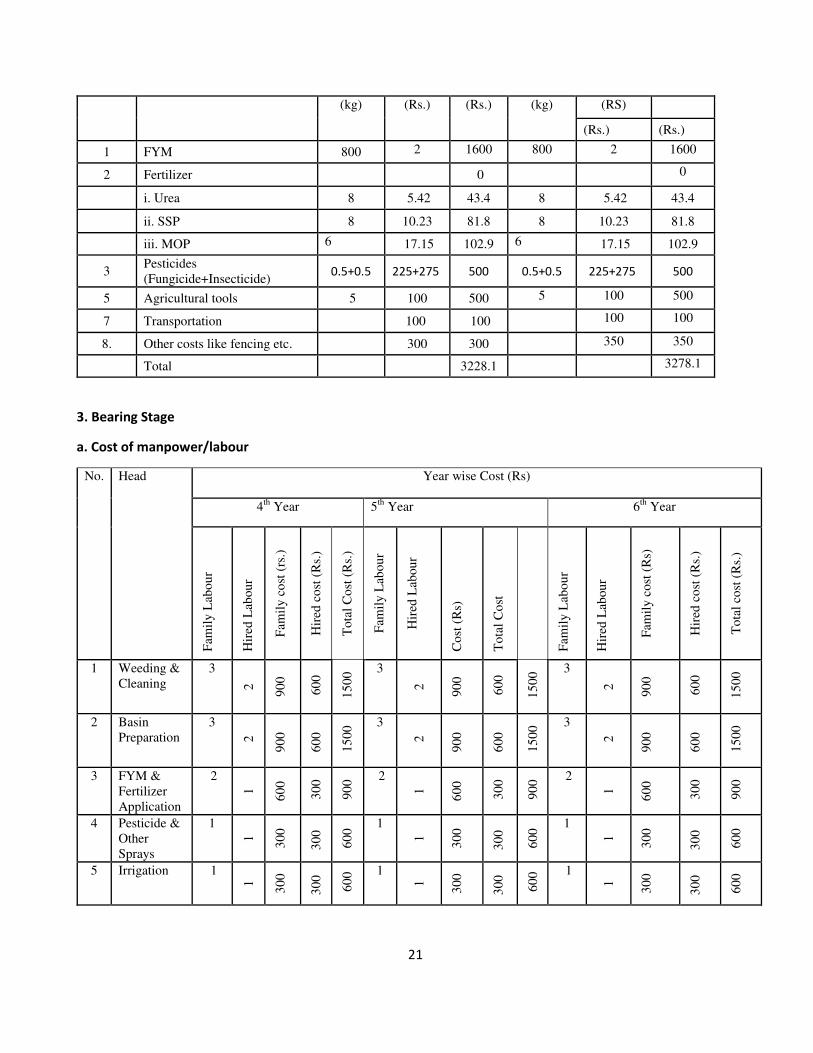
21
(kg) (Rs.) (Rs.) (kg) (RS)
(Rs.) (Rs.)
1 FYM 800 2 1600 800 2 1600
2 Fertilizer
0 0
i. Urea 8 5.42 43.4 8 5.42 43.4
ii. SSP 8 10.23 81.8 8 10.23 81.8
iii. MOP 6 17.15 102.9 6 17.15 102.9
3 Pesticides
(Fungicide+Insecticide) 0.5+0.5 225+275 500 0.5+0.5 225+275 500
5 Agricultural tools 5 100 500 5 100 500
7 Transportation 100 100 100 100
8. Other costs like fencing etc. 300 300 350 350
Total 3228.1 3278.1
3. Bearing Stage
a. Cost of manpower/labour
No. Head Year wise Cost (Rs)
4th
Year 5th
Year 6th
Year
Fam
ily
Lab
ou
r
Hir
ed L
abou
r
Fam
ily
co
st (
rs.)
Hir
ed c
ost
(R
s.)
To
tal
Co
st (
Rs.
)
Fam
ily
Lab
ou
r
Hir
ed L
abou
r
Co
st (
Rs)
To
tal
Co
st
Fam
ily
Lab
ou
r
Hir
ed L
abou
r
Fam
ily
co
st (
Rs)
Hir
ed c
ost
(R
s.)
To
tal
cost
(R
s.)
1 Weeding &
Cleaning
3
2
90
0
60
0
15
00 3
2
90
0
60
0
15
00 3
2
90
0
60
0
15
00
2 Basin
Preparation
3
2
90
0
60
0
15
00 3
2
90
0
60
0
15
00 3
2
90
0
60
0
15
00
3 FYM &
Fertilizer
Application
2
1
60
0
30
0
90
0 2
1
60
0
30
0
90
0 2
1
60
0
30
0
90
0
4 Pesticide &
Other
Sprays
1
1
30
0
30
0
60
0 1
1
30
0
30
0
60
0 1
1
30
0
30
0
60
0
5 Irrigation 1
1
30
0
30
0
60
0 1
1
30
0
30
0
60
0 1
1
30
0
30
0
60
0
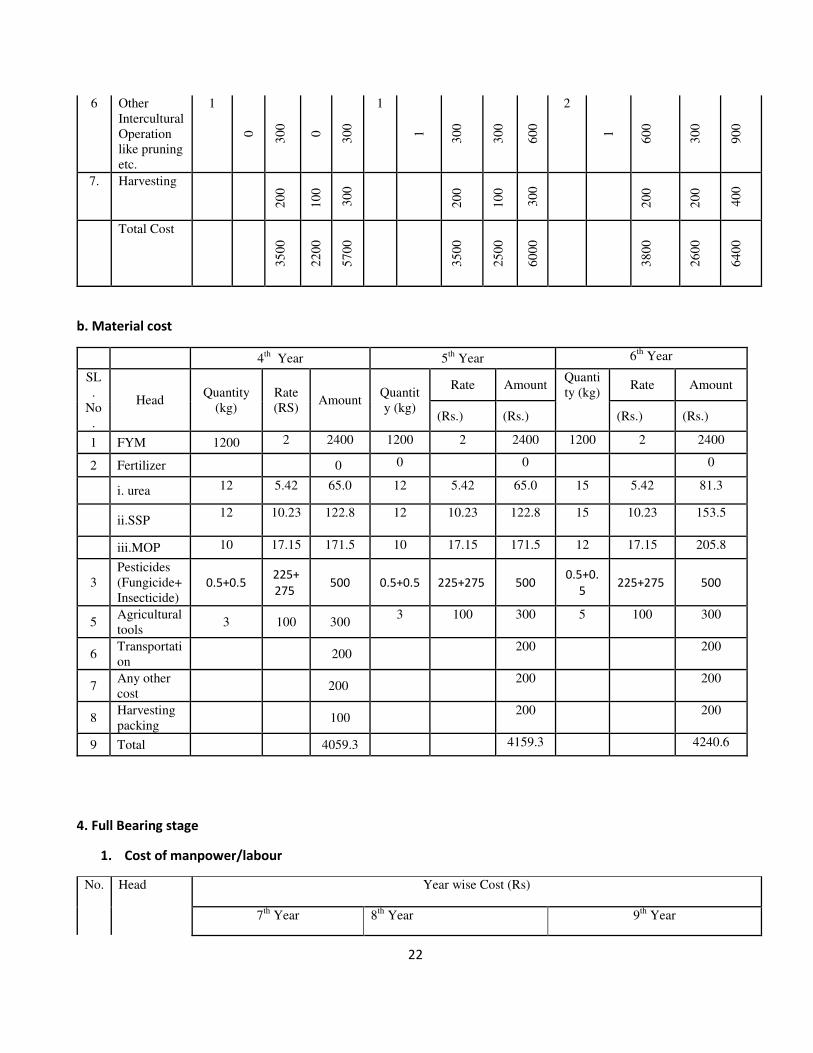
22
6 Other
Intercultural
Operation
like pruning
etc.
1
0
30
0
0
30
0
1
1
30
0
30
0
60
0
2
1
60
0
30
0
90
0
7. Harvesting
20
0
10
0
30
0
20
0
10
0
30
0
20
0
20
0
40
0
Total Cost
35
00
22
00
57
00
35
00
25
00
60
00
38
00
26
00
64
00
b. Material cost
4th
Year 5th
Year 6th
Year
SL
.
No
.
Head Quantity
(kg)
Rate
(RS) Amount
Quantit
y (kg)
Rate Amount Quanti
ty (kg) Rate Amount
(Rs.) (Rs.) (Rs.) (Rs.)
1 FYM 1200 2 2400 1200 2 2400 1200 2 2400
2 Fertilizer 0 0 0 0
i. urea 12 5.42 65.0 12 5.42 65.0 15 5.42 81.3
ii.SSP 12 10.23 122.8 12 10.23 122.8 15 10.23 153.5
iii.MOP 10 17.15 171.5 10 17.15 171.5 12 17.15 205.8
3
Pesticides
(Fungicide+
Insecticide)
0.5+0.5 225+
275 500 0.5+0.5 225+275 500
0.5+0.
5 225+275 500
5 Agricultural
tools 3 100 300
3 100 300 5 100 300
6 Transportati
on 200
200 200
7 Any other
cost 200
200 200
8 Harvesting
packing 100
200 200
9 Total 4059.3 4159.3 4240.6
4. Full Bearing stage
1. Cost of manpower/labour
No. Head Year wise Cost (Rs)
7th
Year 8th
Year 9th
Year
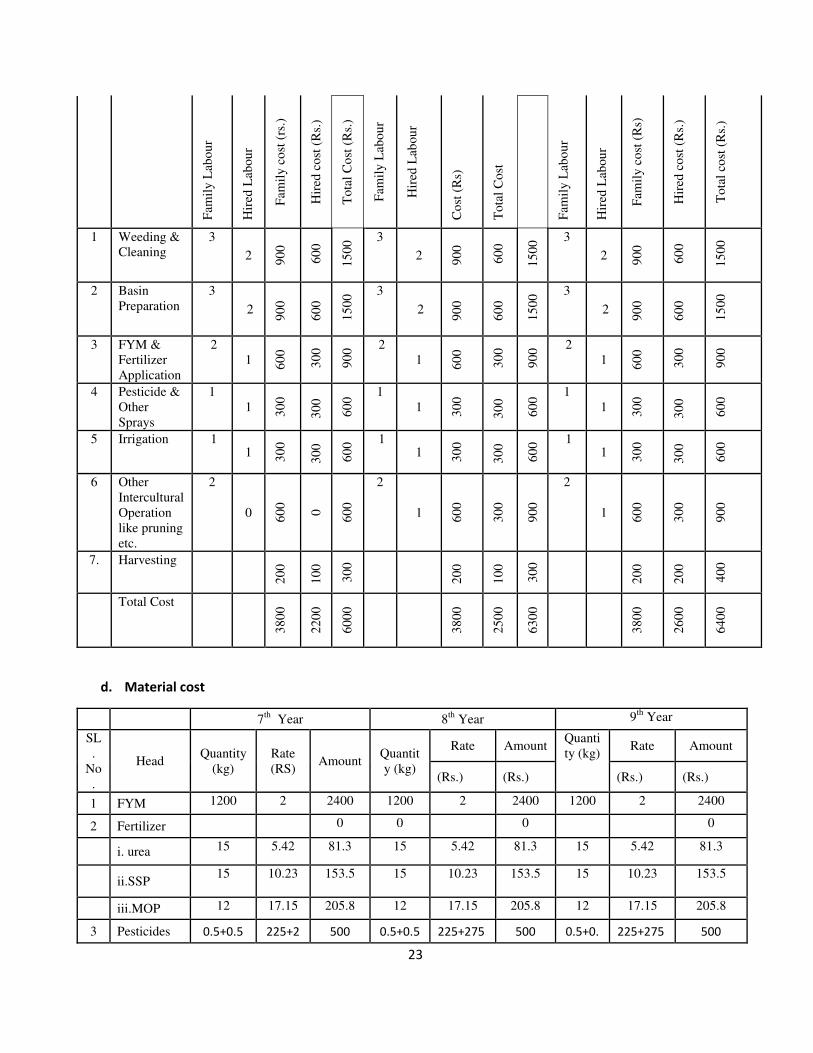
23
Fam
ily
Lab
ou
r
Hir
ed L
abou
r
Fam
ily
co
st (
rs.)
Hir
ed c
ost
(R
s.)
To
tal
Co
st (
Rs.
)
Fam
ily
Lab
ou
r
Hir
ed L
abou
r
Co
st (
Rs)
To
tal
Co
st
Fam
ily
Lab
ou
r
Hir
ed L
abou
r
Fam
ily
co
st (
Rs)
Hir
ed c
ost
(R
s.)
To
tal
cost
(R
s.)
1 Weeding &
Cleaning
3
2 90
0
60
0
15
00 3
2 90
0
60
0
15
00 3
2 90
0
60
0
15
00
2 Basin
Preparation
3
2
90
0
60
0
15
00 3
2
90
0
60
0
15
00 3
2
90
0
60
0
15
00
3 FYM &
Fertilizer
Application
2
1 60
0
30
0
90
0 2
1 60
0
30
0
90
0 2
1 60
0
30
0
90
0
4 Pesticide &
Other
Sprays
1
1 30
0
30
0
60
0 1
1 30
0
30
0
60
0 1
1 30
0
30
0
60
0
5 Irrigation 1 1 3
00
30
0
60
0 1
1 30
0
30
0
60
0 1
1 30
0
30
0
60
0
6 Other
Intercultural
Operation
like pruning
etc.
2
0 60
0
0
60
0
2
1 60
0
30
0
90
0
2
1 60
0
30
0
90
0
7. Harvesting
20
0
10
0
30
0
20
0
10
0
30
0
20
0
20
0
40
0
Total Cost
38
00
22
00
60
00
38
00
25
00
63
00
38
00
26
00
64
00
d. Material cost
7th
Year 8th
Year 9th
Year
SL
.
No
.
Head Quantity
(kg)
Rate
(RS) Amount
Quantit
y (kg)
Rate Amount Quanti
ty (kg) Rate Amount
(Rs.) (Rs.) (Rs.) (Rs.)
1 FYM 1200 2 2400 1200 2 2400 1200 2 2400
2 Fertilizer 0 0 0 0
i. urea 15 5.42 81.3 15 5.42 81.3 15 5.42 81.3
ii.SSP 15 10.23 153.5 15 10.23 153.5 15 10.23 153.5
iii.MOP 12 17.15 205.8 12 17.15 205.8 12 17.15 205.8
3 Pesticides 0.5+0.5 225+2 500 0.5+0.5 225+275 500 0.5+0. 225+275 500
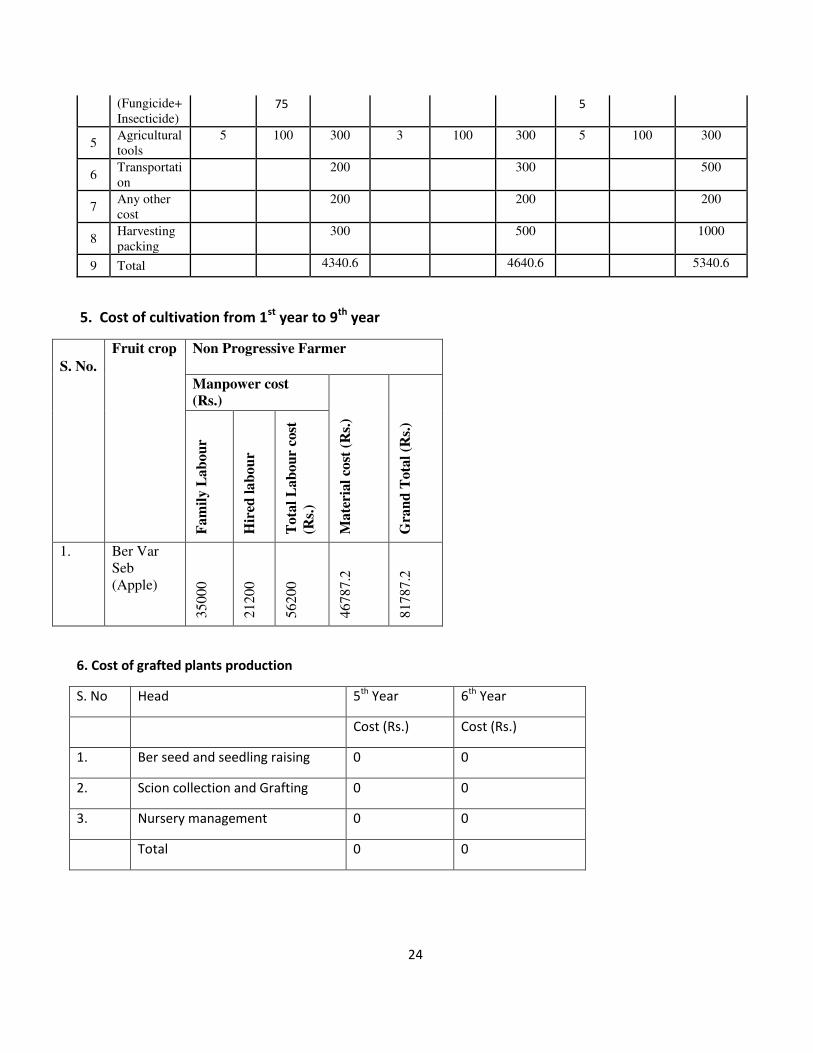
24
(Fungicide+
Insecticide) 75 5
5 Agricultural
tools
5 100 300 3 100 300 5 100 300
6 Transportati
on
200 300 500
7 Any other
cost
200 200 200
8 Harvesting
packing
300 500 1000
9 Total 4340.6 4640.6 5340.6
5. Cost of cultivation from 1st
year to 9th
year
S. No.
Fruit crop Non Progressive Farmer
Manpower cost
(Rs.)
Ma
teri
al
cost
(R
s.)
Gra
nd
Tota
l (R
s.)
Fam
ily L
ab
ou
r
Hir
ed l
ab
ou
r
Tota
l L
ab
ou
r co
st
(Rs.
)
1. Ber Var
Seb
(Apple)
35000
21200
56200
46787.2
81787.2
6. Cost of grafted plants production
S. No Head 5th
Year 6th
Year
Cost (Rs.) Cost (Rs.)
1. Ber seed and seedling raising 0 0
2. Scion collection and Grafting 0 0
3. Nursery management 0 0
Total 0 0
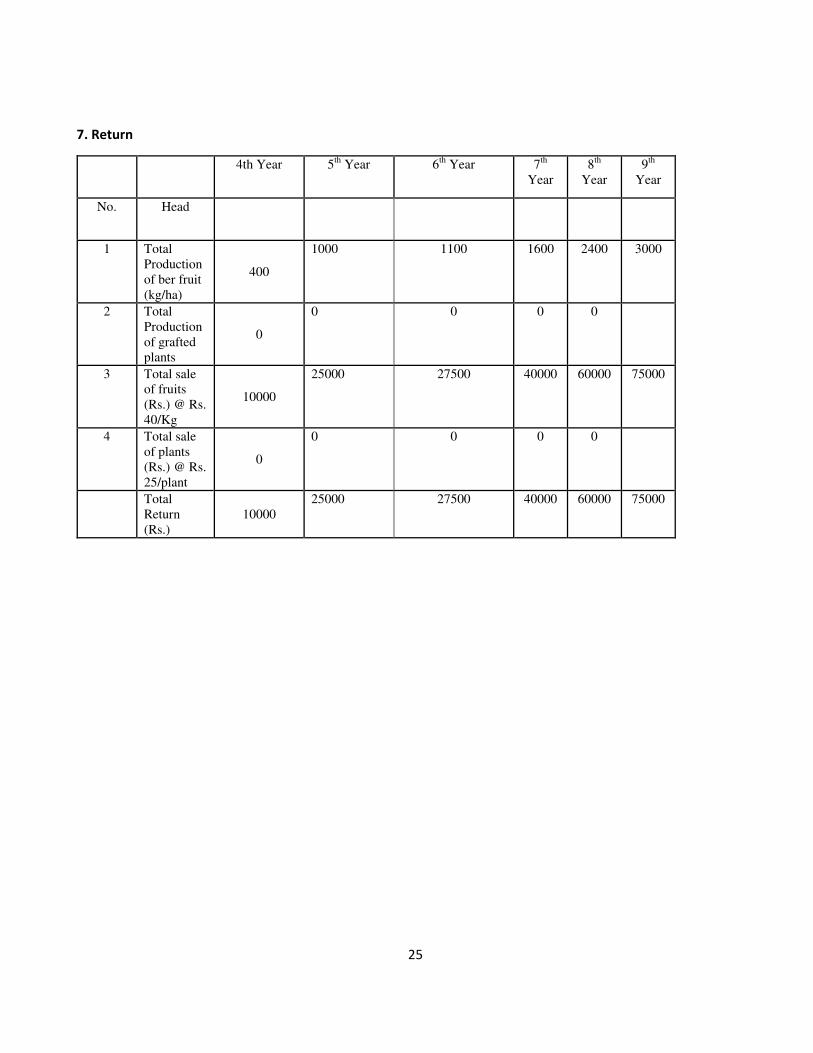
25
7. Return
4th Year 5th
Year 6th
Year 7th
Year
8th
Year
9th
Year
No. Head
1 Total
Production
of ber fruit
(kg/ha)
400
1000 1100 1600 2400 3000
2 Total
Production
of grafted
plants
0
0 0 0 0
3 Total sale
of fruits
(Rs.) @ Rs.
40/Kg
10000
25000 27500 40000 60000 75000
4 Total sale
of plants
(Rs.) @ Rs.
25/plant
0
0 0 0 0
Total
Return
(Rs.)
10000
25000 27500 40000 60000 75000

26
Assessment of cost of cultivation of
agricultural/horticultural crops in Tripura
ICAR (RC) for NEH Region, Tripura Centre, Lembucherra, Tripura
& Directorate of Economics and Statistics, Govt. of Tripura, Agartala
Name of Crop: Ber
Farmer category: Progressive
Area Covered: 1ha.
12. Cost of Planting and after care for 2 months
e. Cost of manpower/labour
No. Head Labour PT
(hr)
Family
cost
(Rs.)
Hired
cost
(Rs)
Total
cost
(Rs.) Family Hired
1 Land Cleaning & Leveling 4 6 4 1200 1800 3000
2 Layout & Pit Digging 3 8 900 2400 3300
3 Pit feeling, Planting &
Watering
3 6
900 1800 2700
4 Fencing Labour 1 2 300 600 1200
5 Other Intercultural Operation
Including irrigation, Insect &
Pest Mgt
1
3
300 900 1500
6 Removal of diseased or
defective plants, Gap Feeling &
any other day to day labour
cost
0
1
0 300 300
7. Any other 0 0 0
Total 3600 7800 12000
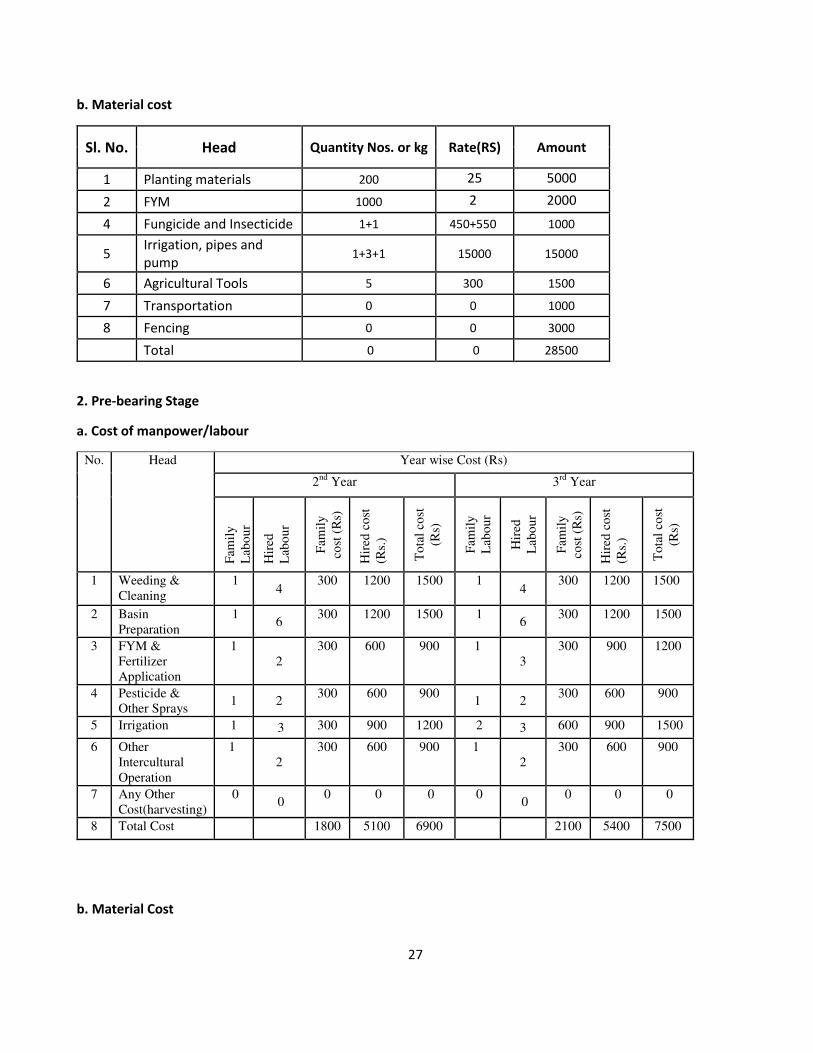
27
b. Material cost
Sl. No. Head Quantity Nos. or kg Rate(RS) Amount
1 Planting materials 200 25 5000
2 FYM 1000 2 2000
4 Fungicide and Insecticide 1+1 450+550 1000
5 Irrigation, pipes and
pump 1+3+1 15000 15000
6 Agricultural Tools 5 300 1500
7 Transportation 0 0 1000
8 Fencing 0 0 3000
Total 0 0 28500
2. Pre-bearing Stage
a. Cost of manpower/labour
No. Head Year wise Cost (Rs)
2nd
Year 3rd
Year
Fam
ily
Lab
ou
r
Hir
ed
Lab
ou
r
Fam
ily
cost
(R
s)
Hir
ed c
ost
(Rs.
)
To
tal
cost
(Rs)
Fam
ily
Lab
ou
r
Hir
ed
Lab
ou
r
Fam
ily
cost
(R
s)
Hir
ed c
ost
(Rs.
)
To
tal
cost
(Rs)
1 Weeding &
Cleaning
1 4
300 1200 1500 1 4
300 1200 1500
2 Basin
Preparation
1 6
300 1200 1500 1 6
300 1200 1500
3 FYM &
Fertilizer
Application
1
2
300 600 900 1
3
300 900 1200
4 Pesticide &
Other Sprays 1 2
300 600 900 1 2
300 600 900
5 Irrigation 1 3 300 900 1200 2 3 600 900 1500
6 Other
Intercultural
Operation
1
2
300 600 900 1
2
300 600 900
7 Any Other
Cost(harvesting)
0 0
0 0 0 0 0
0 0 0
8 Total Cost 1800 5100 6900 2100 5400 7500
b. Material Cost

28
SL. No. Head
2nd
Year 3rd
Year
Quantity
(kg)
Rate
(Rs.)
Amount
(Rs.)
Quantity
(kg)
Rate
(RS) Amount
(Rs.) (Rs.)
1 FYM 1000 2 1000 1500 2 3000
2 Fertilizer
0 0
i. Urea 15 5.42 81.3 20 5.42 108.4
ii. SSP 15 10.23 153.5 20 10.23 204.6
iii. MOP 10 17.15 171.5 15 17.15 157.3
3 Pesticides
(Fungicide+Insecticide) 1+1 450+550 1000 1+1 450+550 1000
5 Agricultural tools 5 500 500 5 500 500
7 Transportation 100 100 100 100
8. Other costs like fencing etc. 400 400 450 450
Total 3406.3 5520.3
3. Bearing Stage
a. Cost of manpower/labour
No. Head Year wise Cost (Rs)
4th
Year 5th
Year 6th
Year
Fam
ily
Lab
ou
r
Hir
ed L
abou
r
Fam
ily
co
st
(Rs)
Hir
ed c
ost
(R
s.)
To
tal
cost
(R
s.)
Fam
ily
Lab
ou
r
Hir
ed L
abou
r
Fam
ily
co
st
(Rs.
)
Hir
ed c
ost
(R
s.)
To
tal
cost
(R
s.)
Fam
ily
Lab
ou
r
Hir
ed L
abou
r
Fam
ily
co
st
(Rs)
Hir
ed c
ost
(R
s.)
To
tal
Co
st
(Rs.
)
1 Weeding &
Cleaning
1
4 30
0
12
00
15
00
1
4 30
0
12
00
15
00
1
4 30
0
12
00
15
00
2 Basin
Preparation
1
6 30
0
18
00
21
00
1
6 30
0
18
00
21
00
1
6 30
0
18
00
21
00
3 FYM &
Fertilizer
Application
1
4 30
0
12
00
15
00
1
4 30
0
12
00
15
00
1
4 30
0
12
00
15
00
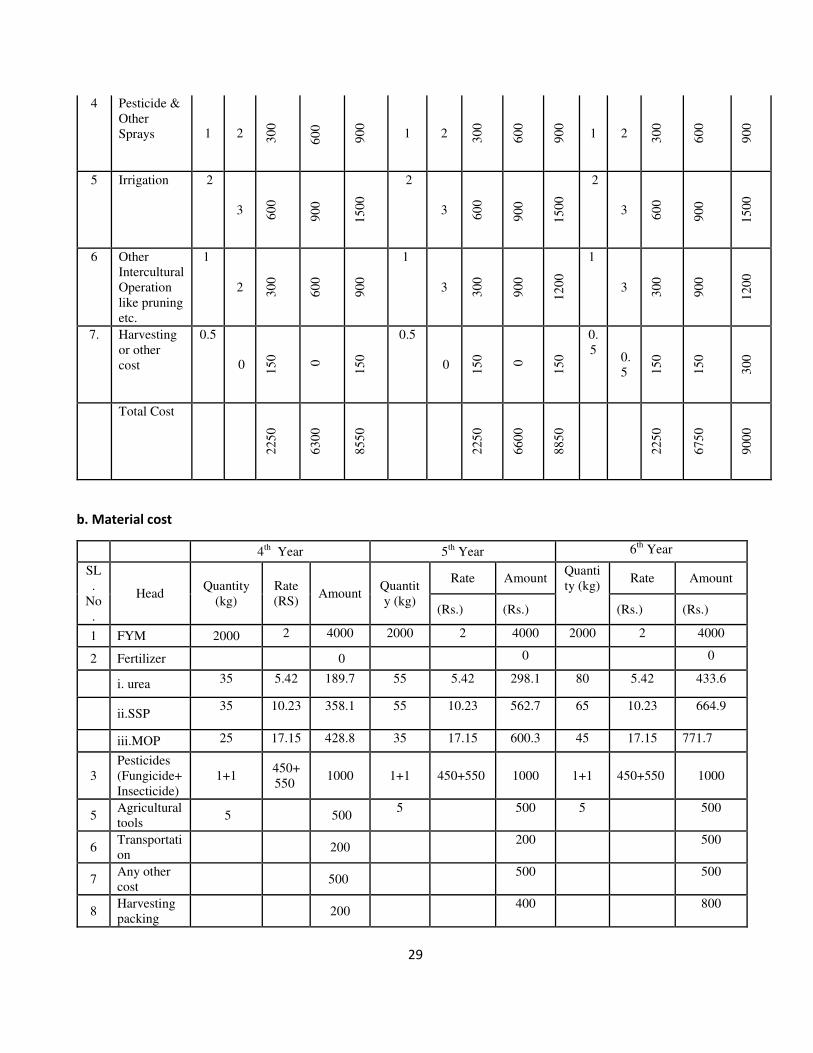
29
4 Pesticide &
Other
Sprays 1 2 30
0
60
0
90
0
1 2 30
0
60
0
90
0
1 2 30
0
60
0
90
0
5 Irrigation 2
3 60
0
90
0
15
00
2
3 60
0
90
0
15
00
2
3 60
0
90
0
15
00
6 Other
Intercultural
Operation
like pruning
etc.
1
2 30
0
60
0
90
0
1
3 30
0
90
0
12
00
1
3 30
0
90
0
12
00
7. Harvesting
or other
cost
0.5
0 15
0
0
15
0
0.5
0 15
0
0
15
0
0.
5 0.
5 15
0
15
0
30
0
Total Cost
22
50
63
00
85
50
22
50
66
00
88
50
22
50
67
50
90
00
b. Material cost
4th
Year 5th
Year 6th
Year
SL
.
No
.
Head Quantity
(kg)
Rate
(RS) Amount
Quantit
y (kg)
Rate Amount Quanti
ty (kg) Rate Amount
(Rs.) (Rs.) (Rs.) (Rs.)
1 FYM 2000 2 4000 2000 2 4000 2000 2 4000
2 Fertilizer 0 0 0
i. urea 35 5.42 189.7 55 5.42 298.1 80 5.42 433.6
ii.SSP 35 10.23 358.1 55 10.23 562.7 65 10.23 664.9
iii.MOP 25 17.15 428.8 35 17.15 600.3 45 17.15 771.7
3
Pesticides
(Fungicide+
Insecticide)
1+1 450+
550 1000 1+1 450+550 1000 1+1 450+550 1000
5 Agricultural
tools 5
500
5 500 5 500
6 Transportati
on 200
200 500
7 Any other
cost 500
500 500
8 Harvesting
packing 200
400 800
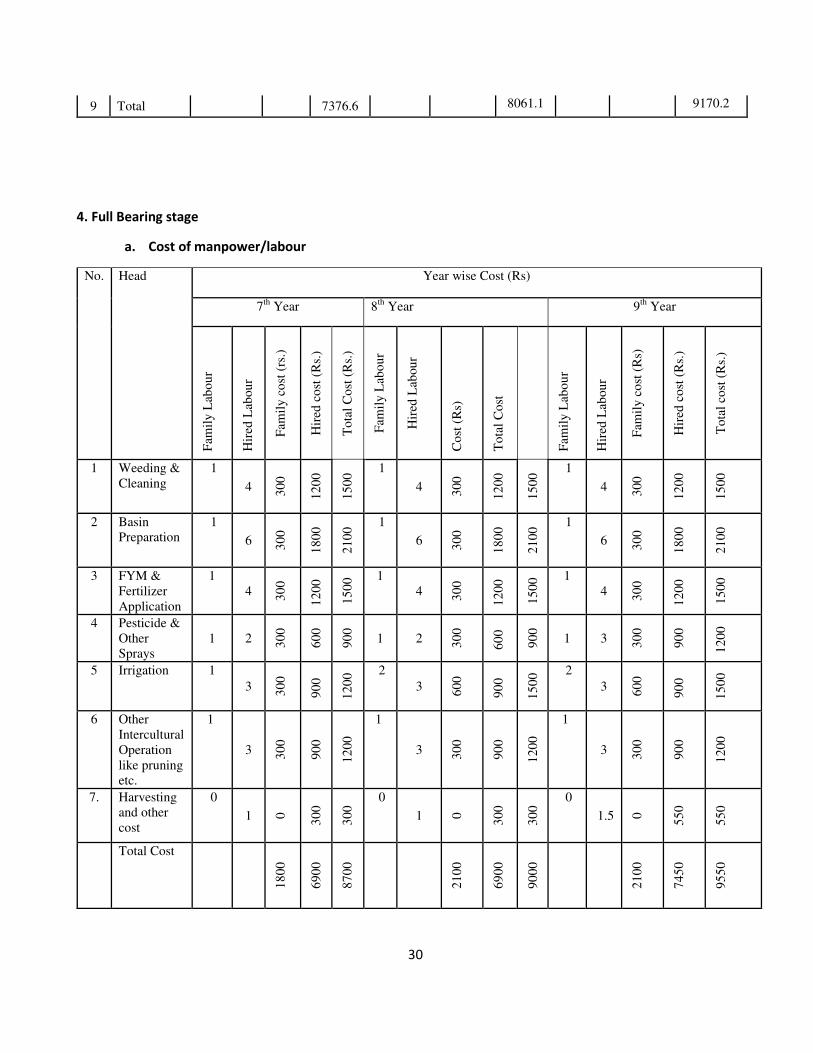
30
9 Total 7376.6 8061.1 9170.2
4. Full Bearing stage
a. Cost of manpower/labour
No. Head Year wise Cost (Rs)
7th
Year 8th
Year 9th
Year
Fam
ily
Lab
ou
r
Hir
ed L
abou
r
Fam
ily
co
st (
rs.)
Hir
ed c
ost
(R
s.)
To
tal
Co
st (
Rs.
)
Fam
ily
Lab
ou
r
Hir
ed L
abou
r
Co
st (
Rs)
To
tal
Co
st
Fam
ily
Lab
ou
r
Hir
ed L
abou
r
Fam
ily
co
st (
Rs)
Hir
ed c
ost
(R
s.)
To
tal
cost
(R
s.)
1 Weeding &
Cleaning
1
4 30
0
12
00
15
00 1
4 30
0
12
00
15
00 1
4 30
0
12
00
15
00
2 Basin
Preparation
1
6 30
0
18
00
21
00 1
6 30
0
18
00
21
00 1
6 30
0
18
00
21
00
3 FYM &
Fertilizer
Application
1
4 30
0
12
00
15
00 1
4 30
0
12
00
15
00 1
4 30
0
12
00
15
00
4 Pesticide &
Other
Sprays
1 2 30
0
60
0
90
0
1 2 30
0
60
0
90
0
1 3 30
0
90
0
12
00
5 Irrigation 1
3 30
0
90
0
12
00 2
3 60
0
90
0
15
00 2
3 60
0
90
0
15
00
6 Other
Intercultural
Operation
like pruning
etc.
1
3 30
0
90
0
12
00
1
3 30
0
90
0
12
00
1
3 30
0
90
0
12
00
7. Harvesting
and other
cost
0
1 0
30
0
30
0 0
1 0
30
0
30
0 0
1.5 0
55
0
55
0
Total Cost
18
00
69
00
87
00
21
00
69
00
90
00
21
00
74
50
95
50
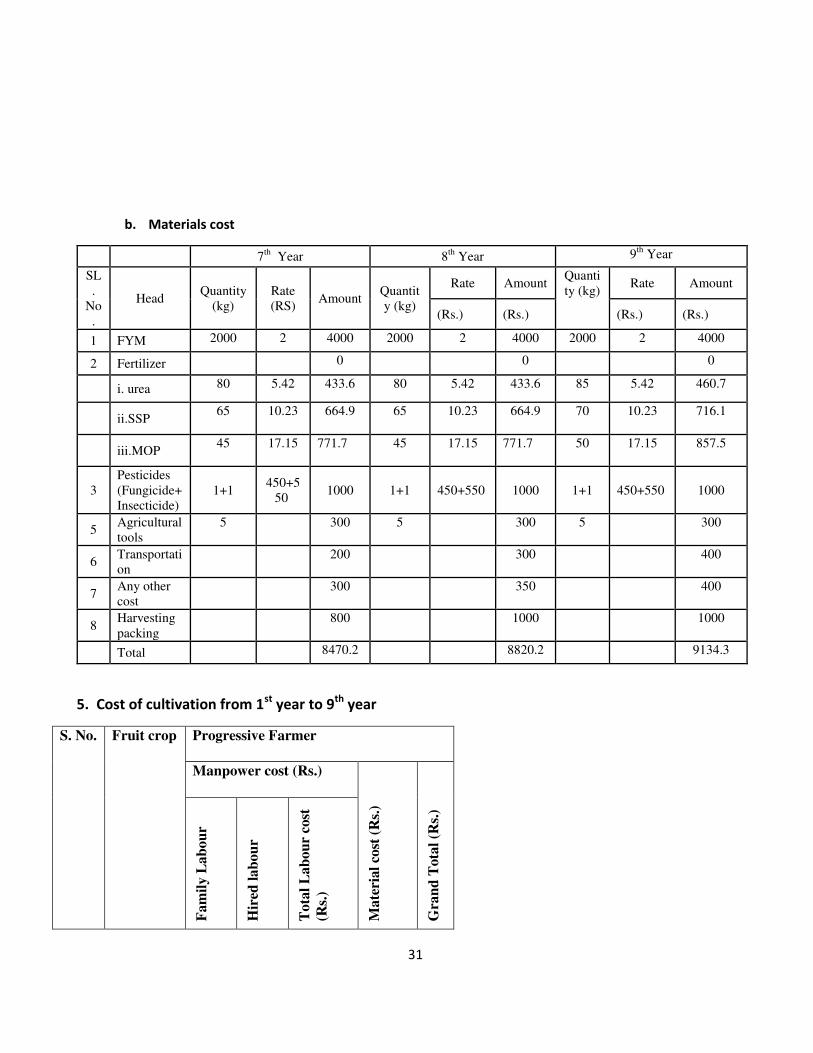
31
b. Materials cost
7th
Year 8th
Year 9th
Year
SL
.
No
.
Head Quantity
(kg)
Rate
(RS) Amount
Quantit
y (kg)
Rate Amount Quanti
ty (kg) Rate Amount
(Rs.) (Rs.) (Rs.) (Rs.)
1 FYM 2000 2 4000 2000 2 4000 2000 2 4000
2 Fertilizer 0 0 0
i. urea 80 5.42 433.6 80 5.42 433.6 85 5.42 460.7
ii.SSP 65 10.23 664.9 65 10.23 664.9 70 10.23 716.1
iii.MOP 45 17.15 771.7
45 17.15 771.7
50 17.15 857.5
3
Pesticides
(Fungicide+
Insecticide)
1+1 450+5
50 1000 1+1 450+550 1000 1+1 450+550 1000
5 Agricultural
tools
5 300 5 300 5 300
6 Transportati
on
200 300 400
7 Any other
cost
300 350 400
8 Harvesting
packing
800 1000 1000
Total 8470.2 8820.2 9134.3
5. Cost of cultivation from 1st
year to 9th
year
S. No. Fruit crop Progressive Farmer
Manpower cost (Rs.)
Ma
teri
al
cost
(R
s.)
Gra
nd
Tota
l (R
s.)
Fam
ily
La
bo
ur
Hir
ed l
ab
ou
r
Tota
l L
ab
ou
r co
st
(Rs.
)

32
1. Ber Var
Seb
(Apple)
20
25
0
59
20
0
79
45
0
79
53
2.6
15
89
82
.6
6. Cost of grafted plants production
S. No Head 5th
Year 6th
Year 7th
Year 8th
Year 9th
Year
1. Numbers of ber seed and
seedling raising
2000 3000 5000 5000 5000
2. Cost of root stock raising 3500 4000 7000 7000 7000
3. Cost of Scion collection and
Grafting
6500 9500 20000 20000 20000
4. Cost of Nursery management 2000 3500 6000 6000 6000
Total (Rs.) 12000 17000 33000 33000 33000
7. Return
4th Year 5th
Year 6th
Year 7th
Year 8th
Year 9th
Year
No. Head
1 Total Production of ber
fruit/ha 1000 1600 3000 4000 4400 6000
2 Total Production of grafted
plants 0 2000 3000 5000 5000 5000
3 Total sale of fruits (Rs.) @
Rs.30/Kg 30000 48000 90000 120000 132000 180000
4 Total sale of plants (Rs.) @
Rs. 25/plant 0 50000 75000 125000 125000 125000
Total return (Rs.) 30000 98000 165000 245000 257000 305000
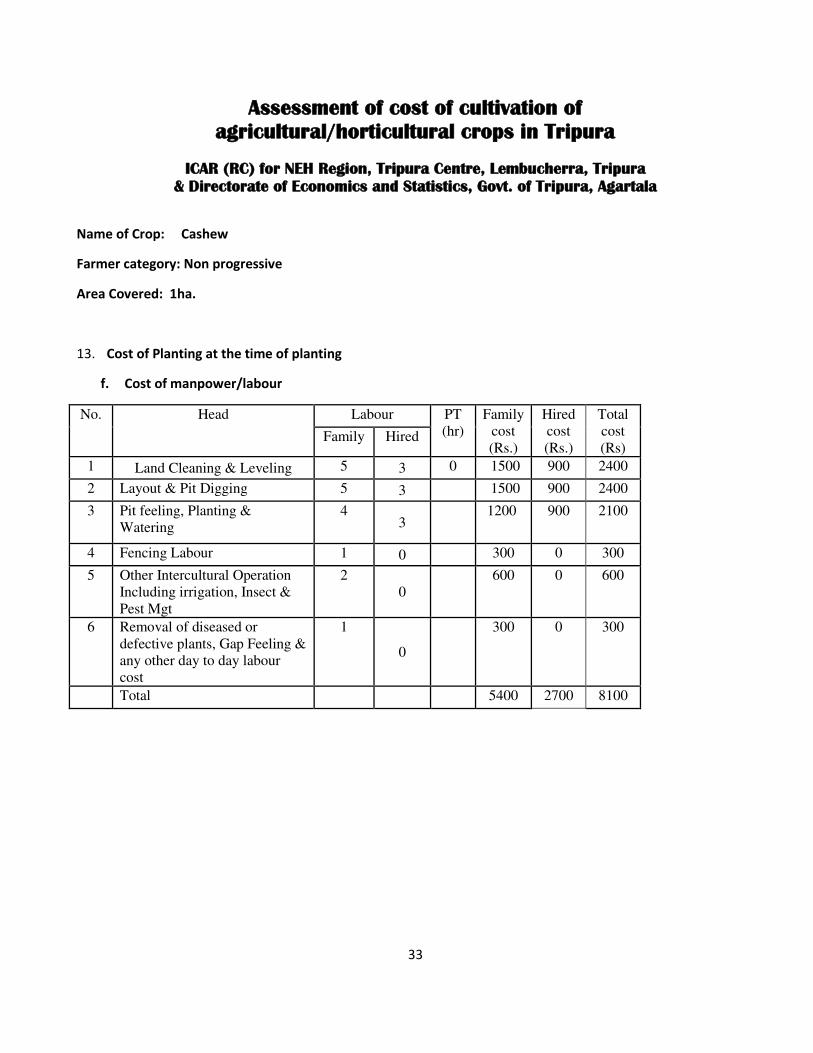
33
Assessment of cost of cultivation of
agricultural/horticultural crops in Tripura
ICAR (RC) for NEH Region, Tripura Centre, Lembucherra, Tripura
& Directorate of Economics and Statistics, Govt. of Tripura, Agartala
Name of Crop: Cashew
Farmer category: Non progressive
Area Covered: 1ha.
13. Cost of Planting at the time of planting
f. Cost of manpower/labour
No. Head Labour PT
(hr)
Family
cost
(Rs.)
Hired
cost
(Rs.)
Total
cost
(Rs) Family Hired
1 Land Cleaning & Leveling 5 3 0 1500 900 2400
2 Layout & Pit Digging 5 3 1500 900 2400
3 Pit feeling, Planting &
Watering
4 3
1200 900 2100
4 Fencing Labour 1 0 300 0 300
5 Other Intercultural Operation
Including irrigation, Insect &
Pest Mgt
2
0
600 0 600
6 Removal of diseased or
defective plants, Gap Feeling &
any other day to day labour
cost
1
0
300 0 300
Total 5400 2700 8100
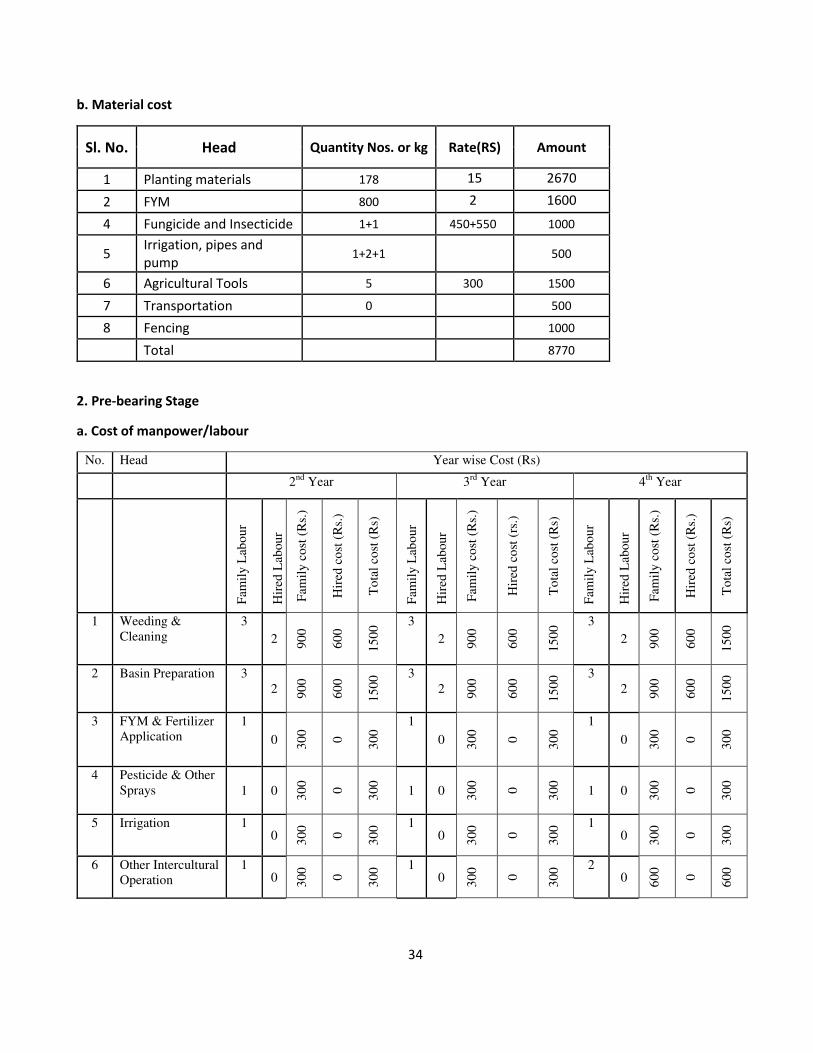
34
b. Material cost
Sl. No. Head Quantity Nos. or kg Rate(RS) Amount
1 Planting materials 178 15 2670
2 FYM 800 2 1600
4 Fungicide and Insecticide 1+1 450+550 1000
5 Irrigation, pipes and
pump 1+2+1 500
6 Agricultural Tools 5 300 1500
7 Transportation 0 500
8 Fencing
1000
Total 8770
2. Pre-bearing Stage
a. Cost of manpower/labour
No. Head Year wise Cost (Rs)
2nd
Year 3rd
Year 4th
Year
Fam
ily
Lab
ou
r
Hir
ed L
abou
r
Fam
ily
co
st (
Rs.
)
Hir
ed c
ost
(R
s.)
To
tal
cost
(R
s)
Fam
ily
Lab
ou
r
Hir
ed L
abou
r
Fam
ily
co
st (
Rs.
)
Hir
ed c
ost
(rs
.)
To
tal
cost
(R
s)
Fam
ily
Lab
ou
r
Hir
ed L
abou
r
Fam
ily
co
st (
Rs.
)
Hir
ed c
ost
(R
s.)
To
tal
cost
(R
s)
1 Weeding &
Cleaning
3
2 90
0
60
0
15
00 3
2 90
0
60
0
15
00 3
2 90
0
60
0
15
00
2 Basin Preparation 3
2 90
0
60
0
15
00 3
2 90
0
60
0
15
00 3
2 90
0
60
0
15
00
3 FYM & Fertilizer
Application
1
0 30
0
0
30
0 1
0 30
0
0
30
0 1
0 30
0
0
30
0
4 Pesticide & Other
Sprays 1 0 30
0
0
30
0
1 0 30
0
0
30
0
1 0 30
0
0
30
0
5 Irrigation 1 0 3
00
0
30
0 1
0 30
0
0
30
0 1
0 30
0
0
30
0
6 Other Intercultural
Operation
1 0 3
00
0
30
0 1
0 30
0
0
30
0 2
0 60
0
0
60
0

35
7 Any Other
Cost(harvesting)
10
0
0
10
0
20
0
0
20
0
30
0
0
30
0
8 Total Cost
31
00
12
00
43
00
32
00
12
00
44
00
36
00
12
00
48
00
b. Material Cost
2nd
Year 3rd
Year 4th
Year
SL.
No. Head
Quantity
(kg)
Rate
(Rs.)
Amount
(Rs.)
Quantity
(kg)
Rate
(RS)
(Rs.)
Amount
(Rs.)
Quantity
(kg)
Rate
(RS)
(Rs.)
Amount
(Rs.)
1 FYM 800 2 1600 800 2 1600 800 2 1600
2 Fertilizer
0 0 0 0
i. Urea 10 5.42 54.2 10 5.42 54.2 10 5.42 54.2
ii. SSP 10 10.23 102.3 10 10.23 102.3 10 10.23 102.3
iii. MOP 8 17.15 137.2 8 17.15 137.2 8 17.15 137.2
3 Pesticides
(Fungicide+Insecticide) 0.5+0.5 225+275 500 0.5+0.5 225+275 500 0.5+0.5 225+275 500
5 Agricultural tools 5 100 500 5 100 500 5 100 500
7 Transportation 100 100 100 100 100 100
8. Other costs like fencing
etc. 1000 1000
1000 1000 1000 1000
Total 3993.7 3993.7 3993.7
3. Bearing Stage
a. Cost of manpower/labour
No. Head Year wise Cost (Rs)
5th
Year 6th
Year 7th
Year
Fam
ily
Lab
ou
r
Hir
ed L
abou
r
Fam
ily
co
st (
Rs.
)
Hir
ed c
ost
(R
s.)
To
tal
cost
(R
s.)
Fam
ily
Lab
ou
r
Hir
ed L
abou
r
Fam
ily
co
st (
Rs.
)
Hir
ed c
ost
(R
s.)
To
tal
cost
(R
s.)
Fam
ily
Lab
ou
r
Hir
ed L
abou
r
Fam
ily
co
st (
Rs.
)
Hir
ed c
ost
(R
s.)
To
tal
cost
(R
s.)
1 Weeding &
Cleaning
3
2 90
0
60
0
15
00 3
2 90
0
60
0
15
00 3
2 90
0
60
0
15
00
2 Basin
Preparation
3
2 90
0
60
0
15
00 3
2 90
0
60
0
15
00 3
2 90
0
60
0
15
00

36
3 FYM &
Fertilizer
Application
1
0 30
0
0
30
0 1
0 30
0
0
30
0 1
0 30
0
0
30
0
4 Pesticide &
Other
Sprays
1 0 30
0
0
30
0
1 0 30
0
0
30
0
1 0 30
0
0
30
0
5 Irrigation 1 0 3
00
0
30
0 1
0 30
0
0
30
0 1
1 30
0
30
0
60
0
6 Other
Intercultural
Operation
like pruning
etc.
2
0 60
0
0
60
0
2
0 60
0
0
60
0
2
0 60
0
0
60
0
7. Harvesting 3
00
0
30
0
30
0
0
30
0 1
1 30
0
30
0
30
0
Total Cost
36
00
12
00
48
00
36
00
12
00
48
00
36
00
18
00
51
00
b. Material cost
5th
Year 6th
Year 7th
Year
SL
.
No
.
Head Quantity
(kg)
Rate
(RS) Amount
Quantit
y (kg)
Rate Amount Quanti
ty (kg) Rate Amount
(Rs.) (Rs.) (Rs.) (Rs.)
1 FYM 800 2 1600 1000 2 2000 1000 2 2000
2 Fertilizer 0 0 0
i. Urea 10 5.42 54.2 18 5.42 97.6 18 5.42 97.6
ii.SSP 10 10.23 102.3 18 10.23 184.1 18 10.23 184.1
iii.MOP 8 17.15 137.2 10 17.15 171.5 10 17.15 171.5
3
Pesticides
(Fungicide+
Insecticide)
0.5+0.5 225+
275 500 0.5+1 225+550 775 0.5+1 225+550 775
5 Agricultural
tools
2 100 200 3 100 300 3 100 300
6 Transportati
on
100 100 100 100
7 Any other
cost
500 500 300 300
8 Harvesting
packing 300
400 500
9 Total 3493.7 4328.2 4428.2
c. Cost of manpower/labour

37
No. Head Year wise Cost (Rs)
8th
Year 9th
Year 10th
Year
Fam
ily
Lab
ou
r
Hir
ed L
abou
r
Fam
ily
co
st (
Rs.
)
Hir
ed c
ost
(R
s.)
To
tal
cost
(R
s)
Fam
ily
Lab
ou
r
Hir
ed L
abou
r
Fam
ily
co
st (
Rs.
)
Hir
ed c
ost
(R
s.)
To
tal
cost
(R
s)
Fam
ily
Lab
ou
r
Hir
ed L
abou
r
Fam
ily
co
st (
Rs.
)
Hir
ed c
ost
(R
s.)
To
tal
cost
(R
s)
1 Weeding &
Cleaning
3 2 9
00
60
0
15
00 3
2 90
0
60
0
15
00 3
2 90
0
60
0
15
00
2 Basin
Preparation
3
2 90
0
60
0
15
00 3
2 90
0
60
0
15
00 3
2 90
0
60
0
15
00
3 FYM &
Fertilizer
Application
1
0 30
0
0
30
0 1
0 30
0
0
30
0 1
0 30
0
0
30
0
4 Pesticide &
Other
Sprays
1 0 30
0
0
30
0
1 0 30
0
0
30
0
1 0 30
0
0
30
0
5 Irrigation 1 1 3
00
30
0
60
0 1
1 30
0
30
0
60
0 1
1 30
0
30
0
60
0
6 Other
Intercultural
Operation
like pruning
etc.
2
0 60
0
0
60
0
2
0 60
0
0
60
0
2
2 60
0
60
0
12
00
7. Harvesting 1
1 30
0
30
0
30
0 1.5
2 55
0
60
0
11
50 1.5
2 55
0
60
0
11
50
Total Cost
36
00
18
00
51
00
38
50
21
00
59
50
38
50
27
00
65
50
d. Material cost
8th
Year 9th
Year 10th
Year
SL
.
No
.
Head Quantity
(kg)
Rate
(RS) Amount
Quantit
y (kg)
Rate Amount Quanti
ty (kg) Rate Amount
(Rs.) (Rs.) (Rs.) (Rs.)
1 FYM 1500 2 3000 1500 2 3000 1500 2 3000
2 Fertilizer 0 0 0
i. Urea 18 5.42 97.6 18 5.42 97.6 18 5.42 97.6
ii.SSP 18 10.23 184.1 18 10.23 184.1 18 10.23 184.1
iii.MOP 10 17.15 171.5 10 17.15 171.5 10 17.15 171.5

38
3
Pesticides
(Fungicide+
Insecticide)
0.5+0.5 225+
275 500 0.5+0.5 225+275 500
0.5+0.
5 225+275 500
5 Agricultural
tools 2 100 200
3 100 300 3 300
6 Transportati
on 200
200 600
7 Any other
cost 300
300 500
8 Harvesting
packing 400
500 800
9 Total 5053.2 5253.2 6153.2
4. Cost of cultivation from 1st
year to 10th
year
S. No.
Fruit crop Non Progressive Farmer
Manpower cost
(Rs.)
Mate
rial
cost
(R
s.)
Gra
nd
Tota
l (R
s.)
Fam
ily L
ab
ou
r
Hir
ed l
ab
ou
r
Tota
l L
ab
ou
r co
st
(Rs.
)
1. Cashewnut
37400
17100
54500
49460.8
103960.8
5. Return
No. Head
5th
Yea
r
6th
Yea
r
7th
Yea
r
8th
Yea
r
9th
Yea
r
10
th Y
ear
11
th Y
ear
12
th Y
ear
13
th Y
ear
14
th Y
ear
15
th y
ear
1 Total
Production
of nuts
(Kg/tree)
2 3 4 4 4 5 5 5 5 6 6
2 Total
Production
(kg/ha)
356
534 712 712 712 890 890 890 890 1068 1068

39
Total
Amount
(Rs) @ Rs.
35/kg
12460
18690 24920 24920 31150 31150 31150 37380 37380 43610 43610
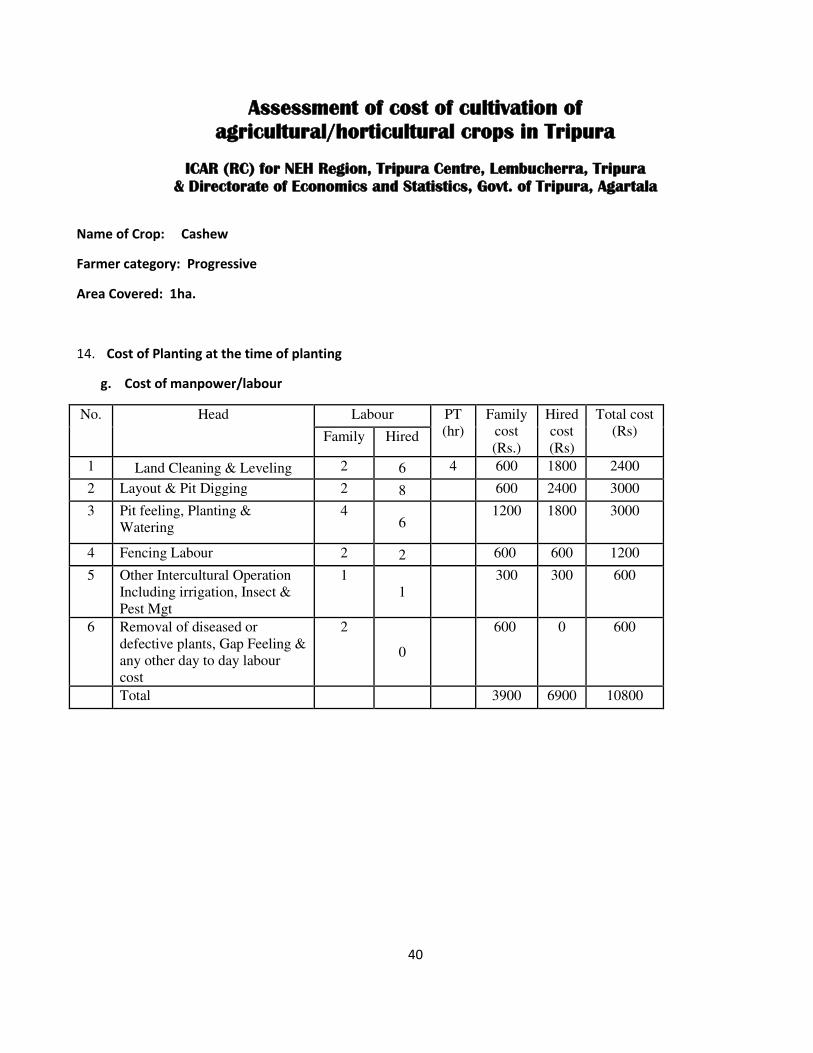
40
Assessment of cost of cultivation of
agricultural/horticultural crops in Tripura
ICAR (RC) for NEH Region, Tripura Centre, Lembucherra, Tripura
& Directorate of Economics and Statistics, Govt. of Tripura, Agartala
Name of Crop: Cashew
Farmer category: Progressive
Area Covered: 1ha.
14. Cost of Planting at the time of planting
g. Cost of manpower/labour
No. Head Labour PT
(hr)
Family
cost
(Rs.)
Hired
cost
(Rs)
Total cost
(Rs) Family Hired
1 Land Cleaning & Leveling 2 6 4 600 1800 2400
2 Layout & Pit Digging 2 8 600 2400 3000
3 Pit feeling, Planting &
Watering
4 6
1200 1800 3000
4 Fencing Labour 2 2 600 600 1200
5 Other Intercultural Operation
Including irrigation, Insect &
Pest Mgt
1
1
300 300 600
6 Removal of diseased or
defective plants, Gap Feeling &
any other day to day labour
cost
2
0
600 0 600
Total 3900 6900 10800

41
b. Material cost
Sl. No. Head Quantity Nos. or kg Rate(RS) Amount
1 Planting materials 178 15 2670
2 FYM 800 2 1600
4 Fungicide and Insecticide 1+1 450+550 1000
5 Irrigation, pipes and
pump 1+3+1 6000
6 Agricultural Tools 5 300 1500
7 Transportation 0 500
8 Fencing
3000
Total 16270
2. Pre-bearing Stage
a. Cost of manpower/labour
No. Head Year wise Cost (Rs)
2nd
Year 3rd
Year 4th
Year
Fam
ily
Lab
ou
r
Hir
ed L
abou
r
Fam
ily
co
st (
Rs.
)
Hir
ed c
ost
(R
s.)
To
tal
cost
(R
s)
Fam
ily
Lab
ou
r
Hir
ed L
abou
r
Fam
ily
co
st (
Rs.
)
Hir
ed c
ost
(R
s.)
To
tal
cost
(R
s)
Fam
ily
Lab
ou
r
Hir
ed L
abou
r
Fam
ily
co
st (
Rs.
)
Hir
ed c
ost
(R
s.)
To
tal
cost
(R
s)
1 Weeding &
Cleaning
2
3 60
0
90
0
15
00 2
3 60
0
90
0
15
00 2
3
600 900 1500
2 Basin
Preparation
2
3 60
0
90
0
15
00 2
3 60
0
90
0
15
00 2
4
600 1200 1800
3 FYM &
Fertilizer
Application
1
1 30
0
30
0
60
0 1
1 30
0
30
0
60
0 1
2
300 600 900
4 Pesticide &
Other Sprays 1 1 30
0
30
0
60
0 1
1 30
0
30
0
60
0 2
1 600 300 900
5 Irrigation 1 1 3
0 0
30 0
60 0 1
1 30 0
30 0
60 0 1
2 300 600 900
6 Other
Intercultural
Operation
1
1 30
0
30
0
60
0 1
2 30
0
60
0
90
0 2
2
600 600 1200
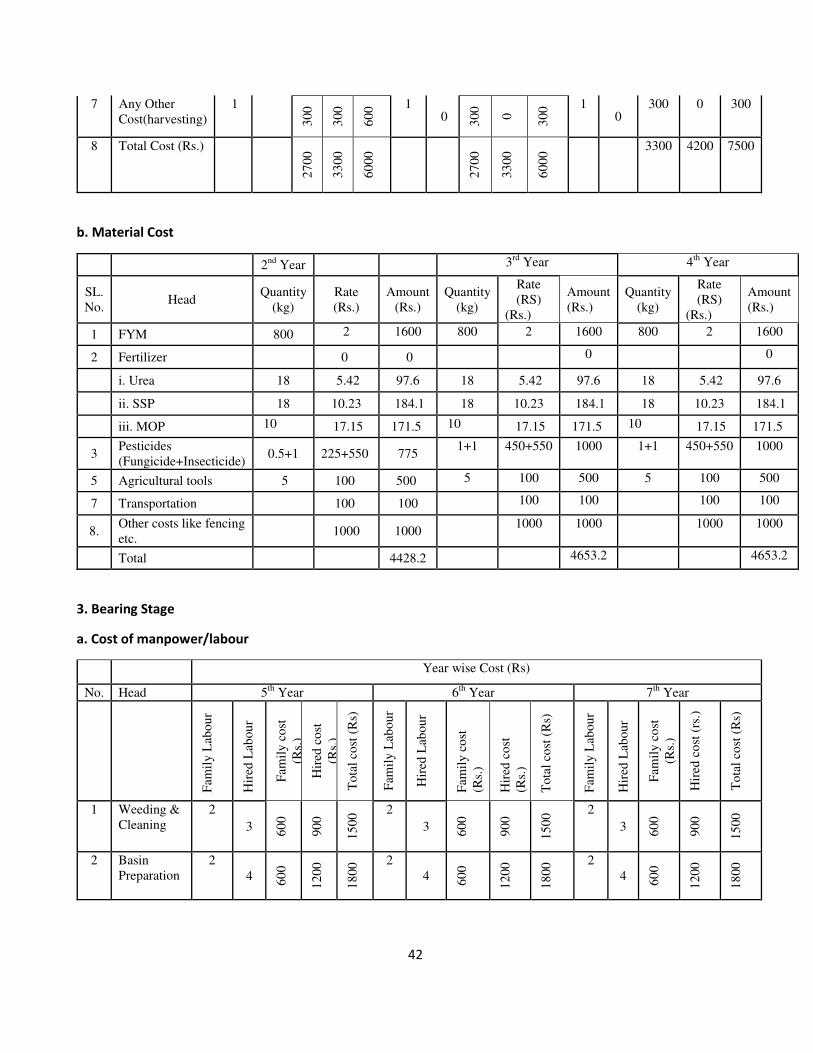
42
7 Any Other
Cost(harvesting)
1 3
00
30
0
60
0 1
0 30
0
0
30
0 1
0 300 0 300
8 Total Cost (Rs.)
27
00
33
00
60
00
27
00
33
00
60
00 3300 4200 7500
b. Material Cost
2nd
Year 3rd
Year 4th
Year
SL.
No. Head
Quantity
(kg)
Rate
(Rs.)
Amount
(Rs.)
Quantity
(kg)
Rate
(RS)
(Rs.)
Amount
(Rs.)
Quantity
(kg)
Rate
(RS)
(Rs.)
Amount
(Rs.)
1 FYM 800 2 1600 800 2 1600 800 2 1600
2 Fertilizer
0 0 0 0
i. Urea 18 5.42 97.6 18 5.42 97.6 18 5.42 97.6
ii. SSP 18 10.23 184.1 18 10.23 184.1 18 10.23 184.1
iii. MOP 10 17.15 171.5 10 17.15 171.5 10 17.15 171.5
3 Pesticides
(Fungicide+Insecticide) 0.5+1 225+550 775
1+1 450+550 1000 1+1 450+550 1000
5 Agricultural tools 5 100 500 5 100 500 5 100 500
7 Transportation 100 100 100 100 100 100
8. Other costs like fencing
etc. 1000 1000
1000 1000 1000 1000
Total 4428.2 4653.2 4653.2
3. Bearing Stage
a. Cost of manpower/labour
Year wise Cost (Rs)
No. Head 5th
Year 6th
Year 7th
Year
Fam
ily
Lab
ou
r
Hir
ed L
abou
r
Fam
ily
co
st
(Rs.
)
Hir
ed c
ost
(Rs.
)
To
tal
cost
(R
s)
Fam
ily
Lab
ou
r
Hir
ed L
abou
r
Fam
ily
co
st
(Rs.
)
Hir
ed c
ost
(Rs.
)
To
tal
cost
(R
s)
Fam
ily
Lab
ou
r
Hir
ed L
abou
r
Fam
ily
co
st
(Rs.
)
Hir
ed c
ost
(rs
.)
To
tal
cost
(R
s)
1 Weeding &
Cleaning
2
3 60
0
90
0
15
00 2
3 60
0
90
0
15
00 2
3 60
0
90
0
15
00
2 Basin
Preparation
2
4 60
0
12
00
18
00 2
4 60
0
12
00
18
00 2
4 60
0
12
00
18
00

43
3 FYM &
Fertilizer
Application
1
2 30
0
60
0
90
0 1
2 30
0
60
0
90
0 1
2 30
0
60
0
90
0
4 Pesticide &
Other
Sprays
2
1 60
0
30
0
90
0
2
1 60
0
30
0
90
0
2
1 60
0
30
0
90
0
5 Irrigation 1
2 30
0
60
0
90
0 1
3 30
0
90
0
12
00 1
3 30
0
90
0
12
00
6 Other
Intercultural
Operation
like pruning
etc.
2
2 60
0
60
0
12
00
2
2 60
0
60
0
12
00
2
2 60
0
60
0
12
00
7. Other cost
and
Harvesting
1
0 30
0
0
30
0 1
0 30
0
0
30
0 1
0 30
0
0
30
0
Total Cost
33
00
42
00
75
00
33
00
45
00
78
00
33
00
45
00
78
00
b. Material cost
5th
Year 6th
Year 7th
Year
SL
.
No
.
Head Quantity
(kg)
Rate
(RS) Amount
Quantit
y (kg)
Rate Amount Quanti
ty (kg) Rate Amount
(Rs.) (Rs.) (Rs.) (Rs.)
1 FYM 1500 2 3000 1500 2 3000 1500 2 3000
2 Fertilizer 0 0 0
i. Urea 18 5.42 97.6 18 5.42 97.6 22 5.42 119.2
ii.SSP 18 10.23 184.1 18 10.23 184.1 22 10.23 225.1
iii.MOP 10 17.15 171.5 10 17.15 171.5 15 17.15 257.3
3
Pesticides
(Fungicide+
Insecticide)
0.5+1 225+
550 775 0.5+1 225+550 775
1+2 450+550 1550
5 Agricultural
tools 3 100 300
3 100 300 3 300
6 Transportati
on 100
100 100
7 Any other
cost 300
300 300
8 Harvesting
packing 400
500 500
9 Total 5328.2 5428.2 6351.6

44
c. Cost of manpower/labour
No. Head Year wise Cost (Rs)
8th
Year 9th
Year 10th
Year
Fam
ily
Lab
ou
r
Hir
ed L
abou
r
Fam
ily
co
st
(Rs.
)
Hir
ed c
ost
(R
s.)
To
tal
cost
(R
s.)
Fam
ily
Lab
ou
r
Hir
ed L
abou
r
Fam
ily
co
st
(rs.
)
Hir
ed c
ost
(rs
.)
To
tal
cost
(R
s)
Fam
ily
Lab
ou
r
Hir
ed L
abou
r
Fam
ily
co
st
(rs.
)
Hir
ed c
ost
(rs
.)
To
tal
cost
(R
s)
1 Weeding &
Cleaning
2
3 60
0
90
0
15
00 2
3 60
0
90
0
15
00 2
3 60
0
90
0
15
00
2 Basin
Preparation
2
4 60
0
12
00
18
00 2
4 60
0
12
00
18
00 2
5 60
0
15
00
21
00
3 FYM &
Fertilizer
Application
2
2 60
0
60
0
12
00 2
2 60
0
60
0
12
00 2
3 60
0
60
0
12
00
4 Pesticide &
Other
Sprays
2
1 60
0
30
0
90
0 2
1 60
0
30
0
90
0 2
1 60
0
30
0
90
0
5 Irrigation 1
3 30
0
90
0
12
00 1
3 30
0
90
0
12
00 1
3 30
0
90
0
12
00
6 Other
Intercultural
Operation
like pruning
etc.
2
3 60
0
90
0
18
00
2
3 60
0
90
0
18
00
2
3 60
0
90
0
18
00
7. Harvesting 1
1 30
0
30
0
60
0
1
1 30
0
30
0
60
0
1
1 30
0
30
0
60
0
Total Cost
36
00
51
00
90
00
36
00
51
00
90
00
36
00
54
00
93
00
b. Material cost
8th
Year 9th
Year 10th
Year
SL
.
No
.
Head Quantity
(kg)
Rate
(RS) Amount
Quantit
y (kg)
Rate Amount Quanti
ty (kg) Rate Amount
(Rs.) (Rs.) (Rs.) (Rs.)
1 FYM 1500 2 3000 1500 2 3000 1500 2 3000

45
2 Fertilizer 0 0 0
i. Urea 22 5.42 119.2 22 5.42 119.2 22 5.42 119.2
ii.SSP 22 10.23 225.1 22 10.23 225.1 22 10.23 225.1
iii.MOP 15 17.15 257.3 15 17.15 257.3 15 17.15 257.3
3
Pesticides
(Fungicide+
Insecticide)
1+2 450+
550
1550 1+2 450+550 1550 1+2 450+550 1550
5 Agricultural
tools 3 100 300
3 100 300 3 300
6 Transportati
on 200
200 1000
7 Any other
cost 300
300 500
8 Harvesting
packing 400
500 1000
9 Total 6351.6 6451.6 7951.6
4. Cost of cultivation from 1st
year to 10th
year
S. No.
Fruit crop Progressive Farmer
Manpower cost (Rs.)
Mate
rial
cost
(R
s.)
Gra
nd
Tota
l (R
s.)
Fam
ily L
ab
ou
r
Hir
ed l
ab
ou
r
Tota
l L
ab
ou
r co
st
(Rs.
)
1. Cashewnut
33300
46500
79800
67867.4
147667
.4
5. Return
No. Head
5th
Yea
r
6th
Yea
r
7th
Yea
r
8th
Yea
r
9th
Yea
r
10
th
Yea
r
11
th
Yea
r
12
th
Yea
r
13
th
Yea
r
14
th
Yea
r
15
th
yea
r
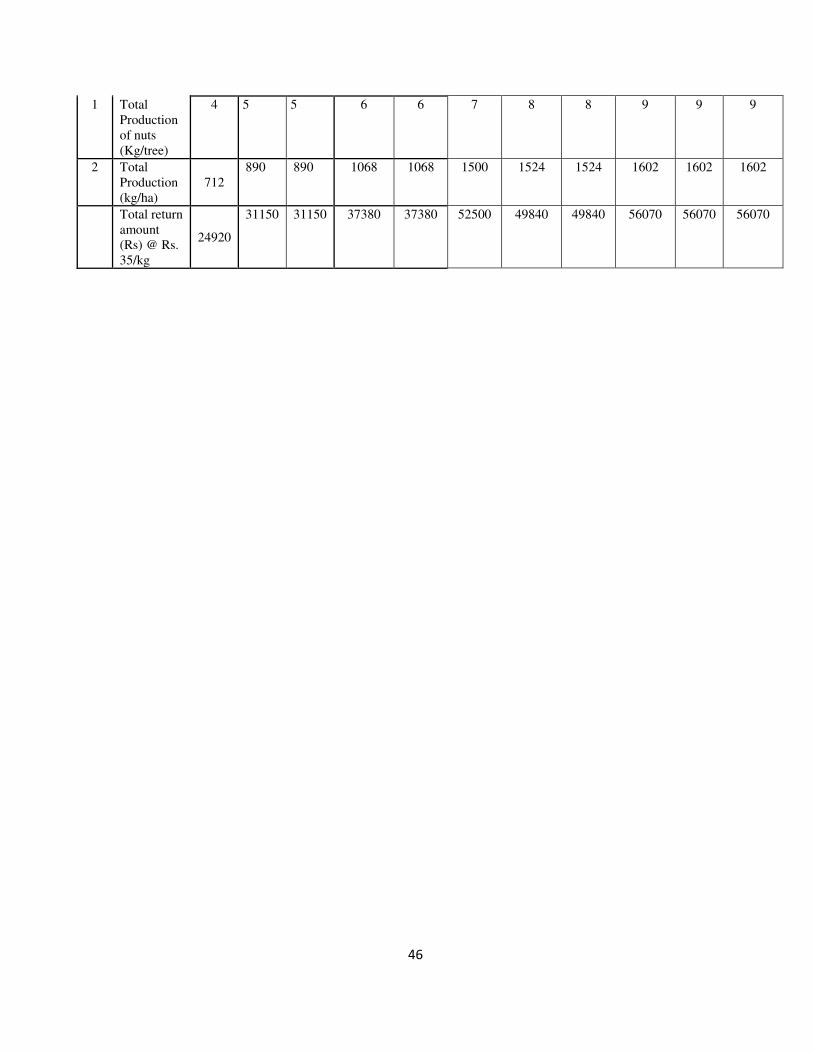
46
1 Total
Production
of nuts
(Kg/tree)
4 5 5 6 6 7 8 8 9 9 9
2 Total
Production
(kg/ha)
712
890 890 1068 1068 1500 1524 1524 1602 1602 1602
Total return
amount
(Rs) @ Rs.
35/kg
24920
31150 31150 37380 37380 52500 49840 49840 56070 56070 56070

47
Assessment of cost of cultivation of
agricultural/horticultural crops in Tripura
ICAR (RC) for NEH Region, Tripura Centre, Lembucherra, Tripura
& Directorate of Economics and Statistics, Govt. of Tripura, Agartala
Name of Crop: Guava
Farmer category: Non progressive
Area: 1 ha.
1. Cost of first year of Planting
a. Cost of manpower/labour
No. Head Labour PT
(hr)
Family
cost
(Rs.)
Hired
cost
(Rs.)
Total
cost
(Rs) Family Hired
1 Land Cleaning & Leveling 4 3 0 1200 900 2100
2 Layout & Pit Digging 4 4 1200 1200 2400
3 Pit feeling, Planting &
Watering
4 2
1200 600 1800
4 Fencing Labour 3 2 900 600 1500
5 Other Interculture Operation
Including Insect & Pest Mgt
3 1
900 300 1200
6 Gap Feeling & any other day to
day labour cost
1 0
300 0 300
Total 5700 3600 9300
b. Material cost
Sl. No. Head Quantity Rate(RS
Amount
(Rs)
1 Planting materials 600 20 12000
2 FYM 600 2 1200
3 Fertilizer --- -- 0
i. UREA ---- --- 0
ii. SSP 0
iii, MOP 0
4 Fungicide and
Insecticide 0
0
5 Agricultural Tools 3 300 300
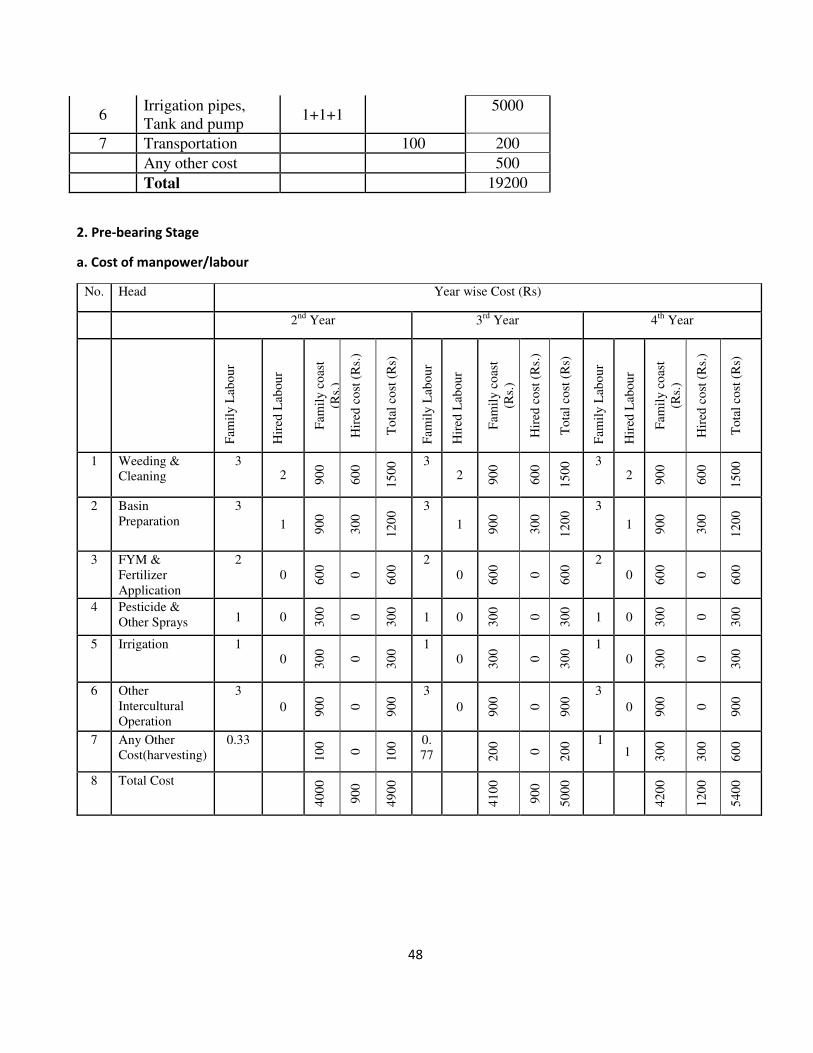
48
6 Irrigation pipes,
Tank and pump 1+1+1
5000
7 Transportation 100 200
Any other cost 500
Total 19200
2. Pre-bearing Stage
a. Cost of manpower/labour
No. Head Year wise Cost (Rs)
2nd
Year 3rd
Year 4th
Year
Fam
ily
Lab
ou
r
Hir
ed L
abou
r
Fam
ily
co
ast
(Rs.
)
Hir
ed c
ost
(R
s.)
To
tal
cost
(R
s)
Fam
ily
Lab
ou
r
Hir
ed L
abou
r
Fam
ily
co
ast
(Rs.
)
Hir
ed c
ost
(R
s.)
To
tal
cost
(R
s)
Fam
ily
Lab
ou
r
Hir
ed L
abou
r
Fam
ily
co
ast
(Rs.
)
Hir
ed c
ost
(R
s.)
To
tal
cost
(R
s)
1 Weeding &
Cleaning
3 2 9
00
60
0
15
00 3
2 90
0
60
0
15
00 3
2 90
0
60
0
15
00
2 Basin
Preparation
3
1 90
0
30
0
12
00 3
1 90
0
30
0
12
00 3
1 90
0
30
0
12
00
3 FYM &
Fertilizer
Application
2
0 60
0
0
60
0 2
0 60
0
0
60
0 2
0 60
0
0
60
0
4 Pesticide &
Other Sprays 1 0 30
0
0
30
0
1 0 30
0
0
30
0
1 0 30
0
0
30
0
5 Irrigation 1 0 3
00
0
30
0 1
0 30
0
0
30
0 1
0 30
0
0
30
0
6 Other
Intercultural
Operation
3
0 90
0
0
90
0 3
0 90
0
0
90
0 3
0 90
0
0
90
0
7 Any Other
Cost(harvesting)
0.33 1
00
0
10
0 0.
77 20
0
0
20
0 1
1 30
0
30
0
60
0
8 Total Cost
40
00
90
0
49
00
41
00
90
0
50
00
42
00
12
00
54
00

49
b. Material Cost
2nd
Year 3rd
Year 4th
Year
SL.
No. Hea
d
Qu
anti
ty
(kg
)
Rat
e
(Rs.
)
Am
ou
nt
(Rs.
)
Qu
anti
ty
(kg
)
Rat
e
(RS
)
Am
ou
nt
(Rs.
)
Qu
anti
ty
(kg
)
Rat
e
(RS
)
Am
ou
nt
(Rs.
)
1 FYM 1200 2 2400 1200 2 2400 1200 2 2400
2 Fertilizer
0 0 0 0
i. Urea 10 5.42 54.2 30 5.42 162.6 30 5.42 162.6
ii. SSP 10 10.23 102.3 30 10.23 306.9 30 10.23 306.9
iii. MOP 8 17.15 137.2 12 17.15 205.8 12 17.15 205.8
3
Pesticides
(Fungicide+
Insecticide)
0.5+0.5 225+
275 500
0.5+0.
5
225+
275 500
0.5+0.
5
225+2
75 500
5 Agricultural tools 3 100 300 3 100 300 3 100 300
7 Transportation 100 100 100 100 200 200
8. Other costs like
fencing etc. 200 200
200 200 200 200
Total 3793.7 4175.3 4275.3
3. Full bearing stage
a. Cost of mandays/Labour
No. Head Year wise Cost (Rs)
5nd
Year 6rd
Year
Fam
ily
Lab
ou
r
Hir
ed L
abou
r
Fam
ily
co
st (
Rs.
)
Hir
ed c
ost
(R
s.)
To
tal
cost
(R
s)
F
amil
y L
abo
ur
Hir
ed L
abou
r
Fam
ily
co
st (
Rs.
)
Hir
ed c
ost
(R
s.)
To
tal
cost
(R
s)
1 Weeding &
Cleaning
3
2 90
0
60
0
15
00 3
1 90
0
30
0
12
00
2 Basin
Preparation
3
1 90
0
30
0
12
00 3
2 90
0
60
0
15
00
3 FYM &
Fertilizer
2 0 6
0 0
0
60 0 2
0 60 0
0
60 0
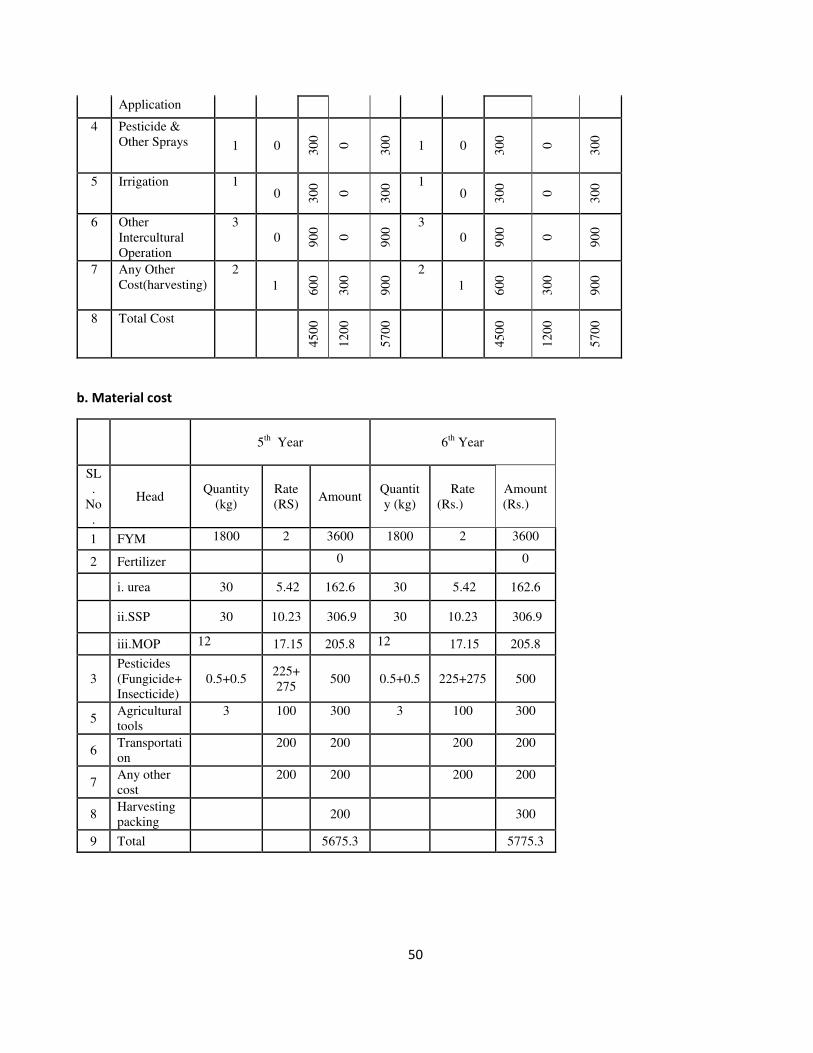
50
Application
4 Pesticide &
Other Sprays 1 0 30
0
0
30
0
1 0 30
0
0
30
0
5 Irrigation 1 0 3
00
0
30
0 1
0 30
0
0
30
0
6 Other
Intercultural
Operation
3
0 90
0
0
90
0 3
0 90
0
0
90
0
7 Any Other
Cost(harvesting)
2
1 60
0
30
0
90
0 2
1 60
0
30
0
90
0
8 Total Cost 4
50
0
12
00
57
00
45
00
12
00
57
00
b. Material cost
5th
Year 6th
Year
SL
.
No
.
Head Quantity
(kg)
Rate
(RS) Amount
Quantit
y (kg)
Rate
(Rs.)
Amount
(Rs.)
1 FYM 1800 2 3600 1800 2 3600
2 Fertilizer 0 0
i. urea 30 5.42 162.6 30 5.42 162.6
ii.SSP 30 10.23 306.9 30 10.23 306.9
iii.MOP 12 17.15 205.8 12 17.15 205.8
3
Pesticides
(Fungicide+
Insecticide)
0.5+0.5 225+
275 500 0.5+0.5 225+275 500
5 Agricultural
tools
3 100 300 3 100 300
6 Transportati
on
200 200 200 200
7 Any other
cost
200 200 200 200
8 Harvesting
packing 200 300
9 Total 5675.3 5775.3
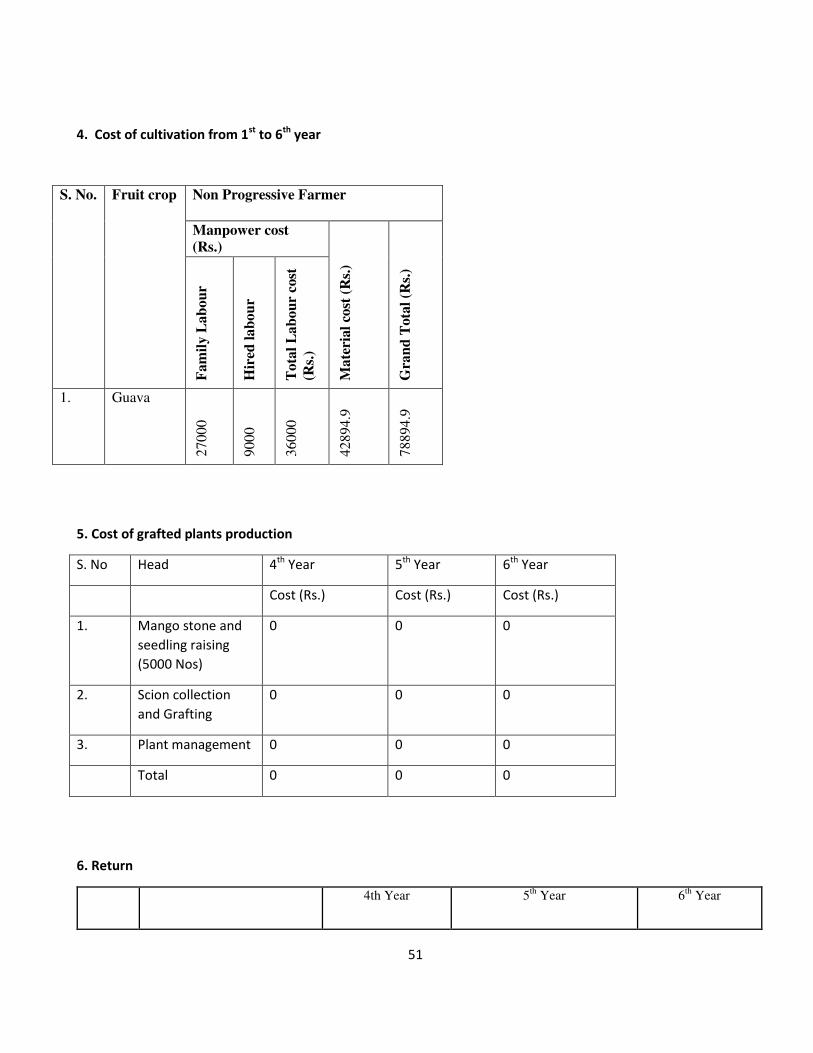
51
4. Cost of cultivation from 1st
to 6th
year
S. No.
Fruit crop Non Progressive Farmer
Manpower cost
(Rs.)
Ma
teri
al
cost
(R
s.)
Gra
nd
Tota
l (R
s.)
Fa
mil
y L
ab
ou
r
Hir
ed l
ab
ou
r
To
tal
La
bo
ur
cost
(Rs.
)
1. Guava
27000
9000
36000
42894.9
78894.9
5. Cost of grafted plants production
S. No Head 4th
Year 5th
Year 6th
Year
Cost (Rs.) Cost (Rs.) Cost (Rs.)
1. Mango stone and
seedling raising
(5000 Nos)
0 0 0
2. Scion collection
and Grafting
0 0 0
3. Plant management 0 0 0
Total 0 0 0
6. Return
4th Year 5th
Year 6th
Year
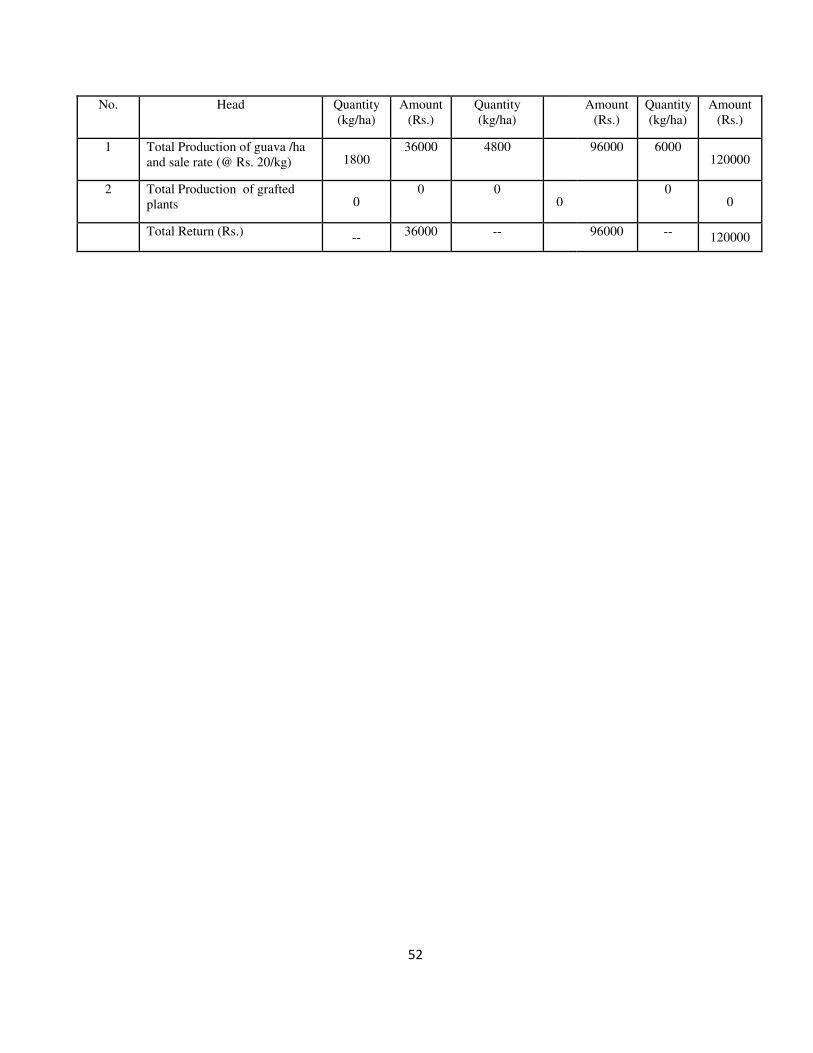
52
No. Head Quantity
(kg/ha)
Amount
(Rs.)
Quantity
(kg/ha)
Amount
(Rs.)
Quantity
(kg/ha)
Amount
(Rs.)
1 Total Production of guava /ha
and sale rate (@ Rs. 20/kg) 1800 36000 4800
96000 6000
120000
2 Total Production of grafted
plants 0 0 0
0 0
0
Total Return (Rs.) --
36000 --
96000 -- 120000

53
Assessment of cost of cultivation of
agricultural/horticultural crops in Tripura
ICAR (RC) for NEH Region, Tripura Centre, Lembucherra, Tripura
& Directorate of Economics and Statistics, Govt. of Tripura, Agartala
Name of Crop: Guava
Farmer category: Progressive
Area : 1 ha.
1. Cost of first year of Planting
a. Cost of manpower/labour
No. Head Labour PT
(hr)
Family
cost
(Rs.)
Hired
cost
(Rs.)
Total
cost
(Rs) Family Hired
1 Land Cleaning & Leveling 2 8 4 600 2400 3000
2 Layout & Pit Digging 2 15 600 4500 5100
3 Pit feeling, Planting &
Watering
2 8
600 2400 3000
4 Fencing Labour 2 4 600 1200 1800
5 Other Interculture Operation
Including Insect & Pest Mgt
1 8
300 2400 2700
6 Gap Feeling & any other day to
day labour cost
1 2
300 600 900
Total 3000 13500 16500
b. Material cost
Sl. No. Head Quantity Rate(Rs.) Amount (Rs.)
1 Planting materials 600 20 12000
2 FYM 1200 2 2400
3 Fertilizer --- -- 0
i. UREA ---- --- 0
ii. SSP 0
iii, MOP 0
4 Fungicide and
Insecticide 2
1000
5 Agricultural Tools 5 500 1500
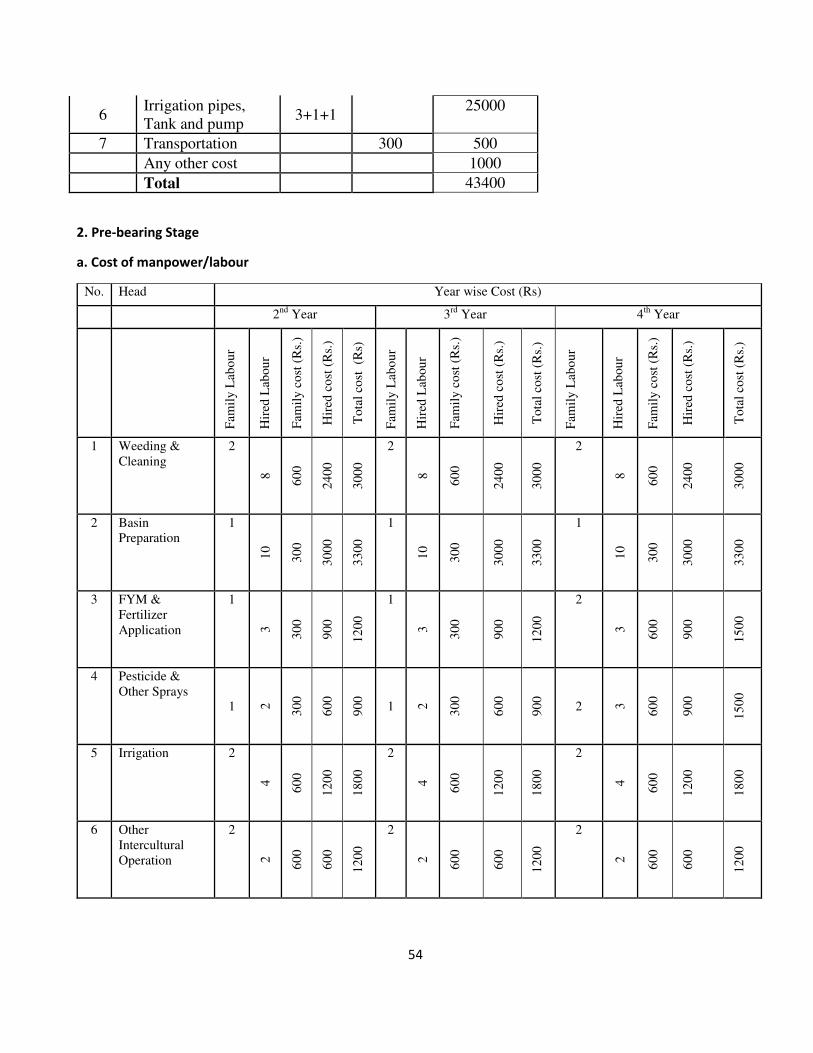
54
6 Irrigation pipes,
Tank and pump 3+1+1
25000
7 Transportation 300 500
Any other cost 1000
Total 43400
2. Pre-bearing Stage
a. Cost of manpower/labour
No. Head Year wise Cost (Rs)
2nd
Year 3rd
Year 4th
Year
Fam
ily
Lab
ou
r
Hir
ed L
abou
r
Fam
ily
co
st (
Rs.
)
Hir
ed c
ost
(R
s.)
To
tal
cost
(R
s)
Fam
ily
Lab
ou
r
Hir
ed L
abou
r
Fam
ily
co
st (
Rs.
)
Hir
ed c
ost
(R
s.)
To
tal
cost
(R
s.)
Fam
ily
Lab
ou
r
Hir
ed L
abou
r
Fam
ily
co
st (
Rs.
)
Hir
ed c
ost
(R
s.)
To
tal
cost
(R
s.)
1 Weeding &
Cleaning
2
8
60
0
24
00
30
00
2
8
60
0
24
00
30
00
2
8
60
0
24
00
30
00
2 Basin
Preparation
1
10
30
0
30
00
33
00
1
10
30
0
30
00
33
00
1
10
30
0
30
00
33
00
3 FYM &
Fertilizer
Application
1
3
30
0
90
0
12
00
1
3
30
0
90
0
12
00
2
3
60
0
90
0
15
00
4 Pesticide &
Other Sprays 1 2
30
0
60
0
90
0
1 2
30
0
60
0
90
0
2 3
60
0
90
0
15
00
5 Irrigation 2
4
60
0
12
00
18
00
2
4
60
0
12
00
18
00
2
4
60
0
12
00
18
00
6 Other
Intercultural
Operation
2
2
60
0
60
0
12
00
2
2
60
0
60
0
12
00
2
2
60
0
60
0
12
00

55
7 Any Other
Cost(harvesting)
10
0
0
10
0
0
1
0 30
0
0
30
0
8 Total Cost
28
00
87
00
11
500
28
00
87
00
11
500
36
00
90
00
12
600
b. Material Cost
2
nd
Year
3rd
Year 4th
Year
SL.
No. Hea
d
Qu
anti
ty
(kg
)
Rat
e
(Rs.
)
Am
ou
nt
(Rs.
)
Qu
anti
ty
(kg
)
Rat
e
(RS
)
(Rs.
)
Am
ou
nt
(Rs.
)
Qu
anti
ty
(kg
)
Rat
e
(RS
)
(Rs.
)
Am
ou
nt
(Rs.
)
1 FYM 1200 2 2400 3000 2 6000 3000 2 6000
2 Fertilizer
0 0 0 0
i. Urea 60 5.42 325.2 60 5.42 325.2 120 5.42 650.4
ii. SSP 60 10.23 613.8 60 10.23 613.8 120 10.23 1227.6
iii. MOP 30 17.15 514.5 30 17.15 514.5 60 17.15 1029
3
Pesticides
(Fungicide+
Insecticide)
0.5+1 225+55
0 775
1+3 450+550 2100 1+3 450+550 2100
5 Agricultural
tools 5 100 500
5 100 500 5 100 500
7 Transportation 100 100 100 100 300 300
8.
Other costs
like fencing
etc.
1000 1000
1000 1000 500 500
Total 6228.5 11153.5 12307
3. Full bearing Stage
a. Cost of mandays/labour
No. Head Year wise Cost (Rs)
5nd
Year 6rd
Year
Fam
ily
Lab
ou
r
Hir
ed
Lab
ou
r
Fam
ily
cost
(R
s.)
Hir
ed
cost
(R
s.)
To
tal
cost
(R
s)
F
amil
y
Lab
ou
r
Hir
ed
Lab
ou
r
Fam
ily
cost
(R
s.)
Hir
ed
cost
(R
s.)
To
tal
cost
(R
s)

56
1 Weeding &
Cleaning
2
8
60
0
24
00
30
00 2
8
60
0
24
00
30
00
2 Basin
Preparation
1
10
30
0
30
00
33
00 1
10
30
0
30
00
33
00
3 FYM &
Fertilizer
Application
2
3
60
0
90
0
15
00 2
3
60
0
90
0
15
00
4 Pesticide &
Other Sprays 2 3
60
0
90
0
15
00
2 3
60
0
90
0
15
00
5 Irrigation 2 4
60
0
12
00
18
00 2
4
60
0
12
00
18
00
6 Other
Intercultural
Operation
2
2
60
0
60
0
12
00 2
2
60
0
60
0
12
00
7 Any Other
Cost(harvesting)
1 1 3
00
30
0
90
0 1
2 30
0
60
0
90
0
8 Total Cost
36
00
93
00
13
200
36
00
96
00
13
200
b. Material Cost
5th
Year 6th
Year
SL
.
No
.
Head Quantity
(kg)
Rate
(RS) Amount
Quantit
y (kg)
Rate
(Rs.)
Amount
(Rs.)
1 FYM 4800 2 9600 4800 2 9600
2 Fertilizer
i. urea 180 5.42 975.6 180 5.42 975.6
ii.SSP 150 10.23 1534. 150 10.23 1534.
iii.MOP 90 17.15 1543.5 90 17.15 1543.5
3
Pesticides
(Fungicide+
Insecticide)
1+3 450+
550
2100 2+3 450+550 2550
5 Agricultural
tools 5
500
5 500
6 Transportati
on 500
500
7 Any other
cost 500
500
8 Harvesting
packing 1000
2000
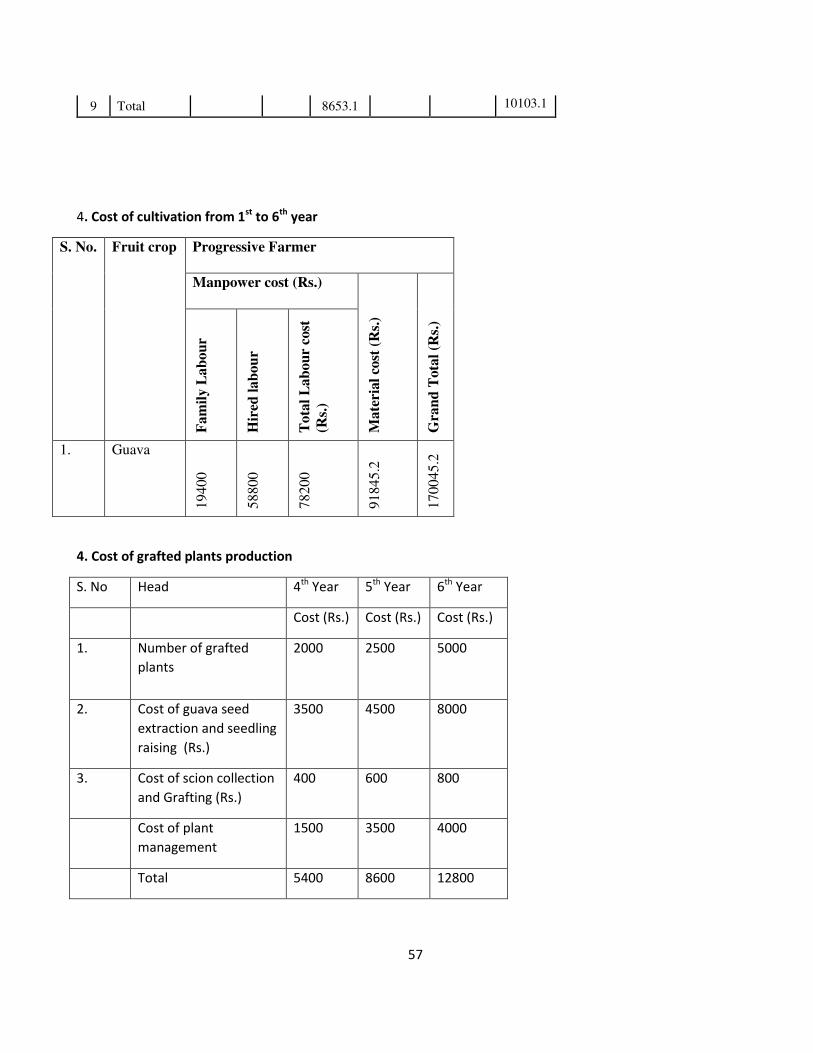
57
9 Total 8653.1 10103.1
4. Cost of cultivation from 1st
to 6th
year
S. No.
Fruit crop Progressive Farmer
Manpower cost (Rs.)
Mate
rial
cost
(R
s.)
Gra
nd
Tota
l (R
s.)
Fam
ily L
ab
ou
r
Hir
ed l
ab
ou
r
Tota
l L
ab
ou
r co
st
(Rs.
)
1. Guava
19400
58800
78200
91845.2
170045.2
4. Cost of grafted plants production
S. No Head 4th
Year 5th
Year 6th
Year
Cost (Rs.) Cost (Rs.) Cost (Rs.)
1. Number of grafted
plants
2000 2500 5000
2. Cost of guava seed
extraction and seedling
raising (Rs.)
3500 4500 8000
3. Cost of scion collection
and Grafting (Rs.)
400 600 800
Cost of plant
management
1500 3500 4000
Total 5400 8600 12800
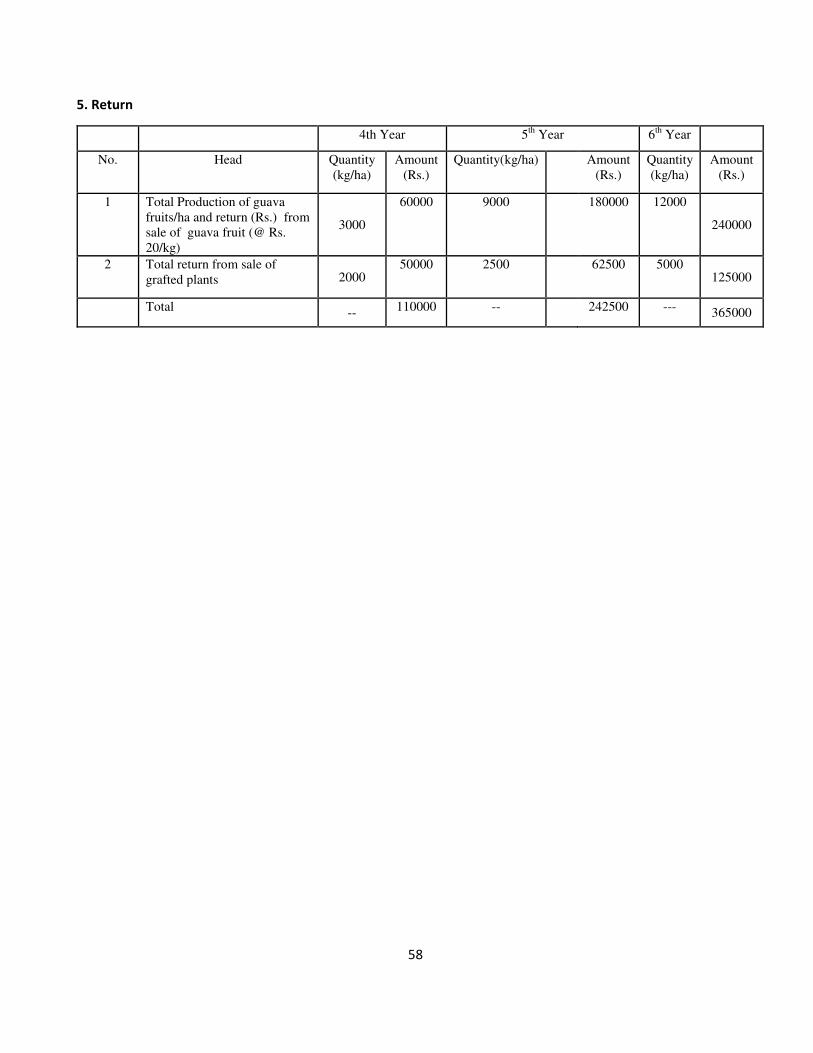
58
5. Return
4th Year 5th
Year 6th
Year
No. Head Quantity
(kg/ha)
Amount
(Rs.)
Quantity(kg/ha) Amount
(Rs.)
Quantity
(kg/ha)
Amount
(Rs.)
1 Total Production of guava
fruits/ha and return (Rs.) from
sale of guava fruit (@ Rs.
20/kg)
3000
60000 9000
180000 12000
240000
2 Total return from sale of
grafted plants 2000 50000 2500
62500 5000
125000
Total --
110000 --
242500 --- 365000
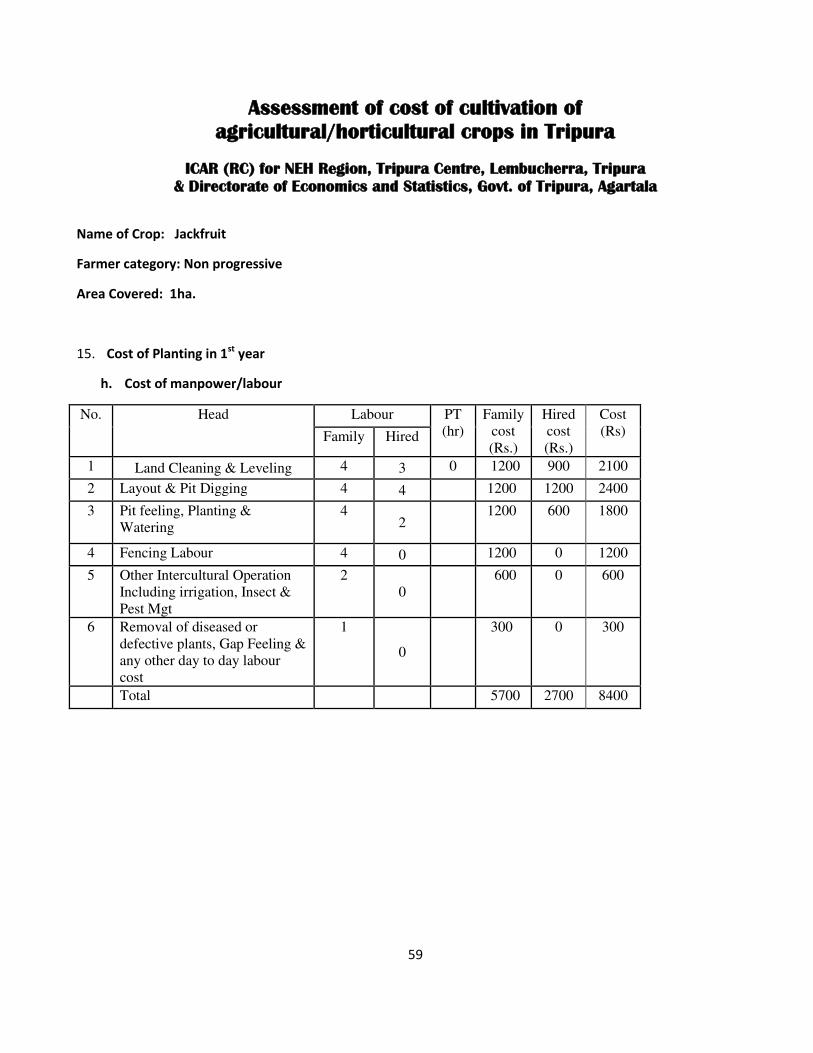
59
Assessment of cost of cultivation of
agricultural/horticultural crops in Tripura
ICAR (RC) for NEH Region, Tripura Centre, Lembucherra, Tripura
& Directorate of Economics and Statistics, Govt. of Tripura, Agartala
Name of Crop: Jackfruit
Farmer category: Non progressive
Area Covered: 1ha.
15. Cost of Planting in 1st
year
h. Cost of manpower/labour
No. Head Labour PT
(hr)
Family
cost
(Rs.)
Hired
cost
(Rs.)
Cost
(Rs) Family Hired
1 Land Cleaning & Leveling 4 3 0 1200 900 2100
2 Layout & Pit Digging 4 4 1200 1200 2400
3 Pit feeling, Planting &
Watering
4 2
1200 600 1800
4 Fencing Labour 4 0 1200 0 1200
5 Other Intercultural Operation
Including irrigation, Insect &
Pest Mgt
2
0
600 0 600
6 Removal of diseased or
defective plants, Gap Feeling &
any other day to day labour
cost
1
0
300 0 300
Total 5700 2700 8400

60
b. Material cost
Sl. No. Head Quantity Nos. or kg Rate(RS) Amount
1 Planting materials 150 15 2250
2 FYM 450 2 900
4 Fungicide and Insecticide 0.5 550 275
5 Irrigation, pipes 1+1 3000
6 Agricultural Tools 5 100 500
7 Transportation 0 500
8 Fencing
1000
Total 8425
2. Pre-bearing Stage
a. Cost of manpower/labour
No. Head Year wise Cost (Rs)
2nd
Year 3rd
Year 4th
Year
Fam
ily
Lab
ou
r
Hir
ed L
abou
r
Fam
ily
oo
st (
Rs.
)
Hir
ed c
ost
(R
s.)
To
tal
cost
(R
s)
Fam
ily
Lab
ou
r
Hir
ed L
abou
r
Fam
ily
oo
st (
Rs.
)
Hir
ed c
ost
(R
s.)
To
tal
cost
(R
s)
Fam
ily
Lab
ou
r
Hir
ed L
abou
r
Fam
ily
oo
st (
Rs.
)
Hir
ed c
ost
(R
s.)
To
tal
cost
(R
s)
1 Weeding &
Cleaning
3
2 90
0
60
0
15
00
3
2 90
0
60
0
15
00
3
2 90
0
60
0
15
00
2 Basin
Preparation
3
2 90
0
60
0
15
00
3
2 90
0
60
0
15
00
3
2 90
0
60
0
15
00
3 FYM &
Fertilizer
Application
1
0 30
0
0
30
0
1
0 30
0
0
30
0
1
0 30
0
0
30
0
4 Pesticide &
Other Sprays 0 0 0
0
0
0 0 0
0
0
1 0 30
0
0
30
0

61
5 Irrigation 1
0 30
0
0
30
0
1
0 30
0
0
30
0
1
0 30
0
0
30
0
6 Other
Intercultural
Operation
2
0 60
0
0
60
0
2
0 60
0
0
60
0
2
0 60
0
0
60
0
7 Any Other
Cost and
harvesting
1
0 30
0
0
30
0
1
0 30
0
0
30
0
1
0 30
0
0
30
0
8 Total Cost
33
00
12
00
45
00
33
00
12
00
45
00
36
00
12
00
48
00
b. Material Cost
2nd
Year 3rd
Year 4th
Year
SL.
No. Head
Quantity
(kg)
Rate
(Rs.)
Amount
(Rs.)
Quantity
(kg)
Rate
(RS)
(Rs.)
Amount
(Rs.)
Quantity
(kg)
Rate
(RS)
(Rs.)
Amount
(Rs.)
1 FYM 600 2 1200 600 2 1200 600 2 1200
2 Fertilizer
0 0 0 0
i. Urea 8 5.42 43.36 8 5.42 43.36 8 5.42 43.36
ii. SSP 8 10.23 81.8 8 10.23 81.8 8 10.23 81.8
iii. MOP 6 17.15 102.9 6 17.15 102.9 6 17.15 102.9
3 Pesticides
(Fungicide+Insecticide) 0 0 0 0 0 0 0 0 0
5 Agricultural tools 5 100 500 5 100 500 5 100 500
7 Transportation 100 100 100 100 100 100
8. Other costs like fencing
etc. 700 700
0 300 0 300
Total 2728.06 2328.06 2328.06
16. Bearing Stage
a. Cost of manpower/labour
No. Head Year wise Cost (Rs)
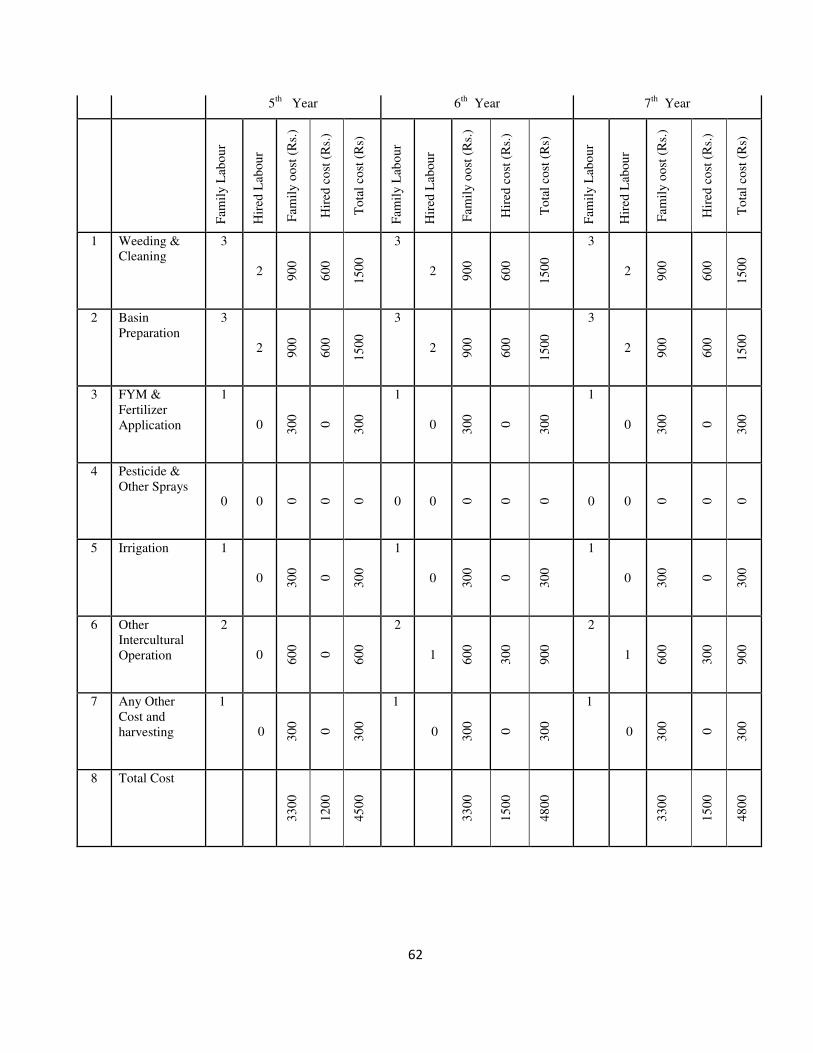
62
5th
Year 6th
Year 7th
Year
Fam
ily
Lab
ou
r
Hir
ed L
abou
r
Fam
ily
oo
st (
Rs.
)
Hir
ed c
ost
(R
s.)
To
tal
cost
(R
s)
Fam
ily
Lab
ou
r
Hir
ed L
abou
r
Fam
ily
oo
st (
Rs.
)
Hir
ed c
ost
(R
s.)
To
tal
cost
(R
s)
Fam
ily
Lab
ou
r
Hir
ed L
abou
r
Fam
ily
oo
st (
Rs.
)
Hir
ed c
ost
(R
s.)
To
tal
cost
(R
s)
1 Weeding &
Cleaning
3
2 90
0
60
0
15
00
3
2 90
0
60
0
15
00
3
2 90
0
60
0
15
00
2 Basin
Preparation
3
2 90
0
60
0
15
00
3
2 90
0
60
0
15
00
3
2 90
0
60
0
15
00
3 FYM &
Fertilizer
Application
1
0 30
0
0
30
0
1
0 30
0
0
30
0
1
0 30
0
0
30
0
4 Pesticide &
Other Sprays 0 0 0
0
0
0 0 0
0
0
0 0 0
0
0
5 Irrigation 1
0 30
0
0
30
0
1
0 30
0
0
30
0
1
0 30
0
0
30
0
6 Other
Intercultural
Operation
2
0 60
0
0
60
0
2
1 60
0
30
0
90
0
2
1 60
0
30
0
90
0
7 Any Other
Cost and
harvesting
1
0 30
0
0
30
0
1
0 30
0
0
30
0
1
0 30
0
0
30
0
8 Total Cost
33
00
12
00
45
00
33
00
15
00
48
00
33
00
15
00
48
00
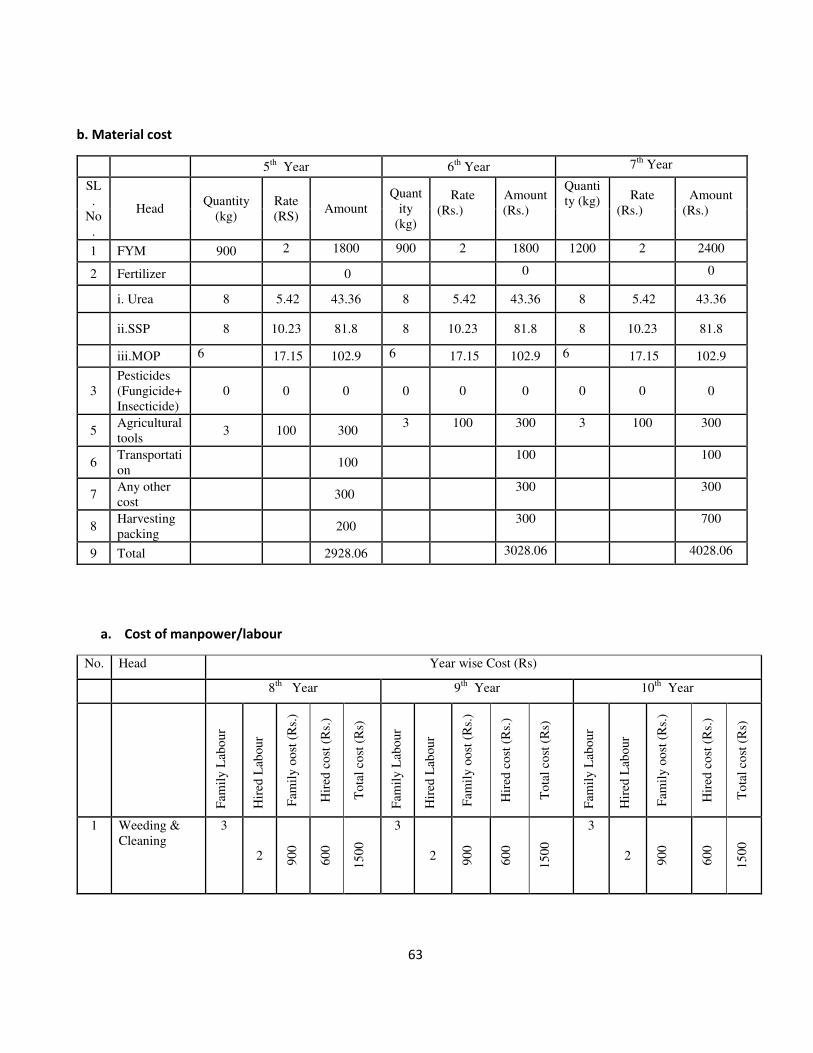
63
b. Material cost
5th
Year 6th
Year 7th
Year
SL
.
No
.
Head Quantity
(kg)
Rate
(RS) Amount
Quant
ity
(kg)
Rate
(Rs.)
Amount
(Rs.)
Quanti
ty (kg) Rate
(Rs.)
Amount
(Rs.)
1 FYM 900 2 1800 900 2 1800 1200 2 2400
2 Fertilizer 0 0 0
i. Urea 8 5.42 43.36 8 5.42 43.36 8 5.42 43.36
ii.SSP 8 10.23 81.8 8 10.23 81.8 8 10.23 81.8
iii.MOP 6 17.15 102.9 6 17.15 102.9 6 17.15 102.9
3
Pesticides
(Fungicide+
Insecticide)
0 0 0 0 0 0 0 0 0
5 Agricultural
tools 3 100 300
3 100 300 3 100 300
6 Transportati
on 100
100 100
7 Any other
cost 300
300 300
8 Harvesting
packing 200
300 700
9 Total 2928.06 3028.06 4028.06
a. Cost of manpower/labour
No. Head Year wise Cost (Rs)
8th
Year 9th
Year 10th
Year
Fam
ily
Lab
ou
r
Hir
ed L
abou
r
Fam
ily
oo
st (
Rs.
)
Hir
ed c
ost
(R
s.)
To
tal
cost
(R
s)
Fam
ily
Lab
ou
r
Hir
ed L
abou
r
Fam
ily
oo
st (
Rs.
)
Hir
ed c
ost
(R
s.)
To
tal
cost
(R
s)
Fam
ily
Lab
ou
r
Hir
ed L
abou
r
Fam
ily
oo
st (
Rs.
)
Hir
ed c
ost
(R
s.)
To
tal
cost
(R
s)
1 Weeding &
Cleaning
3
2 90
0
60
0
15
00
3
2 90
0
60
0
15
00
3
2 90
0
60
0
15
00

64
2 Basin
Preparation
3
2 90
0
60
0
15
00
3
2 90
0
60
0
15
00
3
2 90
0
60
0
15
00
3 FYM &
Fertilizer
Application
1
0 30
0
0
30
0
1
0 30
0
0
30
0
1
0 30
0
0
30
0
4 Pesticide &
Other Sprays 0 0 0
0
0
0 0 0
0
0
0 0 0
0
0
5 Irrigation 1
0 30
0
0
30
0
1
0 30
0
0
30
0
1
0 30
0
0
30
0
6 Other
Intercultural
Operation
2
0 60
0
0
60
0
2
1 60
0
30
0
90
0
2
1 60
0
30
0
90
0
7 Any Other
Cost and
harvesting
1
0 30
0
0
30
0
1
0 30
0
0
30
0
1
1 30
0
30
0
60
0
8 Total Cost
33
00
12
00
45
00
33
00
15
00
48
00
33
00
18
00
51
00
b. Material cost
8th
Year 9th
Year 10th
Year
SL
.
No
.
Head Quantity
(kg)
Rate
(RS) Amount
Quantit
y (kg)
Rate Amount Quanti
ty (kg) Rate Amount
(Rs.) (Rs.) (Rs.) (Rs.)
1 FYM 1200 2 2400 1200 2 2400 1200 2 2400
2 Fertilizer 0 0 0
i. Urea 10 5.42 54.2 10 5.42 54.2 10 5.42 54.2
ii.SSP 10 10.23 102.3 10 10.23 102.3 10 10.23 102.3
iii.MOP 8 17.15 137.2 8 17.15 137.2 8 17.15 137.2
3 Pesticides
(Fungicide+0 0 0 0 0 0 0 0 0

65
Insecticide)
5 Agricultural
tools
3 300 3 300 3 300
6 Transportati
on
100 100 100
7 Any other
cost
300 300 300
8 Harvesting
packing
500 600 800
9 Total 3893.7 3993.7 4193.7
5. Cost of cultivation from 1st
to 10th
year
S. No.
Fruit crop Non Progressive Farmer
Manpower cost
(Rs.)
Mate
rial
cost
(R
s.)
Gra
nd
Tota
l (R
s.)
Fa
mil
y L
ab
ou
r
Hir
ed l
ab
ou
r
To
tal
Lab
ou
r co
st
(Rs.
)
1. Jackfruit
3570
0
1500
0
5070
0
3784
.7
8857
4.7
6. Return
No. Head
5th
Yea
r
6th
Yea
r
7th
Yea
r
8th
Yea
r
9th
Yea
r
10
th Y
ear
11
th Y
ear
12
th Y
ear
13
th Y
ear
14
th Y
ear
15
th y
ear
1. Total raw
jackfruit fruit
harvested/tree
0 0 0 2 2 3 3 3 4 4 4
2. Total
Production of
ripe Jackfruit
(Kg/tree)
2 2 3 3 5 8 8 9 12 25 45
3. Total
production of
raw jackfruit
(kg/ha)
0 0 0 300 300 450 450 450 600 600 600
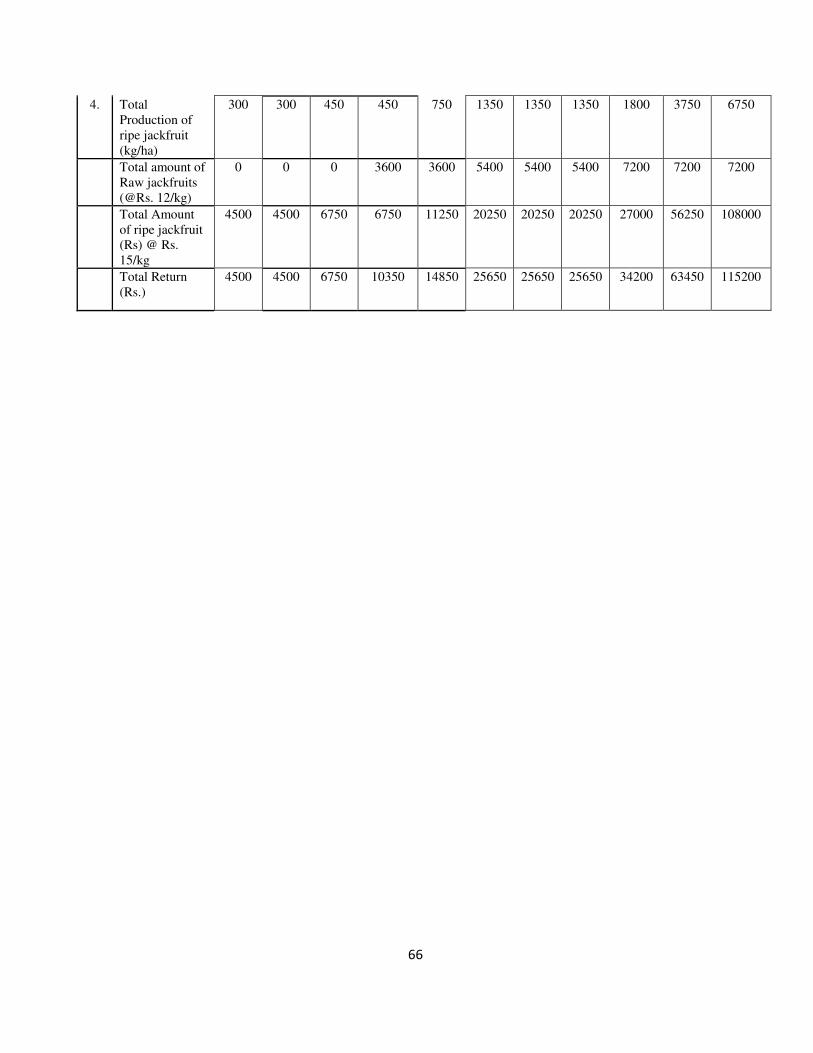
66
4. Total
Production of
ripe jackfruit
(kg/ha)
300 300 450 450 750 1350 1350 1350 1800 3750 6750
Total amount of
Raw jackfruits
(@Rs. 12/kg)
0 0 0 3600 3600 5400 5400 5400 7200 7200 7200
Total Amount
of ripe jackfruit
(Rs) @ Rs.
15/kg
4500 4500 6750 6750 11250 20250 20250 20250 27000 56250 108000
Total Return
(Rs.)
4500 4500 6750 10350 14850 25650 25650 25650 34200 63450 115200
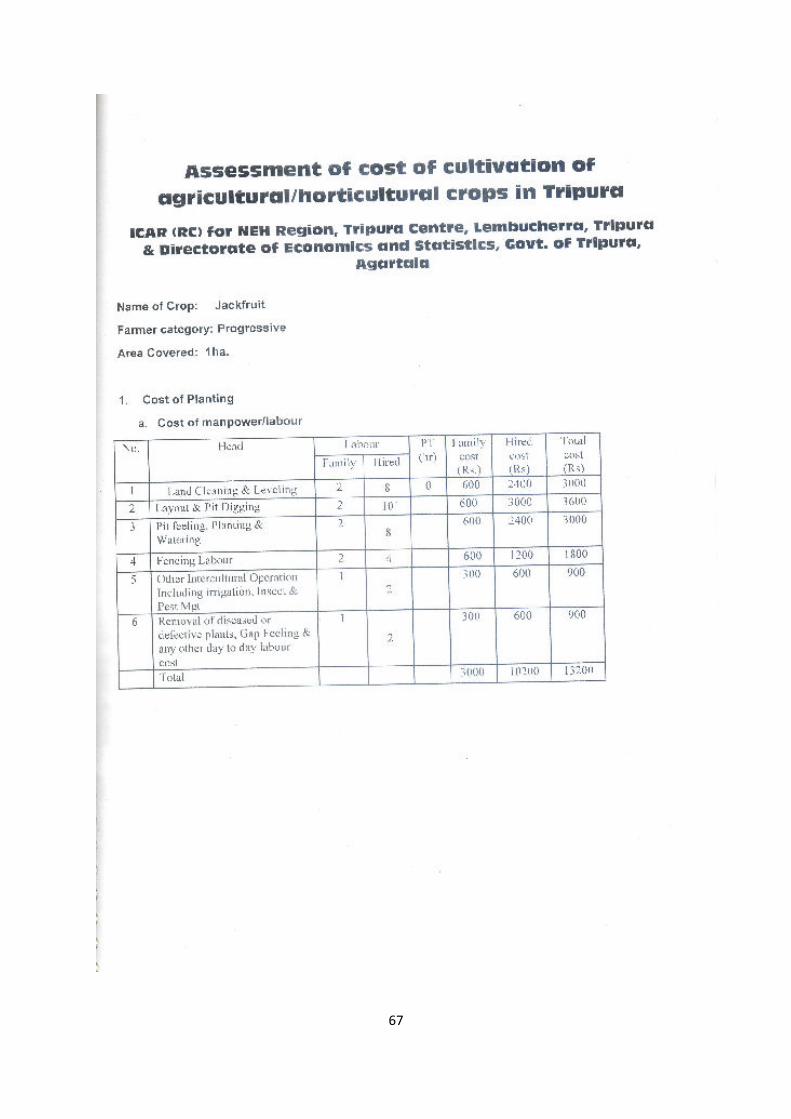
67
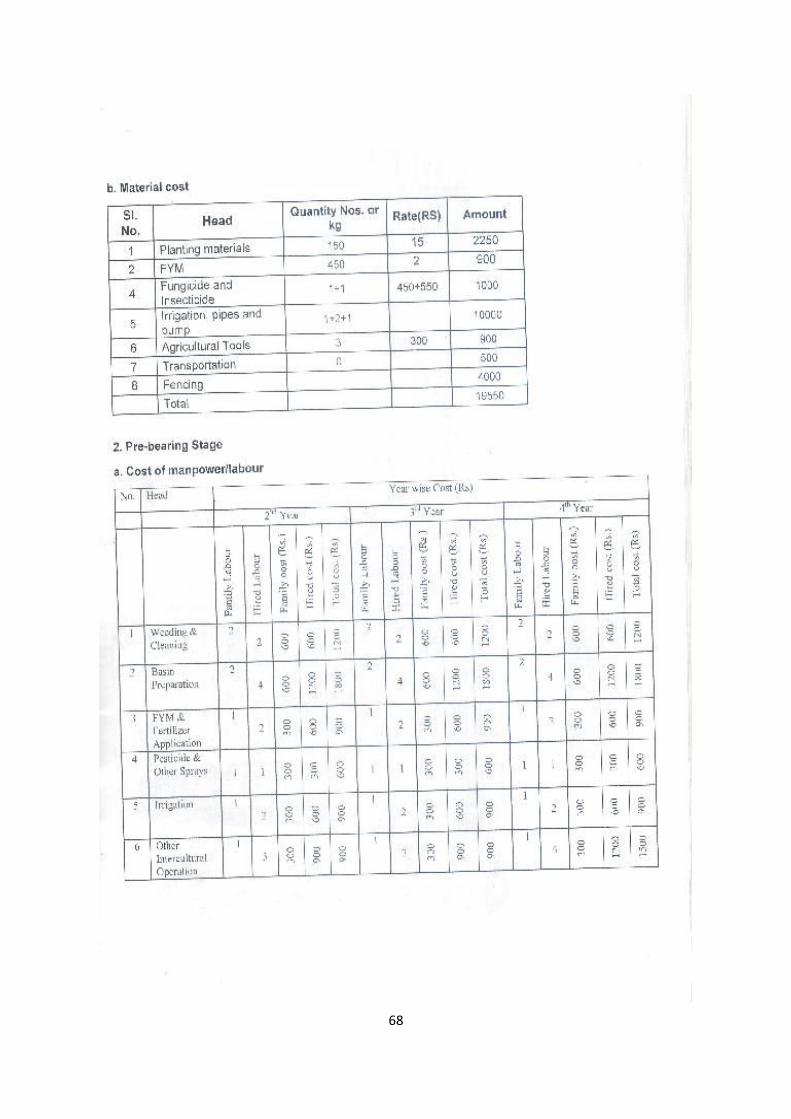
68
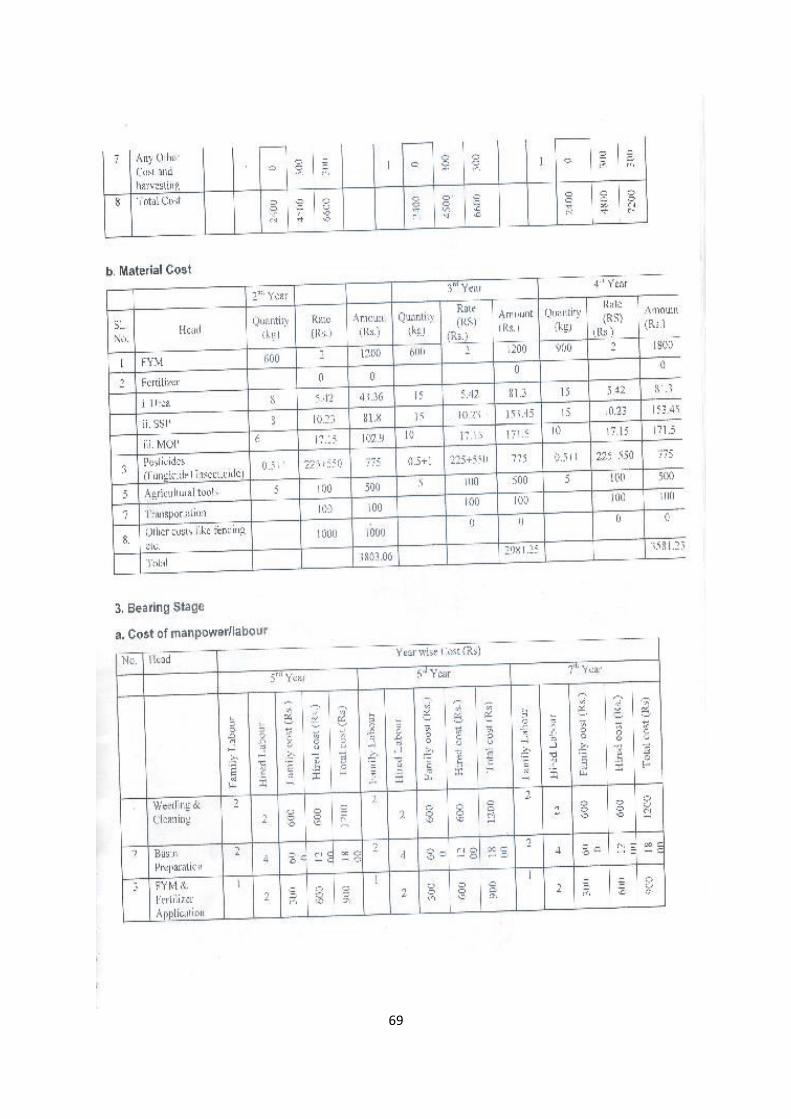
69
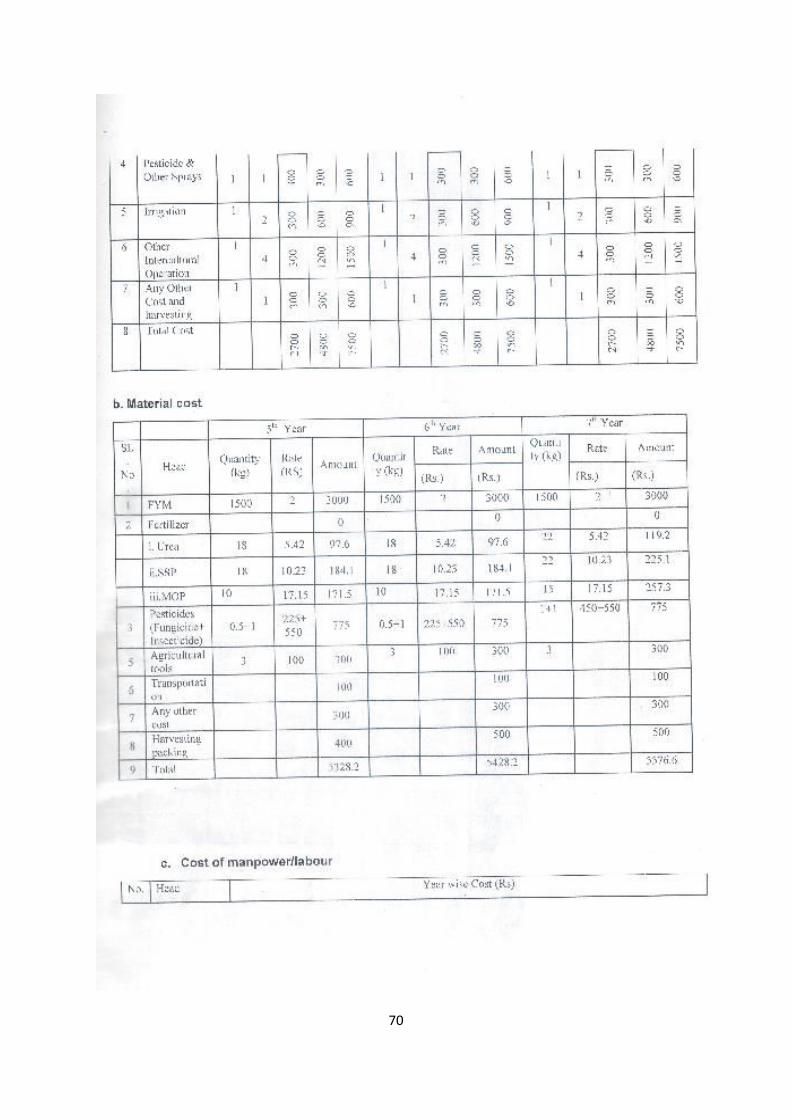
70

71
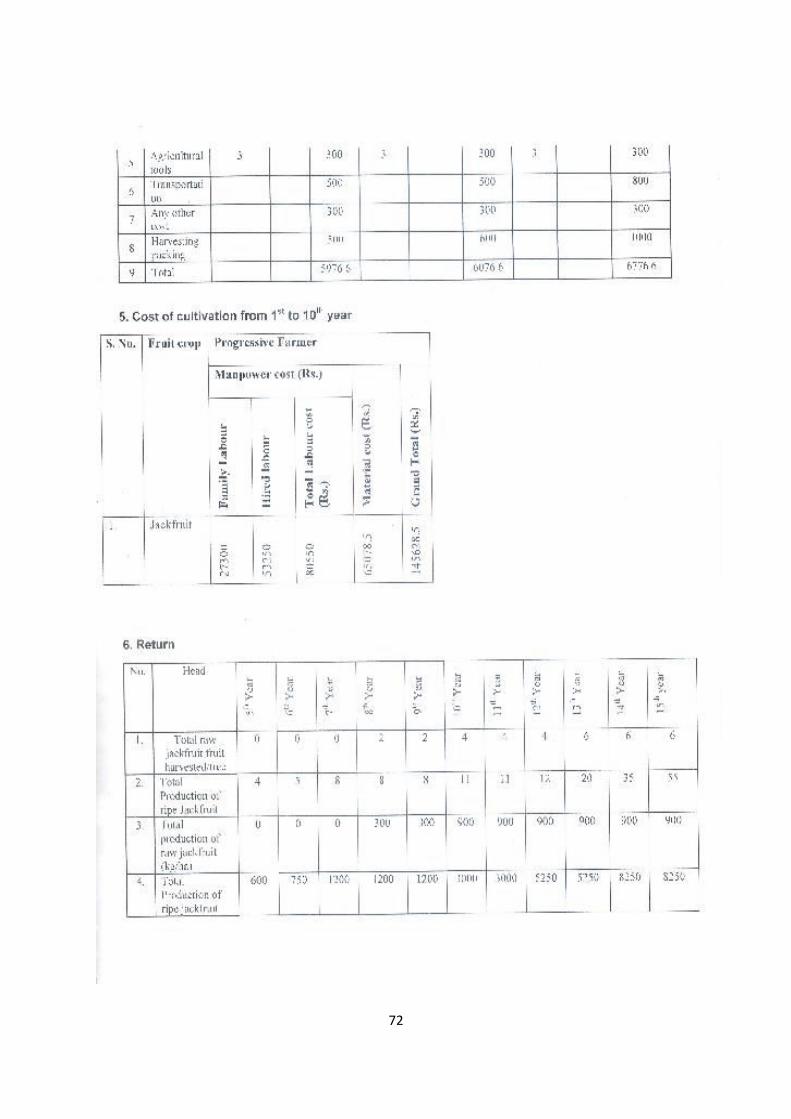
72
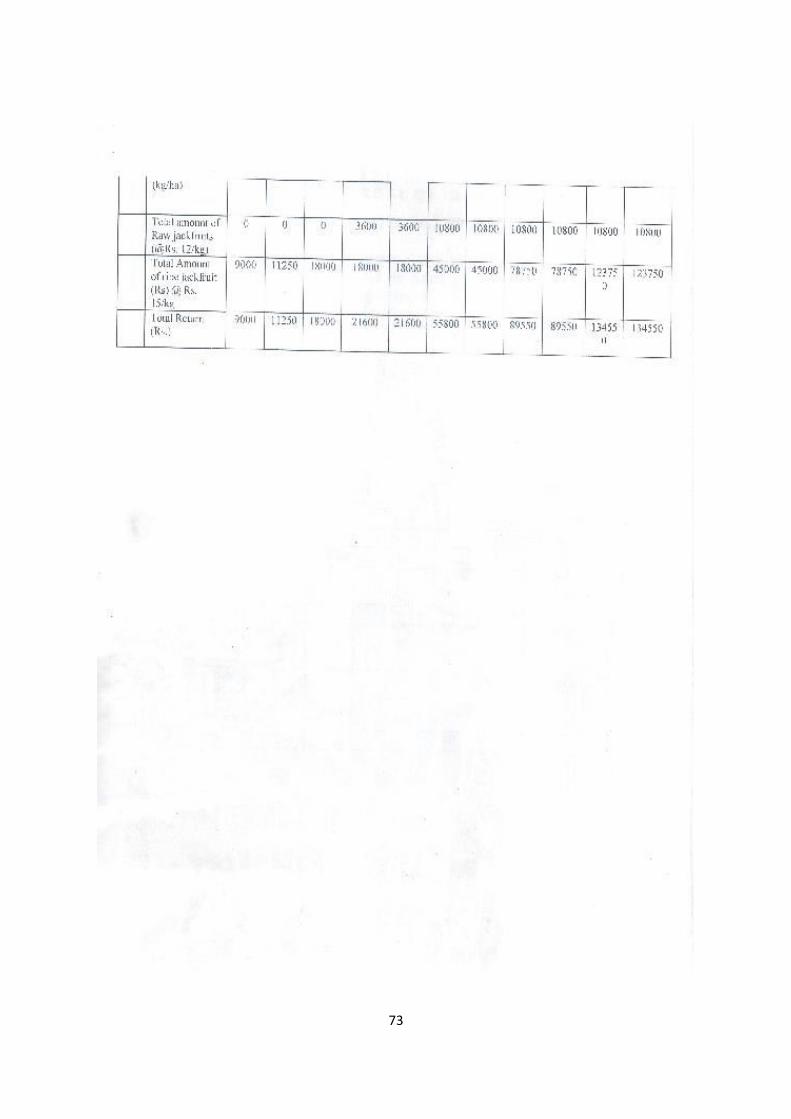
73

74
Assessment of cost of cultivation of
agricultural/horticultural crops in Tripura
ICAR (RC) for NEH Region, Tripura Centre, Lembucherra, Tripura
& Directorate of Economics and Statistics, Govt. of Tripura, Agartala
Name of Crop: Lemon
Farmer category: Non progressive
Area Covered: 1ha.
17. Cost of Planting 1st
year of planting
i. Cost of manpower/labour
No. Head Labour PT
(hr)
Family
cost
(Rs.)
Hired
cost
(Rs)
Total cost
(Rs) Family Hired
1 Land Cleaning & Leveling 3 2 0 900 600 1500
2 Layout & Pit Digging 4 3 1200 600 1800
3 Pit feeling, Planting &
Watering
3 2
900 600 1500
4 Fencing Labour 2 1 600 300 900
5 Other Intercultural Operation
Including irrigation, Insect &
Pest Mgt
2
1
600 300 900
6 Removal of diseased or
defective plants, Gap Feeling &
any other day to day labour
cost
2
0
600 0 600
Total 4800 2400 7200
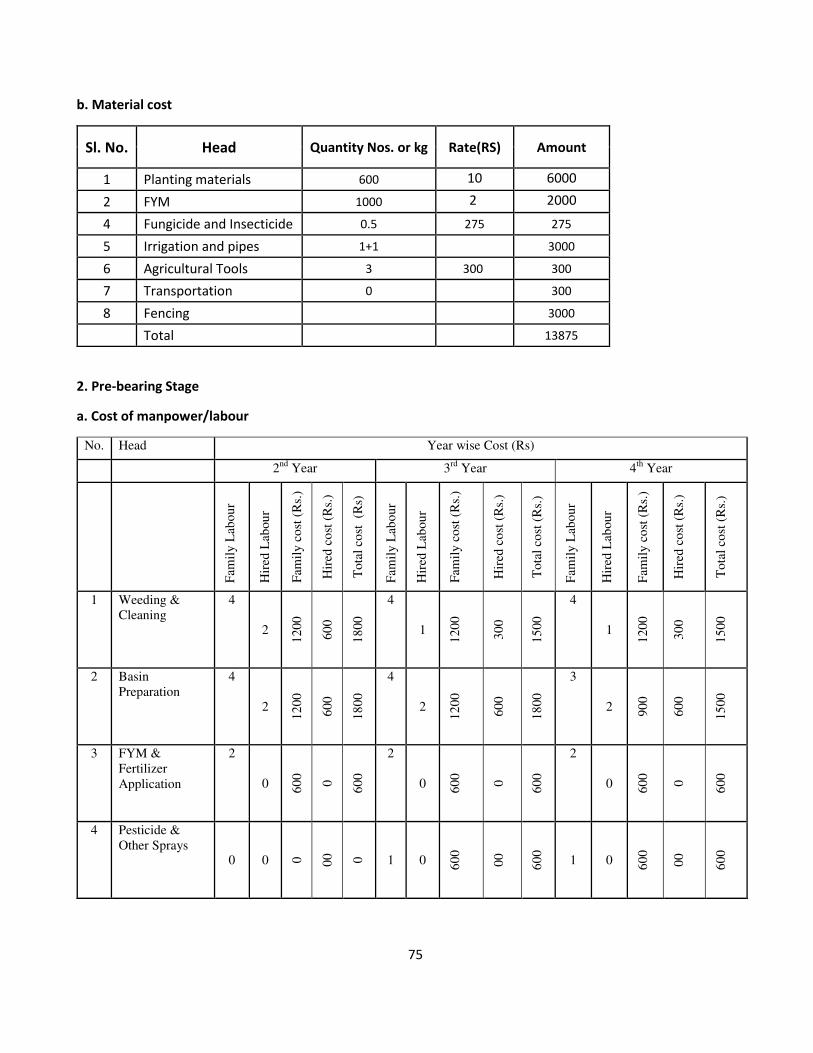
75
b. Material cost
Sl. No. Head Quantity Nos. or kg Rate(RS) Amount
1 Planting materials 600 10 6000
2 FYM 1000 2 2000
4 Fungicide and Insecticide 0.5 275 275
5 Irrigation and pipes 1+1 3000
6 Agricultural Tools 3 300 300
7 Transportation 0 300
8 Fencing
3000
Total 13875
2. Pre-bearing Stage
a. Cost of manpower/labour
No. Head Year wise Cost (Rs)
2nd
Year 3rd
Year 4th
Year
Fam
ily
Lab
ou
r
Hir
ed L
abou
r
Fam
ily
co
st (
Rs.
)
Hir
ed c
ost
(R
s.)
To
tal
cost
(R
s)
Fam
ily
Lab
ou
r
Hir
ed L
abou
r
Fam
ily
co
st (
Rs.
)
Hir
ed c
ost
(R
s.)
To
tal
cost
(R
s.)
Fam
ily
Lab
ou
r
Hir
ed L
abou
r
Fam
ily
co
st (
Rs.
)
Hir
ed c
ost
(R
s.)
To
tal
cost
(R
s.)
1 Weeding &
Cleaning
4
2
12
00
60
0
18
00
4
1
12
00
30
0
15
00
4
1 1
20
0
30
0
15
00
2 Basin
Preparation
4
2
12
00
60
0
18
00
4
2
12
00
60
0
18
00
3
2 90
0
60
0
15
00
3 FYM &
Fertilizer
Application
2
0 60
0
0
60
0
2
0 60
0
0
60
0
2
0 60
0
0
60
0
4 Pesticide &
Other Sprays 0 0 0
00
0
1 0 60
0
00
60
0
1 0 60
0
00
60
0
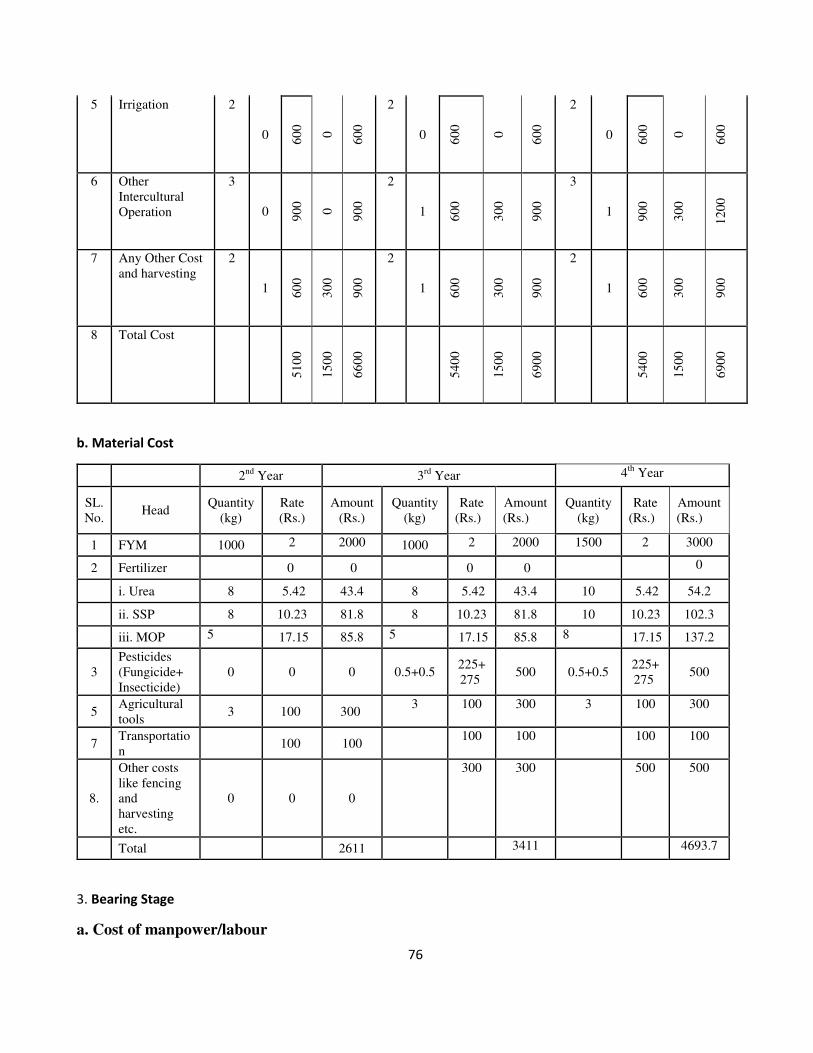
76
5 Irrigation 2
0 60
0
0
60
0
2
0 60
0
0
60
0
2
0 60
0
0
60
0
6 Other
Intercultural
Operation
3
0 90
0
0
90
0
2
1 60
0
30
0
90
0
3
1 90
0
30
0
12
00
7 Any Other Cost
and harvesting
2
1 60
0
30
0
90
0
2
1 60
0
30
0
90
0
2
1 60
0
30
0
90
0
8 Total Cost
51
00
15
00
66
00
54
00
15
00
69
00
54
00
15
00
69
00
b. Material Cost
2nd
Year 3rd
Year 4th
Year
SL.
No. Head
Quantity
(kg)
Rate
(Rs.)
Amount
(Rs.)
Quantity
(kg)
Rate
(Rs.)
Amount
(Rs.)
Quantity
(kg)
Rate
(Rs.)
Amount
(Rs.)
1 FYM 1000 2 2000 1000 2 2000 1500 2 3000
2 Fertilizer
0 0 0 0 0
i. Urea 8 5.42 43.4 8 5.42 43.4 10 5.42 54.2
ii. SSP 8 10.23 81.8 8 10.23 81.8 10 10.23 102.3
iii. MOP 5 17.15 85.8 5 17.15 85.8 8 17.15 137.2
3
Pesticides
(Fungicide+
Insecticide)
0 0 0 0.5+0.5 225+
275 500 0.5+0.5
225+
275 500
5 Agricultural
tools 3 100 300
3 100 300 3 100 300
7 Transportatio
n 100 100
100 100 100 100
8.
Other costs
like fencing
and
harvesting
etc.
0 0 0
300 300 500 500
Total 2611 3411 4693.7
3. Bearing Stage
a. Cost of manpower/labour
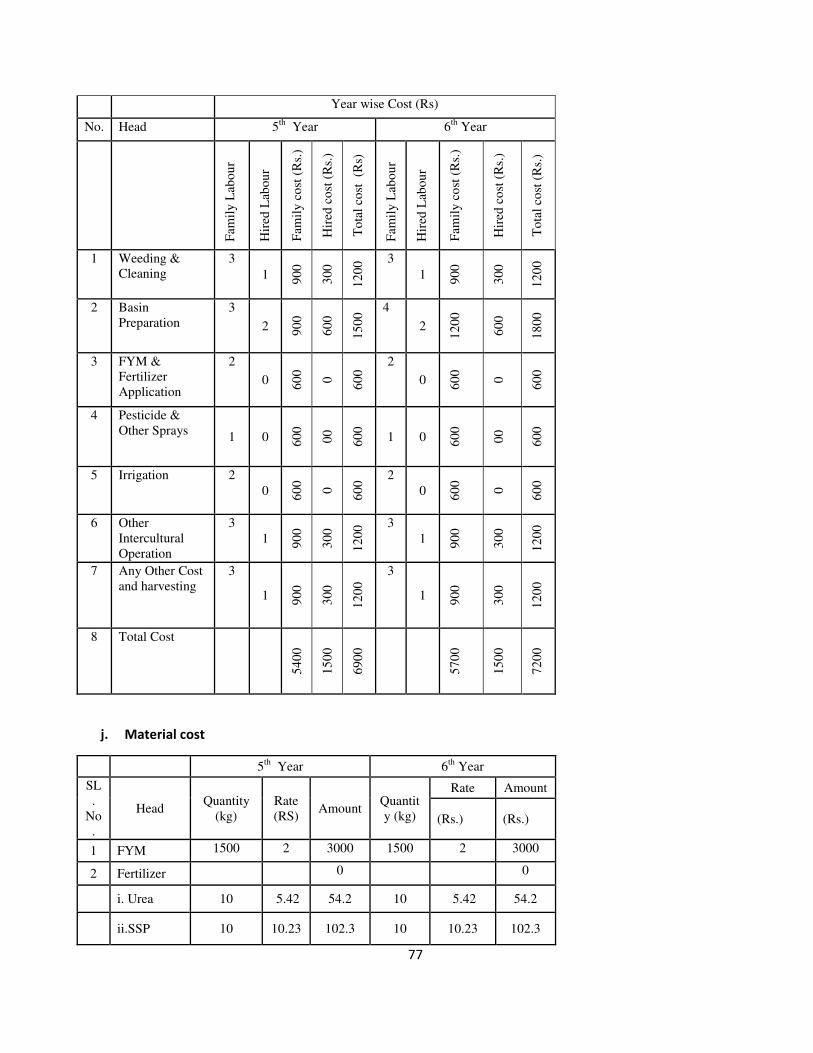
77
Year wise Cost (Rs)
No. Head 5th
Year 6th
Year
Fam
ily
Lab
ou
r
Hir
ed L
abou
r
Fam
ily
co
st (
Rs.
)
Hir
ed c
ost
(R
s.)
To
tal
cost
(R
s)
Fam
ily
Lab
ou
r
Hir
ed L
abou
r
Fam
ily
co
st (
Rs.
)
Hir
ed c
ost
(R
s.)
To
tal
cost
(R
s.)
1 Weeding &
Cleaning
3
1 90
0
30
0
12
00 3
1 90
0
30
0
12
00
2 Basin
Preparation
3
2 90
0
60
0
15
00 4
2
12
00
60
0
18
00
3 FYM &
Fertilizer
Application
2
0 60
0
0
60
0 2
0 60
0
0
60
0
4 Pesticide &
Other Sprays 1 0 6
00
00
60
0
1 0 60
0
00
60
0
5 Irrigation 2
0 60
0
0
60
0 2
0 60
0
0
60
0
6 Other
Intercultural
Operation
3
1 90
0
30
0
12
00 3
1 90
0
30
0
12
00
7 Any Other Cost
and harvesting
3
1 90
0
30
0
12
00
3
1 90
0
30
0
12
00
8 Total Cost
54
00
15
00
69
00
57
00
15
00
72
00
j. Material cost
5th
Year 6th
Year
SL
.
No
.
Head Quantity
(kg)
Rate
(RS) Amount
Quantit
y (kg)
Rate Amount
(Rs.) (Rs.)
1 FYM 1500 2 3000 1500 2 3000
2 Fertilizer 0 0
i. Urea 10 5.42 54.2 10 5.42 54.2
ii.SSP 10 10.23 102.3 10 10.23 102.3
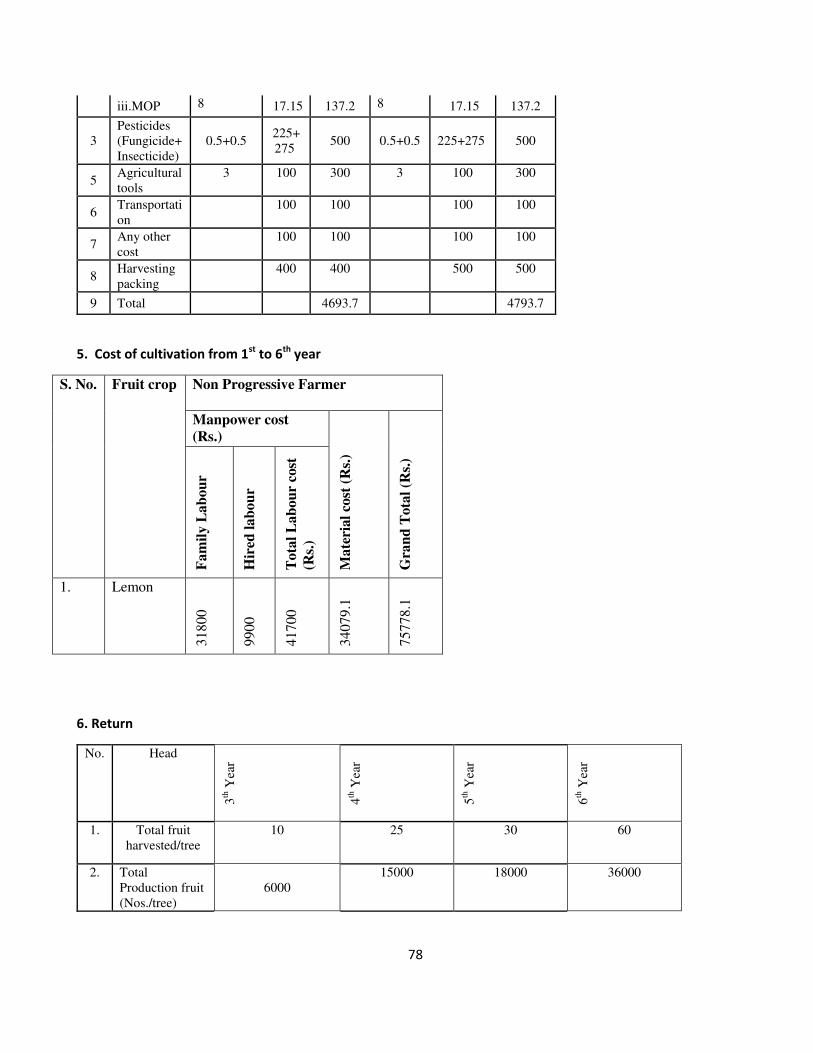
78
iii.MOP 8 17.15 137.2 8 17.15 137.2
3
Pesticides
(Fungicide+
Insecticide)
0.5+0.5 225+
275 500 0.5+0.5 225+275 500
5 Agricultural
tools
3 100 300 3 100 300
6 Transportati
on
100 100 100 100
7 Any other
cost
100 100 100 100
8 Harvesting
packing
400 400 500 500
9 Total 4693.7 4793.7
5. Cost of cultivation from 1st
to 6th
year
S. No.
Fruit crop Non Progressive Farmer
Manpower cost
(Rs.)
Mate
rial
cost
(R
s.)
Gra
nd
Tota
l (R
s.)
Fam
ily L
ab
ou
r
Hir
ed l
ab
ou
r
Tota
l L
ab
ou
r co
st
(Rs.
)
1. Lemon
318
00
990
0
417
00
340
79.1
757
78.1
6. Return
No. Head
3th
Yea
r
4th
Yea
r
5th
Yea
r
6th
Yea
r
1. Total fruit
harvested/tree
10 25 30 60
2. Total
Production fruit
(Nos./tree)
6000
15000 18000 36000
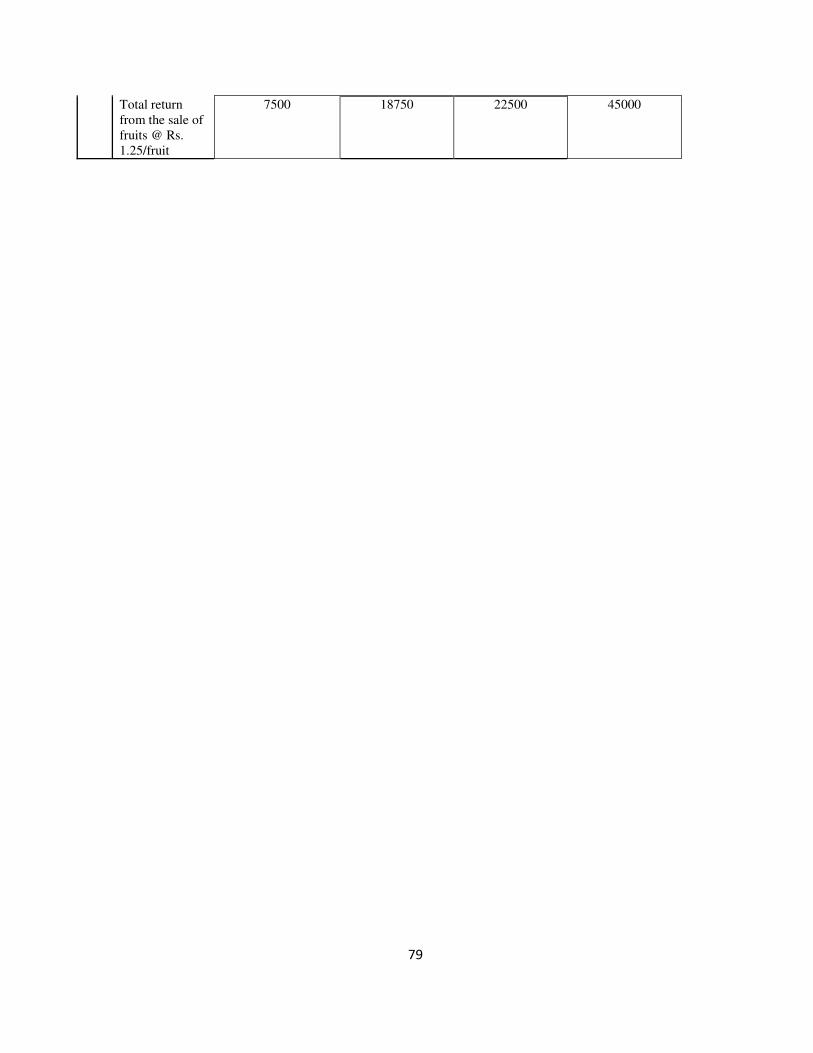
79
Total return
from the sale of
fruits @ Rs.
1.25/fruit
7500 18750 22500 45000

80
Assessment of cost of cultivation of
agricultural/horticultural crops in Tripura
ICAR (RC) for NEH Region, Tripura Centre, Lembucherra, Tripura
& Directorate of Economics and Statistics, Govt. of Tripura, Agartala
Name of Crop: Lemon
Farmer category: progressive
Area Covered: 1ha.
18. Cost of Planting in 1st
year
k. Cost of manpower/labour
No. Head Labour PT
(hr)
Family
cost
(Rs.)
Hired
cost
(Rs)
Total cost
(Rs) Family Hired
1 Land Cleaning & Leveling 2 8 5 600 3900 4500
2 Layout & Pit Digging 2 10 600 3000 3600
3 Pit feeling, Planting &
Watering
2 8
600 2400 3000
4 Fencing Labour 2 3 600 900 1500
5 Other Intercultural Operation
Including irrigation, Insect &
Pest Mgt
2
2
600 600 1200
6 Removal of diseased or
defective plants, Gap Feeling &
any other day to day labour
cost
2
2
600 600 1200
Total 3600 11400 15000
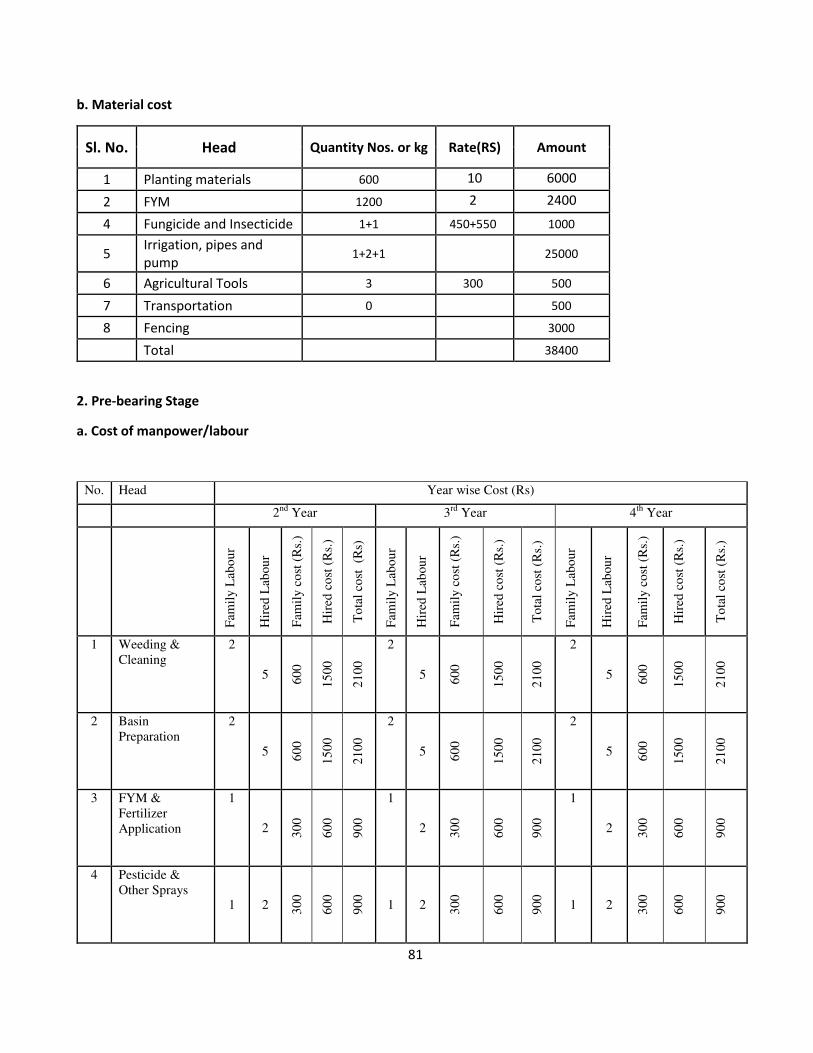
81
b. Material cost
Sl. No. Head Quantity Nos. or kg Rate(RS) Amount
1 Planting materials 600 10 6000
2 FYM 1200 2 2400
4 Fungicide and Insecticide 1+1 450+550 1000
5 Irrigation, pipes and
pump 1+2+1 25000
6 Agricultural Tools 3 300 500
7 Transportation 0 500
8 Fencing
3000
Total 38400
2. Pre-bearing Stage
a. Cost of manpower/labour
No. Head Year wise Cost (Rs)
2nd
Year 3rd
Year 4th
Year
Fam
ily
Lab
ou
r
Hir
ed L
abou
r
Fam
ily
co
st (
Rs.
)
Hir
ed c
ost
(R
s.)
To
tal
cost
(R
s)
Fam
ily
Lab
ou
r
Hir
ed L
abou
r
Fam
ily
co
st (
Rs.
)
Hir
ed c
ost
(R
s.)
To
tal
cost
(R
s.)
Fam
ily
Lab
ou
r
Hir
ed L
abou
r
Fam
ily
co
st (
Rs.
)
Hir
ed c
ost
(R
s.)
To
tal
cost
(R
s.)
1 Weeding &
Cleaning
2
5 60
0
15
00
21
00
2
5 60
0
15
00
21
00
2
5 60
0
15
00
21
00
2 Basin
Preparation
2
5 60
0
15
00
21
00
2
5 60
0
15
00
21
00
2
5 60
0
15
00
21
00
3 FYM &
Fertilizer
Application
1
2 30
0
60
0
90
0
1
2 30
0
60
0
90
0
1
2 30
0
60
0
90
0
4 Pesticide &
Other Sprays 1 2 3
00
60
0
90
0
1 2 30
0
60
0
90
0
1 2 30
0
60
0
90
0

82
5 Irrigation 2
3 60
0
30
0
90
0
2
3 60
0
30
0
90
0
2
3 60
0
30
0
90
0
6 Other
Intercultural
Operation
2
3 60
0
90
0
15
00
3
3 90
0
90
0
18
00
3
5 90
0
15
00
21
00
7 Any Other
Cost(harvesting)
1
2 30
0
60
0
90
0
1
2 30
0
60
0
90
0
1
2 30
0
60
0
90
0
8 Total Cost
33
00
60
00
93
00
36
00
60
00
96
00
36
00
66
00
99
00
b. Material Cost
2nd
Year 3rd
Year 4th
Year
SL.
No
.
Head
Qu
anti
ty (
kg)
Rat
e
(R
s.)
Am
ou
nt
(Rs.
)
Qu
anti
ty (
kg)
Rat
e
(R
S)
Am
ou
nt
(Rs.
)
Qu
anti
ty (
kg)
Rat
e
(R
S)
Am
ou
nt
(Rs.
)
1 FYM 1500 2 3000 1500 2 3000 1500 2 3000
2 Fertilizer
0 0 0 0 0
i. Urea 25 5.42 135.5 25 5.42 135.5 25 5.42 135.5
ii. SSP 15 10.23 153.5 15 10.23 153.5 15 10.23 153.5
iii. MOP 10 17.15 171.5 10 17.15 171.5 10 17.15 171.5
3
Pesticides
(Fungicide+
Insecticide)
0.5+1 225+550 775 1+1.5 450+550 1275 1+1.5 450+550 1275
5 Agricultural
tools 5 100 500
5 100 500 5 100 500
7 Transportati
on 100 100
100 100 100 100
8.
Other costs
like fencing
and
harvesting
etc.
1000 1000
0 600 0 600
Total 5835.5 5935.5 5935.5
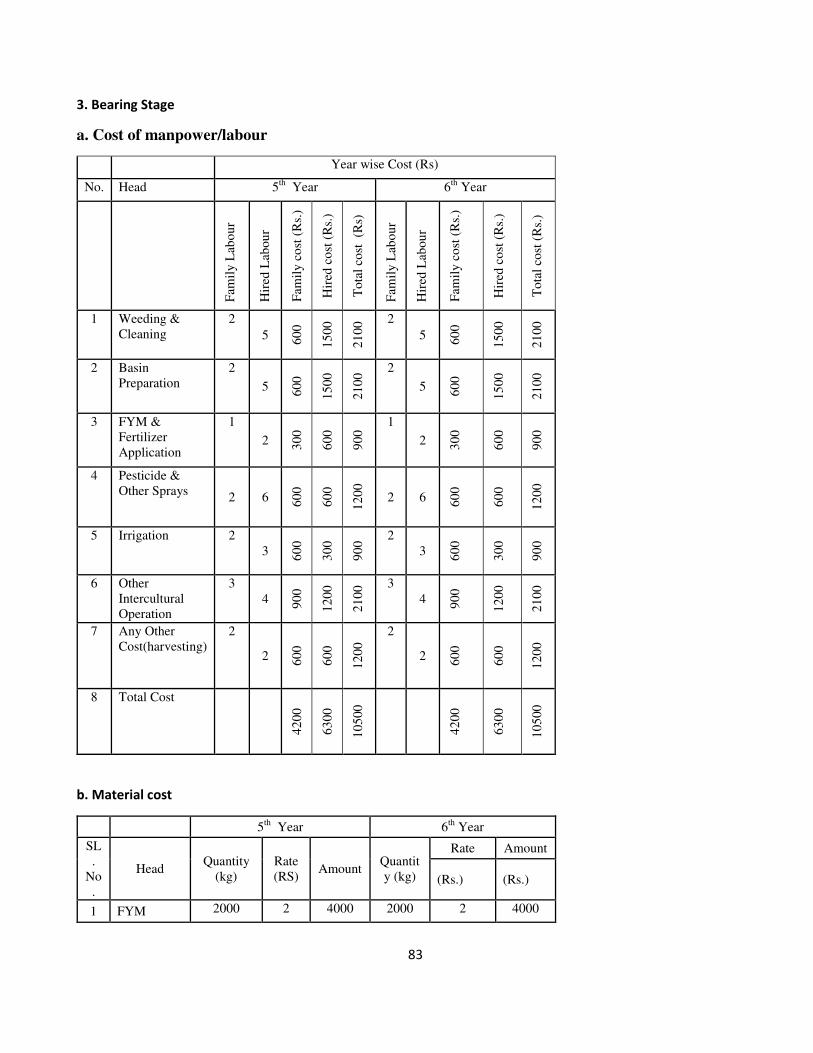
83
3. Bearing Stage
a. Cost of manpower/labour
Year wise Cost (Rs)
No. Head 5th
Year 6th
Year
Fam
ily
Lab
ou
r
Hir
ed L
abou
r
Fam
ily
co
st (
Rs.
)
Hir
ed c
ost
(R
s.)
To
tal
cost
(R
s)
Fam
ily
Lab
ou
r
Hir
ed L
abou
r
Fam
ily
co
st (
Rs.
)
Hir
ed c
ost
(R
s.)
To
tal
cost
(R
s.)
1 Weeding &
Cleaning
2
5 60
0
15
00
21
00 2
5 60
0
15
00
21
00
2 Basin
Preparation
2
5 60
0
15
00
21
00 2
5 60
0
15
00
21
00
3 FYM &
Fertilizer
Application
1
2 30
0
60
0
90
0 1
2 30
0
60
0
90
0
4 Pesticide &
Other Sprays 2 6 6
00
60
0
12
00
2 6 60
0
60
0
12
00
5 Irrigation 2
3 60
0
30
0
90
0 2
3 60
0
30
0
90
0
6 Other
Intercultural
Operation
3
4 90
0
12
00
21
00 3
4 90
0
12
00
21
00
7 Any Other
Cost(harvesting)
2
2 60
0
60
0
12
00
2
2 60
0
60
0
12
00
8 Total Cost
42
00
63
00
10
500
42
00
63
00
10
500
b. Material cost
5th
Year 6th
Year
SL
.
No
.
Head Quantity
(kg)
Rate
(RS) Amount
Quantit
y (kg)
Rate Amount
(Rs.) (Rs.)
1 FYM 2000 2 4000 2000 2 4000

84
4. Cost of cultivation from 1st
to 6th
year
S. No.
Fruit crop Progressive Farmer
Manpower cost (Rs.)
Mate
rial
cost
(R
s.)
Gra
nd
Tota
l (R
s.)
Fam
ily L
ab
ou
r
Hir
ed l
ab
ou
r
Tota
l L
ab
ou
r co
st
(Rs.
)
1. Lemon
22
500
42
600
65
100
71
877.5
13
6977
.5
5. Cost of plant nursery
S.
No.
Nursery plants 5th
Year 6th
Year
1. Number of cuttings 2000 5000
2. Cost of production
(Rs.)
3000 7000
2 Fertilizer 0 0
i. Urea 25 5.42 135.5 25 5.42 135.5
ii.SSP 15 10.23 153.5 15 10.23 153.5
iii.MOP 10 17.15 171.5 10 17.15 171.5
3
Pesticides
(Fungicide+
Insecticide)
1+1.5 450+
550 1275 1+1.5 450+550 1275
5 Agricultural
tools
5 100 500 5 100 500
6 Transportati
on
200 200 300 300
7 Any other
cost
0 500 0 500
8 Harvesting
packing
800 1000
9 Total 7735.5 8035.5

85
6. Return
No. Head
3th
Yea
r
4th
Yea
r
5th
Yea
r
6th
Yea
r
1. Total fruit
harvested/Tree
20 40 60 90
2. Total
Production fruit
(Nos./tree)
12000 24000 36000 60000
3. Total return
from the sale of
fruits @ Rs.
2/fruit
24000 48000 72000 120000
Total return
from plants sale
@ Rs. 10/plant
0 0 20000 108000
Total Return
(Rs.)
24000 48000 92000 180000
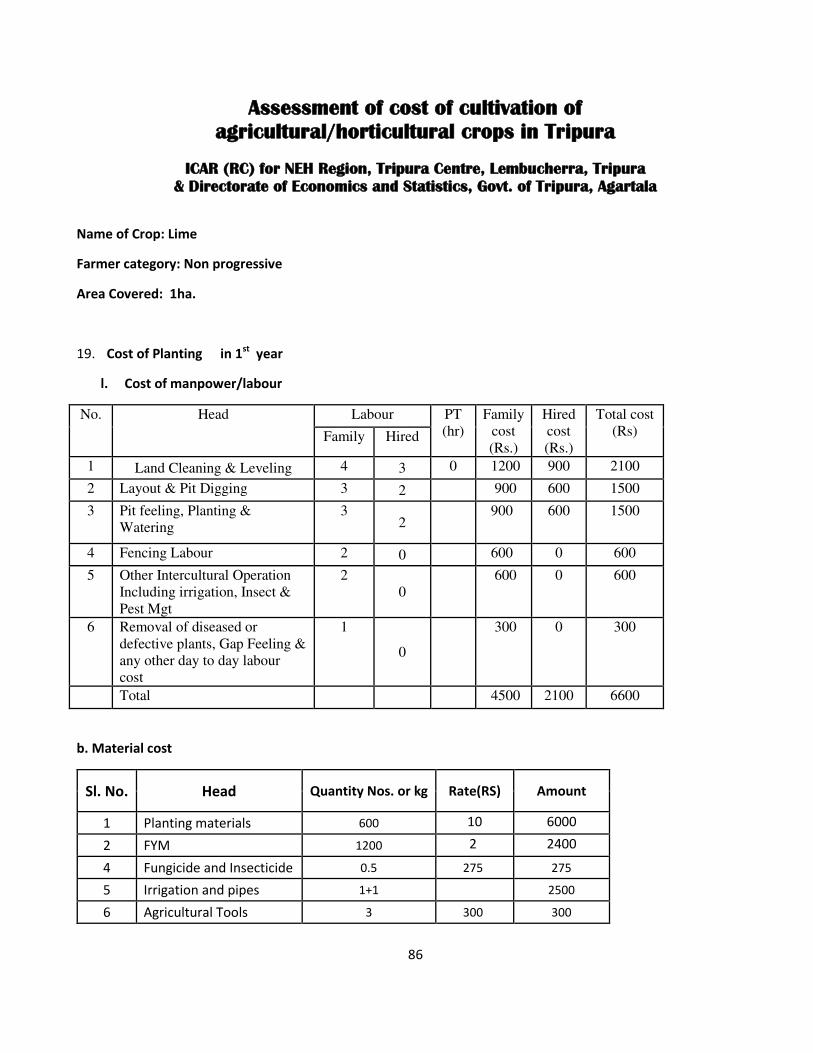
86
Assessment of cost of cultivation of
agricultural/horticultural crops in Tripura
ICAR (RC) for NEH Region, Tripura Centre, Lembucherra, Tripura
& Directorate of Economics and Statistics, Govt. of Tripura, Agartala
Name of Crop: Lime
Farmer category: Non progressive
Area Covered: 1ha.
19. Cost of Planting in 1st
year
l. Cost of manpower/labour
No. Head Labour PT
(hr)
Family
cost
(Rs.)
Hired
cost
(Rs.)
Total cost
(Rs) Family Hired
1 Land Cleaning & Leveling 4 3 0 1200 900 2100
2 Layout & Pit Digging 3 2 900 600 1500
3 Pit feeling, Planting &
Watering
3 2
900 600 1500
4 Fencing Labour 2 0 600 0 600
5 Other Intercultural Operation
Including irrigation, Insect &
Pest Mgt
2
0
600 0 600
6 Removal of diseased or
defective plants, Gap Feeling &
any other day to day labour
cost
1
0
300 0 300
Total 4500 2100 6600
b. Material cost
Sl. No. Head Quantity Nos. or kg Rate(RS) Amount
1 Planting materials 600 10 6000
2 FYM 1200 2 2400
4 Fungicide and Insecticide 0.5 275 275
5 Irrigation and pipes 1+1 2500
6 Agricultural Tools 3 300 300
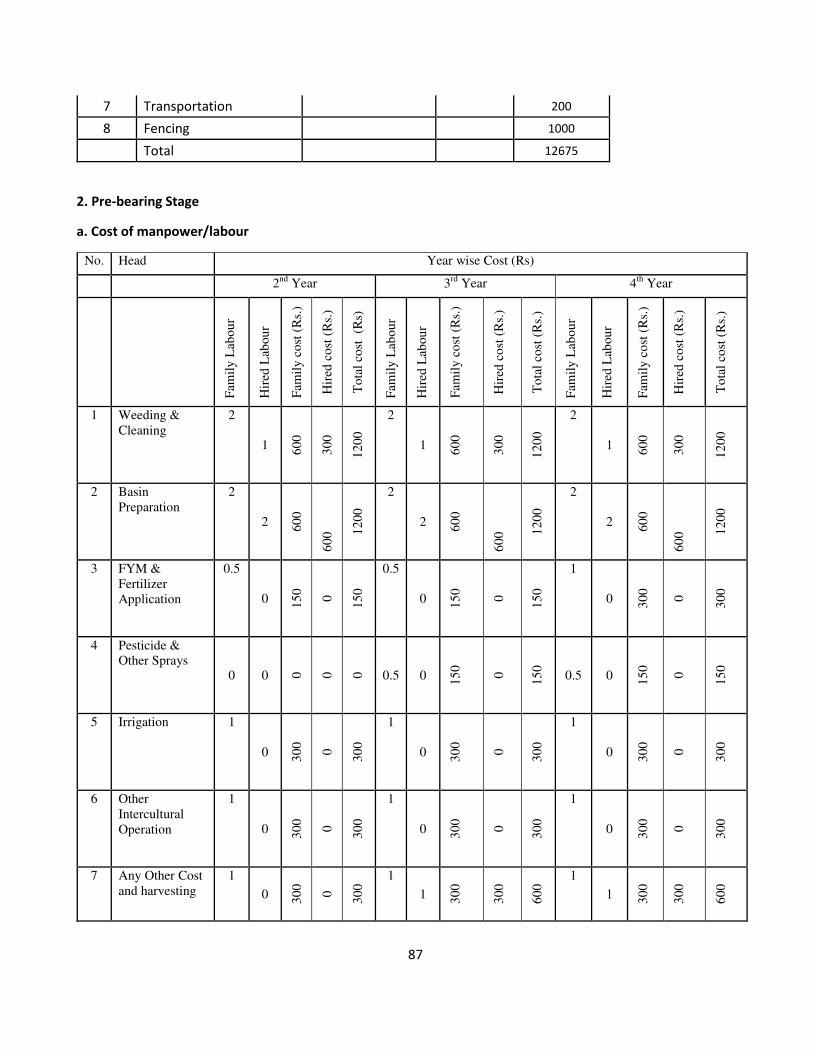
87
7 Transportation
200
8 Fencing
1000
Total 12675
2. Pre-bearing Stage
a. Cost of manpower/labour
No. Head Year wise Cost (Rs)
2nd
Year 3rd
Year 4th
Year
Fam
ily
Lab
ou
r
Hir
ed L
abou
r
Fam
ily
co
st (
Rs.
)
Hir
ed c
ost
(R
s.)
To
tal
cost
(R
s)
Fam
ily
Lab
ou
r
Hir
ed L
abou
r
Fam
ily
co
st (
Rs.
)
Hir
ed c
ost
(R
s.)
To
tal
cost
(R
s.)
Fam
ily
Lab
ou
r
Hir
ed L
abou
r
Fam
ily
co
st (
Rs.
)
Hir
ed c
ost
(R
s.)
To
tal
cost
(R
s.)
1 Weeding &
Cleaning
2
1 60
0
30
0
12
00
2
1 60
0
30
0
12
00
2
1 60
0
30
0
12
00
2 Basin
Preparation
2
2 60
0
60
0 12
00
2
2 60
0
60
0 12
00
2
2 60
0
60
0 12
00
3 FYM &
Fertilizer
Application
0.5
0 15
0
0
15
0
0.5
0 15
0
0
15
0
1
0 3
00
0
30
0
4 Pesticide &
Other Sprays 0 0 0
0
0
0.5 0 15
0
0
15
0
0.5 0 15
0
0
15
0
5 Irrigation 1
0 30
0
0
30
0
1
0 30
0
0
30
0
1
0 30
0
0
30
0
6 Other
Intercultural
Operation
1
0 30
0
0
30
0
1
0 30
0
0
30
0
1
0 30
0
0
30
0
7 Any Other Cost
and harvesting
1
0 30
0
0
30
0 1
1 30
0
30
0
60
0 1
1 30
0
30
0
60
0
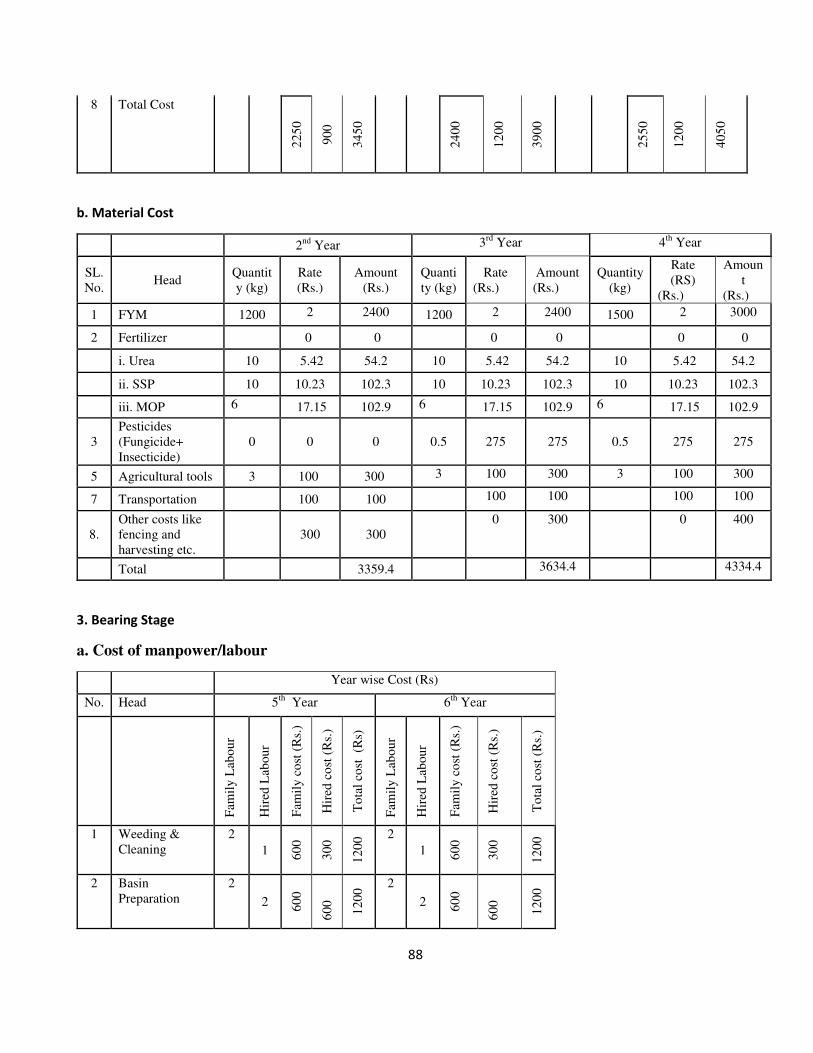
88
8 Total Cost
22
50
90
0
34
50
24
00
12
00
39
00
25
50
12
00
40
50
b. Material Cost
2nd
Year 3rd
Year 4th
Year
SL.
No. Head
Quantit
y (kg)
Rate
(Rs.)
Amount
(Rs.)
Quanti
ty (kg)
Rate
(Rs.)
Amount
(Rs.)
Quantity
(kg)
Rate
(RS)
(Rs.)
Amoun
t
(Rs.)
1 FYM 1200 2 2400 1200 2 2400 1500 2 3000
2 Fertilizer
0 0 0 0 0 0
i. Urea 10 5.42 54.2 10 5.42 54.2 10 5.42 54.2
ii. SSP 10 10.23 102.3 10 10.23 102.3 10 10.23 102.3
iii. MOP 6 17.15 102.9 6 17.15 102.9 6 17.15 102.9
3
Pesticides
(Fungicide+
Insecticide)
0 0 0 0.5 275 275 0.5 275 275
5 Agricultural tools 3 100 300 3 100 300 3 100 300
7 Transportation 100 100 100 100 100 100
8.
Other costs like
fencing and
harvesting etc.
300 300
0 300 0 400
Total 3359.4 3634.4 4334.4
3. Bearing Stage
a. Cost of manpower/labour
Year wise Cost (Rs)
No. Head 5th
Year 6th
Year
Fam
ily
Lab
ou
r
Hir
ed L
abou
r
Fam
ily
co
st (
Rs.
)
Hir
ed c
ost
(R
s.)
To
tal
cost
(R
s)
Fam
ily
Lab
ou
r
Hir
ed L
abou
r
Fam
ily
co
st (
Rs.
)
Hir
ed c
ost
(R
s.)
To
tal
cost
(R
s.)
1 Weeding &
Cleaning
2
1 60
0
30
0
12
00 2
1 60
0
30
0
12
00
2 Basin
Preparation
2
2 60
0
60
0
12
00 2
2 60
0
60
0
12
00
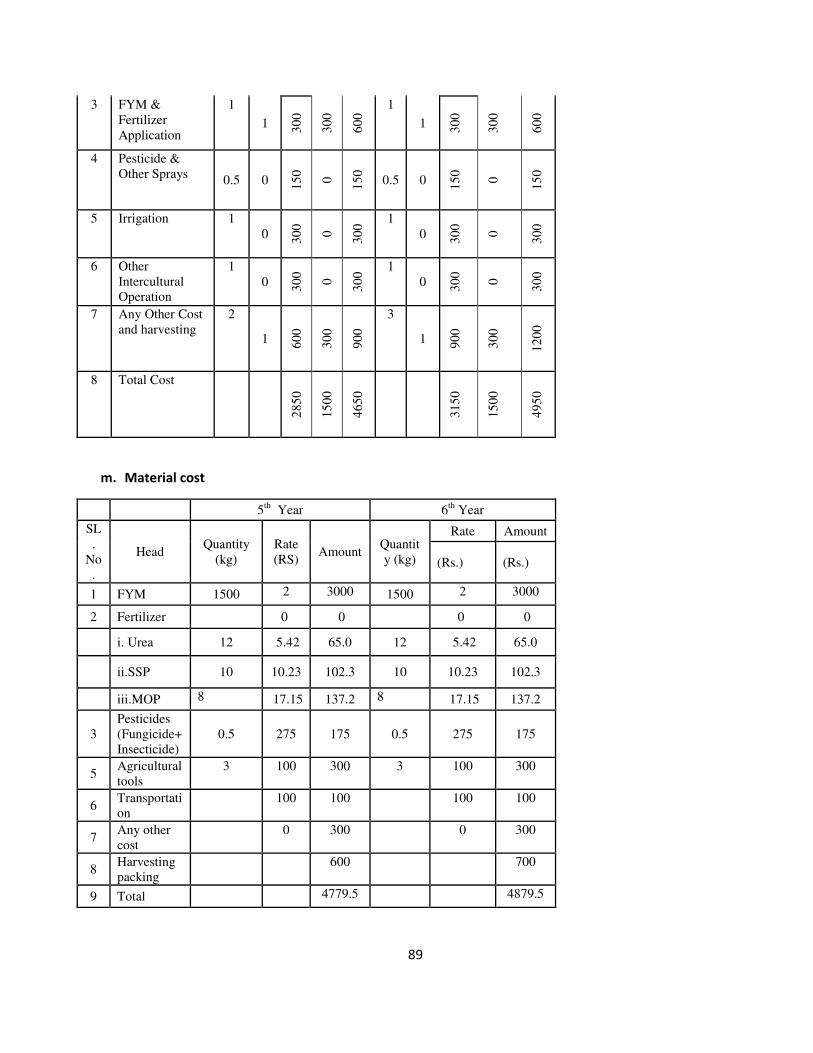
89
3 FYM &
Fertilizer
Application
1
1 30
0
30
0
60
0 1
1 30
0
30
0
60
0
4 Pesticide &
Other Sprays 0.5 0 1
50
0
15
0
0.5 0 15
0
0
15
0
5 Irrigation 1
0 30
0
0
30
0 1
0 30
0
0
30
0
6 Other
Intercultural
Operation
1
0 30
0
0
30
0 1
0 30
0
0
30
0
7 Any Other Cost
and harvesting
2
1 60
0
30
0
90
0
3
1 90
0
30
0
12
00
8 Total Cost
28
50
15
00
46
50
31
50
15
00
49
50
m. Material cost
5th
Year 6th
Year
SL
.
No
.
Head Quantity
(kg)
Rate
(RS) Amount
Quantit
y (kg)
Rate Amount
(Rs.) (Rs.)
1 FYM 1500 2 3000 1500 2 3000
2 Fertilizer 0 0 0 0
i. Urea 12 5.42 65.0 12 5.42 65.0
ii.SSP 10 10.23 102.3 10 10.23 102.3
iii.MOP 8 17.15 137.2 8 17.15 137.2
3
Pesticides
(Fungicide+
Insecticide)
0.5 275 175 0.5 275 175
5 Agricultural
tools
3 100 300 3 100 300
6 Transportati
on
100 100 100 100
7 Any other
cost
0 300 0 300
8 Harvesting
packing
600 700
9 Total 4779.5 4879.5

90
4. Cost of cultivation from 1st
to 6th
year
S. No.
Fruit crop Non Progressive Farmer
Manpower cost
(Rs.)
Ma
teri
al
cost
(R
s.)
Gra
nd
Tota
l (R
s.)
Fa
mil
y L
ab
ou
r
Hir
ed l
ab
ou
r
To
tal
La
bo
ur
cost
(Rs.
)
1. Lime
17700
8400
26100
33662
.2
59762
.2
5. Return
No. Head
3th
Yea
r
4th
Yea
r
5th
Yea
r
6th
Yea
r
1. Total fruit
harvested/Tree
25 44 83 125
2. Total
Production fruit
(Nos./tree)
15000 26400 49800 75000
3. Total return
from the sale of
fruits @ Rs.
1.25/fruit
18750 33000 62250 150000
Total return
from plants sale
@ Rs. 15/plant
0 0 0 0
Total Return
(Rs.)
18750 33000 62250 150000
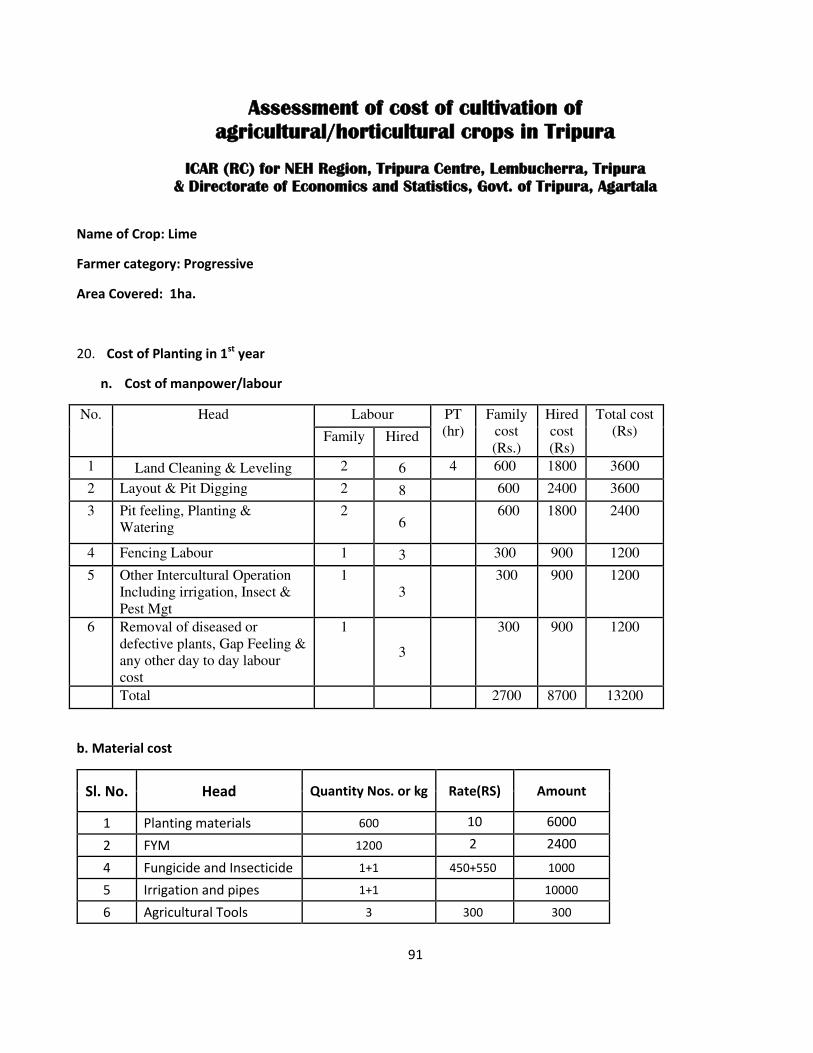
91
Assessment of cost of cultivation of
agricultural/horticultural crops in Tripura
ICAR (RC) for NEH Region, Tripura Centre, Lembucherra, Tripura
& Directorate of Economics and Statistics, Govt. of Tripura, Agartala
Name of Crop: Lime
Farmer category: Progressive
Area Covered: 1ha.
20. Cost of Planting in 1st
year
n. Cost of manpower/labour
No. Head Labour PT
(hr)
Family
cost
(Rs.)
Hired
cost
(Rs)
Total cost
(Rs) Family Hired
1 Land Cleaning & Leveling 2 6 4 600 1800 3600
2 Layout & Pit Digging 2 8 600 2400 3600
3 Pit feeling, Planting &
Watering
2 6
600 1800 2400
4 Fencing Labour 1 3 300 900 1200
5 Other Intercultural Operation
Including irrigation, Insect &
Pest Mgt
1
3
300 900 1200
6 Removal of diseased or
defective plants, Gap Feeling &
any other day to day labour
cost
1
3
300 900 1200
Total 2700 8700 13200
b. Material cost
Sl. No. Head Quantity Nos. or kg Rate(RS) Amount
1 Planting materials 600 10 6000
2 FYM 1200 2 2400
4 Fungicide and Insecticide 1+1 450+550 1000
5 Irrigation and pipes 1+1 10000
6 Agricultural Tools 3 300 300

92
7 Transportation 0 300
8 Fencing
3000
Total 23000
2. Pre-bearing Stage
a. Cost of manpower/labour
No. Head Year wise Cost (Rs)
2nd
Year 3rd
Year 4th
Year
Fam
ily
Lab
ou
r
Hir
ed L
abou
r
Fam
ily
co
st (
Rs.
)
Hir
ed c
ost
(R
s.)
To
tal
cost
(R
s)
Fam
ily
Lab
ou
r
Hir
ed L
abou
r
Fam
ily
co
st (
Rs.
)
Hir
ed c
ost
(R
s.)
To
tal
cost
(R
s.)
Fam
ily
Lab
ou
r
Hir
ed L
abou
r
Fam
ily
co
st (
Rs.
)
Hir
ed c
ost
(R
s.)
To
tal
cost
(R
s.)
1 Weeding &
Cleaning
2
2 60
0
60
0
12
00
2
2 60
0
60
0
12
00
2
2 60
0
60
0
12
00
2 Basin
Preparation
2
2 60
0
60
0 12
00
2
2 60
0
60
0 12
00
2
3 60
0
90
0 15
00
3 FYM &
Fertilizer
Application
1
1 30
0
30
0
60
0
1
1 30
0
30
0
60
0
1
1 30
0
30
0
60
0
4 Pesticide &
Other Sprays 1 1 3
00
30
0
60
0
1 1 30
0
30
0
60
0
1 1 30
0
30
0
60
0
5 Irrigation 1
3 30
0
30
0
60
0
1
3 30
0
30
0
60
0
1
3 30
0
30
0
60
0
6 Other
Intercultural
Operation
1
2 30
0
60
0
90
0
2
2 60
0
60
0
12
00
2
2 60
0
60
0
12
00
7 Any Other Cost
and harvesting
1
2 30
0
60
0
90
0
1
2 30
0
60
0
90
0
1
3 30
0
90
0
12
00

93
8 Total Cost
27
00
33
00
60
00
30
00
33
00
63
00
30
00
39
00
69
00
b. Material Cost
2nd
Year 3rd
Year 4th
Year
SL.
No. Head
Quantity
(kg)
Rate
(Rs.)
Amount
(Rs.)
Quantity
(kg)
Rate
(Rs.)
Amount
(Rs.)
Quantity
(kg)
Rate
(Rs.)
Amount
(Rs.)
1 FYM 1500 2 3000 1500 2 3000 1800 2 3600
2 Fertilizer
0 0 0 0 0
i. Urea 15 5.42 81.3 15 5.42 81.3 20 5.42 108.4
ii. SSP 15 10.23 153.5 15 10.23 153.5 18 10.23 184.1
iii. MOP 8 17.15 137.2 8 17.15 137.2 10 17.15 171.5
3
Pesticides
(Fungicide+
Insecticide)
0.5+1 225+5
50 775 1+1.5 450+550 1275 1+1.5
450+5
50 1275
5 Agricultural
tools 5 100 500
5 100 500 5 100 500
7 Transportati
on 100 100
100 100 100 100
8.
Other costs
like fencing
and
harvesting
etc.
1000 1000
0 600 0 600
Total 5747 5847 6539
3. Bearing Stage
a. Cost of manpower/labour
Year wise Cost (Rs)
No. Head 5th
Year 6th
Year
Fam
ily
Lab
ou
r
Hir
ed L
abou
r
Fam
ily
co
st (
Rs.
)
Hir
ed c
ost
(R
s.)
To
tal
cost
(R
s)
Fam
ily
Lab
ou
r
Hir
ed L
abou
r
Fam
ily
co
st (
Rs.
)
Hir
ed c
ost
(R
s.)
To
tal
cost
(R
s.)
1 Weeding &
Cleaning
2
2 60
0
60
0
12
00 2
2 60
0
60
0
12
00

94
2 Basin
Preparation
2
3 60
0
90
0
15
00 2
3 60
0
90
0
15
00
3 FYM &
Fertilizer
Application
1
1 30
0
30
0
60
0 1
1 30
0
30
0
60
0
4 Pesticide &
Other Sprays 1 1 3
00
30
0
60
0
1 1 30
0
30
0
60
0
5 Irrigation 1
3 30
0
30
0
60
0 1
3 30
0
30
0
60
0
6 Other
Intercultural
Operation
2
2 60
0
60
0
12
00 2
2 60
0
60
0
12
00
7 Any Other
Cost(harvesting)
1
4 30
0
12
00
15
00
1
4 30
0
12
00
15
00
8 Total Cost
30
00
42
00
72
00
30
00
42
00
72
00
o. Material cost
5th
Year 6th
Year
SL
.
No
.
Head Quantity
(kg)
Rate
(RS) Amount
Quantit
y (kg)
Rate
(Rs.)
Amount
(Rs.)
1 FYM 1800 2 3600 1800 2 3600
2 Fertilizer 0 0
i. Urea 20 5.42 108.4 25 5.42 135.5
ii.SSP 18 10.23 184.1 15 10.23 153.5
iii.MOP 10 17.15 171.5 10 17.15 171.5
3
Pesticides
(Fungicide+
Insecticide)
1+1.5 450+
550 1275 1+1.5 450+550 1275
5 Agricultural
tools
5 100 500 5 100 500
6 Transportati
on
100 100 300 300
7 Any other
cost
0 600 0 500
8 Harvesting
packing
-- 900 -- 1000

95
4. Cost of cultivation from 1st
to 6th
year
S. No.
Fruit crop Progressive Farmer
Manpower cost (Rs.)
Ma
teri
al
cost
(R
s.)
Gra
nd
Tota
l (R
s.)
Fa
mil
y L
ab
ou
r
Hir
ed l
ab
ou
r
To
tal
La
bo
ur
cost
(Rs.
)
1. Lime
17400
27600
45000
56207.5
101207.5
5. Cost of plant nursery
S. No. Nursery plants 5th
Year 6th
Year
1. Number of layered plants 1000 3000
2. Cost of raising plants (Rs.) 2500 6500
6. Return
No. Head
3th
Yea
r
4th
Yea
r
5th
Yea
r
6th
Yea
r
1. Total fruit
harvested/Tree
35 65 175 250
2. Total
Production fruit
(Nos./tree)
21000 39000 105000 150000
3. Total return
from the sale of
fruits @ Rs.
1.5/fruit
31500 58500 157500 225000
Total 7439 7635.5
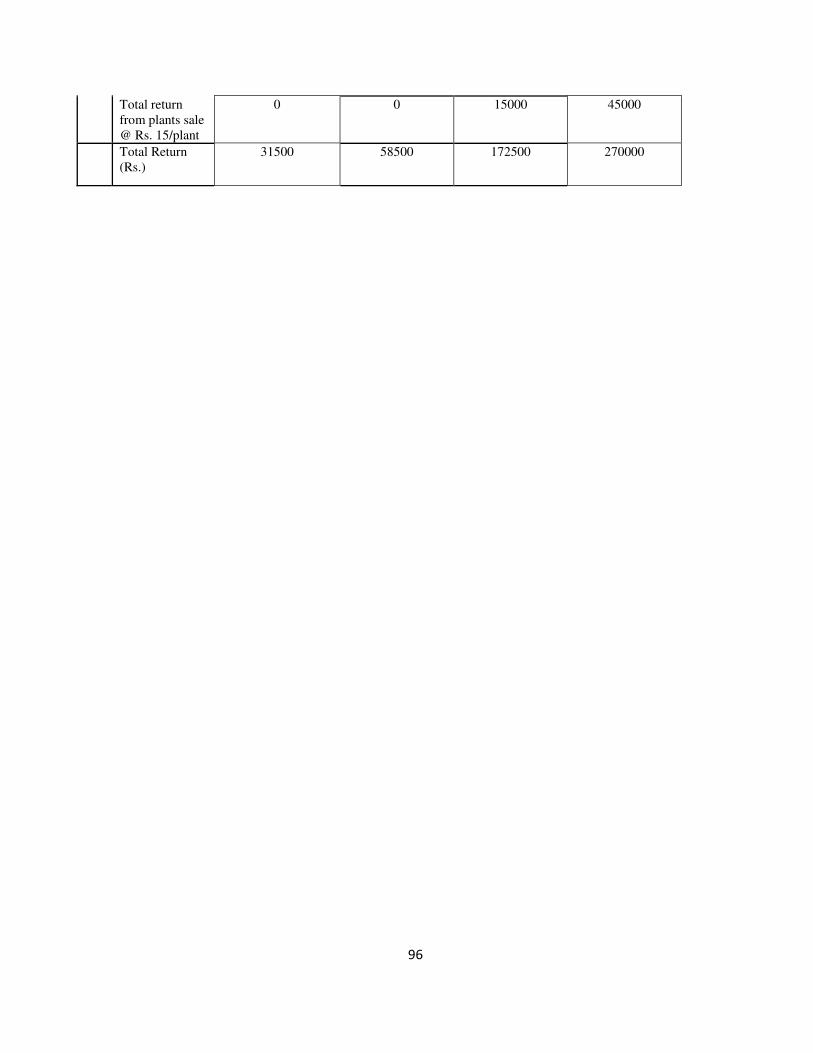
96
Total return
from plants sale
@ Rs. 15/plant
0 0 15000 45000
Total Return
(Rs.)
31500 58500 172500 270000

97
Assessment of cost of cultivation of
agricultural/horticultural crops in Tripura
ICAR (RC) for NEH Region, Tripura Centre, Lembucherra, Tripura
& Directorate of Economics and Statistics, Govt. of Tripura, Agartala
Name of Crop: Litchi
Farmer category: Non progressive
Area Covered: 1ha.
21. Cost of Planting in 1st
year
p. Cost of manpower/labour
No. Head Labour PT
(hr)
Family
cost
(Rs.)
Hired
cost
(Rs)
Total cost
(Rs) Family Hired
1 Land Cleaning & Leveling 3 3 0 900 900 1800
2 Layout & Pit Digging 3 3 900 900 1800
3 Pit feeling, Planting &
Watering
3 3
900 900 1800
4 Fencing Labour 2 0 600 0 600
5 Other Intercultural Operation
Including irrigation, Insect &
Pest Mgt
1
0
300 0 300
6 Removal of diseased or
defective plants, Gap Feeling &
any other day to day labour
cost
2
0
600 0 600
Total 4200 2700 6900
b. Material cost
Sl. No. Head Quantity Nos. or kg Rate(RS) Amount
1 Planting materials 178 30 5340
2 FYM 450 2 900
4 Fungicide and Insecticide 1 550 550
5 Irrigation and pipes 1+1 2000
6 Agricultural Tools 3 200 600
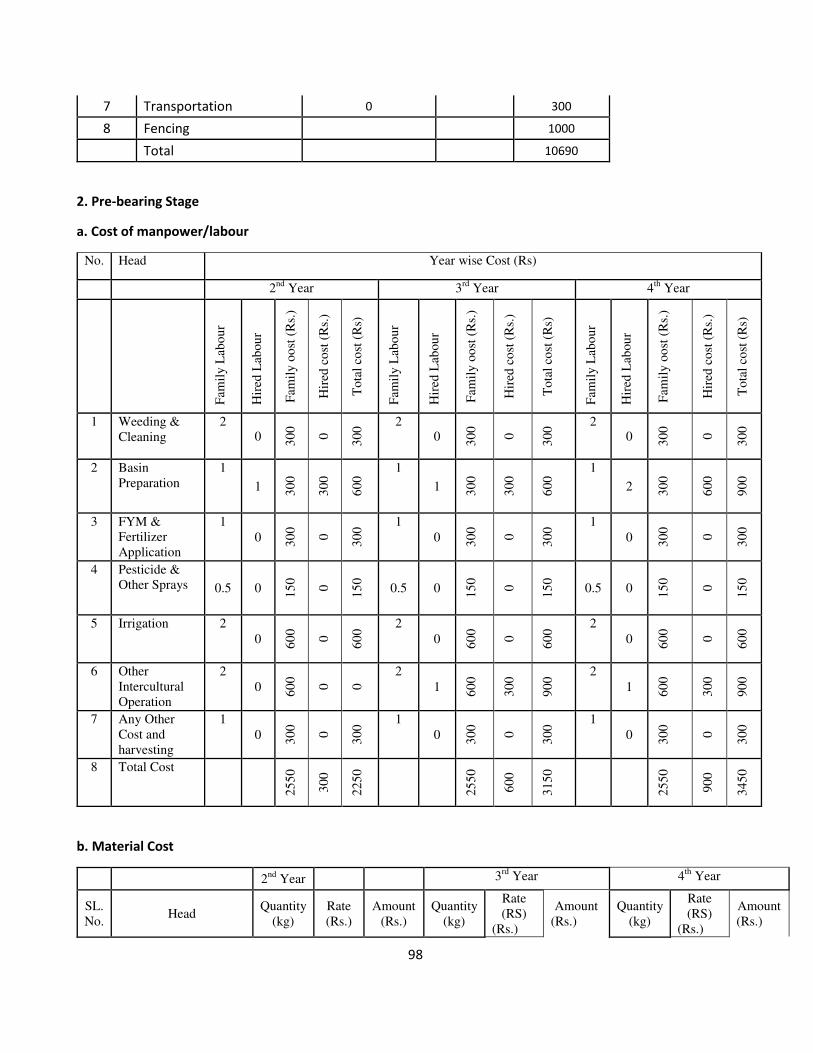
98
7 Transportation 0 300
8 Fencing
1000
Total 10690
2. Pre-bearing Stage
a. Cost of manpower/labour
No. Head Year wise Cost (Rs)
2nd
Year 3rd
Year 4th
Year
Fam
ily
Lab
ou
r
Hir
ed L
abou
r
Fam
ily
oo
st (
Rs.
)
Hir
ed c
ost
(R
s.)
To
tal
cost
(R
s)
Fam
ily
Lab
ou
r
Hir
ed L
abou
r
Fam
ily
oo
st (
Rs.
)
Hir
ed c
ost
(R
s.)
To
tal
cost
(R
s)
Fam
ily
Lab
ou
r
Hir
ed L
abou
r
Fam
ily
oo
st (
Rs.
)
Hir
ed c
ost
(R
s.)
To
tal
cost
(R
s)
1 Weeding &
Cleaning
2 0 3
00
0
30
0 2
0 30
0
0
30
0 2 0 3
00
0
30
0
2 Basin
Preparation
1
1 30
0
30
0
60
0 1
1 30
0
30
0
60
0 1
2 30
0
60
0
90
0
3 FYM &
Fertilizer
Application
1
0 30
0
0
30
0 1
0 30
0
0
30
0 1
0 30
0
0
30
0
4 Pesticide &
Other Sprays 0.5 0 15
0
0
15
0
0.5 0 15
0
0
15
0
0.5 0 15
0
0
15
0
5 Irrigation 2
0 60
0
0
60
0 2
0 60
0
0
60
0 2
0 60
0
0
60
0
6 Other
Intercultural
Operation
2
0 60
0
0
0
2
1 60
0
30
0
90
0 2
1 60
0
30
0
90
0
7 Any Other
Cost and
harvesting
1
0 30
0
0
30
0 1
0 30
0
0
30
0 1
0 30
0
0
30
0
8 Total Cost
25
50
30
0
22
50
25
50
60
0
31
50
25
50
90
0
34
50
b. Material Cost
2nd
Year 3rd
Year 4th
Year
SL.
No. Head
Quantity
(kg)
Rate
(Rs.)
Amount
(Rs.)
Quantity
(kg)
Rate
(RS)
(Rs.)
Amount
(Rs.)
Quantity
(kg)
Rate
(RS)
(Rs.)
Amount
(Rs.)
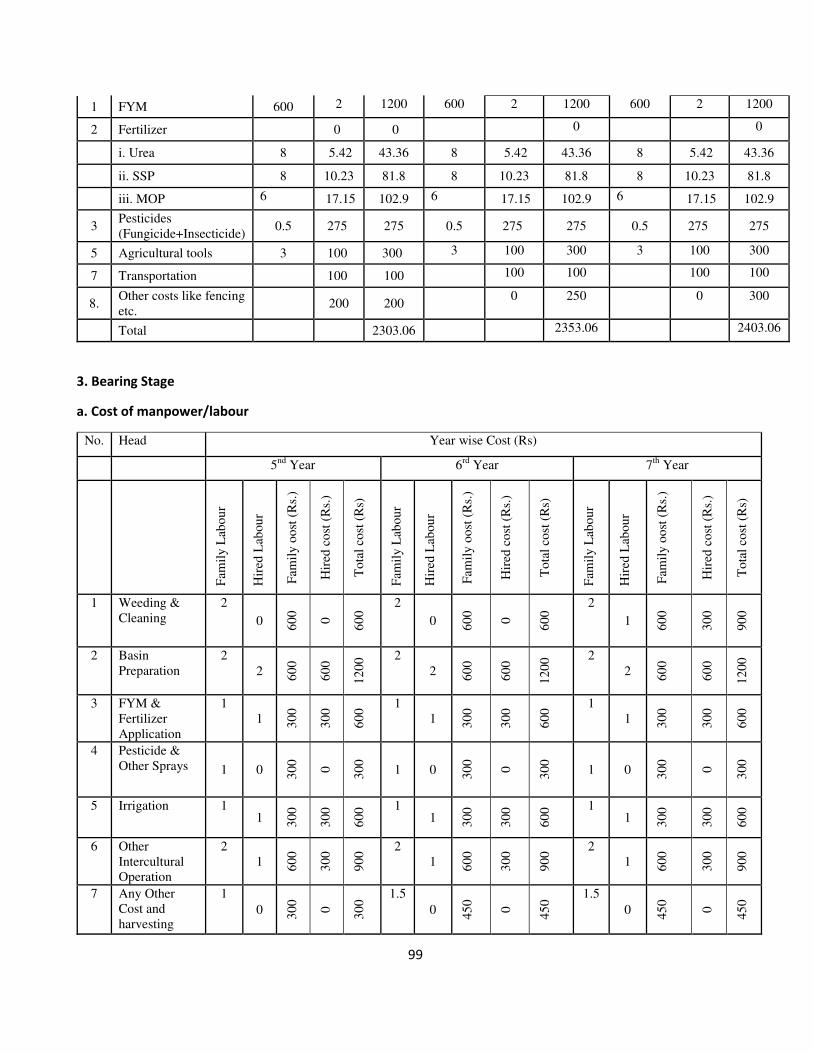
99
1 FYM 600 2 1200 600 2 1200 600 2 1200
2 Fertilizer
0 0 0 0
i. Urea 8 5.42 43.36 8 5.42 43.36 8 5.42 43.36
ii. SSP 8 10.23 81.8 8 10.23 81.8 8 10.23 81.8
iii. MOP 6 17.15 102.9 6 17.15 102.9 6 17.15 102.9
3 Pesticides
(Fungicide+Insecticide) 0.5 275 275 0.5 275 275 0.5 275 275
5 Agricultural tools 3 100 300 3 100 300 3 100 300
7 Transportation 100 100 100 100 100 100
8. Other costs like fencing
etc. 200 200
0 250 0 300
Total 2303.06 2353.06 2403.06
3. Bearing Stage
a. Cost of manpower/labour
No. Head Year wise Cost (Rs)
5nd
Year 6rd
Year 7th
Year
Fam
ily
Lab
ou
r
Hir
ed L
abou
r
Fam
ily
oo
st (
Rs.
)
Hir
ed c
ost
(R
s.)
To
tal
cost
(R
s)
Fam
ily
Lab
ou
r
Hir
ed L
abou
r
Fam
ily
oo
st (
Rs.
)
Hir
ed c
ost
(R
s.)
To
tal
cost
(R
s)
Fam
ily
Lab
ou
r
Hir
ed L
abou
r
Fam
ily
oo
st (
Rs.
)
Hir
ed c
ost
(R
s.)
To
tal
cost
(R
s)
1 Weeding &
Cleaning
2
0 60
0
0
60
0 2
0 60
0
0
60
0 2
1 60
0
30
0
90
0
2 Basin
Preparation
2
2 60
0
60
0
12
00 2
2 60
0
60
0
12
00 2
2 60
0
60
0
12
00
3 FYM &
Fertilizer
Application
1
1 30
0
30
0
60
0 1
1 30
0
30
0
60
0 1
1 30
0
30
0
60
0
4 Pesticide &
Other Sprays 1 0 30
0
0
30
0
1 0 30
0
0
30
0
1 0 30
0
0
30
0
5 Irrigation 1 1 3
00
30
0
60
0 1
1 30
0
30
0
60
0 1
1 30
0
30
0
60
0
6 Other
Intercultural
Operation
2
1 60
0
30
0
90
0 2
1 60
0
30
0
90
0 2
1 60
0
30
0
90
0
7 Any Other
Cost and
harvesting
1
0 30
0
0
30
0 1.5
0 45
0
0
45
0 1.5
0 45
0
0
45
0

100
8 Total Cost
30
00
15
00
45
00
31
50
15
00
46
50
31
50
18
00
49
50
b. Material cost
5th
Year 6th
Year 7th
Year
SL
.
No
.
Head Quantity
(kg)
Rate
(RS) Amount
Quantit
y (kg)
Rate Amount Quanti
ty (kg) Rate Amount
(Rs.) (Rs.) (Rs.) (Rs.)
1 FYM 900 2 1800 900 2 1800 900 2 1800
2 Fertilizer 0 0 0
i. Urea 8 5.42 43.36 8 5.42 43.36 8 5.42 43.36
ii.SSP 8 10.23 81.8 8 10.23 81.8 8 10.23 81.8
iii.MOP 6 17.15 102.9 6 17.15 102.9 6 17.15 102.9
3
Pesticides
(Fungicide+
Insecticide)
0.5 275 275 0.5 275 275 0.5 275 275
5 Agricultural
tools 3 100 300
3 100 300 3 300
6 Transportati
on 100
100 100
7 Any other
cost 200
200 300
8 Harvesting
packing 250
300 300
9 Total 3153.06 3203.06 3303.06
c. Cost of manpower/labour
No. Head Year wise Cost (Rs)
8th
Year 9th
Year 10th
Year
Fam
ily
Lab
ou
r
Hir
ed L
abou
r
Fam
ily
oo
st (
Rs.
)
Hir
ed c
ost
(R
s.)
To
tal
cost
(R
s)
Fam
ily
Lab
ou
r
Hir
ed L
abou
r
Fam
ily
oo
st (
Rs.
)
Hir
ed c
ost
(R
s.)
To
tal
cost
(R
s)
Fam
ily
Lab
ou
r
Hir
ed L
abou
r
Fam
ily
oo
st (
Rs.
)
Hir
ed c
ost
(R
s.)
To
tal
cost
(R
s)
1 Weeding &
Cleaning
2
1 60
0
30
0
90
0 2
1 60
0
30
0
90
0 2
1 60
0
30
0
90
0
2 Basin
Preparation
2
2 60
0
60
0
12
00 2
2 60
0
60
0
12
00 3
2 90
0
90
0
18
00
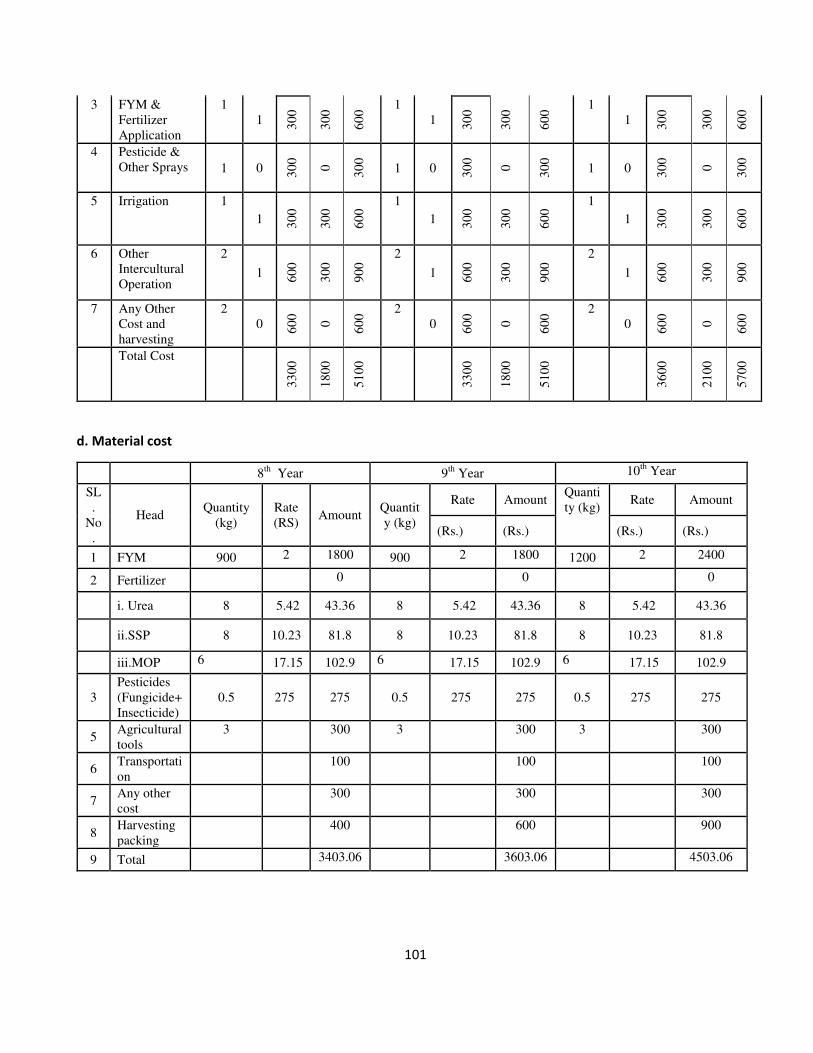
101
3 FYM &
Fertilizer
Application
1
1 30
0
30
0
60
0 1
1 30
0
30
0
60
0 1
1 30
0
30
0
60
0
4 Pesticide &
Other Sprays 1 0 30
0
0
30
0
1 0 30
0
0
30
0
1 0 30
0
0
30
0
5 Irrigation 1
1 30
0
30
0
60
0 1
1 30
0
30
0
60
0 1
1 30
0
30
0
60
0
6 Other
Intercultural
Operation
2
1 60
0
30
0
90
0 2
1 60
0
30
0
90
0 2
1 60
0
30
0
90
0
7 Any Other
Cost and
harvesting
2
0 60
0
0
60
0 2
0 60
0
0
60
0 2
0 60
0
0
60
0
Total Cost
33
00
18
00
51
00
33
00
18
00
51
00
36
00
21
00
57
00
d. Material cost
8th
Year 9th
Year 10th
Year
SL
.
No
.
Head Quantity
(kg)
Rate
(RS) Amount
Quantit
y (kg)
Rate Amount Quanti
ty (kg) Rate Amount
(Rs.) (Rs.) (Rs.) (Rs.)
1 FYM 900 2 1800 900 2 1800 1200 2 2400
2 Fertilizer 0 0 0
i. Urea 8 5.42 43.36 8 5.42 43.36 8 5.42 43.36
ii.SSP 8 10.23 81.8 8 10.23 81.8 8 10.23 81.8
iii.MOP 6 17.15 102.9 6 17.15 102.9 6 17.15 102.9
3
Pesticides
(Fungicide+
Insecticide)
0.5 275 275 0.5 275 275 0.5 275 275
5 Agricultural
tools
3 300 3 300 3 300
6 Transportati
on
100 100 100
7 Any other
cost
300 300 300
8 Harvesting
packing
400 600 900
9 Total 3403.06 3603.06 4503.06
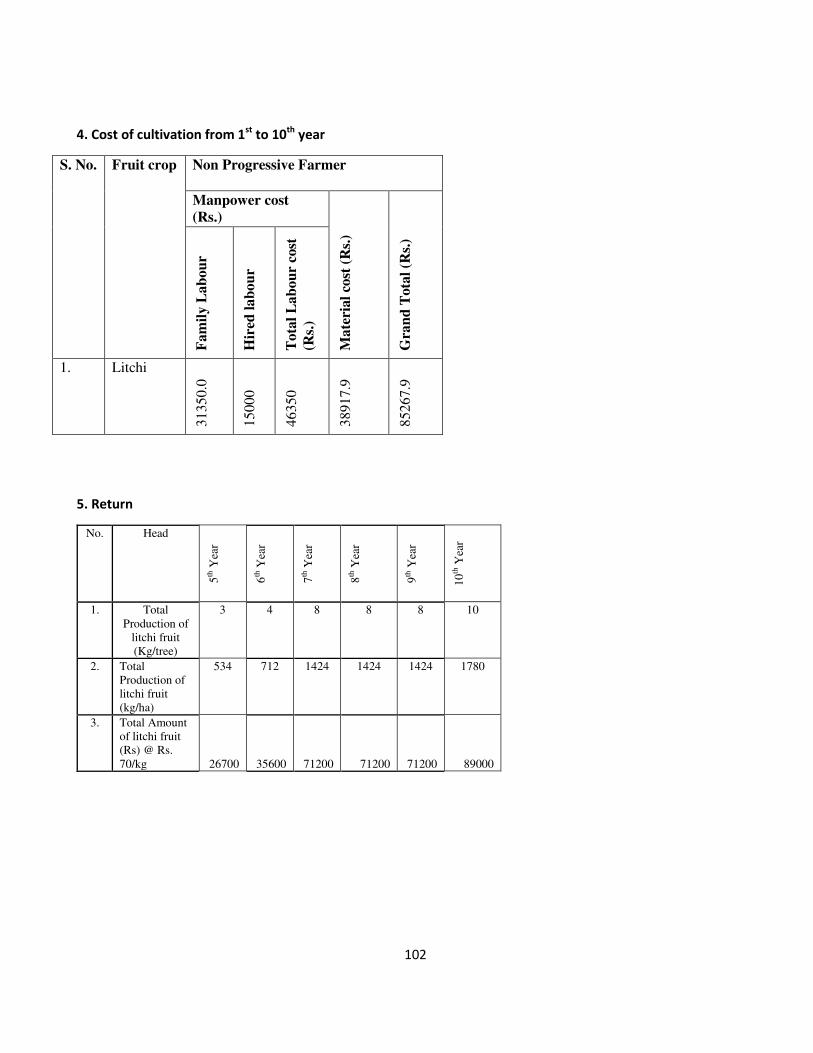
102
4. Cost of cultivation from 1st
to 10th
year
S. No.
Fruit crop Non Progressive Farmer
Manpower cost
(Rs.)
Ma
teri
al
cost
(R
s.)
Gra
nd
Tota
l (R
s.)
Fa
mil
y L
ab
ou
r
Hir
ed l
ab
ou
r
To
tal
La
bo
ur
cost
(Rs.
)
1. Litchi
3135
0.0
1500
0
4635
0
3891
7.9
8526
7.9
5. Return
No. Head
5th
Yea
r
6th
Yea
r
7th
Yea
r
8th
Yea
r
9th
Yea
r
10
th Y
ear
1. Total
Production of
litchi fruit
(Kg/tree)
3 4 8 8 8 10
2. Total
Production of
litchi fruit
(kg/ha)
534 712 1424 1424 1424 1780
3. Total Amount
of litchi fruit
(Rs) @ Rs.
70/kg 26700 35600 71200 71200 71200 89000
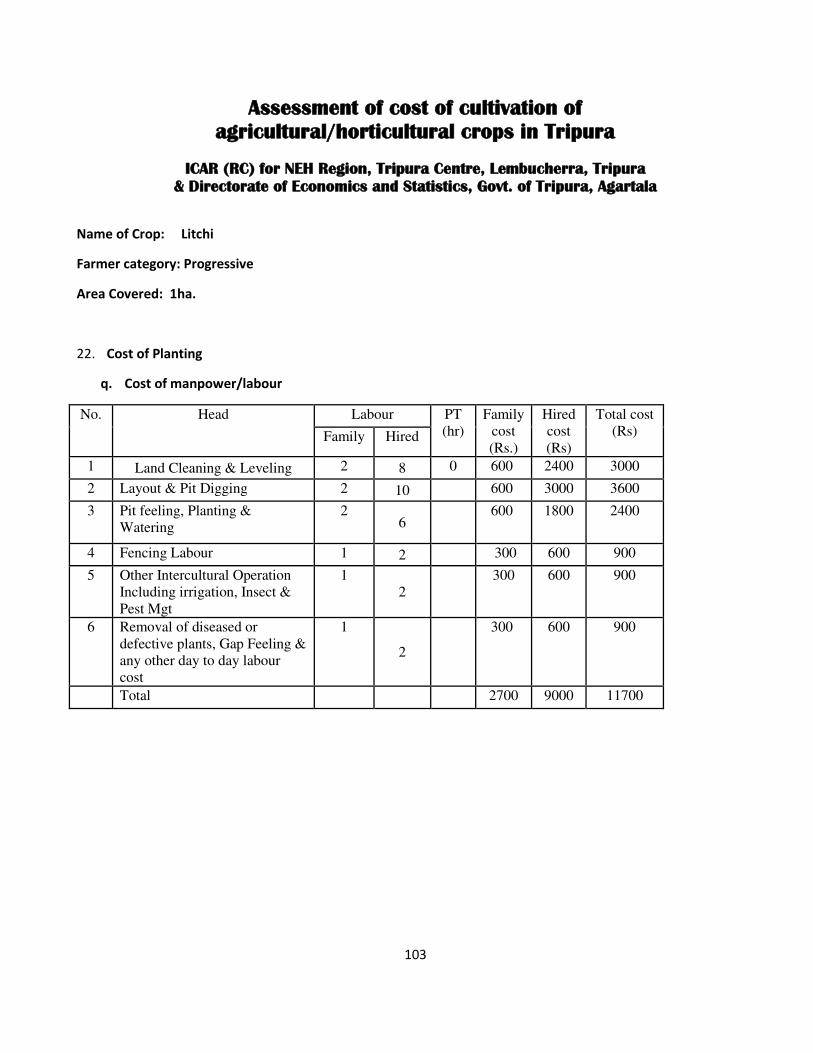
103
Assessment of cost of cultivation of
agricultural/horticultural crops in Tripura
ICAR (RC) for NEH Region, Tripura Centre, Lembucherra, Tripura
& Directorate of Economics and Statistics, Govt. of Tripura, Agartala
Name of Crop: Litchi
Farmer category: Progressive
Area Covered: 1ha.
22. Cost of Planting
q. Cost of manpower/labour
No. Head Labour PT
(hr)
Family
cost
(Rs.)
Hired
cost
(Rs)
Total cost
(Rs) Family Hired
1 Land Cleaning & Leveling 2 8 0 600 2400 3000
2 Layout & Pit Digging 2 10 600 3000 3600
3 Pit feeling, Planting &
Watering
2 6
600 1800 2400
4 Fencing Labour 1 2 300 600 900
5 Other Intercultural Operation
Including irrigation, Insect &
Pest Mgt
1
2
300 600 900
6 Removal of diseased or
defective plants, Gap Feeling &
any other day to day labour
cost
1
2
300 600 900
Total 2700 9000 11700
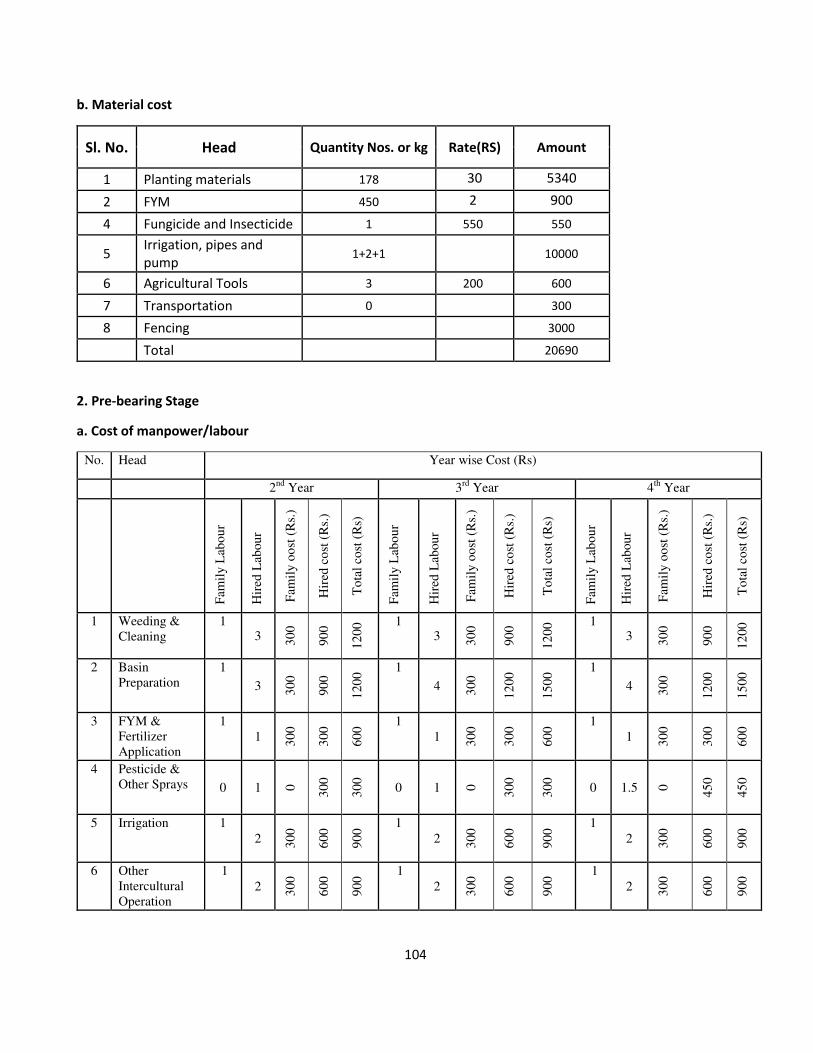
104
b. Material cost
Sl. No. Head Quantity Nos. or kg Rate(RS) Amount
1 Planting materials 178 30 5340
2 FYM 450 2 900
4 Fungicide and Insecticide 1 550 550
5 Irrigation, pipes and
pump 1+2+1 10000
6 Agricultural Tools 3 200 600
7 Transportation 0 300
8 Fencing
3000
Total 20690
2. Pre-bearing Stage
a. Cost of manpower/labour
No. Head Year wise Cost (Rs)
2nd
Year 3rd
Year 4th
Year
Fam
ily
Lab
ou
r
Hir
ed L
abou
r
Fam
ily
oo
st (
Rs.
)
Hir
ed c
ost
(R
s.)
To
tal
cost
(R
s)
Fam
ily
Lab
ou
r
Hir
ed L
abou
r
Fam
ily
oo
st (
Rs.
)
Hir
ed c
ost
(R
s.)
To
tal
cost
(R
s)
Fam
ily
Lab
ou
r
Hir
ed L
abou
r
Fam
ily
oo
st (
Rs.
)
Hir
ed c
ost
(R
s.)
To
tal
cost
(R
s)
1 Weeding &
Cleaning
1 3 3
00
90
0
12
00 1 3 3
00
90
0
12
00 1
3 30
0
90
0
12
00
2 Basin
Preparation
1
3 30
0
90
0
12
00 1
4 30
0
12
00
15
00 1
4 30
0
12
00
15
00
3 FYM &
Fertilizer
Application
1
1 30
0
30
0
60
0 1
1 30
0
30
0
60
0 1
1 30
0
30
0
60
0
4 Pesticide &
Other Sprays 0 1 0
30
0
30
0
0 1 0
30
0
30
0
0 1.5 0
45
0
45
0
5 Irrigation 1
2 30
0
60
0
90
0 1
2 30
0
60
0
90
0 1
2 30
0
60
0
90
0
6 Other
Intercultural
Operation
1
2 30
0
60
0
90
0 1
2 30
0
60
0
90
0 1
2 30
0
60
0
90
0
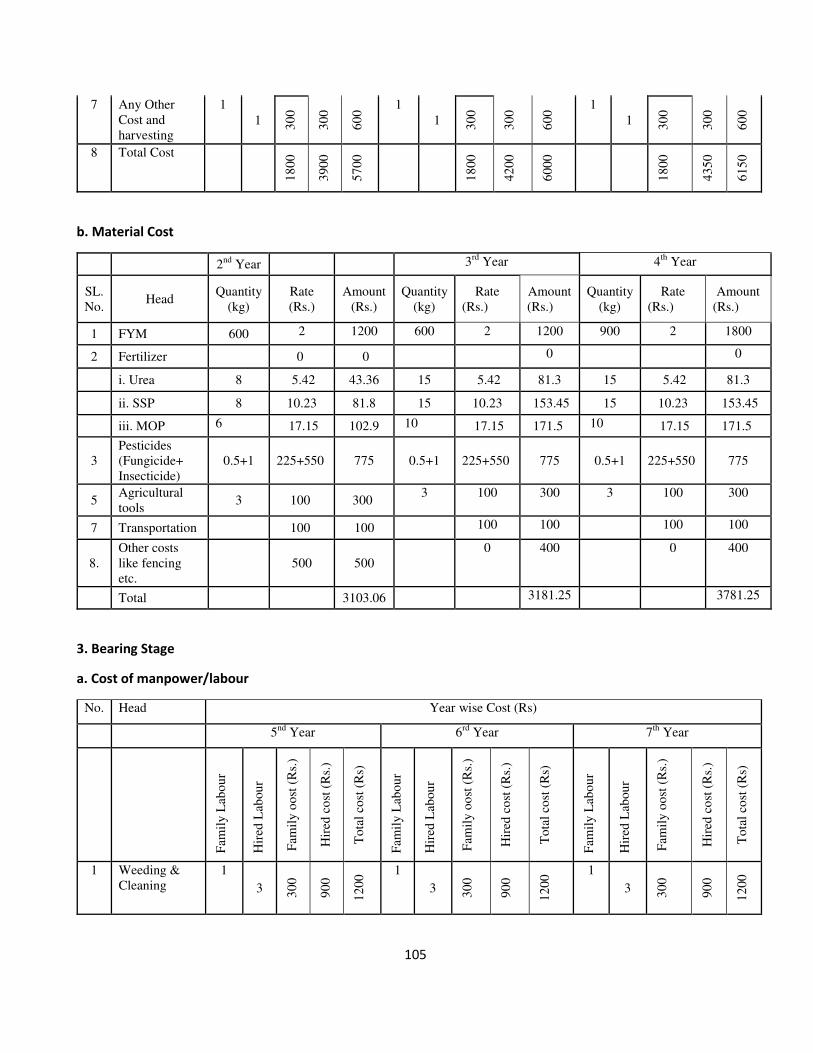
105
7 Any Other
Cost and
harvesting
1
1 30
0
30
0
60
0 1
1 30
0
30
0
60
0 1
1 30
0
30
0
60
0
8 Total Cost
18
00
39
00
57
00
18
00
42
00
60
00
18
00
43
50
61
50
b. Material Cost
2nd
Year 3rd
Year 4th
Year
SL.
No. Head
Quantity
(kg)
Rate
(Rs.)
Amount
(Rs.)
Quantity
(kg)
Rate
(Rs.)
Amount
(Rs.)
Quantity
(kg)
Rate
(Rs.)
Amount
(Rs.)
1 FYM 600 2 1200 600 2 1200 900 2 1800
2 Fertilizer
0 0 0 0
i. Urea 8 5.42 43.36 15 5.42 81.3 15 5.42 81.3
ii. SSP 8 10.23 81.8 15 10.23 153.45 15 10.23 153.45
iii. MOP 6 17.15 102.9 10 17.15 171.5 10 17.15 171.5
3
Pesticides
(Fungicide+
Insecticide)
0.5+1 225+550 775 0.5+1 225+550 775 0.5+1 225+550 775
5 Agricultural
tools 3 100 300
3 100 300 3 100 300
7 Transportation 100 100 100 100 100 100
8.
Other costs
like fencing
etc.
500 500
0 400 0 400
Total 3103.06 3181.25 3781.25
3. Bearing Stage
a. Cost of manpower/labour
No. Head Year wise Cost (Rs)
5nd
Year 6rd
Year 7th
Year
Fam
ily
Lab
ou
r
Hir
ed L
abou
r
Fam
ily
oo
st (
Rs.
)
Hir
ed c
ost
(R
s.)
To
tal
cost
(R
s)
Fam
ily
Lab
ou
r
Hir
ed L
abou
r
Fam
ily
oo
st (
Rs.
)
Hir
ed c
ost
(R
s.)
To
tal
cost
(R
s)
Fam
ily
Lab
ou
r
Hir
ed L
abou
r
Fam
ily
oo
st (
Rs.
)
Hir
ed c
ost
(R
s.)
To
tal
cost
(R
s)
1 Weeding &
Cleaning
1
3 30
0
90
0
12
00 1
3 30
0
90
0
12
00 1
3 30
0
90
0
12
00
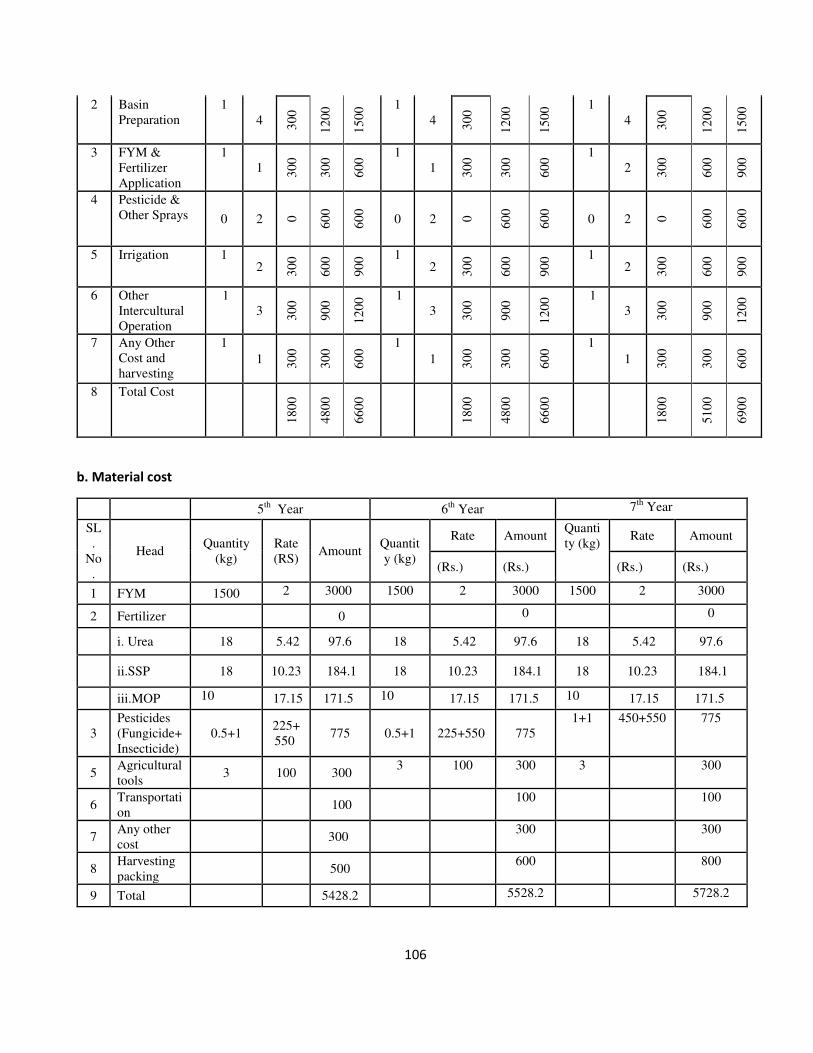
106
2 Basin
Preparation
1
4 30
0
12
00
15
00 1
4 30
0
12
00
15
00 1
4 30
0
12
00
15
00
3 FYM &
Fertilizer
Application
1
1 30
0
30
0
60
0 1
1 30
0
30
0
60
0 1
2 30
0
60
0
90
0
4 Pesticide &
Other Sprays 0 2 0
60
0
60
0
0 2 0
60
0
60
0
0 2 0
60
0
60
0
5 Irrigation 1 2 3
00
60
0
90
0 1
2 30
0
60
0
90
0 1
2 30
0
60
0
90
0
6 Other
Intercultural
Operation
1
3 30
0
90
0
12
00 1
3 30
0
90
0
12
00 1
3 30
0
90
0
12
00
7 Any Other
Cost and
harvesting
1
1 30
0
30
0
60
0 1
1 30
0
30
0
60
0 1
1 30
0
30
0
60
0
8 Total Cost
18
00
48
00
66
00
18
00
48
00
66
00
18
00
51
00
69
00
b. Material cost
5th
Year 6th
Year 7th
Year
SL
.
No
.
Head Quantity
(kg)
Rate
(RS) Amount
Quantit
y (kg)
Rate Amount Quanti
ty (kg) Rate Amount
(Rs.) (Rs.) (Rs.) (Rs.)
1 FYM 1500 2 3000 1500 2 3000 1500 2 3000
2 Fertilizer 0 0 0
i. Urea 18 5.42 97.6 18 5.42 97.6 18 5.42 97.6
ii.SSP 18 10.23 184.1 18 10.23 184.1 18 10.23 184.1
iii.MOP 10 17.15 171.5 10 17.15 171.5 10 17.15 171.5
3
Pesticides
(Fungicide+
Insecticide)
0.5+1 225+
550 775 0.5+1 225+550 775
1+1 450+550 775
5 Agricultural
tools 3 100 300
3 100 300 3 300
6 Transportati
on 100
100 100
7 Any other
cost 300
300 300
8 Harvesting
packing 500
600 800
9 Total 5428.2 5528.2 5728.2

107
c. Cost of manpower/labour
No. Head Year wise Cost (Rs)
8th
Year 9th
Year 10th
Year
F
amil
y L
abo
ur
Hir
ed L
abou
r
Fam
ily
oo
st (
Rs.
)
Hir
ed c
ost
(R
s.)
To
tal
cost
(R
s)
Fam
ily
Lab
ou
r
Hir
ed L
abou
r
Fam
ily
oo
st (
Rs.
)
Hir
ed c
ost
(R
s.)
To
tal
cost
(R
s)
Fam
ily
Lab
ou
r
Hir
ed L
abou
r
Fam
ily
oo
st (
Rs.
)
Hir
ed c
ost
(R
s.)
To
tal
cost
(R
s)
1 Weeding &
Cleaning
1
3 30
0
90
0
12
00 1
3 30
0
90
0
12
00 1
3 30
0
90
0
12
00
2 Basin
Preparation
1
4 30
0
12
00
15
00 1
4 30
0
12
00
15
00 1
4 30
0
12
00
15
00
3 FYM &
Fertilizer
Application
1
2 30
0
60
0
90
0 1
2 30
0
60
0
90
0 1
2 30
0
60
0
90
0
4 Pesticide &
Other Sprays 0 2 0
60
0
60
0
0 2 0
60
0
60
0
0 2 0
60
0
60
0
5 Irrigation 1
2 30
0
60
0
90
0 1
2 30
0
60
0
90
0 1
2 30
0
60
0
90
0
6 Other
Intercultural
Operation
1
3 30
0
90
0
12
00 1
3 30
0
90
0
12
00 1
3 30
0
90
0
12
00
7 Any Other
Cost and
harvesting
1
1 30
0
30
0
60
0 1
1.5 30
0
45
0
75
0 1
1 30
0
60
0
90
0
8 Total Cost
18
00
51
00
69
00
18
00
52
50
70
50
18
00
54
00
72
00
d. Material cost
8th
Year 9th
Year 10th
Year
SL
.
No
.
Head Quantity
(kg)
Rate
(RS) Amount
Quantit
y (kg)
Rate Amount Quanti
ty (kg) Rate Amount
(Rs.) (Rs.) (Rs.) (Rs.)
1 FYM 1500 2 3000 1500 2 3000 1500 2 3000
2 Fertilizer 0 0 0
i. Urea 22 5.42 119.2 22 5.42 119.2 22 5.42 119.2
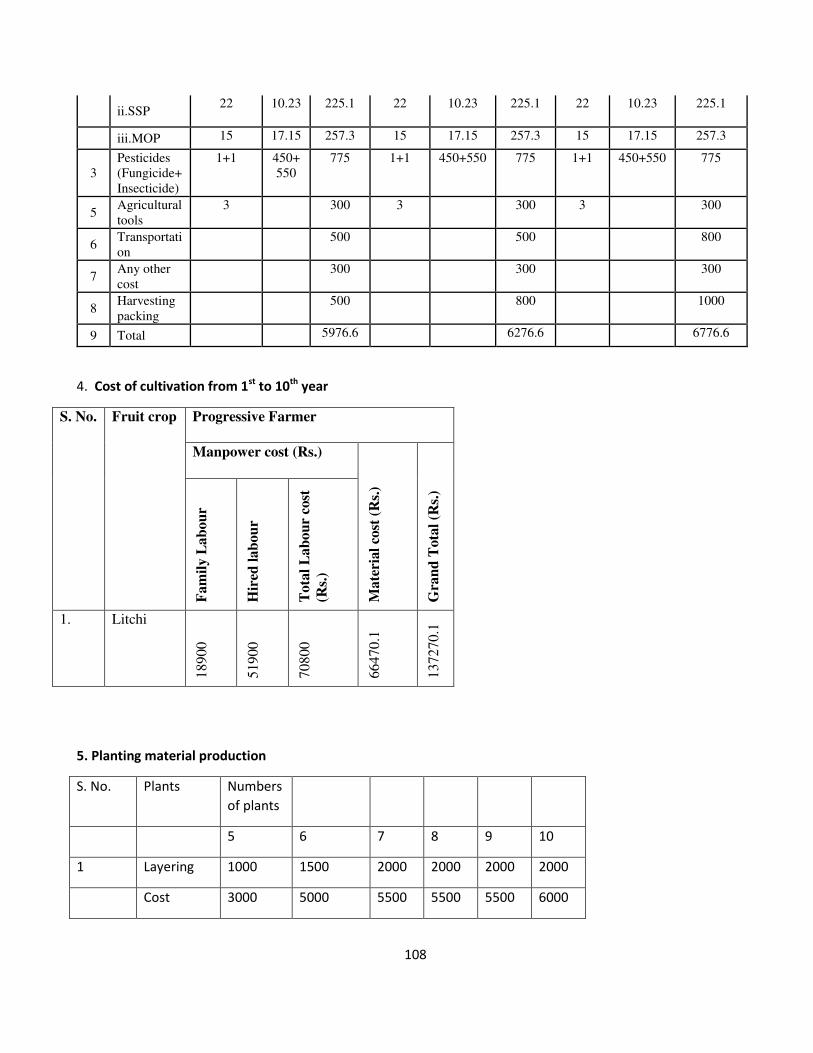
108
ii.SSP 22 10.23 225.1 22 10.23 225.1 22 10.23 225.1
iii.MOP 15 17.15 257.3 15 17.15 257.3 15 17.15 257.3
3
Pesticides
(Fungicide+
Insecticide)
1+1 450+
550
775 1+1 450+550 775 1+1 450+550 775
5 Agricultural
tools
3 300 3 300 3 300
6 Transportati
on
500 500 800
7 Any other
cost
300 300 300
8 Harvesting
packing
500 800 1000
9 Total 5976.6 6276.6 6776.6
4. Cost of cultivation from 1st
to 10th
year
S. No.
Fruit crop Progressive Farmer
Manpower cost (Rs.)
Mate
rial
cost
(R
s.)
Gra
nd
Tota
l (R
s.)
Fam
ily L
ab
ou
r
Hir
ed l
ab
ou
r
Tota
l L
ab
ou
r co
st
(Rs.
)
1. Litchi
18900
51900
70800
66470.1
137270.1
5. Planting material production
S. No. Plants Numbers
of plants
5 6 7 8 9 10
1 Layering 1000 1500 2000 2000 2000 2000
Cost 3000 5000 5500 5500 5500 6000

109
6. Return
No. Head
5th
Yea
r
6th
Yea
r
7th
Yea
r
8th
Yea
r
9th
Yea
r
10
th Y
ear
1. Total
Production of
litchi fruit
(Kg/tree)
4 6 8 8 11 15
2. Total
Production of
litchi fruit
(kg/ha)
71
2
10
68
14
24
14
24
19
58
26
70
3. Layered plant
sale (Rs.
30/Plants)
30
000
45
000
60
000
60
000
60
000
60
000
4. Total Amount
of litchi fruit
(Rs) @ Rs.
60/kg
42
720
64
080
85
440
85
440
11
748
0
16
020
0
Total return
(Rs.)
72
720
10
908
0
14
544
0
14
544
0
17
748
0
22
020
0

110
Assessment of cost of cultivation of
agricultural/horticultural crops in Tripura
ICAR (RC) for NEH Region, Tripura Centre, Lembucherra, Tripura
& Directorate of Economics and Statistics, Govt. of Tripura, Agartala
Name of Crop: Mosambi
Farmer category: Non progressive
Area Covered: 1ha.
23. Cost of Planting in 1st
year
r. Cost of manpower/labour
No. Head Labour PT
(hr)
Family
cost
(Rs.)
Hired
cost
(Rs)
Total cost
(Rs) Family Hired
1 Land Cleaning & Leveling 5 3 0 1500 900 2400
2 Layout & Pit Digging 5 3 1500 900 2400
3 Pit feeling, Planting &
Watering
4 3
1200 900 2100
4 Fencing Labour 2 0 600 0 600
5 Other Intercultural Operation
Including irrigation, Insect &
Pest Mgt
3
0
900 0 900
6 Removal of diseased or
defective plants, Gap Feeling &
any other day to day labour
cost
2
0
600 0 600
Total 6300 2700 9000
b. Material cost
Sl. No. Head Quantity Nos. or kg Rate(RS) Amount
1 Planting materials 400 30 12000
2 FYM 800 2 1600
4 Fungicide and Insecticide 1 550 550
5 Irrigation and pipes 1+1 -- 2500
6 Agricultural Tools 5 100 500

111
7 Transportation 0 400
8 Fencing
1000
Total 18550
2. Pre-bearing Stage
a. Cost of manpower/labour
No. Head Year wise Cost (Rs)
2nd
Year 3rd
Year 4th
Year
Fam
ily
Lab
ou
r
Hir
ed L
abou
r
Fam
ily
co
st (
Rs.
)
Hir
ed c
ost
(R
s.)
To
tal
cost
(R
s)
Fam
ily
Lab
ou
r
Hir
ed L
abou
r
Fam
ily
co
st (
Rs.
)
Hir
ed c
ost
(R
s.)
To
tal
cost
(R
s.)
Fam
ily
Lab
ou
r
Hir
ed L
abou
r
Fam
ily
co
st (
Rs.
)
Hir
ed c
ost
(R
s.)
To
tal
cost
(R
s.)
1 Weeding &
Cleaning 4 1
12
00
30
0
15
00
4 1
12
00
30
0
15
00
4 1
12
00
30
0
15
00
2 Basin
Preparation 4 1
12
00
30
0
15
00
4 1
12
00
30
0
15
00
4 1
12
00
30
0
15
00
3
FYM &
Fertilizer
Application
1 0 30
0
0
30
0
1 0 30
0
0
30
0
1 0 30
0
0
30
0
4 Pesticide &
Other Sprays 0.5 0 1
50
0
15
0
0.5 0 15
0
0
15
0
0.5 0 15
0
0
15
0
5 Irrigation 2 0 60
0
0
60
0
2 0 60
0
0
60
0
2 0 60
0
0
60
0
6
Other
Intercultural
Operation
1 0 30
0
0
30
0
1 0 30
0
0
30
0
2 0 60
0
0
60
0
7 Any Other Cost
and harvesting 0.5 0 1
50
0
15
0
1 0 30
0
0
30
0
1 0 30
0
0
30
0
8 Total Cost
39
00
60
0
45
00
40
50
60
0
46
50
43
50
60
0
49
50
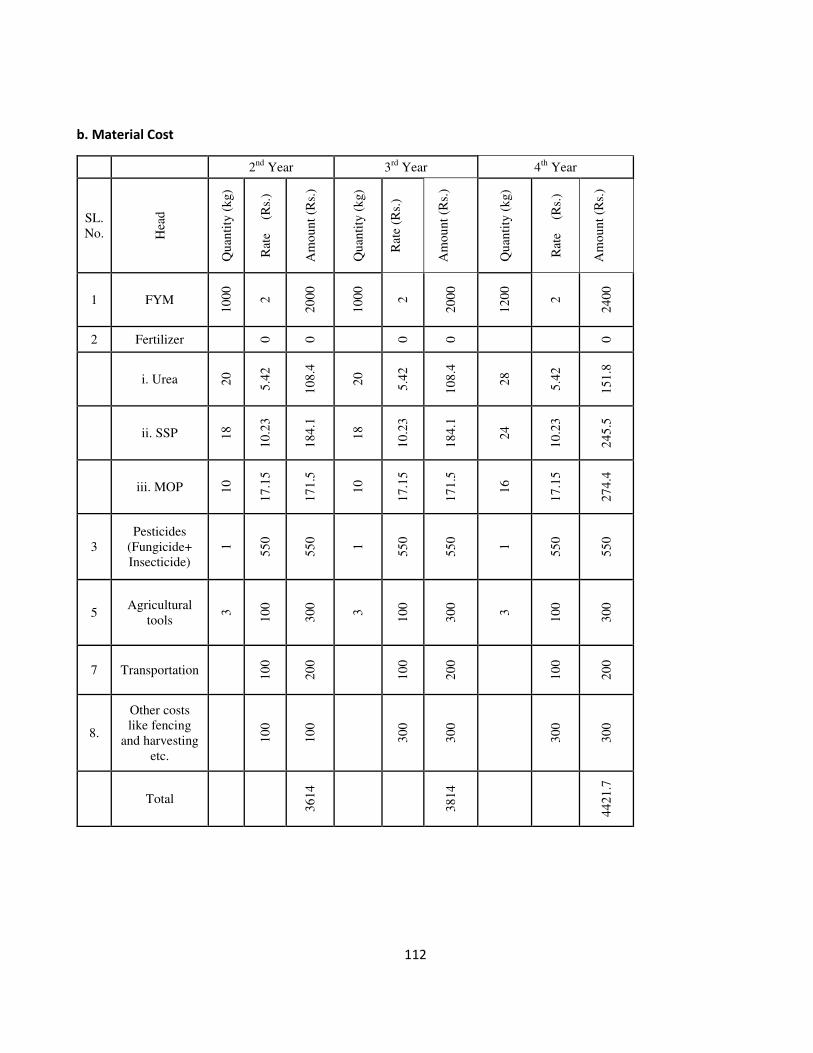
112
b. Material Cost
2nd
Year 3rd
Year 4th
Year
SL.
No. Hea
d
Qu
anti
ty (
kg)
Rat
e
(R
s.)
Am
ou
nt
(Rs.
)
Qu
anti
ty (
kg)
Rat
e (R
s.)
Am
ou
nt
(Rs.
)
Qu
anti
ty (
kg)
Rat
e
(R
s.)
Am
ou
nt
(Rs.
)
1 FYM
10
00
2
20
00
10
00
2
20
00
12
00
2
24
00
2 Fertilizer 0
0 0
0 0
i. Urea 2
0
5.4
2
10
8.4
20
5.4
2
10
8.4
28
5.4
2
15
1.8
ii. SSP 1
8
10
.23
18
4.1
18
10
.23
18
4.1
24
10
.23
24
5.5
iii. MOP 1
0
17
.15
17
1.5
10
17
.15
17
1.5
16
17
.15
27
4.4
3
Pesticides
(Fungicide+
Insecticide)
1
55
0
55
0
1
55
0
55
0
1
55
0
55
0
5 Agricultural
tools
3
10
0
30
0
3
10
0
30
0
3
10
0
30
0
7 Transportation
10
0
20
0
10
0
20
0
10
0
20
0
8.
Other costs
like fencing
and harvesting
etc.
10
0
10
0
30
0
30
0
30
0
30
0
Total
36
14
38
14
44
21
.7

113
3. Bearing Stage
a. Cost of manpower/labour
i. Manpower cost for 5th
and 6th
year
Year wise Cost (Rs)
No. Head 5th
Year 6th
Year
Fam
ily
Lab
ou
r
Hir
ed L
abou
r
Fam
ily
co
st (
Rs.
)
Hir
ed c
ost
(R
s.)
To
tal
cost
(R
s)
Fam
ily
Lab
ou
r
Hir
ed L
abou
r
Fam
ily
co
st (
Rs.
)
Hir
ed c
ost
(R
s.)
To
tal
cost
(R
s.)
1 Weeding &
Cleaning
1
1 60
0
30
0
90
0 1
1 60
0
30
0
90
0
2 Basin
Preparation
2
1 60
0
30
0
90
0 2
1 60
0
30
0
90
0
3 FYM &
Fertilizer
Application
2
0 60
0
0
60
0 2
0 60
0
0
60
0
4 Pesticide &
Other Sprays 1 0 3
00
30
0
60
0
1 0 30
0
30
0
60
0
5 Irrigation 2
0 60
0
0
60
0 2
0 60
0
0
60
0
6 Other
Intercultural
Operation
2
1 60
0
30
0
90
0 2
1 60
0
30
0
90
0
7 Any Other Cost
and Harvesting
1
0 30
0
0
30
0
1
0.5 30
0
15
0
45
0
8 Total Cost
36
00
12
00
48
00
36
00
13
50
49
50
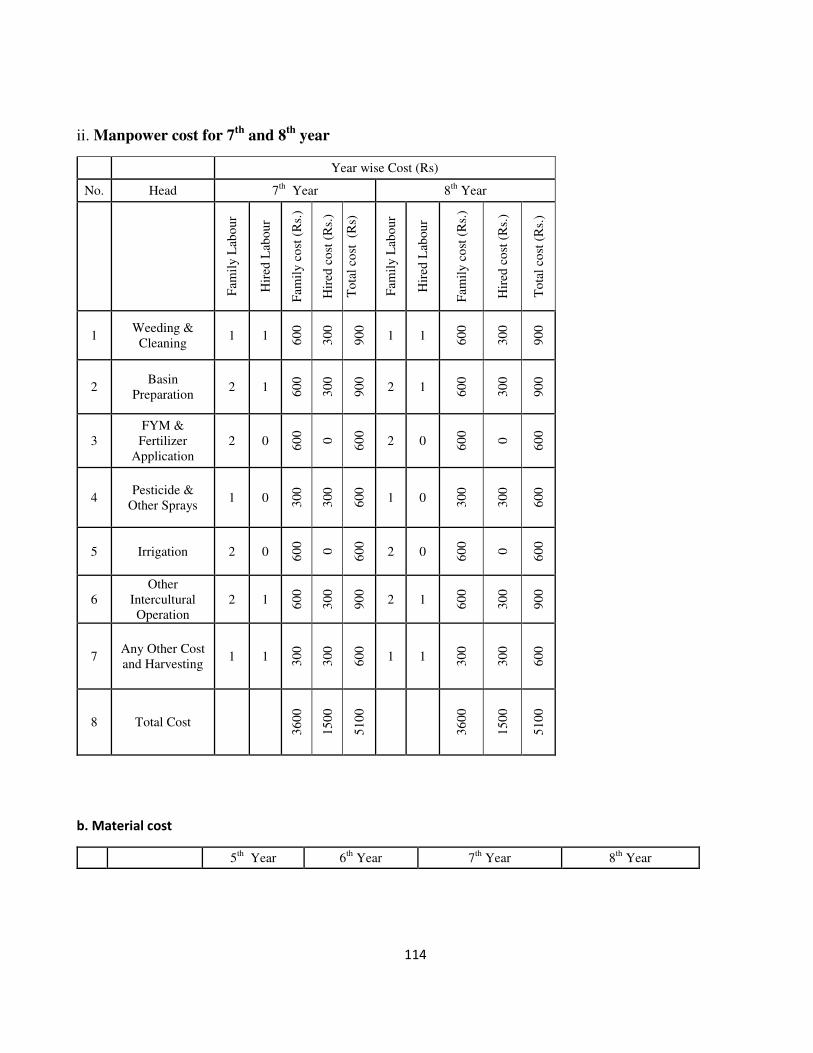
114
ii. Manpower cost for 7th
and 8th
year
Year wise Cost (Rs)
No. Head 7th
Year 8th
Year
Fam
ily
Lab
ou
r
Hir
ed L
abou
r
Fam
ily
co
st (
Rs.
)
Hir
ed c
ost
(R
s.)
To
tal
cost
(R
s)
Fam
ily
Lab
ou
r
Hir
ed L
abou
r
Fam
ily
co
st (
Rs.
)
Hir
ed c
ost
(R
s.)
To
tal
cost
(R
s.)
1 Weeding &
Cleaning 1 1 6
00
30
0
90
0
1 1 60
0
30
0
90
0
2 Basin
Preparation 2 1 6
00
30
0
90
0
2 1 60
0
30
0
90
0
3
FYM &
Fertilizer
Application
2 0 60
0
0
60
0
2 0 60
0
0
60
0
4 Pesticide &
Other Sprays 1 0 3
00
30
0
60
0
1 0 30
0
30
0
60
0
5 Irrigation 2 0 60
0
0
60
0
2 0 60
0
0
60
0
6
Other
Intercultural
Operation
2 1 60
0
30
0
90
0
2 1 60
0
30
0
90
0
7 Any Other Cost
and Harvesting 1 1 3
00
30
0
60
0
1 1 30
0
30
0
60
0
8 Total Cost
36
00
15
00
51
00
36
00
15
00
51
00
b. Material cost
5th
Year 6th
Year 7th
Year 8th
Year

115
SL
.
N
o.
Head
Qu
anti
ty (
kg)
Rat
e
(R
S)
Am
ou
nt
Qu
anti
ty (
kg)
Rat
e (R
s.)
Am
ou
nt
(Rs.
)
Qu
anti
ty
(kg
)
Rat
e (
Rs.
)
Am
ou
nt
(Rs.
)
Rat
e
(Rs.
)
Am
ou
nt
(Rs.
)
Am
ou
nt
1 FYM 2
00
0
2
40
00
20
00
2
40
00
22
00
2
44
00
22
00
2
44
00
2 Fertilizer 0
0 0
0 0 0
i. Urea 2
8
5.4
2
15
1.8
40
5.4
2
21
6.8
40
5.4
2
21
6.8
40
5.4
2
21
6.8
ii.SSP 2
4
10
.23
24
5.5
28
10
.23
28
6.4
28
10
.23
28
6.4
28
10
.23
28
6.4
iii.MOP 1
6
17
.15
27
4.4
20
17
.15
34
3
20
17
.15
34
3
20
17
.15
34
3
3
Pesticides
(Fungicide+
Insecticide)
1
55
0
55
0
1
55
0
55
0
1
55
0
55
0
1
55
0
55
0
5 Agricultural
tools
3
10
0
30
0
3
10
0
30
0
3
10
0
30
0
3
10
0
30
0
6 Transportation
10
0
20
0
10
0
20
0
10
0
20
0
10
0
20
0
7 Any other cost
30
0
30
0
30
0
30
0
30
0
30
0
30
0
30
0
8 Harvesting
packing
40
0
40
0
40
0
40
0
60
0
60
0
60
0
60
0
9 Total
67
39
.5
67
39
.5
74
82
.8
74
82
.8
4. Cost of cultivation from 1st
to 8th
year
S. No.
Fruit crop Non Progressive Farmer
Manpower cost
(Rs.) M ate
ria
l Gr
an
d
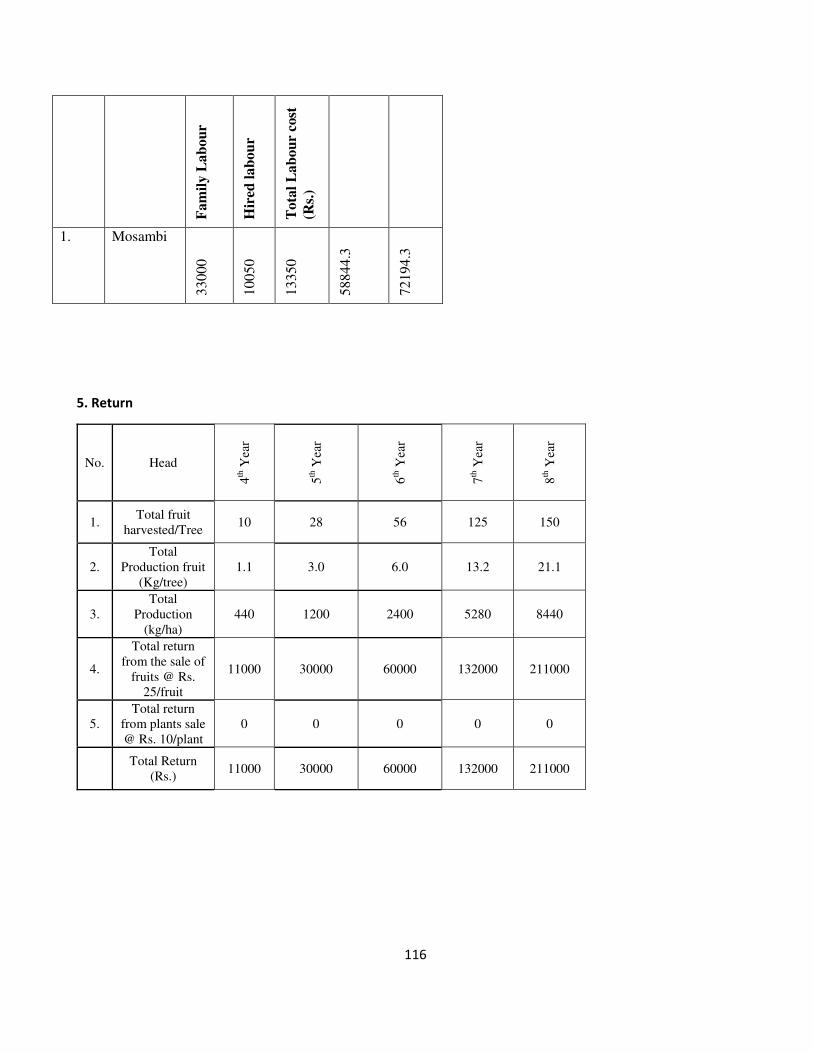
116
Fa
mil
y L
ab
ou
r
Hir
ed l
ab
ou
r
To
tal
La
bo
ur
cost
(Rs.
)
1. Mosambi
33
00
0
10
05
0
13
35
0
58
84
4.3
72
19
4.3
5. Return
No. Head
4th
Yea
r
5th
Yea
r
6th
Yea
r
7th
Yea
r
8th
Yea
r
1. Total fruit
harvested/Tree 10 28 56 125 150
2.
Total
Production fruit
(Kg/tree)
1.1 3.0 6.0 13.2 21.1
3.
Total
Production
(kg/ha)
440 1200 2400 5280 8440
4.
Total return
from the sale of
fruits @ Rs.
25/fruit
11000 30000 60000 132000 211000
5.
Total return
from plants sale
@ Rs. 10/plant
0 0 0 0 0
Total Return
(Rs.) 11000 30000 60000 132000 211000
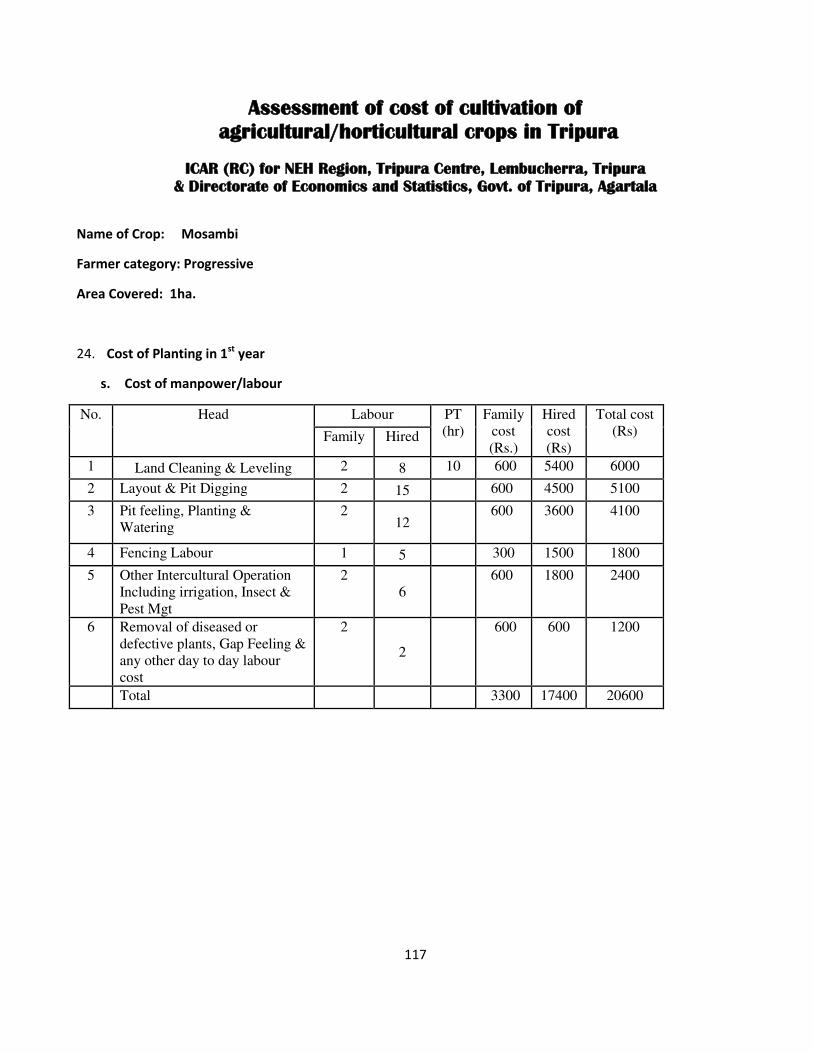
117
Assessment of cost of cultivation of
agricultural/horticultural crops in Tripura
ICAR (RC) for NEH Region, Tripura Centre, Lembucherra, Tripura
& Directorate of Economics and Statistics, Govt. of Tripura, Agartala
Name of Crop: Mosambi
Farmer category: Progressive
Area Covered: 1ha.
24. Cost of Planting in 1st
year
s. Cost of manpower/labour
No. Head Labour PT
(hr)
Family
cost
(Rs.)
Hired
cost
(Rs)
Total cost
(Rs) Family Hired
1 Land Cleaning & Leveling 2 8 10 600 5400 6000
2 Layout & Pit Digging 2 15 600 4500 5100
3 Pit feeling, Planting &
Watering
2 12
600 3600 4100
4 Fencing Labour 1 5 300 1500 1800
5 Other Intercultural Operation
Including irrigation, Insect &
Pest Mgt
2
6
600 1800 2400
6 Removal of diseased or
defective plants, Gap Feeling &
any other day to day labour
cost
2
2
600 600 1200
Total 3300 17400 20600
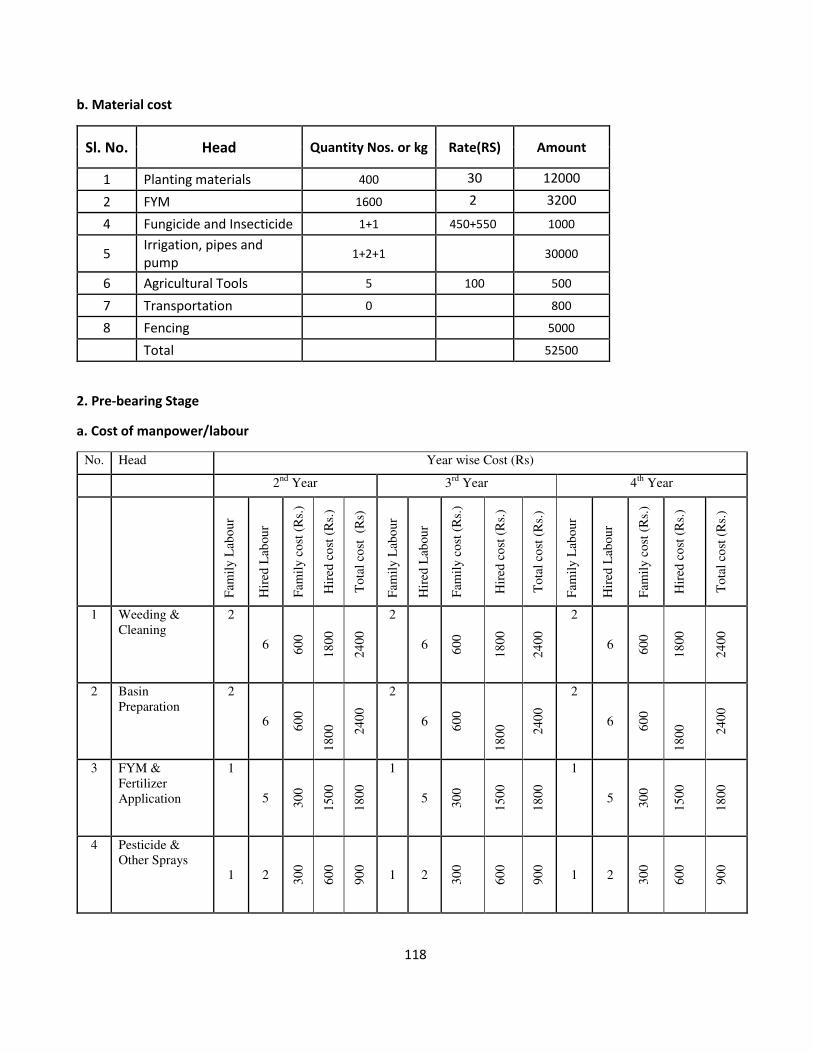
118
b. Material cost
Sl. No. Head Quantity Nos. or kg Rate(RS) Amount
1 Planting materials 400 30 12000
2 FYM 1600 2 3200
4 Fungicide and Insecticide 1+1 450+550 1000
5 Irrigation, pipes and
pump 1+2+1 30000
6 Agricultural Tools 5 100 500
7 Transportation 0 800
8 Fencing
5000
Total 52500
2. Pre-bearing Stage
a. Cost of manpower/labour
No. Head Year wise Cost (Rs)
2nd
Year 3rd
Year 4th
Year
Fam
ily
Lab
ou
r
Hir
ed L
abou
r
Fam
ily
co
st (
Rs.
)
Hir
ed c
ost
(R
s.)
To
tal
cost
(R
s)
Fam
ily
Lab
ou
r
Hir
ed L
abou
r
Fam
ily
co
st (
Rs.
)
Hir
ed c
ost
(R
s.)
To
tal
cost
(R
s.)
Fam
ily
Lab
ou
r
Hir
ed L
abou
r
Fam
ily
co
st (
Rs.
)
Hir
ed c
ost
(R
s.)
To
tal
cost
(R
s.)
1 Weeding &
Cleaning
2
6 60
0
18
00
24
00
2
6 60
0
18
00
24
00
2
6 60
0
18
00
24
00
2 Basin
Preparation
2
6 60
0
18
00
24
00
2
6 60
0
18
00
24
00
2
6 60
0
18
00
24
00
3 FYM &
Fertilizer
Application
1
5 30
0
15
00
18
00
1
5 30
0
15
00
18
00
1
5 30
0
15
00
18
00
4 Pesticide &
Other Sprays 1 2 3
00
60
0
90
0
1 2 30
0
60
0
90
0
1 2 30
0
60
0
90
0
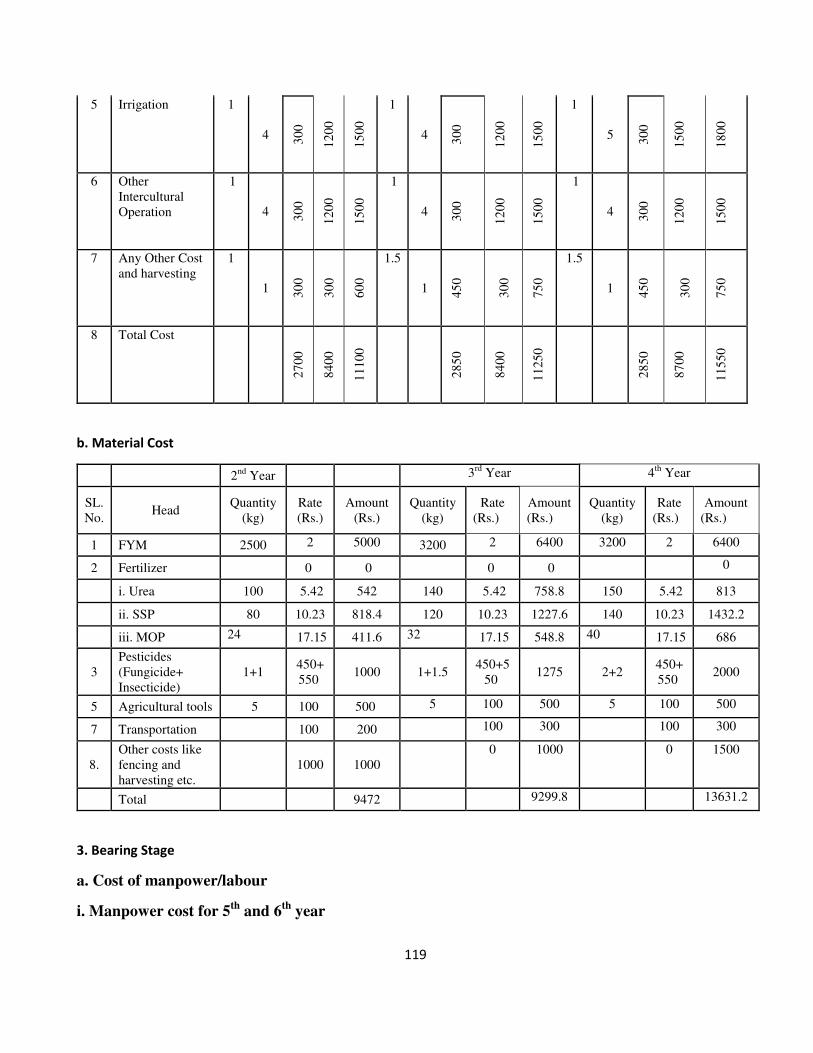
119
5 Irrigation 1
4 30
0
12
00
15
00
1
4 30
0
12
00
15
00
1
5 30
0
15
00
18
00
6 Other
Intercultural
Operation
1
4 30
0
12
00
15
00
1
4 30
0
12
00
15
00
1
4 30
0
12
00
15
00
7 Any Other Cost
and harvesting
1
1 30
0
30
0
60
0
1.5
1 45
0
30
0
75
0
1.5
1 45
0
30
0
75
0
8 Total Cost
27
00
84
00
11
100
28
50
84
00
11
250
28
50
87
00
11
550
b. Material Cost
2nd
Year 3rd
Year 4th
Year
SL.
No. Head
Quantity
(kg)
Rate
(Rs.)
Amount
(Rs.)
Quantity
(kg)
Rate
(Rs.)
Amount
(Rs.)
Quantity
(kg)
Rate
(Rs.)
Amount
(Rs.)
1 FYM 2500 2 5000 3200 2 6400 3200 2 6400
2 Fertilizer
0 0 0 0 0
i. Urea 100 5.42 542 140 5.42 758.8 150 5.42 813
ii. SSP 80 10.23 818.4 120 10.23 1227.6 140 10.23 1432.2
iii. MOP 24 17.15 411.6 32 17.15 548.8 40 17.15 686
3
Pesticides
(Fungicide+
Insecticide)
1+1 450+
550 1000 1+1.5
450+5
50 1275 2+2
450+
550 2000
5 Agricultural tools 5 100 500 5 100 500 5 100 500
7 Transportation 100 200 100 300 100 300
8.
Other costs like
fencing and
harvesting etc.
1000 1000
0 1000 0 1500
Total 9472 9299.8 13631.2
3. Bearing Stage
a. Cost of manpower/labour
i. Manpower cost for 5th
and 6th
year

120
Year wise Cost (Rs)
No. Head 5th
Year 6th
Year
Fam
ily
Lab
ou
r
Hir
ed L
abou
r
Fam
ily
co
st (
Rs.
)
Hir
ed c
ost
(R
s.)
To
tal
cost
(R
s)
Fam
ily
Lab
ou
r
Hir
ed L
abou
r
Fam
ily
co
st (
Rs.
)
Hir
ed c
ost
(R
s.)
To
tal
cost
(R
s.)
1 Weeding &
Cleaning
2
8 60
0
24
00
30
00 2
8 60
0
24
00
30
00
2 Basin
Preparation
2
8 60
0
24
00
30
00 2
8 60
0
24
00
30
00
3 FYM &
Fertilizer
Application
1
8 30
0
24
00
27
00 1
8 30
0
24
00
27
00
4 Pesticide &
Other Sprays 1 4 3
00
12
00
15
00
1 4 30
0
12
00
15
00
5 Irrigation 1
6 30
0
18
00
21
00 1
6 30
0
18
00
21
00
6 Other
Intercultural
Operation
1
6 30
0
18
00
21
00 2
6 60
0
18
00
24
00
7 Any Other Cost
and Harvesting
1
2 30
0
60
0
90
0
1
2 30
0
60
0
90
0
8 Total Cost
27
00
12
600
15
300
30
00
12
600
15
600
ii. Manpower cost for 7th
and 8th
year
Year wise Cost (Rs)
No. Head 7th
Year 8th
Year
Fam
ily
Lab
ou
r
Hir
ed L
abou
r
Fam
ily
co
st (
Rs.
)
Hir
ed c
ost
(R
s.)
To
tal
cost
(R
s)
Fam
ily
Lab
ou
r
Hir
ed L
abou
r
Fam
ily
co
st (
Rs.
)
Hir
ed c
ost
(R
s.)
To
tal
cost
(R
s.)
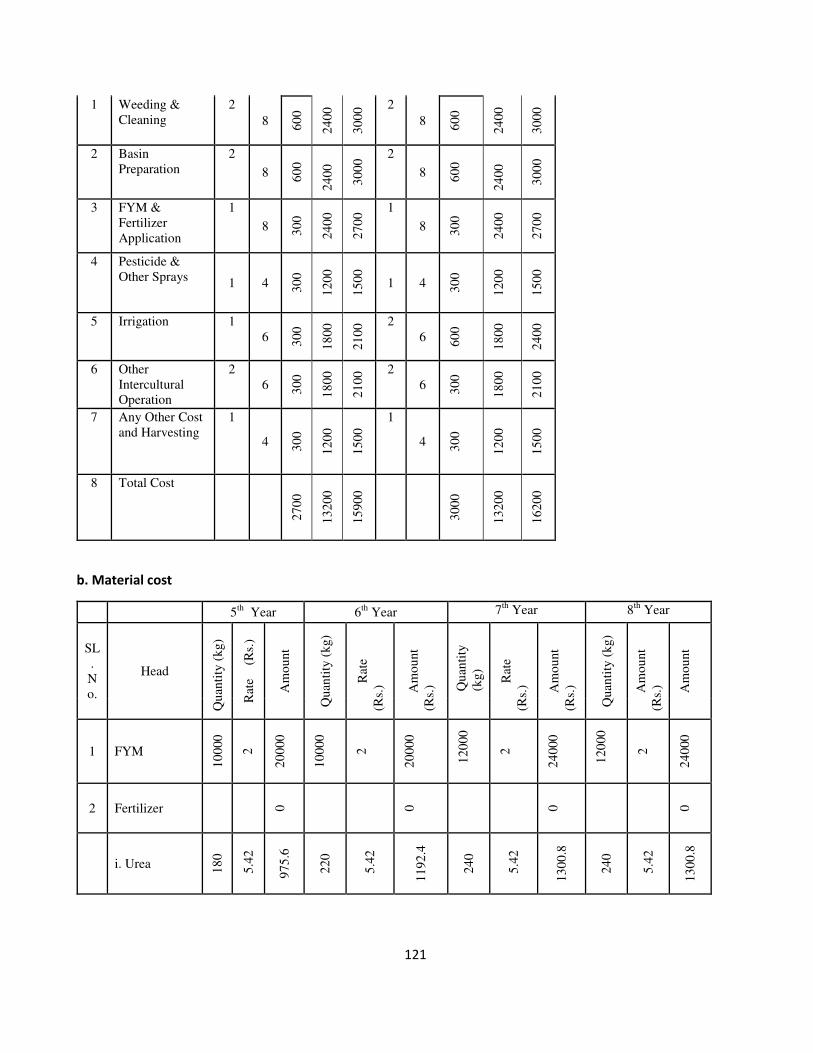
121
1 Weeding &
Cleaning
2
8 60
0
24
00
30
00 2
8 60
0
24
00
30
00
2 Basin
Preparation
2
8 60
0
24
00
30
00 2
8 60
0
24
00
30
00
3 FYM &
Fertilizer
Application
1
8 30
0
24
00
27
00 1
8 30
0
24
00
27
00
4 Pesticide &
Other Sprays 1 4 3
00
12
00
15
00
1 4 30
0
12
00
15
00
5 Irrigation 1
6 30
0
18
00
21
00 2
6 60
0
18
00
24
00
6 Other
Intercultural
Operation
2
6 30
0
18
00
21
00 2
6 30
0
18
00
21
00
7 Any Other Cost
and Harvesting
1
4 30
0
12
00
15
00
1
4 30
0
12
00
15
00
8 Total Cost
27
00
13
200
15
900
30
00
13
200
16
200
b. Material cost
5th
Year 6th
Year 7th
Year 8th
Year
SL
.
N
o.
Head
Qu
anti
ty (
kg)
Rat
e
(R
s.)
Am
ou
nt
Qu
anti
ty (
kg)
Rat
e
(Rs.
) Am
ou
nt
(Rs.
) Qu
anti
ty
(kg
)
Rat
e
(Rs.
) Am
ou
nt
(Rs.
)
Qu
anti
ty (
kg)
Am
ou
nt
(Rs.
) Am
ou
nt
1 FYM
10
000
2
20
000
10
000
2
20
000
1
20
00
2
24
000
1
20
00
2
24
000
2 Fertilizer 0 0 0 0
i. Urea 18
0
5.4
2
97
5.6
22
0
5.4
2
11
92
.4
24
0
5.4
2
13
00
.8
24
0
5.4
2
13
00
.8
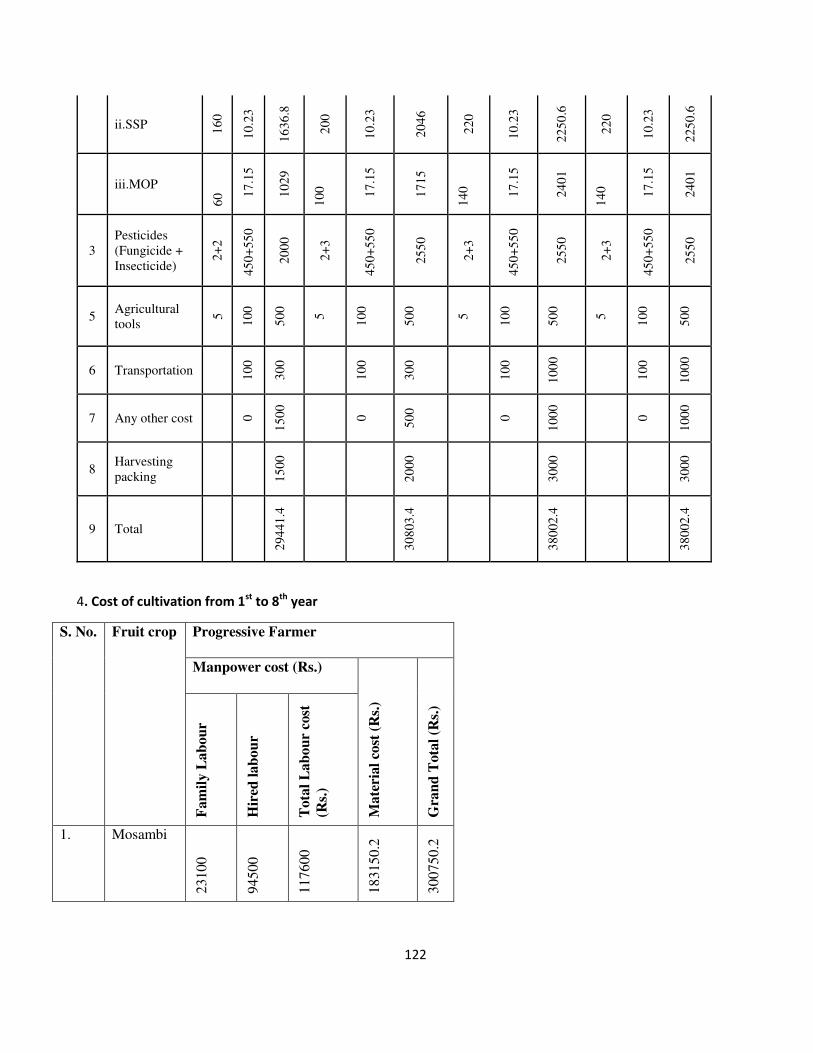
122
ii.SSP 16
0
10
.23
16
36
.8
20
0
10
.23
20
46
22
0
10
.23
22
50
.6
22
0
10
.23
22
50
.6
iii.MOP
60
17
.15
10
29
10
0
17
.15
17
15
14
0
17
.15
24
01
14
0
17
.15
24
01
3
Pesticides
(Fungicide +
Insecticide)
2+
2
45
0+
55
0
20
00
2+
3
45
0+
55
0
25
50
2+
3
45
0+
55
0
25
50
2+
3
45
0+
55
0
25
50
5 Agricultural
tools
5
10
0
50
0
5
10
0
50
0
5
10
0
50
0
5
10
0
50
0
6 Transportation
10
0
30
0
10
0
30
0
10
0
10
00
10
0
10
00
7 Any other cost 0
15
00
0
50
0
0
10
00
0
10
00
8 Harvesting
packing
15
00
20
00
30
00
30
00
9 Total
29
441
.4
30
803
.4
38
002
.4
38
002
.4
4. Cost of cultivation from 1st
to 8th
year
S. No.
Fruit crop Progressive Farmer
Manpower cost (Rs.)
Ma
teri
al
cost
(R
s.)
Gra
nd
Tota
l (R
s.)
Fa
mil
y L
ab
ou
r
Hir
ed l
ab
ou
r
To
tal
La
bo
ur
cost
(Rs.
)
1. Mosambi
231
00
945
00
117
60
0
183
15
0.2
300
75
0.2

123
5. Cost of plant nursery
Nursery plants Year
4 5 6 7 8
Nos. of Grafted
Plants
1000 2500 5000 5000 0
Cost 2500 5000 12000 12000 12000
6. Return
No. Head
4th
Yea
r
5th
Yea
r
6th
Yea
r
7th
Yea
r
8th
Yea
r
1. Total fruit
harvested/Tree
15 45 80 315 450
2. Total
Production fruit
(Kg/tree)
1.7 5.2 9.4 37.0 53
3. Total
Production
(kg/ha)
680 2080 3760 14800 21200
4. Total return
from the sale of
fruits @ Rs.
30/kg
20400 62400 112800 444000 636000
5. Total return
from plants sale
@ Rs. 30/plant
30000 75000 150000 150000 150000
Total Return
(Rs.)
50400 137400 262800 594000 786000

124
Assessment of cost of cultivation of
agricultural/horticultural crops in Tripura
ICAR (RC) for NEH Region, Tripura Centre, Lembucherra, Tripura
& Directorate of Economics and Statistics, Govt. of Tripura, Agartala
Name of Crop: Orange
Farmer category: Non progressive
Area Covered: 1ha.
25. Cost of Planting in 1st
year
t. Cost of manpower/labour
No. Head Labour PT
(hr)
Family
cost
(Rs.)
Hired
cost
(Rs)
Total cost
(Rs) Family Hired
1 Land Cleaning & Leveling 3 2 0 900 600 1500
2 Layout & Pit Digging 4 3 1200 900 2100
3 Pit feeling, Planting &
Watering
3 2
900 600 1500
4 Fencing Labour 2 1 600 300 900
5 Other Intercultural Operation
Including irrigation, Insect &
Pest Mgt
2
1
600 300 900
6 Removal of diseased or
defective plants, Gap Feeling &
any other day to day labour
cost
2
1
600 300 900
Total 4800 3000 7800

125
b. Material cost
Sl. No. Head Quantity Nos. or kg Rate(RS) Amount
1 Planting materials 277 30 8310
2 FYM 1000 2 2000
4 Fungicide and Insecticide 1+1 500+550 1050
5 Irrigation and pipes 1+1 5000
6 Agricultural Tools 5 150 750
7 Transportation 0 800
8 Fencing
2000
Total 19910
2. Pre-bearing Stage
a. Cost of manpower/labour
No. Head Year wise Cost (Rs)
2nd
Year 3rd
Year 4th
Year
Fam
ily
Lab
ou
r
Hir
ed L
abou
r
Fam
ily
co
st (
Rs.
)
Hir
ed c
ost
(R
s.)
To
tal
cost
(R
s)
Fam
ily
Lab
ou
r
Hir
ed L
abou
r
Fam
ily
co
st (
Rs.
)
Hir
ed c
ost
(R
s.)
To
tal
cost
(R
s.)
Fam
ily
Lab
ou
r
Hir
ed L
abou
r
Fam
ily
co
st (
Rs.
)
Hir
ed c
ost
(R
s.)
To
tal
cost
(R
s.)
1 Weeding &
Cleaning
3
1 90
0
30
0
12
00
3
1 90
0
30
0
12
00
3
1 90
0
30
0
12
00
2 Basin
Preparation
2
0 60
0
0 6
00 2
0 60
0
0 6
00 2
1 60
0
30
0
90
0
3 FYM &
Fertilizer
Application
1
0 30
0
0
30
0
1
0 30
0
0
30
0
1
0 30
0
0
30
0
4 Pesticide &
Other Sprays 0.5 0 1
50
0
15
0
0.5 0 15
0
0
15
0
0.5 0 15
0
0
15
0

126
5 Irrigation 1
0 30
0
0
30
0
1
0 30
0
0
30
0
2
0 60
0
0
60
0
6 Other
Intercultural
Operation
1
0 30
0
0
30
0
1
0 30
0
0
30
0
1
0 30
0
0
30
0
7 Any Other Cost 0.5
0 15
0
0
15
0
1
0 30
0
0
30
0
1
0 30
0
0
30
0
8 Total Cost
27
00
30
0
30
00
28
50
30
0
31
50
31
50
60
0
37
50
b. Material Cost
2nd
Year 3rd
Year 4th
Year
SL.
No. Head
Qu
anti
ty
(kg
)
Rat
e
(Rs.
)
Am
ou
nt
(Rs.
)
Qu
anti
ty
(kg
)
Rat
e
(Rs.
)
Am
ou
nt
(Rs.
)
Qu
anti
ty
(kg
)
Rat
e
(Rs.
)
Am
ou
nt
(Rs.
)
1 FYM 80
0
2
16
00
10
00
2
20
00
14
00
2
28
00
2 Fertilizer 0
0 0
0 0
i. Urea 15
5.4
2
81
.3
20
5.4
2
10
8.4
20
5.4
2
10
8.4
ii. SSP 10
10
.23
10
2.3
17
10
.23
17
3.9
17
10
.23
17
3.9
iii. MOP
8 17
.15
13
7.2
8 17
.15
13
7.2
10
17
.15
17
1.5
3
Pesticides
(Fungicide+
Insecticide)
1
60
0
60
0
1.5
60
0
90
0
1.5
60
0
60
0
5 Agricultural
tools
3
15
0
45
0
3
15
0
45
0
3
15
0
45
0
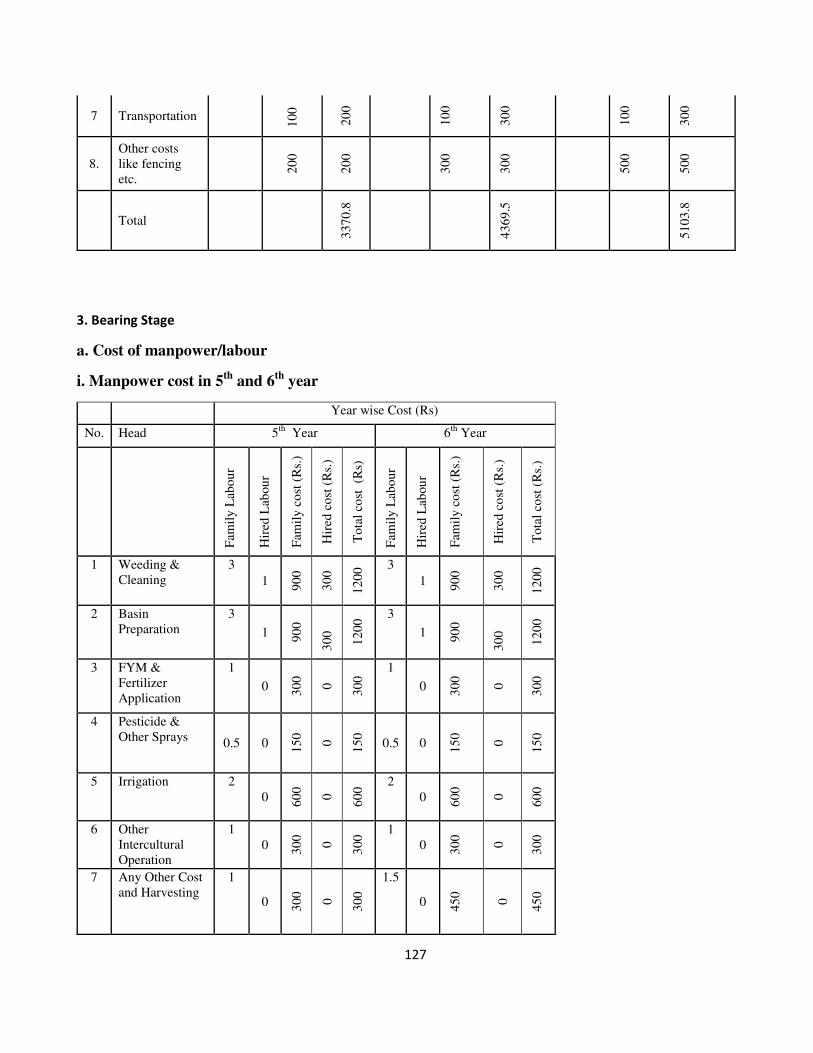
127
7 Transportation
10
0
20
0
10
0
30
0
10
0
30
0
8.
Other costs
like fencing
etc.
20
0
20
0
30
0
30
0
50
0
50
0
Total
33
70
.8
43
69
.5
51
03
.8
3. Bearing Stage
a. Cost of manpower/labour
i. Manpower cost in 5th
and 6th
year
Year wise Cost (Rs)
No. Head 5th
Year 6th
Year
Fam
ily
Lab
ou
r
Hir
ed L
abou
r
Fam
ily
co
st (
Rs.
)
Hir
ed c
ost
(R
s.)
To
tal
cost
(R
s)
Fam
ily
Lab
ou
r
Hir
ed L
abou
r
Fam
ily
co
st (
Rs.
)
Hir
ed c
ost
(R
s.)
To
tal
cost
(R
s.)
1 Weeding &
Cleaning
3
1 90
0
30
0
12
00 3
1 90
0
30
0
12
00
2 Basin
Preparation
3
1 90
0
30
0
12
00 3
1 90
0
30
0
12
00
3 FYM &
Fertilizer
Application
1
0 30
0
0
30
0 1
0 30
0
0
30
0
4 Pesticide &
Other Sprays 0.5 0 1
50
0
15
0
0.5 0 15
0
0
15
0
5 Irrigation 2
0 60
0
0
60
0 2
0 60
0
0
60
0
6 Other
Intercultural
Operation
1
0 30
0
0
30
0 1
0 30
0
0
30
0
7 Any Other Cost
and Harvesting
1
0 30
0
0
30
0
1.5
0 45
0
0
45
0
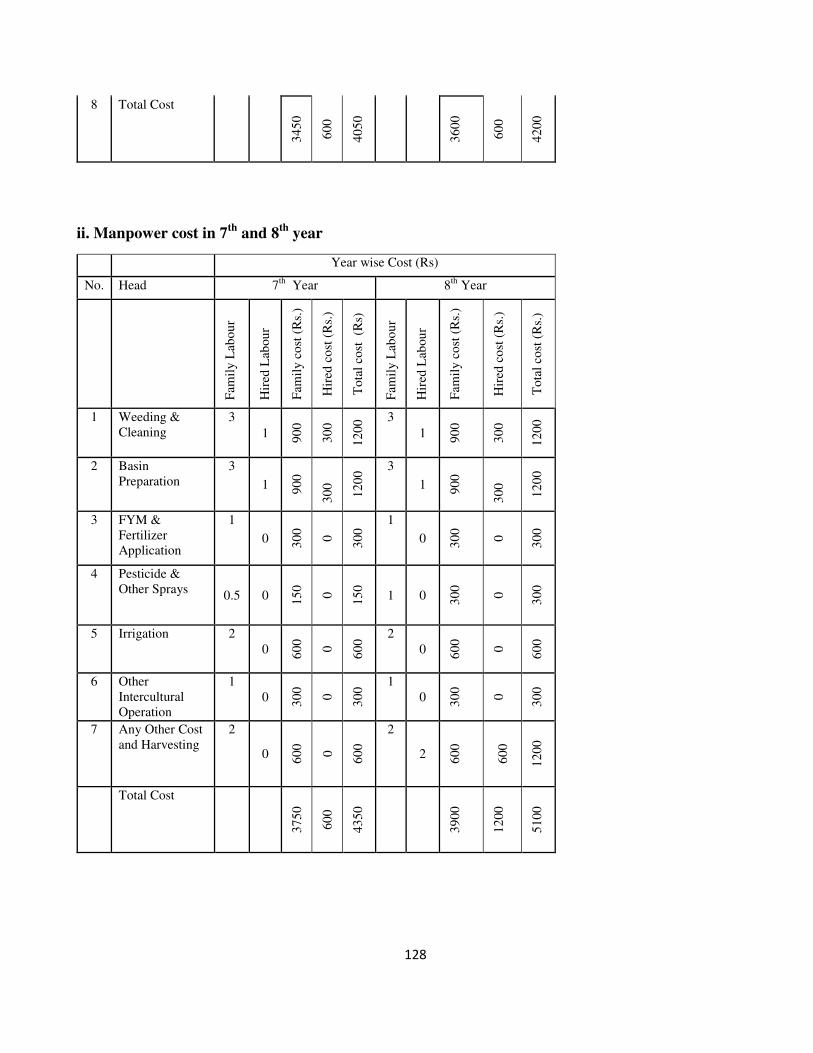
128
8 Total Cost
34
50
60
0
40
50
36
00
60
0
42
00
ii. Manpower cost in 7th
and 8th
year
Year wise Cost (Rs)
No. Head 7th
Year 8th
Year
Fam
ily
Lab
ou
r
Hir
ed L
abou
r
Fam
ily
co
st (
Rs.
)
Hir
ed c
ost
(R
s.)
To
tal
cost
(R
s)
Fam
ily
Lab
ou
r
Hir
ed L
abou
r
Fam
ily
co
st (
Rs.
)
Hir
ed c
ost
(R
s.)
To
tal
cost
(R
s.)
1 Weeding &
Cleaning
3
1 90
0
30
0
12
00 3
1 90
0
30
0
12
00
2 Basin
Preparation
3
1 90
0
30
0
12
00 3
1 90
0
30
0
12
00
3 FYM &
Fertilizer
Application
1
0 30
0
0
30
0 1
0 30
0
0
30
0
4 Pesticide &
Other Sprays 0.5 0 1
50
0
15
0
1 0 30
0
0
30
0
5 Irrigation 2
0 60
0
0
60
0 2
0 60
0
0
60
0
6 Other
Intercultural
Operation
1
0 30
0
0
30
0 1
0 30
0
0
30
0
7 Any Other Cost
and Harvesting
2
0 60
0
0
60
0
2
2 60
0
60
0
12
00
Total Cost
37
50
60
0
43
50
39
00
12
00
51
00
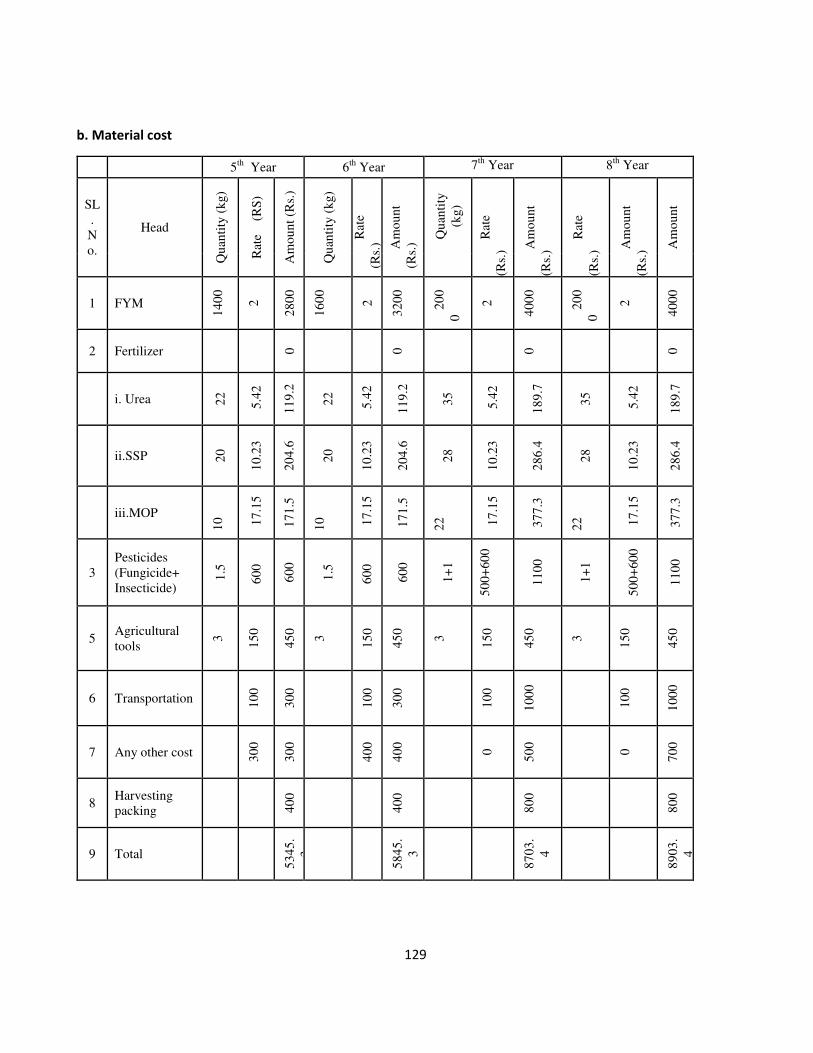
129
b. Material cost
5th
Year 6th
Year 7th
Year 8th
Year
SL
.
N
o.
Head Q
uan
tity
(k
g)
Rat
e
(R
S)
Am
ou
nt
(Rs.
)
Qu
anti
ty (
kg)
Rat
e
(Rs.
) Am
ou
nt
(Rs.
)
Qu
anti
ty
(kg
)
Rat
e
(Rs.
) Am
ou
nt
(Rs.
)
Rat
e
(Rs.
) Am
ou
nt
(Rs.
) Am
ou
nt
1 FYM
14
00
2
28
00
16
00
2
32
00
2
00
0
2
40
00
2
00
0
2
40
00
2 Fertilizer 0 0 0 0
i. Urea 22
5.4
2
11
9.2
22
5.4
2
11
9.2
35
5.4
2
18
9.7
35
5.4
2
18
9.7
ii.SSP 20
10
.23
20
4.6
20
10
.23
20
4.6
28
10
.23
28
6.4
28
10
.23
28
6.4
iii.MOP
10
17
.15
17
1.5
10
17
.15
17
1.5
22
17
.15
37
7.3
22
17
.15
37
7.3
3
Pesticides
(Fungicide+
Insecticide)
1.5
60
0
60
0
1.5
60
0
60
0
1+
1
50
0+
60
0
11
00
1+
1
50
0+
60
0
11
00
5 Agricultural
tools
3
15
0
45
0
3
15
0
45
0
3
15
0
45
0
3
15
0
45
0
6 Transportation
10
0
30
0
10
0
30
0
10
0
10
00
10
0
10
00
7 Any other cost
30
0
30
0
40
0
40
0
0
50
0
0
70
0
8 Harvesting
packing
40
0
40
0
80
0
80
0
9 Total
53
45
.
3
58
45
.
3
87
03
.
4
89
03
.
4
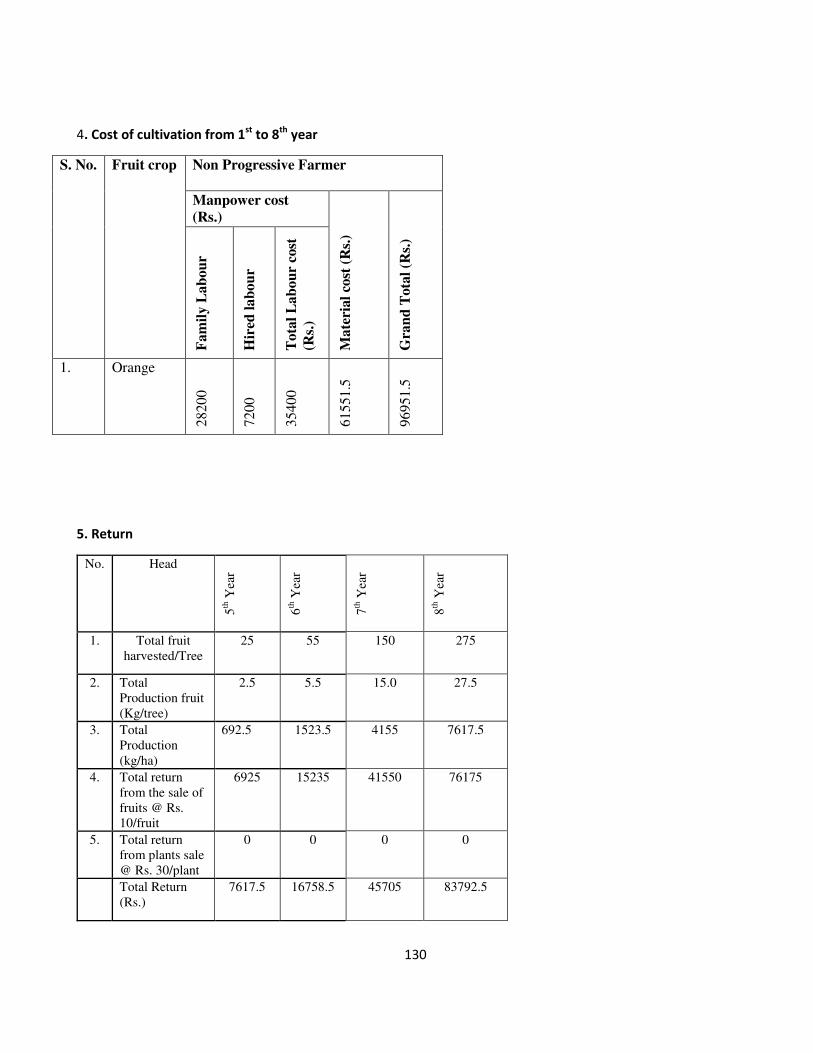
130
4. Cost of cultivation from 1st
to 8th
year
S. No.
Fruit crop Non Progressive Farmer
Manpower cost
(Rs.)
Ma
teri
al
cost
(R
s.)
Gra
nd
Tota
l (R
s.)
Fa
mil
y L
ab
ou
r
Hir
ed l
ab
ou
r
To
tal
La
bo
ur
cost
(Rs.
)
1. Orange
2820
0
7200
3540
0
6155
1.5
9695
1.5
5. Return
No. Head
5th
Yea
r
6th
Yea
r
7th
Yea
r
8th
Yea
r
1. Total fruit
harvested/Tree
25 55 150 275
2. Total
Production fruit
(Kg/tree)
2.5 5.5 15.0 27.5
3. Total
Production
(kg/ha)
692.5 1523.5 4155 7617.5
4. Total return
from the sale of
fruits @ Rs.
10/fruit
6925 15235 41550 76175
5. Total return
from plants sale
@ Rs. 30/plant
0 0 0 0
Total Return
(Rs.)
7617.5 16758.5 45705 83792.5
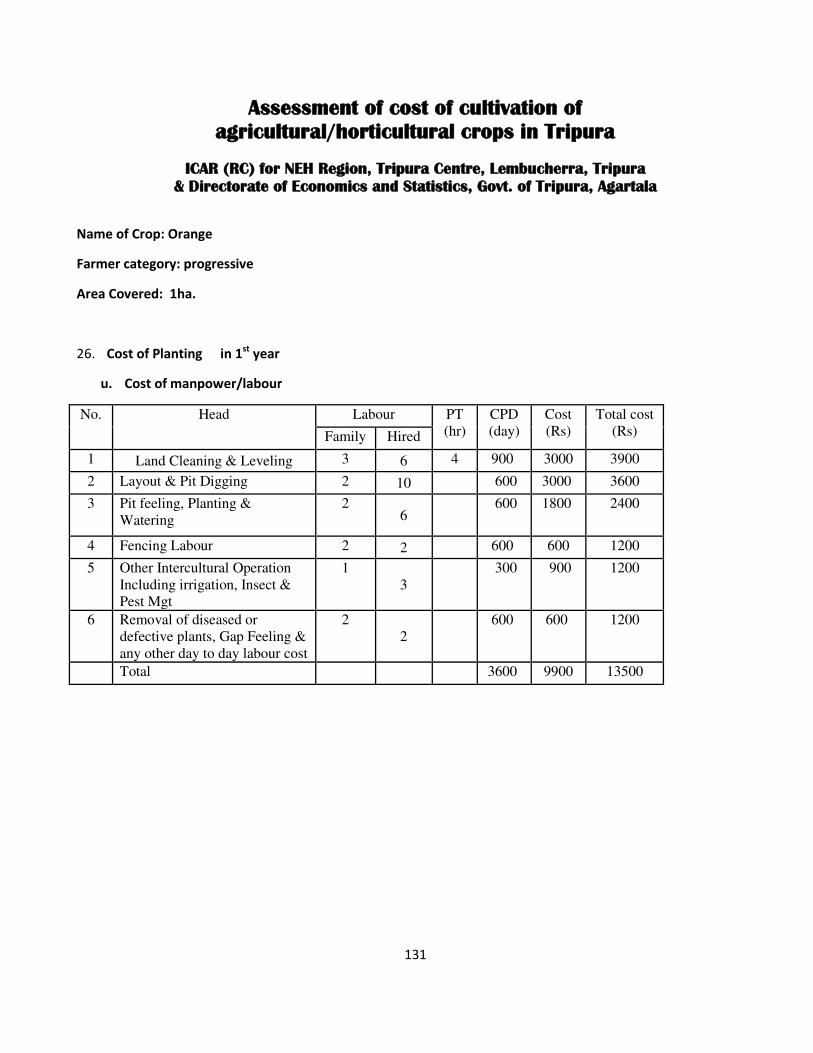
131
Assessment of cost of cultivation of
agricultural/horticultural crops in Tripura
ICAR (RC) for NEH Region, Tripura Centre, Lembucherra, Tripura
& Directorate of Economics and Statistics, Govt. of Tripura, Agartala
Name of Crop: Orange
Farmer category: progressive
Area Covered: 1ha.
26. Cost of Planting in 1st
year
u. Cost of manpower/labour
No. Head Labour PT
(hr)
CPD
(day)
Cost
(Rs)
Total cost
(Rs) Family Hired
1 Land Cleaning & Leveling 3 6 4 900 3000 3900
2 Layout & Pit Digging 2 10 600 3000 3600
3 Pit feeling, Planting &
Watering
2 6
600 1800 2400
4 Fencing Labour 2 2 600 600 1200
5 Other Intercultural Operation
Including irrigation, Insect &
Pest Mgt
1
3
300 900 1200
6 Removal of diseased or
defective plants, Gap Feeling &
any other day to day labour cost
2
2
600 600 1200
Total 3600 9900 13500

132
b. Material cost
Sl. No. Head Quantity Nos. or kg Rate(RS) Amount
1 Planting materials 277 30 8310
2 FYM 1000 2 2000
4 Fungicide and Insecticide 1+1 500+550 1050
5 Irrigation, pipes and
pump 1+2+1 25000
6 Agricultural Tools 5 150 750
7 Transportation 0 1000
8 Fencing
4000
Total 42110
2. Pre-bearing Stage
a. Cost of manpower/labour
No. Head Year wise Cost (Rs)
2nd
Year 3rd
Year 4th
Year
Fam
ily
Lab
ou
r
Hir
ed L
abou
r
Fam
ily
co
st (
Rs.
)
Hir
ed c
ost
(R
s.)
To
tal
cost
(R
s)
Fam
ily
Lab
ou
r
Hir
ed L
abou
r
Fam
ily
co
st (
Rs.
)
Hir
ed c
ost
(R
s.)
To
tal
cost
(R
s.)
Fam
ily
Lab
ou
r
Hir
ed L
abou
r
Fam
ily
co
st (
Rs.
)
Hir
ed c
ost
(R
s.)
To
tal
cost
(R
s.)
1 Weeding &
Cleaning
2
4 60
0
12
00
18
00
2
4 60
0
12
00
18
00
2
4 60
0
12
00
18
00
2 Basin
Preparation
2
4 60
0
12
00
18
00
2
4 60
0
12
00
18
00
2
4 60
0
12
00
18
00
3 FYM &
Fertilizer
Application
1
1 30
0
30
0
60
0
1
1 30
0
30
0
60
0
1
1 30
0
30
0
60
0
4 Pesticide &
Other Sprays 1 1 3
00
30
0
60
0
1 1 30
0
30
0
60
0
1 2 30
0
60
0
90
0

133
5 Irrigation 1
2 30
0
60
0
90
0
1
2 30
0
60
0
90
0
1
2 30
0
60
0
90
0
6 Other
Intercultural
Operation
2
2 60
0
60
0
12
00
2
2 60
0
60
0
12
00
2
2 60
0
60
0
12
00
7 Any Other Cost 0.5
0 15
0
0
15
0
1
0 30
0
0
30
0
1
0 30
0
0
30
0
8 Total Cost
28
50
42
00
70
50
30
00
42
00
72
00
30
00
45
00
75
00
b. Material1 Cost
2nd
Year 3rd
Year 4th
Year
SL.
No. Head
Qu
anti
ty
(kg
)
Rat
e
(Rs.
)
Am
ou
nt
(Rs.
)
Qu
anti
ty
(kg
)
Rat
e
(Rs.
)
Am
ou
nt
(Rs.
)
Qu
anti
ty
(kg
)
Rat
e
(Rs.
)
Am
ou
nt
(Rs.
)
1 FYM
12
00
2
24
00
15
00
2
30
00
20
00
2
40
00
2 Fertilizer 0
0 0
0 0
i. Urea 28
5.4
2
15
1.8
28
5.4
2
15
1.8
42
5.4
2
22
7.6
ii. SSP 23
10
.23
23
5.3
23
10
.23
23
5.3
28
10
.23
28
6.4
iii. MOP
10
17
.15
17
1.5
10
17
.15
17
1.5
14
17
.15
24
0.1
3
Pesticides
(Fungicide+Ins
ecticide)
1+
1
50
0+
60
0
11
00
1+
1.5
50
0+
60
0
14
00
2+
2
50
0+
60
0
22
00
5 Agricultural
tools
5
15
0
75
0
5
15
0
75
0
5
15
0
75
0

134
7 Transportation
10
0
30
0
10
0
35
0
10
0
40
0
8.
Other costs
like fencing
and harvesting
etc.
10
00
10
00
0
10
00
0
10
00
Total
61
08
.6
70
58
.6
91
04
.1
3. Bearing Stage
a. Cost of manpower/labour
i. Manpower cost in 5th
and 6th
year
Year wise Cost (Rs)
No. Head 5th
Year 6th
Year
Fam
ily
Lab
ou
r
Hir
ed L
abou
r
Fam
ily
co
st (
Rs.
)
Hir
ed c
ost
(R
s.)
To
tal
cost
(R
s)
Fam
ily
Lab
ou
r
Hir
ed L
abou
r
Fam
ily
co
st (
Rs.
)
Hir
ed c
ost
(R
s.)
To
tal
cost
(R
s.)
1 Weeding &
Cleaning
2
4 60
0
12
00
18
00 2
4 60
0
12
00
18
00
2 Basin
Preparation
2
4 60
0
12
00
18
00 2
4 60
0
12
00
18
00
3 FYM &
Fertilizer
Application
1
2 30
0
60
0
90
0 1
2 30
0
60
0
90
0
4 Pesticide &
Other Sprays 1 2 3
00
60
0
90
0
1 2 30
0
60
0
90
0
5 Irrigation 1
2 30
0
60
0
90
0 1
2 30
0
60
0
90
0
6 Other
Intercultural
Operation
2
2 60
0
60
0
12
00 2
2 60
0
60
0
12
00
7 Any Other Cost
and Harvesting
1
0 30
0
0
30
0
1
1 30
0
30
0
60
0
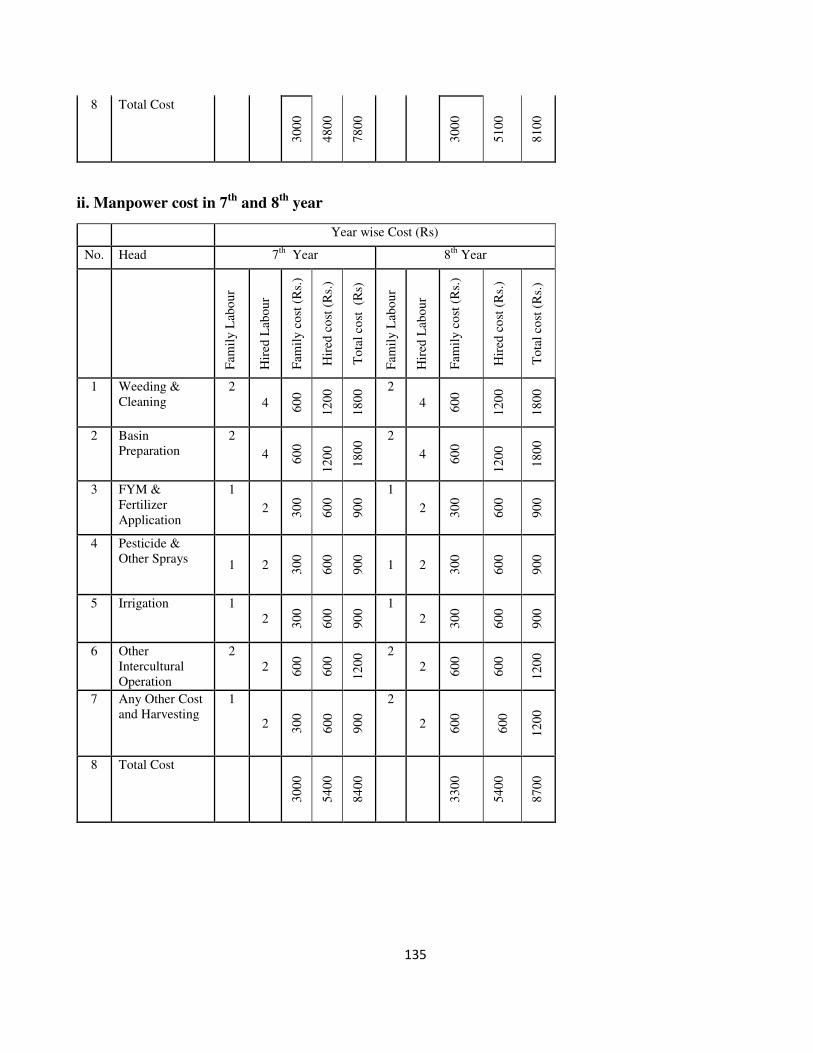
135
8 Total Cost
30
00
48
00
78
00
30
00
51
00
81
00
ii. Manpower cost in 7th
and 8th
year
Year wise Cost (Rs)
No. Head 7th
Year 8th
Year
Fam
ily
Lab
ou
r
Hir
ed L
abou
r
Fam
ily
co
st (
Rs.
)
Hir
ed c
ost
(R
s.)
To
tal
cost
(R
s)
Fam
ily
Lab
ou
r
Hir
ed L
abou
r
Fam
ily
co
st (
Rs.
)
Hir
ed c
ost
(R
s.)
To
tal
cost
(R
s.)
1 Weeding &
Cleaning
2
4 60
0
12
00
18
00 2
4 60
0
12
00
18
00
2 Basin
Preparation
2
4 60
0
12
00
18
00 2
4 60
0
12
00
18
00
3 FYM &
Fertilizer
Application
1
2 30
0
60
0
90
0 1
2 30
0
60
0
90
0
4 Pesticide &
Other Sprays 1 2 3
00
60
0
90
0
1 2 30
0
60
0
90
0
5 Irrigation 1
2 30
0
60
0
90
0 1
2 30
0
60
0
90
0
6 Other
Intercultural
Operation
2
2 60
0
60
0
12
00 2
2 60
0
60
0
12
00
7 Any Other Cost
and Harvesting
1
2 30
0
60
0
90
0
2
2 60
0
60
0
12
00
8 Total Cost
30
00
54
00
84
00
33
00
54
00
87
00
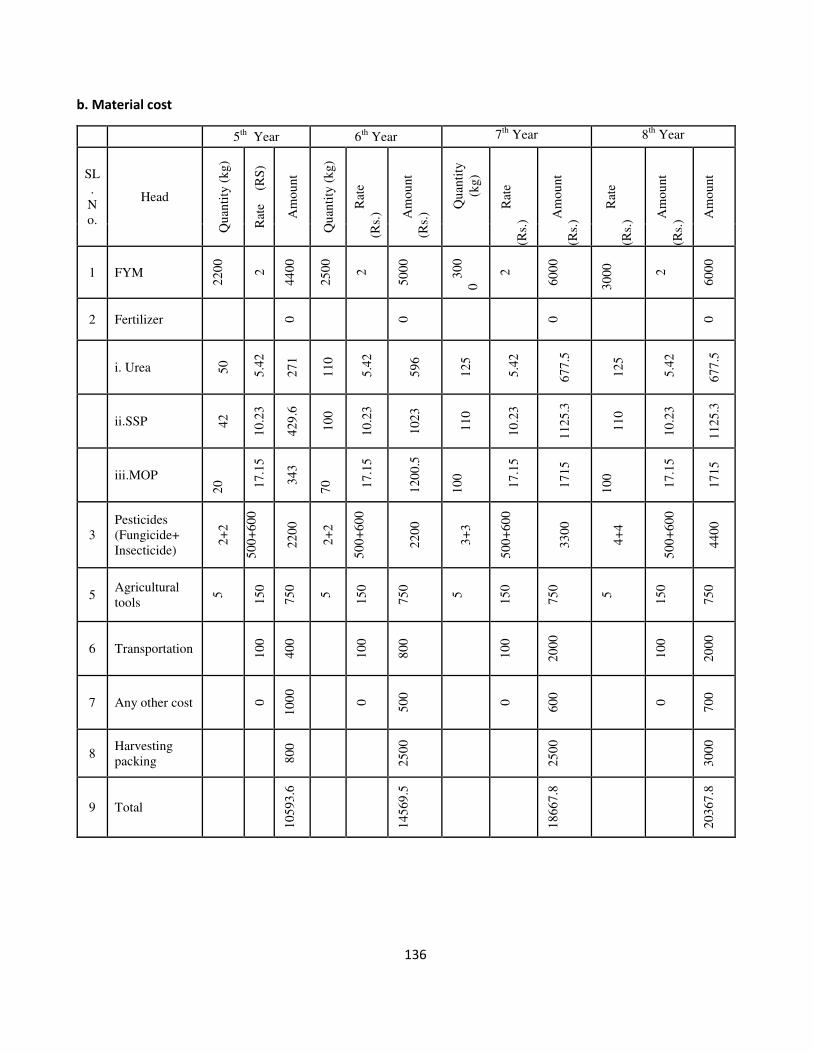
136
b. Material cost
5th
Year 6th
Year 7th
Year 8th
Year
SL
.
N
o.
Head
Qu
anti
ty (
kg)
Rat
e
(R
S)
Am
ou
nt
Qu
anti
ty (
kg)
Rat
e
(Rs.
) Am
ou
nt
(Rs.
)
Qu
anti
ty
(kg
)
Rat
e
(Rs.
) Am
ou
nt
(Rs.
)
Rat
e
(Rs.
) Am
ou
nt
(Rs.
) Am
ou
nt
1 FYM
22
00
2
44
00
25
00
2
50
00
3
00
0
2
60
00
30
00
2
60
00
2 Fertilizer 0 0 0 0
i. Urea 50
5.4
2
27
1
11
0
5.4
2
59
6
12
5
5.4
2
67
7.5
12
5
5.4
2
67
7.5
ii.SSP 42
10
.23
42
9.6
10
0
10
.23
10
23
11
0
10
.23
11
25
.3
11
0
10
.23
11
25
.3
iii.MOP
20
17
.15
34
3
70
17
.15
12
00
.5
10
0
17
.15
17
15
10
0
17
.15
17
15
3
Pesticides
(Fungicide+
Insecticide)
2+
2
50
0+
60
0
22
00
2+
2
50
0+
60
0
22
00
3+
3
50
0+
60
0
33
00
4+
4
50
0+
60
0
44
00
5 Agricultural
tools
5
15
0
75
0
5
15
0
75
0
5
15
0
75
0
5
15
0
75
0
6 Transportation
10
0
40
0
10
0
80
0
10
0
20
00
10
0
20
00
7 Any other cost 0
10
00
0
50
0
0
60
0
0
70
0
8 Harvesting
packing
80
0
25
00
25
00
30
00
9 Total
10
593
.6
14
569
.5
18
667
.8
20
367
.8

137
4. Cost cultivation from 1st
of to 8th
year
S. No.
Fruit crop Progressive Farmer
Manpower cost (Rs.)
Ma
teri
al
cost
(R
s.)
Gra
nd
Tota
l (R
s.)
Fa
mil
y L
ab
ou
r
Hir
ed l
ab
ou
r
To
tal
La
bo
ur
cost
(Rs.
) 1. Orange
24750
43500
68250
12858
0
19683
0.0
5. Cost of plant nursery
Nursery plants Year
5 6 7 8
Nos. of Grafted
Plants
2500 5000 5000 5000
Cost 7500 90000 90000 90000
6. Return
No. Head
5th
Yea
r
6th
Yea
r
7th
Yea
r
8th
Yea
r
1. Total fruit
harvested/Tree
45 80 315 500
2. Total
Production fruit
(Kg/tree)
5.2 9.4 37.4 58.8
3. Total
Production
(kg/ha)
1440.5 2603.8 10359.8 16287.6
4. Total return
from the sale of
fruits @ Rs.
12/fruit
17286 31245.6 124317.6 195451.2

138
5. Total return
from plants sale
@ Rs. 30/plant
75000 150000 150000 150000
Total Return
(Rs.)
92286 181245.6 274317.6 345451.2

139
Assessment of cost of cultivation of
agricultural/horticultural crops in Tripura
ICAR (RC) for NEH Region, Tripura Centre, Lembucherra, Tripura
& Directorate of Economics and Statistics, Govt. of Tripura, Agartala
Name of Crop: Papaya
Farmer category: Non progressive
Area Covered: 1ha.
1. Cost of Planting and after care
a. Cost of manpower/labour
No. Head Labour PT
(hr)
Family
cost
(Rs.)
Hired
cost
(Rs.)
Total cost
(Rs) Family Hired
1 Land Cleaning & Leveling 10 4 0 3000 1200 4200
2 Layout & Pit Digging 10 6 3000 1800 4800
3 Pit feeling, Planting &
Watering
8 6
2400 1800 4200
4 Fencing Labour 2 0 600 0 600
5 Other Intercultural Operation
Including irrigation, FYM and
fertilizer application, Insect &
Pest Mgt
6
2
1800 600 2400
6 Removal of diseased or
defective plants, Gap Feeling &
any other day to day labour
cost
3
1
900 300 1200
Total 11700 5700 17400

140
b. Material cost
Sl. No. Head Quantity Nos. or kg Rate(RS) Amount
1 Planting materials 2500 10 25000
2 FYM 2500 2 5000
4 Fungicide and Insecticide 1+1 450+550 1000
5 Irrigation and pipes 1+1 6000
6 Agricultural Tools 5 100 500
7 Fertilizer 0
Urea 60 5.42 325.2
SSP 30 10.23 306.9
MOP 28 17.15 480.2
8 Transportation 0 500
9 Fencing 1000
10 Harvesting and packing 800
Total 40912.3
2. Cost of cultivation
S. No.
Fruit crop Non Progressive Farmer
Manpower cost
(Rs.)
Ma
teri
al
cost
(R
s.)
Gra
nd
Tota
l (R
s.)
Fa
mil
y L
ab
ou
r
Hir
ed l
ab
ou
r
To
tal
La
bou
r co
st
(Rs.
)
1. Papaya
11
70
0
57
00
17
40
0
40
91
2.3
58
31
2.3
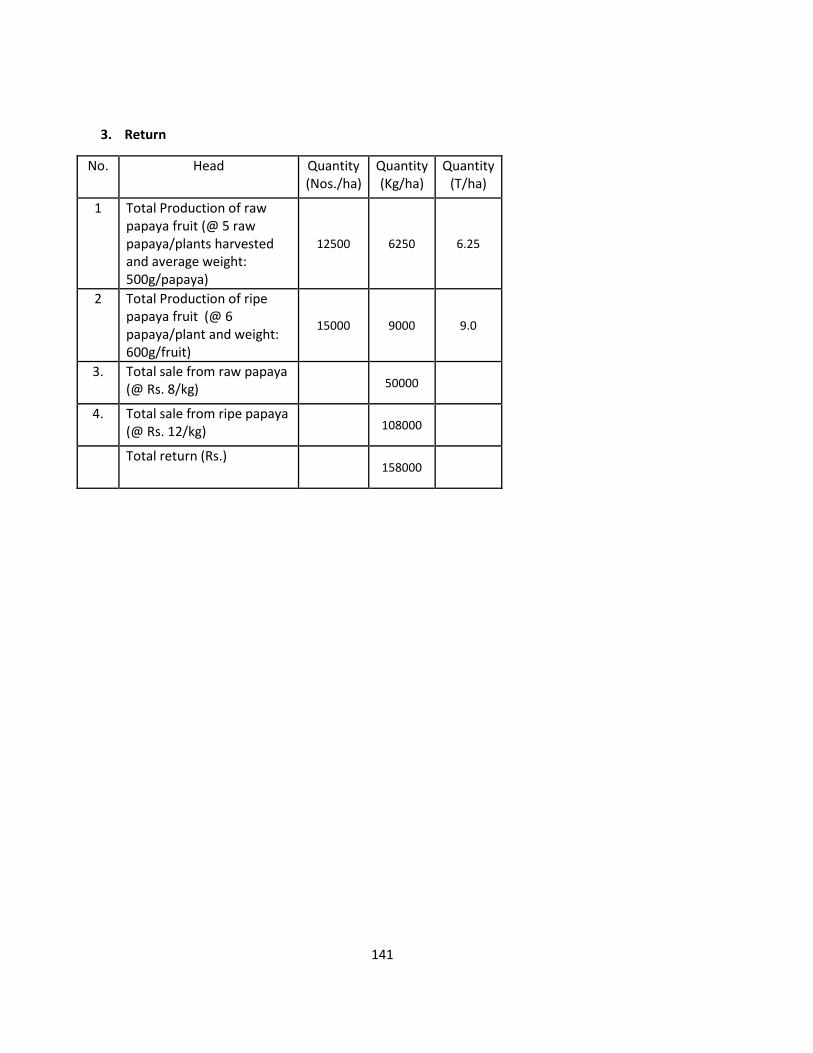
141
3. Return
No. Head Quantity
(Nos./ha)
Quantity
(Kg/ha)
Quantity
(T/ha)
1 Total Production of raw
papaya fruit (@ 5 raw
papaya/plants harvested
and average weight:
500g/papaya)
12500 6250 6.25
2 Total Production of ripe
papaya fruit (@ 6
papaya/plant and weight:
600g/fruit)
15000 9000 9.0
3. Total sale from raw papaya
(@ Rs. 8/kg) 50000
4. Total sale from ripe papaya
(@ Rs. 12/kg) 108000
Total return (Rs.) 158000
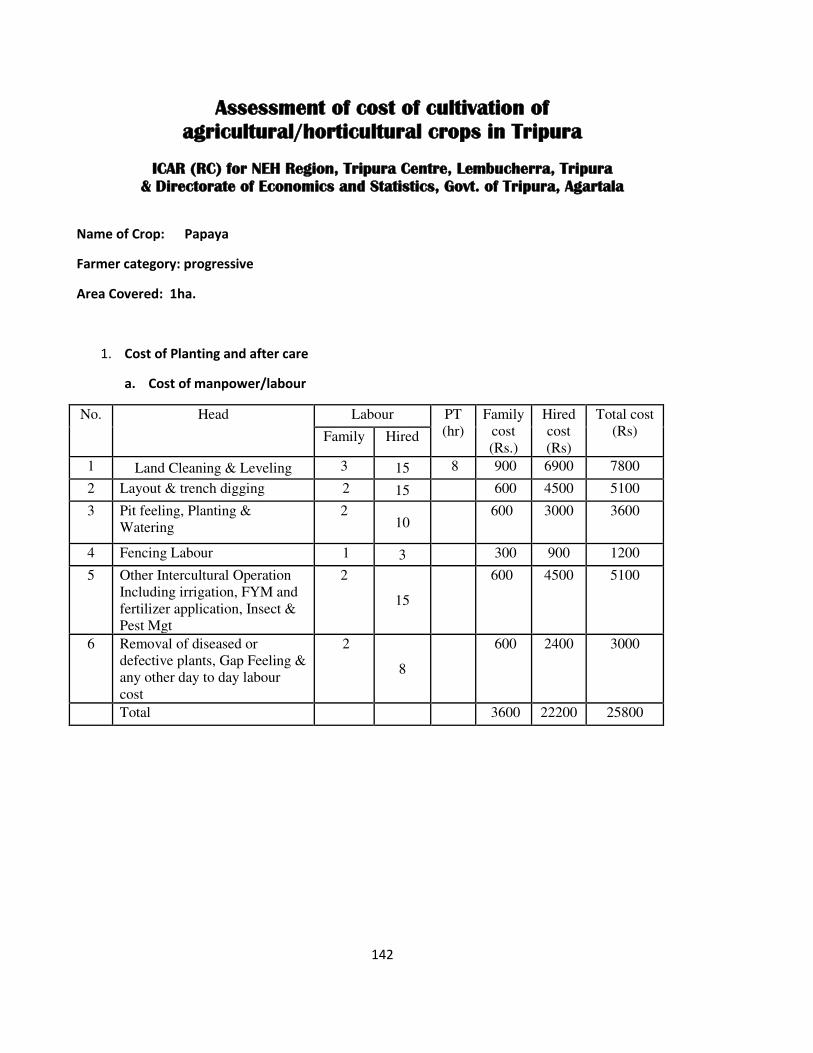
142
Assessment of cost of cultivation of
agricultural/horticultural crops in Tripura
ICAR (RC) for NEH Region, Tripura Centre, Lembucherra, Tripura
& Directorate of Economics and Statistics, Govt. of Tripura, Agartala
Name of Crop: Papaya
Farmer category: progressive
Area Covered: 1ha.
1. Cost of Planting and after care
a. Cost of manpower/labour
No. Head Labour PT
(hr)
Family
cost
(Rs.)
Hired
cost
(Rs)
Total cost
(Rs) Family Hired
1 Land Cleaning & Leveling 3 15 8 900 6900 7800
2 Layout & trench digging 2 15 600 4500 5100
3 Pit feeling, Planting &
Watering
2 10
600 3000 3600
4 Fencing Labour 1 3 300 900 1200
5 Other Intercultural Operation
Including irrigation, FYM and
fertilizer application, Insect &
Pest Mgt
2
15
600 4500 5100
6 Removal of diseased or
defective plants, Gap Feeling &
any other day to day labour
cost
2
8
600 2400 3000
Total 3600 22200 25800
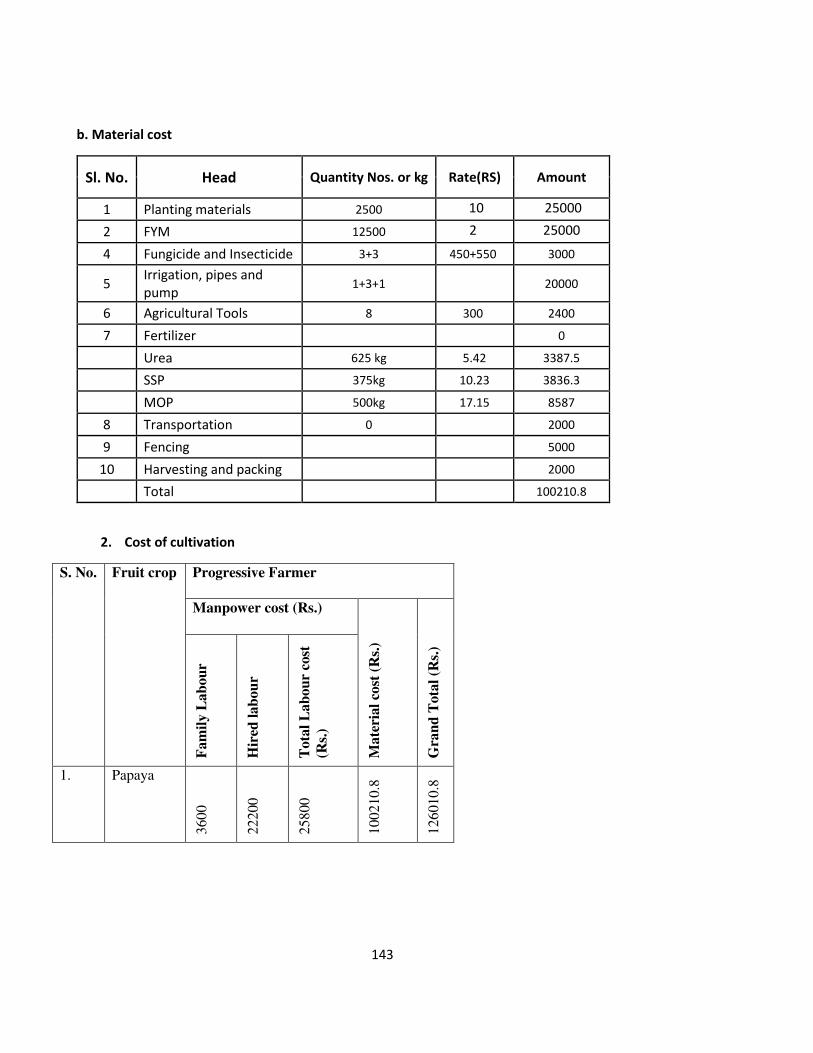
143
b. Material cost
Sl. No. Head Quantity Nos. or kg Rate(RS) Amount
1 Planting materials 2500 10 25000
2 FYM 12500 2 25000
4 Fungicide and Insecticide 3+3 450+550 3000
5 Irrigation, pipes and
pump 1+3+1 20000
6 Agricultural Tools 8 300 2400
7 Fertilizer 0
Urea 625 kg 5.42 3387.5
SSP 375kg 10.23 3836.3
MOP 500kg 17.15 8587
8 Transportation 0 2000
9 Fencing 5000
10 Harvesting and packing 2000
Total 100210.8
2. Cost of cultivation
S. No.
Fruit crop Progressive Farmer
Manpower cost (Rs.)
Ma
teri
al
cost
(R
s.)
Gra
nd
Tota
l (R
s.)
Fa
mil
y L
ab
ou
r
Hir
ed l
ab
ou
r
To
tal
Lab
ou
r co
st
(Rs.
)
1. Papaya
36
00
22
20
0
25
80
0
10
02
10
.8
12
60
10
.8
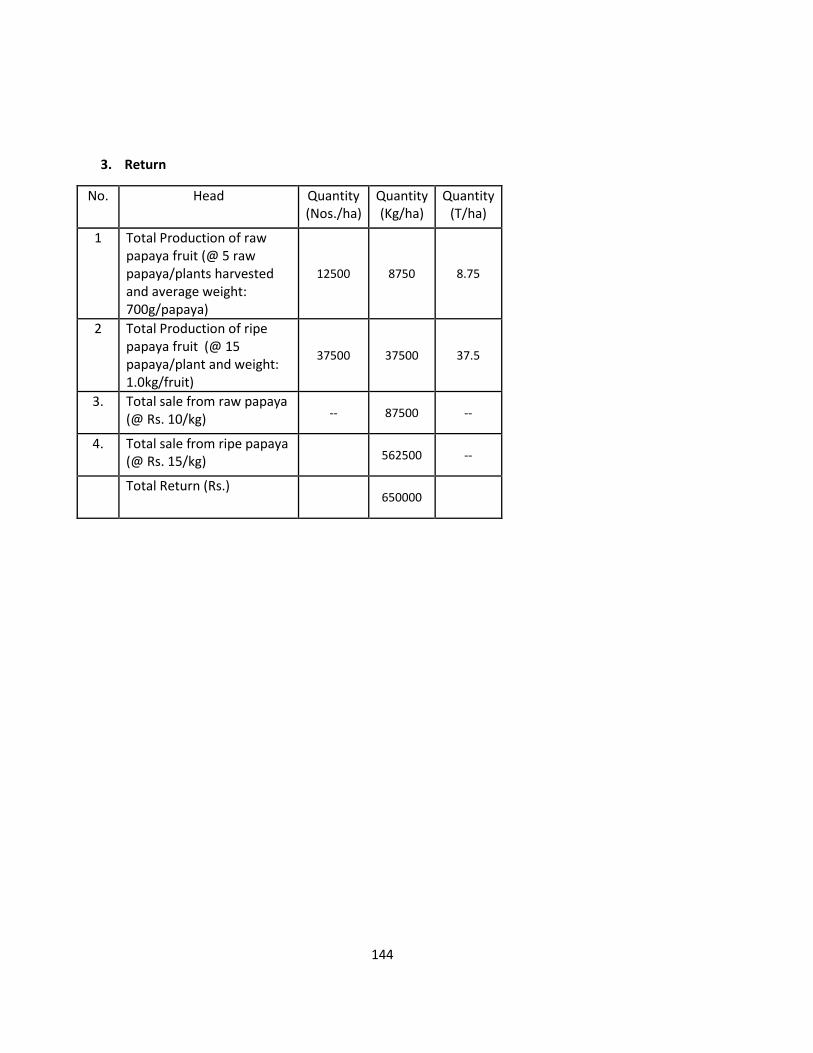
144
3. Return
No. Head Quantity
(Nos./ha)
Quantity
(Kg/ha)
Quantity
(T/ha)
1 Total Production of raw
papaya fruit (@ 5 raw
papaya/plants harvested
and average weight:
700g/papaya)
12500 8750 8.75
2 Total Production of ripe
papaya fruit (@ 15
papaya/plant and weight:
1.0kg/fruit)
37500 37500 37.5
3. Total sale from raw papaya
(@ Rs. 10/kg) -- 87500 --
4. Total sale from ripe papaya
(@ Rs. 15/kg) 562500 --
Total Return (Rs.) 650000
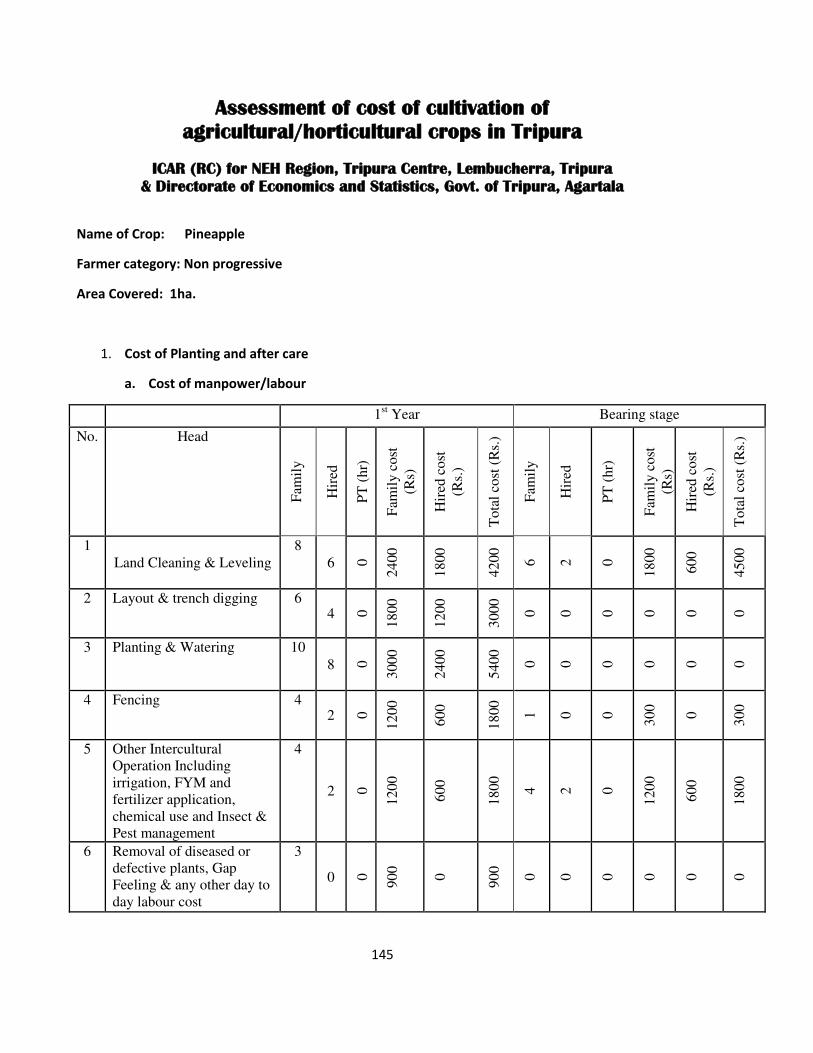
145
Assessment of cost of cultivation of
agricultural/horticultural crops in Tripura
ICAR (RC) for NEH Region, Tripura Centre, Lembucherra, Tripura
& Directorate of Economics and Statistics, Govt. of Tripura, Agartala
Name of Crop: Pineapple
Farmer category: Non progressive
Area Covered: 1ha.
1. Cost of Planting and after care
a. Cost of manpower/labour
1st Year Bearing stage
No. Head
Fam
ily
Hir
ed
PT
(hr)
Fam
ily c
ost
(Rs)
Hir
ed c
ost
(Rs.
)
To
tal
cost
(R
s.)
Fam
ily
Hir
ed
PT
(hr)
Fam
ily c
ost
(Rs)
Hir
ed c
ost
(Rs.
)
To
tal
cost
(R
s.)
1
Land Cleaning & Leveling
8
6 0
2400
1800
4200
6
2
0
1800
600
4500
2 Layout & trench digging 6 4 0
1800
1200
3000
0
0
0
0
0
0
3 Planting & Watering 10
8 0
3000
2400
5400
0
0
0
0
0
0
4 Fencing 4 2 0
12
00
60
0
18
00
1
0
0
30
0
0
30
0
5 Other Intercultural
Operation Including
irrigation, FYM and
fertilizer application,
chemical use and Insect &
Pest management
4
2 0
12
00
60
0
18
00
4
2
0
12
00
60
0
18
00
6 Removal of diseased or
defective plants, Gap
Feeling & any other day to
day labour cost
3
0 0
90
0
0
90
0
0
0
0
0
0
0
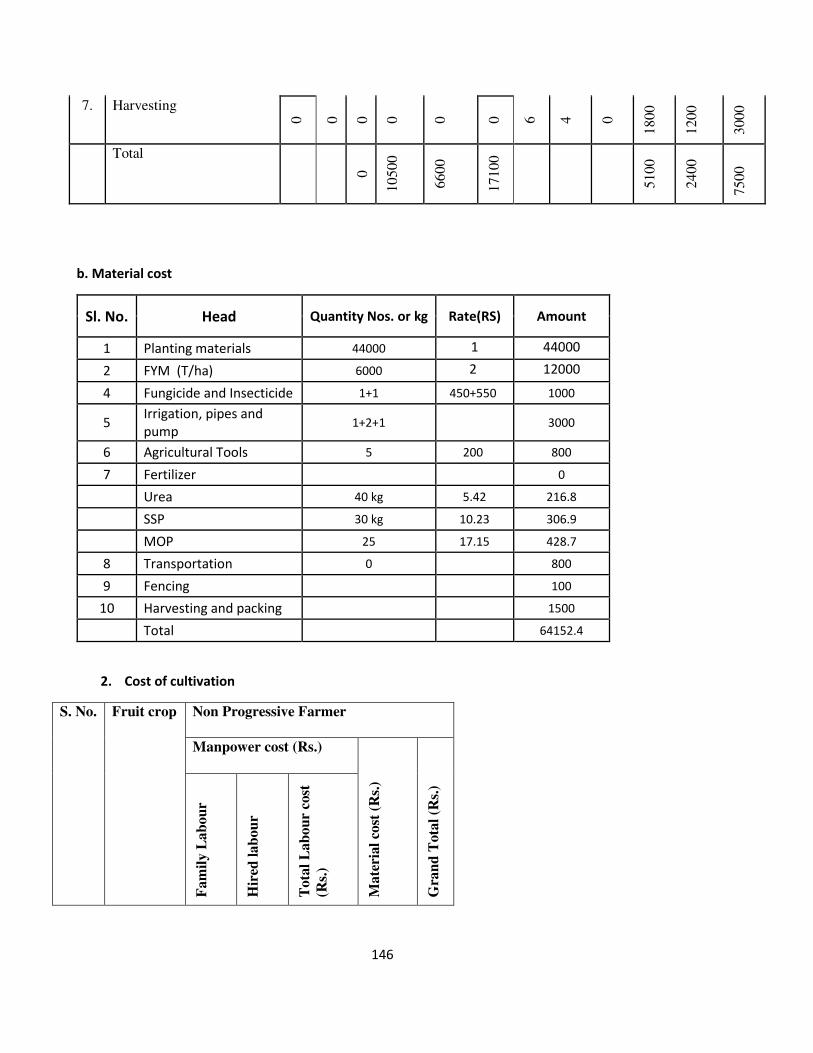
146
7. Harvesting
0
0
0
0
0
0
6
4
0
18
00
12
00
30
00
Total
0
10
50
0
66
00
17
10
0
51
00
24
00
75
00
b. Material cost
Sl. No. Head Quantity Nos. or kg Rate(RS) Amount
1 Planting materials 44000 1 44000
2 FYM (T/ha) 6000 2 12000
4 Fungicide and Insecticide 1+1 450+550 1000
5 Irrigation, pipes and
pump 1+2+1 3000
6 Agricultural Tools 5 200 800
7 Fertilizer 0
Urea 40 kg 5.42 216.8
SSP 30 kg 10.23 306.9
MOP 25 17.15 428.7
8 Transportation 0 800
9 Fencing 100
10 Harvesting and packing 1500
Total 64152.4
2. Cost of cultivation
S. No.
Fruit crop Non Progressive Farmer
Manpower cost (Rs.)
Ma
teri
al
cost
(R
s.)
Gra
nd
Tota
l (R
s.)
Fam
ily
La
bo
ur
Hir
ed l
ab
ou
r
Tota
l L
ab
ou
r co
st
(Rs.
)
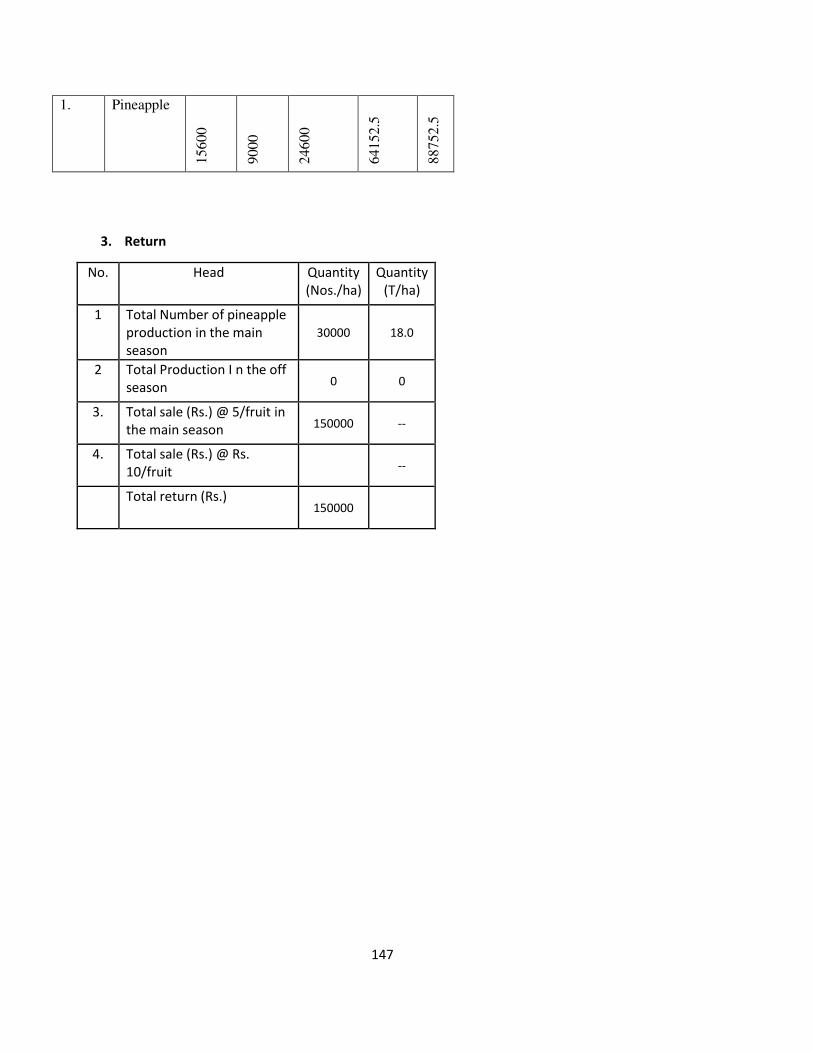
147
1. Pineapple
15
60
0
90
00
24
60
0
64
15
2.5
88
75
2.5
3. Return
No. Head Quantity
(Nos./ha)
Quantity
(T/ha)
1 Total Number of pineapple
production in the main
season
30000 18.0
2 Total Production I n the off
season 0 0
3. Total sale (Rs.) @ 5/fruit in
the main season 150000 --
4. Total sale (Rs.) @ Rs.
10/fruit --
Total return (Rs.) 150000
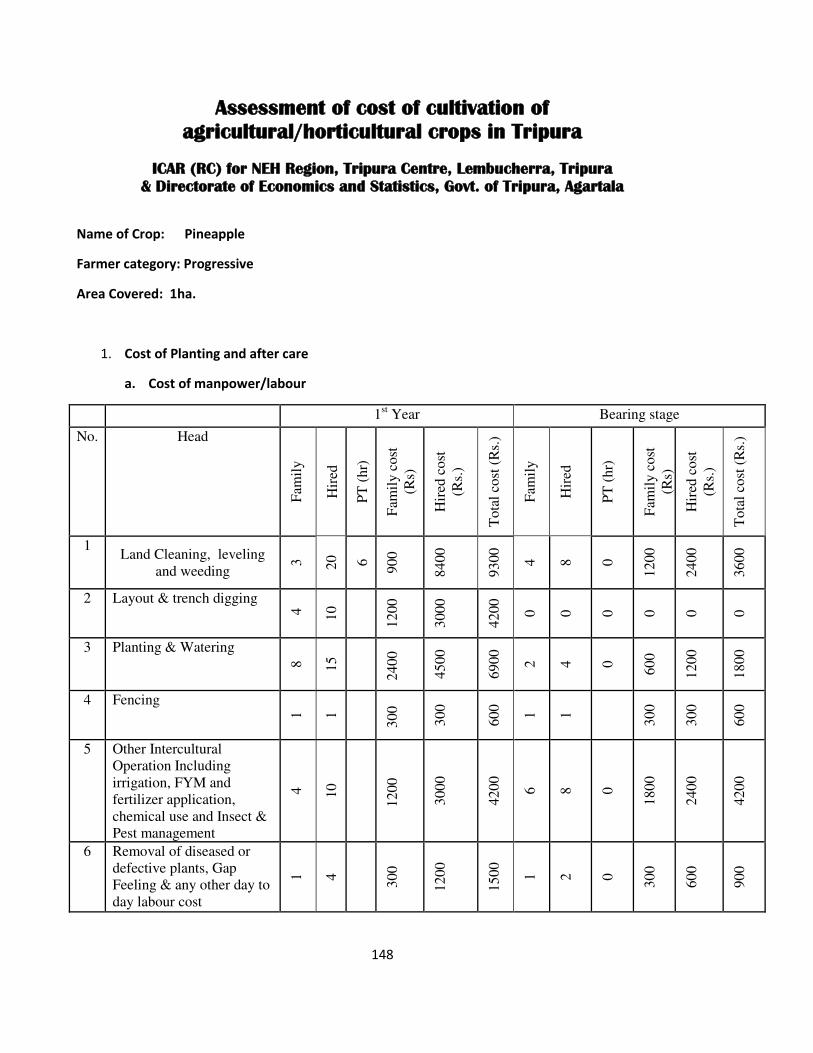
148
Assessment of cost of cultivation of
agricultural/horticultural crops in Tripura
ICAR (RC) for NEH Region, Tripura Centre, Lembucherra, Tripura
& Directorate of Economics and Statistics, Govt. of Tripura, Agartala
Name of Crop: Pineapple
Farmer category: Progressive
Area Covered: 1ha.
1. Cost of Planting and after care
a. Cost of manpower/labour
1st Year Bearing stage
No. Head
Fam
ily
Hir
ed
PT
(hr)
Fam
ily c
ost
(Rs)
Hir
ed c
ost
(Rs.
)
To
tal
cost
(R
s.)
Fam
ily
Hir
ed
PT
(hr)
Fam
ily c
ost
(Rs)
Hir
ed c
ost
(Rs.
)
To
tal
cost
(R
s.)
1 Land Cleaning, leveling
and weeding
3
20
6
900
8400
9300
4
8
0
1200
2400
3600
2 Layout & trench digging
4
10
1200
3000
4200
0
0
0
0
0
0
3 Planting & Watering
8
15
2400
4500
6900
2
4
0
600
1200
1800
4 Fencing
1
1
30
0
30
0
60
0
1
1
30
0
30
0
60
0
5 Other Intercultural
Operation Including
irrigation, FYM and
fertilizer application,
chemical use and Insect &
Pest management
4
10
12
00
30
00
42
00
6
8
0
18
00
24
00
42
00
6 Removal of diseased or
defective plants, Gap
Feeling & any other day to
day labour cost
1
4
30
0
120
0
150
0
1
2
0
30
0
60
0
90
0

149
7. Harvesting
0
0
0
0
0
0
8
10
0
24
00
30
00
54
00
Total
63
00
20
40
0
26
70
0
66
00
99
00
16
50
0
b. Material cost
Sl. No. Head Quantity Nos. or kg Rate(RS) Amount
1 Planting materials 44000 1 44000
2 FYM (T/ha) 10000 2 20000
4 Fungicide and Insecticide 5+5 450+550 5000
5 Irrigation, pipes and
pump 1+3+1 20000
6 Agricultural Tools 8 300 2400
7 Fertilizer 0
Urea 200 kg 5.42 1084
SSP 150 kg 10.23 1534.5
MOP 150 kg 17.15 2572.5
8 Transportation 0 1000
9 Fencing 1000
10 Harvesting and packing 2000
Total 100591
2. Cost of cultivation
S. No.
Fruit crop Progressive Farmer
Manpower cost (Rs.)
Ma
teri
al
cost
(R
s.)
Gra
nd
Tota
l (R
s.)
Fa
mil
y L
ab
ou
r
Hir
ed l
ab
ou
r
To
tal
La
bo
ur
cost
(Rs.
)
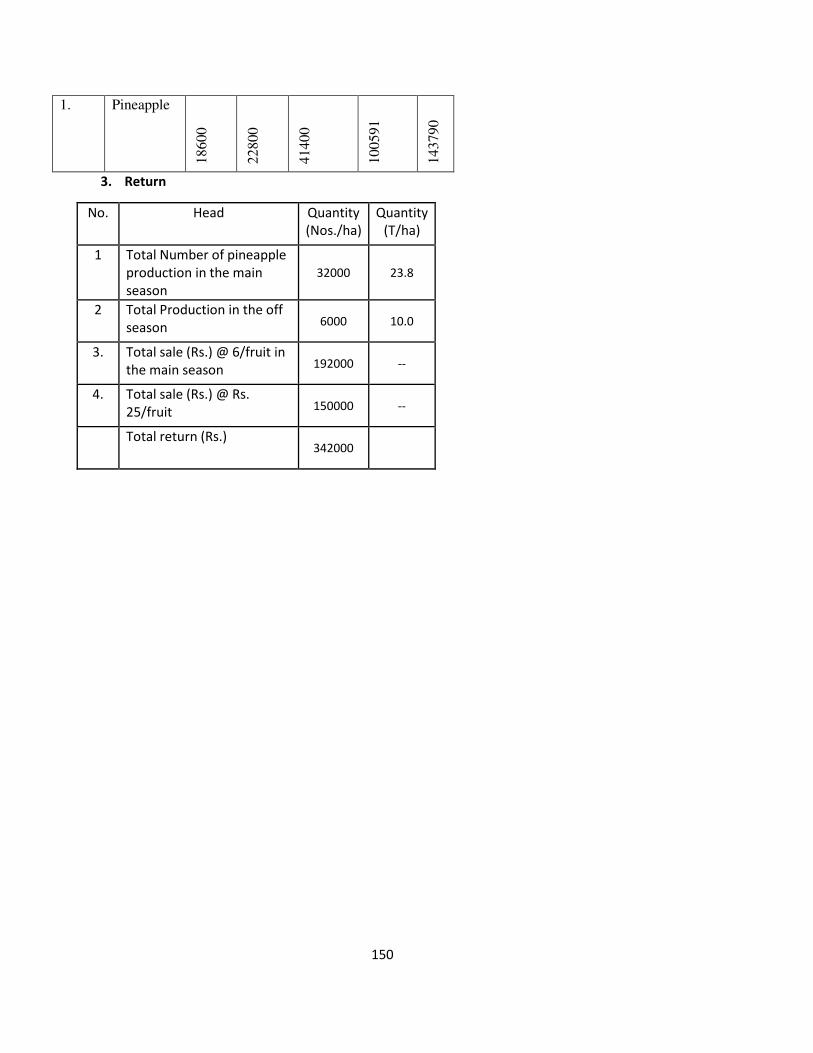
150
1. Pineapple
18
60
0
22
80
0
41
40
0
10
05
91
14
37
90
3. Return
No. Head Quantity
(Nos./ha)
Quantity
(T/ha)
1 Total Number of pineapple
production in the main
season
32000 23.8
2 Total Production in the off
season 6000 10.0
3. Total sale (Rs.) @ 6/fruit in
the main season 192000 --
4. Total sale (Rs.) @ Rs.
25/fruit 150000 --
Total return (Rs.) 342000
Annexure VI
Proforma for collection of data on cost of cultivation of cereal crops,
vegetable crops and fruit crops

Assessment of cost of cultivation of
agricultural/horticultural crops in Tripura
ICAR (RC) for NEH Region, Tripura Centre, Lembucherra, Tripura
& Directorate of Economics and Statistics, Govt. of Tripura, Agartala
Vegetable Crops
District: _________________________________, Block__________________________
Vill.______________________
Name of the Farmer: ________________________________________________
S/o: ___________________________________________________________
Ph.:________________________
Total Area: __________, Area under 1. Tomato: __________, 2. Brinjal__________, 3. Chilly __________
Variety :
Crop Variety
Other crops grown:
Crops Name of Crops Season Area
Field Crops
Vegetable crops
Fruit Crops
Farmer’s Category: Small/marginal/Big
Technology adopted:
S.
No
Head Cost (Rs.)
Tomato Brinjal Chilly
1. Land Cleaning
2. Ploughing and ridge
preparation
3. FYM and fertilizer
cost including
transportation
4. FYM and Fertilizer
mixing in the field
5. Seed Cost
6. Nursery raising
7. Transplanting

Assessment of cost of cultivation of
agricultural/horticultural crops in Tripura
ICAR (RC) for NEH Region, Tripura Centre, Lembucherra, Tripura
& Directorate of Economics and Statistics, Govt. of Tripura, Agartala
8. Irrigation and shading
9. Sprays of pesticides
10. Intercultural operation-
weeding hoeing and
earthling etc.
11. Any other inputs
12 Staking
13. Harvesting
14. Grading. Cleaning.
Packaging and
marketing
15. Total Yield
16. Sale rate
17. Total income
Other points (if any):
Signature of the farmer Signature of Data Collector
Signature of Data Collector

Assessment of cost of cultivation of
agricultural/horticultural crops in Tripura
ICAR (RC) for NEH Region, Tripura Centre, Lembucherra, Tripura
& Directorate of Economics and Statistics, Govt. of Tripura, Agartala
Fruit Crops
District: _________________________________, Block__________________________
Vill.______________________
Name of the Farmer: ________________________________________________
S/o: ___________________________________________________________
Ph.:________________________
Total Area: _________________, Area under Mango: __________________________Variety of
Mango: 1.______________________, 2. _____________________, 3. ___________________
Year of Planting:
Age of plantation:
Other crops grown:
Crops Name of Crops Season Area
Field Crops
Vegetable crops
Fruit Crops
Farmer’s Category: Progressive/Non-Progressive
Technology adopted:
1. Land development and planting in the planting Year
S. No Head Cost (Rs.)
1st Year
1. Land Cleaning and leveling
2. Layout, pit digging
3. pit filling with soil and FYM

Assessment of cost of cultivation of
agricultural/horticultural crops in Tripura
ICAR (RC) for NEH Region, Tripura Centre, Lembucherra, Tripura
& Directorate of Economics and Statistics, Govt. of Tripura, Agartala
4. Planting Materials including
Transportation and handling cost
5. Planting and Watering
6. Fencing
7. Pesticide cost and sprays
8. Agricultural Tools for orchard
management
9. Other intercultural operation including
insect and disease management
10. Gap filling
Any other information regarding cost:
2. Pre-bearing stage
i. Variety Amrapalli will take 3-5 years for commercial bearing.
ii. Other varieties will take 7 years for bearing.
Cost (Rs.)
S.
No
Head 2nd
year 3rd
year 4th year 5
th year 6
th year 7
th year
1. Orchard floor weeding
and cleaning
2. Basin Preparation
3. Manure and Fertilizer
cost
4. Pesticide cost
5. Fertilizer application
6. Irrigation and other
Miscellaneous costs
3. Bearing Stage
S. No Head Cost (Rs.)
8th year Full bearing present stage
1. Orchard floor weeding and cleaning
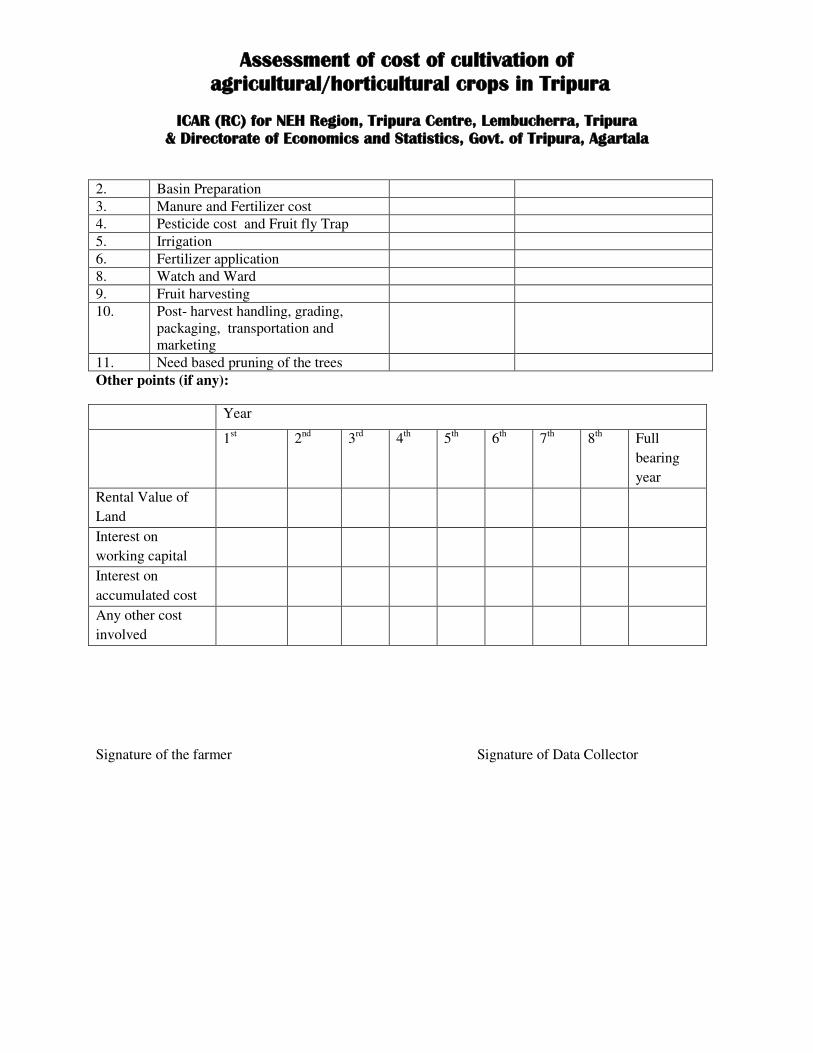
Assessment of cost of cultivation of
agricultural/horticultural crops in Tripura
ICAR (RC) for NEH Region, Tripura Centre, Lembucherra, Tripura
& Directorate of Economics and Statistics, Govt. of Tripura, Agartala
2. Basin Preparation
3. Manure and Fertilizer cost
4. Pesticide cost and Fruit fly Trap
5. Irrigation
6. Fertilizer application
8. Watch and Ward
9. Fruit harvesting
10. Post- harvest handling, grading,
packaging, transportation and
marketing
11. Need based pruning of the trees
Other points (if any):
Year
1st 2
nd 3
rd 4
th 5
th 6
th 7
th 8
th Full
bearing
year
Rental Value of
Land
Interest on
working capital
Interest on
accumulated cost
Any other cost
involved
Signature of the farmer Signature of Data Collector
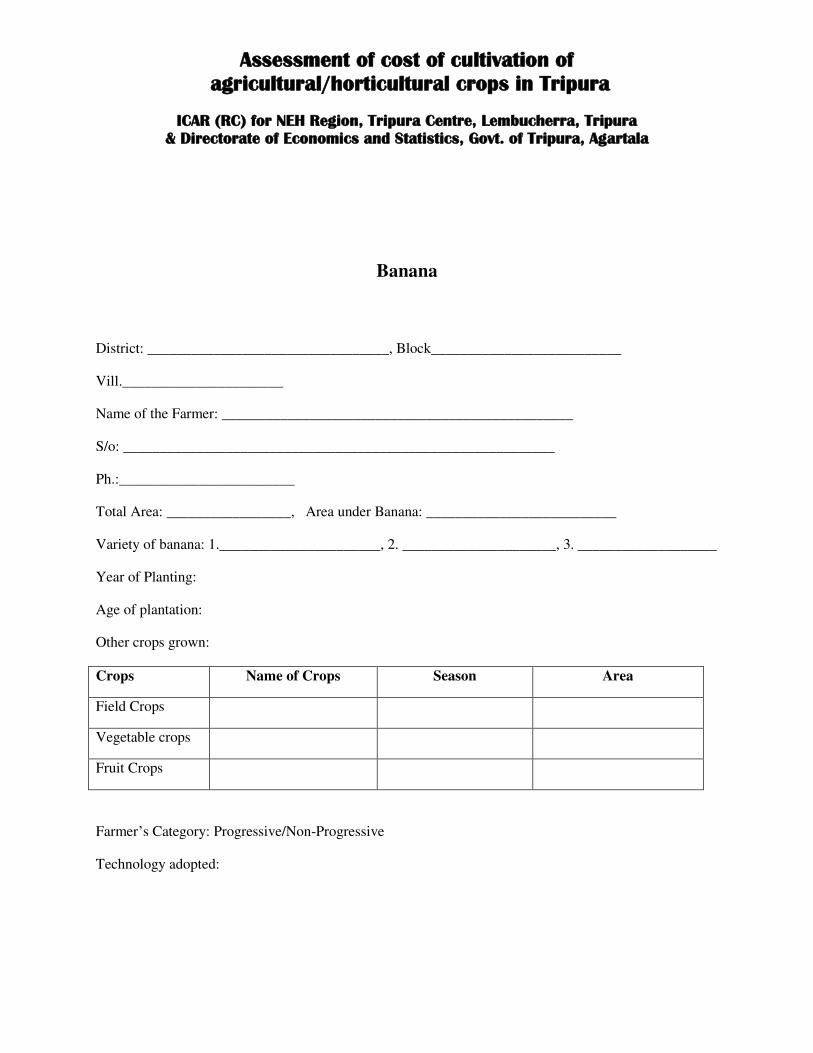
Assessment of cost of cultivation of
agricultural/horticultural crops in Tripura
ICAR (RC) for NEH Region, Tripura Centre, Lembucherra, Tripura
& Directorate of Economics and Statistics, Govt. of Tripura, Agartala
Banana
District: _________________________________, Block__________________________
Vill.______________________
Name of the Farmer: ________________________________________________
S/o: ___________________________________________________________
Ph.:________________________
Total Area: _________________, Area under Banana: __________________________
Variety of banana: 1.______________________, 2. _____________________, 3. ___________________
Year of Planting:
Age of plantation:
Other crops grown:
Crops Name of Crops Season Area
Field Crops
Vegetable crops
Fruit Crops
Farmer’s Category: Progressive/Non-Progressive
Technology adopted:
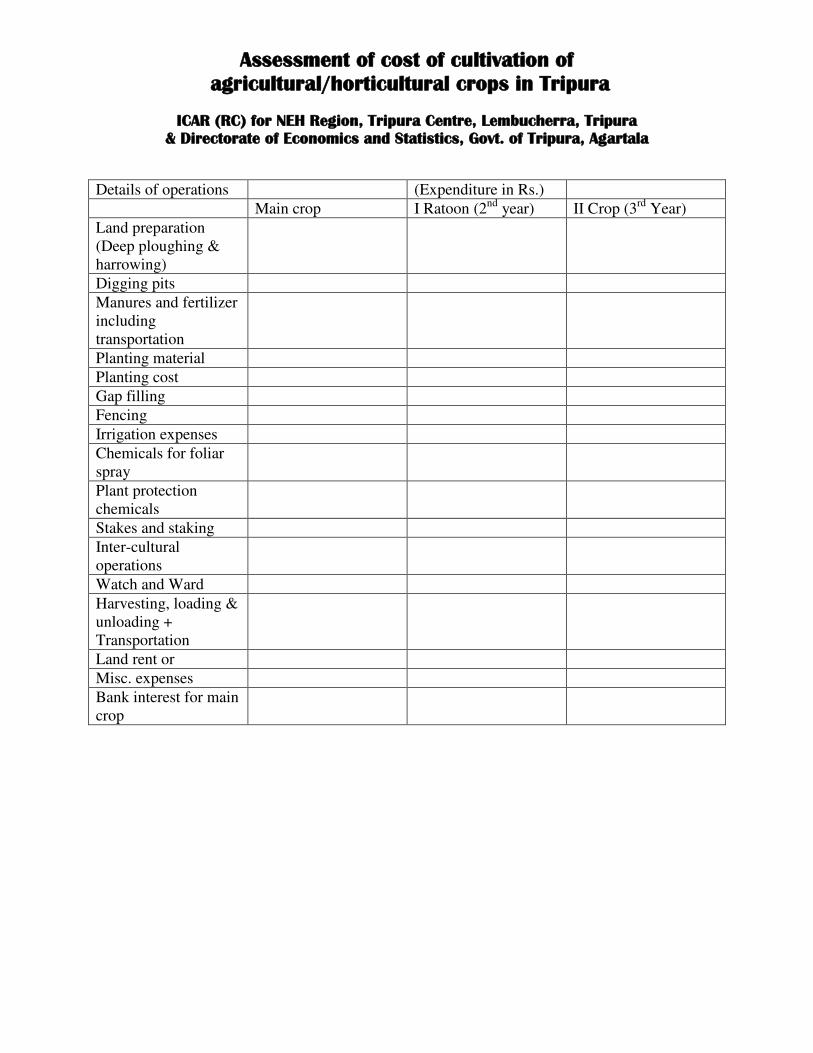
Assessment of cost of cultivation of
agricultural/horticultural crops in Tripura
ICAR (RC) for NEH Region, Tripura Centre, Lembucherra, Tripura
& Directorate of Economics and Statistics, Govt. of Tripura, Agartala
Details of operations (Expenditure in Rs.)
Main crop I Ratoon (2nd
year) II Crop (3rd
Year)
Land preparation
(Deep ploughing &
harrowing)
Digging pits
Manures and fertilizer
including
transportation
Planting material
Planting cost
Gap filling
Fencing
Irrigation expenses
Chemicals for foliar
spray
Plant protection
chemicals
Stakes and staking
Inter-cultural
operations
Watch and Ward
Harvesting, loading &
unloading +
Transportation
Land rent or
Misc. expenses
Bank interest for main
crop
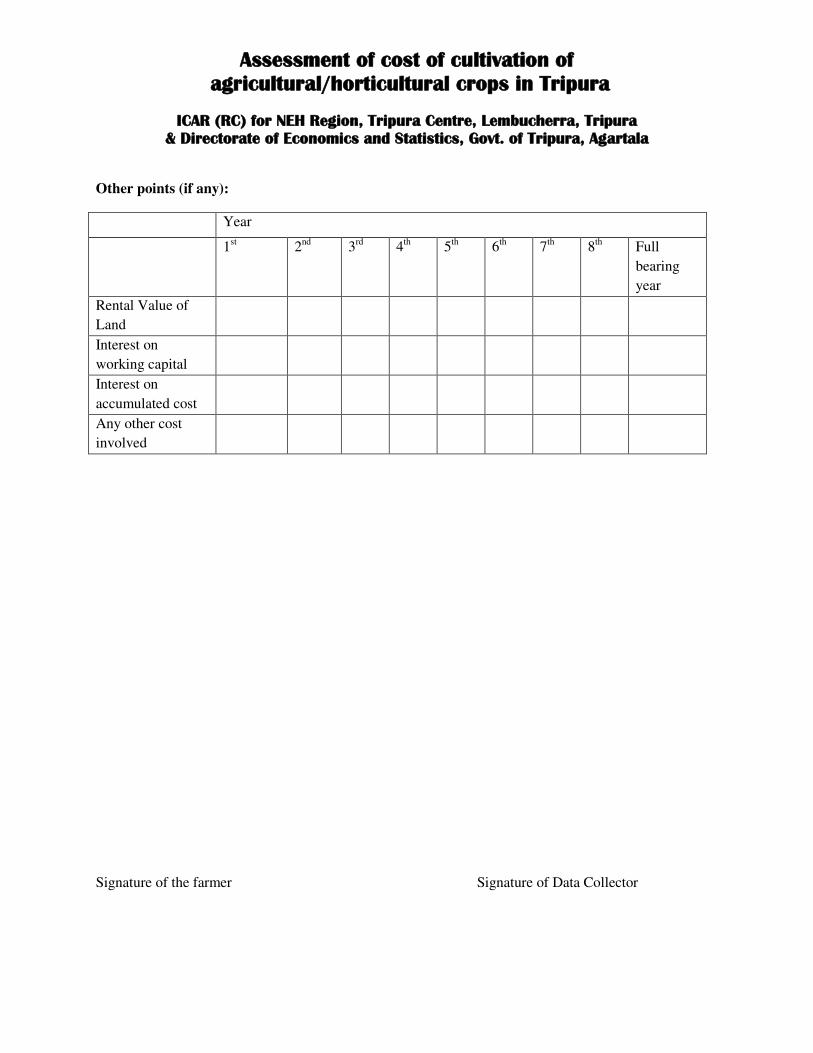
Assessment of cost of cultivation of
agricultural/horticultural crops in Tripura
ICAR (RC) for NEH Region, Tripura Centre, Lembucherra, Tripura
& Directorate of Economics and Statistics, Govt. of Tripura, Agartala
Other points (if any):
Year
1st 2
nd 3
rd 4
th 5
th 6
th 7
th 8
th Full
bearing
year
Rental Value of
Land
Interest on
working capital
Interest on
accumulated cost
Any other cost
involved
Signature of the farmer Signature of Data Collector

Assessment of cost of cultivation of
agricultural/horticultural crops in Tripura
ICAR (RC) for NEH Region, Tripura Centre, Lembucherra, Tripura
& Directorate of Economics and Statistics, Govt. of Tripura, Agartala
Pineapple
District: _________________________________, Block__________________________
Vill.______________________
Name of the Farmer: ________________________________________________
S/o: ___________________________________________________________
Ph.:________________________
Total Area: _________________, Area under Pineapple: __________________________
Variety of Pineapple: 1.______________________, 2. _____________________, 3.
___________________
Year of Planting:
Age of plantation:
Other crops grown:
Crops Name of Crops Season Area
Field Crops
Vegetable crops
Fruit Crops
Farmer’s Category: Progressive/Non-Progressive
Technology adopted:
Details of operations (Expenditure in Rs.)
Main crop I Ratoon (2nd
year) II Crop (3rd
year)
Land preparation
(Deep ploughing &
harrowing)
Digging of trench
Planting material
Suckers
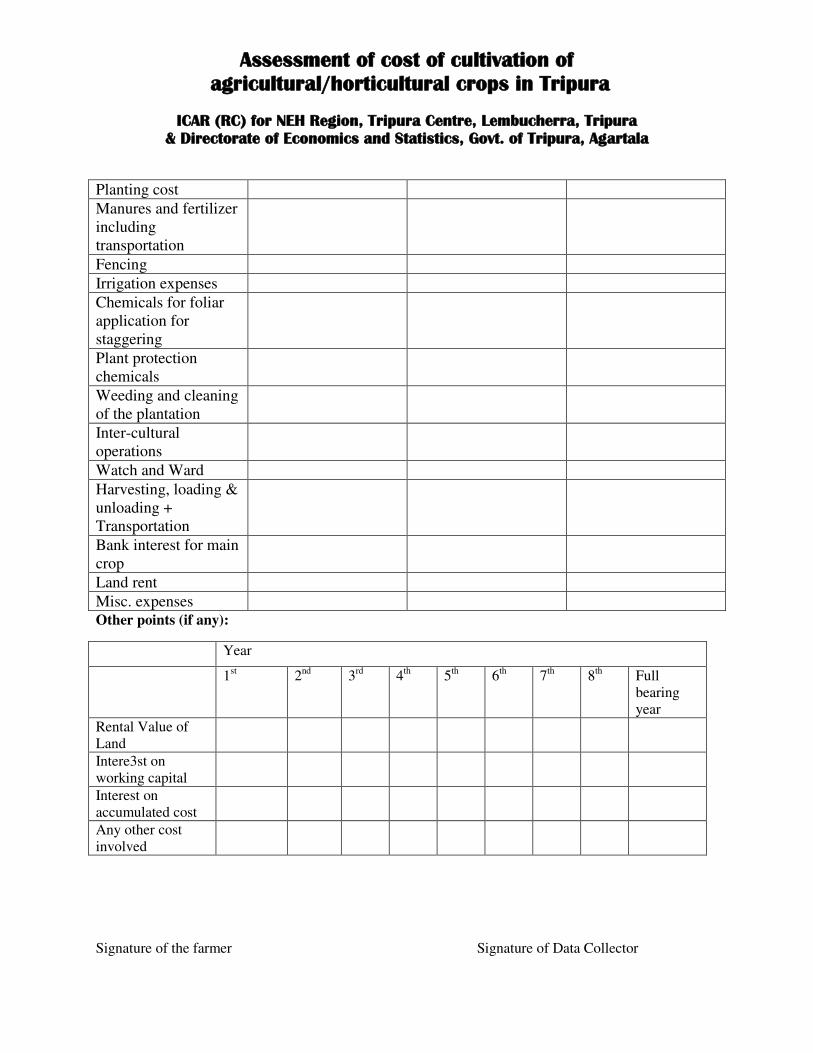
Assessment of cost of cultivation of
agricultural/horticultural crops in Tripura
ICAR (RC) for NEH Region, Tripura Centre, Lembucherra, Tripura
& Directorate of Economics and Statistics, Govt. of Tripura, Agartala
Planting cost
Manures and fertilizer
including
transportation
Fencing
Irrigation expenses
Chemicals for foliar
application for
staggering
Plant protection
chemicals
Weeding and cleaning
of the plantation
Inter-cultural
operations
Watch and Ward
Harvesting, loading &
unloading +
Transportation
Bank interest for main
crop
Land rent
Misc. expenses Other points (if any):
Year
1st 2
nd 3
rd 4
th 5
th 6
th 7
th 8
th Full
bearing
year
Rental Value of
Land
Intere3st on
working capital
Interest on
accumulated cost
Any other cost
involved
Signature of the farmer Signature of Data Collector

Assessment of cost of cultivation of
agricultural/horticultural crops in Tripura
ICAR (RC) for NEH Region, Tripura Centre, Lembucherra, Tripura
& Directorate of Economics and Statistics, Govt. of Tripura, Agartala
Papaya
District: _________________________________, Block__________________________
Vill.______________________
Name of the Farmer: ________________________________________________
S/o: ___________________________________________________________
Ph.:________________________
Total Area: _________________, Area under Papaya: __________________________
Variety of Papaya: 1.______________________, 2. _____________________, 3.
___________________
Year of Planting:
Age of plantation:
Other crops grown:
Crops Name of Crops Season Area
Field Crops
Vegetable crops
Fruit Crops
Farmer’s Category: Progressive/Non-Progressive
Technology adopted:
Details of operations Cost (Rs.)
Land preparation (Deep ploughing &
harrowing)
Digging of pits and pit filling
Planting material Seedlings
Planting cost
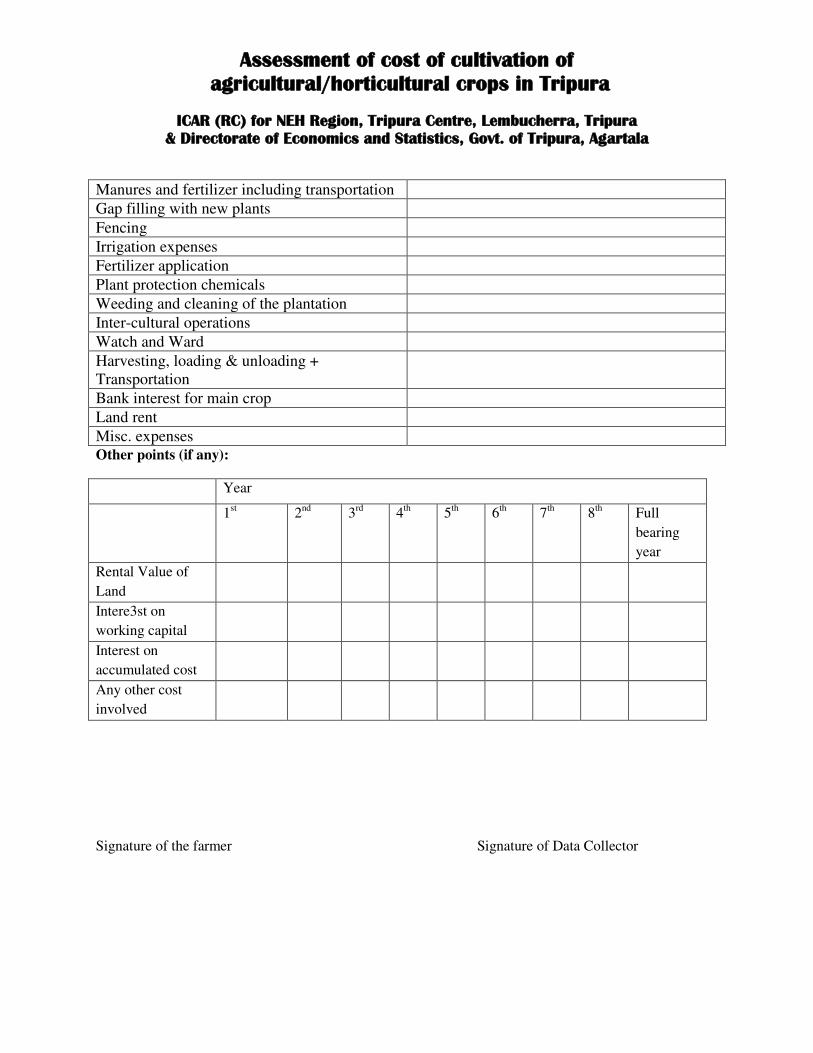
Assessment of cost of cultivation of
agricultural/horticultural crops in Tripura
ICAR (RC) for NEH Region, Tripura Centre, Lembucherra, Tripura
& Directorate of Economics and Statistics, Govt. of Tripura, Agartala
Manures and fertilizer including transportation
Gap filling with new plants
Fencing
Irrigation expenses
Fertilizer application
Plant protection chemicals
Weeding and cleaning of the plantation
Inter-cultural operations
Watch and Ward
Harvesting, loading & unloading +
Transportation
Bank interest for main crop
Land rent
Misc. expenses Other points (if any):
Year
1st 2
nd 3
rd 4
th 5
th 6
th 7
th 8
th Full
bearing
year
Rental Value of
Land
Intere3st on
working capital
Interest on
accumulated cost
Any other cost
involved
Signature of the farmer Signature of Data Collector
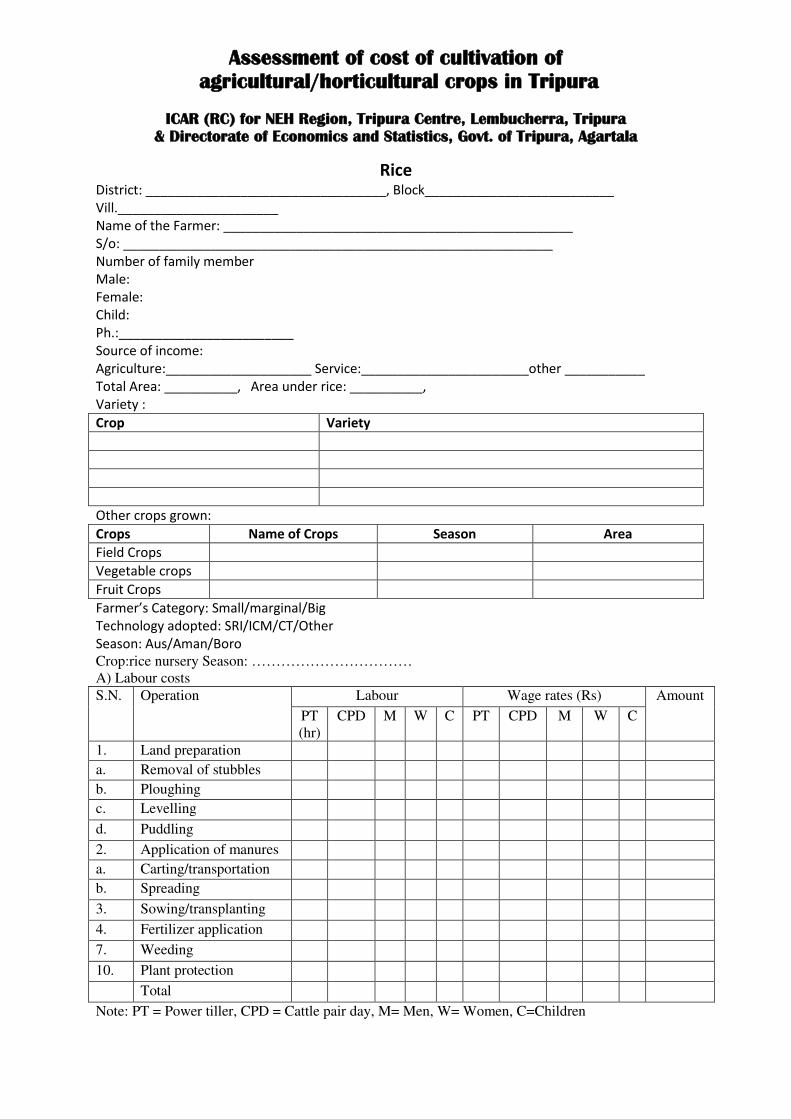
Assessment of cost of cultivation of
agricultural/horticultural crops in Tripura
ICAR (RC) for NEH Region, Tripura Centre, Lembucherra, Tripura
& Directorate of Economics and Statistics, Govt. of Tripura, Agartala
Rice District: _________________________________, Block__________________________
Vill.______________________
Name of the Farmer: ________________________________________________
S/o: ___________________________________________________________
Number of family member
Male:
Female:
Child:
Ph.:________________________
Source of income:
Agriculture:____________________ Service:_______________________other ___________
Total Area: __________, Area under rice: __________,
Variety :
Crop Variety
Other crops grown:
Crops Name of Crops Season Area
Field Crops
Vegetable crops
Fruit Crops
Farmer’s Category: Small/marginal/Big
Technology adopted: SRI/ICM/CT/Other
Season: Aus/Aman/Boro
Crop:rice nursery Season: ……………………………
A) Labour costs
S.N. Operation Labour Wage rates (Rs) Amount
PT
(hr)
CPD M W C PT CPD M W C
1. Land preparation
a. Removal of stubbles
b. Ploughing
c. Levelling
d. Puddling
2. Application of manures
a. Carting/transportation
b. Spreading
3. Sowing/transplanting
4. Fertilizer application
7. Weeding
10. Plant protection
Total
Note: PT = Power tiller, CPD = Cattle pair day, M= Men, W= Women, C=Children

Assessment of cost of cultivation of
agricultural/horticultural crops in Tripura
ICAR (RC) for NEH Region, Tripura Centre, Lembucherra, Tripura
& Directorate of Economics and Statistics, Govt. of Tripura, Agartala
(B) Material costs
S.N. Item Quantity
(kg)
Rate (Rs) Value (Rs)
1. Seed/planting materials
2. FYM/Compost/Vermicompost
3. Fertilizers
i. Urea
ii. SSP
iii. MOP
4. Plant protection chemicals
i. Fungicides
ii. Insecticides
Total
Total of A and B
Rice main crop
A) Labour costs
S.N. Operation Labour Wage rates Amount
(Rs) PT
(hr)
CPD M W C PT CPD M W C
1. Land preparation
a. Ploughing
b. Levelling
c. Puddling
2. Application of manures
a. Carting/transportation
b. Spreading
3. Transplanting
4. Fertilizer application
7. Weeding
10. Plant protection
11. Harvesting
12. Threshing and
winnowing
13. Bagging and
transportation
Others if any
Total
Nursery cost
Total
Note: PT = Power tiller, CPD = Cattle pair day, M= Men, W= Women, C=Children
(B) Material costs
S.N. Item Quantity Rate (Rs) Value (Rs)
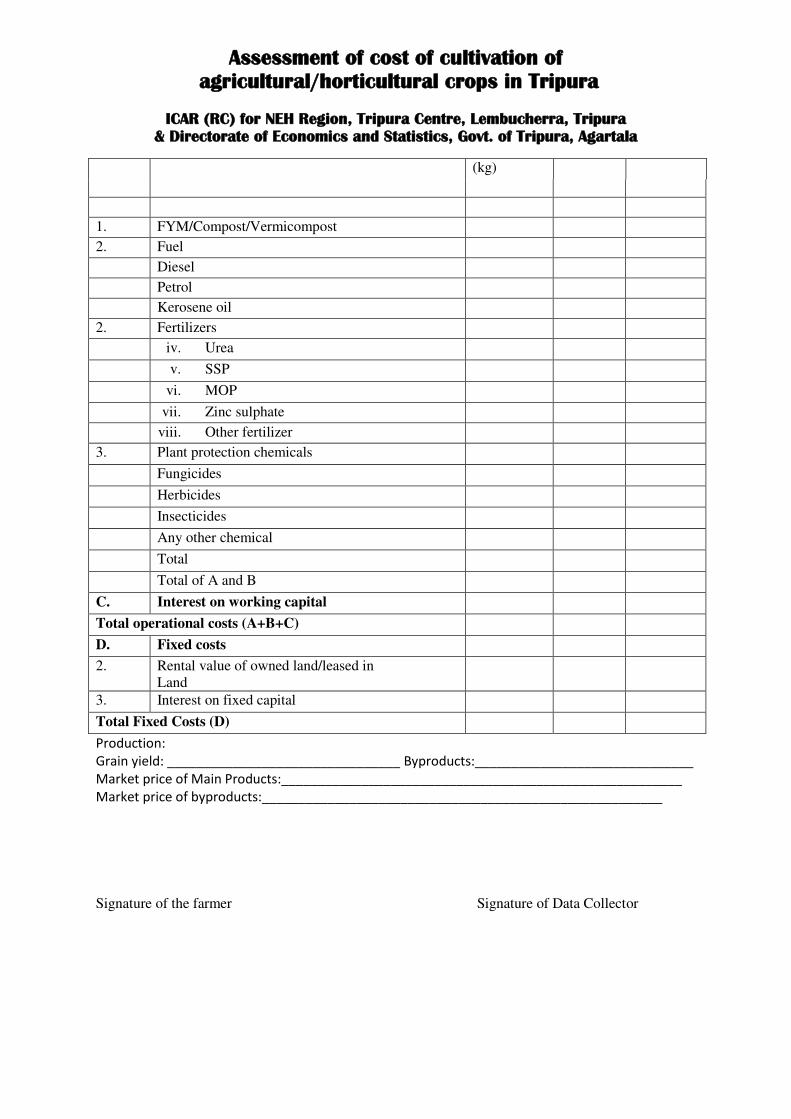
Assessment of cost of cultivation of
agricultural/horticultural crops in Tripura
ICAR (RC) for NEH Region, Tripura Centre, Lembucherra, Tripura
& Directorate of Economics and Statistics, Govt. of Tripura, Agartala
(kg)
1. FYM/Compost/Vermicompost
2. Fuel
Diesel
Petrol
Kerosene oil
2. Fertilizers
iv. Urea
v. SSP
vi. MOP
vii. Zinc sulphate
viii. Other fertilizer
3. Plant protection chemicals
Fungicides
Herbicides
Insecticides
Any other chemical
Total
Total of A and B
C. Interest on working capital
Total operational costs (A+B+C)
D. Fixed costs
2. Rental value of owned land/leased in
Land
3. Interest on fixed capital
Total Fixed Costs (D)
Production:
Grain yield: ________________________________ Byproducts:______________________________
Market price of Main Products:_______________________________________________________
Market price of byproducts:_______________________________________________________
Signature of the farmer Signature of Data Collector
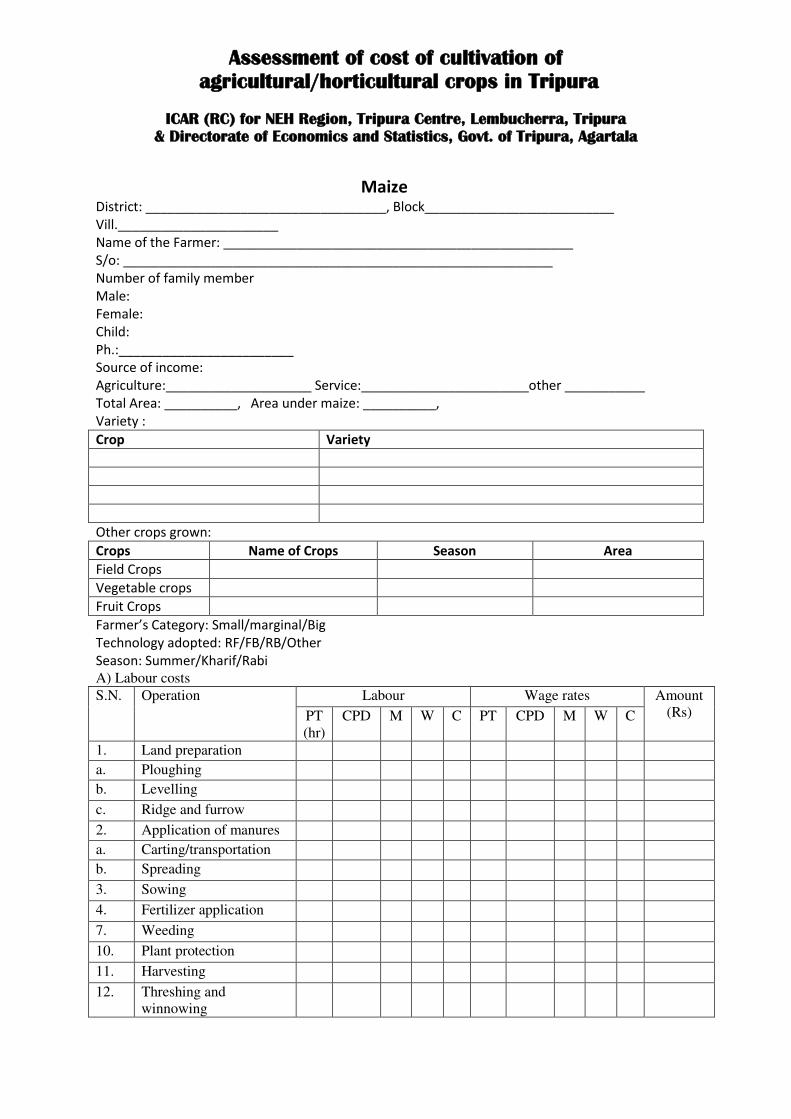
Assessment of cost of cultivation of
agricultural/horticultural crops in Tripura
ICAR (RC) for NEH Region, Tripura Centre, Lembucherra, Tripura
& Directorate of Economics and Statistics, Govt. of Tripura, Agartala
Maize
District: _________________________________, Block__________________________
Vill.______________________
Name of the Farmer: ________________________________________________
S/o: ___________________________________________________________
Number of family member
Male:
Female:
Child:
Ph.:________________________
Source of income:
Agriculture:____________________ Service:_______________________other ___________
Total Area: __________, Area under maize: __________,
Variety :
Crop Variety
Other crops grown:
Crops Name of Crops Season Area
Field Crops
Vegetable crops
Fruit Crops
Farmer’s Category: Small/marginal/Big
Technology adopted: RF/FB/RB/Other
Season: Summer/Kharif/Rabi
A) Labour costs
S.N. Operation Labour Wage rates Amount
(Rs) PT
(hr)
CPD M W C PT CPD M W C
1. Land preparation
a. Ploughing
b. Levelling
c. Ridge and furrow
2. Application of manures
a. Carting/transportation
b. Spreading
3. Sowing
4. Fertilizer application
7. Weeding
10. Plant protection
11. Harvesting
12. Threshing and
winnowing

Assessment of cost of cultivation of
agricultural/horticultural crops in Tripura
ICAR (RC) for NEH Region, Tripura Centre, Lembucherra, Tripura
& Directorate of Economics and Statistics, Govt. of Tripura, Agartala
13. Bagging and
transportation
Others if any
Total
Note: PT = Power tiller, CPD = Cattle pair day, M= Men, W= Women, C=Children
(B) Material costs
S.N. Item Quantity
(kg)
Rate (Rs) Value (Rs)
1. Seed/planting materials
2. FYM/Compost/Vermicompost
3. Fuel
Diesel
Petrol
Kerosene oil
4. Fertilizers
ix. Urea
x. SSP
xi. MOP
xii. Zinc sulphate
xiii. Other fertilizer
5. Plant protection chemicals
Fungicides
Herbicides
Insecticides
Any other chemical
Total
Total of A and B
C. Interest on working capital
Total operational costs (A+B+C)
D. Fixed costs
2. Rental value of owned land/leased in
Land
3. Interest on fixed capital
Total Fixed Costs (D)
Production:
Grain yield: ________________________________Byproducts :______________________________
Market price of Main Products:_______________________________________________________
Market price of byproducts:_______________________________________________________
Signature of the farmer Signature of Data Collector

Assessment of cost of cultivation of
agricultural/horticultural crops in Tripura
ICAR (RC) for NEH Region, Tripura Centre, Lembucherra, Tripura
& Directorate of Economics and Statistics, Govt. of Tripura, Agartala
Groundnut District: _________________________________, Block__________________________
Vill.______________________
Name of the Farmer: ________________________________________________
S/o: ___________________________________________________________
Number of family member
Male:
Female:
Child:
Ph.:________________________
Source of income:
Agriculture:____________________ Service:_______________________other ___________
Total Area: __________, Area under crop: __________,
Variety :
Crop Variety
Other crops grown:
Crops Name of Crops Season Area
Field Crops
Vegetable crops
Fruit Crops
Farmer’s Category: Small/marginal/Big
Technology adopted: RF/FB/RB/Other
Season: Summer/Kharif/Rabi
A) Labour costs
S.N. Operation Labour Wage rates Amount
(Rs) PT
(hr)
CPD M W C PT CPD M W C
1. Land preparation
a. Ploughing
b. Levelling
c. Ridge and furrow
2. Application of manures
a. Carting/transportation
b. Spreading
3. Sowing
4. Fertilizer application
7. Weeding
10. Plant protection
11. Harvesting
12. Threshing and

Assessment of cost of cultivation of
agricultural/horticultural crops in Tripura
ICAR (RC) for NEH Region, Tripura Centre, Lembucherra, Tripura
& Directorate of Economics and Statistics, Govt. of Tripura, Agartala
winnowing
13. Bagging and
transportation
Others if any
Total
Note: PT = Power tiller, CPD = Cattle pair day, M= Men, W= Women, C=Children
(B) Material costs
S.N. Item Quantity
(kg)
Rate (Rs) Value (Rs)
1. Seed/planting materials
2. FYM/Compost/Vermicompost
3. Fuel
Diesel
Petrol
Kerosene oil
4. Fertilizers
i. Urea
ii. SSP
iii. MOP
iv. Zinc sulphate
v. Other fertilizer
5. Plant protection chemicals
Fungicides
Herbicides
Insecticides
Any other chemical
Total
Total of A and B
C. Interest on working capital
Total operational costs (A+B+C)
D. Fixed costs
2. Rental value of owned land/leased in
Land
3. Interest on fixed capital
Total Fixed Costs (D)
Production:
Grain yield: ________________________________Byproducts :______________________________
Market price of Main Products:_______________________________________________________
Market price of byproducts:_______________________________________________________
Signature of the farmer Signature of Data Collector

Assessment of cost of cultivation of
agricultural/horticultural crops in Tripura
ICAR (RC) for NEH Region, Tripura Centre, Lembucherra, Tripura
& Directorate of Economics and Statistics, Govt. of Tripura, Agartala
Sesame District: _________________________________, Block__________________________
Vill.______________________
Name of the Farmer: ________________________________________________
S/o: ___________________________________________________________
Number of family member
Male:
Female:
Child:
Ph.:________________________
Source of income:
Agriculture:____________________ Service:_______________________other ___________
Total Area: __________, Area under crop: __________,
Variety :
Crop Variety
Other crops grown:
Crops Name of Crops Season Area
Field Crops
Vegetable crops
Fruit Crops
Farmer’s Category: Small/marginal/Big
Technology adopted: RF/FB/RB/Other
Season: Summer/Kharif/Rabi
A) Labour costs
S.N. Operation Labour Wage rates Amount
(Rs) PT
(hr)
CPD M W C PT CPD M W C
1. Land preparation
a. Ploughing
b. Levelling
c. Ridge and furrow
2. Application of manures
a. Carting/transportation
b. Spreading
3. Sowing
4. Fertilizer application
7. Weeding
10. Plant protection
11. Harvesting
12. Threshing and
winnowing
13. Bagging and

Assessment of cost of cultivation of
agricultural/horticultural crops in Tripura
ICAR (RC) for NEH Region, Tripura Centre, Lembucherra, Tripura
& Directorate of Economics and Statistics, Govt. of Tripura, Agartala
transportation
Others if any
Total
Note: PT = Power tiller, CPD = Cattle pair day, M= Men, W= Women, C=Children
(B) Material costs
S.N. Item Quantity
(kg)
Rate (Rs) Value (Rs)
1. Seed/planting materials
2. FYM/Compost/Vermicompost
3. Fuel
Diesel
Petrol
Kerosene oil
4. Fertilizers
i. Urea
ii. SSP
iii. MOP
iv. Zinc sulphate
v. Other fertilizer
5. Plant protection chemicals
Fungicides
Herbicides
Insecticides
Any other chemical
Total
Total of A and B
C. Interest on working capital
Total operational costs (A+B+C)
D. Fixed costs
2. Rental value of owned land/leased in
Land
3. Interest on fixed capital
Total Fixed Costs (D)
Production:
Grain yield: ________________________________Byproducts :______________________________
Market price of Main Products:_______________________________________________________
Market price of byproducts:_______________________________________________________
Signature of the farmer Signature of Data Collector

Assessment of cost of cultivation of
agricultural/horticultural crops in Tripura
ICAR (RC) for NEH Region, Tripura Centre, Lembucherra, Tripura
& Directorate of Economics and Statistics, Govt. of Tripura, Agartala
Mustard District: _________________________________, Block__________________________
Vill.______________________
Name of the Farmer: ________________________________________________
S/o: ___________________________________________________________
Number of family member
Male:
Female:
Child:
Ph.:________________________
Source of income:
Agriculture:____________________ Service:_______________________other ___________
Total Area: __________, Area under crop: __________,
Variety :
Crop Variety
Other crops grown:
Crops Name of Crops Season Area
Field Crops
Vegetable crops
Fruit Crops
Farmer’s Category: Small/marginal/Big
Technology adopted: RF/FB/RB/Other
Season: Rabi
A) Labour costs
S.N. Operation Labour Wage rates Amount
(Rs) PT
(hr)
CPD M W C PT CPD M W C
1. Land preparation
a. Ploughing
b. Levelling
c. Ridge and furrow
2. Application of manures
a. Carting/transportation
b. Spreading
3. Sowing
4. Fertilizer application
7. Weeding
10. Plant protection
11. Harvesting
12. Threshing and
winnowing
13. Bagging and

Assessment of cost of cultivation of
agricultural/horticultural crops in Tripura
ICAR (RC) for NEH Region, Tripura Centre, Lembucherra, Tripura
& Directorate of Economics and Statistics, Govt. of Tripura, Agartala
transportation
Others if any
Total
Note: PT = Power tiller, CPD = Cattle pair day, M= Men, W= Women, C=Children
(B) Material costs
S.N. Item Quantity
(kg)
Rate (Rs) Value (Rs)
1. Seed/planting materials
2. FYM/Compost/Vermicompost
3. Fuel
Diesel
Petrol
Kerosene oil
4. Fertilizers
i. Urea
ii. SSP
iii. MOP
iv. Zinc sulphate
v. Other fertilizer
5. Plant protection chemicals
Fungicides
Herbicides
Insecticides
Any other chemical
Total
Total of A and B
C. Interest on working capital
Total operational costs (A+B+C)
D. Fixed costs
2. Rental value of owned land/leased in
Land
3. Interest on fixed capital
Total Fixed Costs (D)
Production:
Grain yield: ________________________________Byproducts :______________________________
Market price of Main Products:_______________________________________________________
Market price of byproducts:_______________________________________________________
Signature of the farmer Signature of Data Collector
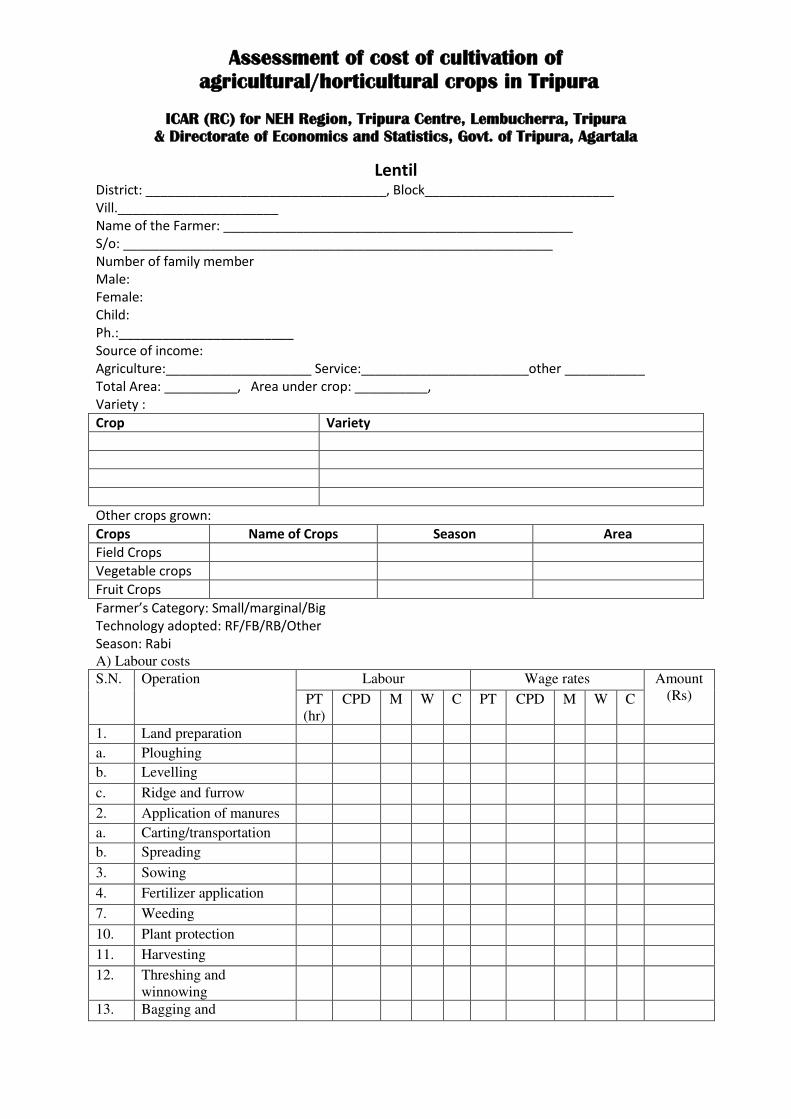
Assessment of cost of cultivation of
agricultural/horticultural crops in Tripura
ICAR (RC) for NEH Region, Tripura Centre, Lembucherra, Tripura
& Directorate of Economics and Statistics, Govt. of Tripura, Agartala
Lentil District: _________________________________, Block__________________________
Vill.______________________
Name of the Farmer: ________________________________________________
S/o: ___________________________________________________________
Number of family member
Male:
Female:
Child:
Ph.:________________________
Source of income:
Agriculture:____________________ Service:_______________________other ___________
Total Area: __________, Area under crop: __________,
Variety :
Crop Variety
Other crops grown:
Crops Name of Crops Season Area
Field Crops
Vegetable crops
Fruit Crops
Farmer’s Category: Small/marginal/Big
Technology adopted: RF/FB/RB/Other
Season: Rabi
A) Labour costs
S.N. Operation Labour Wage rates Amount
(Rs) PT
(hr)
CPD M W C PT CPD M W C
1. Land preparation
a. Ploughing
b. Levelling
c. Ridge and furrow
2. Application of manures
a. Carting/transportation
b. Spreading
3. Sowing
4. Fertilizer application
7. Weeding
10. Plant protection
11. Harvesting
12. Threshing and
winnowing
13. Bagging and

Assessment of cost of cultivation of
agricultural/horticultural crops in Tripura
ICAR (RC) for NEH Region, Tripura Centre, Lembucherra, Tripura
& Directorate of Economics and Statistics, Govt. of Tripura, Agartala
transportation
Others if any
Total
Note: PT = Power tiller, CPD = Cattle pair day, M= Men, W= Women, C=Children
(B) Material costs
S.N. Item Quantity
(kg)
Rate (Rs) Value (Rs)
1. Seed/planting materials
2. FYM/Compost/Vermicompost
3. Fuel
Diesel
Petrol
Kerosene oil
4. Fertilizers
i. Urea
ii. SSP
iii. MOP
iv. Zinc sulphate
v. Other fertilizer
5. Plant protection chemicals
Fungicides
Herbicides
Insecticides
Any other chemical
Total
Total of A and B
C. Interest on working capital
Total operational costs (A+B+C)
D. Fixed costs
2. Rental value of owned land/leased in
Land
3. Interest on fixed capital
Total Fixed Costs (D)
Production:
Grain yield: ________________________________Byproducts :______________________________
Market price of Main Products:_______________________________________________________
Market price of byproducts:_______________________________________________________
Signature of the farmer Signature of Data Collector

Assessment of cost of cultivation of
agricultural/horticultural crops in Tripura
ICAR (RC) for NEH Region, Tripura Centre, Lembucherra, Tripura
& Directorate of Economics and Statistics, Govt. of Tripura, Agartala
Potato District: _________________________________, Block__________________________
Vill.______________________
Name of the Farmer: ________________________________________________
S/o: ___________________________________________________________
Number of family member
Male:
Female:
Child:
Ph.:________________________
Source of income:
Agriculture:____________________ Service:_______________________other ___________
Total Area: __________, Area under crop: __________,
Variety :
Crop Variety
Other crops grown:
Crops Name of Crops Season Area
Field Crops
Vegetable crops
Fruit Crops
Farmer’s Category: Small/marginal/Big
Technology adopted: RF/FB/RB/Other
Season: Rabi
A) Labour costs
S.N. Operation Labour Wage rates Amount
(Rs) PT
(hr)
CPD M W C PT CPD M W C
1. Land preparation
a. Ploughing
b. Levelling
c. Ridge and furrow
2. Application of manures
a. Carting/transportation
b. Spreading
3. Sowing
4. Fertilizer application
7. Weeding
10. Plant protection
11. Harvesting
12. Threshing and
winnowing
13. Bagging and

Assessment of cost of cultivation of
agricultural/horticultural crops in Tripura
ICAR (RC) for NEH Region, Tripura Centre, Lembucherra, Tripura
& Directorate of Economics and Statistics, Govt. of Tripura, Agartala
transportation
Others if any
Total
Note: PT = Power tiller, CPD = Cattle pair day, M= Men, W= Women, C=Children
(B) Material costs
S.N. Item Quantity
(kg)
Rate (Rs) Value (Rs)
1. Seed/planting materials
2. FYM/Compost/Vermicompost
3. Fuel
Diesel
Petrol
Kerosene oil
4. Fertilizers
i. Urea
ii. SSP
iii. MOP
iv. Zinc sulphate
v. Other fertilizer
5. Plant protection chemicals
Fungicides
Herbicides
Insecticides
Any other chemical
Total
Total of A and B
C. Interest on working capital
Total operational costs (A+B+C)
D. Fixed costs
2. Rental value of owned land/leased in
Land
3. Interest on fixed capital
Total Fixed Costs (D)
Production:
Grain yield: ________________________________Byproducts :______________________________
Market price of Main Products:_______________________________________________________
Market price of byproducts:_______________________________________________________
Signature of the farmer Signature of Data Collector

Assessment of cost of cultivation of
agricultural/horticultural crops in Tripura
ICAR (RC) for NEH Region, Tripura Centre, Lembucherra, Tripura
& Directorate of Economics and Statistics, Govt. of Tripura, Agartala
Any other crop District: _________________________________, Block__________________________
Vill.______________________
Name of the Farmer: ________________________________________________
S/o: ___________________________________________________________
Number of family member
Male:
Female:
Child:
Ph.:________________________
Source of income:
Agriculture:____________________ Service:_______________________other ___________
Total Area: __________, Area under crop: __________,
Variety :
Crop Variety
Other crops grown:
Crops Name of Crops Season Area
Field Crops
Vegetable crops
Fruit Crops
Farmer’s Category: Small/marginal/Big
Technology adopted: RF/FB/RB/Other
Season: Rabi
A) Labour costs
S.N. Operation Labour Wage rates Amount
(Rs) PT
(hr)
CPD M W C PT CPD M W C
1. Land preparation
a. Ploughing
b. Levelling
c. Ridge and furrow
2. Application of manures
a. Carting/transportation
b. Spreading
3. Sowing
4. Fertilizer application
7. Weeding
10. Plant protection
11. Harvesting
12. Threshing and
winnowing
13. Bagging and
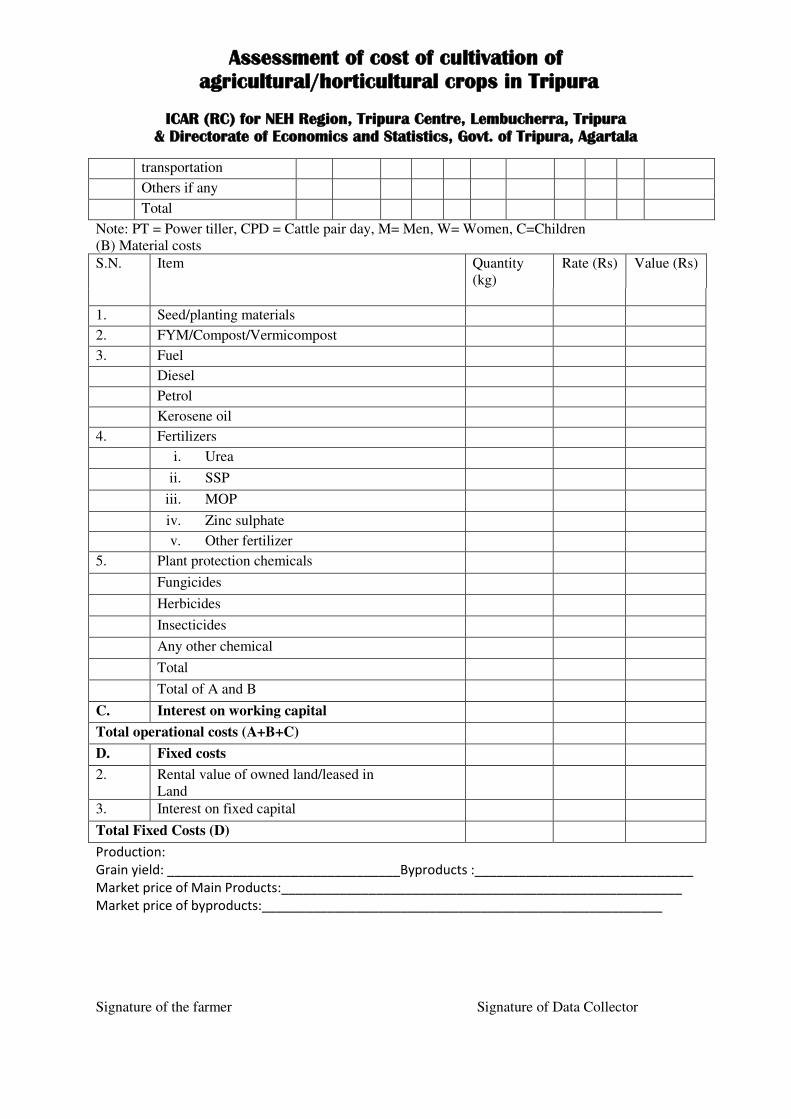
Assessment of cost of cultivation of
agricultural/horticultural crops in Tripura
ICAR (RC) for NEH Region, Tripura Centre, Lembucherra, Tripura
& Directorate of Economics and Statistics, Govt. of Tripura, Agartala
transportation
Others if any
Total
Note: PT = Power tiller, CPD = Cattle pair day, M= Men, W= Women, C=Children
(B) Material costs
S.N. Item Quantity
(kg)
Rate (Rs) Value (Rs)
1. Seed/planting materials
2. FYM/Compost/Vermicompost
3. Fuel
Diesel
Petrol
Kerosene oil
4. Fertilizers
i. Urea
ii. SSP
iii. MOP
iv. Zinc sulphate
v. Other fertilizer
5. Plant protection chemicals
Fungicides
Herbicides
Insecticides
Any other chemical
Total
Total of A and B
C. Interest on working capital
Total operational costs (A+B+C)
D. Fixed costs
2. Rental value of owned land/leased in
Land
3. Interest on fixed capital
Total Fixed Costs (D)
Production:
Grain yield: ________________________________Byproducts :______________________________
Market price of Main Products:_______________________________________________________
Market price of byproducts:_______________________________________________________
Signature of the farmer Signature of Data Collector