assessment of carbon capture and sequestration: an investigation on algae …€¦ · ·...
TRANSCRIPT

Abstract—Current challenges on CO2 emissions and
climate change require cost-effective techniques for carbon
capture and sequestration. The aim of this study was to
investigate algae growth under controlled environmental
conditions for CO2 sequestration. An algae strain from a
local lake was used in this study and inoculation tests were
performed at 22, 32 and 38oC. The highest algae growth was
observed around 22oC.
Index Terms—Carbon Capture, Algae, Sequestration.
I. INTRODUCTION
ARBON dioxide emissions and global warming are
among the major challenges that the world has ever
been confronted with. Chemical and mechanical
industries are the major contributors of carbon dioxide
emissions due to their dependence on carbon sources
such as coal, oil, natural gas for fulfillment of energy
requirements. According to a report by Carbon Dioxide
Information Analysis Center (CDIAC), CO2 emissions
have increased from 3 metric tonnes in 1751 to 8230
metric tonnes in 2006. It was estimated that CO2 reached
390 ppmv in 2010 in the atmosphere relative to 280
ppmv in 1958 [1]. This clearly indicates a rise in the
concentration of CO2. Therefore, this environmental
crisis presents a need for reduction of the concentration
of CO2 gas into the atmosphere. Capturing, transporting
Manuscript received July 4, 2016; revised August 10, 2016. This
work was supported in part by the National Research Foundation
(NRF)-THRIP and the Faculty of Engineering and the Built
Environment at the University of Johannesburg.
J. Chauke is with the Department of Chemical Engineering,
University of Johannesburg, South Africa (e-mail:
L. Ndleve is with the Department of Chemical Engineering,
University of Johannesburg, South Africa (e-mail: lndleve@dual-
h.com).
C. Griffiths is with Holland & Hausberger, Wild Fig Business Park,
1494 Cranberry Street, Honeydew, 2170, Randburg, South Africa (e-
mail: [email protected]).
B. Hausberger is with Holland & Hausberger, Wild Fig Business
Park, 1494 Cranberry Street, Honeydew, 2170, Randburg, South Africa
(e-mail: [email protected]).
K. Jalama is the Department of Chemical Engineering, University of
Johannesburg, South Africa (corresponding author, e-mail:
[email protected], phone: +27-11-559-6157).
and storing of carbon dioxide require a physical means
which is rather expensive. Bio-capture and sequestration
are cost effective and most attractive options due to the
fact that they are cheap and flexible relative to the other
methods [2].
These techniques are broadly divided into physical and
biological means. The latter involves algae organisms to
sequestrate CO2. The use of algae organisms comes with
several advantages.
Algae have been reported to have an ability to fix CO2
ten times greater than any terrestrial plants [1]. Kumar et
al. [2] have reported that 1 kg of algal dry cells is capable
of fixing 1.83 kg of CO2 which, on an annually scale is
around 54.9 – 67.7 tonnes of carbon dioxide that can
sequestrated by just 30 – 37 tonnes of algae.
Subsequently, the resultant biomass of the algae can be
used for production of biofuels and other commercial and
scientific important products such as bio-filters, food
products and water quality purposes. There are
enormous groups of algae species which have different
characteristics altogether. Generally, algae have a wide
range of habitat such as fresh water, marine water, in-
deep oceans and rocky shores. The primary factors that
influence the growth of algae directly or indirectly
include sunlight, concentration of CO2, pH, agitation and
salinity [1]. Cultivation of algae through biological
means involves two types of systems either open or
closed. One of the shortcomings of the open system is the
lack of the ability to control parameters such as
availability of light, agitation, pH, temperature and
nutrient concentrations. Another drawback is that there is
very low residence time of sparged gas in the culture
which gives a limited time for algal biomass to sequester
CO2. Open systems are also susceptible to contamination
which reduces the biomass productivity and its uses for
the production of commercially important products.
Thus, this makes open system least viable system to
sequester CO2.Whereas, in a closed system the degree of
control is very high and it is possible to control the
crucial parameters that influences the grow rate of the
culture [1].
This study aims at investigating the optimum conditions
to sequestrate CO2 using algae organisms in a semi-
isolated bioreactor.
Assessment of Carbon Capture and
Sequestration: An Investigation on Algae
Growth Rate under controlled Environmental
Conditions
Jeffrey Chauke, Lunghile Ndleve, Craig Griffiths, Brendon Hausberger, Kalala Jalama
C
Proceedings of the World Congress on Engineering and Computer Science 2016 Vol II WCECS 2016, October 19-21, 2016, San Francisco, USA
ISBN: 978-988-14048-2-4 ISSN: 2078-0958 (Print); ISSN: 2078-0966 (Online)
WCECS 2016
II. EXPERIMENTAL DETAILS
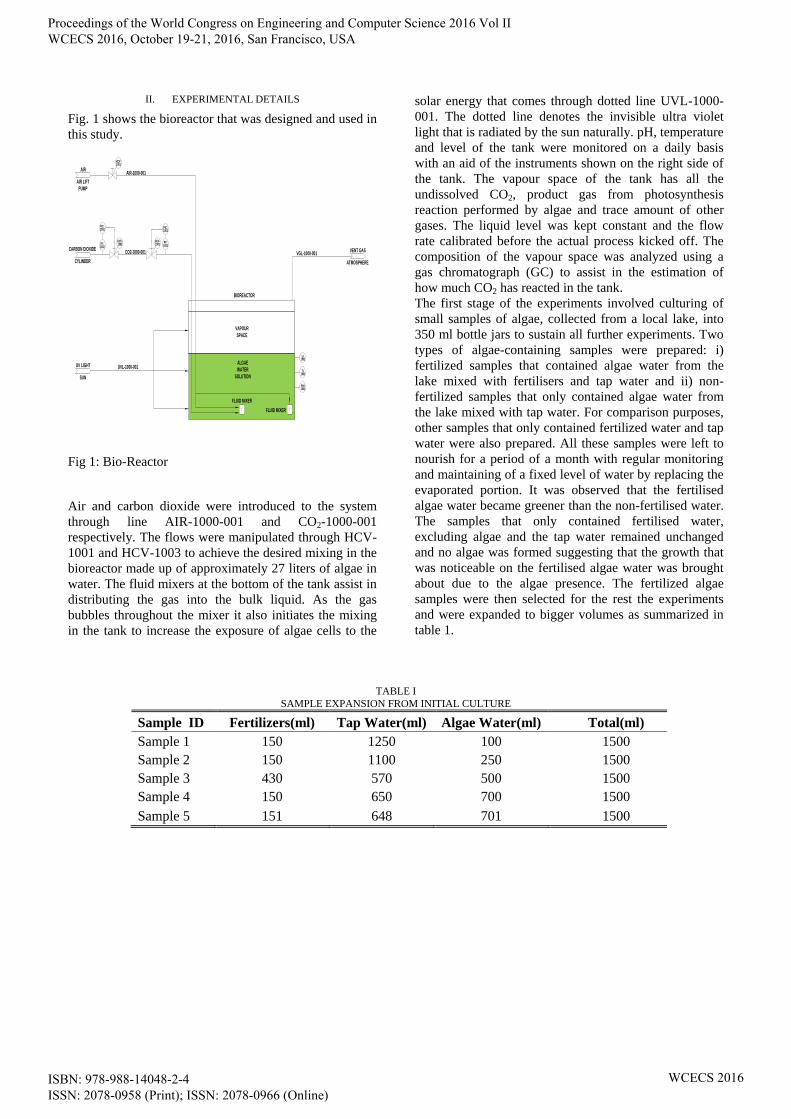
Fig. 1 shows the bioreactor that was designed and used in
this study.
TI-1001
PHI-1001
LI-1001
AIR
AIR LIFT
PUMP
CARBON DIOXIDE
CYLINDER
AIR-1000-001
VGL-1000-001VENT GAS
ATMOSPHERE
UV LIGHT
SUN
UVL-1000-001
FLUID MIXER
FLUID MIXER
ALGAE
WATER
SOLUTION
BIOREACTOR
VAPOUR
SPACE
CO2-1000-001
PIC-1003
PT-1002
PIC-1002
HCV-1002
HCV-1003 PT-
1003
HCV-1001
Fig 1: Bio-Reactor
Air and carbon dioxide were introduced to the system
through line AIR-1000-001 and CO2-1000-001
respectively. The flows were manipulated through HCV-
1001 and HCV-1003 to achieve the desired mixing in the
bioreactor made up of approximately 27 liters of algae in
water. The fluid mixers at the bottom of the tank assist in
distributing the gas into the bulk liquid. As the gas
bubbles throughout the mixer it also initiates the mixing
in the tank to increase the exposure of algae cells to the
solar energy that comes through dotted line UVL-1000-
001. The dotted line denotes the invisible ultra violet
light that is radiated by the sun naturally. pH, temperature
and level of the tank were monitored on a daily basis
with an aid of the instruments shown on the right side of
the tank. The vapour space of the tank has all the
undissolved CO2, product gas from photosynthesis
reaction performed by algae and trace amount of other
gases. The liquid level was kept constant and the flow
rate calibrated before the actual process kicked off. The
composition of the vapour space was analyzed using a
gas chromatograph (GC) to assist in the estimation of
how much CO2 has reacted in the tank.
The first stage of the experiments involved culturing of
small samples of algae, collected from a local lake, into
350 ml bottle jars to sustain all further experiments. Two
types of algae-containing samples were prepared: i)
fertilized samples that contained algae water from the
lake mixed with fertilisers and tap water and ii) non-
fertilized samples that only contained algae water from
the lake mixed with tap water. For comparison purposes,
other samples that only contained fertilized water and tap
water were also prepared. All these samples were left to
nourish for a period of a month with regular monitoring
and maintaining of a fixed level of water by replacing the
evaporated portion. It was observed that the fertilised
algae water became greener than the non-fertilised water.
The samples that only contained fertilised water,
excluding algae and the tap water remained unchanged
and no algae was formed suggesting that the growth that
was noticeable on the fertilised algae water was brought
about due to the algae presence. The fertilized algae
samples were then selected for the rest the experiments
and were expanded to bigger volumes as summarized in
table 1.
TABLE I
SAMPLE EXPANSION FROM INITIAL CULTURE
Sample ID Fertilizers(ml) Tap Water(ml) Algae Water(ml) Total(ml)
Sample 1 150 1250 100 1500
Sample 2 150 1100 250 1500
Sample 3 430 570 500 1500
Sample 4 150 650 700 1500
Sample 5 151 648 701 1500
Proceedings of the World Congress on Engineering and Computer Science 2016 Vol II WCECS 2016, October 19-21, 2016, San Francisco, USA
ISBN: 978-988-14048-2-4 ISSN: 2078-0958 (Print); ISSN: 2078-0966 (Online)
WCECS 2016

Additionally these samples were further grown for a
period of a month and later used for inoculations
purposes.
Inoculation involved selecting and injecting the greener
sample into the bioreactor with sterilized water to make a
total volume of 27 litres. The rate of CO2 (0.856 l/min.)
and air (1.583l/min.), and the quantity of fertilizer (3086
ml) added to the bioreactor were the same for each
experiment but the following average temperatures were
selected: 22, 32, 38 and 40°C. The rate of algae growth
was determined by monitoring the change in mass
content of the algae in the bioreactor by water
evaporation of small samples taken from the reacting
mixture at different time intervals.
III. RESULTS AND DISCUSSION
A. Initial culture growth
The expanded samples listed in table 1 responded
differently. Sample 1 and 2 growth rates were slow while
those for samples 3, 4 and 5 were significantly fast for
the first two weeks. However, after this period samples 1
and 2 caught up with the rest of the samples and a peak in
growth rate was reached. This was likely caused by the
density effect of the culture in the volume. Below the
optimum cell concentration, not all the light energy is
caught by the cells whereas at above the optimum cell
concentration, a larger proportion of the cell are in the
dark due to self-shading and this was observed on sample
5. Sample 1 which had the least cells concentration was
able catch up to the other samples which relatively had
high cell concentration. High density of the cells
improves the tolerance of carbon dioxide [3] and as a
result, it can be expected that the denser the culture the
better the sequestration. However, it is not effective to
cultivate with denser algae cells due to the self-shading
effect which reduces the productivity.
B. Inoculation
Figure 2 represents two identical inoculations at a mean
temperature of 22°C for 164 hours. The first run (1a)
used sample 2 (table 1) and showed a linear algae growth
with the time-on-stream (TOS). At the end of the
experiments a growth 0.014 g of algae per ml was
recorded. Sample 5 was used to repeat run 1 (run 1b) and
also showed a linear algae growth with TOS.
Fig 2: Inoculation 1 (mean temperature 22C)
The experiments conducted at 32 and 38°C also showed
algae growth with TOS as summarized in table 2.
TABLE II
OVERALL RESULTS OBTAINED THROUGHOUT THE EXPERIMENTS
Run identity
Average temperature [oC]
Stock sample identity* 2 5 1 3 4 2
Inoculated mass [g] 0.53 2.07 10.05 2.38 4.82 7.55
105 x Inoculated density [galgae/ml] 2 7 32 8 16 24
105 x Intermediate growth [galgae/ml] 730 248 430 342 628 84
105 x End of run growth [galgae/ml] 1458 489 828 676 1240 144
End of run growth factor** 858 74 27 89 79 7
1 2 3
22 (uncontrolled) 32 38
*: summarized in table 1
**: calculated as
lg
lglg
a
aa
MInitial
MFinalMInitial
Proceedings of the World Congress on Engineering and Computer Science 2016 Vol II WCECS 2016, October 19-21, 2016, San Francisco, USA
ISBN: 978-988-14048-2-4 ISSN: 2078-0958 (Print); ISSN: 2078-0966 (Online)
WCECS 2016
Samples 1 and 3 were used for the run at 32°C. The initial
algae concentration for sample 1 was measured to be
0.000324 g algae/ml. The intermediate growth, over a
period 80 hours, was 0.0043 g algae/ml and the final total
growth at the end (after 160 hours) of the run was 0.00828 g
algae/ml. Sample 3 with an initial algae concentration of
0.00000767 g algae/ml, had an intermediate growth of
0.00342 g algae/ml and total growth of 0.00676 g algae/ml.
The run at 38oC used samples 2 and 4.These data suggest
that that this strain is mesophilic (16-45°C).
The pH of the system was monitored during each
experiment and the texture of the algae solution was used to
develop a judgement on the growth and as a result of CO2
sequestration. An average pH of 7.5 was observed
throughout the inoculations and suggested dissociation of
CO2 compound in the solution. Optimum conditions for
sequestration of CO2 were observed for run 1 (with sample
2) which gave the highest algae growth factor.
IV. CONCLUSION
Carbon dioxide sequestration using microalgae was
investigated in a semi-isolated bio-reactor. The temperature
tested ranged from 22°C to 38°C where the other parameters
were kept constant. All the runs demonstrated positive
growth of algae which confirms the hypothesis that presence
of carbon dioxide, light, water and nutrients availability
enhances photosynthesis of algae cells.
The highest algae growth was observed for inoculation run
which was subjected to uncontrolled temperature of 22°C.
References
[1] A. Dahiya, 2015. Chapter 14 - Algae Biomass
Cultivation for Advanced Biofuel Production. In: A.
DAHIYA, ed, Bioenergy. Boston: Academic Press, pp.
219-238.
[2] K. Kumar, C.N. Dasgupta, B. Nayak, P. Lindblad, D.
Das, 2011. Development of suitable photobioreactors
for CO2 sequestration addressing global warming
using green algae and cyanobacteria. Bioresource
technology, 102(8), pp. 4945-4953.
[3] L. Xin, H. Hong-Ying, G. Ke, S. Ying-Xue, 2010.
Effects of different nitrogen and phosphorus
concentrations on the growth, nutrient uptake, and
lipid accumulation of a freshwater microalga
Scenedesmus sp. Bio-resource technology, 101(14),
pp. 5494-5500.
Proceedings of the World Congress on Engineering and Computer Science 2016 Vol II WCECS 2016, October 19-21, 2016, San Francisco, USA
ISBN: 978-988-14048-2-4 ISSN: 2078-0958 (Print); ISSN: 2078-0966 (Online)
WCECS 2016