assessment and monitoring of the san pedro creek flood control project matthew graul arnie thompson...
TRANSCRIPT
Assessment and Monitoring of theSan Pedro Creek Flood Control
Project
Matthew Graul Arnie Thompson
Wilson Yee Tim Brink
Purpose
The purpose of this study was to extend the monitoring and assessment activities done by previous students and facilitate the collection of baseline data for the system.
Why do this study?
• Objective of the Flood Control Project was to restore channel shape and improve flood capacity of the creek
• Area provides critical habitat for two threatened and endangered species
• Newly planted restoration site (2 yrs old)
• Provide data to guide management practices and future restoration
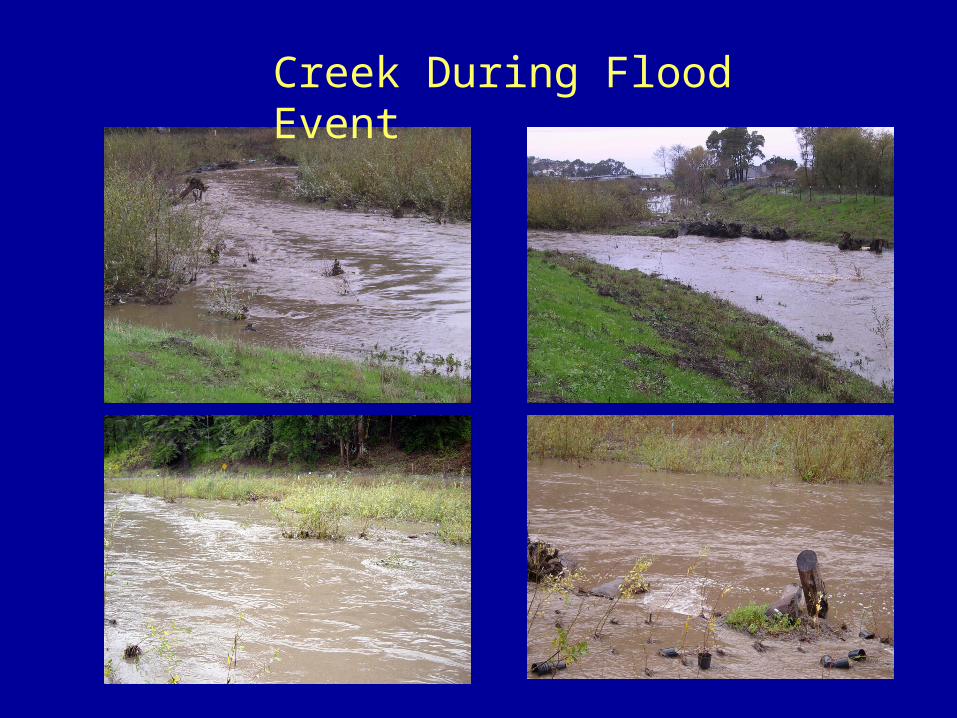
Creek During Flood Event

Location of Study Area
• Southern most section of Pacifica, CA –Approx. 10mi. from San Francisco
• East of Hwy.1 bridge over San Pedro Creek
• Bordered by the – Lind Mar residential district to the N and E– San Pedro and Montarra Mountains to S– Pacific Ocean to the W
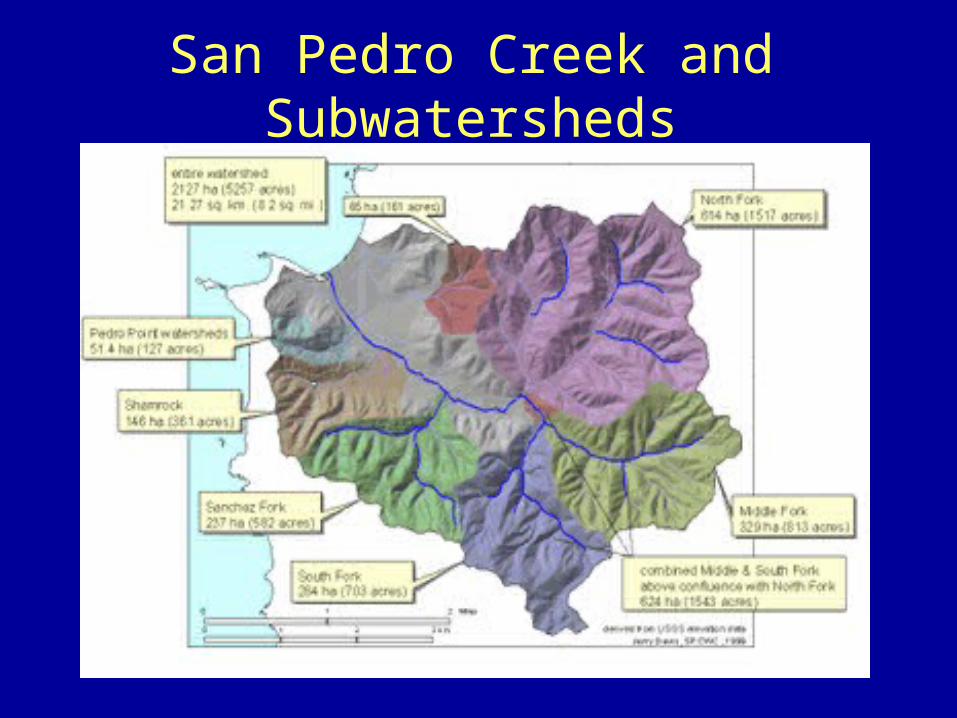
San Pedro Creek and Subwatersheds

Study Area
View From the West

Overview of Project
• Site assessment (1 day)
• Cross Sections (4 days)
• Planimetric Map (1 day)
• Water Quality (1 day)
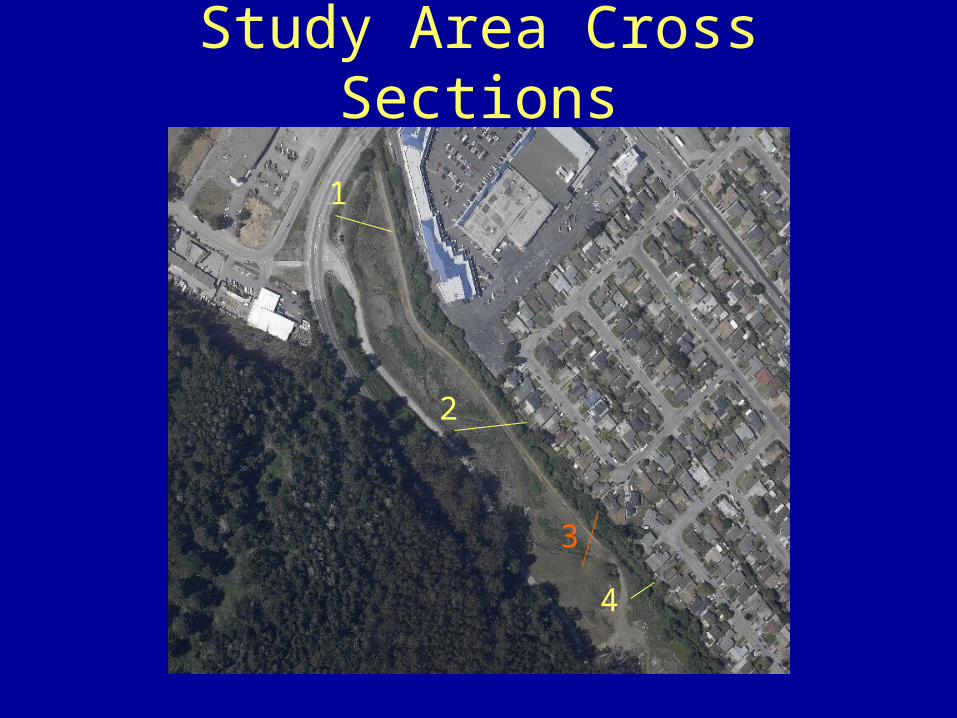
Study Area Cross Sections
1
2
3
4
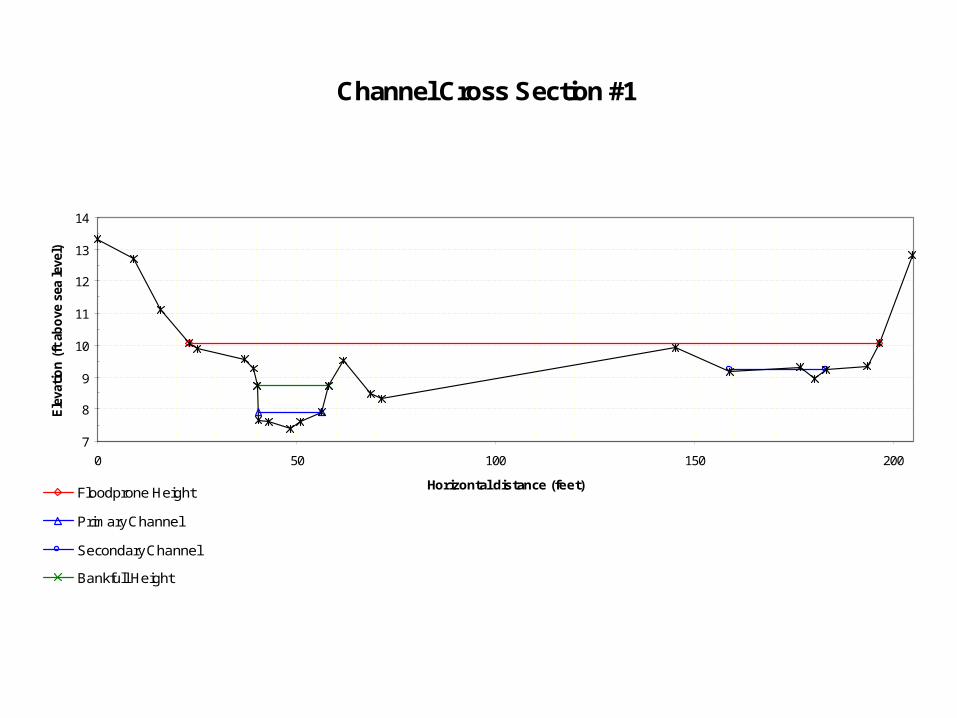
Channel Cross Section #1
7
8
9
10
11
12
13
14
0 50 100 150 200
Horizontal distance (feet)
Ele
vati
on
(ft
ab
ove
sea
leve
l)
Floodprone Height
Primary Channel
Secondary Channel
Bankfull Height
Cross Section #1
• 204.6 feet in length
• Left bank is approx. 110 M SE of bridge
• Two stream sections – main channel & secondary channel
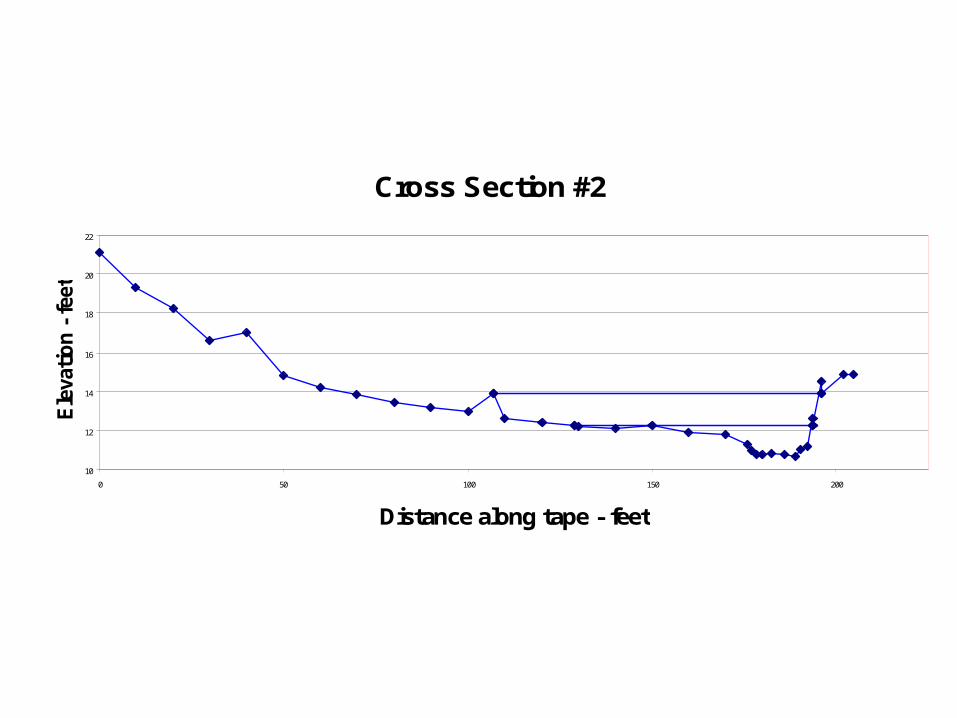
Cross Section #2
10
12
14
16
18
20
22
0 50 100 150 200
Distance along tape - feet
Ele
vati
on
- f
eet

Cross Section #2
• 204.7 feet in length
• Starts approx. 300M SE of cross section #1
• Two thalwegs, almost equal depth
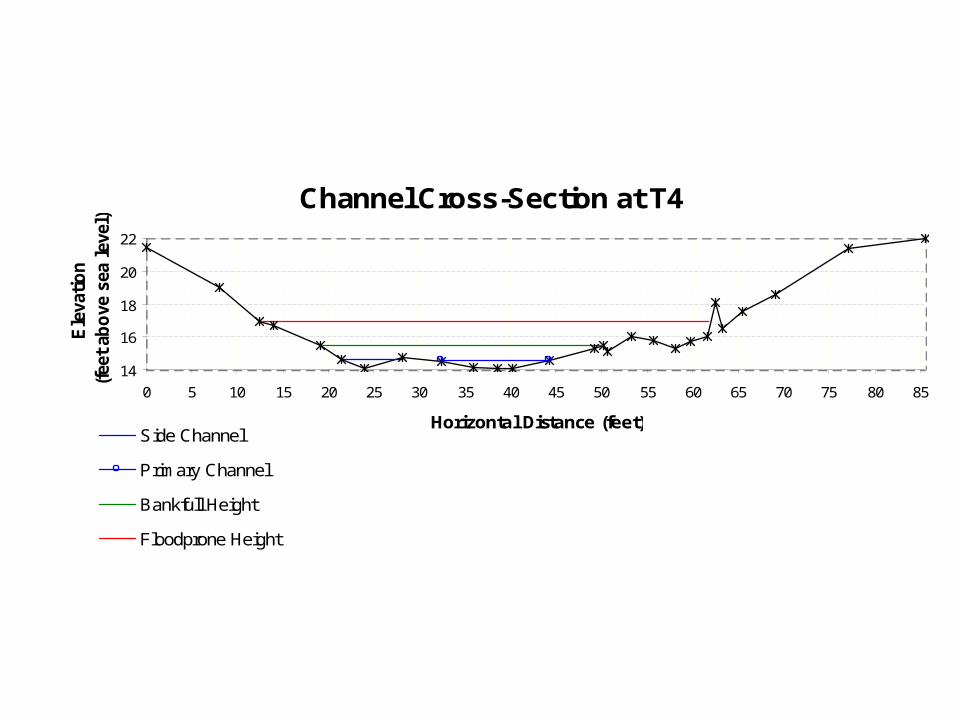
Channel Cross-Section at T4
14
16
18
20
22
0 5 10 15 20 25 30 35 40 45 50 55 60 65 70 75 80 85
Horizontal Distance (feet)
Ele
vati
on
(fe
et a
bo
ve s
ea l
evel
)
Side Channel
Primary Channel
Bankfull Height
Floodprone Height
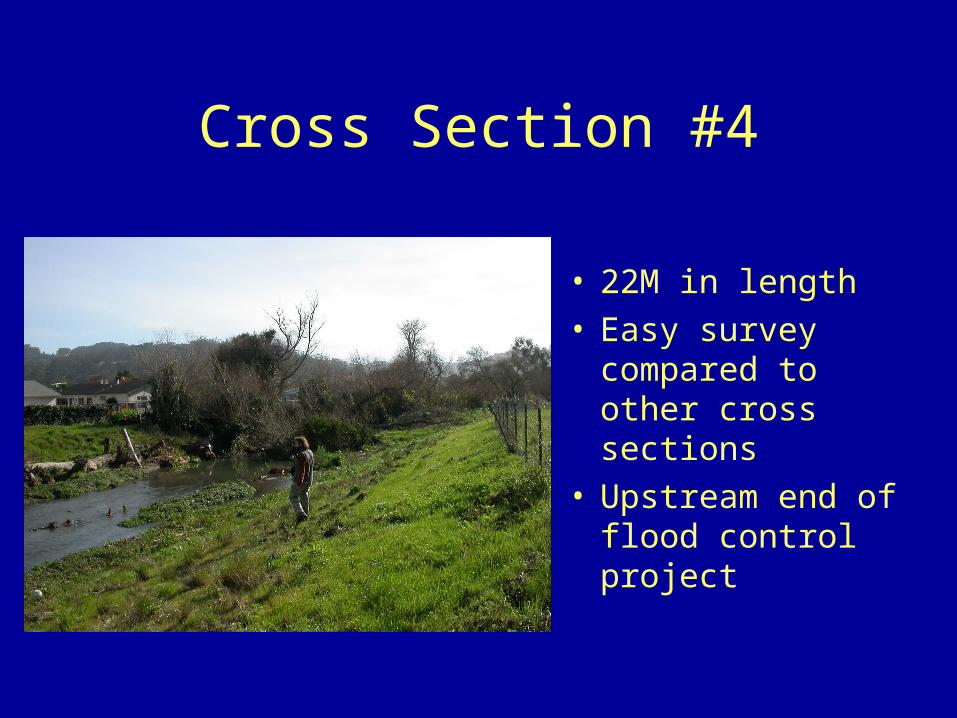
Cross Section #4
• 22M in length• Easy survey
compared to other cross sections
• Upstream end of flood control project
San Pedro Creek Flood Control Project
Plan View
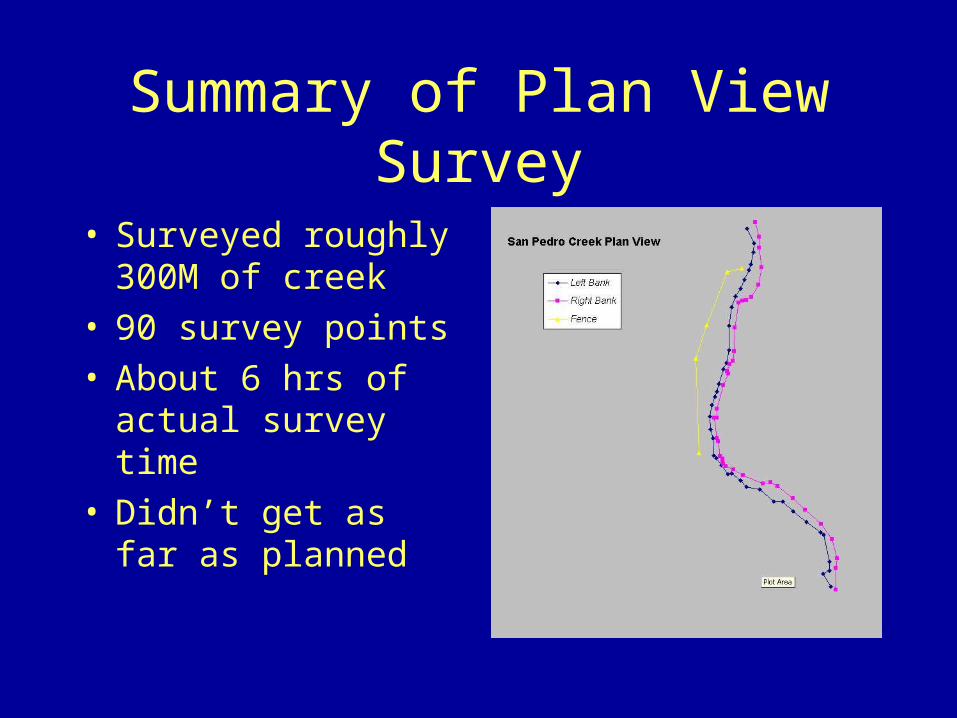
Summary of Plan View Survey
• Surveyed roughly 300M of creek
• 90 survey points• About 6 hrs of actual
survey time• Didn’t get as far as
planned
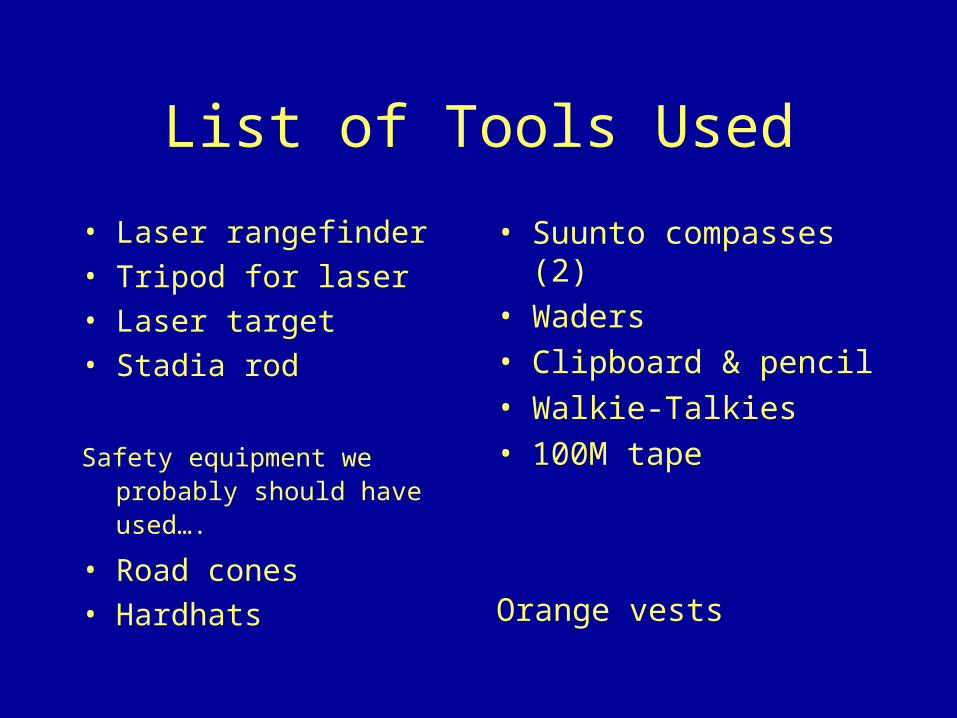
List of Tools Used
• Laser rangefinder
• Tripod for laser
• Laser target
• Stadia rod
Safety equipment we probably should have used….
• Road cones
• Hardhats
• Suunto compasses (2)
• Waders
• Clipboard & pencil
• Walkie-Talkies
• 100M tape
Orange vests
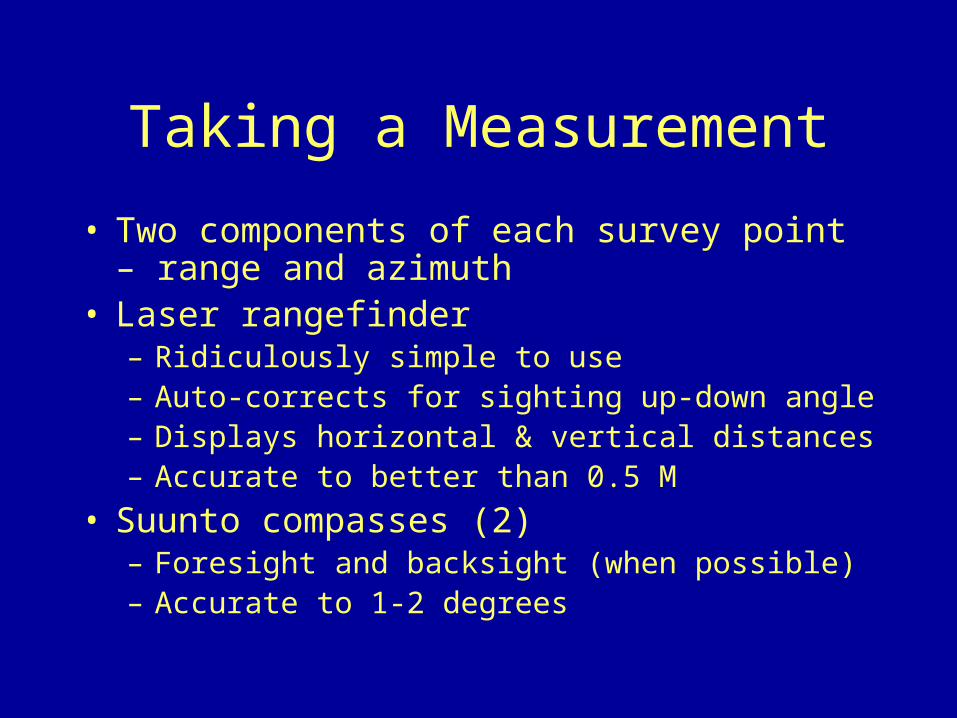
Taking a Measurement
• Two components of each survey point – range and azimuth
• Laser rangefinder– Ridiculously simple to use– Auto-corrects for sighting up-down angle– Displays horizontal & vertical distances– Accurate to better than 0.5 M
• Suunto compasses (2)– Foresight and backsight (when possible)– Accurate to 1-2 degrees
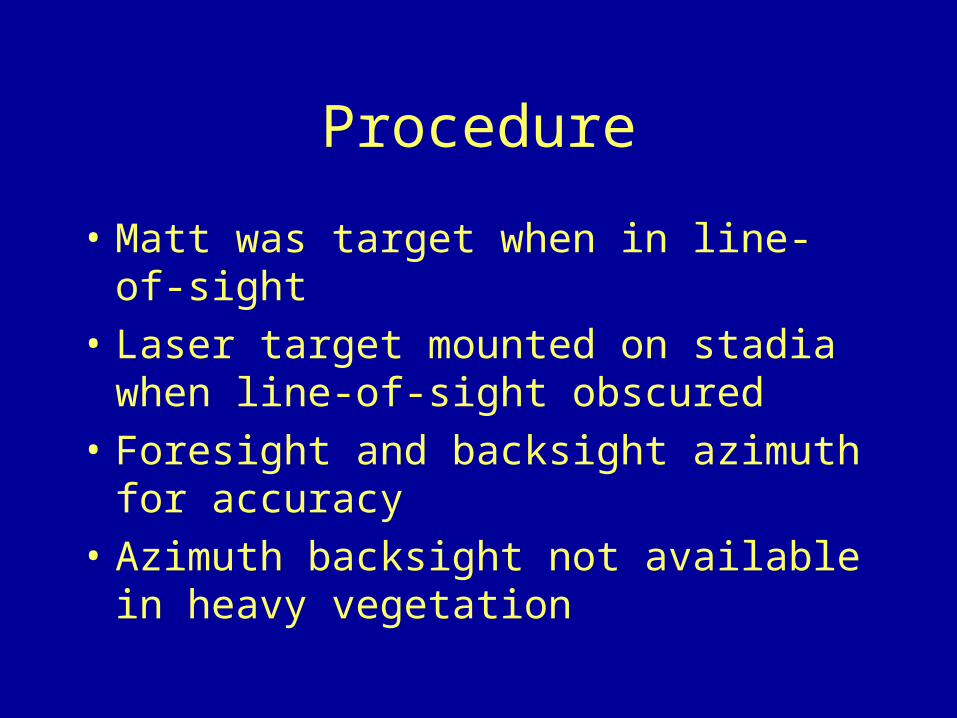
Procedure
• Matt was target when in line-of-sight
• Laser target mounted on stadia when line-of-sight obscured
• Foresight and backsight azimuth for accuracy
• Azimuth backsight not available in heavy vegetation
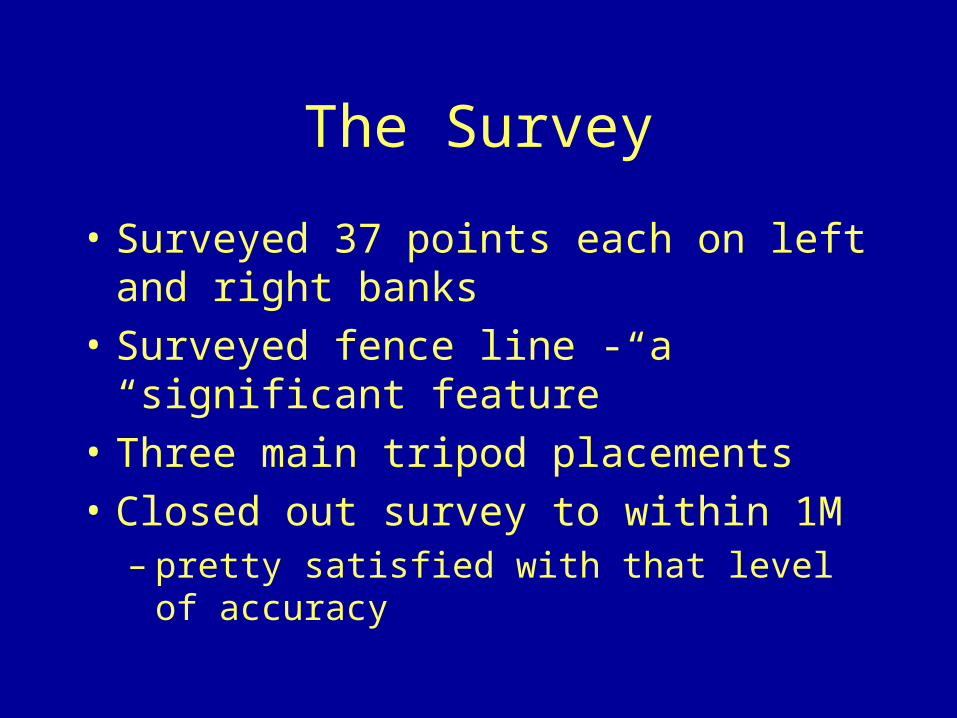
The Survey
• Surveyed 37 points each on left and right banks
• Surveyed fence line - a “significant feature”
• Three main tripod placements
• Closed out survey to within 1M– pretty satisfied with that level of accuracy
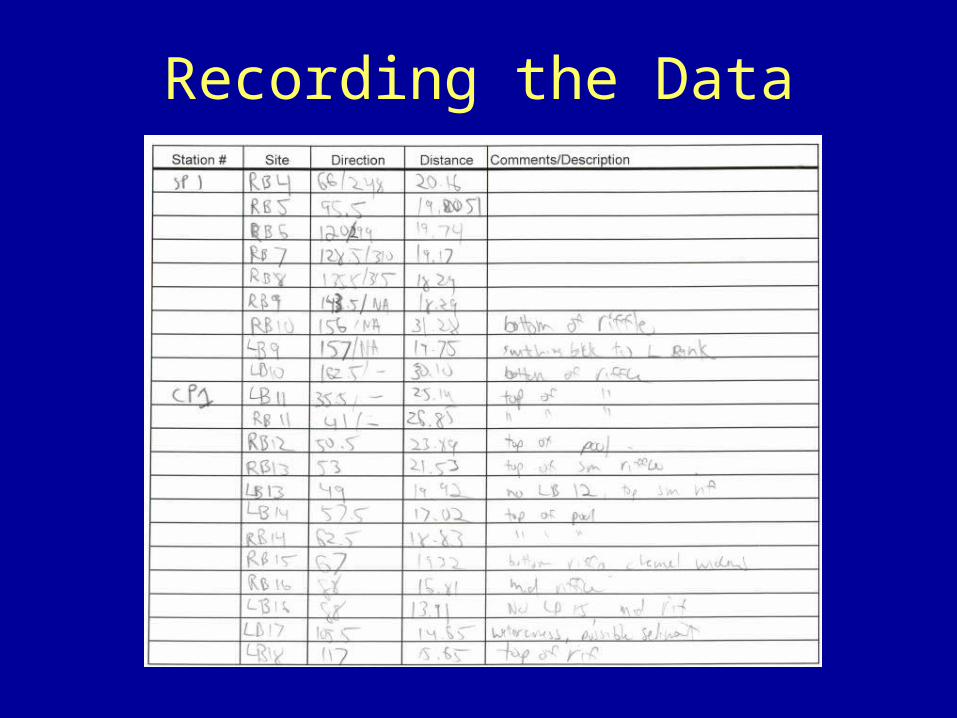
Recording the Data
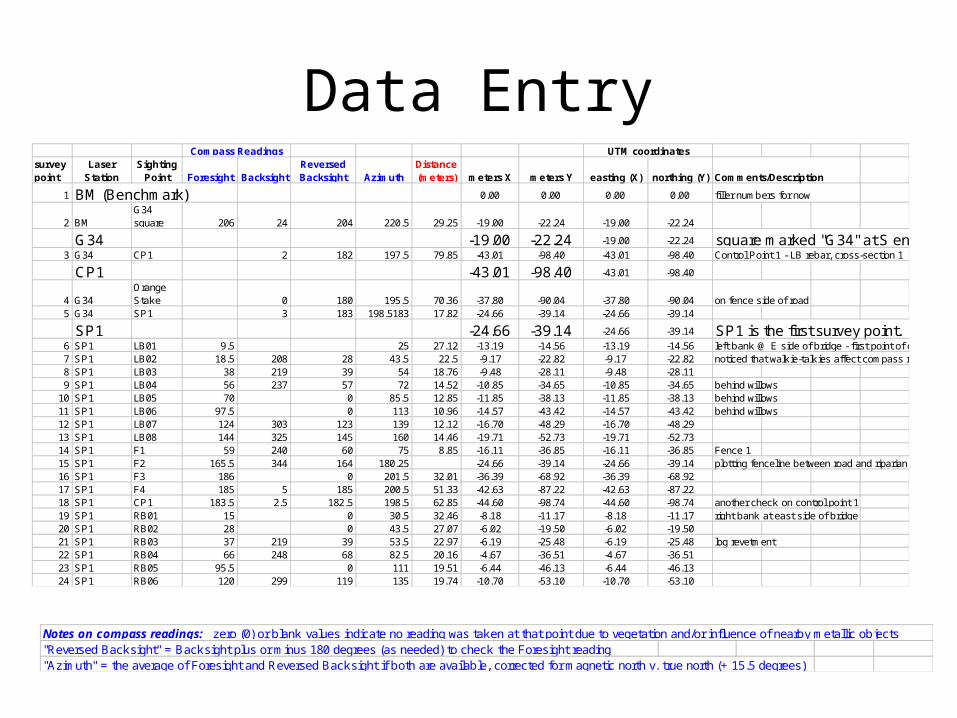
Data Entrysurvey point
Laser Station
Sighting Point Foresight Backsight
Reversed Backsight Azimuth
Distance (meters) meters X meters Y easting (X) northing (Y) Comments/Description
1 BM (Benchmark) 0.00 0.00 0.00 0.00 filler numbers for now
2 BMG34 square 206 24 204 220.5 29.25 -19.00 -22.24 -19.00 -22.24
G34 -19.00 -22.24 -19.00 -22.24 square marked "G34" at S end of the bridge on E side3 G34 CP1 2 182 197.5 79.85 -43.01 -98.40 -43.01 -98.40 Control Point 1 - LB rebar, cross-section 1
CP1 -43.01 -98.40 -43.01 -98.40
4 G34Orange Stake 0 180 195.5 70.36 -37.80 -90.04 -37.80 -90.04 on fence side of road
5 G34 SP1 3 183 198.5183 17.82 -24.66 -39.14 -24.66 -39.14
SP1 -24.66 -39.14 -24.66 -39.14 SP1 is the first survey point. Can't do it from bridge due to metal affecting compass readings6 SP1 LB01 9.5 25 27.12 -13.19 -14.56 -13.19 -14.56 left bank @ E side of bridge - first point of creek survey7 SP1 LB02 18.5 208 28 43.5 22.5 -9.17 -22.82 -9.17 -22.82 noticed that walk ie-talk ies affect compass reading - put them down!8 SP1 LB03 38 219 39 54 18.76 -9.48 -28.11 -9.48 -28.119 SP1 LB04 56 237 57 72 14.52 -10.85 -34.65 -10.85 -34.65 behind willows
10 SP1 LB05 70 0 85.5 12.85 -11.85 -38.13 -11.85 -38.13 behind willows11 SP1 LB06 97.5 0 113 10.96 -14.57 -43.42 -14.57 -43.42 behind willows12 SP1 LB07 124 303 123 139 12.12 -16.70 -48.29 -16.70 -48.2913 SP1 LB08 144 325 145 160 14.46 -19.71 -52.73 -19.71 -52.7314 SP1 F1 59 240 60 75 8.85 -16.11 -36.85 -16.11 -36.85 Fence 115 SP1 F2 165.5 344 164 180.25 -24.66 -39.14 -24.66 -39.14 plotting fenceline between road and riparian zone16 SP1 F3 186 0 201.5 32.01 -36.39 -68.92 -36.39 -68.9217 SP1 F4 185 5 185 200.5 51.33 -42.63 -87.22 -42.63 -87.2218 SP1 CP1 183.5 2.5 182.5 198.5 62.85 -44.60 -98.74 -44.60 -98.74 another check on control point 119 SP1 RB01 15 0 30.5 32.46 -8.18 -11.17 -8.18 -11.17 right bank at east side of bridge20 SP1 RB02 28 0 43.5 27.07 -6.02 -19.50 -6.02 -19.5021 SP1 RB03 37 219 39 53.5 22.97 -6.19 -25.48 -6.19 -25.48 log revetment22 SP1 RB04 66 248 68 82.5 20.16 -4.67 -36.51 -4.67 -36.5123 SP1 RB05 95.5 0 111 19.51 -6.44 -46.13 -6.44 -46.1324 SP1 RB06 120 299 119 135 19.74 -10.70 -53.10 -10.70 -53.10
Compass Readings UTM coordinates
Notes on compass readings: zero (0) or blank values indicate no reading was taken at that point due to vegetation and/or influence of nearby metallic objects"Reversed Backsight" = Backsight plus or minus 180 degrees (as needed) to check the Foresight reading"Azimuth" = the average of Foresight and Reversed Backsight if both are available, corrected for magnetic north v. true north (+ 15.5 degrees)
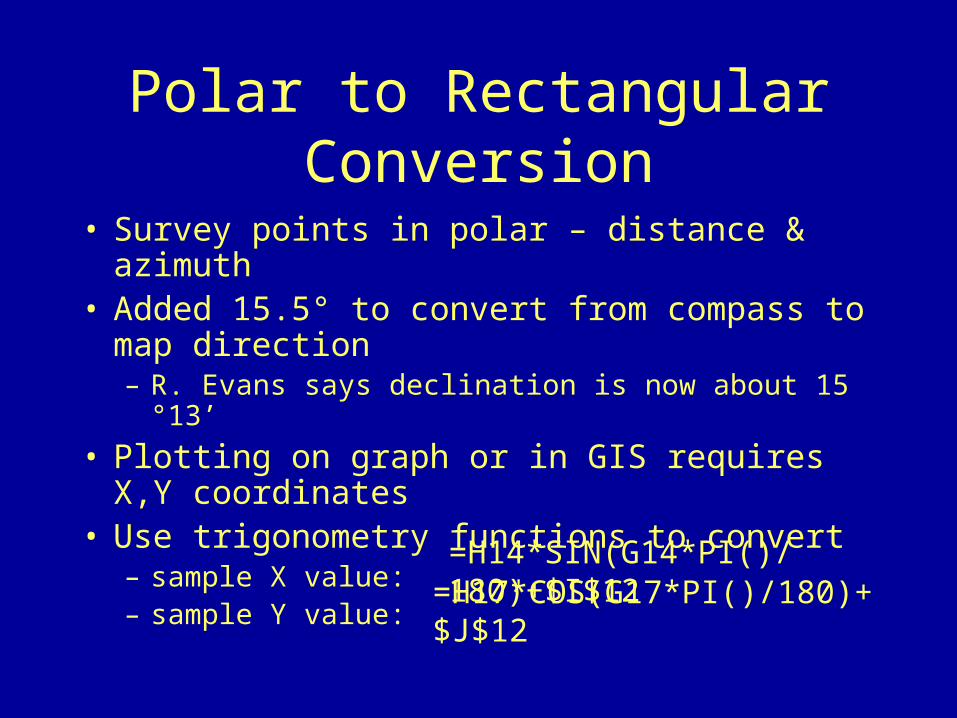
Polar to Rectangular Conversion
• Survey points in polar – distance & azimuth• Added 15.5° to convert from compass to map
direction– R. Evans says declination is now about 15 °13’
• Plotting on graph or in GIS requires X,Y coordinates
• Use trigonometry functions to convert– sample X value:– sample Y value:
=H14*SIN(G14*PI()/180)+$I$12=H17*COS(G17*PI()/180)+$J$12

Graphing Survey Results
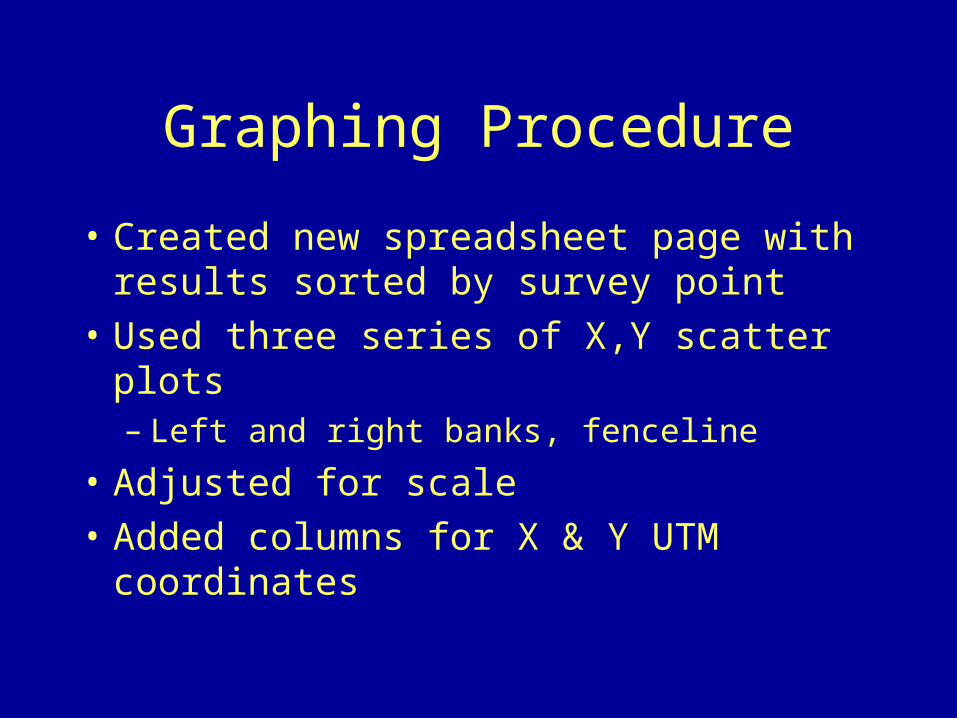
Graphing Procedure
• Created new spreadsheet page with results sorted by survey point
• Used three series of X,Y scatter plots– Left and right banks, fenceline
• Adjusted for scale
• Added columns for X & Y UTM coordinates

Fieldwork Challenges
• Riparian vegetation
• Metallic objects affect compass readings
• Ditto walkie-talkies
• Laser bounced off vegetation
• Couldn’t see squat from original benchmark
• Survey took longer than expected– Points too close together?

Graphing Challenges
• Excel trig functions wanted inputs as radians, not degrees– Initial X,Y plot made no sense at all– When all else fails, RTFM
• First pass at plotting stream course didn’t match up with aerial photo– Plot was eXaggerated: X > Y
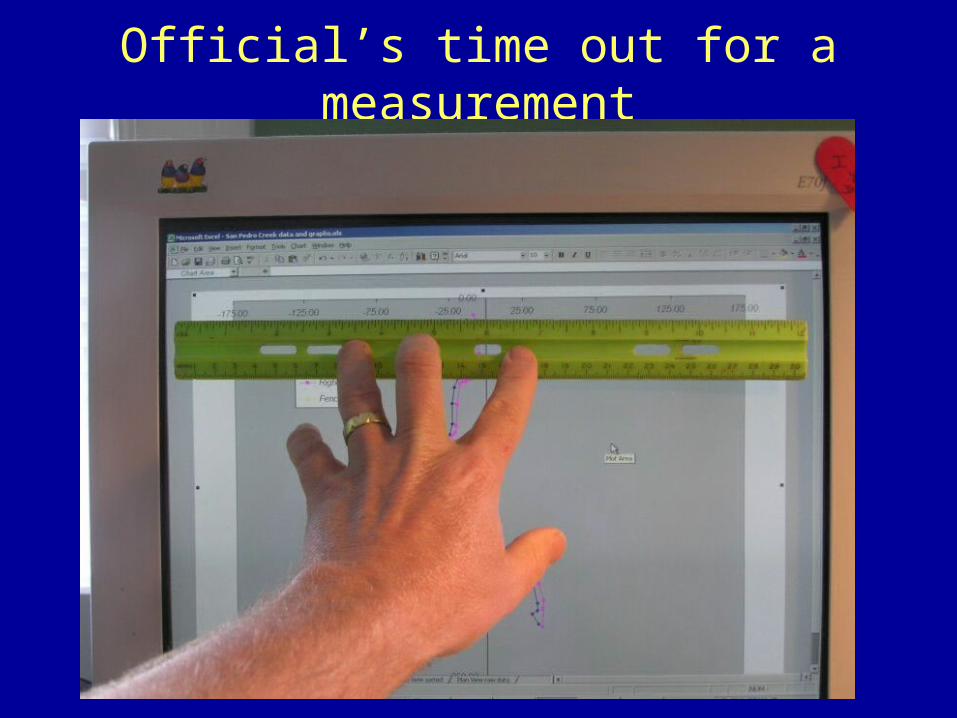
Official’s time out for a measurement

Extensions
• Data should be used for continued monitoring of the site
• Conduct longitudinal profile of flood control system
• Finish Planimetric mapping– Map braided sections, ponds, depressions
• Study should be repeated quarterly or biannually to assess changes in system