assessing translucent flows in the murrumbidgee - … · river, environmental flows would need to...
TRANSCRIPT
Assessing translucent environmental water releases in the Murrumbidgee River below Burrinjuck Dam, 1999-2002
Report 3. Effect of translucent releases on biofilms and periphyton in the Murrumbidgee River
Published by the NSW Department of Primary Industries, Office of Water
Assessing translucent environmental water releases in the Murrumbidgee River below Burrinjuck Dam, 1999-2002; Report 3, Effect of Translucent Releases on Periphyton Communities in the Murrumbidgee Catchment
First published July 2014
ISBN 978 1 74256
More information
Lorraine Hardwick, Ben Wolfenden, David Ryan, Bruce Chessman, Doug Westhorpe, Simon Mitrovic
www.dpi.nsw.gov.au
Acknowledgments
Lee Bowling, Simon Williams
Alpine River, Kosciusko National Park, photo by Lorraine Hardwick JTN 12772
© State of New South Wales through the Department of Trade and Investment, Regional Infrastructure and Services, 2014. You may copy, distribute and otherwise freely deal with this publication for any purpose, provided that you attribute the NSW Department of Primary Industries as the owner.
Disclaimer: The information contained in this publication is based on knowledge and understanding at the time of writing (July 2014). However, because of advances in knowledge, users are reminded of the need to ensure that information upon which they rely is up to date and to check currency of the information with the appropriate officer of the Department of Primary Industries or the user’s independent adviser.

Assessing translucent environmental water releases in the Murrumbidgee River below Burrinjuck Dam, 1999-2002
i NSW Office of Water, July 2014
Contents Summary .................................................................................................................................... 1
Acknowledgements ..................................................................................................................... 1
Introduction ................................................................................................................................. 2
Returning flow variability to the Murrumbidgee River ............................................................... 3
Study Objectives...................................................................................................................... 4
Methods ...................................................................................................................................... 5
Study area ............................................................................................................................... 5
Monitoring design .................................................................................................................... 9
Field sampling ......................................................................................................................... 9
Sample processing ................................................................................................................ 10
Data analysis ......................................................................................................................... 10
Results ...................................................................................................................................... 13
Hydrological changes caused by water sharing rules ............................................................ 13
Biofilm responses to regulation .............................................................................................. 17
Periphyton community data ................................................................................................ 17
Periphyton Chlorophyll A .................................................................................................... 23
Biofilm organic mass .......................................................................................................... 23
Biofilm inorganic mass ....................................................................................................... 24
Biofilm Inorganic:organic mass ratio ................................................................................... 25
Biofilm periphyton relationship with flow and water quality ..................................................... 27
Periphyton community response ........................................................................................ 27
Periphyton metrics – antecedent flow ................................................................................. 27
Periphyton community composition – antecedent flow ....................................................... 28
Periphyton community composition - water quality ............................................................. 28
Discussion ................................................................................................................................ 31
Considerations for future environmental monitoring ............................................................... 34
Considerations for re-evaluating the Murrumbidgee Water Sharing Plan ............................... 35
References ............................................................................................................................... 37
Appendix A, Hydrological indicators .......................................................................................... 42
Appendix B, Summary data and additional analyses ................................................................. 45

Assessing translucent environmental water releases in the Murrumbidgee River below Burrinjuck Dam, 1999-2002
ii NSW Office of Water, July 2014
Table of Figures Figure 1. Sampling sites . .................................................................................................................. 6
Figure 2. River discharge in the Murrumbidgee. ............................................................................. 6
Figure 3. Total Monthly Flow (ML) as a Proportion of Mean Annual Flow .................................... 7
Figure 4. a) Photos of rivers. ............................................................................................................. 7
Figure 5. Mean daily flow (MLd-1) ...................................................................................................... 8
Figure 6. Releases from Burrinjuck Dam, 1999 during the study.. ............................................... 14
Figure 7. Releases from Burrinjuck Dam, 2000 during the study.. ............................................... 14
Figure 8. Releases from Burrinjuck Dam, 2001. ............................................................................. 14
Figure 9: Mean daily flows in the four rivers before and during translucent flows. ................... 16
Figure 10. Mean periphyton abundance (for each sampling occasion ....................................... 18
Figure 11. Periphyton genus richness for each sampling occasion ............................................ 18
Figure 12. Non-metric MDS of periphyton samples.. ..................................................................... 20
Figure 13. Percentage composition of periphyton......................................................................... 21
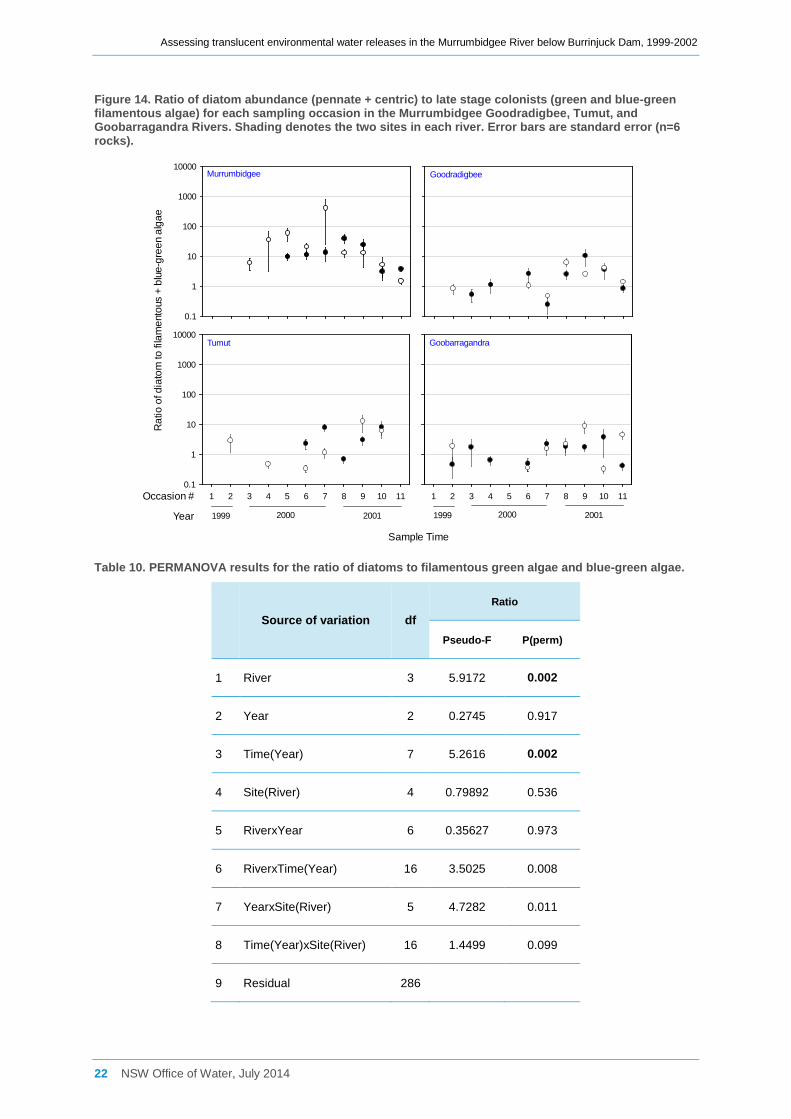
Figure 14. Ratio of diatom abundance to late stage colonists for each sampling occasion..... 22
Figure 15. Mean mass of chlorophyll-a (mg m-2) for each sampling occasion ........................... 23
Figure 16. Mean organic mass (mg m-2) for each sampling occasion ......................................... 25
Figure 17. Mean inorganic mass (mg m-2) for each sampling occasion. ..................................... 26
Figure 18. Mean inorganic:organic mass ratio for each sampling occasion ............................. 26

Assessing translucent environmental water releases in the Murrumbidgee River below Burrinjuck Dam, 1999-2002
iii NSW Office of Water, July 2014
Table of Tables Table 1. Sampling occasions ............................................................................................................. 9
Table 2: PERMANOVA design used for this study. ........................................................................ 11
Table 3. Hydrological variables selected for examining periphyton relationships with flow. ... 12
Table 4. Translucent Releases 1999-2001 ....................................................................................... 13
Table 5. Environmental Water Allowance (EWA) and Translucency as a Percentage of Annual Flow in the Murrumbidgee................................................................................................... 13
Table 6: Coefficient of variation (CV) and constancy (C) values for the four rivers before and during (1998-2001) translucent flows. ...................................................................................... 15
Table 7. PERMANOVA results for periphyton taxa richness between rivers and sampling years. ........................................................................................................................................ 17
Table 8. PERMANOVA results for periphyton multivariate data. .................................................. 19
Table 9. Periphyton Dominance in each of the four rivers over all sampling events ................. 21
Table 10. PERMANOVA results for the ratio of diatoms to filamentous green algae and blue-green algae. ............................................................................................................................... 22
Table 11. PERMANOVA univariate tests ......................................................................................... 24
Table 12. BIOENV Analysis relating periphyton community structure to antecedent flow conditions ........................................................................................................................................ 27
Table 13. MDS-BIOENV Analysis of Individual Rivers ................................................................... 29
Table 14. MDS-BIOENV Analysis of Individual Rivers ................................................................... 30

Assessing translucent environmental water releases in the Murrumbidgee River below Burrinjuck Dam, 1999-2002
1 NSW Office of Water, July 2014
Summary Environmental flows in the Murrumbidgee River commenced in 1999. These were developed using river flow objectives to guide release rules. One of the river flow objectives was to increase small scale variability downstream of regulatory dams. The solution to this lack of variability was the development of the ‘translucency and transparency’ environmental flow rules. Ecological monitoring of these environmental flow rules was performed between 1999 and 2001. This report documents the outcome of monitoring the regulated Murrumbidgee and Tumut rivers impacted by translucency and transparency rules, and their unregulated tributaries, the Goodradigbee and Goobarragandra rivers.
Translucency both reduced constancy and increased variability of flows released from Burrinjuck Dam between April and October, although this study found limited evidence that translucent flows altered periphyton composition or biofilm biomass. The study was designed to test for a long term change in flow and corresponding changes to biofilms with the onset of translucent flows; the size of effect from translucency was unknown. Significant differences in biofilm composition were observed among rivers, but the observed differences were not consistent with the predicted impacts of regulation. Summer irrigation flows were found to be much greater than the relatively minor winter-spring translucent releases. With the overarching influence of irrigation releases on the flow regime of the Murrumbidgee River, environmental flows would need to create a substantial change to the rivers flow regime for this study to be able to detect a change in biofilms. Moreover, factors other than flow appeared to be strong drivers of biofilm dynamics in the Murrumbidgee catchment, governing patterns of biofilms observed among rivers. Returning natural flow variability to rehabilitate the Murrumbidgee River appears to be hindered by the effects of large summer irrigation flows and water-column nutrient dynamics.
Acknowledgements We would like to acknowledge the following, who provided much support. Lee Bowling provided information and advice on water quality. Simon Williams, Simon Mitrovic and Nick Cook reviewed and edited this report. Justin Nancarrow, David Hohnberg, Nirvana Searle, Meredith Royal, Bronwen Jones, Chris Burton and Sean Grimes assisted with field work. Hugh Jones and Terry Koehn assisted with early statistical advice. Simon Treadwell, Tony Church, Darren Ryder and Andrew Boulton assisted with methods development. Daniel Hannon, Garry Carr and Geoff Quinn assisted with flow data. Trevor, Madeline and Kieran Delves supported this project.

Assessing translucent environmental water releases in the Murrumbidgee River below Burrinjuck Dam, 1999-2002
2 NSW Office of Water, July 2014
Introduction Rivers throughout the world are regulated for agriculture, domestic water use and hydropower, altering the natural flow regime and impacting on aquatic communities (Poff et al. 1997). The subsequent loss of values and services that intact ecosystems provide, such as clean water and recreation, have prompted many governments to begin rehabilitating rivers (Palmer et al. 2005). Providing environmental flows that mimic attributes of natural flow has become one of the most effective rehabilitation tools available (Stanford et al. 1996), although these techniques are limited by poor empirical knowledge of flow-ecology relationships (Poff et al. 2010). Monitoring physical and ecological responses to environmental flows is essential for progressing this understanding and for providing feedback for adaptive management (Poff et al. 2010). In this study, we examine the response of epilithic ‘biofilms’ in a regulated Australian river where management seeks to restore lost elements of the rivers flow/disturbance regime.
Biofilms and disturbance Submerged surfaces in rivers host communities of algae and microbes that live in a layer of polysaccharide exudates, organic matter, and inorganic sediment called a ‘biofilm’ (Lock 1993). Biofilms are a key site for autotrophic production and a important sink for transported organic matter (Graham 1990), thus serving as a vital resource for invertebrate grazers, scrapers, and detritivores that feed on algae, microbes, and detritus (Burns & Walker 2000a). The algae and microbes that comprise biofilms uptake and transform nutrients from both the water column (Mulholland 1996; Sabater et al. 2002) and from coarse and fine particulate organic material (CPOM and FPOM), thus linking energy and nutrient resources with aquatic food webs (Robertson et al. 1999). These mechanisms of uptake, immobilisation and transformation make biofilms an important regulator of water quality (Biggs 2000a; Villeneuve, Bouchez & Montuelle 2011). Biofilms affect physicochemical conditions (dissolved oxygen and pH), transform toxic compounds, limit excessive nutrients (Vymazal 1988; Biggs 2000a; Vymazal 2007), and immobilise heavy metals (Wilde & Benemann 1993; Sabater et al. 2002).
The structure and function of river biofilms is chiefly regulated by flow variability (Burns & Ryder 2001). Changes in flow affect the availability of nutrients and light, controlling rates of growth and reproduction, and can remove biofilms from substratum through scouring or desiccation (Ryder 2004). The intensity and frequency of disturbance thus affects the accrual of mass in the biofilm as well as the community composition of periphyton ( the algal component of biofilms) (Figure 1). Small changes in flow occur frequently in rivers, disturbing relatively small areas of biofilm, particularly in littoral habitats (Burns & Walker 2000b; Watts & Ryder 2001). Larger disturbances such as scouring events (where benthic shear stress exceeds thresholds for periphyton attachment during high flows) or low-flows (where large areas of the benthos dry out) are typically less frequent. The sensitivity to flow changes depends, in part, on the prior composition of the biofilm, which is governed by antecedent flow conditions (Dodds and Biggs 2002; Biggs et al 2005).
Following disturbance, scoured or desiccated surfaces are rapidly colonised by algae and microbes to form a new biofilm (Lock 1993). The community composition of this biofilm changes through time, ‘maturing’ (typically in the order of weeks to months; Gawne & Lake 1995, Uehlinger et al. 2003, Ryder et al. 2007) depending on numerous controls on rate and outcomes of succession. Typical early colonists such as diatoms and unicellular green algae have growth forms and life histories that enable them to attach to substratum and dominate early in succession (McCormick & Stevenson 1991). Population interactions such as facilitation and competition create a succession from these early assemblages, dominated by small prostrate organisms, toward assemblages dominated by late-stage colonists with extant growth forms (cf. McCormick and Stevenson 1991). By resetting succession, frequent disturbance can inhibit dominance of late-successional communities and can maintain biofilm community composition at an early successional stage (Steinman & McIntire 1990).

Assessing translucent environmental water releases in the Murrumbidgee River below Burrinjuck Dam, 1999-2002
3 NSW Office of Water, July 2014
Numerous drivers control relative survivorship and growth rates among species, and can alter the trajectory of succession in biofilms (McCormick & Stevenson 1991; Passy & Larson 2011). For example, variable flow creates dynamic resource and hydraulic environments (Morin & Cattaneo 1992; Matthaei, Guggelberger & Huber 2003), leading to diverse microhabitats that may favour some species over others. Invertebrate consumers (i.e. grazers) also regulate periphyton communities, and thus the distribution of consumers can alter periphyton community succession across relatively small spatial scales (Sarnelle, Kratz & Cooper 1993; Bergey et al.1995). Succession in periphyton has also been linked to light, with varying intensity affecting growth of different species (Tuji 2000; Sekar et al. 2002) and varying nutrient concentrations (Sekar et al. 2002).
Biofilms in regulated rivers The overarching influence of flow means biofilms in regulated rivers are often highly altered (Flinders & Hart 2009). The constant flows, and high nutrient loads that often accompany regulation can favour thickened biofilms dominated by late successional species such as filamentous algae and cyanobacteria, and containing fewer microbes and unicellular algae (Steinman and McIntyre 1990) that are thought to be most palatable to consumers (Bunn, Davies & Mosisch 1999; Biggs 2000b). However, evidence of subsequent impacts to aquatic communities in Australia’s regulated rivers is scarce (Chessman & Jones 2001). The accrual of extensive mats of filamentous green and blue green algae, often termed ‘nuisance biofilms’, in regulated streams has been linked with impacts to aquatic organisms, altered water quality, and aesthetic impacts (Biggs 2000b). Nutrient uptake by biofilms decreases with increasing biomass, limiting their capacity to affect water quality (Sabater et al. 2002). Nuisance growths can be accompanied by high rates of respiration, creating low oxygen levels in the water column (e.g. the Jackson River in the United States, Flinders & Hart 2009). Changes to the composition of biofilms in regulated rivers can also affect their quality as a resource for consumers, impacting on consumer populations (Sheldon & Walker 1997).
Returning flow variability to the Murrumbidgee River This study examined the response of biofilms, particularly periphyton, to changes in flow regime induced by water sharing rules in the Murrumbidgee River, a large regulated river in south-western NSW that drains parts of the NSW alpine region. Biofilms are defined as the matrix of material growing on surfaces in streams, composed of algae, bacteria, fungi, mucilage and the trapped sediments within them. Periphyton are the algal component of the biofilms. In this study, attributes of each are used as indicators of environmental change. Biofilm attributes of percent organic mass as well as periphyton community structure and chlorophyll a concentration were used. A long history of regulation has severely altered flows to the Murrumbidgee River and consequently impacted on aquatic communities (Watts & Ryder 2001).
The Water Sharing Plan for the regulated Murrumbidgee water source was gazetted in July 2004 (DIPNR 2004), although environmental flows have been released since 1998 (Hardwick et al. 2012a, b). These water sharing rules seek to (adapted from DIPNR 2004):
1. Ensure that there is no loss of the long-term average volume of water available to the environment by reserving all water above the Plan extraction limit for the environment (~56% of flows)
2. Protect the low flows in the upper reaches of the river immediately below ... Burrinjuck Dam by releasing up to … 615MLd-1 from Burrinjuck Dam, depending on inflows. If inflows fall below this volume then releases are to at least equivalent to be the inflows.
3. Provide variable flows during winter months by releasing a percentage of inflow between 22 April and 21 October each year. **
4. Provide a volume of water in the dams (Environmental Water Allowances – EWA) that can be released when needed for environmental purposes, such as to assist with water-

Assessing translucent environmental water releases in the Murrumbidgee River below Burrinjuck Dam, 1999-2002
4 NSW Office of Water, July 2014
bird breeding, flooding of wetlands, fish passage or breeding, or to restore water quality (with annual volumes depending on a variety of factors)
** The percentage of inflows that are released is determined using a schedule of daily flows. These daily flows are determined by the storage level of the dam and the mean daily flow in the Goodradigbee River, as directed by a series of tables included in schedules 3, 4, and 5 of the Water Sharing Plan for the Murrumbidgee Regulated River Water Source. In this way, daily releases are adjusted depending on whether it is a dry, normal, or wet period. Note that a small amount of flows from the upper Goodradigbee River are extracted by the Snowy Scheme.
The above objectives are aligned with the general river flow objectives developed for water sharing plans in NSW (cf. NSW Government 2006). The Integrated Monitoring of Environmental Flows (IMEF) project was designed to assess the success of these objectives, of which resetting epilithic biofilms forms a key hypothesis (from Chessman & Jones 2001):
Hypothesis 4 (conditioning stony beds) - Protecting or restoring a portion of freshes and high flows, and otherwise maintaining flow variability … will induce scouring of silt and sloughing of biofilms from stony strata, resetting biofilm development and improving habitat quality for some invertebrate scrapers and their predators, and spawning conditions for gravel-spawning fishes.
A separate hypothesis that relates specifically to lowland rivers, suggests more detail about changes to periphyton community composition that could be provided by disturbance and is also applicable.
Hypothesis 6 (resetting lowland biofilms) - … releases will cause scouring and level-changes that will shift the species composition of river biofilms … towards a greater representation of pioneering taxa such as diatoms, heterotrophic bacteria and fungi relative to filamentous algae and cyanobacteria, and consequently increase macroinvertebrate diversity.
Thus, environmental flows can be used to increase the frequency and intensity of disturbance for biofilms with the goal of reducing biofilm biomass and maintaining periphyton assemblages at an earlier successional stage.
Study Objectives This study sought to determine if translucent releases to the Murrumbidgee River between 1998 and 2001 affected the condition of epilithic periphyton through increased frequency and intensity of disturbance during winter and early spring. If successful, translucency should increase flow variability, reducing the mass of biofilms in the Murrumbidgee River and shifting periphyton community assemblages away from that of a control river and toward reference condition (cf. Chessman & Jones 2001). More specifically, we tested if translucent flows to the Murrumbidgee River:
• Increased flow variability and reduced flow constancy in the Murrumbidgee River between 22nd April and 21st October in each year;
• Reduced the mass of benthic biofilms through increased flow variability and scouring; • Shifted the composition of benthic algae toward an earlier successional stage (with a
greater proportion of early-successional stage taxa, like diatoms, and less late-stage colonists such as filamentous algae and cyanobacteria) through more frequent disturbance that resets biofilm development.

Assessing translucent environmental water releases in the Murrumbidgee River below Burrinjuck Dam, 1999-2002
5 NSW Office of Water, July 2014
Methods Study area Flows to the Murrumbidgee River originate in the NSW Alps, draining ~84,000 km2 (Wallbrink et al. 1996) and flowing 1609km west to converge with the Murray River. Through this region, annual rainfall varies between 600 and 1000 mm, increasing with altitude into the Australian Alps (Morton et al. 2010). The present study focuses on the upper reaches of the Murrumbidgee immediately below Burrinjuck Dam and three tributaries: the regulated Tumut River which enters the Murrumbidgee ~95km downstream of Burrinjuck Dam, the unregulated Goodradigbee River which flows into Burrinjuck Dam, and the unregulated Goobarragandra River that flows into the Tumut River (Figure 1).
Flows in the Murrumbidgee below Burrinjuck Dam would have once peaked in spring and early summer from snow melt. Snowmelt flows would have played a critical role in the formation and maintenance of the river channel and in the ecology of aquatic flora and fauna (sensu Yarnell, Viers & Mount 2010). Since the construction of Burrinjuck Dam (1026 GL storage capacity) in 1928, Tantangara Dam (254 GL) in 1960, and Blowering Dam (1628 GL) in 1968, the hydrology of the Murrumbidgee River has been highly altered. Inter-basin transfers divert 1026 GL per year into Blowering Dam via the Snowy Mountains Hydroelectric Scheme (SMHS). Approximately ~550 GL is diverted from upper Murrumbidgee tributaries at Tantangara Reservoir and numerous aqueducts throughout the Snowy Mountains. Diversions into the upper Tumut River of 1026 GLy-1 from Snowy Hydro has amplified the mean annual flow (MAF) of the Tumut River by using the river channel as a conduit to deliver water to users downstream. Mean daily flows in the four rivers are highly variable among years and the regulated rivers exhibited decreasing flow variability since 1995 with the onset of drought.
Inflows to Lake Burrinjuck (average 1170GL) and Blowering Dam (average 1580GL – NSW Office of Water 2011a) are used primarily for summer irrigation. This demand has shifted the seasonality of flows downstream of Burrinjuck dam from winter-spring to spring-summer (Figure 3). Conversely, releases from Blowering Dam alternate between low flows of <1000 MLd-1 which can last for several months between October and March, followed by long periods of high stable flows of around 9000MLd-1 (bank full discharge). These maximum flows peak briefly in October but remain high from December through to April, reflecting consumer demand downstream. The Murrumbidgee thus experiences peak flows through summer rather than spring, but also loses many small to large scale flow events replaced by longer periods of low flow punctuated by high flows.
Flow restoration A translucent flow rule was in place for Burrinjuck dam between 1998 and 2006 (Hardwick et al. 2012b), releasing a varying percent of dam inflows (see above) between April and October each year. Flows in the Goobarragandra River were particularly low during 1998 and 1999 and normal to wet during 2000 and 2001. The Goodradigbee and Goobarragandra Rivers each received peak flows during spring and early summer consistent with spring snowmelt. Ideally, the translucent flows in the Murrumbidgee River would mimic this spring-snowmelt recession. The study terminated in November 2001, after translucent releases became minimal during drought and with the Water Sharing Plan set aside in November 2006. Between 2006 and July 2011 when the Water Sharing Plan was reinstated, there were no translucent releases from Burrinjuck Dam.

Assessing translucent environmental water releases in the Murrumbidgee River below Burrinjuck Dam, 1999-2002
6 NSW Office of Water, July 2014
Figure 1. Sampling sites (n = 2 per stream) for this study. Areas potentially affected by snow are indicated in blue (i.e. above 1200m asl).
Figure 2. River discharge in the Murrumbidgee (MAF 1298, dark blue), Tumut (MAF 1593, red), Goodradigbee (MAF 290, light blue) and Goobarragandra (MAF 284, green) rivers from 1966-2007.

Assessing translucent environmental water releases in the Murrumbidgee River below Burrinjuck Dam, 1999-2002
7 NSW Office of Water, July 2014
Figure 3. Total Monthly Flow (ML) as a Proportion of Mean Annual Flow (1985-2005) in the regulated Murrumbidgee and Tumut Rivers and their unregulated tributaries.
Figure 4. a) Photos of rivers. Murrumbidgee River @ Nannangroe ; b) Tumut River downstream of Blowering Dam; c) the Goodradigbee River; d) the Goobarragandra River
a)
b)
c) d)

Assessing translucent environmental water releases in the Murrumbidgee River below Burrinjuck Dam, 1999-2002
8 NSW Office of Water, July 2014
Figure 5. Mean daily flow (MLd-1) for the Murrumbidgee, Goodradigbee, Tumut, and Goobarragandra Rivers between 1999 and 2001(NSW Office of Water 2011b). Vertical red lines show approximate sample occasions for each river

Assessing translucent environmental water releases in the Murrumbidgee River below Burrinjuck Dam, 1999-2002
9 NSW Office of Water, July 2014
Monitoring design As sampling began after translucency rules took effect, evidence for biofilm response to flow was sought by comparing biofilms in the Murrumbidgee River with an adjacent control stream (the regulated Tumut River that is regulated but does not receive translucent flows) and two reference streams (the Goodradigbee and Goobarragandra rivers). The design drew heavily on that of Watts and Ryder (2001). We tested for overall differences among rivers as well as changes through time (i.e. in the Murrumbidgee River) attributable to flow restoration. To compare among treatment, control, and reference rivers, two sites (i.e. riffles) were chosen from within each of the four rivers (Figure 1). Sites were selected for their proximity to dams and gauging stations, and comparable elevation. There are two gauging stations in the Murrumbidgee River downstream of Burrinjuck (gauge numbers 410008 and 410068), one in the Tumut River downstream of Blowering (410073), and on in each of the Goobarragandra (410057) and Goodradigbee Rivers (410024).
Samples were collected on 11 occasions between July 1999 and November 2001 (Table 1). Sampling was approximately seasonal to coincide with changes in discharge management and to encompass natural seasonality but was not consistently collected across all sites at all times.
Table 1. Sampling occasions River Jul 99 Oct 99 Feb 00 May 00 Aug 00 Sep 00 Oct 00 Feb 01 May 01 Aug 01 Nov 01
Murrumbidgee x x x* x* x x x x x x x
Tumut x x x* x x x x x
Goodradigbee x x x* x* x x x x x x
Goobarragandra x x x* x* x x x x x x
* only one riffle sampled at each site
Field sampling Epilithic biofilms were sampled following the methods described in Treadwell et al. (2003) and Biggs and Close (1989). Briefly, six rocks were selected randomly from the riffle at each site. Stream velocity was measured 10 cm above each rock using a Pygmy Current Meter (Model OSS-PC1; fan diameter 50 mm, pitch 0.05m). Each rock was then removed to a clean plastic bucket and scrubbed with a hard kitchen brush and rinsed with a small volume of filtered (100μm) water to rinse off the biofilm. A spatula was used on any biofilm not removed by the brush. As this study randomly sampled both periphyton and chlorophyll A and also organic and inorganic mass, a larger, less variable sample was required. Earlier trials of the method of Davies and Gee ( (1993) used by Watts and Ryder (2001), indicated unreliable results related to significant periphyton remnants retained in the scourer. Sampling small areas of high density periphyton using a selective technique had the possibility of large errors where four different rivers were to be sampled. These differences in objectives and associated method differences render comparisons with that study difficult.
The slurry of extracted biofilm and water was then quantitatively transferred to a 1L plastic bottle, ensuring the total sample volume did not exceed 900ml. Samples were kept chilled during transport to the laboratory.
To estimate sample surface area each rock was covered with aluminium foil, cut to form a single layer without any overlap (Lower et al. 1996). Foil density was later estimated by cutting foil standards of known area, and used to convert foil mass for each sample to rock surface area (m2). Contrary to Biggs and Hickey (1994), the entire stone area was used, rather than the 31.5% correction to equate for proportion of rock not colonised by periphyton. This has no effect on intra-study comparisons but correction would be required to compare

Assessing translucent environmental water releases in the Murrumbidgee River below Burrinjuck Dam, 1999-2002
10 NSW Office of Water, July 2014
across other studies. Assessment of using aluminium foil versus plastic wrap and LWH measurements indicated (contrary to Doeg and Lake 1981) that catering grade aluminium foil was robust to wrapping and avoided the folding and associated light weight errors of plastic wrap. Water quality samples were also collected as outlined in an accompanying report (Hardwick et al. 2012a).
Sample processing Upon return to the laboratory, each sample was quantitatively transferred to a blender using distilled water and made up to 1L. With the blender running at high speed, aliquots were extracted with a large syringe (volume recorded) for separate analyses.
Approximately 10-20mls was filtered through an 0.45 micron filter to extract the biofilm. This paper was then placed into a labelled foil envelope and frozen in liquid nitrogen for further analysis. Phaeophytin-corrected chlorophyll-a was later measured using this frozen sample by pigment extraction and spectrophotometric analysis (APHA-AWWA-WEF (1992) Method 10200H).
Fifty millilitres was preserved with Lugol’s solution and later used to identify periphyton to genus following published techniques (APHA-AWWA-WEF (1992) Method 10300A), using standard keys (Prescott 1978; Entwisle, Sonneman & Lewis 1997; Baker, Fabbro & Ecology 2002). Each genus was later assigned to a group (pennate diatom, centric diatom, blue-green algae, blue-green filamentous algae, green filamentous algae, green algae) depending on growth form and thus used to distinguish between early and late stage colonists.
A 500 mL aliquot was chilled and later used for Determination of organic/inorganic mass. This determination was performed by potassium dichromate reduction (Australian Standard AS1289.4.1.1.-1997).
The remainder of the sample was retained for further studies (see companion report series).
All variables were corrected using rock surface area and expressed in units per square metre.
Data analysis Flow variability To test whether translucency increased flow variability and reduced constancy, flows were compared across all rivers for four years before and after translucency began. Mean daily flow data were acquired for the four study rivers and from the Burrinjuck Dam outlet from the NSW Office of Water HYDSTRA database (NoW 2011b). The upstream site in the Goobarragandra River (Goobarragandra River @ Rock Flat 41010173) is an ungauged site. Flow at this site was calculated using a combination of existing and new hydrometric gaugings a range of flows and developing catchment area/flow metrics.
Actual (regulated) and modelled (before regulation) releases were calculated using the NSW Office of Water Integrated Quantity Quality Model (IQQM, NoW 2011a).
Flow variability between 22nd April and 21st October before (1994-1998) and during (1998-2001) translucent releases was compared using the coefficient of variation (CV) and constancy. The CV is a dimensionless index that describes flow variability without considering the temporal sequence of flow variation (Poff & Allan 1995) and is calculated for by dividing the standard deviation of mean daily flows by the mean. Constancy (C) estimates the degree of stability in flows (Colwell 1974), returning a value between 0 and 1 that is greatest when flows fall within a narrow range of values (i.e. are maintained at a particular discharge for extended periods) and is lower when flows occur across multiple flow categories. To calculate C, flow frequencies for each month were determined across seven flow classes (<0.5, 0.5-1.0, 1.0-1.5, 1.5-2.0, 2.0-2.5, 2.5-3.0 and >3.0 times the mean flow after Gan, McMahon & Finlayson 1991). These data were then used to calculate a single value that describes the distribution of flow frequencies among classes (Colwell 1974). We

Assessing translucent environmental water releases in the Murrumbidgee River below Burrinjuck Dam, 1999-2002
11 NSW Office of Water, July 2014
predicted that, if the translucency rule was successful at restoring flow variability, CV would increase and C would decrease.
The number of high flows were examined by calculating an arbitrary high flow value [(value*standard deviation)+mean] using the spells analysis function of the River Analysis Package (RAP; Marsh, Stewardson & Kennard, M.J. 2003). The number of spells exceeding this threshold were summed for four years before and during the flow release period. The threshold for spells was calculated separately for before and after data. The number of rises were also calculated using RAP. We predicted the frequency of high flow events, and number of rises, would increase during the EFR period relative to the four years before.
Biofilm periphyton data To test the hypothesis that epilithic biofilms would have greater mass in the two regulated rivers, and would become reduced in the Murrumbidgee through time, univariate data (chlorophyll-a, biofilm mass (organic and inorganic), periphyton species richness and total abundance) were compared among rivers and sites with a permutational analysis of variance (PERMANOVA; Anderson 2001; Anderson 2005). The ratio of inorganic:organic mass was calculated as a measure of potential effects on resource quality and analysed using the same model. Sites (n=2) were nested within rivers (n=4) and compared among sample times (between 2 and 4) nested within years (n=3). Individual sub-samples were pooled at the site level for the analysis.
Of particular interest was the interaction between river and year (and other complex interactions with time) that may indicate differences in the trajectory of change among rivers through time. Where appropriate, these relationships were explored further with pairwise tests.
Table 2: PERMANOVA design used for this study. Samples were unbalanced across the three years.
Source of variation Degrees of freedom*
1 River 3
2 Year 2
3 Time(Year) 7
4 Site(River) 4
5 RiverxYear 4
6 RiverxTime(Year) 16
7 YearxSite(River) 5
8 Time(Year)xSite(River) 16
9 Residual 286
*DF varied depending on the number of replicates available for the model being tested. DF are reported separately for each analysis.
PERMANOVA was also used to test for differences/changes in periphyton community composition using the same model (i.e. Table 2). Mean plots were then examined to assess whether those trends were consistent with the test hypotheses, i.e. that the Murrumbidgee was becoming more similar to the reference rivers or less similar to the negative control river. Non metric multi-dimensional scaling (MDS) was used to represent these patterns graphically. Significant differences between levels of factors and periphyton genera were investigated further through SIMPER analysis (Clarke and Warwick 2001).

Assessing translucent environmental water releases in the Murrumbidgee River below Burrinjuck Dam, 1999-2002
12 NSW Office of Water, July 2014
PERMANOVA tests were conducted with Type III sum of squares as recommended by Anderson et al. (2005), as this was the most conservative and widely accepted approach to managing unbalanced designs. A multivariate equivalent of homogeneity of variances, a permutational analysis of multivariate dispersions (PERMDISP) was performed on all data. This analysis tests for heterogeneity in groups defined by a factor, in this case, rivers, years and events. Where dispersals differed, a more stringent critical test level of p = 0.005 was adopted instead of using the conventional critical level of p=0.05 to interpret significant test results. Multivariate data were either transformed by square root or log (x+1) to reduce the skew created by zero data and large populations. All multivariate analyses were performed using PRIMER V6 and PERMANOVA+ (Clarke & Warwick 2006, Anderson 2001, 2005).
Biofilm periphyton responses to flow Mean daily flows for each gauging station were used to calculate hydrological indices (Growns & Marsh 2000) that relate biofilms with hydrological disturbance. Froude numbers were calculated as a surrogate of stream velocity (Biggs and Close 1989; Horner et al. 1990) for each sample using recorded depth and current velocity (Gordon, McMahon & Finlayson 2004). The list of hydrological indicators was further refined, using a principal components analysis (using Statistica Version 6.1), to potential indicators to those most likely to influence biofilms, with many indices autocorrelated and thus redundant (Olden & Poff 2003), Appendix 1.
Table 3. Hydrological variables selected for examining periphyton relationships with flow.
Hydrological Variables
Antecedent mean 30 days
Antecedent mean 60 days
Antecedent 5 day median
Antecedent 10 day median
Maximum 60 day antecedent flow
Maximum 60 day antecedent fall
Maximum 30 day antecedent change
Froude No.
Correlating flow and water quality with biofilm periphyton Potential relationships between periphyton community composition with flow and water quality were examined using BIOENV (Clarke and Warwick 2001). The pre-chosen antecedent flow variables (Table 3) and water quality data were used as input into BIOENV. BIOENV measures agreement in the patterns between environmental and biotic data, using a ranked correlation process. This does not in itself prove causation, however best variable combinations can be used in much the same way as R values may be used in regressions.
Assessing translucent environmental water releases in the Murrumbidgee River below Burrinjuck Dam, 1999-2002
13 NSW Office of Water, July 2014
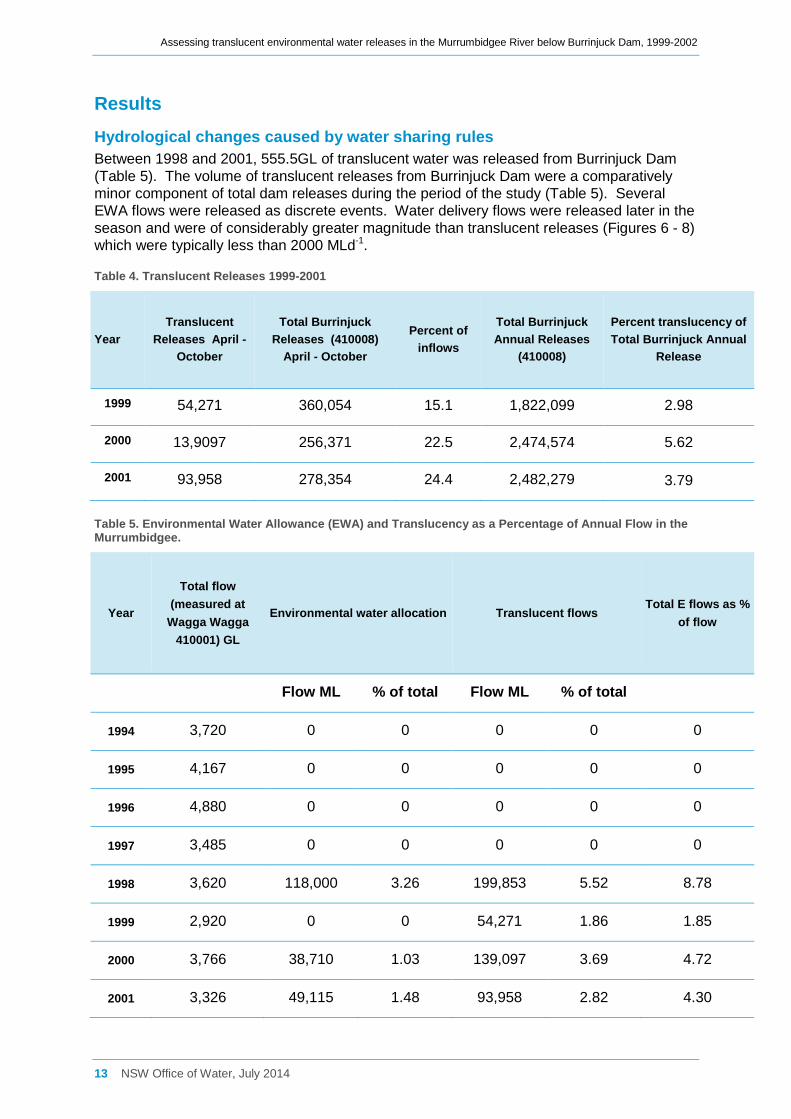
Results Hydrological changes caused by water sharing rules Between 1998 and 2001, 555.5GL of translucent water was released from Burrinjuck Dam (Table 5). The volume of translucent releases from Burrinjuck Dam were a comparatively minor component of total dam releases during the period of the study (Table 5). Several EWA flows were released as discrete events. Water delivery flows were released later in the season and were of considerably greater magnitude than translucent releases (Figures 6 - 8) which were typically less than 2000 MLd-1.
Table 4. Translucent Releases 1999-2001
Year Translucent
Releases April - October
Total Burrinjuck Releases (410008)
April - October
Percent of inflows
Total Burrinjuck Annual Releases
(410008)
Percent translucency of Total Burrinjuck Annual
Release
1999 54,271 360,054 15.1 1,822,099 2.98
2000 13,9097 256,371 22.5 2,474,574 5.62
2001 93,958 278,354 24.4 2,482,279 3.79
Table 5. Environmental Water Allowance (EWA) and Translucency as a Percentage of Annual Flow in the Murrumbidgee.
Year
Total flow (measured at
Wagga Wagga 410001) GL
Environmental water allocation Translucent flows Total E flows as %
of flow
Flow ML % of total Flow ML % of total
1994 3,720 0 0 0 0 0
1995 4,167 0 0 0 0 0
1996 4,880 0 0 0 0 0
1997 3,485 0 0 0 0 0
1998 3,620 118,000 3.26 199,853 5.52 8.78
1999 2,920 0 0 54,271 1.86 1.85
2000 3,766 38,710 1.03 139,097 3.69 4.72
2001 3,326 49,115 1.48 93,958 2.82 4.30

Assessing translucent environmental water releases in the Murrumbidgee River below Burrinjuck Dam, 1999-2002
14 NSW Office of Water, July 2014
Figure 6. Releases from Burrinjuck Dam, 1999 during the study. Lines are actual (recorded at gauge 410008) and calculated (transparent and translucent) releases from April-October 1999.
Figure 7. Releases from Burrinjuck Dam, 2000 during the study. Lines are actual (recorded at gauge 410008) and calculated (transparent and translucent) releases from April-October 2000.
Figure 8. Releases from Burrinjuck Dam, 2001 during the study. Lines are actual (recorded at gauge 410008) and calculated (transparent and translucent) releases from April-October 2001.

Assessing translucent environmental water releases in the Murrumbidgee River below Burrinjuck Dam, 1999-2002
15 NSW Office of Water, July 2014
One flow event, exceeding ~7000 MLd-1, occurred in each year within the translucency period; in October 1999 following heavy rainfall, and EWA releases in August 2000 and September 2001 (Figures 6-8). A particularly large (16,543 MLd-1) water delivery was made in October 2001, dwarfing earlier environmental releases (Figure 8). At times translucent flows accounted for a substantial component of daily flows (Figures 6-8).
Releases from Burrinjuck Dam were more variable and less constant during translucent release periods relative to years before Figure 6). Overall, unregulated flows were both less variable and less constant than regulated flows, with only small changes in both in these rivers during the EFR than before (Table 6). In the Murrumbidgee, downstream at the sample sites, the coefficient of variation was greater during translucent releases than before, and constancy declined slightly. By contrast, constancy in the Tumut River increased substantially during the study period due to longer periods of flows at ~600MLd-1 between April and November. High spells were frequent in the Murrumbidgee both before and during the EFR period (Table 6) but threshold levels decreased in both regulated rivers during the years of translucent releases. Seasonal variability also appeared unaffected by water sharing rules (Figure 9). Rates of rise and fall also differed (Appendix Figures A2, A3)
Table 6: Coefficient of variation (CV) and constancy (C) values for the four rivers before (1994-1998) and during (1998-2001) translucent flows. Values were calculated using data between 22nd April-21st October in each year. Data for the Murrumbidgee is taken from the gauging site downstream of Burrinjuck dam (gauge site 410068).
River
CV*, € C** total # rises High spells
before during before during before during before during
threshold (MLd-1)
# spells€ threshold
(MLd-1)
# spells
Murrumbidgee 1.18 1.39 0.66 0.56 139 169 3860 (1,11,7,2)
21 2446 (3,5,9,9)
26
Goodradigbee 0.95 0.97 0.29 0.19 113 114 668 (3,12,7,4)
26 662 (6,10,11,6)
33
Tumut 1.05 1.11 0.45 0.79 138 157 4842 (8,8,8,8)
32 3978 (2,6,2,7)
17
Goobarragandra 0.83 0.81 0.22 0.17 125 126 791 (6,14,8,7)
35 712 (11,14,11,9
)
45
*CV is the mean of CV for flows within each day; **C is calculated for all data in each period before and during, €
values in brackets are individual values for each year.

Assessing translucent environmental water releases in the Murrumbidgee River below Burrinjuck Dam, 1999-2002
16 NSW Office of Water, July 2014
Figure 9: Mean daily flows in the four rivers before (1994-1998, blue) and during (1998-2001, orange) translucent flows by ordinal day. Vertical red lines indicate dates when flow rules seek to increase flow variability (April to October). Note the difference in scale on the y-axis, these ranges have been reduced to exclude extreme values.
Spring SummerAutumn Winter
0
5000
10000
15000
20000
25000
30000
X Data
Spring SummerAutumn Winter
Dis
char
ge (M
L d-1
)
0
2000
4000
6000
8000
X Data
Spring SummerAutumn Winter
0
2000
4000
6000
8000
10000
Spring SummerAutumn Winter
0
2000
4000
6000
8000
Murrumbidgee
Goodradigbee
Tumut
Goobarragandra

Assessing translucent environmental water releases in the Murrumbidgee River below Burrinjuck Dam, 1999-2002
17 NSW Office of Water, July 2014
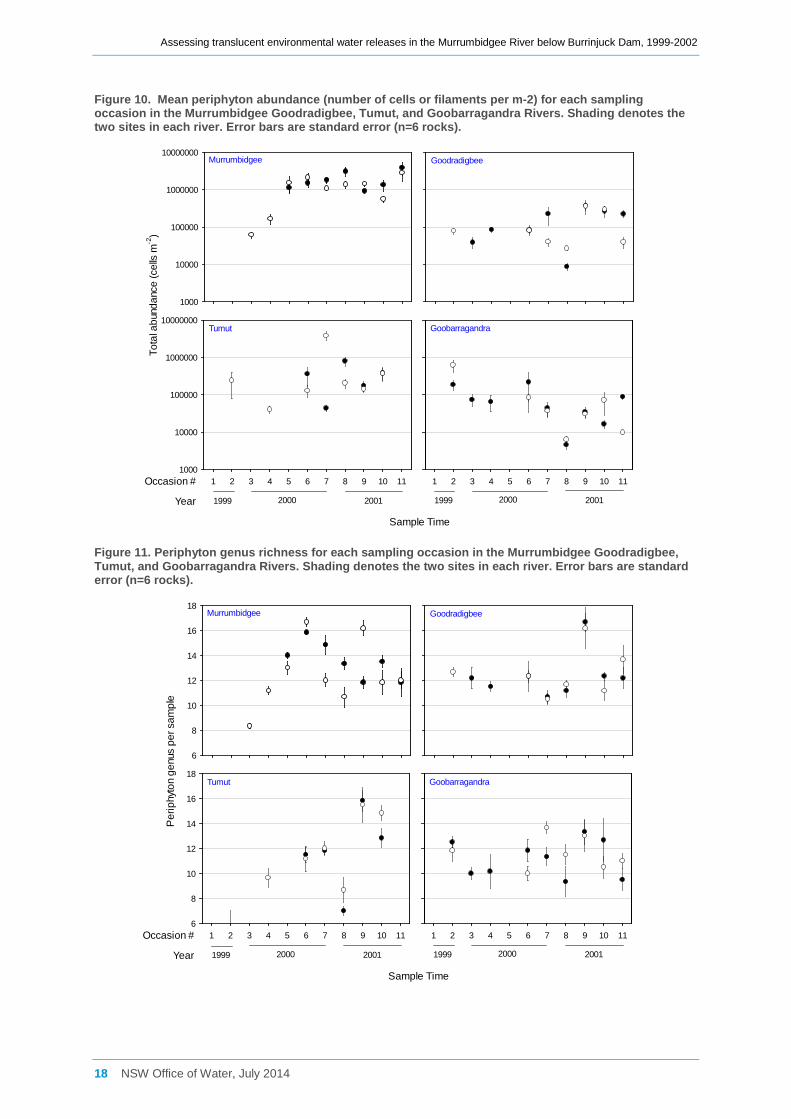
Biofilm responses to regulation Periphyton community data Abundance and genus richness Periphyton were significantly more abundant in the Murrumbidgee River than the Goobarragandra River, but only during 2001 (Figure 10, Table 7 term 5, pairwise p-perm=0.004). Overall mean periphyton abundance in the Murrumbidgee was 1,513,730 individuals per m-2, 30 times greater than mean abundance in the Goobarragandra River (50,052 individuals per m-2). Across time, abundance in the Murrumbidgee tended to increase where in the Goobarragandra they tended to decrease (Figure 10). Abundances were significantly less in the Goobarragandra river than the Goodradigbee during 2001 (p-perm=0.005) but not 2000 (p(perm)=0.558). Other high order interaction terms (Table 7, term 8) suggest differences among rivers should be viewed cautiously, but may also be due to the unbalanced dataset. No other significant differences were observed.
Overall genus richness appeared to differ significantly among rivers and years (Table 7, term 5) although pairwise comparisons, using adjusted p-values, found no significant differences.
Table 7. PERMANOVA results for periphyton taxa richness between rivers and sampling years.
Source of variation df
Total abundance Genus richness
Pseudo-F P(perm) Pseudo-F P(perm)
1 River 3 11.4300 0.001 8.4043 0.002
2 Year 2 1.1193 0.396 4.4877 0.024
3 Time(Year) 7 2.3776 0.090 6.5879 0.001
4 Site(River) 4 0.69207 0.609 1.7854 0.950
5 RiverxYear 6 4.3954 0.004 6.592 0.003
6 RiverxTime(Year) 16 1.7369 0.121 1.8248 0.133
7 YearxSite(River) 5 1.0576 0.425 1.8248 0.133
8 Time(Year)xSite(River) 16 3.4429 0.001 1.5786 0.062
9 Residual 286
Assessing translucent environmental water releases in the Murrumbidgee River below Burrinjuck Dam, 1999-2002
18 NSW Office of Water, July 2014
Figure 10. Mean periphyton abundance (number of cells or filaments per m-2) for each sampling occasion in the Murrumbidgee Goodradigbee, Tumut, and Goobarragandra Rivers. Shading denotes the two sites in each river. Error bars are standard error (n=6 rocks).
1000
10000
100000
1000000
10000000
1 2 3 4 5 6 7 8 9 10 11
Tota
l abu
ndan
ce (c
ells
m-2
)
1000
10000
100000
1000000
10000000
1 2 3 4 5 6 7 8 9 10 11
Sample Time
Murrumbidgee Goodradigbee
Tumut Goobarragandra
1999 2000 2001 1999 2000 2001
Occasion #
Year
Figure 11. Periphyton genus richness for each sampling occasion in the Murrumbidgee Goodradigbee, Tumut, and Goobarragandra Rivers. Shading denotes the two sites in each river. Error bars are standard error (n=6 rocks).
6
8
10
12
14
16
18
1 2 3 4 5 6 7 8 9 10 11
Per
iphy
ton
genu
s pe
r sam
ple
6
8
10
12
14
16
18
1 2 3 4 5 6 7 8 9 10 11
Sample Time
Murrumbidgee Goodradigbee
Tumut Goobarragandra
1999 2000 2001 1999 2000 2001
Occasion #
Year

Assessing translucent environmental water releases in the Murrumbidgee River below Burrinjuck Dam, 1999-2002
19 NSW Office of Water, July 2014
Multivariate analysis A total of 52 periphyton genera were recorded from the four rivers during the study. Commonly observed genera include Gomphonema and Navicula (pennate diatoms), Aulacoseria (centric diatom) and Lyngbya (blue green filamentous algae), which were all recorded for more than 70% of samples. Other abundant genus, though not observed in as many samples, include Stigeoclonium and Cladophora (green filamentous algae), and Chlorella (a green phytoplanktonic algae). Most genera were observed in both regulated and unregulated streams except for Hantzschia, a pennate diatom found only in the two reference streams and Staurastrum, a phytoplanktonic species found only in the two regulated rivers.
Periphyton community composition differed significantly between the Murrumbidgee and Goobarragandra rivers (Figure 12, Table 8, term 1; pairwise p-perm = 0.001) and between the Murrumbidgee and Goodradigbee Rivers (pairwise p-perm = 0.002). These differences were mostly driven by Aulacoseira/Melosira, Gomphonema and Rhoicosphenia (the latter two being pennate diatoms; results via SIMPER), all of which appear more abundant in the Murrumbidgee River. Significant high order interactions (Table 8, terms 6 and 8) mean these differences may not be consistent among sites within rivers or samples within years.
There was no evidence of compositional changes in the Murrumbidgee, relative to the control and reference rivers, through time (Table 8, term 5).
Table 8. PERMANOVA results for periphyton multivariate data.
Source of variation df Pseudo-F P(perm)
1 River 3 2.8709 0.002
2 Year 2 2.3851 0.010
3 Time(Year) 7 5.0091 0.001
4 Site(River) 4 0.8853 0.652
5 RiverxYear 6 1.5363 0.012
6 RiverxTime(Year) 16 1.9964 0.001
7 YearxSite(River) 5 0.8675 0.675
8 Time(Year)xSite(River) 16 4.5839 0.001
9 Residual 286

Assessing translucent environmental water releases in the Murrumbidgee River below Burrinjuck Dam, 1999-2002
20 NSW Office of Water, July 2014
Figure 12. Non-metric MDS of periphyton samples. See table X for PERMANOVA results.
Periphyton taxonomic groups Samples from the Murrumbidgee River contained a significantly greater proportion of diatoms relative to filamentous algae (Figure10) than samples from the Goobarragandra (pairwise p-perm = 0.001) and Goodradigbee (pairwise p-perm = 0.001) Rivers and the Tumut (pairwise p-perm = 0.114, Figures 13 and 14). Again, centric diatoms (particularly Aulocoseira) are the main driver of these differences (Figure 10). During May 2000 (sample time 4) and February 2001 (sample time 8), Chlorella (a unicellular green phytoplankton species) comprised more than 20% of total abundance from Murrumbidgee samples, but green algae were not abundant at other times (Figure 13, data for individual genera not shown).
The proportion of diatoms to late-stage colonists also differed significantly among sample times within years (Table 10, term 3, pairwise p-perm=0.002) but not among years (p-perm=0.917).

Assessing translucent environmental water releases in the Murrumbidgee River below Burrinjuck Dam, 1999-2002
21 NSW Office of Water, July 2014
Figure 13. Percentage composition of periphyton in the regulated Murrumbidgee (M1, M2), Tumut (T1,T2), and unregulated sites of the Goobarragandra (GB1,GB2) and Goodradigbee (GD1,GD2) Rivers.
Table 9. Periphyton Dominance in each of the four rivers over all sampling events
Murrumbidgee Goodradigbee Tumut Goobarragandra
Aulacoseira Gomphonema Stigeoclonium Cladophora
Gomphonema Cladophora Gomphonema Stigeoclonium
Chlorella Synedra Cladophora Planktolyngbya
Synedra Planktolyngbya Cymbella Nitzschia
Stigeoclonium Aulacoseira Phormidium (broad) Gomphonema
Rhoicosphenia Stigeoclonium Navicula Navicula
Navicula Navicula Aulacoseira Phormidum (type2)
Planktolyngbya Cocconeis Lyngbya Phormidium (broad)
Cladophora Cymbella Rhizoclonium Aulacoseira
0%
10%
20%
30%
40%
50%
60%
70%
80%
90%
100%
GD1 GD2 GB1 GB2 MU1 MU2 TUMAS2 TUMAS2
Site
Perc
ent c
ompo
sitio
n of
per
iphy
ton
clas
ses
Green Unicellular Green Filamentous Blue Green Unicellular
Blue Green f ilamentous Pennate diatoms Centric Diatoms
Algal Group ClassificationGreen Filamentous Chlorophyta: Chaetophorales,SiphonocladalesCentric Diatoms Chrysophyta: Bacillariophyceae:Centrales Pennate Diatoms Chrysophyta: Bacillariphyceae:PennalesBlue Green Filamentous Cyanophyta: OscillatorialesGreen Unicellular Chlorophyta: Chloraceae:Chlorococcales
Assessing translucent environmental water releases in the Murrumbidgee River below Burrinjuck Dam, 1999-2002
22 NSW Office of Water, July 2014
Figure 14. Ratio of diatom abundance (pennate + centric) to late stage colonists (green and blue-green filamentous algae) for each sampling occasion in the Murrumbidgee Goodradigbee, Tumut, and Goobarragandra Rivers. Shading denotes the two sites in each river. Error bars are standard error (n=6 rocks).
0.1
1
10
100
1000
10000
1 2 3 4 5 6 7 8 9 10 11
Rat
io o
f dia
tom
to fi
lam
ento
us +
blu
e-gr
een
alga
e
0.1
1
10
100
1000
10000
1 2 3 4 5 6 7 8 9 10 11
Sample Time
Murrumbidgee Goodradigbee
Tumut Goobarragandra
1999 2000 2001 1999 2000 2001
Occasion #
Year
Table 10. PERMANOVA results for the ratio of diatoms to filamentous green algae and blue-green algae.
Source of variation df Ratio
Pseudo-F P(perm)
1 River 3 5.9172 0.002
2 Year 2 0.2745 0.917
3 Time(Year) 7 5.2616 0.002
4 Site(River) 4 0.79892 0.536
5 RiverxYear 6 0.35627 0.973
6 RiverxTime(Year) 16 3.5025 0.008
7 YearxSite(River) 5 4.7282 0.011
8 Time(Year)xSite(River) 16 1.4499 0.099
9 Residual 286

Assessing translucent environmental water releases in the Murrumbidgee River below Burrinjuck Dam, 1999-2002
23 NSW Office of Water, July 2014
Periphyton Chlorophyll A Mean chlorophyll-a concentrations ranged from ~0.2 mg m-2 (Goodradigbee River, October 2000) to 122.9 mg m-2 (Murrumbidgee River, July 2000) (Appendix B). Overall, samples from the Murrumbidgee contained significantly more chlorophyll-a than those from the Goobarragandra ( pairwise p-perm = 0.0039) and the Goodradigbee Rivers (pairwise p = 0.0050) but not the Tumut (pairwise p=0.4004). No other river comparisons differed significantly.
Chlorophyll-a appeared to decline slightly across time in the Tumut and Goobarragandra rivers, but was unchanged in the Goodradigbee and Murrumbidgee rivers. Despite these apparent patterns, there was not significantly more chlorophyll-a in Murrumbidgee samples at later sample times (Table 11, term 5). Sample occasions within years differed significantly, but not consistently among rivers (Table 11, terms 3 and 6). The significant interaction term appears to be partly due to missing data for some river/time combinations (particularly in association with the Tumut River) but may also be partly due to a decrease in chlorophyll-a at some sites in the Murrumbidgee, Goodradigbee and Goobarragandra rivers at sampling event 7 (coinciding with a large flow event in October 2000).
Figure 15. Mean mass of chlorophyll-a (mg m-2) for each sampling occasion in the Murrumbidgee Goodradigbee, Tumut, and Goobarragandra Rivers. Shading denotes the two sites in each river. Error bars are standard error (n=6 rocks).
0.1
1
10
100
1 2 3 4 5 6 7 8 9 10 11
Chl
orop
hyll a
(mg
m-2
)
0.1
1
10
100
1 2 3 4 5 6 7 8 9 10 11
Sample Time
Murrumbidgee Goodradigbee
Tumut Goobarragandra
1999 2000 2001 1999 2000 2001
Occasion #
Year
Biofilm organic mass Mean organic mass concentrations ranged between 1027 mg m-2 (Goobarragandra River, May 2001) to 36,843 mg m-2 (Murrumbidgee River, November 2001;
Figure 16) (Appendix B). Samples from the Murrumbidgee contained significantly more organic mass than the Goodradigbee, Goobarragandra, and Tumut Rivers (
Figure 16; Table 11, term 1, pairwise p=0.05 for all comparisons). All other river comparisons also differed significantly. PERMDISP did not identify a significant difference in dispersals among river groups, so we considered differences to be statistically significant when p<0.05.

Assessing translucent environmental water releases in the Murrumbidgee River below Burrinjuck Dam, 1999-2002
24 NSW Office of Water, July 2014
Table 11. PERMANOVA univariate tests . See Appendix Bfor notes on adjusted p-values. The number of unique permutations always exceeded 9900.
Source of variation
df Chlorophyll-a Organic mass Inorganic mass Org : Inorg ratio
Pseudo-F P(perm) Pseudo-F P(perm) Pseudo-F P(perm) Pseudo-F P(perm)
1 River 3 4.6425 0.0054 20.1160 0.0001 11.0100 0.0001 3.8053 0.0093
2 Year 2 1.3965 0.2637 1.4847 0.2276 0.7065 0.6679 1.3426 0.2751
3 Time(Year) 7 6.9991 0.0001 4.2120 0.0041 3.0544 0.019 2.1909 0.0768
4 Site(River) 4 0.1484 0.9624 0.2964 0.8923 1.1310 0.3639 0.9191 0.4568
5 RiverxYear 6 0.5174 0.9313 0.9815 0.5058 0.9544 0.5356 1.3938 0.2168
6 RiverxTime (Year)**
16 3.4156 0.0047 3.3118 0.0056 3.6512 0.0031 0.7711 0.7025
7 YearxSite (River)
8 0.1743 0.9906 0.8404 0.5754 0.4279 0.8866 1.5310 0.2116
8 Time(Year)x Site(River)**
22 3.4198 0.0001 1.0965 0.348 1.7872 0.0146 1.3307 0.1450
9 Residual 344
As for chlorophyll-a, organic mass appeared to decline slightly across time in the Tumut and Goobarragandra Rivers and increase slightly in the Murrumbidgee (
Figure 16), although there was no changes in differences among rivers through time (Table 11; term 2, term 5) or significant differences among sample times within rivers (term 6).
Biofilm inorganic mass Mean inorganic mass ranged between 1824 mg m-2 (Goobarragandra River, October 2001) and 142,736 mg m-2 (Murrumbidgee River, November 2001) (Appendix B) . There was significantly more inorganic mass in the Murrumbidgee River than for the other three rivers (Table 10, term 1, pairwise p: vs Goodradigbee = 0.001, vs Tumut = 0.017, vs Goobarragandra <0.001) and more inorganic mass in the Tumut than the Goobarragandra (p= 0.0281) but not the Goodradigbee (p= 0.5871). Again, dispersal did not differ significantly among rivers and so p<0.05 was considered significant.
There were no patterns across time, apparent or otherwise, although sample times did differ significantly within years (Table 11, term 6). Again, this significant interaction may have been partly due to the unbalanced data (particularly for the Tumut River).

Assessing translucent environmental water releases in the Murrumbidgee River below Burrinjuck Dam, 1999-2002
25 NSW Office of Water, July 2014
Figure 16. Mean organic mass (mg m-2) for each sampling occasion in the Murrumbidgee River Goodradigbee, Tumut, and Goobarragandra Rivers. Shading denotes the two sites in each river. Error bars are standard error (n=6 rocks).
100
1000
10000
100000
1 2 3 4 5 6 7 8 9 10 11
Org
anic
mas
s (m
g m
-2)
100
1000
10000
100000
1 2 3 4 5 6 7 8 9 10 11
Sample Occasion
Murrumbidgee Goodradigbee
Tumut Goobarragandra
1999 2000 2001 1999 2000 2001
Occasion #
Year
Biofilm Inorganic:organic mass ratio Organic:inorganic mass ratios ranged between 0.002 and 6.208 (both values recorded for the Murrumbidgee River in 2001; Figure 18) (Appendix B) . Typically, there was more inorganic mass than organic mass in samples from all rivers (i.e. ratios were typically >1). No significant differences in the organic:inorganic mass ratio were observed between rivers, years, or sample occasions (Table 1).

Assessing translucent environmental water releases in the Murrumbidgee River below Burrinjuck Dam, 1999-2002
26 NSW Office of Water, July 2014
Figure 17. Mean inorganic mass (mg m-2) for each sampling occasion in the Murrumbidgee Goodradigbee, Tumut, and Goobarragandra Rivers. Shading denotes the two sites in each river. Error bars are standard error (n=6 rocks).
1000
10000
100000
1000000
1 2 3 4 5 6 7 8 9 10 11
Inor
gani
c m
ass
(mg
m-2
)
1000
10000
100000
1000000
1 2 3 4 5 6 7 8 9 10 11
Sample Occasion
Murrumbidgee Goodradigbee
Tumut Goobarragandra
1999 2000 2001 1999 2000 2001
Occasion #
Year
Figure 18. Mean inorganic:organic mass ratio for each sampling occasion in the Murrumbidgee Goodradigbee, Tumut, and Goobarragandra Rivers. Shading denotes the two sites in each river. Error bars are standard error (n=6 rocks).
0.1
1.0
10.0
1 2 3 4 5 6 7 8 9 10 11
Rat
io o
f ino
rgan
ic :
orga
nic
mas
s
0.1
1.0
10.0
1 2 3 4 5 6 7 8 9 10 11
Sample Occasion
Murrumbidgee Goodradigbee
Tumut Goobarragandra
1999 2000 2001 1999 2000 2001
Occasion #
Year

Assessing translucent environmental water releases in the Murrumbidgee River below Burrinjuck Dam, 1999-2002
27 NSW Office of Water, July 2014
Biofilm periphyton relationship with flow and water quality Periphyton community response Distribution of periphyton groups responded to periods of high flow, with the Murrumbidgee supporting a change from centric diatoms to green unicellular phytoplankton communities as a response to a flow event during Spring 2000 (Figure 14). This had an accompanying response to chlorophyll A concentrations on rock periphyton (Figure 15). Lack of flow events coincided with low populations of periphyton, with higher density after periods of high flow.
Raw flow variables were used as catchment-size corrected flow variables correlated poorly with periphyton community structure, with maximum value of ρ=-0.008.
In the unregulated Goodradigbee River, different patterns existed, with changing dominance from green filamentous communities dominated by Cladophora and Stigeoclonium spp. before and during flow events to those dominated by diatoms and blue green filamentous algae (Gomphonema, Navicula, Melosira, Pseudanabena and Planktolyngbya spp.) after periods of low flow.
The unregulated and forested Goobarragandra indicated a comparatively poor density of periphyton, dominated by filamentous green and blue green algal taxa (Cladophora and Stigeoclonium; Planktolyngbya, Phormidium and Lyngbya spp ).
The Tumut River exhibited long periods of extremely high flows and low flows, with comparatively poor taxa richness dominated by the green filamentous algae Stigeoclonium and Cladophora spp. and the pennate diatoms Cymbella and Gomphonema spp.
Periphyton metrics – antecedent flow BIOENV analysis (Clarke and Warwick 2001) using Spearman Rank correlations of Chlorophyll-a, organic and inorganic mass across all rivers (Table 12), indicated weak, significant correlations related to antecedent flow conditions, particularly for antecedent means, median and maximum flows and organic mass.
Table 12. BIOENV Analysis relating periphyton community structure to antecedent flow conditions (biotic data transformed (square root), no standardisation, quantitative data. Flow data spearman rank correlation. Flow variables reduced by initial PCA analysis, log (X+1) transformation and normalised.
K Best Variable Combination
1 ρ= 0.215
antecedent 30 day median
2 ρ = 0.204
antecedent 30 day median, antecedent 10 day median
3 ρ = 0.217
antecedent 30 day mean, antecedent 30 day median, antecedent 10 day median
4 ρ= 0.205
antecedent 20 day mean, antecedent 30 day mean, antecedent median 10 day, antecedent 30 day median flow

Assessing translucent environmental water releases in the Murrumbidgee River below Burrinjuck Dam, 1999-2002
28 NSW Office of Water, July 2014
Periphyton community composition – antecedent flow BIOENV analysis of the flow relationship to periphyton communities in each river indicated that flow had a more important impact in some rivers than others (Table 13) and responses differed among rivers. For example, antecedent medians and means were more influential in the Murrumbidgee, Goobarragandra and Tumut, whereas in the Goodradigbee antecedent maximum change, maximum fall and maximum flow were more influential. In the Goobarragandra, antecedent flow wasn’t influential at all, with very low Rho values. Antecedent flow variables explained up to 50% of the community structure and were significant. The Goobarragandra River periphyton was not strongly affected by antecedent flows. More aspects of antecedent flow impacted on periphyton communities with means, medians and maximum changes all important. In comparison, the unregulated river periphyton community was more affected by single or at most two flow variables.
Multivariate (BIOENV – Clarke and Warwick 2001) analysis of periphyton/flow relationships across all rivers and times indicated that both antecedent median and mean flows affected periphyton attributes. However there were no strong correlations with flow variables, with analysis explaining less than 22% of the differences in periphyton community structure (Table 13).
Periphyton community composition - water quality BIOENV analysis was also performed to identify which water quality attributes were most important in ordering periphyton community structure (Table 14). Results indicate that water quality weakly explained periphyton community structure across all rivers. As number of water quality variables increased, so did the Rho (ρ) values, indicating that water quality as a whole, rather than single attributes affected periphyton communities. Single river analysis indicated stronger relationships with water quality explaining between 53 and 64 % of the variation in periphyton communities.

Assessing translucent environmental water releases in the Murrumbidgee River below Burrinjuck Dam, 1999-2002
29 NSW Office of Water, July 2014
Table 13. MDS-BIOENV Analysis of Individual Rivers - Periphyton and Antecedent flow. Matching of Periphyton community structure (MDS with centroids, square root transformed data) with BIOENV analysis (periphyton data square root transformed, Bray Curtis dissimilarity, antecedent flow data normalised).
Periphyton MDS (square root transformed, bray curtis dissimilarity, centroids), over all
sampling events
River – Rho (ρ) Values and Best
Combination of Flow Variables
BEST Permutation Distribution (Significance level of sample statistic: 1%)
Murrumbidgee ρ = 0.543
antecedent 10 day mean, antecedent
10 day median antecedent 30 day
median, antecedent 60 day maximum fall
change
Tumut ρ = 0.418 antecedent 30 day mean, antecedent
30 day median, antecedent 60 day
median, antecedent 30 day maximum fall change, antecedent maximum change
Goodradigbee ρ = 0.426
Antecedent maximum flow 90 days, antecedent
maximum fall change 30 days
Goobarragandra ρ = 0.179
antecedent 30 day median
event030405060708091011
0304
050607
08
09
1011
2D Stress: 0.01 BEST
0 0.05 0.10 0.15 0.20 0.25 0.30 0.35 0.40 0.45 0.50 0.55Rho
0
13
Freq
uenc
y
event02040607080910
02
04
06
07
08
0910
2D Stress: 0.04 BEST
-0.05 0 0.05 0.10 0.15 0.20 0.25 0.30 0.35 0.40 0.45Rho
0
15
Freq
uenc
y
event0304060708091011
03
04
06
07
08
09
1011
2D Stress: 0.02 BEST
-0.05 0 0.05 0.10 0.15 0.20 0.25 0.30 0.35 0.40 0.45Rho
0
20
Freq
uenc
y
event020304060708091011
02 03
04
0607
08
09
10 11
2D Stress: 0.09 BEST
-0.08 -0.06 -0.04 -0.02 0 0.02 0.04 0.06 0.08 0.10 0.12 0.14 0.16 0.18Rho
0
22
Freq
uenc
y

Assessing translucent environmental water releases in the Murrumbidgee River below Burrinjuck Dam, 1999-2002
30 NSW Office of Water, July 2014
Table 14. MDS-BIOENV Analysis of Individual Rivers - Periphyton and Water Quality (matching of periphyton community structure (MDS with centroids, square root transformed data) with BIOENV analysis (periphyton data square root transformed, Bray Curtis dissimilarity, antecedent flow data normalised)
Periphyton MDS (sqrt transformed, bray curtis dissimilarity, centroids)
River – Rho Values and Best
Combination of Water Quality
Variables
BEST Permutation Distribution
Murrumbidgee ρ = 0.641
Dissolved Oxygen (% Saturation),
Temperature (deg C), Turbidity (NTU), Mean
Ammonia (mg/L)
Tumut ρ =0.572 electrical
conductivity (uS/cm),temperature, Mean Nox (mg/L) pH
Goodradigbee ρ = 0.639 electrical conductivity (uS/cm), Temperature (deg C),
Mean Ammonia (mg/L)
Goobarragandra ρ =0.536 Mean
Ammonia (mg/L), Dissolved Reactive Phosphorus (mg/L)
event030405060708091011
0304
050607
08
09
1011
2D Stress: 0.01 BEST
0 0.1 0.2 0.3 0.4 0.5 0.6 0.7Rho
0
13
Fre
quen
cy
event02040607080910
02
04
06
07
08
0910
2D Stress: 0.04 BEST
-0.1 0 0.1 0.2 0.3 0.4 0.5 0.6Rho
0
20
Fre
quen
cy
event0304060708091011
03
04
06
07
08
09
1011
2D Stress: 0.02 BEST
0 0.1 0.2 0.3 0.4 0.5 0.6 0.7Rho
0
20
Fre
quen
cy
event020304060708091011
02 03
04
0607
08
09
10 11
2D Stress: 0.09 BEST
0 0.05 0.10 0.15 0.20 0.25 0.30 0.35 0.40 0.45 0.50 0.55Rho
0
14
Fre
quen
cy

Assessing translucent environmental water releases in the Murrumbidgee River below Burrinjuck Dam, 1999-2002
31 NSW Office of Water, July 2014
Discussion Did translucency restore flow variability to the Murrumbidgee River? During translucent releases, flows to the Murrumbidgee were both less constant and more variable relative to flows during the preceding four years. Constancy, measured using Colwell’s index, declined from 0.66 to 0.56 while the coefficient of variation increased from 1.18 to 1.39. The number of rises and high spells also increased in the Murrumbidgee for the same period. By contrast, variability in the control stream (Tumut) declined during the flow releases, even though increased flow variability in the two reference streams demonstrated that flow variability increased across the region. The lack of inflows to the Murrumbidgee between Burrinjuck Dam and the gauge used for this analysis suggests the observed increase in flow variability can be attributed to translucency.
Although variability increased, the overall effect of translucency on the flow regime of the Murrumbidgee River appears minor relative to flows for water delivery. Between 1999 and 2001 translucent releases comprised just 2.98. 5.62 and 3.79 percent (in respective years) of the mean annual Burrinjuck releases of the Murrumbidgee River. They do comprise appreciable percent of inflows of 15.1, 22.5 and 24.4% for 1999-2001 respectively (Table 4). Water delivered for irrigation accounted for most of the annual flow volume, although the exact volume for irrigation cannot be separated from environmental water as environmental flows are not protected from extraction. As these deliveries occurred during summer, peak flows remained skewed away from spring. The effect of translucency on both flow volume and variability, appear relatively minor.
Were periphyton impacted by regulation? We predicted that if regulation were impacting on biofilms then both biofilm mass and the proportion of late-stage periphyton colonists would be greater in the regulated Tumut River (and possibly the Murrumbidgee, depending on the impact of translucency) than the two reference streams. We found evidence for increased accrual but not compositional changes associated with regulation in the two regulated streams. There is evidence elsewhere (Biggs 2000b) that in streams with long accrual times (lack of scouring) small inputs of nutrients may greatly increase biomass. In addition, extreme patchiness of biofilms in rivers, their dynamic relationship with current velocity and nutrient availability lead to lack of predictive reliability. And patchy biofilm distributions create difficulties for field sampling and experimental design (Morin & Cattaneo 1992).
Overall, samples from the Murrumbidgee contained significantly more chlorophyll-a (overall mean 19.7 mg m-2) than from the two reference rivers (overall mean 3.28 and 3.48 mg m-2) and contained more organic and inorganic material than all other rivers (the next closest being the Tumut River). This higher biomass is consistent with biofilms from other regulated rivers.
The unregulated river assemblage comprised higher percentages of blue green filamentous algae, in particular Planktolyngbya spp. The dominance of Gomphonema (pollution tolerant), Synedra (common in lowland rivers) and Cladophora (eutrophic and alkaline conditions - Entwistle et al. 1997; high flow rivers – Stevenson1996) in the Murrumbidgee indicated alteration of natural stream systems and the presence of pollution (Biggs 1995). The presence of Stigeoclonium (fast running streams – Entwistle et al. 1997) in the Tumut and Goobarragandra Rivers indicated conditions of high flow velocity and low nutrient status found commonly in montane forested catchment streams. Genus level taxonomic identification didn’t allow further analysis such as endemicity and Australian distribution. The presence of Aulocoseira during the winter months when dam releases would have been below the euphotic zone but not stratified may indicate that the community was not part of the phytoplankton but attached to rocks. One would expect blooms of phytoplankton in summer as the dams released above the euphotic zone as dam levels receded at the end of

Assessing translucent environmental water releases in the Murrumbidgee River below Burrinjuck Dam, 1999-2002
32 NSW Office of Water, July 2014
irrigation seasons. Which is exactly what occurred during the Chlorella bloom of summer 2001 (Thompson, Croke & Takken 2008).
Research from other countries has established thresholds for nuisance biofilm accrual and its impacts on a rivers ecological or societal value (Flinders and Hart 2009). Typically, concentrations of chlorophyll-a exceeding between 100 and 200 mg m-2 are considered nuisance periphyton biomass (Welch et al. 1989; Busse, Simpson & Cooper 2006). Biggs (2000a) lists thresholds of 120 of chlorophyll-a mg m-2 and 35 g m-2 of AFDM as a nuisance biofilm for aesthetics, recreation, and angling in gravel/cobble bed New Zealand streams, and 15 mg m-2 chlorophyll-a for periphyton impacts on invertebrates. These values are based on correlative studies of biofilms and ecosystem attributes in a small number of ecosystems and may be of limited use in Australian rivers. However, these thresholds illustrate the kind of biofilm development that might occur in regulated and otherwise impacted rivers.
Despite having greater mass than in reference streams, periphyton in the Murrumbidgee were dominated by diatoms and contained, proportionally, the least filamentous algae of the four rivers. In part, this finding is driven by high densities of the diatom Aulocoseira in the Murrumbidgee. This genus has since been classified into two separate genus, Aulocoseira with a free-floating growth form and Melosira which grows attached to rocks and other surfaces (Entwistle et al.1997; Bormans and Webster 1999). However, this genus was not differentiated for the present work.
The higher proportion of diatoms in the Murrumbidgee River might thus be due to free-floating Aulocoseria flushed downstream after having grown in Burrinjuck Dam rather than attached Melosira. However, the continued presence of Aulocoseira during winter, when releases would have been from below the euphotic zone, suggests the attached form occurred locally rather than flushed from upstream.
There is evidence that increasing flow velocity leads to increased diatom biomass with simultaneous reduction in AFDM and chlorophyll A (Biggs and Hickey 1994; Biggs 1995), however there was no such patterns identified during this study. Trends between measured flow above in situ rocks and dominant algal groups and Chlorophyll A only registered minor positive trends. Moreover, while Aulocoseira dominated periphyton communities in the Murrumbidgee, other diatoms, such as Gomphonema and Synedra, were also particularly abundant.
Periphyton in the Tumut River below Blowering Dam appeared typical of regulated rivers, containing more filamentous algae consistent with altered high flow velocity events and periods of unseasonal low flows (Stevenson 1996). However, periphyton at reference sites also contained high proportions of filamentous algae. We expected biofilm thickness and composition to be correlated, with more filamentous algae and relatively fewer diatoms comprising thicker biofilms in the Tumut and Murrumbidgee Rivers.
Diatom mucilage is known to increase in thickness with increased flow and Froude number in New Zealand rivers with low levels of nutrients (Biggs 1995). This leads to increased diatom mats, but with corresponding higher AFDM but less chlorophyll A. This suggests that flow velocity may increase periphyton communities, both diatoms and filamentous algae, rather than that expected for this hypothesis. Increases in flow velocity stimulate nutrient update rates, photosynthesis, respiration and reproduction rates (Stevenson 1996). In nutrient rich waters, there is a wide range of flow velocities (between 8 and 50 cm s-1) so it is difficult to identify a fixed threshold velocity to predictively manage periphyton community structure.
Elsewhere, flow has been established as the key driver of biofilms. In New Zealand, chlorophyll A was found to be strongly and negatively associated with flow velocity (Biggs and Gerbeauz 1993). But there appears to be high levels of unpredictability between flow velocity and algal biomass (Stevenson 1996) with optimum velocity varying between 5-7 cm s-1 to as high as 60 cm s-1 and peak benthic algal biomass highest in velocity ranges of 10-

Assessing translucent environmental water releases in the Murrumbidgee River below Burrinjuck Dam, 1999-2002
33 NSW Office of Water, July 2014
20 cm s-1 (Biggs and Gerbeaux 1993) and up to 60ms-1 (Horner et al. 1990). In the lower Murrumbidgee, Ryder (2004) estimated that flow velocities of >0.3ms-1 (30 cm s-1) were needed to reset the succession of epixylic biofilms. These thresholds have since been adopted by environmental flow programs in other systems highlighting the need for this specific level of knowledge for environmental flow management as well as its lack of availability. Watts and Ryder (2001), who also examined biofilms in the Murrumbidgee during environmental flows, found percent organic mass was the only biofilm attribute that correlated significantly with antecedent flow, although both Biggs (2000b) and Stevenson (1996) provide ample evidence of other attributes that are also similarly affected. However, scouring may not be necessary to circumvent biofilm maturation. For example, Rodriguez (1994) found that small fluctuations favoured early successional species without needing to scour, creating intermediate biofilms. And Stevenson (1996) highlighted the complex nature of biofilm dynamics, with high flows stimulating growth of filamentous Cladophora spp. Our findings also suggest a stronger link between periphyton and water quality than with antecedent flow, which also contravenes our conceptual model.
Although we observed a substantial reduction in biofilm mass following larger flow events, suggesting flow is important, these effects may be relatively short-lived. The temporal resolution of our sampling means this could not be adequately tested. We can conclude that regulation has impacted on the accrual of river biofilms and on the genus composition of epilithic periphyton, but are unable to determine whether flow or some other artefact of regulation is most responsible for these differences. Our results however suggest that aspects of water quality; dissolved oxygen, ammonia, turbidity and temperature were important in differentiating periphyton communities in the Murrumbidgee River. Other aspects known to affect periphyton community resilience and resistence in disturbed systems such as downstream of dams include frequency of disturbances but also substrate size and antecedent dessication for example (Larned 2010; Peterson 1996)
Did biofilm mass and composition shift away from a regulated condition and toward reference conditions? Without data from before the translucency rules altered flows to the Murrumbidgee we cannot directly test whether biofilms shifted in response to the observed increase in flow variability. We sought evidence for a gradual change in biofilms after translucent flows commenced (i.e. to see if biofilm responses lagged behind increased flow variability) and also by comparing biofilms between the Murrumbidgee and Tumut rivers. Some minor temporal trends were observed in the data. Biofilms respond rapidly to environmental change, making them a valuable tool for monitoring ecological impacts (Burns and Ryder 2001). But this also means timescales of recovery for biofilms may also be relatively rapid. McCormick and Stevensen (1991) reported a substantial increase in algal biovolume in biofilms between 8 and 12 days and patchy recolonisation after 6 days (Matthei et al. 2003). This means that, depending on the degree of disturbance and rate of regrowth/succession, algal biomass might be either higher or lower following.
Upstream impacts on water quality in the Murrumbidgee catchment (Hardwick et al. 2012a) mean that underlying eutrophication may drive periphyton communities; that dam release management centred mostly on irrigation supply and other impacts of regulation may mitigate against periphyton mass and composition toward long term reference condition. It seems unlikely that such trends would be consistent enough through space and time to determine at what stage in succession sampling occurs. We found some limited evidence that some flows could increase scour, but suggest biofilms recovered in the intervening period between. We found no evidence of changes to biofilms in the Murrumbidgee over longer timescales.

Assessing translucent environmental water releases in the Murrumbidgee River below Burrinjuck Dam, 1999-2002
34 NSW Office of Water, July 2014
The use of environmental flows to manage periphyton in the Murrumbidgee River Although we found little evidence that translucency benefitted periphyton, this may also be due to effect size and experimental power rather than evidence for a lack of response. What scale of change in flow is required to affect (i.e. scour) biofilms in the Murrumbidgee and what scale of change to biofilms is needed for recovery? This study was designed to detect a relatively coarse change in periphyton, and not to examine the mechanisms of overall biofilm loss or accrual. This lack of power is typical of periphyton research owing to the patchiness of periphyton and its complex relationships to environmental variables (Larned 2010). However, these mechanisms are central to the conceptual model we use to predict ecological responses and understanding them is necessary to fully explain why no change was observed. For example, without knowing what magnitude of flow disturbs biofilms in any of the studied rivers, we are unable to examine whether translucency increased the frequency of disturbance events and might be expected to cause any long-term change. To scour biofilms frequently enough to enable a long-term resetting of succession this would theoretically mean disturbance frequency must exceed the rate of biofilm regrowth and maturation. Predicting an appropriate disturbance frequency means these growth rates need to be quantified. Assuming this was the case prior to regulation, and assuming biofilms are able to recover in as little as four weeks, then translucent flows would need to achieve scouring approximately once per month to meet hypothesis 4. Whether this is possible, or even necessary, requires more detail studies of biofilm flow relationships.
Scouring may not be strictly necessary to initiate changes in biofilm composition (e.g. Rodriguez 1994). Moreover, in the absence of frequent scour, our data suggest water quality may be disproportionately important to periphyton communities in the Murrumbidgee (Hardwick et al. 2012a). Evidence of longitudinal patterns in nutrient cycling and periphyton (Mulholland et al. 1995), suggests that nutrient cycling instream supports downstream algal nutrient supply. This suggests that increased and shorter term variability that creates scouring may be important for downstream productivity. So translucent releases per se are important, not just for localised scouring, but for nutrient cycling and downstream river health.
A single bloom of Chlorella after a flow event in the Murrumbidgee illustrated the significant patchy nature of algal dynamics in the rivers. The source of such a bloom by the planktonic Chlorella is uncertain and is likely to have originated upstream in Burrinjuck dam. Dam operators report that at the time of the bloom, penstock changes were made with releases made from a different limnetic layer. So drift could be an important mechanism of distribution of algal communities (Robson et al. 2008), but provides uncertainty in analyses of the periphyton community and environmental flows. It did, however, provide a suggestion of a further impact of regulation.
Considerations for future environmental monitoring Biofilms remain a powerful tool for monitoring ecosystem responses to environmental flows. Any future sampling in the Murrumbidgee River should consider the following:
• The mechanisms linking biofilms to flow need to be clearly understood. Hydraulic modelling provides a useful way to predict broad-scale impacts of environmental flows, but relies on adequate information relating flow with biofilms.
• Future studies should focus on thresholds for biofilm scouring and rates of biofilm regrowth. Both are likely to be affected by season and nutrient availability. These studies should consider the importance of limiting relationships rather than seeking central tendency ((Downes et al. 2002). Given the added complexity of seasonality, such studies could initially focus on times of peak biofilm accrual and/or sample intensively during periods before and after flows are released.

Assessing translucent environmental water releases in the Murrumbidgee River below Burrinjuck Dam, 1999-2002
35 NSW Office of Water, July 2014
• Biofilm monitoring should be conducted in a way that ensures complementarity of sampling, but shouldn’t overlook the needs of individual projects. Sampling for periphyton and chlorophyll A may need different sampling techniques; sampling for periphyton and invertebrates may require different temporal scales. This adds to complexity and cost of environmental flow projects and mitigates against broadscale ecological studies in favour of single indicator studies. Disadvantages of such studies include a lack of strong inference across ecosystem response. Periphyton respond quickly to nutrients delivered by bottom releases from Burrinjuck dam. It is therefore a degraded reach and acting as an ‘assimilation zone’. Monitoring must reflect temporal changes of indicators – a smaller temporal scale for periphyton and other biofilm attributes and larger temporal scale for invertebrates. This monitoring then becomes event monitoring rather than long term condition and improvement monitoring which will not deliver results due to other underlying dynamics of flow, water quality, irrigation flows and weather conditions.
• A particular issue with monitoring periphyton is the risk of drift of phytoplankton which is included in the periphyton samples. So taxonomic resolution must be at an adequate scale to identify phytoplankton drift
• For categorical models of the type used here, variability at fine spatial scales is pooled when testing for differences at the level of interest. Future designs should consider pooling samples before samples are processed so that more effort can be put toward sampling either on more occasions or at more sites to increase statistical power. Significant high order interaction terms suggest more samples or more stratum were needed in the design.
Considerations for re-evaluating the Murrumbidgee Water Sharing Plan • The relatively small amount of flows that are varied by translucency are overshadowed by
extensive irrigation flows later in summer. Achieving flow variability within this constraint will be difficult – environmental benefit assists the Murrumbidgee River downstream of Burrinjuck dam for only part of the year.
• Translucency restores some variability downstream of Burrinjuck that would not occur otherwise. Small pulses scour riffle rocks and reset periphyton succession. The material scoured off becomes part of downstream productivity, fuelling food webs. If this happens relatively often, there is an ongoing source of nutrients. If it happens irregularly and in large quantities, it creates pulses of nutrients with lack of nutrients between pulses. So irregular scouring releases relative often that may mimic natural variability is intuitively better practice than large releases occurring only rarely. Different temporal scales of flow variation are both important with large scale temporal events affecting ecosystems through ‘drag-disturbance’ effects while small scale flow variations affect ecosystems through mass transfer processes and those between creating complexity of effect depending on dynamics of variability( Biggs et al. 2005). Flow variability is not explicitly stated as a performance indicator in the past water sharing plan.
• Studies across NSW have addressed other aspects of translucent releases. There needs to be a Statewide synthesis of translucency to pull together all of the evidence for impact of these releases to inform planning for remakes of water sharing plans and development of new ones.
• The translucency rule in the Murrumbidgee is complicated and difficult to administer. At times, releases have not followed the rules exactly and operators have found daily release operations difficult. Translucency as an objective in water sharing plans is a useful tool in increasing downstream variability, but design could be improved. One solution would be to have a fixed translucency, say 30% of inflows. Other options would

Assessing translucent environmental water releases in the Murrumbidgee River below Burrinjuck Dam, 1999-2002
36 NSW Office of Water, July 2014
be to tie translucent releases to end of system flow releases so that variability continues through the river system.
• Other factors impinging on biofilms dynamics and periphyton communities include water quality, rates of rise and recession (both a feature of dam releases)’ drift’ and grazing by invertebrates (Chessman et al. 2009). It is inappropriate to use a single indicator of response to measure the usefulness of a flow rule, especially one which is so dynamic and difficult to measure.
• More recent management of releases from similar dams such as Dartmouth dam in Victoria recommend series of pulsing flows to deliver water downstream. Modelling of such flow regimes is recommended as a possible component of a future translucency flow rule.

Assessing translucent environmental water releases in the Murrumbidgee River below Burrinjuck Dam, 1999-2002
37 NSW Office of Water, July 2014
References Anderson, MJ 2001, A new method for non-parametric multivariate analysis of variance,
Austral Ecology, vol. 26, pp.32–46.
Anderson, MJ 2005, PERMANOVA, a FORTRAN computer program for permuational multivariate analysis of variance, Department of Statistics, University of Auckland, New Zeland.
APHA-AWWA-WEF, Standard Methods for the Examination of Water and Wastewater, 20th edition, 1998, APHW Washington USA.
Baker PD, Fabbro LD, 2002, A guide to the identification of common blue-green algae (Cyanoprokaryotes) in Australian freshwaters, Cooperative Research Centre for Freshwater Ecology.
Bergy, EA, Boettiger, CA, Resh, VH 1995, Effects of water velocity on the architecture and epiphytes of Cladophora (Chlorophyta). Journal of Phycology, vol.31, no. 2, pp.64-271.
Biggs, BJF 1995, The contribution of flood disturbance, catchment geology and and use to the habitat template of periphyton in stream ecosystems, Freshwater Biology, vol.33, pp.419-438.
Biggs, BJF, 2000a, Eutrophication of streams and rivers, dissolved nutrient-chlorophyll relationships for benthic algae, Journal of the North American Benthological Society, vol.19 no.1, pp.17-31.
Biggs, BJF, 2000b, New Zealand, periphyton guideline, NIWA, Christchurch, New Zealand.
Biggs, BJF, Close, ME, 1989, Periphyton biomass dynamics in gravel bed rivers, the relative effects of flows and nutrients, Freshwater Biology, vol.22, pp.209-231.
Biggs, BJF, Gerbeaux, P 1993, Periphyton development in relation to macro-scale (geology) and micro-scale (velocity limiters in two gravel-bed rivers, New Zealand, New Zealand Journal of Marine and Freshwater Research, vol.27, pp.39-53.
Biggs, JF, Hickey, CW 1994, Periphyton resonses to a hydraulic gradient in a regulated river in New Zealand, Freshwater Biology, vol.32, pp.49-59.
Biggs, BJF, Nikora, VI, Snelder, TH 2005, Linking scales of flow variabiity to lotic ecosystem structure and function, River Research and Applications, vol.21, pp.283-298.
Bormans, M, Webster, IT 1999, Modelling the spatial and temporal variability of diatoms in the River Murray, Journal of Plankton Research, vol.21, no.3, pp.589-598.
Bunn, SE, Davies, PM, Mosisch, TD 1999, Ecosystem measures of river health and their response to riparian and catchment degradation, Freshwater Biology, vol.41, pp.333–345.
Burns, A, Ryder, DS 2001, Potential for biofilms as biological indicators in Australian riverine systems, Ecological Management & Restoration vol.2 no.5, pp.3–64.
Burns, A, Walker, KF 2000a, Biofilms as food for decapods (Atyidae, Palaemonidae) in the River Murray, South Australia, Hydrobiologia vol.437, pp.83–90.
Burns, A, Walker, KF 2000b, Effects of water level regulation on algal biofilms in the River Murray, South Australia, Regulated Rivers, Research & Management vol.16, pp.433–444.
Busse, LB, Simpson, JC, Cooper, SD 2006, Relationships among nutrients, algae, and land use in urbanized southern California streams, Canadian Journal of Fisheries and Aquatic Sciences vol.63, pp.2621–2638.

Assessing translucent environmental water releases in the Murrumbidgee River below Burrinjuck Dam, 1999-2002
38 NSW Office of Water, July 2014
Chessman, B, Jones, H 2001, Integrated monitoring of environmental flows, design report. Land and Water Conservation, Sydney.
Chessman, BC, Westhorpe, DP, Mitrovic, SM, Hardwick, L 2009, Trophic linkages between periphyton and grazing macroinvertebrates in rivers with different levels of catchment development, Hydrobiologia, vol.625, pp.135-150.
Clarke, KR, Warwick, RM, 2001, Change in marine communities, an approach to statistical analysis and interpretation, 2nd edition. PRIME - Plymouth.
Colwell, RK, 1974, Predictability, Constancy, and Contingency of Periodic Phenomena. Ecology, vol.55, no. 1, pp.148–1153.
Davies, AL, Gee, JHR 1993, A simple periphyton sampler for algal biomass estimates in streams, Freshwater Biology, vol. 30, pp.47–51.
DIPNR 2004, A guide to the Water Sharing Plan for the Murrumbidgee Regulated River Water Source. Department of Infrastructure, Planning, and Natural Resources, Sydney.
Dodds, WJ, Biggs, BJ 2002, Water velocity attenuation by stream periphyton and macrophytes in relation to growth form and architecture, Journal of the North American Benthological Society, vol.21, no.1, pp.2-15.
Doeg, T, Lake, PS 1981, A technique for assessing the composition and density of the
macroinvertebrate fauna of large stones in streams, Hydrobiologia, vol.80, pp.3–6.
Downes, BJ, Barmuta, LA, Fairweather, PG, Faith, DP, Keough, MJ, Lake, PS, Mapstone, BR, Quinn, GP 2002, Monitoring Ecological Impacts, concepts and practice inflowing waters. Cambridge University Press, Cambridge UK.
Entwisle, TJ, Sonneman, JA, Lewis, SH, 1997, Freshwater algae in Australia, a guide to conspicuous genera. Sainty & Associates.
Flinders, CA, Hart, DD 2009, Effects of pulsed flows on nuisance periphyton growths in rivers, a mesocosm study, River Research and Applications, vol.25, pp.1320–1330.
Gan, KC, McMahon, TA, Finlayson, BL, 1991, Analysis of periodicity in streamflow and rainfall data by Colwell’s indices, Journal of Hydrology, vol.123, pp.105–118.
Gawne, B, Lake, PS 1995, Effects of microspatial complexity on a herbivore-epilithon interaction in an Australian upland stream, Freshwater Biology, vol.33, pp.557-565.
Gordon, ND, McMahon, T, Finlayson, B 2004, Stream hydrology, an introduction for ecologists. John Wiley and Sons, Chichester.
Graham, AA 1990, Siltation of stone-surface periphyton in rivers by clay-sized particles from low concentrations in suspension, Hydrobiologia, vol.199, pp.107–115.
Growns, J, Marsh, N 2000, Characterisation of flow in regulated and unregulated streams in eastern Australia, CRC for Freshwater Ecology, Albury N.S.W.
Hardwick, L, Chessman, B, Westhorpe, DP, Mitrovic, SM 2012a, Assessing translucent environmental water release in the Murrumbidgee River below Burrinjuck Dam 1999-2002, Report 2 - Water quality, NSW Office of Water, Sydney.
Hardwick, L, Chessman, BC, Westhorpe, D, Mitrovic, SM 2012b, Assessing translucent environmental water release in the Murrumbidgee River below Burrinjuck Dam 1999-2002, Report 1 – Background. Regulated and unregulated rivers of the Murrumbidgee catchment and the effect of translucent releases – an Integrated Monitoring of Environmental Flows background report, NSW Office of Water, Sydney.
Horner, RR, Welch, EB, Seeley, MR, Jacoby, JM 1990, Responses to peripyhton to changes in current velocity, suspended sediment and phosphorus concentration, Freshwater Biology, vol.24, pp.215-232.

Assessing translucent environmental water releases in the Murrumbidgee River below Burrinjuck Dam, 1999-2002
39 NSW Office of Water, July 2014
Larnad, ST 2010, A prospectus for periphyton, recent and future ecological research, Journal of the North American Benthological Society, vol.29, no.1, pp.182-206.
Lock, M 1993, Attached microbial communities in rivers, In, Aquatic Microbiology. (Ed. T. Ford), Blackwell.
Lower, RL, Guckert, JB, Belanger, SE, Davidson, DH, Johnson, DW, 1996, An evaluation of periphyton community structure and function on tile and cobble substrata in experimental stream mesocosms, Hydrobiologia, vol.328, pp.135–146.
Marsh, NA, Stewardson, MJ, Kennard, MJ, 2003, River Analysis Package. CRC for Catchment Hydrology, Monash University, Melbourne.
Matthaei, CD, Guggelberger, C, Huber, H 2003, Local disturbance history affects patchiness of benthic river algae, Freshwater Biology, vol.48, pp.1514–1526.
McCormick, PV, Stevenson, RJ 1991, Mechanisms of Benthic Algal Succession in Lotic Environments, Ecology, vol.72, pp.1835–1848.
Morin, A, Cattaneo, A 1992, Factors affecting sampling variability of freshwater periphyton and the power of periphyton studies, Canadian Journal of Fisheries and Aquatic Sciences, vol.49, pp.1695–1703.
Mulholland, P 1996, Role in nutrient cycling in streams, In, Algal Ecology. Freshwater Benthic Ecosystems, Stevenson RJ, Bothwell ML, Lowe RL (eds). Academic Press, New York; pp. 609–640. Academic Press, San Diego.
Mulholland, PJ, Marzolf, ER, Hendricks, SP, Wilkerson, RV, Baybayan, AK 1995, Longitudinal patterns of nutrient cycling and periphyton characteristics in streams, a test of upstream-downstream linkage, Journal of the North American Benthological Society, vol.14, no.3, pp.357-370.
NSW Office of Water (2011a) Modelling - NSW Office of Water flow modelling database - IQQM model
NSW Office of Water 2011b, Real-time water data. NSW Office of Water Hydstra database. Kisters Ltd.
NSW Government 2006, Water Quality Objectives for NSW Waterways. NSW Government, Sydney
Olden, JD, Poff, NL 2003, Redundancy and the choice of hydrologic indices for characterising streamflow regimes, River Research and Applications, vol.19, pp.101–121.
Palmer, MA, Bernhardt, ES, Allan, JD, Lake, PS, Alexander, G, Brooks, S, 2005, Standards for ecologically successful river restoration, Journal of Applied Ecology, vol.42, pp.208–217.
Peterson, CG 1996, Response of benthic algal communities to natural physical disturbance, In, Algal Ecology. Freshwater Benthic Ecosystems, Stevenson RJ, Bothwell ML, Lowe RL (eds). Academic Press, New York; pp. 375–403.
Passy, SI, Larson, CA 2011, Succession in Stream Biofilms is an Environmentally Driven Gradient of Stress Tolerance, Microbial Ecology, vol.62, pp.414–424.
Poff, NL, Allan, JD, 1995, Functional Organization of Stream Fish Assemblages in Relation to Hydrological Variability, Ecology, vol.76, pp.606.
Poff, NL, Allan, JD, Bain, MB, Karr, JR, Prestegaard, KL, Richter, BD, 1997, The natural flow regime, a paradigm for river conservation and restoration, BioScience, vol.47, pp.769–784.
Poff, NL, Richter, BD, Arthington, AH, Bunn, SE, Naiman, RJ, Kendy, E, et al. 2010, The ecological limits of hydrologic alteration (ELOHA), a new framework for developing regional environmental flow standards, Freshwater Biology, vol.55, pp.147–170.

Assessing translucent environmental water releases in the Murrumbidgee River below Burrinjuck Dam, 1999-2002
40 NSW Office of Water, July 2014
Prescott, GW 1978, How to know the freshwater algae, 3rd Edition, W. C. Brown: McGraw-Hill, Boston Massachusetts, USA.
Robertson, AI, Bunn, SE, Walker, KF, Boon, PI 1999, Sources, sinks and transformations of organic carbon in Australian floodplain rivers, Mar. Freshwater Res, vol.50, pp.813–829.
Robson, BJ, Matthews, TG, Lind, PR, Thomas, NA 2008, Pathways for algal recolonization in seasonally-flowing streams, Freshwater Biology, vol 53, no.12, pp.2385-2401.
Rodriguez, MA, 1994, Succession, environmental fluctuations and stability in experi-mentally manipulated microalgal communities, OIKOS, vol.70, pp.107-120.
Ryder, DS 2004, Response of epixylic biofilm metabolism to water level variability in a regulated floodplain river, Journal of the North American Benthological Society, vol.23, pp.214–223.
Ryder, D, Vink, S, Bleakley, N, Burns, A 2007, 'Managing sources, sinks and transport of natural contaminants in regulated rivers, a case study in the Murrumbidgee River catchment, NSW'. Proceedings of the 5th Australian Stream Management Conference. Australian rivers, making a difference. Charles Sturt University, Thurgoona, New South Wales.21-25 May 2007, pp354-359.
Sabater, S, Guasch, H, Romani, A Muñoz I 2002, The effect of biological factors on the efficiency of river biofilms in improving water quality, Hydrobiologia, vol.469, pp.149–156.
Sarnelle, O, Kratz, KW, Cooper, SD, 1993, Effects of an invertebrate grazer on the spatial arrangement of a benthic microhabitat, Oecologia, vol.96, pp.208-218.
Sekar, R, Nair, KV, Rao, VN, Venugopalan, VP, 2002, Nutrient dynamics and successional changes in a lentic freshwater biofilm, Freshwater Biology, vol.47, pp.1893–1907.
Sheldon, F, Walker, KF 1997, Changes in biofilms induced by flow regulation could explain extinctions of aquatic snails in the lower River Murray, Australia, Hydrobiologia, vol.347, pp.97–108.
Stanford, JA, Ward, JV, Liss, WJ, Frissel, CA, Williams, RN, Lichatowich, JA, et al. 1996, A general protocol for restoration of regulated rivers, Regulated Rivers, Research and Management, vol.12, pp.391–413.
Steinman, AD, McIntire, CD 1990, Recovery of lotic periphyton communities after disturbance, Environmental Management, vol.14, pp.589–604.
Stevenson, RJ, 1996, The stimulation and drag of current,. In Algal Ecology, Freshwater Benthic Ecosystems, Stevenson RJ, Bothwell ML, Lowe RL (eds). Academic Press, New York; pp.321–340.
Thompson, CJ, Croke, J, Takken, I 2008, A catchment-scale model of mountain stream channel morphologies in southeast Australia, Geomorphology, 10/016/j.geomorph.2007.05.015
Tuji, A 2000, The Effect of Irradiance on the Growth of Different Forms of Freshwater Diatoms, Implications for Succession in Attached Diatom Communities, Journal of Phycology, vol.36, pp.659–661.
Uehlinger, U, Kawecka, B, Robinson, CT 2003, Effects of experimental floods on periphyton and stream metabolism below a high dam in the Swiss Alps (River Spol), Aquatic Sciences, vol.65, pp.199-209.
Villeneuve, A, Bouchez, A, Montuelle, B 2011, In situ interactions between the effects of season, current velocity and pollution on a river biofilm, Freshwater Biology, vol.56, pp.2245–2259.

Assessing translucent environmental water releases in the Murrumbidgee River below Burrinjuck Dam, 1999-2002
41 NSW Office of Water, July 2014
Vymazal, J 2007, Removal of nutrients in various types of constructed wetlands, Science of the Total Environment, vol.380, pp.48–65.
Vymazal, J 1988, The use of periphyton communities for nutrient removal from polluted streams, Hydrobiologia, vol.166, pp.225–237.
Wallbrink, P, Olley, J, Murray, A, Olive, L 1996, The contribution of subsoil to sediment yield in the Murrumbidgee River basin, New South Wales, Australia, IAHS Publications-Series of Proceedings and Reports-Intern Assoc Hydrological Sciences vol.236, pp.347–356.
Watts, R, Ryder, D 2001, Developing Biological Indicators for the Assessment of Environmental Flows, Australian Journal of Water Resources vol. 5, pp.119-122.
Welch, EB, Horner, RR, Patmont, CR 1989, Prediction of nuisance periphytic biomass, A management approach, Water Research, vol.23, pp.401–405.
Wilde, EW, Benemann, JR 1993, Bioremoval of heavy metals by the use of microalgae, Biotechnology Advances, vol.11, pp.781–812.
Yarnell, SM, Viers, JH, Mount, JF 2010, Ecology and management of the spring snowmelt recession, BioScience, vol.60, pp.114-127.

Assessing translucent environmental water releases in the Murrumbidgee River below Burrinjuck Dam, 1999-2002
42 NSW Office of Water, July 2014
Appendix A, Hydrological indicators Table A1 Hydrological variables used for in analyses
Hydrological Variable Short name
30 day antecedent median 30 day median
60 day antecedent median 60 day median
90 day antecedent median 90 day median
Maximum 30 day antecedent flow max flow 30
Maximum 60 day antecedent flow max flow 60
Maximum 90 day antecedent flow max flow 90
Maximum change 5 day antecedent flow max change 5
Maximum change 10 day antecedent flow max change 10
Maximum change 20 day antecedent flow max change 20
Maximum change 30 day antecedent flow max change 30
Maximum change 60 day antecedent flow max change 60
Maximum change 90 day antecedent flow max change 90
Antecedent mean flow 10 days ant mean 10
Antecedent mean flow 20 days ant mean 20
Antecedent mean flow 30 days ant mean 30
Antecedent mean flow 60 days ant mean 60
Antecedent mean flow 90 days ant mean 90
Maximum fall in antecedent flows 30 days fall change 30
Maximum fall in antecedent flows 60 days fall change 60
Maximum fall in antecedent flows 90 days fall change 90
Principal Components Analysis (Statistica Version 6.1) of the hydrological variables predictably indicated that there are strong correlations within groups of flow variables. Flow variables related to means and medians (group1), maximum flow (group 2), maximum change (group 3) and fall change (group 4) were all closely correlated. Many of the hydrological variables were providing redundant information. Such redundancy in hydrological variables is well known (Olden and Poff 2003).
With all of the flow variables contributing more or less evenly to the first Principal Coordinate, and that describing around 70% of the variance between the variables (figure 18), it was not necessary to use all of the variables to discriminate between biological groups. It was decided to choose one ecologically relevant variable from each grouping as identified in the eigenvector diagram (Figure 18) for use in the analysis.

Assessing translucent environmental water releases in the Murrumbidgee River below Burrinjuck Dam, 1999-2002
43 NSW Office of Water, July 2014
Figure A1. Principal components diagram (factor 1 versus factor 2) Antecedent flow variables
Table A2. Principal Components Analysis - Highest Eigen values
Hydrological Variable Highest Value
Antecedent mean 30 days 0.458397
Antecedent mean 60 days 0.510095
Antecedent 5 day median 0.562840
Antecedent 10 day median 0.395181
Maximum 60 day antecedent flow 0.408400
Maximum 60 day antecedent fall 0.315382
Maximum 30 day antecedent change
0.344511
Froude No. 0.467570
Duration of rising (RLD)and falling limb (FLD) within the river downstream of Burrinjuck Dam were found to be short, with changes in flow of, on average 1,500 ML per hour and with gauge height changes of up to half a metre (50 cm) per hour (Figures 16 and 17).
Projection of the variables on the factor-plane ( 1 x 2)
Active
ant mean 10
ant mean 20 ant mean 30 ant 60 day ant 90 day
5 day median 10 day median
30 day median 60 day median
x flow 30 days x flow 60 days ax flow 90 days
fall change 30 fall change60 fall change 90
Max change 30 max change 60 max change 90
Froude
-1.0 -0.5 0.0 0.5 1.0
Factor 1 : 64.92%
-1.0
-0.5
0.0
0.5
1.0
Factor 2 : 17.30%

Assessing translucent environmental water releases in the Murrumbidgee River below Burrinjuck Dam, 1999-2002
44 NSW Office of Water, July 2014
Figure A2. Burrinjuck Releases and Gauge Height Change, 13 October and 21 November 2000
Figure A3 Rates of Rise and Fall, Unregulated and Regulated Tumut Rivers, 8-20 August 2000
Similar short RLD was evident in the Tumut River, compared to the unregulated rivers. Analysis of hourly flow data between 1999 and 2001 indicated that RLD and FLD were generally shorter while maximum rates of rise and fall in the regulated rivers were much greater. Analysis of hourly gauge height changes during the period of study (Table 6) indicated that while there were rapid natural increases in gauge height in the unregulated rivers, primarily related to storm events, they were comparatively lower than those for the Murrumbidgee and the Tumut Rivers. Natural Maximum FLD in the unregulated rivers was very slow (Figures 13,14) compared to the regulated rivers, reflecting a rate required for natural aquatic systems adaptation.
Table A3. Maximum hourly change in gauge height in metres, during study period 1999-2001
River Maximum Hourly Rise (metres) Date Maximum Hourly
Fall (metres) Date
Murrumbidgee 1.823 20/10/2001 -1.585 03/9/2001
Tumut 0.518 13/10/2001 -0.647 13/10/2001
Goodradigbee 0.228 19/10/2000 -0.053 27/01/2000
Goobarragandra 0.444 17/03/2001 -0.133 28/12/1999

Assessing translucent environmental water releases in the Murrumbidgee River below Burrinjuck Dam, 1999-2002
45 NSW Office of Water, July 2014
Appendix B, Summary data and additional analyses Table B1, Mean, minimum and maximum values for Chlorophyll a, organic mass, inorganic mass and the ratio of organic,inorganic mass for all rivers and years.
River Year Chlorophyll a ( mg/L) Organic mass ( mg/L) Inorganic mass ( mg/L) Org,Inorg Carbon Ratio
Mean Minimum Maximum Mean Minimum Maximum Mean Minimum Maximum Mean Minimum Maximum
Murrumbidgee 1999 13.679993 7.345541 23.18522 7088.582 3514.8 18487.33 20998.17 6607.6813 59049.081 0.426 0.177 0.706
Murrumbidgee 2000 27.132243 0.010912 280.9277 7725.836 1944.122 17981.49 22909.899 1980.4105 138340.3 0.525 0.051 5.300
Murrumbidgee 2001 11.837034 1.101505 45.02335 12525.3 547.5451 144318.8 38004.375 1068.7535 350528.36 0.678 0.002 6.209
Tumut 1999 11.683126 3.194838 42.35675 6437.688 2311.363 12368.56 6247.4215 3823.7598 9021.5151 1.014 0.572 1.570
Tumut 2000 10.063102 0.008173 69.16989 5122.536 897.98 19604.62 22730.244 2434.2343 153872.17 0.674 0.047 5.156
Tumut 2001 3.6677824 0 9.500156 4078.69 1231.311 8756.503 5179.1356 1795.2698 10520.927 0.884 0.270 1.981
Goobarragandra 1999 6.3558467 3.761156 8.492159 2572.214 1853.712 3393.283 3207.8205 1447.3944 5708.8703 0.870 0.594 1.384
Goobarragandra 2000 4.2003409 0 64.33641 1702.669 11.92869 4966.403 5774.2383 988.4589 82617.718 0.585 0.006 1.588
Goobarragandra 2001 1.4313067 0 10.30824 1307.694 307.3456 2558.425 2404.5849 741.20093 6148.2673 0.632 0.089 2.000
Goodradigbee 1999 6.5210527 1.629482 20.49332 5376.062 1332.445 30486.4 8482.9449 1602.8514 27412.14 0.650 0.232 1.116
Goodradigbee 2000 3.0640731 0.007781 18.468 1889.4 216.3042 4285.403 3665.9421 1197.9922 15800.173 0.637 0.073 1.514
Goodradigbee 2001 2.9999405 0 10.79609 2922.541 748.3113 7491.063 5931.9794 1139.2201 42077.358 0.619 0.163 1.963

Assessing translucent environmental water releases in the Murrumbidgee River below Burrinjuck Dam, 1999-2002
46 NSW Office of Water, Jul 2013
Table B2, PERMDISP tests for homogeneity of variances, based on factors of River, Year and Event. Where dispersal differed significantly, a more conservative p-value of <0.005 was adopted.
Factor f df1 df2 p(perm) Perms
Chlorophyll a Rivers 3.9919 3 409 0.011 999
Years 17.9080 2 410 0.001 999
Sampling Events 6.9340 9 403 0.001 999
Organic mass Rivers 0.2671 3 409 0.849 999
Years 3.2372 2 410 0.047 999
Sampling Events 5.5469 9 403 0.001 999
Inorganic mass
Rivers 2.4515 3 409 0.128 999
Years 4.0733 2 410 0.032 999
Sampling Events 7.1366 9 403 <0.001 999
Org,Inorg C Ratio
Rivers 5.0705 3 409 0.003 999
Years 0.7319 2 410 0.5418 999
Sampling Events 2.0297 9 403 0.1042 999
Table B3. Indicator taxa for each of the rivers indicating % contribution to dissimilarity (Similarity of Percentages)
Murrumbidgee Goodradigbee Goobarragandra Tumut
Aulocoseira/Melosira 36.8%
Gomphonema 17% Gomphonema 18.4% Gomphonema 21.9%
Gomphonema 16.4% Cladophora 16% Navicula 16.5% Cladophora 16%
Navicula 9.8% Navicula 12.9% Cladophora 11.8% Navicula 14.3%
Rhoicosphenia 6.4% Aulocoseira/Melosira 8.3%
Cyanobacteria 9.83% Aulocoseira/Melosira 7.94%
Cocconeis 4.24% Cyanobacteria 6.7% Planktolyngbya 6.7% Phormidium (broad) 6.6%