assessing the value of pecan trees - noble research … · 2017-01-19 · can use in determining...
TRANSCRIPT

It is the intent of this publication to provide methodology that appraisers, tax preparers and other interested parties can use in determining the value of pecan trees. Pecan trees are indigenous (native) to the United States. They were first recorded by early explorers during expeditions across America. Native Americans taught them to eat the high qual-ity kernels (“pecans”) found inside the nuts. The trees grew wild and today are referred to as native pecan trees because they occur naturally. Pecan is the only major cultivated nut native to the United States. It is particularly adapted to the Mississippi Valley1, westward into central Oklahoma and Texas, southward into northern Mexico and as far north as northern Illinois. The nuts produced by these native trees are known by their somewhat hard shells and very flavorful kernels.
Over time, landowners have commercialized the pro-duction of nuts produced by pecan trees. Over the last 100 years, pecan researchers have enhanced commercialization of pecans through selection and traditional plant breeding techniques. The result is cultivars (varieties) that produce larger, thinner-shelled nuts. These pecan trees and their nuts are often referred to as “improved” pecans. Propagation is accomplished through grafting of wood from a desirable cultivar onto a seedling or native pecan rootstock. These improved cultivars have been introduced in many other parts of the United States as well as other countries, includ-ing Mexico, South Africa, Israel and Australia.
Today, pecan trees can be found growing across much of the southern United States from the Carolinas to California and as far north as southern Canada. Pecan trees are rarely
by Dan Childs, Job Springer, Charles Rohla and Steve Upson NF-AE-08-01
The Samuel Roberts Noble Foundation Agricultural Division
Assessing the Value of Pecan Trees
found growing naturally in areas that receive less than 30 inches of annual rainfall. However, irrigation technology has allowed plantings to occur in semi-arid regions such as west and southwest Texas, southern New Mexico and Arizona. Be-cause of commercialization, irrigation, the development of more productive cultivars and better production technology, the acreage of pecan trees in the United States increased 20 percent between 1987 and 2002. In Oklahoma, pecan acre-age increased by 91 percent during the same time period.2
In addition to the commercialization of native pecan trees managed as groves in natural environments and those planted and grafted to an improved cultivar in orchards, many homeowners have planted pecan trees or managed a wild seedling tree to enhance the landscape around their houses. Pecan trees make beautiful shade trees and give the homeowner an opportunity for a nice crop of pecans. Reasons for Determining ValueSince citizens of the United States were first given the right to own land, the buying and selling of land quickly ensued. How prices are determined varies by transaction. Some unin-formed buyers will pay above-market prices and uninformed sellers sometimes sell below the market. Market price is the price which an informed seller and an informed buyer agree upon. How do sellers and buyers become informed? Using an appraiser trained to accurately determine the value of property is the best way to determine market price. Apprais-ers are third-party professionals with a strong code of ethics and standards who provide unbiased values. Appraisers, however, have often had difficulty finding credible sources of information about pecan tree values on which to base ap-praisals. The amount a pecan tree contributes to the overall value of the land can be beneficial in assessing overall value of the property by appraisers and an estimate for how much of the purchase price should be allocated to pecan trees for depreciation purposes. In addition, individual pecan tree value can be estimated in situations where condemnation of property with pecan trees is needed to provide right-of-way for utilities, roads, pipelines and/or mineral exploration. Rules for Depreciating a Pecan TreeThe first rule in depreciating any asset is that it has to be busi-ness property. Just because a pecan tree exists on a person’s property does not necessarily mean it can be depreciated — it must be managed for profit. When land is purchased with existing nut-producing pecan trees, a portion of the purchase

price can be allocated to each identified pecan tree in the year of purchase. This establishes the basis for depreciation. The trees are normally depreciated over a 10-year period us-ing the straight-line method.
When pecan trees are planted, the rules for recovering the costs of establishment can be confusing. Farming busi-nesses are required to capitalize all expenses incurred during the preproduction period. Another way of saying this is that all the expenses incurred between planting and the first year of production, often five to seven years, are not deducted and are combined together. This total becomes the basis for depreciation. All the preproductive expenses are then recov-ered over the next 10 years using the straight-line method. However, if a farmer agrees to use the 150 percent declining balance method for depreciable assets (instead of the 200 percent that all other business owners use), then they can ex-pense or deduct all preproduction expenses for animals and plants that have a preproduction period of two years or less.
The Internal Revenue Service has stated that nut trees have a preproduction period of more than two years. There-fore, a farmer establishing a pecan orchard who elects to deduct the preproduction expenses must use the alternative depreciation system (ADS) for all agricultural assets while the election is in effect. The consequence of using ADS is that the recovery periods are longer. For example, breeding animals go from five to seven years, farm equipment from seven to 10 years, and trees or vines bearing fruit or nuts go from 10 to 20 years. If a farmer chooses to capitalize prepro-duction expenses of pecan orchards, then they can use the general depreciation system (GDS) for all agricultural assets, including the pecan orchard. Factors Affecting ValueTo assess the value of a pecan tree, several factors should be considered. First determine the purpose of the specific tree. Pecan trees are valued for their shade and appearance, fire-wood, lumber and nut production. Of these, this publication addresses the value of pecan trees for nut production. The Oklahoma State Forestry Division can help with evaluating trees for forest purposes, and an arborist can assist with valu-ations of shade trees. To value a pecan tree, it is important to know the history of the tree, including how it has been man-aged. A good pecan tree in the proper location with ample space to grow can produce nuts for many years. Typically, unmanaged native trees have little value for nut production. The only real values are firewood, lumber and shade. Inadequate Tree SpacingIf trees are crowded, the potential production of the trees can be negatively affected. Pecan trees produce nuts on the terminal ends of branches. If the trees are crowded, then the number of branches is decreased, which, in turn, decreases the fruit bearing area. Another factor that greatly affects po-tential production of pecans is water and nutrient availabil-
ity. If trees are crowded, then their root systems are stacked on top of each other. For example, if you have a tree that is 60 feet tall, then the root system for that tree is at least 60 feet on each side of the trunk. Therefore, there is at least a 120-foot-diameter circle of roots around the tree. If there is another tree within that 120-foot circle, then its root system is in direct competition with the first tree. If you have several trees close to that first tree, you could easily have an area around that root system competing with the root systems of 10 or more trees. This greatly stresses the tree, especially during times when moisture and nutrients are limited. If you thin these trees to a desired spacing, there will be less com-petition for water and nutrients, which will result in healthier trees and a higher production potential. FertilizationProper fertilization is important for the health of pecan trees. Pecans require relatively low amounts of nutrients compared to other crops. However, if one of the nutrients is limited, then the production potential greatly diminishes. Nitrogen fertilizer is usually the most critical and is required on an annual basis. Other nutrients needed are determined by leaf sampling. If trees are not fertilized on a regular basis, then the production potential is decreased. Insect and Disease ControlProduction is measured by how many pounds of nuts are harvested from the trees. Even if a tree produces a crop, it has no value until it is harvested. Controlling insects and diseases is the best way to maximize the potential produc-tion of the grove or orchard. Insect control normally consists of spraying the trees for at least pecan weevil. Pecan weevil is the most damaging insect to pecan trees in Oklahoma and Texas. If trees are not sprayed for weevil, substantial production losses can occur. Well-managed trees will also be sprayed for pecan nut casebearer and foliage feeders (webworms, walnut caterpillars, etc.) when needed. Disease control is also important in harvesting a crop. Control in a native grove is best achieved by removing diseased trees. Chemical sprays may be used to control disease problems on susceptible trees. Weed and Grass ControlFor maximum production, the area beneath pecan trees should be managed to control weeds. Weeds and grass directly compete with trees for water and nutrients. Tall veg-etation around the trees can increase disease incidence by restricting airflow, increasing humidity and prolonging leaf drying time from rain or dew. Ground cover should provide a suitable surface for orchard traffic and harvest but should not unduly compete with trees for water and nutrients. Vari-ous forage grasses are compatible with pecan trees and may also be used for grazing or hay. In those instances, additional fertilizer may be required, particularly when the forage is
The Samuel Roberts Noble Foundation Agricultural Division2
The Samuel Roberts Noble Foundation Agricultural Division
Estim
ated Average Value of N
ative Pecan Trees Receiving Proper Managem
ent in Ideal Soils*Value of Trees for N
ut Production (value in dollar per tree)
Avg. trunk dia. (in.)
Trees per Acre
A
67
89
1012
1518
2124
2730
3336
4044
4852
56
13.6$294.10
$294.10$294.10
$294.10$294.10
$294.10$161.96
$149.91$212.87
$206.74$204.01
$203.91$157.57
$122.77$93.92
$72.57$56.55
$44.37$35.02
14.3$322.93
$322.93$322.93
$322.93$322.93
$202.15$179.89
$248.35$236.27
$229.51$226.57
$173.32$133.93
$104.35$79.83
$61.69$48.07
$37.71
15.1$363.30
$363.30$363.30
$363.30$242.58
$224.87$298.02
$275.65$262.30
$254.89$192.58
$147.32$113.84
$88.70$67.86
$52.43$40.86
16.2$415.20
$415.20$415.20
$269.94$269.84
$372.53$330.78
$306.02$291.30
$216.65$163.69
$125.23$96.77
$75.40$57.68
$44.57
17.5$484.40
$484.40$303.68
$299.82$447.03
$413.47$367.22
$339.85$247.60
$184.16$139.14
$106.44$82.25
$64.09
19.2$582.43
$347.07$337.30
$496.70$496.16
$459.03$407.82
$288.87$210.46
$156.53$118.27
$90.48
21.4$404.91
$385.48$558.79
$551.29$550.83
$509.77$346.65
$245.54$178.89
$133.05$100.53
23.5$449.73
$427.87$620.21
$612.04$611.73
$433.31$294.65
$208.71$152.06
$113.09
24.7$499.19
$708.81$688.54
$679.70$519.97
$368.31$250.45
$177.40$129.25
26.2$826.94
$786.90$764.66
$577.74$441.97
$313.06$212.88
$150.79
28.0$918.05
$873.90$649.96
$491.08$375.68
$266.10$180.95
30.3$1,019.55
$742.81$552.47
$417.42$319.33
$226.19
*Cash flows discounted at 6.25 percent
Average price per pound of natives $0.865 (1998-2007) *O
ptimal grove w
ill produce 884 pounds per acreIf grove m
anagement (insect control and fertilizer) is not used, reduce values by 25 percent.
*Total cost of production is 50%
of yearly gross revenue per acre.In addition, if grove floor cover consists of unm
anaged grass and weeds, m
owed or not, or is
in less than ideal location (i.e., soil type, climate), reduce the basic values as follow
s: Rule of Thum
b: 1. A producing pecan tree is w
orth about 8 times the value of its average annual production.
1. To the left of Line A - Subtract 25 percent
2. W
ith 100 pounds change in yield per acre, per acre value of trees changes by $692; 2. To the right of Line A
- Subtract 50 percent
per tree value changes by $692 divided by trees per acre.
-(Exam
ple: $692 per acre ÷ 6 trees per acre = $115.33 value change per tree)
References: Heinrichs, H
erman, 1960 O
klahoma Pecan G
rowers Proceedings, pp. 27-29 and N
ational Agricultural Statistics Service — O
klahoma Q
uick Stats
TABLE 1
3

The Samuel Roberts Noble Foundation Agricultural Division4
Es
tim
ated
Ave
rage
Val
ue o
f Im
prov
ed P
ecan
Tre
es R
ecei
ving
Pro
per M
anag
emen
t in
Idea
l Soi
ls*V
alue
of T
rees
for N
ut P
rodu
ctio
n (v
alue
in d
olla
r per
tree
)
Avg.
tr
unk
dia.
(in
.)
Tr
ees
per A
cre
A
67
89
1012
1518
2124
2730
3336
4044
4852
56
13.6
$670
.65
$631
.20
$621
.34
631.
20$6
62.7
6$6
64.0
8$5
51.2
5$5
10.2
2$4
85.4
2$4
71.4
3$4
65.2
2$4
64.9
8$3
59.1
1$2
80.1
0$2
14.2
1$1
65.3
3$1
28.8
7$1
01.0
5$7
9.75
14.3
$736
.40
$710
.10
$710
.10
$736
.40
$796
.89
$689
.06
$612
.26
$566
.33
$538
.77
$523
.37
$516
.65
$395
.03
$305
.56
$238
.02
$181
.86
$140
.59
$109
.47
$85.
88
15.1
$828
.45
$811
.54
$828
.45
$885
.43
$826
.87
$765
.33
$679
.59
$628
.57
$598
.14
$581
.23
$438
.92
$336
.11
$259
.65
$202
.07
$154
.64
$119
.43
$93.
04
16.2
$946
.80
$946
.80
$996
.11
$918
.75
$918
.40
$849
.49
$754
.28
$697
.83
$664
.26
$493
.78
$373
.46
$285
.62
$220
.44
$171
.83
$131
.37
$101
.49
17.5
$1,1
04.6
0$1
,138
.41
$1,0
33.5
9$1
,020
.44
$1,0
19.3
9$9
42.8
6$8
37.3
9$7
74.9
7$5
64.3
2$4
20.1
4$3
17.3
5$2
42.4
9$1
87.4
5$1
45.9
7
19.2
$1,3
28.1
5$1
,181
.25
$1,1
48.0
0$1
,132
.65
$1,1
31.4
3$1
,046
.74
$929
.97
$658
.38
$480
.16
$357
.02
$269
.43
$206
.19
21.4
$1,3
78.1
2$1
,311
.99
$1,2
74.2
4$1
,257
.14
$1,2
56.0
9$1
,162
.46
$790
.05
$560
.19
$408
.03
$303
.11
$229
.10
23.5
$1,5
30.6
6$1
,456
.27
$1,4
14.2
8$1
,395
.65
$1,3
94.9
5$9
87.5
7$6
72.2
3$4
76.0
3$3
46.4
1$2
57.7
4
24.7
$1,6
98.9
8$1
,616
.32
$1,5
70.1
1$1
,549
.95
$1,1
85.0
8$8
40.2
9$5
71.2
4$4
04.1
4$2
94.5
6
26.2
$1,8
85.7
1$1
,794
.41
$1,7
43.6
9$1
,316
.75
$1,0
08.3
4$7
14.0
5$4
84.9
7$3
43.6
5
28.0
$2,0
93.4
8$1
,992
.79
$1,4
81.3
5$1
,120
.38
$856
.85
$606
.22
$412
.38
30.3
$2,3
24.9
2$1
,692
.97
$1,2
60.4
3$9
52.0
6$7
27.4
6$5
15.4
8
*Cas
h flo
ws
disc
ount
ed a
t 6.2
5 pe
rcen
t Av
erag
e O
klah
oma
pric
e pe
r pou
nd o
f im
prov
es $
1.31
5 (1
998-
2007
) *O
ptim
al g
rove
will
pro
duce
1,3
26 p
ound
s pe
r acr
e.If
grov
e m
anag
emen
t (in
sect
con
trol
and
fert
ilize
r) is
not
use
d, re
duce
val
ues
by 2
5 pe
rcen
t.
*
Tota
l cos
t of p
rodu
ctio
n is
50%
of y
early
gro
ss re
venu
e pe
r acr
e.
If va
rietie
s (B
urke
tt, W
ichi
ta, W
este
rn, e
tc.)
are
susc
eptib
le to
sca
b an
d m
anag
ed, r
educ
e ta
ble
valu
es fu
rthe
r by
25 p
erce
nt. I
f unm
anag
ed, v
alue
for n
ut p
rodu
ctio
n is
zer
o.In
add
ition
, if g
rove
floo
r cov
er c
onsi
sts
of u
nman
aged
gra
ss a
nd w
eeds
, mow
ed o
r not
, or i
s
in le
ss th
an id
eal l
ocat
ion
(i.e.
, soi
l typ
e, c
limat
e), r
educ
e th
e ba
sic
valu
es a
s fo
llow
s:
Rule
of T
hum
b: 1
. A
pro
duci
ng p
ecan
tree
is w
orth
abo
ut 1
3.83
tim
es th
e va
lue
of it
s av
erag
e an
nual
pro
duct
ion.
1. To
the
left
of L
ine
A -
Subt
ract
25
perc
ent
2.
With
100
pou
nds
chan
ge in
yie
ld p
er a
cre,
per
acr
e va
lue
of tr
ees
chan
ges
by $
1,05
2;
2. To
the
right
of L
ine
A -
Subt
ract
50
perc
ent
pe
r tre
e va
lue
chan
ges
by $
1,05
2 di
vide
d by
tree
s pe
r acr
e.
-(Exa
mpl
e: $
1,05
2 pe
r acr
e ÷
6 tr
ees
per a
cre
= $1
75.3
3 va
lue
chan
ge p
er tr
ee)
Refe
renc
es: H
einr
ichs
, Her
man
, 196
0 O
klah
oma
Peca
n G
row
ers
Proc
eedi
ngs,
pp. 2
7-29
and
Nat
iona
l Agr
icul
tura
l Sta
tistic
s Se
rvic
e —
Okl
ahom
a Q
uick
Sta
ts
TABL
E 2

used for hay. Certain legumes are suitable ground covers for pecan groves or orchards and may be capable of supplying the trees’ nitrogen requirement plus enhancing beneficial arthropods in the orchard ecosystem. Mowing is used to manage vegetation height during the growing season and to prepare for harvest. In cultivar orchards, herbicides are fre-quently used for vegetation control in the tree row. Improved Cultivars vs. Native PecansWhen determining the value of trees, it is important to find out if trees are improved cultivars (named varieties). The majority of cultivars are released from the university systems or from the USDA. These cultivars were studied for a long period of time and monitored for performance before they were released. Several of these releases worked great in commercial production, while others struggled or failed to perform to the established standards. On average, cultivars can be managed better and the return on management costs are better than on native trees. There are more man-agement tools that can be used in an improved orchard that will improve production and quality of the pecans, compared to native groves. This typically is in relation to the size of the tree. Management strategies in a well-managed, improved orchard would include irrigation and control of insects, disease, weeds and wildlife.
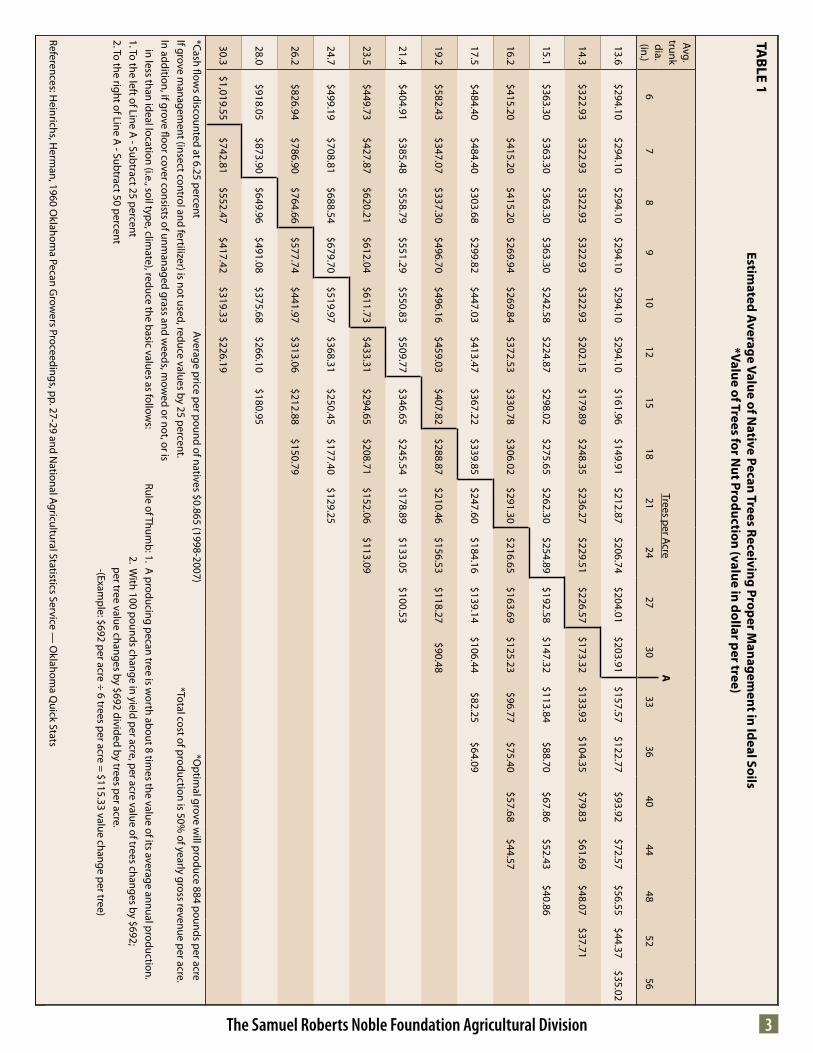
If these management strategies are followed, trees can produce up to their maximum potential. If even one of these strategies is not incorporated, then potential production may be reduced by as much as 50 percent. If none of the strategies are used, then the production potential will be even lower and the value of the trees will be greatly reduced. The only value of the pecan tree then would be for lumber, firewood or shade. In a pecan grove or orchard, a value can be determined by referring to Table 1 for native trees and Table 2 for improved trees. The values in the tables reflect the degree of management. However, if trees are not man-aged, a viable crop will not be produced each year and the years without a crop should be factored into the value. Pecans are alternate bearing, meaning that they pro-duce a good crop one year followed by one or more years of light to no crop. If the trees are unmanaged, this alternate bearing trend is more severe. If you harvest 80 pounds from a tree one year and the next harvested crop is
three years later with 60 pounds, then the average produc-tion over this four-year period would be 35 pounds. Determining Tree ValueThe productivity of a pecan orchard is based on many fac-tors, but arguably the most important is the cross-sectional square feet of trunk area per acre. Cross-sectional square feet of trunk area per acre is the sum of the trunk sizes of the trees per acre (1a). Table 1 and Table 2 provide the value of a pecan tree depending upon its existence within a native orchard and improved orchard, respectively, with respect to how many cross-sectional square feet of trunk area are present per acre. The optimal level of cross-sectional square feet of trunk per acre is 30 square feet3, which is indicated within the tables just to the left of diagonal line A. The tables assume orchards with this optimal spacing and tree size will have an average annual yield of 884 pounds of pecans for native groves and 1,326 pounds of pecans for improved orchards. On a per tree basis, the cross- sectional square feet per acre begins to restrict nut production after 12 cross- sectional square feet, as can be seen in the tables. The value of a producing pecan tree is based on its productivity into the future. Many pecan trees have been observed to be producing for more than 100 years, and, therefore, the tables assume productivity of a tree to be for many years (into perpetuity).
Table 1 and Table 2 are used by first determining how many trees are within a half-acre radius of the tree in ques-tion (include the tree that is being valued in this figure). Find the number of trees on the horizontal axis of the table. Then determine what the average diameter of the trees that were counted is in inches. Locate this number on the vertical axis. Go across horizontally and down vertically at your located
The Samuel Roberts Noble Foundation Agricultural Division 5
Improved pecan (left) compared to Native pecan.

The Samuel Roberts Noble Foundation Agricultural Division6
numbers until they intersect. This number is the current value of the tree(s) being valued. The values in the tables were derived from equations 1b. Equation (1a):
T
D
CS *144
2*
2
⎟⎠
⎞⎜⎝
⎛
=π
Equation (1b):
Where: CS = Cross-sectional square feet of trunk area per acre D = Diameter in inches T = Trees per acre TV = Pecan tree value (dollar per tree) P = 10-year average price of native pecans in Oklahoma Q = Pounds of pecans per acre C = Total cost of production (variable and fixed) as a percentage of gross revenue DR = Discount rate = 3.14159 For illustration purpose the following are two examples. Example one is for a native grove using the table valuation method and example two is an improved orchard using the formula valuation method. Example 1:
A track of six acres contains a pecan grove with 36 trees. All of the trees circumferences are measured at breast height (4.5 feet). The circumferences are summed (2,793.6 inches) and divided by the 36 trees (2,793.6 ÷ 36 = 77.6 inches) to determine the average circumference per tree in the grove. The average diameter of the trees would be 77.6 ÷ π which is 24.7 inches. Using Table 1 locate 24.7 on the left side of the table in the vertical axis. Then, locate the number the number of trees per acre (36 ÷ 6 = 6) on the top of the chart in the horizontal axis. Moving across the table to the right of 24.7 and down the table from 6 where the row and column meet the value of 499.19 appears. This means the average tree in the six acre grove is worth $499.19.
Example 2:
A track of 24 acres has an orchard with an average of six trees per acre. Production records show that over the last
1 Cochran, L.C. 1961. Pecan Research Program. Proc. Southeastern Pecan Growers Assn. 54th. 10-16.2 1987 and 2002 Ag Census3 McCraw, Dean. Improving Native Pecan Groves. Oklahoma Cooperative Extension Service Fact Sheet F-6208.
ten years average in shell nut production per acre was 969 pounds. The price that received on average over the last 10 years was $1.315 per pound. Total cost of production per year over the last 10 years has averaged 50 percent of the yearly gross revenue per acre. Using a discount rate of 6.25% each tree is valued as follows:
This means that the average value of a pecan tree in the orchard is worth $1,698.97.
While both valuation methods provide an assessed value of a pecan tree it should be noted that using the formula valuation method is the most accurate on a per case basis. By using actual yields and prices received by a producer for his or her product is better than a table created for an aver-age orchard or grove’s production and prices. ConclusionBecause of the many variables involved, the process of de-termining the value of any one pecan tree or group of trees has historically been a subjective endeavor. This publication has attempted to quantify the various factors affecting nut yield for both native and cultivar trees thereby providing a more objective methodology for assessing the value of pecan trees.
It is anticipated the information contained in this publica-tion, specifically Tables 1 and 2, will be used by appraisers, tax preparers, growers and other interested parties in deter-mining the value of pecan trees. <
π
€
TV = P * Q( ) − C * P * Q( )[ ][ ] /T[ ] /DR[ ]€
TV = 1.315*969( ) − .5* 1.315*969( )[ ][ ] /6[ ] /.0625[ ]
€
TV = 1274.235 − .5* 1274.235( )[ ][ ] /6[ ] /.0625[ ]
€
TV = 1274.235 − 637.115[ ] /6[ ] /.0625[ ]
€
TV = 637.115[ ] /6[ ] /.0625[ ]
€
TV = 106.1858 /.0625[ ]
€
TV =1698.97
€
TV = P * Q( ) − C * P * Q( )[ ][ ] /T[ ] /DR[ ]