assessing the impact of weather and season on pedestrian traffic
TRANSCRIPT

1
Assessing the Impact of Weather and Season on Pedestrian Traffic Volumes
Lisa Aultman-Hall
Damon Lane
Rebecca R. Lambert
Transportation Research Center
University of Vermont
210 Colchester Road
Burlington, VT 05401
802 656 1312
fax 802 656 9892
Words: 4412
Figures: 12 x 250 = 3000
Total Words: 7412
Submitted to the Transportation Research Board
For the 88th Annual Meeting
January 2009
Resubmission Date: November 15, 2008

Aultman-Hall, Lane and Rockefeller Page 1
1
ABSTRACT
Twelve months of automated hourly pedestrian counts in downtown Montpelier, Vermont (pop.
8,035) were analyzed along with weather data (temperature, relative humidity, precipitation, and
wind) to determine the factors affecting count variability. The study is unique in that a large
amount of data in a single location was collected in a locale with an extreme range of weather
conditions. Results indicate consistent patterns in relative volumes by hour of the day and month
of year that show that good adjustment factors can be developed to use with time-limited counts
to estimate usage and pedestrian exposure to accidents. Some predictive relationships were
found between weather variables, season and pedestrian volumes (no more than 30% of variation
and 20% of volume are affected). Precipitation and season do impact pedestrian levels even
when time of day and day of week are controlled, but other larger unmeasured factors are at
play. The impact of weather on walking levels in a business and commercial downtown is large
enough to consider programs and counter measures that might increase walking in adverse
weather.

Aultman-Hall, Lane and Rockefeller Page 2
2
INTRODUCTION
This paper analyzes a one-year time series of pedestrian traffic volumes on a single downtown
sidewalk location and seeks to evaluate the impact of weather on volume levels while controlling
for time and day. Most previous pedestrian counts datasets have been collected in locales with
less severe weather than this site in Vermont.
We have two broad research goals. First, it is our intention to contribute to a small but growing
base of data on temporal variation in pedestrian traffic volumes that might allow a weekly count
to be corrected for any week of the year based on standard factors such as those in the Highway
Capacity Manual for vehicular traffic. Second, as part of coordinated efforts at the University of
Vermont Transportation Research Center, we are seeking to understand seasonal and especially
winter weather impacts on travel decisions including pedestrian travel decisions. Ultimately, a
better understanding of the factors affecting the choice to use non-motorized transportation will
assist 1) policy makers to establish programs that increase walking levels, 2) transportation
engineers to address operations and capacity issues, and 3) demand modelers to include walking
as a mode in regional models to more accurately forecast non-motorized trips. Increasing non-
motorized transportation will in turn reduce energy use, improve the transportation system, and
benefit public health through more active living.
BACKGROUND
There is insufficient data for bicycle and pedestrian professionals to adequately forecast demand,
adjust short term counts to other times of year, or quantify the benefit of improvements. Specific
research on the factors influencing non-motorized travel behavior has been called for by the
Federal Highway Administration (1). The general lack of data has recently been affirmed by a

Aultman-Hall, Lane and Rockefeller Page 3
3
private sector company stepping forward and proposing a national documentation project (2)
including counting standards. Such a task is daunting, as pedestrian volumes have been found to
vary by location, street and path type and days of the week (3). While some have demonstrated
relatively stable daily patterns in hourly pedestrian volumes even when overall total volume
differs, the difference by land use type and surroundings are still noted (4). When researchers
consider forecasting pedestrian travel, the large number of factors affecting levels becomes the
challenge (5). Moreover, automated methods to count pedestrians can be prone to errors and
simply cannot capture the complex factors affecting pedestrian volumes including behavioral
aspects (6).
Previous studies have addressed the impacts of climate and season to some extent. Clifton et al.
(7) found in their Maryland studies that slightly more than 40% of both males and females
reported reducing walking in bad weather and that 12-15% stopped walking due to season. In a
survey of Tennessee university students, 24% of respondents cited weather as a factor for driving
instead of biking or walking (8). In Australia, weather and season were found to have only slight
effects on bicycle commuters (9). The authors of this study argue that the perception of weather
rather than the weather itself might be more of a deterrent (9).
Several studies find that weather and season affect walking speed (10,11,12) although results
vary. Some have found winter increases walking speed while others find the opposite.
Muraleetharan et al. (13) suggest that walking may increase in winter in their Japan study
because cyclists are walking not biking. They also suggest weather may impact route choice.
Guo et al. (14) have found that season affects transit ridership.

Aultman-Hall, Lane and Rockefeller Page 4
4
In summary, levels of pedestrian activity are found to be affected by numerous complex factors.
More pedestrian data are needed in order to address a range of important transportation planning
questions. Others have obtained results that suggest weather and season are factors that affect
pedestrian levels to some degree. This study has the advantage of a long time period of data
collection (hourly observations for a full year) in a location with a significant range of weather
conditions. However, data are only collected in one location.
Measuring the impact of weather will allow planners and program managers to consider weather
as a factor to lengthen the pedestrian transportation season in northern climates or to take steps to
encourage walking during bad weather such as snow, ice or rain. Furthermore, seasonal
adjustments for pedestrian accident exposure have been suggested (15) and the complete data to
obtain such factors which will vary spatially and temporarily have not been collected. This
suggests pedestrian travel data are important for planning purposes as well as safety analyses.
Collecting data for a long period at one site provides a means to assess whether relative patterns
by hour of day and consistency throughout the week allow for correction factor development.
DATA
In this project we make use of two merged hourly datasets: automated pedestrian counts and
weather reports from the National Climatic Data Center. Pedestrian counts were recorded at a
single downtown location in Montpelier Vermont (population 8,035) for one year from
November 2, 2006 to November 1, 2007. Montpelier is the state capital and in addition to retail
and commercial businesses, the downtown is home to numerous state government office
complexes. The counter is the grey box attached to the pole with a parking meter (mounted 113
cm above the ground and 328 cm from the buildings). It is located on the west side of Main

Aultman-Hall, Lane and Rockefeller Page 5
5
Street between on street parking and commercial store fronts. Figure 1 is the view south. A
bridge before the hill in the distance concentrates pedestrian traffic to this street within this
corridor. The town’s main intersection is to the north.
Figure 1: Pedestrian Counter on Signpost in Montpelier Vermont
The device is an Eco-counter Pyro Double Middle Range and is owned by the Vermont Agency
of Transportation (VTrans). It was installed by VTrans and data have been downloaded and
managed by their project team. The infrared sensor can distinguish direction of travel but cannot
distinguish between cyclists and pedestrians. In this location cyclists are expected to be minimal.
While 46.5% of the total pedestrian volume was southbound (the direction of vehicular traffic on
this side of the road) and 53.5% was northbound over the one year, total aggregate pedestrian
volume in both directions is used in this study. Others have conducted a comparison of this type

Aultman-Hall, Lane and Rockefeller Page 6
6
of counter with video data at three locations and found 9% to 19% undercounting (16). VTrans
performed a 2-hour manual check of the counter in 2006 and determined 98% accuracy (17). We
conducted a comparison with a manual count in this location in 2008 for a six hour period on one
day and found the Eco-counter undercounting by 5%. In this particular location, counters
noticed that people putting coins in the parking meter were blocking the counter while
pedestrians walked by. We also noted a large difference between the errors in one direction and
the other but with this limited observation time no reasons for this difference were evident.
Weather data were downloaded from the National Climatic Data Center for the Edward F Knapp
State Airport approximately 3 miles from the counting site. Hourly data were used to link to
count information. In most cases, the hourly weather observation was recorded at 51 minutes
after the hour which was mapped to the pedestrian count from the 51 minutes before until 7
minutes after the weather observation. When more frequent precipitation observations were
recorded (about 65.8% of the hours had extra observations called special reports) the
observations were aggregated to hourly totals. The following information was recorded and
linked to the pedestrian counts based on time of day: temperature, relative humidity, depth of
precipitation, and wind speed.
Overall, the database is very complete and few missing values were present. A total of 21 hours
of data during the year were missing relative humidity, while 4 were missing wind speed. Flags
indicating trace precipitation were converted to zeros. The large number of blank precipitation
records were converted to zero. Four days of data were missing data during a unusually large
snow storm in February 2007; the counter data was otherwise unedited. The range, mean and
standard deviation for temperature, relative humidity, precipitation and wind speed are shown in

Aultman-Hall, Lane and Rockefeller Page 7
7
Table 1. As the table illustrates, Montpelier experiences a wide range of temperatures and
humidity. It would not be considered windy although it is important to note a reasonable
proportion of the precipitation falls as snow or ice and wind is reasonably associated with these
winter storms.
Table 1: Summary of Hourly Weather Data
N Minimum Maximum Mean Std. Deviation
Dry Bulb Air Temperature
(degrees C) 8664 -26.7 32.8 7.47 11.5
Relative Humidity (%) 8643 11.0 96.0 68.63 17.8
Wind Speed (mph) 8660 0.0 29.0 5.24 5.0
Hourly Precipitation (inches) 8664 0.00 0.82 0.0045 0.029
Several variables were created for use in the analysis. A dummy variable for both precipitation,
and precipitation when the temperature was below freezing, were created. This corresponds to
9% and 2% respectively of hours when data were recorded. The day of the week record was
categorized to dummy variables indicating weekday, weekend and holiday. A total of 11
holidays which fell on weekdays such as the Fourth of July were recorded. The pedestrian
volume mean is shown by day and day type in Table 2. As one would expect much of the
variation indicated by the standard deviation in Table 2 is due to the differences in pedestrian
volume by time of the day as shown in Figure 2. Based on these results, holidays and Sundays
were categorized together as were weekdays and Saturdays for a portion of the analysis where
volumes were normalized for hour of the day.
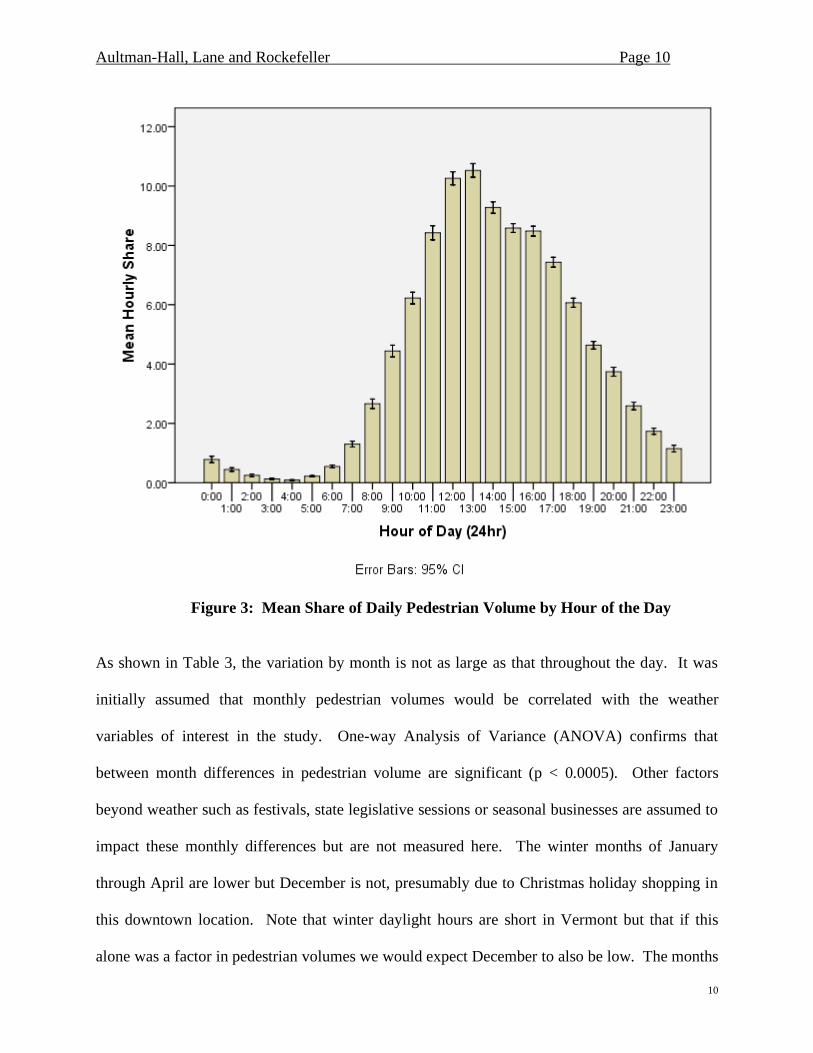
The daily pattern in Figure 2 is considered a location-specific attribute. Although there are many
workplaces nearby, there is not an AM or PM peak as one might expect if most of the

Aultman-Hall, Lane and Rockefeller Page 8
8
pedestrians were commuting. Rather the pedestrian volume peak at noon and in the afternoon
suggests workers eating out, running errands and other shoppers in a commercial district. The
total pedestrian volume for each day was calculated and for each hour the percent of the day was
calculated. This may be thought of as the hourly share of the given day’s pedestrian traffic
volume. Figure 3 shows the mean hourly share by hour of the day for the whole year. The error
bars correspond to the 95% confidence interval on the mean. The intervals are very small and
support the findings of others that the relative levels of pedestrian hourly volumes at a given
location are constant throughout the week and year.
Table 2: Mean Hourly Pedestrian Volume by Day and Day Type
Day Type Mean N Std. Deviation
Holiday 56.8 264 69.2
Weekday 104.1 5952 99.9
Weekend 81.7 2448 78.8
Monday 94.4 1248 97.6
Tuesday 101.8 1248 101.3
Wednesday 98.8 1248 95.7
Thursday 100.5 1248 98.4
Friday 115.2 1224 102.0
Saturday 100.2 1224 89.2
Sunday 63.1 1224 61.5
Total 96.32 8664 94.3

Aultman-Hall, Lane and Rockefeller Page 9
9
Figure 2: Mean Pedestrian Volume by Hour of the Day
Aultman-Hall, Lane and Rockefeller Page 10
10
Figure 3: Mean Share of Daily Pedestrian Volume by Hour of the Day
As shown in Table 3, the variation by month is not as large as that throughout the day. It was
initially assumed that monthly pedestrian volumes would be correlated with the weather
variables of interest in the study. One-way Analysis of Variance (ANOVA) confirms that
between month differences in pedestrian volume are significant (p < 0.0005). Other factors
beyond weather such as festivals, state legislative sessions or seasonal businesses are assumed to
impact these monthly differences but are not measured here. The winter months of January
through April are lower but December is not, presumably due to Christmas holiday shopping in
this downtown location. Note that winter daylight hours are short in Vermont but that if this
alone was a factor in pedestrian volumes we would expect December to also be low. The months

Aultman-Hall, Lane and Rockefeller Page 11
11
of January through April might reasonably be associated with times when snow is present on the
ground. Therefore a dummy variable for winter was created corresponding to the months of
January through April.
Table 3: Hourly Pedestrian Volume by Month
Month Mean N Std. Deviation
JAN 85.89 744 89.80
FEB 76.23 576 83.86
MAR 91.87 744 92.16
APR 88.32 720 86.13
MAY 99.85 744 93.51
JUN 102.38 720 89.56
JUL 104.06 744 94.29
AUG 102.86 744 91.69
SEP 95.17 720 87.43
OCT 100.54 744 96.86
NOV 94.46 720 96.16
DEC 109.51 744 119.24
Total 96.32 8664 94.34
Because one main objective of the analysis is to measure the impact of weather on pedestrian
volume, the volumes needed to be normalized for day of the week and hour of the day. A factor
of the mean was calculated using the following equation:
Factor of Mean = Hourly Total / Hourly Mean for Day Type
where the hourly mean for day type was calculated for the given hour of the day for either
weekday/Saturday or holiday/Sunday. The result is a variable distributed around 1.0 where a
value above 1.0 indicates the pedestrian volume for that hour was higher than the mean for that

Aultman-Hall, Lane and Rockefeller Page 12
12
hour and day type. Similarly, a value below 1.0 indicates the given hour is lower than the mean
for the particular hour and day type. A histogram of the factor of the mean is provided in Figure
4. Note the distribution is not completely normal.
Figure 4: Factor of Mean (normalized for hour and day type) Frequency
Using the factor of the mean it is possible to consider whether a HCM-style correction for time
of year or month of year might be feasible for this location. Figure 5 illustrates the confidence
interval of the monthly means for the factor of the mean pedestrian volume. The relatively small
confidence intervals suggest some feasibility but the causal impacts by month of the year remain
unclear. February is a busy month for the adjacent legislature, but it includes a school vacation
week when many families travel. It could be perceived as having bad winter weather, and along
with November, could be affected by limited daylight. August may be a popular vacation month

Aultman-Hall, Lane and Rockefeller Page 13
13
and could be too hot for the northern pedestrians.
Figure 5: Mean Pedestrian Volume by Month
RESULTS ON WEATHER AND SEASON
In order to evaluate the impacts of weather conditions on pedestrian volume linear regression
models were initially pursued. In the first model estimations, the modeled output variables were
weekday/Saturday factor of the mean and holiday/Sunday factor of the mean. In the second set
of model estimations, only the noon hour (the peak time for most days) or the 8 hours from
10AM to 6PM were used.

Aultman-Hall, Lane and Rockefeller Page 14
14
As a first step, linear correlations between the continuous predictor variables temperature, wind
speed, relative humidity and precipitation were calculated. Although statistically significant
correlations were found, all absolute values of the Pearson’s Correlation Coefficient were below
0.20 except for a -0.4 correlation between relative humidity and wind speed.
A Student’s t-test was used to evaluate the difference in mean between hours with and without
precipitation or frozen precipitation (there was not a way to distinguish between ice and snow).
For weekdays/Saturday the levels of hourly pedestrian volume were significantly lower (factor of
the mean 0.87 and 0.86) for hours with precipitation and frozen precipitation than for days
without (1.01 and 1.00). However, for holidays/Sundays, the hourly pedestrian volumes were
not statistically different for days with and without precipitation or frozen precipitation. This
may be due to the low pedestrian volume those days, either as a statistical power effect or
because there may be a certain number of pedestrians who must travel regardless of the weather.
The difference between the hourly factor of the mean for winter (January through April) and the
other months was statistically significant (0.84 versus 1.08 p < 0.0005). One might interpret
these mean differences by saying precipitation reduces average pedestrian volume by 13% on
weekdays and Saturdays but not on Sundays or holidays. And “winter” reduces average
pedestrian levels by 24%.
Scatterplots such as those shown in Figure 6 reveal large scatter in the factor of the mean for
pedestrian volume with all continuous predictor variables for both weekdays/Saturdays and
holidays/Sunday. Similar scatterplots were created by month and season and also only noon in
the summer months of June, July and August as shown in Figure 7. No strong relationships were
noted. A small quadratic relationship was found between pedestrian factor of the mean and

Aultman-Hall, Lane and Rockefeller Page 15
15
temperature with very cold and very hot temperatures reducing pedestrian volume levels slightly.
Whether this is due to fewer pedestrians, or poor counter performance in extreme conditions
requires additional checks to determine.
Figure 6: Pedestrian Volume and Weather Factors (all hours)

Aultman-Hall, Lane and Rockefeller Page 16
16
Figure 7: Pedestrian Volume and Weather Factor (noon only)

Aultman-Hall, Lane and Rockefeller Page 17
17
Figure 8: Distribution of Factor of the Mean Pedestrian Volume by Hour of Day
When linear regression models were estimated for all 24 hours of the weekday/Saturday dataset
all coefficients for the weather variables were significant. However, the adjusted R2 of 0.03
confirms that these variables account for little of the variation in the hourly pedestrian volumes.
For the holiday/Sunday dataset, none of the precipitation variable coefficients were significant
and the R2 was still 0.03. Recall the factor of the mean already accounts for hour of the day as
well as whether the observation was on a weekday/Saturday versus holiday/Sunday.
Because the factor of the mean is skewed by the very low pedestrian volumes in the night
(Figure 8) regression models were estimated for only the hours of 10AM through 6PM. But no
R2 above 0.05 was obtained. In all cases, a significance level of 0.05 was used for testing if
coefficients were significantly different from zero using a Student’s t-test.

Aultman-Hall, Lane and Rockefeller Page 18
18
For the noon hour regression model development, the predictor variable temperature squared was
included. Model parameters are shown in Table 4. Other weather variables did not have
significant coefficients. This model had an adjusted R2 of 0.3. Therefore, even for the peak
noon hour, weather only accounts for 30% of the overall variation in volume. Note that the
different effect of precipitation on holidays/Sunday versus weekdays/Saturday affected several
model specifications and is the reason the output variable of factor of mean is retained in this
noon model. The constant of 1.139 indicates the mean pedestrian volume in the noon hour is
higher than the rest of the day. On average this model suggests pedestrian volume increase in the
noon hour by 1.5% for every degree C. But note the negative coefficient for temperature
squared; that is very cold and very hot temperatures reduce volume. Humidity has a limited but
statistically significant effect. Any type of precipitation reduces the volume by on average 15%.
Table 4: Linear Regression Model for Noon Hour Pedestrian Volume
Parameter Coefficient P value (Student’s t-test)
Constant 1.139 <0.0005
Temperature C 0.015 <0.0005
Relative Humidity (%) -0.003 <0.0005
Precipitation (yes/no) -0.152 0.002
Temp * Temp /100 -0.041 <0.0005
CONCLUSIONS
These results are consistent with other studies in establishing that pedestrian volumes are
affected by a large number of interrelated factors. While this study was based on counts at only
a single location, the wide range of weather conditions provides a robust dataset. The findings
suggest that season and weather have an effect on levels of pedestrian volume in downtown
Montpelier Vermont. Precipitation reduces the average hourly volume level by approximately
13% and the winter months reduce it by 16%. At best a combination of weather variables
account for 30% of the variance measured in hourly volumes. From a predictive power point of

Aultman-Hall, Lane and Rockefeller Page 19
19
view the models are weak. But considered as portion of variability, 30% is high and suggests
policies and measures to address weather as a factor in walking levels might be worthwhile.
The year of hourly data clearly suggest that reasonable week of year and hour of day corrections
factors can be estimated. But the overall shape of the daily curve for this test location, without
AM and PM peaks, reaffirms the assertions made by others that pedestrian volumes are very site
specific. This suggests that household travel survey or planning style analysis rather than
operational count are best suited for understanding behavioral motivations for pedestrian travel.
For policy makers and transportation planners, these initial findings are useful in several ways.
First, the consistent hourly pattern within a day and the consistency of day type
(weekday/Saturday versus holiday/Sunday) suggests that correction factors and forecasting
methods are feasible. The daily pattern is likely to vary significantly from place to place and an
effort to define a number of pedestrian location types might assist with factor development.
Second, the results indicate that weather such as cold temperature or precipitation are directly
and consistently reducing aggregate levels of walking by only a moderate amount (less than
20%). Programs to alter habits/perceptions and extend the walking season may be viable. But
many factors are affecting pedestrian activity clearly suggesting more comprehensive data are
needed.
ACKNOWLEDGMENTS
The authors wish to thank Amy Bell and Jon Kaplan of the Vermont Agency of Transportation
who provided invaluable data and support. This work was funded by the United States
Department of Transportation through The University of Vermont University Transportation

Aultman-Hall, Lane and Rockefeller Page 20
20
Research Center. Our collaborators Drs. Jane Kolodinsky and Brian Flynn and their research
groups participated in proposal development and research planning.. Any opinions, findings, and
conclusions or recommendations expressed in this material are those of the authors and do not
necessarily reflect the views of the USDOT or VTrans.
REFERENCES
1. Schwartz, W. L., C. D. Porter, G. C. Payne, J. H. Suhrbier, P. C. Moe, W. L. Wilkinson III.
Guidebook on Methods to Estimate Non-Motorized Travel: Overview of Methods. Report
Number FHWA-RD-98-165. FHWA, U.S. Department of Transportation, 1999.
2. Schneider, R, R. Patton, J. Toole and C. Raborn. Pedestrian and Bicycle Data Collection in
United States Communities: Quantifying Use, Surveying Users, and Documenting Facility
Extent. Pedestrian and Bicycle Information Center, University of North Carolina at Chapel
Hill, Highway Safety Research Center, Chapel Hill, NC, 2005.
3. Alta Planning and Design, Inc. National Bicycle and Pedestrian Documentation Project:
Description. Institute of Transportation Engineers Pedestrian & Bicycle Council. 2005.
4. Hottenstein, A., S. Turner and G. Shunk. Bicycle and Pedestrian Travel Demand Forecasting:
Summary of Data Collection Activities. Publication FHWA/TX-98/1723-1. Texas
Transportation Institute, Federal Highway Administration, 1997.
5. Soot, S. Trends in Downtown Pedestrian Traffic and Methods of Estimating Daily Volumes.
Transportation Research Record 1325, Transportation Research Board, 1991, pp 75-82.
6. Porter, C., J. Suhrbier, and W. L. Schwartz. Forecasting Bicycle and Pedestrian Travel: State
of the Practice and Research Needs. In Transportation Research Record: Journal of the
Transportation Research Board, No. 1674, Transportation Research Board of the National
Academies, Washington, D.C., 1999, pp. 94-101.
7. Clifton, K. J. and A. D. Livi. Gender Differences in Walking Behavior, Attitudes About
Walking, and Perceptions of the Environment in Three Maryland Communities. In Research
on Women’s Issues in Transportation: Volume 2: Technical Papers, Report of a Conference,
No. 35, Transportation Research Board of the National Academies, Washington, D.C., 2005.
8. Couch, K. L. and D. A. Badoe. Travel Behavior of University Students in the Weekday
Journey to Campus and its Implications for Campus Transport Planning. Presented at the
Annual Meeting of the Transportation Research Board, Washington, D.C., 2007.
9. Nankervis, M. The Effect of Weather and Climate on Bicycle Commuting. Transportation
Research A, Vol. 33, 1999, pp. 417-431.

Aultman-Hall, Lane and Rockefeller Page 21
21
10. Daamen, W., and S. P. Hoogendoorn. Experimental Research on Pedestrian Walking
Behavior. In Transportation Research Record: Journal of the Transportation Research
Board, No. 1828, Transportation Research Board of the National Academies, Washington,
D.C., 2003, pp. 20–30.
11. Montufar, J., J. Arango, M. Porter, and S. Nakagawa. The Normal Walking Speed of
Pedestrians and How Fast They Walk When Crossing the Street. Presented at the Annual
Meeting of the Transportation Research Board, Washington, D.C., 2007.
12. Knoblauch, R., M. Pietrucha, and M. Nitzburg. Field Studies of Pedestrian Walking Speed
and Start-Up Time. In Transportation Research Record; No. 1538, 1996, pp. 27 -38.
13. Muraleetharan, T., K. Meguro, T. Adachi, T. Hagiwara, and S. Kagaya. Influence of Winter
Road Conditions and Signal Delay on Pedestrian Route Choice in Japan’s Snowiest
Metropolis. In Transportation Research Record: Journal of the Transportation Research
Board, No. 1939, Transportation Research Board of the National Academies, Washington,
D.C., 2005, pp. 145-153.
14. Guo, Z., N. H. M. Wilson, and A. Rahbee. The Impact of Weather on Transit Ridership in
Chicago. Presented at the Annual Meeting of the Transportation Research Board,
Washington, D.C., 2007.
15. Green-Roesel, R., M. C. Diogenes, and D. R. Ragland. Estimating Pedestrian Accident
Exposure: Protocol Report. Institute of Transportation Studies, UC Berkeley Traffic Safety
Center, University of California, Berkeley, 2007.
16. Green-Roesel, R., M. C. Diogenes, D. R. Ragland, and L. A. Lindau. Effectiveness of a
Commercially Available Automated Pedestrian Counting Device in Urban Environments:
Comparison with Manual Counts. Institute of Transportation Studies, UC Berkeley Traffic
Safety Center, University of California, Berkeley, 2007.
17. Amy Bell. Technology Innovations: Infrared Bicyclist & Pedestrian Counter. In Bike/Ped
Professional: Journal of the Association of Pedestrian and Bicycle Professionals.
Association of Pedestrian and Bicycle Professionals, Hamilton Square, NJ, 2006, pp 4-5.