assessing the accuracy and precision of stereo-video and
TRANSCRIPT

CCSBT ESC/0809/12 i
Assessing the accuracy and precision of stereo-video and sonar length measurements of southern bluefin tuna (Thunnus maccoyii)
K. Phillips1, V. Boero Rodriguez2, E. Harvey3, D. Ellis4, J. Seager5, G. Begg1, N. Honda6, K. Shibata7, J. Hender1 1Fisheries and Marine Sciences Program, Bureau of Rural Sciences 2Biosecurity and Statistical Sciences Program, Bureau of Rural Sciences 3School of Plant Biology, The University of Western Australia 4Australian Southern Bluefin Tuna (SBT) Industry Association Ltd 5SeaGIS Pty Ltd 6National Research Institute of Fisheries Engineering, Fisheries Research Agency 7Toyo Corporation

CCSBT ESC/0809/12 ii
© Commonwealth of Australia 2007
This work is copyright. Apart from any use as permitted under the Copyright Act 1968, no part may be reproduced by any process without prior written permission from the Commonwealth. Requests and inquiries concerning reproduction and rights should be addressed to the Commonwealth Copyright Administration, Attorney General’s Department, Robert Garran Offices, National Circuit, Barton ACT 2600 or posted at http://www.ag.gov.au/cca.
The Australian Government acting through the Bureau of Rural Sciences has exercised due care and skill in the preparation and compilation of the information and data set out in this publication. Notwithstanding, the Bureau of Rural Sciences, its employees and advisers disclaim all liability, including liability for negligence, for any loss, damage, injury, expense or cost incurred by any person as a result of accessing, using or relying upon any of the information or data set out in this publication to the maximum extent permitted by law.
Postal address: Bureau of Rural Sciences GPO Box 858 Canberra, ACT 2601

CCSBT ESC/0809/12 iii
Executive Summary Background and experimental set-up
This report provides results from the second year (Stage II) of a two-year research project designed to test the accuracy, precision and robustness of stereo-video cameras under at-sea research transfer conditions in Australia’s southern bluefin tuna (SBT) ranching sector. Results from trials of a DIDSON sonar module provided by Japan are also given.
A 10 t research mortality allowance (RMA) was allocated to Australia at the fourteenth meeting of the Commission for the Conservation of Southern Bluefin Tuna (CCSBT14) for Stage II. Fieldwork was conducted in early April 2008.
In late March 2008, a 9.6 t RMA (n = 563 SBT) was transferred from a commercial tow pontoon to a holding pontoon on a lease site in Spencer Gulf near Port Lincoln. Of these, 474 SBT were measured with calipers and transferred into the first of two research pontoons prior to transfer. A subset (n >30) were individually marked with colour-coded tailstrops that were visible in stereo-video footage. These tailstropped SBT were also measured using a fish-measuring cradle. Differences in caliper and cradle measurements of direct length ranged from 0 to 12 cm.
Between 7 and 9 April 2008, 16 transfers comparable to commercial transfers were conducted between the two research pontoons under variable environmental conditions. All 16 transfers were successfully recorded by a GigE stereo-video camera mounted on the transfer gate, and 11 complete transfers were successfully recorded by a DIDSON sonar module mounted on the collar of the pontoon.
Accuracy and precision of stereo-video length measurement
Manual measurements of Fork Length (cm) were obtained from stereo-video footage. Measurements were taken from multiple frames recorded of individual SBT as they swam through the transfer gate. Analysis of Variance (ANOVA) of (a) mean length from multiple frames of individual SBT per transfer and (b) maximum length from multiple frames of individual SBT per transfer (using only frames in which SBT appeared to be straight, not flexing) revealed that, in most cases, stereo-video length measurement does not differ significantly among transfers.
Statistical models were developed to predict length distributions from (a) mean length from multiple frames of individual SBT per transfer, and (b) maximum length from multiple frames of

CCSBT ESC/0809/12 iv
individual SBT per transfer. Means of predicted lengths from the model based on stereo-video mean length from multiple frames differed by <3 cm from the mean of direct caliper length measurements. In 7 of 16 transfers, this difference was <1 cm, and in another 7 transfers this difference was 1 cm. Means of predicted lengths from the model based on stereo-video maximum length from multiple frames differed by 0–2 cm from the mean of direct caliper length measurements. In 3 of 16 transfers, this difference was <1 cm, and in 9 transfers this difference was <2 cm.
Sampling regimes
Until software capable of taking automated length measurements from stereo-video footage becomes available, a portion of SBT in a transfer may be sampled and used to predict the length distribution of the whole population in the transfer. Four sampling regimes were tested using stereo-video length measurements: simple random sample of 10% of the population (i.e. of all SBT recorded during transfer); systematic random sample of 10% of the population; simple random sample of 20% of the population; systematic random sample of 20% of the population. Differences between mean direct caliper length of the population and mean sample lengths were <2 cm regardless of sampling regime.
Physical robustness in operational conditions
The stereo-video camera was easily mounted on the transfer gate, recorded all 16 transfers without interruption, remained calibrated throughout the trials and proved robust under operational conditions.
Comparison of stereo-video and sonar length measurements
Manual and automated measurements of SBT Total Length (cm) were taken from DIDSON sonar imagery (the caudal fork not being visible in sonar imagery). No conversion factor from Total Length to Fork Length was available. There were several operational challenges that made it difficult to record stable images. Summary statistics (mean, median, minimum, maximum length) of sonar measurements differed from direct length measurements, and did not approach the accuracy and precision of stereo-video length measurements. One advantage that sonar has over stereo-video at the present time is that automated measurements can be taken from sonar imagery in a short amount of time, whereas automated software is not yet available for stereo-video. However, the accuracy and precision of these two systems were not comparable in the April 2008 trials.

CCSBT ESC/0809/12 v
Contents Executive Summary ......................................................................................................................... iii
Contents ............................................................................................................................................. v
Background ........................................................................................................................................ 1 Objectives ....................................................................................................................................... 2
Materials and methods ..................................................................................................................... 3 Capture and tagging of SBT ..................................................................................................... 3
Stereo-video camera ...................................................................................................................... 3 Sonar system ................................................................................................................................. 4 Calibration of stereo-video ............................................................................................................. 4 Length measurement ..................................................................................................................... 5
Stereo-video measurements ....................................................................................................... 5 Sonar measurements .................................................................................................................. 6
Statistical analysis .......................................................................................................................... 6 Stereo-video measurements ....................................................................................................... 6 Modelling stereo-video length measurements of tailstropped SBT ............................................. 6 Multiple frames of individual SBT: which length measurement is best? ..................................... 7 Sonar measurements .................................................................................................................. 8
Results ................................................................................................................................................ 9 Transfers ........................................................................................................................................ 9 Physical robustness in operational conditions ............................................................................... 9
Stereo-video ................................................................................................................................ 9 Sonar ........................................................................................................................................... 9
Direct length measurements ........................................................................................................ 10 Stereo-video measurements ........................................................................................................ 11
Scale bar ................................................................................................................................... 11 Proportion of SBT measured per transfer ................................................................................. 11 Comparison among technicians ................................................................................................ 12 Comparison of tailstropped SBT among transfers .................................................................... 12 Modeled length distributions ...................................................................................................... 13
Sonar measurements ................................................................................................................... 14 Summary statistics .................................................................................................................... 14
Sampling regimes ......................................................................................................................... 16
Outcomes ......................................................................................................................................... 19 Objective 1. Assess the accuracy and precision of stereo-video length measurements obtained under operational conditions ...................................................................................... 19

CCSBT ESC/0809/12 vi
Objective 2. Develop statistically robust sample sizes and sampling regimes for stereo-video measurement ............................................................................................................................. 19 Objective 3. Assess the robustness and suitability of the stereo-video equipment in operational conditions ............................................................................................................... 20 Objective 4. Compare the accuracy, precision and robustness of the stereo-video cameras with a sonar system supplied by Japan .................................................................................... 20
References ....................................................................................................................................... 21
Figures .............................................................................................................................................. 22
Appendix 1 ....................................................................................................................................... 39
Appendix 2 ....................................................................................................................................... 41
Appendix 3 ....................................................................................................................................... 45

CCSBT-ESC/0809/12 1
Background Over 99% of Australia’s catch allocation of southern bluefin tuna (SBT, Thunnus maccoyii) is captured by purse-seine vessels in the Great Australian Bight and transported live to the tuna ranching offshore zone in Spencer Gulf near Port Lincoln, South Australia, for ranching in grow-out pontoons for up to 6 months before harvest (herein referred to as Australia’s ranching sector) (Larcombe & McLoughlin 2008). Unlike other SBT fishing sectors (for example longlining) in which SBT are brought on deck, most SBT captured by the Australian industry for the ranching sector are not handled until harvest. As a consequence, length and weight data cannot be collected at the time of capture. Mean length and weight are instead based on a sample of 40 SBT of ≥10 kg from each tow pontoon as it arrives in Port Lincoln, and means from each tow pontoon are in turn scaled up to estimate Australian catch per quota year. Although an independent review of Australia’s ranching sector concluded that regulation of the industry is a rigorous and well-managed process, some members questioned Australia’s system of calculating catches by the ranching sector at the 13th meeting of the Commission for the Conservation of Southern Bluefin Tuna (CCSBT13) (Anon 2006). For a number of years, Australia has investigated monitoring and data validation measures that could be used to reduce uncertainties in catch calculation. Most research has been dedicated to the development and testing of stereo-video camera systems, which can be mounted on the transfer gate as SBT are transferred from tow pontoons into grow-out pontoons and thereby increase the amount of length data collected from Australia’s ranching sector and hence improve estimation of catch. Provisional work on stereo-video in an operational environment identified a number of issues (relating to hardware, deployment, and sampling and measurement regimes) to be addressed before a decision can be reached on whether this technology can be used to monitor Australia’s catch of SBT in the Great Australian Bight (Harvey et al. 2001, 2003a,b, 2005). In January 2007 the Australian Fisheries Management Authority (AFMA), responsible for the management of Australia’s SBT fishery, convened a Stereo-Video Working Group (SVWG) to develop a project to evaluate stereo-video technology. The SVWG concluded that the following were immediate priorities for determining the utility of stereo-video for ongoing monitoring of SBT catch: • Evaluation of the accuracy and precision of stereo-video under a range of conditions
comparable to actual ranch transfer conditions, particularly with regard to variable light and water visibility)
• Evaluation of the accuracy and precision of stereo-video with a range of fish sizes • Assessment of the physical robustness of the equipment under operational conditions. This report presents the results from the second year (Stage II) of a research project designed to address the above priorities identified by the SVWG by comparing direct measurements of SBT lengths with stereo-video measurements made under variable conditions in a research operational environment. Assessment of the accuracy and precision of stereo-video required that repeated measurements of both (a) individual SBT length and (b) length-frequency distributions of the population in a pontoon be taken from multiple transfers. Because multiple transfers are not performed as part of commercial operations and require additional resources (including SBT, crew, vessels, pontoons) beyond the normal research and development contributions of the Australian Government and industry, Australia sourced a 10 t research mortality allowance (RMA) for the Stage II field work at CCSBT14. While negotiating the 10 t RMA at CCSBT14, Japan noted that in certain environments the length measurements of SBT being transferred into grow-out pontoons may be more reliably obtained from sonar imagery rather than stereo-video footage because sonar

CCSBT-ESC/0809/12 2
is not affected by low light, high turbidity or other conditions that lead to poor water clarity. Following Japan’s offer of contributing a sonar system and engineering expertise to the project, Australia agreed to develop a trial to test the accuracy and precision of both stereo-video and sonar technology. This work formed the basis of Stage II and the results are presented here. In December 2007, AFMA and the Australian Government Department of Agriculture, Fisheries and Forestry (DAFF) agreed to fund the stereo-video research project designed to address priorities identified by the SVWG. The Fisheries Research and Development Corporation (FRDC) also agreed in 2008 to contribute funds.
Objectives The primary objectives of Stage II (2008 fieldwork) of the stereo-video research project were to:
1. Assess the accuracy and precision of stereo-video length measurements obtained under operational conditions
2. Develop statistically robust sample sizes and sampling regimes that will collect a subset of stereo-video length measurements representative of the length distribution in a transfer
3. Assess the robustness and suitability of the stereo-video equipment in operational conditions
Subsequent to CCSBT14, an additional objective agreed for this project was to: 4. Compare the accuracy, precision and robustness of the stereo-video cameras with a sonar
system supplied by Japan. Length measurements from stereo-video footage would ideally be made by automated software (not currently available). Automated measurement will expedite the availability of length data for catch-monitoring purposes. Therefore, some consideration has also been given as to how to obtain automated length measurements from multiple frames of individual SBT recorded per transfer. Objective 2 addresses sampling regimes for manual measurement of stereo-video footage that may be implemented before automated software becomes available.

CCSBT-ESC/0809/12 3
Materials and methods
Capture and tagging of SBT The research mortality allowance (RMA) of SBT was captured in the Great Australian Bight at around 33°27’S, 132°19’E between 17 February and 2 March 2008 as part of a larger commercial catch by the purse-seine vessel FV Independence and transferred into a tow pontoon. The SBT were then towed to Port Lincoln by the vessel FV Salt River, and on 19 March 2008 a 40-fish sample was taken from the tow pontoon to estimate mean weight of ≥10 kg SBT (verified by Protec Marine Pty Ltd in accordance with current catch reporting requirements). This 40-fish sample was observed by an AFMA representative. Based on the mean weight of 17.13 kg obtained from the 40-fish sample, a total of 563 SBT were transferred into a holding pontoon on 20 March to give an RMA of approximately 9.6 t. On 27 and 28 March 2008, 474 SBT from the holding pontoon were caught using a baited hook and handline, tagged with conventional CCSBT dart tags, measured to the nearest 1 cm from the snout to the caudal fork (Fork Length) with a set of large calipers, and transferred via a stainless steel slide into the first of two research pontoons (32 m diameter) moored on a commercial lease site. Pontoon configuration is shown in Fig. 1. Note that research pontoons used in this study were smaller than typical commercial grow-out pontoons (40–45 m diameter). Immediately before the first transfer on 7 April 2008, and again following the first transfer of 8 April 2008, a subset of the 474 SBT (n = 42) in the research pontoon were again caught by hook and handline, and colour-coded tailstrops attached around the caudal peduncle. A second set of length measurements were taken for these SBT using a fish-measuring cradle (as opposed to the calipers used on 27 & 28 March; logistical constraints prevented the set-up of a measuring platform on 7 & 8 April). The tailstrops were made of 2 lengths (short, long) of synthetic webbing (black, white, grey, red or yellow) (Fig. 2). Each tailstrop could be individually identified in the stereo-video footage (see Fig. 5), and allowed multiple measurements of individual SBT to be compared among multiple transfers. That is, in addition to comparing the length-frequency distribution of stereo-video measurements from multiple transfers against direct length measurements, the accuracy and precision of stereo-video could also be assessed from measurements of individual SBT. Several tailstrops fell off shortly after attachment, and data were attained for 36 SBT.
Stereo-video camera The camera system used to record the transfers was supplied by AQ1 Systems Pty Ltd and comprised two Pulnix TMC 1327 Gigagbit Ethernet (GigE) cameras, positioned approximately 700 mm apart and directed inward at 6° (Fig. 3). This system, which also incorporated power converters and an Ethernet switch, was contained within an aluminium underwater housing and mounted on a bracket on the transfer gate. The cameras were connected to an onboard logging computer by a 30 m umbilical cord that supplied power and allowed communication and synchronisation between the computer and cameras. The computer was installed with MotionLogging software that automatically controlled image brightness (through gain and shutter speed adjustments) and logged frames only when SBT were detected within the field of view (see Harvey et al. 2003a). MotionLogging software was provided by SeaGIS Pty Ltd. Images were recorded in compressed Audio Video Interleaved (AVI) file format directly onto the computer’s hard drive. A light logger was attached to the transfer gate so that light could be included as a continuous variable in subsequent analyses.

CCSBT-ESC/0809/12 4
Sonar system The dual-frequency identification sonar (DIDSON) system was supplied by the National Research Institute of Fisheries Engineering, Fisheries Research Agency and comprised a standard DIDSON module (operating frequency 1.8 MHz; two-way beam width 0.3° horizontal by 14° vertical, field of view 29°) and topside junction box fixed to an adjustable 3 m arm (Fig. 4a). The module connected to the logging computer by a 15 m cable and used 24 V DC power. A brief interruption to the vessel’s power supply disrupted recording of the first transfer on 7 April, so thereafter a small uninterruptible power system (UPS) was used to ensure a constant power supply. The arm was mounted on a bracket fixed to the collar of the pontoon at an angle of ~45°, and was positioned 6–12 m from the proximate edge of the transfer gate (Fig. 4b). The pan and tilt of the DIDSON module were remotely adjusted from the computer, and DIDSON Control and Display software V.5.14 was used to log images.
Calibration of stereo-video The stereo-video was calibrated in the Port Lincoln Leisure Centre pool on 2 April 2008 as described by Harvey et al. (2002, 2003a). The calibration was performed by recording imagery of a 1 × 1 × 0.5 m purpose-built calibration frame and processing the images using the CAL software package (www.seagis.com.au/bundle.html). Subsequent measurements were completed using the PhotoMeasure photogrammetric measurement software (www.seagis.com.au/photo.html). The GigE stereo-video camera was calibrated with a network precision of 1:16,000 and average image residual of 0.12 pixels (Table 1).
Table 1. GigE camera configuration parameters Item Value Precision Base separation (X) 699.0019 mm 821 µm Delta Omega 1.39968° 22” Left Phi –5.46119° 128” Left Kappa –2.08007° 95” Right Phi 6.14435° 185” Right Kappa –0.81479° 78”
These results were verified using a calibrated scale bar (a) immediately after calibration and (b) in situ in the research pontoons (to check that cameras remained within reasonable calibration limits after deployment in an operational setting) (Table 2). The scale bar has an accurately calibrated length (908.7 ± 0.1 mm) between two circular reflective targets. Measurements of the scale bar provide an independent validation of the system’s calibration integrity, and give an indication of the best possible measurement accuracy the systems can achieve.

CCSBT-ESC/0809/12 5
Table 2. Validation of stereo-video camera calibration; n = no. of measurements of a 908.7±0.1 mm scale bar
Date Location n Distance
from camera
Mean (±SD) length
of measurements
2 Apr 08 Port Lincoln pool,
immediately after
calibration
9 1.0–4.5 m 909.2±2.4 mm
8 Apr 08 In situ, mounted
on transfer gate
10 1.3–2.1 m 910.6±0.9 mm
9 Apr 08 In situ, mounted
on transfer gate
10a 1.6–3.4 m 909.0±1.5 mm
afootage recorded after completion of final transfer on 9 April
Length measurement In the case of manual length measurements taken from both stereo-video and sonar imagery, technicians did not have access to the caliper or cradle length measurements of the SBT in each transfer until they had completed all measurements. Therefore, manual measurements were not biased by a priori knowledge of the actual length distribution in the research pontoons.
Stereo-video measurements Measurements of SBT length from the stereo-video imagery were made manually by up to four technicians (depending on the transfer) using PhotoMeasure. Two AVI files containing images from the left and right cameras were imported into PhotoMeasure, and paired images were synchronised using the time code burnt to the top left corner of each image. Measurements were made by manually locating the tip of the lower jaw and the caudal fork (Fork Length) of the target SBT within the synchronised video streams using cursor positioning and mouse clicks. The two pairs of image coordinates were converted into coordinates in three-dimensional object space (x, y and z) and an estimator of the quality (root mean square residual, also known as residual parallax) and precision of the measurement logged. To obtain length measurements, the three-dimensional distances between consecutive point measurements (tip of the lower jaw and caudal fork) were computed automatically. The distance from the tip of the lower jaw to the central point between the camera lenses and the angle of the point of interest relative to the camera centres were also automatically computed (Fig. 5). In each transfer a number of SBT were partially or completely obscured by other SBT, whereby either the tip of the lower jaw and/or caudal fork could not be viewed. Measurements of these obscured SBT were discarded (see Table 8 for proportions of recorded and measurable SBT per transfer). For those SBT without tailstrops, measurements were only taken from frames in which the SBT appeared to be straight (i.e. body not flexed); up to five measurements were taken for individual SBT without tailstrops per transfer (see Harvey et al. 2003b). For those SBT with tailstrops, the maximum number of measurements were taken (n ≤ 16) regardless of whether the SBT appeared to be straight or flexing. This allowed comparison of minimum, median, mean and maximum length measurements of individually marked SBT to be compared among transfers.

CCSBT-ESC/0809/12 6
Sonar measurements Length measurements of SBT from sonar imagery were made both manually and with the automated functions of two software packages, DIDSON Control and Display version 5.17 and Echoview version 4.40 (www.echoview.com). Both programs had preset thresholds, automatically detected SBT from the imagery based on the moving conditions, shape and size of each subject, tracked the image of individual SBT and measured length automatically. Manual measurements were made by two technicians and were calculated from a line drawn manually along the curvature of an SBT (Fig. 6). Technicians completed all analyses independently of one another. The caudal fork is not visible in sonar imagery; therefore, all measurements were of the complete visible length of SBT, from the anterior tip of the snout to the posterior tip of the tail (Total Length) as detected by sonar. Thus, a conversion factor should be used if DIDSON measurements are to be compared with direct length measurements of SBT measured with calipers or stereo-video (i.e. Total Length to Fork Length conversion).
Statistical analysis
Stereo-video measurements Analysis of variance (ANOVA) was used to test for differences in stereo-video length measurements of individual tailstropped SBT among transfers. In addition, box plots of minimum, maximum, mean, and 25th and 75th percentiles were drawn to compare distributions of direct caliper length measurements against distributions predicted from stereo-video length measurements using a series of statistical models, and distributions predicted from a selection of these models using one of four sampling regimes. Proportion histograms of stereo-video length measurements per transfer are given in Appendix 2a.
Modelling stereo-video length measurements of tailstropped SBT The tailstropped (i.e. individually marked) SBT were used to test the effect of technicians and variable light on stereo-video length measurements through a series of models that predicted direct length distribution from the stereo-video length measurements. Such predicted length distributions can be converted to weight distributions and used to estimate total catches. The mean light measurement from the light logger mounted on the transfer gate was calculated for each transfer, and the following linear regression model fitted: Direct caliper length = α + β1stereo-video mean length + β2light + β3technician + ε (1) where α, β1, β2 and β3 are the regression parameters and ε standard error, which are assumed to have a Gaussian distribution, be independent of each other and with a mean of zero and variance of σ2. The technician effect was non-significant and so was deleted from the model. Other models tested included random effects for individual SBT, transfer, technician and some combinations of all, but all variables proved to be non-significant.

CCSBT-ESC/0809/12 7
The model in Eq. (1) was then fitted without the technician effect: Direct caliper length = α + β1stereo-video mean length + β2light + ε (2) The diagnostics for Eq. (2) were acceptable and the assumptions seemed to hold (Appendix 1a). The R2-value of this model was 98% and residuals ranged from –3.3 to 3.2 cm. Table 3 gives the model parameters for Eq. (2), which indicate that the intercept was non-significant while the two main effects were highly significant.
Table 3. Parameters for Eq. (2) Parameter Error p-value
Intercept 0.4620 0.6675 0.4890
Stereo-video mean length 0.9780 0.0068 <0.0001
Light 0.0126 0.0027 <0.0001
Although light was significant, we decided to remove this variable and re-run the model to see how it was affected: Direct caliper length = α + β1stereo-video mean length + ε (3) The diagnostics for Eq. (3) were again acceptable and the assumptions seemed to hold (Appendix 1b). The R2-value for Eq. (3) was 98%, and residuals ranged from –3.6 to 3.3 cm. That is, Eq. (3) fitted the data very well and was simpler than Eq. (2). Table 4 gives the model parameters for Eq. (3), indicating that the intercept and main effect were significant.
Table 4. Parameters for Eq. (3) Parameter Error p-value
Intercept 1.3493 0.6592 0.0415
Stereo-video mean length 0.9751 0.0070 <0.0001
Multiple frames of individual SBT: which length measurement is best? To automate the measurement of SBT lengths from stereo-video footage, it may be necessary to measure all frames in which an SBT appears with no capacity for discriminating between frames in which an SBT appears to be straight and frames in which it is flexing. If automated software calculates the mean length measurement of an SBT from multiple frames, then the mean will be biased by any frames in which the SBT is flexing. An option may be to identify the maximum length of an SBT from multiple frames. Therefore, it was decided to fit the model in Eq. (2) with the maximum length of individual tailstropped SBT from each transfer instead of mean length: Direct caliper length = α + β1stereo-video maximum length + β2light + ε (4)

CCSBT-ESC/0809/12 8
The diagnostics for Eq. (4) are not as good as those of the previous models: the distribution of the residuals has a slightly heavier lower tail. However, this is to be expected when the maximum is used because the model tends to underestimate length (Appendix 1c). The R2-value for this model was 95% and residuals ranged from –7.5 to 5.0 cm. Table 5 gives the model parameters for Eq. (4), indicating that the intercept and main effects were significant.
Table 5. Parameters for Eq. (4) Parameter Error p-value
Intercept 3.0097 1.1546 0.0096
Stereo-video max. length 0.9327 0.0115 <0.0001
Light 0.0128 0.0047 0.0072
We again decided to simplify the model by deleting the light variable such that: Direct caliper length = α + β1stereo-video maximum length + ε (5) The residuals did not deteriorate to a great extent when light was removed from the model (Appendix 1d). The R2-value for this model was also 95% and residuals ranged from –8.1 to 5.3 cm. Table 6 gives the model parameters for Eq. (5), indicating that the intercept and main effect were significant.
Table 6. Parameters for Eq. (5) Parameter Error p-value
Intercept 3.9085 1.1164 0.0005
Stereo-video max. length 0.9299 0.0116 <0.0001
Sonar measurements Summary statistics (minimum, maximum, mean, median) are given for sonar length measurements. Proportional histograms of manual and automated sonar measurements per transfer are given in Appendix 2b.
CCSBT-ESC/0809/12 9
Results
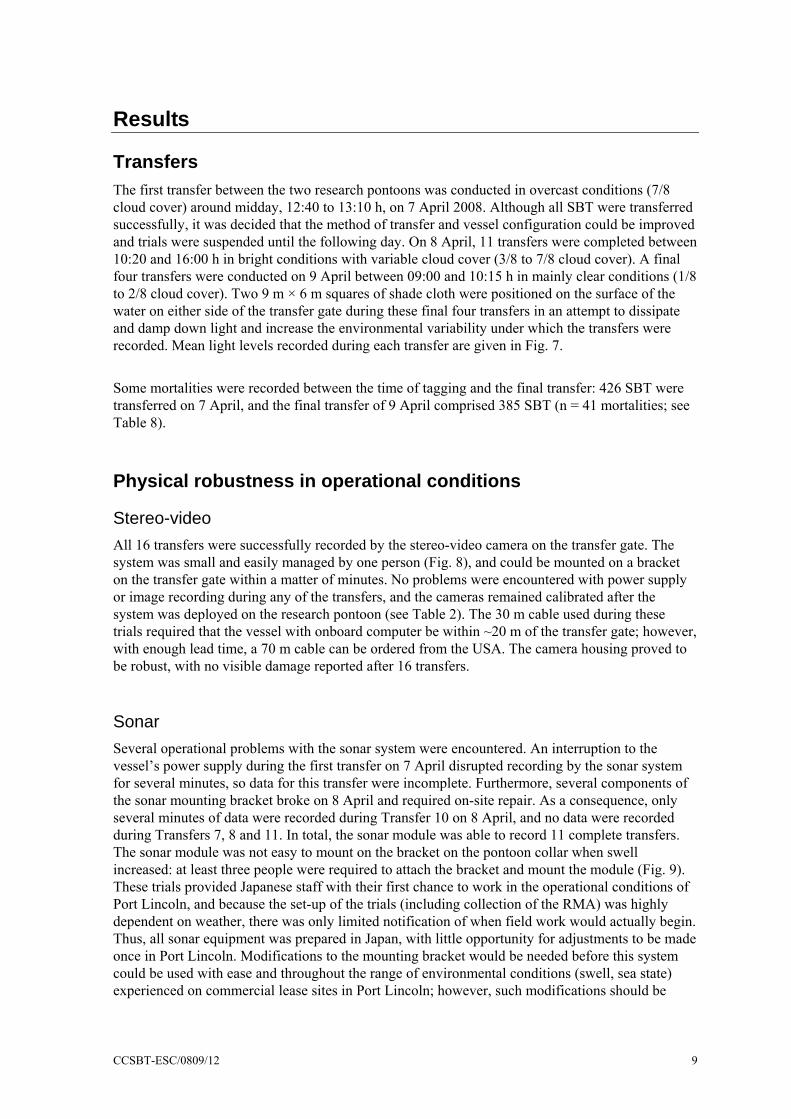
Transfers The first transfer between the two research pontoons was conducted in overcast conditions (7/8 cloud cover) around midday, 12:40 to 13:10 h, on 7 April 2008. Although all SBT were transferred successfully, it was decided that the method of transfer and vessel configuration could be improved and trials were suspended until the following day. On 8 April, 11 transfers were completed between 10:20 and 16:00 h in bright conditions with variable cloud cover (3/8 to 7/8 cloud cover). A final four transfers were conducted on 9 April between 09:00 and 10:15 h in mainly clear conditions (1/8 to 2/8 cloud cover). Two 9 m × 6 m squares of shade cloth were positioned on the surface of the water on either side of the transfer gate during these final four transfers in an attempt to dissipate and damp down light and increase the environmental variability under which the transfers were recorded. Mean light levels recorded during each transfer are given in Fig. 7. Some mortalities were recorded between the time of tagging and the final transfer: 426 SBT were transferred on 7 April, and the final transfer of 9 April comprised 385 SBT (n = 41 mortalities; see Table 8).
Physical robustness in operational conditions
Stereo-video All 16 transfers were successfully recorded by the stereo-video camera on the transfer gate. The system was small and easily managed by one person (Fig. 8), and could be mounted on a bracket on the transfer gate within a matter of minutes. No problems were encountered with power supply or image recording during any of the transfers, and the cameras remained calibrated after the system was deployed on the research pontoon (see Table 2). The 30 m cable used during these trials required that the vessel with onboard computer be within ~20 m of the transfer gate; however, with enough lead time, a 70 m cable can be ordered from the USA. The camera housing proved to be robust, with no visible damage reported after 16 transfers.
Sonar Several operational problems with the sonar system were encountered. An interruption to the vessel’s power supply during the first transfer on 7 April disrupted recording by the sonar system for several minutes, so data for this transfer were incomplete. Furthermore, several components of the sonar mounting bracket broke on 8 April and required on-site repair. As a consequence, only several minutes of data were recorded during Transfer 10 on 8 April, and no data were recorded during Transfers 7, 8 and 11. In total, the sonar module was able to record 11 complete transfers. The sonar module was not easy to mount on the bracket on the pontoon collar when swell increased: at least three people were required to attach the bracket and mount the module (Fig. 9). These trials provided Japanese staff with their first chance to work in the operational conditions of Port Lincoln, and because the set-up of the trials (including collection of the RMA) was highly dependent on weather, there was only limited notification of when field work would actually begin. Thus, all sonar equipment was prepared in Japan, with little opportunity for adjustments to be made once in Port Lincoln. Modifications to the mounting bracket would be needed before this system could be used with ease and throughout the range of environmental conditions (swell, sea state) experienced on commercial lease sites in Port Lincoln; however, such modifications should be

CCSBT-ESC/0809/12 10
relatively simple to design. The module itself appeared to be robust and survived the multiple transfers without damage.
Direct length measurements Mean and median lengths measured with calipers were identical to the nearest cm, and ranged from 98 cm (Transfers 13 to 16) to 99 cm (Transfers 1 to 12). Standard deviations were always 11 cm. The largest SBT in Transfers 1 to 12 was 129 cm, and that in Transfers 13 to 16 was 127 cm. The smallest SBT in all transfers was 72 cm. Unlike data collected during previous stereo-video trials (including Stage I of the current project), direct length measurements were taken from live SBT rather than SBT killed after harvest. The difficulty in measuring live SBT lead to some errors in direct length measurements, as can be seen in a comparison of caliper and cradle length measurements of SBT tagged with tailstrops (Table 7). Differences between caliper and cradle measurements ranged from 0 to 12 cm as a consequence of human error introduced when handling large, live fish that are not anaesthetised. When comparing the accuracy and precision of stereo-video measurements of tailstropped SBT, those SBT with length discrepancies of ≥4 cm were excluded from analyses (n = 5). The accuracy/variability of direct length measurements must be considered foremost in any discussion of the accuracy and precision required of stereo-video in Australia’s ranching sector.
Table 7. Difference (cm) in caliper and cradle length measurements of SBT individually marked with tailstrops (n = 36 SBT)
SBT tailstrop ID
caliper cm
cradle cm
difference cm
SBT tailstrop ID caliper cm cradle cm
difference cm
1124 97 97 0 1325 88 90 21523 100 100 0 1421 81 83 22215 89 89 0 1521 91 93 22311 84 84 0 1522 94 96 22312 107 107 0 2112 107 109 22514 90 90 0 2211 107 109 23232 84 84 0 2214 98 100 21123 83 84 1 2411 89 91 21223 79 80 1 2513 84 86 21425 102 103 1 3333 107 109 21524 99 100 1 2114 94 97 32113 100 101 1 2213 96 99 32115 95 96 1 2511 105 108 32315 84 85 1 1324 97 93 43131 81 82 1 1225 93 98 53434 87 86 1 1122 90 96 61125 99 101 2 3535 102 113 111221 88 90 2 2512 100 112 12
CCSBT-ESC/0809/12 11
Stereo-video measurements
Scale bar An ANOVA on repeated measurements (n = 9–10) of the scale bar immediately after calibration in the Port Lincoln swimming pool (2 April) and in the pontoons on 8 and 9 April (Table 2) revealed no significant difference in calibration. This indicates that the system was robust to transportation and deployment on the transfer gate and that the calibration of the system was stable and applicable to all 16 transfers.
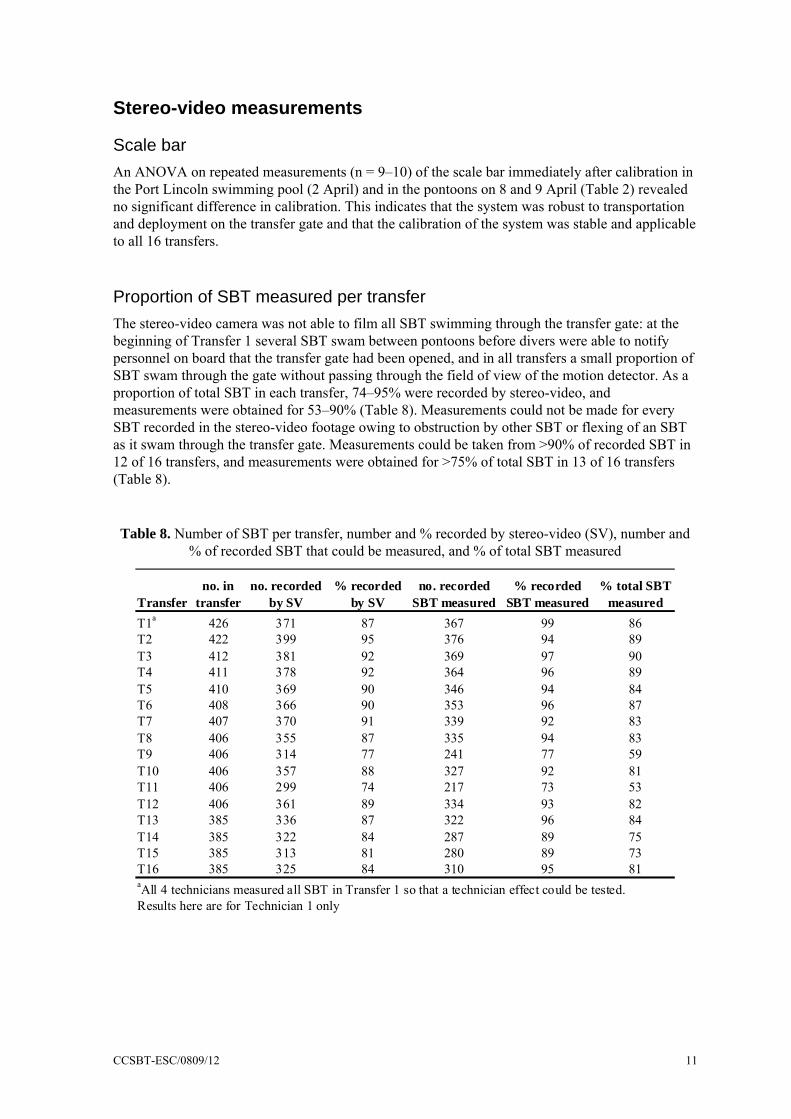
Proportion of SBT measured per transfer The stereo-video camera was not able to film all SBT swimming through the transfer gate: at the beginning of Transfer 1 several SBT swam between pontoons before divers were able to notify personnel on board that the transfer gate had been opened, and in all transfers a small proportion of SBT swam through the gate without passing through the field of view of the motion detector. As a proportion of total SBT in each transfer, 74–95% were recorded by stereo-video, and measurements were obtained for 53–90% (Table 8). Measurements could not be made for every SBT recorded in the stereo-video footage owing to obstruction by other SBT or flexing of an SBT as it swam through the transfer gate. Measurements could be taken from >90% of recorded SBT in 12 of 16 transfers, and measurements were obtained for >75% of total SBT in 13 of 16 transfers (Table 8).
Table 8. Number of SBT per transfer, number and % recorded by stereo-video (SV), number and % of recorded SBT that could be measured, and % of total SBT measured
Transferno. in
transferno. recorded
by SV% recorded
by SVno. recorded
SBT measured% recorded
SBT measured% total SBT
measuredT1a 426 371 87 367 99 86T2 422 399 95 376 94 89T3 412 381 92 369 97 90T4 411 378 92 364 96 89T5 410 369 90 346 94 84T6 408 366 90 353 96 87T7 407 370 91 339 92 83T8 406 355 87 335 94 83T9 406 314 77 241 77 59T10 406 357 88 327 92 81T11 406 299 74 217 73 53T12 406 361 89 334 93 82T13 385 336 87 322 96 84T14 385 322 84 287 89 75T15 385 313 81 280 89 73T16 385 325 84 310 95 81aAll 4 technicians measured all SBT in Transfer 1 so that a technician effect could be tested.Results here are for Technician 1 only

CCSBT-ESC/0809/12 12
Comparison among technicians For Transfer 1, all four technicians made ≤5 manual measurements of individual SBT without tailstrops (and ≤16 manual measurement of tailstropped SBT) so that a technician effect could be tested. For each technician, mean length measurements were calculated for individual SBT using only frames in which an SBT appeared to be straight (i.e. body not flexed). Quantile-Quantile plots (QQ-plots) of each technician mean were then plotted against the direct caliper length measurements (Fig. 10). In these plots the distributions of all technician measurements were very similar to that of caliper measurements: only Technician 1 seemed to produce quantiles slightly higher than the caliper measurements. To test the hypothesis that at least one of these distributions had a different median, a Kruskal-Wallis test was performed. The p-value of this test was 0.49; therefore, this hypothesis can be rejected and the medians of these distributions cannot be considered to differ significantly from one another. It was concluded that there was no technician effect in Transfer 1, so for the remaining 15 transfers stereo-video length measurements were made by one technician only. Technician 1 measured Transfers 14, 15, 16 and the second half of Transfer 8; Technician 2 measured SBT in Transfer 1 only; Technician 3 measured transfers 2, 3, 4, 5, 6, 7 and the first half of Transfer 8; and Technician 4 measured Transfers 9, 10, 11, 12 and 13.
Comparison of tailstropped SBT among transfers The accuracy and precision of stereo-video length measurements of individual SBT were determined by comparing multiple measurements of tailstropped SBT among transfers. The direct length of tailstropped SBT was measured using a cradle in addition to calipers, and some large discrepancies between these direct length measurements were recorded (Table 7). When these discrepancies were greater than 3 cm, the tailstropped SBT were removed from analyses (n = 5, i.e. SBT with tailstrop IDs 1324, 1225, 1122, 3535 and 2512). The total number of observations of the 31 tailstropped SBT analysed for the 16 transfers was 332: the number of observations varied from transfer to transfer because in several transfers some tailstropped SBT were obscured by other SBT or did not pass through the field of view of the motion detector. The distribution of (a) mean length from multiple frames of tailstropped SBT per transfer and (b) maximum length from multiple frames of tailstropped SBT per transfer were compared against both caliper and cradle direct length measurements in Fig. 11. In Fig. 11, stereo-video length measurements appear to be more similar to cradle than caliper length measurements, suggesting that the latter were more erroneous. Distributions of mean lengths (Fig. 11a) are in most cases more closely aligned with direct length measurements than are distributions of maximum length (Fig. 11b) (e.g. Tailstrop ID 1521 in Fig. 11). For many tailstropped SBT, the distribution of mean length measurements from multiple transfers was similar to or less than the difference between the two direct length measurements. For most tailstropped SBT, stereo-video length measurements did not differ significantly among transfers (Table 9). When mean lengths from multiple frames per transfer were compared, a significant difference was observed for one SBT (p < 0.05): in this instance, mean lengths from 9 transfers differed by 0–5 cm from the direct length. Likewise, a significant difference was noted for one SBT when maximum length from multiple frames per transfer were compared (p < 0.05); for this SBT, maximum lengths from 7 transfers differed by 1–3 cm from the direct length.

CCSBT-ESC/0809/12 13
Table 9. ANOVA of stereo-video lengths of tailstropped SBT among transfers, comparing (a) mean length of individual SBT from multiple frames per transfer, and (b) max. length of individual
SBT from multiple frames per transfer. *, p < 0.05
Tailstrop ID No. transfers
(a) Mean from multiple frames:
(b) Max. from multiple frames:
significant? significant?1123 13 – –1124 8 – –1125 8 – –1221 9 * –1223 10 – –1325 16 – –1421 13 – –1425 10 – –1521 2 – –1522 11 – –1523 11 – –1524 9 – –2112 12 – –2113 2 – –2114 7 – –2115 10 – –2213 13 – –2214 15 – –2215 16 – –2312 10 – –2411 10 – –2511 13 – –2513 13 – –2514 3 – –3131 12 – –3232 7 – *3333 11 – –3434 2 – –
Modeled length distributions In order to identify which model provides the best prediction of direct length distribution, four sets of length distributions were analysed and compared against direct measurements: • Stereo-video mean length of individual SBT per transfer • Stereo-video maximum length of individual SBT per transfer • Predicted length per individual SBT from Eq. (3) • Predicted length per individual from Eq. (5). Box plots were drawn to analyse the distribution of these predicted values together with the direct caliper length measurements (Fig. 12). The box plots were calculated per transfer because the number of SBT differed among transfers owing to mortalities. The model in Eq. (5) is the one that yields predicted values with the closest distribution to that of the direct caliper length distribution. However, there was little difference between distributions generated by Eqs. (3) and (5), and previous research on stereo-video length measurements of SBT indicated that mean rather than maximum length from multiple frames yields the most accurate length measurement (Fig 3. in

CCSBT-ESC/0809/12 14
Harvey et al. 2003a; see also Fig. 11 herein). Therefore, although no attempt has been made to develop automated length measurement from stereo-video footage, it appears to be preferable to base automated length measurement on mean rather than maximum length from multiple frames per transfer. Mean values from Fig. 12 are also shown for comparison in Table 10.
Table 10. Mean direct length from caliper measurements, mean stereo-video length from multiple measurements per SBT, max. stereo-video length from multiple measurements per SBT, and means
predicted values per SBT from Eqs. (3) & (5). Means were calculated from all recorded and measured SBT in each transfer (i.e. not from tailstropped SBT only)
TransferMean caliper
length cmMean stereo-video
length cmMax. stereo-video
length cmMean of model
mean length (Eq. 3)Mean of model
max. length (Eq. 5)T1 99 99 100 98 97T2 99 103 105 102 101T3 99 100 102 99 98T4 99 101 103 100 100T5 99 100 102 99 98T6 99 100 102 100 99T7 99 100 101 99 98T8 99 100 101 99 98T9 99 100 101 99 98T10 99 100 102 99 98T11 99 100 101 99 98T12 99 99 100 98 97T13 98 100 101 99 98T14 98 101 104 101 100T15 98 100 102 99 99T16 98 99 101 99 98
Sonar measurements
Summary statistics Similar to stereo-video length measurements, the number of sonar measurements varied from the number of SBT in each transfer. This resulted from a combination of factors: (a) sonar was not able to capture all individual SBT, especially when several SBT swam through the transfer gate together such that their images overlapped; (b) some SBT swam back and forth through the gate, resulting in multiple measurements being made for some individuals; (c) the field of view of the sonar module did not always cover the whole transfer gate, e.g. when the module was mounted too close to the gate or when swell raised up the module (mounted on the pontoon collar) relative to the gate. Furthermore, with regard to automated measurements, the detection threshold was set to exclude erroneous detection of the transfer gate and net; therefore, automated measurements were not taken from any images of SBT that fell below this threshold. As a proportion of the SBT in each transfer, 11–84% were measured manually, 8–79% were measured by the automated DIDSON function, and 2–134% were measured by the automated Echoview software (Table 11).

CCSBT-ESC/0809/12 15
Table 11. Number of SBT per transfer, number and % recorded by sonar, number and % of recorded SBT that could be measured, and % of total SBT measured. (a) Manual measurements;
(b) automated measurements a
Transferno. in
transferno. recorded
by sonar% recorded
by sonarno. recorded
SBT measured% recorded
SBT measured% total SBT
measuredno. recorded
by sonar% recorded
by sonarno. recorded
SBT measured% recorded
SBT measured% total SBT
measuredT1 426 132 31 103 78 24 131 31 84 64 20T2 422 248 59 165 67 39 252 60 155 62 37T3 412 409 99 273 67 66 417 101 309 74 75T4 411 426 104 321 75 78 459 112 347 76 84T5 410 363 89 215 59 52 379 92 257 68 63T6 408 193 47 127 66 31 202 50 115 57 28T9 406 362 89 188 52 46 349 86 183 52 45T10 406 132 33 97 73 24 134 33 100 75 25T12 406 373 92 234 63 58 363 89 216 60 53T13 385 321 83 179 56 46 300 78 194 65 50T14 385 415 108 259 62 67 391 102 227 58 59T15 385 328 85 172 52 45 322 84 169 52 44T16 385 80 21 45 56 12 77 20 42 55 11
Technician A Technician B
b
Transferno. in
transferno. recorded
by sonar% recorded
by sonarno. recorded
SBT measured% recorded
SBT measured% total SBT
measuredno. recorded
by sonar% recorded
by sonarno. recorded
SBT measured% recorded
SBT measured% total SBT
measuredT1 426 176 41 176 100 41 109 26 109 100 26T2 422 286 68 286 100 68 226 54 226 100 54T3 412 104 25 104 100 25 552 134 552 100 134T4 411 232 56 232 100 56 230 56 230 100 56T5 410 236 58 236 100 58 18 4 18 100 4T6 408 123 30 123 100 30 64 16 64 100 16T9 406 185 46 185 100 46 121 30 121 100 30T10 406 132 33 132 100 33 49 12 49 100 12T12 406 322 79 322 100 79 93 23 93 100 23T13 385 31 8 31 100 8 91 24 91 100 24T14 385 165 43 165 100 43 109 28 109 100 28T15 385 172 45 172 100 45 69 18 69 100 18T16 385 190 49 190 100 49 7 2 7 100 2
DIDSON Echoview
Mean, median, minimum and maximum measurements of SBT in each transfer also varied and in many cases did not approach direct length measurements (Fig. 13). Mean total lengths from manual measurements were larger than mean fork lengths from direct measurements (by 0 to 17 cm), whereas mean total lengths from automated measurements were smaller (by 6 to 41 cm). In most transfers, manual measurements underestimated the minimum length of SBT (by 9 cm on average). Similarly, automated measurements underestimated minimum length in all transfers (by 37 cm on average). In every transfer, manual measurements of maximum length were larger than the direct measurements of maximum fork length of SBT (by 15 cm on average), while automated measurements also generally overestimated maximum length (by 21 cm on average). It must be again noted that while direct length measurements were of Fork Length cm, all sonar length measurements were of Total Length cm. If converted to Fork Length, some sonar measurements (especially manual measurements) may provide more accurate estimates of direct length. Mean (±SD), minimum and maximum sonar length measurements per transfer are given in Appendix 3. Several factors can account for discrepancies between direct length measurements and sonar length measurements. Movement of the sonar module relative to the position of the transfer gate (e.g. with swell) affected the accuracy of measurement, as too any SBT that swam in a direction oblique to rather than horizontal to the observation plane. Furthermore, the tailstrops attached to the caudal peduncle could not be distinguished from the SBT body in sonar imagery and may have led to erroneously large measurements. In addition, the detection threshold set for the automated DIDSON and Echoview packages may have excluded the extremities of individual SBT (e.g. the caudal fin) from measurement if the sonar signal of the extremities fell below the threshold. Finally, owing to the configuration of the sonar module (mounted on the pontoon collar) relative to the transfer gate (Fig. 4b), the distance between the module and the gate was affected by sea state and swell, which in turn affected the accuracy of length measurement during transfer. Some of these issues may be resolvable (e.g. if more time were available to fine-tune the detection threshold

CCSBT-ESC/0809/12 16
and hence accuracy of the automated software packages), but it is unclear whether all can be addressed given the requirements of commercial transfer of SBT in Port Lincoln. In summary, manual measurements were generally more accurate than automated measurements, but not to a level that would encourage any discussion of implementing sonar technology into Australia’s ranching sector at the present time. Furthermore, in 7 out of 12 transfers from which manual measurements were made, technicians were able to measure less than 50% of the SBT in the respective transfer, precluding the development of a rigorous sampling protocol. Finally, in contrast with the linear line drawn from the tip of the lower jaw to the caudal fork in the stereo-video PhotoMeasure software, manual measurements of DIDSON imagery were taken from a line drawn along the curvature of individual SBT (Fig. 6). The reproducibility of these manually-drawn, curved lines was not tested owing to the limited time available for analysis (7 weeks), but it must be tested to determine if measurements differ among (a) technicians and (b) repeated measurements by the same technician.
Sampling regimes If stereo-video length measurements are used to monitor catch in near-real time, the manual measurement of Fork Length in PhotoMeasure must be replaced by an automated system. However, until an automated system becomes available, a portion of measurable SBT in a transfer may be sampled and used to predict the length distribution of the whole population in the transfer. Any sampling regime should be representative of the population of SBT in a tow pontoon. To avoid bias, every SBT must have the same probability of being measured. When testing sampling regimes for this study, two sampling methodologies were considered: a simple random sample and a systematic random sample. In a simple random sample of size n we select k SBT at random, while in a systematic random sample of size n of population size N, k = N/n is calculated, an integer from 1 to k selected at random as the starting point and every kth measurable SBT is selected. Because the number of SBT in a tow pontoon is large (usually well in excess of 5000 SBT, sometimes >10 000 SBT), it is possible to assume that the sample will be large and that the Central Limit Theorem applies. Therefore, the sample mean (ŷ) is approximately normally distributed with mean μ and variance σ2/n, where μ is the population mean, σ2 is the population variance and n is the sample size. Confidence intervals for the population mean are (ŷ – z[σ × √n–1], ŷ + z[σ × √n–1]) where z is 1.96, 2.33 and 2.58 for 95%, 98% and 99% confidence intervals respectively. Hence, based on the variability in direct caliper length measurements (Table 12), the sample required to obtain a sample mean within e units of the population mean at α% confidence interval will be:
2)(e
zn σαα =

CCSBT-ESC/0809/12 17
Table 12. Sample size required for a predetermined error tolerance and confidence interval Error tolerance e (cm) Confidence % Sample size (no. SBT)
1.0 99 749
1.5 99 333
2.0 99 187
1.0 98 611
1.5 98 271
2.0 98 153
1.0 95 432
1.5 95 192
2.0 95 108
The sample sizes in Table 12 were calculated from the mean and standard deviation of the direct caliper measurements of all SBT transferred into the research pontoons. These sample sizes are only an indication because the population mean and variance of tow pontoons arriving in Port Lincoln—and hence annual catches by Australia’s ranching sector—are not recorded. Uncertainty regarding the error tolerance will increase when direct length is estimated from stereo-video length measurements. To give an indication of how well these sample sizes estimate the population mean, we considered all of the SBT measured with the calipers to be the population. Systematic and simple random samples of 10% and 20% of the population (stereo-video length measurements) were taken from four transfers, and box plots calculated. The samples were taken from Transfers 2, 4, 8 and 12, which were selected owing to their different characteristics: • Transfer 2: many SBT swam back through the transfer gate and were potentially recorded and
measured multiple times. Measurements of SBT swimming back through the transfer gate were removed from the data set, but multiple measurements of SBT without tailstrops swimming forward through the gate could not be identified or deleted. This can also happen during commercial transfers, so Transfer 2 was selected to represent a ‘real-life’ operational scenario
• Transfer 4: mean values of all stereo-video length distributions (of mean length of individual SBT from multiple frames; maximum length of individual SBT from multiple frames; and predicted values from Eqs. 3 & 5) were higher than mean direct caliper length. The mean of Eq. (5) was closest to mean direct caliper length
• Transfer 8: the mean of predicted values from Eq. (3) was the closest to mean direct caliper length
• Transfer 12: means of both Eqs. (3) and (5) were lower than mean direct caliper length. Box plots of predicted length distributions generated from sampling 10% and 20% of the population are shown in Fig. 14. Mean values are also shown for comparison in Table 13: differences between sample means and the population mean vary from 0 to 2 cm regardless of sampling regime. In terms of mean values, there seems to be little difference among sampling regime. Sampling 10% of the population will be more cost-effective and, until an automated

CCSBT-ESC/0809/12 18
system is available, faster. Systematic random sampling is likely to be easier to implement than simple random sampling. Predicted length distributions are usually smaller in range than the distribution of direct length, but this varies among transfers (e.g. see Transfer 12, systematic random sampling of 20% of the population). Note that the population size and hence sample sizes here are small owing to the small number of SBT in the research pontoons (n < 474). Numbers in commercial transfers vary between 1500 and 4000 (typically between 2200 and 2600; T. Jones pers. comm.). When greater numbers of SBT are included in the sample (i.e. during commercial transfer), the error between sample mean and population mean will decrease and confidence will increase (Table 12), countering any increased uncertainty in the measurement error of stereo-video length measurements. This could be tested in future field trials (see ‘Further field work’ below).
Table 13. Transfers 2, 4, 8 and 12. Mean direct caliper lengths, and mean stereo-video lengths, maximum stereo-video lengths, mean of values predicted by Eq. (3) and mean of values predicted
by Eq. (5) under four sampling regimes: simple and systematic random sampling of 10% of the population; and simple and systematic random sampling of 20% of the population
Sampling regime Transfer 2 Transfer 4 Transfer 8 Transfer 12Mean direct caliper length cm 99 99 99 99
Simple random 10% of pop'n Eq. (3) mean 100 100 98 98 Eq. (5) mean 100 100 97 98Systematic random 10% of pop'n Eq. (3) mean 100 101 98 100 Eq. (5) mean 100 101 97 99Simple random 20% of pop'n Eq. (3) mean 100 99 99 98 Eq. (5) mean 100 98 99 97Systematic random 20% of pop'n Eq. (3) mean 101 101 98 99 Eq. (5) mean 100 101 98 99

CCSBT-ESC/0809/12 19
Outcomes Fieldwork for Stage II of the project “Assessing the accuracy and precision of stereo-video and sonar length measurements of southern bluefin tuna (SBT, Thunnus maccoyii)” was completed in early April 2008. A GigE stereo-video camera successfully recorded 16 complete transfers of SBT between two research pontoons using a 9.6 t RMA allocated to Australia at CCSBT14 in October 2007. A DIDSON sonar module provided by Japan was trialed at the same time. Length measurements obtained from both the stereo-video and sonar system were compared against direct length measurements of live SBT. Results are listed under the relevant project objective.
Objective 1. Assess the accuracy and precision of stereo-video length measurements obtained under operational conditions • Measurements of a scale-bar on each day of the field trials showed that the stereo-video camera
remained calibrated throughout deployment on the transfer gate • ANOVA comparing multiple stereo-video length measurements of tailstropped SBT among
transfers revealed that stereo-video length measurements do not differ significantly among transfer for almost all SBT
• Models were developed to predict length distributions from (a) mean length from multiple frames of individual SBT per transfer (Eq. 3) and (b) maximum length from multiple frames of individual SBT per transfer (Eq. 5)
• Means of length distributions predicted by Eq. (3) differed by 0–3 cm from the mean of direct caliper length measurements. In 7 of 16 transfers this difference was 0 cm, and in another 7 transfers this difference was 1 cm
• Means of length distributions predicted by Eq. (5) differed by 0–2 cm from the mean of direct caliper length measurements. In 3 of 16 transfers this difference was 0 cm, and in 9 transfers this difference was 1 cm
• Further discussion of the accuracy and precision of stereo-video and its suitability for implementation in Australia’s ranching sector must also consider the error inherent in direct length measurements of live SBT. The variability of stereo-video measurements among transfers was within the bounds of the variability in direct length measurements of live SBT taken with calipers and cradles.
Objective 2. Develop statistically robust sample sizes and sampling regimes for stereo-video measurement • Using Eqs. (3) and (5), four sampling regimes were tested: simple random sample of 10% of the
population (i.e. all SBT recorded during transfer); systematic random sample of 10% of the population; simple random sample of 20% of the population; systematic random sample of 20% of the population
• Differences between mean direct caliper length of the population and mean sample lengths were 0–2 cm regardless of sampling regime
• Distributions of predicted lengths generated by sampling regimes will improve when the number of SBT in a transfer is increased to levels typical of commercial transfers.

CCSBT-ESC/0809/12 20
Objective 3. Assess the robustness and suitability of the stereo-video equipment in operational conditions • The stereo-video camera supplied by AQ1 Systems proved to be robust and easy to implement
in operational conditions. The system remained calibrated throughout deployment on the transfer gate.
Objective 4. Compare the accuracy, precision and robustness of the stereo-video cameras with a sonar system supplied by Japan • Automated sonar measurements, which were obtained within a short period of time, were
inaccurate compared with stereo-video length measurements of SBT in the 2008 at Port Lincoln. Some adjustment to the detection threshold settings may improve the accuracy of automated sonar measurements in the future
• Manual DIDSON measurements were less accurate than stereo-video length measurements. Replicability of manual measurements drawn by mouse along the curvature of SBT in sonar imagery was not tested owing to the limited time available
• Sonar imagery was coarser than stereo-video imagery and could measure Total Length but not Fork Length during the 2008 trials
• Although DIDSON modules are able to operate under conditions of low light and high turbidity, stereo-video cameras provided more accurate estimates of SBT fork length in conditions observed at Port Lincoln in the April 2008 trials.

CCSBT-ESC/0809/12 21
References Anon (2006) Report of the thirteenth annual meeting of the Commission for the Conservation
of Southern Bluefin Tuna. www.ccsbt.org
Harvey ES, Shortis M, Seager J, Cappo M (2001) The validation of the accuracy and precision of in situ length measurements of southern bluefin tuna by stereo-video. Australian Fisheries Management Authority Research Contract R00/1181. AFMA, Canberra
Harvey ES, Shortis MR, Stadler M, Cappo M (2002) A comparison of the accuracy and precision of digital and analogue stereo-video systems. Mar Tech Soc J 36:38-49
Harvey ES, Cappo M, Shortis MR, Robson S, Buchannan J, Speare P (2003a) The accuracy and precision of underwater measurements of length of and maximum body depth of southern bluefin tuna (Thunnus maccoyii) with a stereo-video system. Fish Res 63:315-326
Harvey ES, Shortis M, Seager J, Robson S (2003b) The implementation and validation of a stereo-video system for measuring the length of southern bluefin tuna during transfers. Final Report. Australian Fisheries Management Authority Research Contract R01/1299. AFMA, Canberra
Harvey ES, Shortis M, Seager J, Hall N (2005) Refining non intrusive stereo video techniques and protocols for southern bluefin tuna transfers. Final Report. Australian Fisheries Management Authority Research Contract R03/1428. AFMA, Canberra
Larcombe J, McLoughlin K (2008) Fishery status reports 2007: status of fish stocks managed by the Australian Government. Bureau of Rural Sciences, Canberra

CCSBT-ESC/0809/12 22
Figures
Fig. 1. Transfer of SBT from the tow pontoon to research pontoons. Based on mean weight (17.13 kg) of the 40-fish sample taken from the tow pontoon on 19 March, 563 SBT were counted through Transfer Gate (a) by conventional underwater video. A subset (n = 474) was then hooked by handline, tagged with conventional spaghetti tags and transferred by stainless steel slide into the first of two 32 m diam. research pontoons. SBT were transferred multiple times (n = 16) through Transfer Gate (b) between 7 and 9 April

CCSBT-ESC/0809/12 23
Fig. 2. Colour-coded tailstrops attached around the caudal peduncle to individually mark a subset of SBT in transfers

CCSBT-ESC/0809/12 24
Fig. 3. GigE stereo-video camera system and 30 m umbilical chord

CCSBT-ESC/0809/12 25
(a)
(b)
Acoustic camera (DIDSON)
Pan & tilt unit
Underwater cables
PC, Poweron the boat
Attachment
Depth: 2 m
Fig. 4. (a) DIDSON sonar module and adjustable arm. (b) Fixture of the DIDSON sonar module to the collar of the research pontoon

CCSBT-ESC/0809/12 26
Fig. 5. Measurement of an SBT from stereo-video footage using PhotoMeasure. This SBT has been individually marked by a colour-coded tailstrop (solid yellow) attached around the caudal peduncle

CCSBT-ESC/0809/12 27
Fig. 6. Manual measurement of an SBT from sonar footage using DIDSON Control and Display

CCSBT-ESC/0809/12 28
0
20
40
60
80
100
120
1 2 3 4 5 6 7 8 9 10 11 12 13 14 15 16
Transfer
Mea
n lig
ht μ
E m
–2 s
–1
Fig. 7. Mean light recorded during each transfer

CCSBT-ESC/0809/12 29
Fig. 8. GigE stereo-video camera being retrieved from the transfer gate

CCSBT-ESC/0809/12 30
Fig. 9. Mounting the DIDSON sonar module and adjustable arm on the collar of the research pontoon

CCSBT-ESC/0809/12 31
Fig. 10. QQ-plots of direct caliper length measurements against mean stereo-video
measurements (straight frames only) of individual SBT for each technician, Transfer 1

CCSBT-ESC/0809/12 32
Fig. 11a. Tailstropped SBT. Box plot of mean length of multiple frames recorded per transfer, compared with caliper (red square) and cradle (green circle)
direct length measurements

CCSBT-ESC/0809/12 33
Fig. 11b. Tailstropped SBT. Box plot of maximum length of multiple frames recorded per transfer, compared with caliper (red square) and cradle (green
circle) direct length measurements

CCSBT-ESC/0809/12 34
Fig. 12. Direct caliper length distributions, distributions of stereo-video mean and maximum lengths from multiple frames of individual SBT per transfer, and predicted length distributions from Eqs. (3) & (5)

CCSBT-ESC/0809/12 35
Fig. 12. (cont’d) Direct caliper length distributions, distributions of stereo-video mean and maximum lengths from multiple frames of individual SBT per transfer, and predicted length distributions from Eqs. (3) & (5)

CCSBT-ESC/0809/12 36
Mean
0
20
40
60
80
100
120
140
T1 T2 T3 T4 T5 T6 T9 T10 T12 T13 T14 T15 T16
Transfer
Leng
th c
m
DirectTech ATech BDIDSONEchoview
Median
0
20
40
60
80
100
120
140
T1 T2 T3 T4 T5 T6 T9 T10 T12 T13 T14 T15 T16
Transfer
Leng
th c
m
Minimum
0
10
20
30
40
50
60
70
80
90
T1 T2 T3 T4 T5 T6 T9 T10 T12 T13 T14 T15 T16
Transfer
Leng
th c
m
DirectTech ATech BDIDSONEchoview
Maximum
0
50
100
150
200
250
T1 T2 T3 T4 T5 T6 T9 T10 T12 T13 T14 T15 T16
TransferLe
ngth
cm
Fig. 13. Summary statistics (mean, median, minimum and maximum) of manual (Tech A, Tech B) and automated (DIDSON, Echoview) length measurements taken from DIDSON sonar data, compared with direct length measurements of SBT in each transfer. NB direct length measurements are Fork Length, whereas sonar measurements are Total Length. No DIDSON data were available for transfers 7, 8 or 11, and recordings were incomplete for transfers 1 and 10

CCSBT-ESC/0809/12 37
Fig. 14. Distributions of direct length measurements and distributions generated from simple and systematic random sampling of 10 and 20% of the population (i.e. all SBT recorded in Transfers 2, 4, 8 and 12)

CCSBT-ESC/0809/12 38
Fig. 14. (cont’d) Distributions of direct length measurements and distributions generated from simple and systematic random sampling of 10 and 20% of the population (i.e. all SBT recorded in Transfers 2, 4, 8 and 12)

CCSBT-ESC/0809/12 39
Appendix 1 Results: modelling the stereo-video length measurements of tailstropped SBT. Diagnostics for Eqs. 2, 3, 4 & 5.
Appendix 1a. Diagnostics for Eq. (2)
Appendix 1b. Diagnostics for Eq. (3)

CCSBT-ESC/0809/12 40
Appendix 1c. Diagnostics for Eq. (4)
Appendix 1d. Diagnostics for Eq. (5)

CCSBT-ESC/0809/12 41
Appendix 2 A visual comparison of direct caliper length against (a) stereo-video length measurements and (b) sonar length measurements.
2a. Proportional histograms (%, 5 cm length classes) of direct length measurements vs. mean length measurements (from ≤5 measurements per individual) of SBT from stereo-video footage
T1
0
5
10
15
20
25
0–4
10–1
4
20–2
4
30–3
4
40–4
4
50–5
4
60–6
4
70–7
4
80–8
4
90–9
4
100–
104
110–
114
120–
124
130–
134
140–
144
150–
154
160–
164
170–
174
180–
184
190–
194
DirectStereo-video
T2
0
5
10
15
20
25
0–4
10–1
4
20–2
4
30–3
4
40–4
4
50–5
4
60–6
4
70–7
4
80–8
4
90–9
4
100–
104
110–
114
120–
124
130–
134
140–
144
150–
154
160–
164
170–
174
180–
184
190–
194
T3
0
5
10
15
20
25
0–4
10–1
4
20–2
4
30–3
4
40–4
4
50–5
4
60–6
4
70–7
4
80–8
4
90–9
4
100–
104
110–
114
120–
124
130–
134
140–
144
150–
154
160–
164
170–
174
180–
184
190–
194
DirectStereo-video
T4
0
5
10
15
20
25
0–4
10–1
4
20–2
4
30–3
4
40–4
4
50–5
4
60–6
4
70–7
4
80–8
4
90–9
4
100–
104
110–
114
120–
124
130–
134
140–
144
150–
154
160–
164
170–
174
180–
184
190–
194
T5
0
5
10
15
20
25
0–4
10–1
4
20–2
4
30–3
4
40–4
4
50–5
4
60–6
4
70–7
4
80–8
4
90–9
4
100–
104
110–
114
120–
124
130–
134
140–
144
150–
154
160–
164
170–
174
180–
184
190–
194
DirectStereo-video
T6
0
5
10
15
20
25
0–4
10–1
4
20–2
4
30–3
4
40–4
4
50–5
4
60–6
4
70–7
4
80–8
4
90–9
4
100–
104
110–
114
120–
124
130–
134
140–
144
150–
154
160–
164
170–
174
180–
184
190–
194
T7
0
5
10
15
20
25
0–4
10–1
4
20–2
4
30–3
4
40–4
4
50–5
4
60–6
4
70–7
4
80–8
4
90–9
4
100–
104
110–
114
120–
124
130–
134
140–
144
150–
154
160–
164
170–
174
180–
184
190–
194
DirectStereo-video
T8
0
2
4
6
8
10
12
14
16
18
20
0–4
10–1
4
20–2
4
30–3
4
40–4
4
50–5
4
60–6
4
70–7
4
80–8
4
90–9
4
100–
104
110–
114
120–
124
130–
134
140–
144
150–
154
160–
164
170–
174
180–
184
190–
194
5 cm length class

CCSBT-ESC/0809/12 42
2a (cont’d). Proportional histograms (%, 5 cm length classes) of direct length measurements vs. mean length measurements (from ≤5 measurements per individual) of SBT from stereo-video
footage
T9
0
2
4
6
8
10
12
14
16
18
20
0–4
10–1
4
20–2
4
30–3
4
40–4
4
50–5
4
60–6
4
70–7
4
80–8
4
90–9
4
100–
104
110–
114
120–
124
130–
134
140–
144
150–
154
160–
164
170–
174
180–
184
190–
194
DirectStereo-video
T10
0
2
4
6
8
10
12
14
16
18
20
0–4
10–1
4
20–2
4
30–3
4
40–4
4
50–5
4
60–6
4
70–7
4
80–8
4
90–9
4
100–
104
110–
114
120–
124
130–
134
140–
144
150–
154
160–
164
170–
174
180–
184
190–
194
T11
0
2
4
6
8
10
12
14
16
18
20
0–4
10–1
4
20–2
4
30–3
4
40–4
4
50–5
4
60–6
4
70–7
4
80–8
4
90–9
4
100–
104
110–
114
120–
124
130–
134
140–
144
150–
154
160–
164
170–
174
180–
184
190–
194
DirectStereo-video
T12
0
2
4
6
8
10
12
14
16
18
20
0–4
10–1
4
20–2
4
30–3
4
40–4
4
50–5
4
60–6
4
70–7
4
80–8
4
90–9
4
100–
104
110–
114
120–
124
130–
134
140–
144
150–
154
160–
164
170–
174
180–
184
190–
194
T13
0
2
4
6
8
10
12
14
16
18
20
0–4
10–1
4
20–2
4
30–3
4
40–4
4
50–5
4
60–6
4
70–7
4
80–8
4
90–9
4
100–
104
110–
114
120–
124
130–
134
140–
144
150–
154
160–
164
170–
174
180–
184
190–
194
DirectStereo-video
T14
0
5
10
15
20
25
0–4
10–1
4
20–2
4
30–3
4
40–4
4
50–5
4
60–6
4
70–7
4
80–8
4
90–9
4
100–
104
110–
114
120–
124
130–
134
140–
144
150–
154
160–
164
170–
174
180–
184
190–
194
T15
0
5
10
15
20
25
0–4
10–1
4
20–2
4
30–3
4
40–4
4
50–5
4
60–6
4
70–7
4
80–8
4
90–9
4
100–
104
110–
114
120–
124
130–
134
140–
144
150–
154
160–
164
170–
174
180–
184
190–
194
DirectStereo-video
T16
0
2
4
6
8
10
12
14
16
18
20
0–4
10–1
4
20–2
4
30–3
4
40–4
4
50–5
4
60–6
4
70–7
4
80–8
4
90–9
4
100–
104
110–
114
120–
124
130–
134
140–
144
150–
154
160–
164
170–
174
180–
184
190–
194
5 cm length class

CCSBT-ESC/0809/12 43
2b. Proportional histograms (5 cm length classes) of direct length measurements vs. manual (Tech A, Tech B) and automated (DIDSON, Echoview) length measurements of SBT from DIDSON
sonar imagery. NB direct length measurements are Fork Length cm, whereas sonar length measurements are Total Length cm
T1
0
2
4
6
8
10
12
14
16
18
20
0–4
10–1
4
20–2
4
30–3
4
40–4
4
50–5
4
60–6
4
70–7
4
80–8
4
90–9
4
100–
104
110–
114
120–
124
130–
134
140–
144
150–
154
160–
164
170–
174
180–
184
190–
194
DirectDIDSONEchoviewTech ATech B
T2
0
5
10
15
20
25
0–4
10–1
4
20–2
4
30–3
4
40–4
4
50–5
4
60–6
4
70–7
4
80–8
4
90–9
4
100–
104
110–
114
120–
124
130–
134
140–
144
150–
154
160–
164
170–
174
180–
184
190–
194
T3
0
2
4
6
8
10
12
14
16
18
20
0–4
10–1
4
20–2
4
30–3
4
40–4
4
50–5
4
60–6
4
70–7
4
80–8
4
90–9
4
100–
104
110–
114
120–
124
130–
134
140–
144
150–
154
160–
164
170–
174
180–
184
190–
194
DirectDIDSONEchoviewTech ATech B
T4
0
2
4
6
8
10
12
14
16
18
20
0–4
10–1
4
20–2
4
30–3
4
40–4
4
50–5
4
60–6
4
70–7
4
80–8
4
90–9
4
100–
104
110–
114
120–
124
130–
134
140–
144
150–
154
160–
164
170–
174
180–
184
190–
194
T5
0
2
4
6
8
10
12
14
16
18
20
0–4
10–1
4
20–2
4
30–3
4
40–4
4
50–5
4
60–6
4
70–7
4
80–8
4
90–9
4
100–
104
110–
114
120–
124
130–
134
140–
144
150–
154
160–
164
170–
174
180–
184
190–
194
DirectDIDSONEchoviewTech ATech B
T6
0
5
10
15
20
25
0–4
10–1
4
20–2
4
30–3
4
40–4
4
50–5
4
60–6
4
70–7
4
80–8
4
90–9
4
100–
104
110–
114
120–
124
130–
134
140–
144
150–
154
160–
164
170–
174
180–
184
190–
194
T9
0
2
4
6
8
10
12
14
16
18
20
0–4
10–1
4
20–2
4
30–3
4
40–4
4
50–5
4
60–6
4
70–7
4
80–8
4
90–9
4
100–
104
110–
114
120–
124
130–
134
140–
144
150–
154
160–
164
170–
174
180–
184
190–
194
DirectDIDSONEchoviewTech ATech B
T10
0
2
4
6
8
10
12
14
16
18
20
0–4
10–1
4
20–2
4
30–3
4
40–4
4
50–5
4
60–6
4
70–7
4
80–8
4
90–9
4
100–
104
110–
114
120–
124
130–
134
140–
144
150–
154
160–
164
170–
174
180–
184
190–
194
5 cm length class

CCSBT-ESC/0809/12 44
2b (cont’d). Proportional histograms (%, 5 cm length classes) of direct length measurements vs. manual (Tech A, Tech B) and automated (DIDSON, Echoview) length measurements of SBT from
DIDSON sonar imagery. NB direct length measurements are Fork Length cm, whereas sonar length measurements are Total Length cm
T12
0
2
4
6
8
10
12
14
16
18
20
0–4
10–1
4
20–2
4
30–3
4
40–4
4
50–5
4
60–6
4
70–7
4
80–8
4
90–9
4
100–
104
110–
114
120–
124
130–
134
140–
144
150–
154
160–
164
170–
174
180–
184
190–
194
DirectDIDSONEchoviewTech ATech B
T13
0
2
4
6
8
10
12
14
16
18
0–4
10–1
4
20–2
4
30–3
4
40–4
4
50–5
4
60–6
4
70–7
4
80–8
4
90–9
4
100–
104
110–
114
120–
124
130–
134
140–
144
150–
154
160–
164
170–
174
180–
184
190–
194
T14
0
2
4
6
8
10
12
14
16
18
20
0–4
10–1
4
20–2
4
30–3
4
40–4
4
50–5
4
60–6
4
70–7
4
80–8
4
90–9
4
100–
104
110–
114
120–
124
130–
134
140–
144
150–
154
160–
164
170–
174
180–
184
190–
194
DirectDIDSONEchoviewTech ATech B
T15
0
2
4
6
8
10
12
14
16
18
20
0–4
10–1
4
20–2
4
30–3
4
40–4
4
50–5
4
60–6
4
70–7
4
80–8
4
90–9
4
100–
104
110–
114
120–
124
130–
134
140–
144
150–
154
160–
164
170–
174
180–
184
190–
194
T16
0
5
10
15
20
25
30
0–4
10–1
4
20–2
4
30–3
4
40–4
4
50–5
4
60–6
4
70–7
4
80–8
4
90–9
4
100–
104
110–
114
120–
124
130–
134
140–
144
150–
154
160–
164
170–
174
180–
184
190–
194
DirectDIDSONEchoviewTech ATech B
5 cm length class

CCSBT-ESC/0809/12 45
Appendix 3 Mean (±SD), minimum and maximum sonar length measurements per transfer. Manual measurements: Technician A, Technician B; Automated measurements: DIDSON, Echoview
Transfer
Technician A Technician B DIDSON EchoviewMean ± SD Min. Max. Mean ± SD Min. Max. Mean ± SD Min. Max. Mean ± SD Min. Max. Mean ± SD Min. Max.
T1 99 ± 11 72 129 116 ± 19 78 174 112 ± 17 69 153 61 ± 19 31 117 65 ± 17 38 106T2 99 ± 11 72 129 108 ± 14 57 146 107 ± 15 46 142 91 ± 34 32 198 72 ± 19 32 181T3 99 ± 11 72 129 104 ± 13 51 143 103 ± 14 76 147 68 ± 26 33 155 69 ± 21 30 181T4 99 ± 11 72 129 108 ± 11 80 140 106 ± 12 75 139 85 ± 26 30 163 78 ± 20 30 161T5 99 ± 11 72 129 102 ± 13 73 160 100 ± 13 68 137 68 ± 25 32 153 65 ± 20 32 95T6 99 ± 11 72 129 110 ± 13 75 143 105 ± 12 81 139 76 ± 25 33 151 89 ± 21 34 135T9 99 ± 11 72 129 101 ± 13 70 156 102 ± 14 50 136 84 ± 30 31 157 84 ± 21 38 141T10 99 ± 11 72 129 107 ± 13 76 150 105 ± 22 32 155 90 ± 25 32 151 58 ± 19 26 118T12 99 ± 11 72 129 102 ± 13 61 146 108 ± 14 56 140 87 ± 27 31 164 87 ± 18 53 191T13 98 ± 11 72 127 103 ± 15 64 140 100 ± 18 40 135 83 ± 23 33 154 82 ± 26 40 193T14 98 ± 11 72 127 105 ± 12 67 136 102 ± 15 36 155 92 ± 29 32 160 92 ± 21 46 143T15 98 ± 11 72 127 101 ± 12 67 130 98 ± 16 49 136 70 ± 22 32 149 86 ± 21 48 143T16 98 ± 11 72 127 104 ± 14 72 132 108 ± 14 74 134 86 ± 28 30 160 60 ± 14 35 73
Direct length measurement(Folk Length cm)
Sonar length measurement(Total Length cm)