assessing peanut consumption in a population of … sofianuou-katsoulis...original article assessing...
TRANSCRIPT

ORIGINAL ARTICLE
Assessing Peanut Consumption in a Population of Mothersand Their Children in the UK
Validation Study of a Food Frequency Questionnaire
Aikaterini Sofianou-Katsoulis, MD, MRCPCH, MSc,1 David Mesher, MSc,2 Peter Sasieni, PhD,2
George Du Toit, FRCPCH,3 Adam T. Fox, FRCPCH,3 and Gideon Lack, FRCPCH3
Background: Food frequency questionnaires (FFQs) are essentialtools to investigate the relationship between peanut consumptionand the development of peanut allergy. The aim was to validate a50-item FFQ for use in peanut protein sensitization studies.Methods: There were 38 mother-child pairs visiting a pediatricclinic of a London hospital included. Mothers recorded their ownand their child’s diet, using a 7 day food diary (7DFDR), completedprospectively over week. Six months later, they tried to recall theconsumption of food items for the index week on a FFQ.Results: Of these, 33 out of 38 mothers completed both the 7DFDRand the recall FFQ. Although there was considerable variation at theindividual level between the 2 tools, there was extremely close agree-ment between the mean 7DFDR response and the FFQ when consid-ering groups of fives with similar FFQ levels. Agreement was apparenton both peanut and other control foods consumption patterns.Conclusion: �he FFQ will reliably divide the population intogroups with markedly different peanut consumption levels. It accu-rately reflects true adults and children peanut consumption, espe-cially at low levels of peanut consumption, as it was validatedagainst the gold standard, the 7DFDR. It also provides a goodmeasure of other foods consumption.
Key Words: validation, food frequency questionnaire, recall,children
(WAO Journal 2011; 4:38–44)
The valid measurement of habitual food, energy or specificnutrient intake is required in studies that investigate the
link between nutrition and disease outcomes. A major chal-
lenge in this field of research is the accurate determination ofdietary intake.1 In the absence of a validated biomarker, theuse of 24 hours food diaries, particularly when performedmore than 7 consecutive days, is considered to be by many,the best method for determining dietary intake. However,dietary records are labor intensive and require individuals tobe followed-up prospectively and regularly. Hence, retro-spective food frequency questionnaires (FFQs) have beenused extensively in this field for the measurement of alcohol,2vitamins,3 fatty acids,4 and mineral consumption.5 It is es-sential, therefore, that FFQs are validated against a goldstandard, to verify that they reflect the accurate recall ofconsumption.6
The acceptability of an ‘instrument’ for measuringdietary intake will depend on the component of diet and thestudy design in which it is to be used. In the field of FoodAllergy it is of interest to relate dietary intake (and inparticular, the timing and quantification of food allergenexposure) to disease status. A common design is a casecontrol study in which dietary questionnaires are given tochildren and their parents before allergy testing. The aim ofthe questionnaires is to divide the study population intogroups with very low, low, medium, high, and very highexposure to a particular allergen.
The aim of this study was to validate the retrospectiveuse of a 50 item semi-quantitative FFQ against a 7DFDR goldstandard, for use in research on peanut allergy. The quanti-tative assessment of the association between peanut proteinexposure and subsequent development of peanut allergy andthe time this sensitization occurs are currently under research.
SUBJECTS AND METHODS
Dietary Record and FFQ DesignA. Food Frequency Questionnaire (FFQ)
The semi-quantitative food frequency questionnairecontained a predefined list of food items commonly con-sumed by families living in the United Kingdom. This FFQhad been validated previously for recall but has not beenvalidated against a gold standard.7 Eighteen high-peanutprotein containing food items were also included. To makethe latter list as accurate and complete as possible, we madeuse of both the pediatric dietitians’ peanut avoidance diet
From the 1Institute of Child Health, M.Asias 76, Gr-11527, Athens, Greece.St Mary’s Hospital, Paediatric Department, QEQM Building, PraedStreet, W2 1NY, London, UK; 2Centre for Epidemiology, Mathematicsand Statistics, Wolfson Institute for Preventive Medicine, Queen MaryUniversity of London, Barts and The London School of Medicine andDentistry, Charterhouse Square, London, EC1M 6BQ, UK; 3King’sCollege, London. MRC & Asthma UK Centre in Allergic Mechanisms ofAsthma, Division of Asthma, Allergy and Lung Biology. Guy’s and St.Thomas’ NHS Foundation Trust, London. St Mary’s Hospital, PaediatricDepartment, QEQM Building, Praed Street, W2 1NY, London, UK.
Correspondence to: Aikaterini Sofianou-Katsoulis, MD, Paediatrician, ResearchFellow, Institute of Child Health, M.Asias 76, Gr-11527, Athens, Greece.
Copyright © 2011 by World Allergy Organization
38 WAO Journal ● February 2011

sheets (that lists common peanut-containing foods), and theAnaphylaxis Campaign (a charitable organization that offerssupport to the families of children with allergies) food lists.Given that refined peanut oils contain negligible quantities ofprotein, peanut oil containing foods were not included. Sim-ilarly, items that listed peanut either as a trace ingredient or asa possible contaminant were not placed on the questionnairebecause of their minimal protein content.
The FFQ for peanut included 13 questions about peanutconsumption combined with 37 questions on the consumptionof other food groups so that mothers filling out the question-naires would not realize that peanut was the focus of thestudy. Peanut items, however, were interspersed with otherbetween a variety of other food items and different foodcategories were all mixed among each other, to prevent themothers’ attention being biased toward peanut consumption(Table 1). The questionnaire was also limited in size to allowfor completion within �10 minutes. We made use of 7consecutive day food diaries, thereby recording consumptionthrough all days of the week. Use of more than 7 food diarieshas not shown to give a more efficient record of the true diet.8Quantities listed in both the FFQs and in the 7-day fooddiaries (7DFDR) were in portion sizes as recommended bythe Ministry of Agriculture;9 however, for prepacked snackssuch as chocolates, the number of bars consumed was re-quested. The weight in grams of peanut protein in the relevantfood items was provided by the manufacturers. The FFQ isidentical to that used in the test–retest validation study7 and inthe epidemiological studies carried out by our group.10,11
B. Seven Days Food Diaries (7DFDR)The 7DFDR included the same predefined list of food
items and the same serving sizes as the food frequencyquestionnaires. Table 1 demonstrates the listed food itemsand portions used in both instruments. A total of 7 records foreach 24 hour period during the index-week requested infor-mation on amount and times received for each food itemlisted and were obtained from each mother and her childreflecting the diet of a whole week.
Population EnrolmentThe target population of the study was mothers of
children aged 3 to 7 years. The mothers were visiting withtheir children either a General Pediatric clinic or a PediatricAllergy clinic and they were enrolled consecutively betweenMay and November 2005. These populations were targeted torecruit participants with both high and low peanut consump-tion diets. Mother-child pairs were excluded from the study ifthe main carer was not the mother, if the mother was pregnantor breast-feeding (at the time of the study UK governmentrecommendations advised against peanut consumption duringpregnancy and while breast-feeding, in atopic families), andif the mothers understanding of English language was poor.The mothers were given an information sheet at the end of theconsultation to read at home. A few days later, AikateriniSofianou-Katsoulis (ASK) would contact them to ask if theyagreed to participate. In case they did they were sent a packcontacting the FDFDR paperwork, a consent form and aprepaid envelope to return the 7DFDR. The population en-
TABLE 1. Original List of Food Items Included in Both DRsand FFQs and Portion Size
Apples No of fruits
Orange No of fruits
Cherries Handfulls
Pears No of fruits
Whole peanuts Handfulls
Peanut butter on bread Slices
Crunchy Nut Cornflakes Bowls
Crunchy Nut Cornflakes Red Bowls
Shoosh Packets
Bamba Packets
Cadbury’s Star Bar Bars
Cadbury’s Fuse Bars
Cadbury’s Picnic Bars
Revels Bars
Satay sauce Servings
Rowntree’s Lion Bar Bars
Tracker Roasted nut Bars
Reese’s Peanut Butter Cups Cups
Snickers Bars
Biscuits with peanuts Teaspoons
Peanut M&Ms Handful
Peanut brittle ’botnit’ Bars
Musli Bowls
Bran flakes Bowls
Corn flakes Bowls
Coffee Cup
Milk Cup
White yogurt Pots
Tea Cup
White bread No of slices
Cheddar Slices
Mushrooms Spoons
Margarine on bread Slices
Butter on bread Slices
Jam Teaspoon
Fruit loaf slice
Chips Portion of ten
Pasta Bowls
Tuna flakes Spoons
Bounty Bars
Chocolate muffins Muffins
Milk chocolate Bars
Soya sauce Servings
Sweet and sour sauce Servings
Curry sauce Servings
Crisps 50 g pack
Salami Slices
Crackers Crackers
Custard Bowls
Fromage frais Pots
Peanut items were interspersed with other food items to prevent the mothers’attention being biased towards peanut consumption.
WAO Journal • February 2011 FFQ Validation Study
© 2011 World Allergy Organization 39

rolled was not tested with a pilot questionnaire to assess theirconsumption before hand. We ultimately enrolled similarnumber of mothers from either the general Pediatric and theAllergy clinic (assuming that children from the Allergy clinichave often limited peanut consumption) and the 2 groups hadsimilar drop out rate.
EthicsEthics Committee, and Hospital Trust, approval was ob-
tained from Hillingdon Hospital (Uxbridge, Middlesex) and St.Mary’s Research and Development Committee. Informed writ-ten consent was obtained from all mothers before participation.
Data CollectionUpon obtaining consent, 7 food diaries were issued.
Mothers were asked to record their diet and their child’s dietmore than 7 consecutive days, starting any day of the weekthat was convenient for them. This week is referred to as‘index-week’ for the remainder of this paper. Mothers werenot made aware of the study’s particular interest in peanutallergy. Mothers were advised to fill in the forms at the endof each day, reflecting the diet over the past 24 hours. It wasalso recorded if the index-week was a ‘typical week,’ forexample, did the week include a holiday? A reminder (bytelephone or text message) to complete the questionnaire wasissued in the middle of the index-week. The 7DFDRs werereturned in a prepaid envelope at the end of the index-week.All mothers were contacted by post 6 months later and askedto recall their diet for the index-week and the FFQ wasseparately completed for themselves and their child.
The amount of peanut protein consumption (in grams)reported in the food diaries and in the FFQs was gathered.Data regarding fruit (in portions), milk (cups), fat–namelybutter and margarine (grams), and selected wheat items(grams) consumption were collected for use as control foods.
Statistical AnalysisStatistical analyses were performed using Stata version
10.0 (Stata Corp.)12. For each observed FFQ response, wecalculated the mean of the diary responses based on individ-uals with the same or similar FFQ responses. This was donein Stata using a symmetric nearest neighbor running linesmoother (moving average) based on 3, 5 or 7 observations.13
In the absence of ties (individuals with same FFQ result), thatwould be the individual together with the 2 individuals withthe closest smaller FFQ and the one, 2 or 3 with the closestlarger FFQ responses, respectively. This smoothing methodallows graphical representation of average values rather thanthe individual matched data and hence won’t give undueinfluence to outliers. These smoothed lines together with theindividual 7-day diaries were plotted against the FFQ re-sponses separately for mothers and children and according tothe type of food. An illustration of a smoothed line producedby this technique, relating to peanut consumption, is providedin Figure 1a and b.
FFQ responses were graded into 3 equal sized groups(whose size were as far as possible equal) for each food type,denoting low, moderate, and high consumption and formother and children separately. The mean, the SE, and the
upper and lower quartiles of the diaries were then calculatedfor each FFQ-group (Table 2).
To calculate a 50% prediction interval for the diaryresponse for any given value of FFQ, we estimated theconditional mean DR for a given FFQ and the correspondingSD. The prediction interval is such that for a given value onthe FFQ 50% of paired diary responses will be within theprediction intervals at that point (see Appendix for details ofhow these were produced) (Figure 2).
RESULTS
Completion of Follow-UpThere were 72 mothers initially approached and en-
rolled in the study. Out of this number, 21 were enrolled fromthe general Pediatric clinic and 20 from the Pediatric AllergyClinic; 38 mothers finally consented to complete the study, 18
FIGURE 1. a and b, Comparison between FFQ and 7DFDRresponses relating to maternal (a)/children’s (b) weekly pea-nut consumption. When individual 7DFDR/FFQ responsesare compared a greatly variable line is produced- upper leftgraph in both figures. When groups of 5 or 7 individualswith similar FFQ responses are gathered, the average of their7DFDR responses produces a smoothed line (bottom charts).This line is closer to the equality line, that is, the line thatwould be produced assuming that FFQ-7DFDR responses inall individuals would be identical.
Sofianou-Katsoulis et al WAO Journal • February 2011
© 2011 World Allergy Organization40

from the high consumption group and 20 from the lowconsumption group. Of these, 34 out of 38 (89.5%) ofmothers completed both the Food Diaries and the recall FFQsat 6 months. The remaining 4 were contacted and asked toreturn their FFQs, but failed to do so. Another was excluded,because of erratic completion of the FFQ. One mother com-pleted the FFQ relating to her child’s consumption only;hence, there were data from 33 children and 32 mothers.
Validity of FFQTable 2 shows the relationship between Food Diary and
FFQ for each of the food types. It is seen, that in almost allcases, the questionnaires reliably identify groups with differ-ent levels of consumption. With a few exceptions, individualsin the lowest consumption group on the FFQ, had a muchlower mean diary score than did those in the middle FFQ-group; the middle group, in turn, had a much lower meandiary score than did the group with the highest FFQ re-sponses. In all cases, there is a clear distinction between theno/low and high consumption groups.
When FFQ responses are matched to individual7DFDR responses, a great variation is observed (see plotsshowing no smoothing within Fig. 1a and b, other food typesnot shown). When this line is smoothed, we show reasonableagreement for mothers and children’s 7DFDR response whencompared with FFQ response, when groups 5 or 7 individualswith similar FFQ responses are averaged (Fig. 1a and b).
Figure 2 shows the relationship between the mean fooddiary value at a given level of FFQ and also provide 50%prediction bands for food diary responses given the FFQlevel. These bands are such that 50% of individual diaryvalues will fall within the bands for any given FFQ level. Theprediction bands get wider as the FFQ increases. Conse-quently, their prediction value is limited at higher levels ofreported consumption. When considering all food types inthis study, for both mothers and children, the FFQ wasgenerally seen to be unbiased in the low and normal range offood consumption, but to slightly underestimate consumptionat high levels.
DISCUSSIONThe prevalence of IgE-mediated food allergy appears to
have increased over the recent past with �3–6% of childrenin the developed world being affected.14 The increase in foodallergy is, however, best described for peanut allergy.15–17 Forexample, in the UK, 3 sequential studies (cohorts born 1989–2000) demonstrate an increase in the prevalence of peanutallergy from 0.6 to 1.8% over the last 10 years.16,19 PeanutAllergy is considered a public health concern as the conditionis associated with significant morbidity and occasional mor-tality.18 Studies into the etiology of food allergies in general,and peanut allergy in particular, rely on the accurate deter-mination of disease outcome and food allergen exposure(route of exposure, timing, and quantification).19 The FFQ isan essential tool for research in this area, but requires vali-dation before use.
The FFQ that has been validated in this study, haspreviously been validated for retrospective recall of peanutconsumption, where a high degree of correlation (R � 0.95)
TABLE 2. Comparison of FFQ Responses and Mean DRConsumptions FFQ Responses Grouping in Equal SizedGroups (Size is as Far as Possible Equal)
FFQ ResponseNo. of
Individuals
Diary Response
Mean SELower
QuartileUpper
Quartile
Mother (n � 32)
Fruit (portions)
None/low (0–�5) 10 3.05 1.11 0 4
Moderate (5–�8) 11 6.77 1.70 1.5 11
High (8�) 11 9.02 1.78 4.25 16
Peanut (g)
None (0) 12 0.83 0.56 0 0
Low (0.01–�17.5) 6 18.85 12.44 0 25
Moderate (17.5–�35) 7 24.46 8.54 6 53
High (35�) 7 40.60 12.64 28 40.5
Wheat (g)
None/low (0–�42) 11 23.13 5.88 12.6 25.8
Moderate (42–�60) 11 56.28 9.86 35.5 87.3
High (60�) 10 57.99 14.08 25.5 60.5
Milk (cups)
None (0) 13 2.15 0.74 0 3
Low (0.01–�5) 7 0.71 0.36 0 2
Moderate (5–�10) 9 5.22 0.97 2 7
High (10�) 3 7.17 3.66 0 12
Fat (g)
None/low (0–�14) 11 12.73 5.22 0 28
Moderate (14–�28) 10 25.60 10.03 4 40
High (28�) 11 32.73 7.45 16 52
Child (n � 33)
Fruit (portions)
None/low (0–�5) 11 2.68 0.75 1 3.5
Moderate (5–�7) 10 6.48 0.61 4 7
High (7�) 12 5.25 1.51 2 7.5
Peanut (g)
None (0) 19 1.89 1.20 0 0
Low (0.01–�10) 4 9.53 8.84 0 19.05
Moderate (10–�30) 5 28.48 10.97 20 27.9
High (30�) 5 19.01 10.49 0 25
Wheat (g)
None/low (0–�37) 11 35.75 10.06 3.5 48.6
Moderate (37–�65) 11 49.75 7.18 34.9 68
High (65�) 11 67.47 7.34 41.4 91
Milk (cups)
None/low (0–�5) 10 5.15 1.11 2 7
Moderate (5–�7) 13 6.56 1.10 4 7.75
High (7�) 10 13.25 2.02 8 18
Fat (g)
None/low (0–�12) 10 9.40 3.93 0 16
Moderate (12–�24) 10 26.90 4.67 20 40
High (24�) 13 32.31 7.62 16 44
Grouping is performed for each food type, denoting low/none, moderate, and highconsumption and for mother and children separately. The mean, the SE and the upperand lower quartiles of the diaries are then calculated for each FFQ-group.
WAO Journal • February 2011 FFQ Validation Study
© 2011 World Allergy Organization 41

was demonstrated.7 Recently it has been employed in 2published studies10,11 looking at the relationship betweenexposure to peanut and the development of peanut allergy.However, to date, this FFQ had not been validated against agold standard for peanut consumption. Therefore, we tried tovalidate our FFQ against a well accepted gold standard, the7-day food diary.
The results of this study demonstrate a good agreementbetween the FFQ responses and the Food Diaries especially atlow and normal levels of consumption for peanut protein, fats(butter and margarine), selected wheat products, fruit por-tions, and milk cups weekly intake. The recalled consumptionpattern was very similar at these levels for peanut, milk, fats,and fruit consumption. This demonstrates that the partici-pants’ answers were not biased by the fact that consumptionof a specific allergenic food stuff’s consumption was examined.At high levels of consumption the peanut protein consumptionwas slightly underestimated by the FFQs for mothers andchildren. This FFQ does not hence, accurately distinguishbetween different levels consumption at the highly consum-ing group especially among children. This FFQ, however,appears to be a valid and useful tool at differentiating be-tween low, medium, and high range of consumption both inmothers and children.
One of the main strengths of this study is its prospectivedesign that allowed for the recruitment of participating mother-child pairs who were naive to the precise nutritional focus ofthe study, that is, peanut consumption. By including childrenaged 3–7 years, we hoped to target a population that was not
subject to DoH peanut avoidance recommendations at thattime.
Prospective enrolment, from different pediatric clinics,allowed for the inclusion of both low and high peanut consum-ing families. Participation of both high and low peanut consum-ers in this study allowed for assessment of the FFQ at all levelsof consumption. We prevented recall bias concerning peanutconsumption (that is widely known culprit for food allergies) byinterspersing peanut items between other food items.
The children target group was 3–7 year olds. Themajority of children in this age group would either be with theparents or at school, where peanut containing food items arenot widely consumed in the UK. We believe that this con-sumption would be true for this age group. It may have beenless accurate for teenagers, who spend more time out of thehouse. In the latter age group this FFQ may not be an accuratetool in terms of reflecting true diet and would need furthervalidation for that population.
The questionnaire was limited in size to allow for com-pletion within �10 minutes. We made use of 7 consecutive dayfood diaries, thereby recording consumption through all days ofthe week. Use of less than 7 food (ie, 5 or 3 day food diaries) hasbeen proven by other studies to miss important variations in anindividual’s diet that can occur between weekdays and theweekend. Conversely, longer than 7DFDR have not proven togive a more efficient record of the true diet.6
Regular contact with the mothers was provided toensure that the food diaries were properly completed and thatany queries were promptly resolved. Participating mothers
FIGURE 2. 50% Prediction Bands for smoothed points. They demonstrate that 50% of individual diary values will fall withinthe bands for any given FFQ level. The prediction bands get wider as the FFQ increases, hence their prediction value is limitedat higher levels of reported consumption.
Sofianou-Katsoulis et al WAO Journal • February 2011
© 2011 World Allergy Organization42
were also contacted if questions were illegibly or incom-pletely answered.
Despite its careful design and the vigorous follow upthis study has a few limitations. The original number ofwomen asked to participate in the study was 72. Just over halfof them finally agreed to complete the paperwork and 34 ofthem remained on the follow up stage. A significant numberof mothers withdrew after receipt of the 7DFDR pack. Otherswere not able to cope (because of increased workload), oftenhad younger children to look after, or had a subsequentpregnancy. Despite the large number who failed to completethe study, however, we were left with 2 groups (high and lowlevel) of peanut protein consumers of similar size.
One could argue that no biomarkers of consumptionwere not used to validate consumption. Use of such Biomark-ers is considered by many researchers to reflect more accu-rately true diet.6 To our knowledge there are no specificbiomarkers that distinguish between peanut, wheat, fat, andmilk consumption.
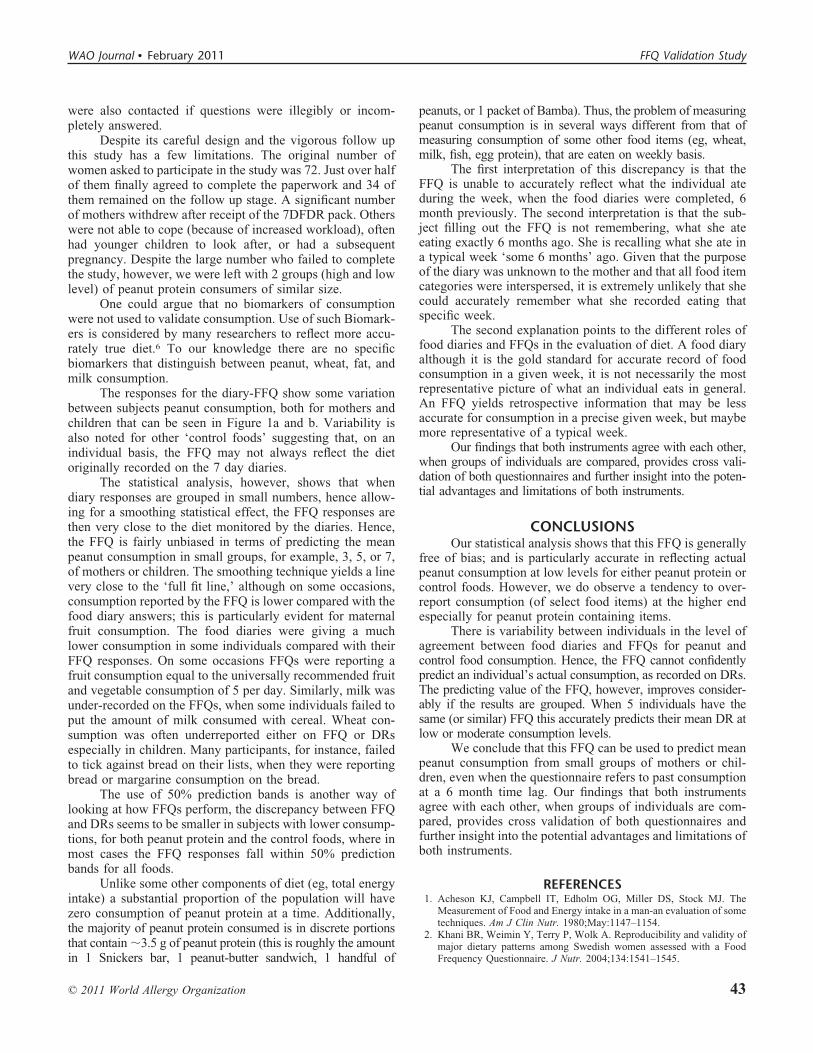
The responses for the diary-FFQ show some variationbetween subjects peanut consumption, both for mothers andchildren that can be seen in Figure 1a and b. Variability isalso noted for other ‘control foods’ suggesting that, on anindividual basis, the FFQ may not always reflect the dietoriginally recorded on the 7 day diaries.
The statistical analysis, however, shows that whendiary responses are grouped in small numbers, hence allow-ing for a smoothing statistical effect, the FFQ responses arethen very close to the diet monitored by the diaries. Hence,the FFQ is fairly unbiased in terms of predicting the meanpeanut consumption in small groups, for example, 3, 5, or 7,of mothers or children. The smoothing technique yields a linevery close to the ‘full fit line,’ although on some occasions,consumption reported by the FFQ is lower compared with thefood diary answers; this is particularly evident for maternalfruit consumption. The food diaries were giving a muchlower consumption in some individuals compared with theirFFQ responses. On some occasions FFQs were reporting afruit consumption equal to the universally recommended fruitand vegetable consumption of 5 per day. Similarly, milk wasunder-recorded on the FFQs, when some individuals failed toput the amount of milk consumed with cereal. Wheat con-sumption was often underreported either on FFQ or DRsespecially in children. Many participants, for instance, failedto tick against bread on their lists, when they were reportingbread or margarine consumption on the bread.
The use of 50% prediction bands is another way oflooking at how FFQs perform, the discrepancy between FFQand DRs seems to be smaller in subjects with lower consump-tions, for both peanut protein and the control foods, where inmost cases the FFQ responses fall within 50% predictionbands for all foods.
Unlike some other components of diet (eg, total energyintake) a substantial proportion of the population will havezero consumption of peanut protein at a time. Additionally,the majority of peanut protein consumed is in discrete portionsthat contain �3.5 g of peanut protein (this is roughly the amountin 1 Snickers bar, 1 peanut-butter sandwich, 1 handful of
peanuts, or 1 packet of Bamba). Thus, the problem of measuringpeanut consumption is in several ways different from that ofmeasuring consumption of some other food items (eg, wheat,milk, fish, egg protein), that are eaten on weekly basis.
The first interpretation of this discrepancy is that theFFQ is unable to accurately reflect what the individual ateduring the week, when the food diaries were completed, 6month previously. The second interpretation is that the sub-ject filling out the FFQ is not remembering, what she ateeating exactly 6 months ago. She is recalling what she ate ina typical week ‘some 6 months’ ago. Given that the purposeof the diary was unknown to the mother and that all food itemcategories were interspersed, it is extremely unlikely that shecould accurately remember what she recorded eating thatspecific week.
The second explanation points to the different roles offood diaries and FFQs in the evaluation of diet. A food diaryalthough it is the gold standard for accurate record of foodconsumption in a given week, it is not necessarily the mostrepresentative picture of what an individual eats in general.An FFQ yields retrospective information that may be lessaccurate for consumption in a precise given week, but maybemore representative of a typical week.
Our findings that both instruments agree with each other,when groups of individuals are compared, provides cross vali-dation of both questionnaires and further insight into the poten-tial advantages and limitations of both instruments.
CONCLUSIONSOur statistical analysis shows that this FFQ is generally
free of bias; and is particularly accurate in reflecting actualpeanut consumption at low levels for either peanut protein orcontrol foods. However, we do observe a tendency to over-report consumption (of select food items) at the higher endespecially for peanut protein containing items.
There is variability between individuals in the level ofagreement between food diaries and FFQs for peanut andcontrol food consumption. Hence, the FFQ cannot confidentlypredict an individual’s actual consumption, as recorded on DRs.The predicting value of the FFQ, however, improves consider-ably if the results are grouped. When 5 individuals have thesame (or similar) FFQ this accurately predicts their mean DR atlow or moderate consumption levels.
We conclude that this FFQ can be used to predict meanpeanut consumption from small groups of mothers or chil-dren, even when the questionnaire refers to past consumptionat a 6 month time lag. Our findings that both instrumentsagree with each other, when groups of individuals are com-pared, provides cross validation of both questionnaires andfurther insight into the potential advantages and limitations ofboth instruments.
REFERENCES1. Acheson KJ, Campbell IT, Edholm OG, Miller DS, Stock MJ. The
Measurement of Food and Energy intake in a man-an evaluation of sometechniques. Am J Clin Nutr. 1980;May:1147–1154.
2. Khani BR, Weimin Y, Terry P, Wolk A. Reproducibility and validity ofmajor dietary patterns among Swedish women assessed with a FoodFrequency Questionnaire. J Nutr. 2004;134:1541–1545.
WAO Journal • February 2011 FFQ Validation Study
© 2011 World Allergy Organization 43

3. Martin- Moreno JM, Boyle P, Gorgojo L, Maisonneuve P, Fernandez-Rodriguez JC, Salvini S, Willett W. Development and validation of aFood Frequency Questionnaire in Spain. Int. J Epidemiol. 1993;22(3):512–519.
4. �roadfield E, McKeever T, Fogarty A, Britton J. Measuring dietary fattyacid intake: validation of a food frequency questionnaire against 7dweighed records. Br J Nutr. 2003;90:215–220.
5. Rockett HR, Breitenbach RD, Frazier L, Witschi J, Wolf AM, Field AE,Colditz GA. Validation of a youth/adolescent Food Frequency Ques-tionnaire. Preventive Med. 1997;26:808–816.
6. Cade J, Thompson R, Burley V, Warm D. Development, validation andutilisation of food frequency questionnaires: a review. Public HealthNutr. 2002;5(4):567–587.
7. Fox AT, Meyer R, DuToit G, Syed H, Sasieni P, Lack G. Retrospectiverecall of maternal peanut consumption using a multiple food-frequencyquestionnaire. S African J Clin Nutr. 2006;19(4):154–160.
8. Stram DO, Longnecker MP, Shames L, Kolonel LN, Wilkens LR, et al.Efficient design of a diet validation study. American Journal of Epide-miology. 1995;142(3):353–360.
9. Helen C. (Ed). Food Portion Sizes. 2nd ed. London: Ministry ofAgriculture, Fisheries & Food, The Stationery Office Books; 1994.
10. Du Toit G, Katz Y, Sasieni-Mesher D, Maleki SJ, Fisher HR, Fox AT,Turcanu V, et al. Early consumption of peanuts in infancy is associatedwith a low prevalence of peanut allergy. J Allergy Clin Immunol.2008;122(5):984–991.
11. Fox AT, Sasieni P, du Toit G, Syed H, Lack G. Household PeanutConsumption as a Risk Factor for the Development of Peanut Allergy.J Allergy Clin Immunol. 2009;123(2):417–423.
12. Stata version 10.0 (Stata Corporation).13. Sasieni P. sed9: Symmetric nearest neighbor linear smoothers. Stata
Technical Bulletin 24:10–14. In Stata Technical Bulletin Reprints,4:97–101. College Station, TX: Stata Press; 1995.
14. Sicherer SH, Sampson HA. 9. Food allergy. J Allergy Clin Immunol.2006;117:S470–S475.
15. Grundy J, Matthews S, Bateman B, Dean T, Arshad SH. Rising preva-lence of allergy to peanut in children: data from 2 sequential cohorts.J Allergy Clin Immunol. 2002;110:784–789.
16. Hourihane JO, Aiken R, Briggs R, Gudegeon LA, Grimshaw KE, et al.The impact of government advice to pregnant mothers regarding peanutavoidance on the prevalence of peanut allergy in United Kingdomchildren at school entry. J Allergy Clin Immunol. 2007;119:1197–1202.
17. Sicherer SH, Munoz-Furlong A, Sampson HA. Prevalence of peanut andtree nut allergy in the United States determined by means of a randomdigit dial telephone survey: a 5-year follow-up study. J Allergy.
18. Warner JO. Peanut allergy: a major public health issue. PAI 1999;10:14–20.
19. Lack G, Fox D, Northstone K, Golding J, Avon Longitudinal Study ofParents and Children Study Team. Factors associated with the develop-ment of peanut allergy in childhood. N Engl J Med. 2003;348:977–985.
APPENDIX
Creation of 50% Prediction Bands for Figure 2To calculate a 50% prediction interval for the diary
response for any given value of FFQ, we estimated theconditional mean DR for a given FFQ and the correspondingSD. Formally, the bands are given by: f(FFQ) � z�S(FFQ),where f(FFQ) is a smooth function estimating the mean andS(FFQ) is a linear function estimating the SD of DR givenFFQ. The smooth f was obtained as a local linear regressionfor 19 symmetric nearest neighbor diary responses and con-strained to be greater than or equal to zero. S(FFQ) wasobtained by a linear regression of the square root of thesmoothed squared residuals against FFQ. The mean �0.675*SD gives a 50% prediction interval.
Sofianou-Katsoulis et al WAO Journal • February 2011
© 2011 World Allergy Organization44