assessing oregon’s retail environment...costs of excessive alcohol use excessive drinking causes...
TRANSCRIPT

Assessing Oregon’s Retail Environment
Shining Light on Alcohol Industry Tactics

Today’s Speakers
2
Shaun ParkmanHealth Promotion Strategist
Sharon CoryellResearch Analyst
Amanda CuePolicy Specialist

Today’s Agenda
Defining the Problem
Why did we assess the alcohol retail environment?
Understanding Our Data
What did we do?
Building Community Support
How do we use our retail assessment findings?
Sharing Experiences
How can we counter the alcohol industry’s influence?
3

Learning Objectives
Understand the alcohol retail environment across
Oregon, including alcohol industry targeting of
youth, communities of color, and low-income
residents.
Align assessment findings with community
readiness and grantee work plans.
Prepare to disseminate assessment findings in
local communities.
4

DEFINING THE PROBLEM
Understanding the risks of alcohol
consumption in Oregon
5

Alcohol use is the #3 cause of
preventable death in Oregon
88,000 people die
from excessive
drinking in the
U.S. each year.
1,900 people in
Oregon die each
year from
excessive alcohol
use.6

Alcohol-related deaths in Oregon
Chronic61%
Acute39%
• Poisoning• Injuries• Motor-vehicle
crashes
• Dependency• Liver disease• Cancers• Heart disease• Stroke• Pancreatitis• Fetal AS
Source: Centers for Disease Control and Prevention. Alcohol Related Disease Impact (ARDI) application, 2013. Alcohol attributable deaths to due any alcohol use, average for Oregon (2006-2010)


3.5 billion
The annual cost of excessive alcohol use to Oregon’s economy each year due to lost productivity, health care expenses, criminal justice costs, and motor vehicle crashes.
That’s $2.08 per drink consumed.
Costs of Excessive Alcohol Use
Excessive drinking causes
harm to communities,
families and individuals
from serious injuries and car
crashes, heart and liver
disease, and certain
cancers.
It also fuels drug and
alcohol addiction, domestic
violence, risky sexual
behavior and lower
educational attainment.

This equates to about 587 drinks
per year
Apparent per capita alcohol consumption, Oregon, 1990-2016 (pure alcohol in gallons)

Binge drinking is common among many groups.
Sources: 2016 Oregon Behavioral Risk Factor Surveillance System (BRFSS);2017 Oregon Healthy Teens (OHT) Survey

Alcohol Industry Spending
The alcohol industry spends nearly $3.5 billion
on product promotion.
29% of advertising dollars promoted alcohol
products in the retail environment
12

UNDERSTANDING OUR DATA
Assessing the Retail Environment
13

Assessment Snapshot
3,100 Tobacco retailers in Oregon (minor accessible)
2,000 Retail assessments completed
36 Counties participated
(both ADPEP and TPEP)
2 Tribal partners participated

Assessment Tool
2018 data will provide a
baseline for all future
assessments.
Oregon is one of the
first states to include
alcohol in a tobacco
retail environment
assessment.
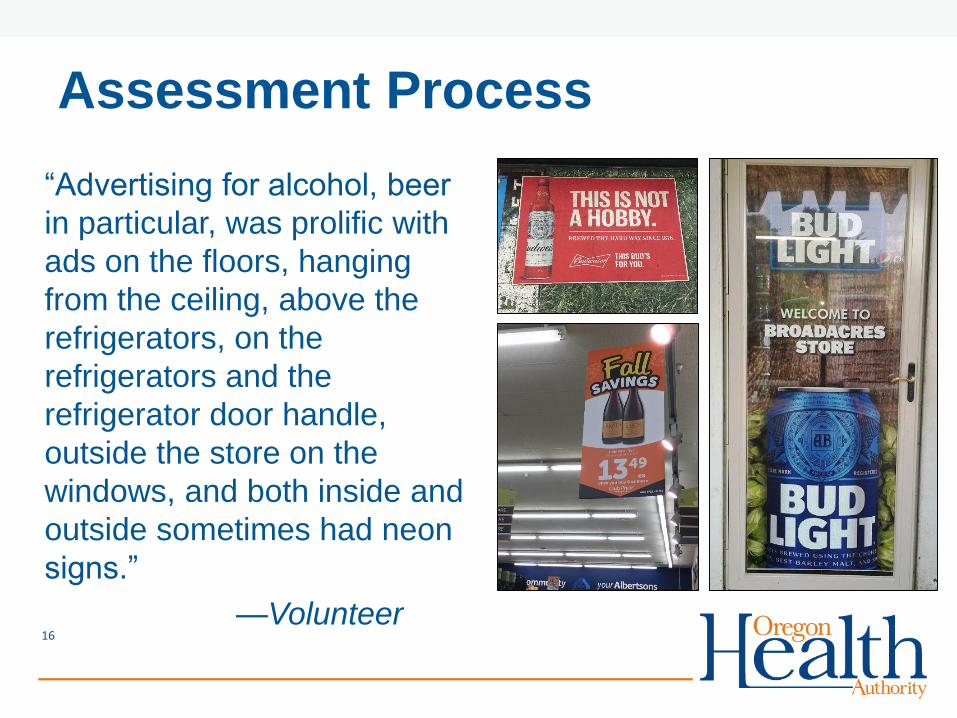
Assessment Process
“Advertising for alcohol, beer
in particular, was prolific with
ads on the floors, hanging
from the ceiling, above the
refrigerators, on the
refrigerators and the
refrigerator door handle,
outside the store on the
windows, and both inside and
outside sometimes had neon
signs.”
—Volunteer16

Retail Store Types
17
Store Type Percentage
Convenience Stores 63%
Market 10%
Grocery Store 10%
Drug Store 5%
Other 4%
Tobacco Shop 1%
Certified Smoke Shops 0.33%

Outdoor Ads
Nearly 50% of retailers had outside
advertising for at least one type of alcoholic
beverage.
“Some stores had large signs with their store name
that were cobranded with a beer company.”
—Volunteer 18

23% of the retail locations had large beer displays
19
Entering the Store

Product Availability
Most retailers sold alcohol:
92% beer
86% hard cider
85% alcopop or wine coolers
84% wine
75% malt liquor

Price Discounts
53% offered a price discount
for at least one alcohol
product
31% promoted alcopops
24% promoted malt liquor

Flavors
85% of retailers had
alcopops for sale
22

Flavors
"It is impossible to discuss harmful alcohol
consumption among youth and not include
supersized alcopops. These low-priced and
sweet-tasting beverages are associated with
reports of dangerous consequences among
youth.”
David Jernigan, PhD
Director of the Center on Alcohol Marketing and Youth
Johns Hopkins Bloomberg School of Public Health
23

Targeting Youth
50% of retailers
placed alcohol
products 12 inches
from toys and
candy
24

Targeting Youth
“In most stores the beer and other alcohol was near the
back of the store with all the other drinks. Sometimes we
would find soda pop right next to the alcohol in the
refrigerators.”
- Teen Council Member25

Targeting Youth
“Some beer companies
used sports to advertise.
Budweiser and Bud Lite all
used schools such as
University of Oregon and
Oregon State University to
advertise, which condones
drinking and possibly
underage drinking.”
- Youth Volunteer
26

Alcohol Industry Influence
27
“My big takeaway was I thought it was important that we
did the retail assessment. It made us more
knowledgeable of what is being sold in the retail
environment. Some youth see this environment all the
time and this is their normal routine. … I now cannot
look at the store environment the same.
Advertisements are much more apparent and so are
paraphernalia for alcohol and tobacco.”
- Volunteer

BUILDING COMMUNITY SUPPORT
Changing the retail environment
28

PICTURES
29

30

Place Matters Oregon
Conference
31
C. Debra Furr-Holden, PhDMichigan State University College of Human Medicine

Density and Location
32

Taking Action
What are your next
steps for countering the
alcohol industry’s
influence?
How will data from the
assessment build your
community’s readiness?
33

Community Context
34

COMMUNICATING RESULTS
Disseminating Data in Your Community

Products
Reports
• Data Summaries
Coming soon!
• Statewide
• County Retail
Assessment Summaries
Earned Media
• Toolkit
– Email announcement
– Press release
– Social media posts
– Newsletter article
– Talking points
– PPT presentation
• Technical Assistance
36

Questions?
37

38
THANK YOU!
Questions?
Shaun Parkman
HEALTH PROMOTION STRATEGIST
(971) 673-1051