assessing molybdenum adsorption onto an industrial soil and iron minerals
TRANSCRIPT
Assessing Molybdenum Adsorption onto an Industrial Soiland Iron Minerals
Chunnu Geng & Xuping Jian & Yuhong Su &
Qinhong Hu
Received: 23 June 2013 /Accepted: 4 September 2013 /Published online: 19 September 2013# Springer Science+Business Media Dordrecht 2013
Abstract The processes affecting adsorption of molyb-denum (Mo) in alkaline industrial soils are not wellknown, as most research on Mo fate and transport hasfocused on agricultural soils. In this work, we performedstudies of soil extraction, as well as sorption studiesusing both batch and stirred-flow cell approaches.
After 60 h of extraction, we observed, even where threeextractable fractions were present, 14.1 % of the boundresidue was extracted by CaCl2 solution. This indicatesthat the procedures recommended by the Commissionof European Communities Bureau of Reference, whichis targeted to metals cations, not anions due to the use ofextractants at acidic pH, are not a suitable approach forassessing mobility and availability of Mo in alkalinesoils. Because the observed extent of Mo adsorptiononto two Fe minerals, goethite, and amorphous ironhydroxide (HFO) was 2 to 3 orders of magnitude higherthan that onto the soil, soils amended with these Feminerals were found to have a higher Mo adsorptioncapacity, with HFO yielding stronger sorption than goe-thite. The additivity principle was successfully used topredict Mo adsorption with the HFO-amended soil butfailed to do so for the goethite-amended soil. The best fitsorption isotherms and estimated parameters wereslightly different from batch and flow cell experiments.The Kd values of sorption coefficient in our industrialsoils and Fe-minerals-amended soils ranged from 0.19to 1.45 L/kg from both experimental approaches; thislow adsorption potential renders it infeasible to immo-bilizeMo into the soil matrix and reduceMo availabilityby amending the soil with Fe minerals. In the future,materials with potentially highMo adsorption capacitiesshould be identified, screened, and characterized forpermeable reactive barriers application.
Keywords Alkaline industrial soils . Adsorptionisotherm . Additivity principle . Batch and flow cellsystems .Mo immobilization
Water Air Soil Pollut (2013) 224:1743DOI 10.1007/s11270-013-1743-6
C. GengInstitute of Urban Environment,Chinese Academy of Sciences,No. 1799 Jimei Road, 361021 Xiamen, Chinae-mail: [email protected]
C. GengInstitute of Soil Science, Chinese Academy of Sciences,Nanjing 210008, China
X. Jian :Y. SuCollege of Chemistry and Chemical Engineering,Xinjiang University,Urumqi 830046, China
X. Jiane-mail: [email protected]
Y. Sue-mail: [email protected]
Q. Hu (*)College of Environmental Studies,China University of Geosciences,Wuhan 430074, Chinae-mail: [email protected]
Q. HuDepartment of Earth and Environmental Sciences,The University of Texas at Arlington,500 Yates Street, Arlington, TX 76019, USA
1 Introduction
Molybdenum (Mo) is a necessary plant and humanmicronutrient (O'Connor et al. 2001). However, Moof high concentration may cause copper deficiency incattle (Elliott and Taylor 2000; O'Connor et al. 2001).Elevated concentrations of Mo have been found in theirrigation drainage of arid agricultural soils (Lemly1994; O'Connor et al. 2001) and near Mo ore mining(Qu et al. 2007; Cong et al. 2009) and on an industrialsite engaged in lamp-making plants (Geng et al. 2013).
Over the past years, Mo sorption on soils and soilminerals has been relatively well studied (Xie andMacKenzie 1991; Xie et al. 1993; Goldberg et al.1998, 2002). Maximal adsorption has been observedin the pH range of 2 to 5; a rapid decrease occurs withincreasing pH in the range from 5 to 8, while a minimaladsorption is observed above pH 9. The dominant Mo-adsorbing surfaces in soils are Al and Fe oxides, clayminerals, and organic matter (Goldberg et al. 1996).Adsorption of Mo onto soil clays is reduced by theremoval of amorphous Fe and Al oxides (Theng 1971).Statistically significant correlations have beenobtained between amorphous Al oxide, free Fe oxide,and allophone content and Mo adsorption in 16Chilean volcanic soils (Gonzalez et al. 1974).
Most of these sorption studies focus on agriculturalsoils rather than on industrial soils. However, Mo hasbeen historically used in incandescent light bulbmanufacturing processes and continues in wide usefor these purposes. A detailed investigation at one suchsite has found Mo concentrations reaching 32.5 mg/Lin groundwater and 252 mg/kg in the soil at a measuredaverage soil pH of 8.65 (Geng et al. 2013). The pro-cesses that affect the adsorption, fate, and transport ofMo in alkaline industrial soils are unknown. A betterunderstanding of Mo sorption on soil and Fe mineralswill be useful in the prediction and interpretation of Mobehavior in natural and engineered environments andin the design of remediation process of contaminatedsites.
The objectives of this study were to address thefollowing: (1) Mo adsorption behavior in an alkalineindustrial soil using batch and flow cell approaches; (2)Mo adsorption behaviors in Fe oxides under alkalineconditions; (3) Mo adsorption behavior in soilamended with Fe oxides, again using both batch andflow cell systems; (4) prediction of Mo adsorption ontosoil amended with Fe minerals; and (5) comparison of
Mo adsorption behavior and parameters obtained fromthe batch and flow cell experiments.
2 Materials and Methods
2.1 Materials of Soil and Fe Minerals
Collected from a light bulb manufacturing plant inShanghai, the soil used in all experiments was anindustrial soil classified as fine silt. Carbon (C), nitro-gen (N), and sulfur (S) were analyzed by Vario MaxCNS analyzer (Elementar Inc., Germany), followingapproaches of Guo et al. (2011), Lin et al. (2004), andZhang (2004). Soluble bromine (Br) and chlorine (Cl)were extracted by Milli-Q water and analyzed by in-ductively coupled plasma mass spectrometry (ICP-MS, Agilent 7500cx, Agilent Inc., USA) according toLu and Liu (2011) and SBQTS (2010). Soil texture wasanalyzed, according to Li et al. (2011) and Jiang et al.(2005), by the following procedure: the soil was firsttreated with sodium hexametaphosphate for disper-sion, then carbon was removed by adding 6 % H2O2
and dilute HCl in succession, and then the treated soilwas analyzed by the laser particle sizer (Mastersizer2000, Malvern Inc., UK). Total Fe, Al, and Mn in thesoil were determined by digestion with aqua regiausing the following steps: a soil amount of 0.10 gwas weighed into a reaction vessel; 3 mL aqua regiawas then added and allowed to stand for 16 h(overnight) at room temperature, to permit slow oxida-tion of the organic matter in the soil; the samples werethen digested at 120 °C for 12 h; after cooling, 3 mLconcentrated HClO4 was added and digested at 140 °Cfor another 6 h; then the sample was heated at 190 °Cuntil the soil turned white and the acid was exhausted;the residue was dissolved in 50 mL Milli-Q water andfiltered with 0.45 μm membrane; and the digestionsolution was subsequently analyzed by inductivelycoupled plasma optical emission spectrometry (ICP-OES, Optima 7000DV, PerkinElmer Inc., USA).Amorphous Al and Fe oxides in the soils wereextracted by ammonium oxalate buffer solution(pH 3.0) for 2 h, and the extractants were determinedby ICP-OES (Bartels 1996). Free Al and iron oxides(including amorphous and crystal oxide) in the soilswere extracted by 0.3 mol/L sodium citrate solutionand 1 mol/L sodium bicarbonate solution at 80 °C for15 min, centrifuged, and the residues was washed by
1743, Page 2 of 16 Water Air Soil Pollut (2013) 224:1743

1 mol/L NaCl. The supernatant and the wash-off wasput together and measured by ICP-OES (Lu 1999). Theprotocol of Mo fractionation and total Mo was takenfrom Geng et al. (2013). The measurement of pH,organic matter, and cation exchange capacity (CEC)followed the method of Lu (1999).
Two Fe minerals (goethite and amorphous iron hy-droxide, HFO) were synthesized according to themethods of Davranche and Bollinger (2000) andLenoble et al. (2002). Briefly, goethite was synthesizedby the following steps: (1) 100 mL of 1 M Fe(NO3)3·9H2O and 180 mL of 5 M KOH were simulta-neously mixed; (2) the suspension was then diluted to2 L and stored inside a 70 °C oven for 60 h; (3) thesuspension was centrifuged at 4,000 rpm for 20 minand the precipitate was dialyzed to EC <2 μS/cm; and(4) the resultant solid was dried at 60 °C for 24 h andground for homogenization (<100 mesh sieve). In ad-dition, HFO was synthesized using the following steps:(1) 60 g of NaOH pellets was slowly added into500 mL of 0.5 M Fe(NO3)3·9H2O; (2) the suspensionwas centrifuged at 4,000 rpm for 20 min and theprecipitate was dialyzed to EC <2 μS/cm; and (3) theresultant solid was freeze-dried and ground for homog-enization. After syntheses, these two Fe minerals werecharacterized by X-ray diffraction analyses using aSiemens D5000 diffractometer with filtered copperK 1 radiation (PANalytical X'Pert PRO).
2.2 Kinetic Experiments
An adsorption kinetic experiment was carried out todetermine the equilibrium time between sorbed andaqueous Mo for the soil. Briefly, 100 g soil was placedinto 500 mL flask, to which 100 mL aliquots of9.60 mg/L Mo solution (0.005 M CaCl2 as a back-ground electrolyte) were added. The flasks were pre-pared in triplicate and shaken at 250 rpm for 60 h.During the shaking time, 3 mL mixture of soil andsolution was sampled every a few hours and put into5 mL vials. Then, the vials were centrifuged at3,500 rpm for 20 min and the supernatants were sam-pled and filtered through a 0.45-μm membrane foranalyses. Due to Mo existence in the industrial soil,the control experiment was performed without Mospiking, but sampled at regular time intervals to mon-itor aqueous Mo concentrations released from the soil.The background electrolyte was changed from0.005 M CaCl2 to 0.01 M NaNO3 in the later
experiments, due to CaMoO4 precipitation at higherMo concentrations.
2.3 Batch Sorption Experiments
Batch experiments were conducted to evaluate theequilibrium relationship between sorbed and aqueousMo for the soil, Fe minerals (goethite and HFO), andthe soil amended with Fe minerals. Four experimentswere performed. In experiment I, subsamples (approx-imately 5 g soil) were placed into polypropylene vials,to which 5 mL aliquots of Mo solution was added. Inexperiment II, subsamples (approximately 0.06 g Feminerals) were placed in polypropylene vials, to which40 mL aliquots of Mo solution was added. A buffersolution of 2 mM TAPS adjusted to pH 8.4 was used tokeep the solution in constant pH. In experiment III, soilwas first mixed with 0.5 % goethite or HFO and then6.03 g mixture was placed in polypropylene vials, towhich 6 mL aliquots of Mo solution was added. Inexperimental IV, soil was first mixed with differentamount of Fe minerals (0.5, 2, 5, and 10 %) and then6.03 to 6.67 g mixture (exactly 6 g soil in differenttreatments) was placed in polypropylene vials, towhich 6 mL aliquots of Mo solution was added.
For experiments I, II, and III, the solutions had seveninitial Mo concentrations (0, 0.96, 1.92, 4.80, 9.60, 19.19,and 47.98 mg/L), which were selected to represent theupper range of concentrations that have been found on theindustrial site. In experiment IV, only one initial Moconcentration of 9.60mg/Lwas used. For these four batchexperiments, 0.01 M NaNO3 was used as the backgroundelectrolyte, the vials were prepared in triplicate for eachconcentration, and blank solutions were used to confirmthat no Mo was initially adsorbed. The vials were shakenat 250 rpm for 24 h, which was confirmed to be adequatefor equilibration by the previous kinetic experiment. Thevials were then centrifuged at 3,500 rpm for 20 min, andthe supernatants were sampled and filtered through a0.45-μm membrane for chemical analyses.
2.4 Stirred-Flow Cell Experiments
A flow cell approach was used to characterize Mo sorp-tion kinetics on soil and on soil amended with Fe min-erals. Flow cell experiments were setup in a 10-mLultrafiltration stirred cell (fitted with two filters of74 μm and 450 nm pore size). The influent flow ratewas controlled at 0.65 to 0.70 mL/h, resulting in an
Water Air Soil Pollut (2013) 224:1743 Page 3 of 16, 1743

average residence time of 2.9 to 3.1 h. The assumption ofideal mixing conditions in the flow reactors was con-firmed by comparing measured Br breakthrough with theanalytical solution until the end of the experiments.Initially, the solid (soil alone and soil amended with0.5 % goethite/HFO) and the working solution(29.26 mg/L Mo and 47.23 mg/L Br, 0.01 M NaNO3 asthe background electrolyte) were loaded into the flow cellto generate 2 ml of a 500-g/L suspension. Because Moreached fast equilibrium at 2 h (Fig. 1a) and the retentiontime was 2.9 to 3.1 h, the adsorption experiments werestarted immediately by pumping the same working solu-tion into the flow cell. Effluent fractions were collectedby a fraction collector over time, and their exact volumeswere determined gravimetrically to measure flow rates.
2.5 Modeling the Adsorption of Mo
2.5.1 Adsorption Isotherm
During sorption experiments, Mo concentrations in theaqueous phase were monitored and were used to deter-mine partitioning onto the adsorbents (soil, Fe min-erals, and soil amended with Fe minerals), q (milligramof Mo adsorbed/kilogram of adsorbents), according to:
q ¼ C0−Ceð ÞVm
ð1Þ
where C0 is the initial Mo concentration (in milligramper liter), Ce the residual Mo concentration (in milli-gram per liter) in the aqueous phase at a specific time,
V the suspension volume (in liter), and m the mass (inkilogram) of the adsorbents. Three isotherms—linear,Freundlich, and Langmuir—were applied to describethe Mo adsorption equilibrium in the batch experi-ments I, II, and III.
The Freundlich model empirically describes the re-lationship at equilibrium between sorption density anddissolved concentration, where sorption density refersto the mass in milligram of a chemical adsorbed to thesolid surfaces of an adsorbent material, per unit mass(in kilogram) of that material, and concentration refersto the mass of that chemical per unit volume of solutionin contact with the sorbing material (Aboul-Kassimand Simoneit 2001; Yang et al. 2011):
qeq ¼ K f C1=neq ð2Þ
where qeq (in milligram per kilogram) is sorption den-sity, Kf (in milligram1−nliternkilogram−1) the Freundlichadsorption coefficient, Ceq (in milligram per liter) theequilibrium concentration in the liquid phase, and 1/nthe measure of nonlinearity.
The condition that the constant 1/n of the Freundlichmodel approximates unity will produce a linear iso-therm (Eq. 3, below), which closely describes thepartitioning of a solute at low mass loading or whenthere is no specific bonding between the adsorbate andthe adsorbent (Aboul-Kassim and Simoneit 2001):
qeq ¼ KdCeq ð3Þwhere Kd (in liter per kilogram) is the distributioncoefficient and is defined as the ratio of concentration
0 10 20 30 40 50 60
Mo
rele
ase
from
the
soil
(%)
0
10
20
30
Sample time (h)
0 10 20 30 40 50 60
Rel
ativ
e co
ncen
trat
ion
0.0
0.2
0.4
0.6
0.8
1.0
a b
Fig. 1 Mo released into the aqueous phase by the soil with time (a) and Mo equilibration time with the soil (b). Initial Mo concentrationwas 9.60 mg/L with a background electrolyte of 0.005 M CaCl2 and the ratio of soil to water was 1:1
1743, Page 4 of 16 Water Air Soil Pollut (2013) 224:1743
in the solid phase to that in the aqueous phase, and Ceq
and qeq are defined as in Eq. 2.As given below in Eq. 4, the Langmuir model de-
scribes the monolayer sorption of a solute onto a sur-face with a finite number of identical sites withoutsurface diffusion:
qeq ¼QbCeq
1þ bCeqð4Þ
where Q (in milligram per kilogram) indicates thebinding strength, b (in liter per milligram) the maxi-mum of the solute adsorbed per amount of adsorbents,and Ceq and qeq are defined as in Eq. 2.
The experimental data were fitted to these threeisotherms to determine sorption coefficients.
2.5.2 Adsorption Modeling in Batch Experiments
Adsorption of Mo in two experiments (batch experi-ments III and IV) was calculated for each vial andcompared to the results predicted by the best fit iso-therms, as obtained from the batch experiments I and II.
For experiments III and IV, the amount of Mo ad-sorption in each vial, AExperiment (in microgram), wascalculated as:
AExperiment ¼ C0−Ceð ÞV � 1000 ð5ÞWhere C0, Ce, and V are defined as in Eq. 1.Adsorption of Mo in the batch experiments III and
IV, Aprediction (in microgram), was obtained by thefollowing steps: (1) Eqs. 2–4 were fitted to the dataof the batch experiments I and II, and the best simulat-ed equation was selected for soil and for Fe minerals;(2) each equilibrium aqueous Mo concentration frombatch experiments III and IV was used to calculate theadsorption capacity of soil (qeq-soil) and of Fe minerals(qeq-Fe), respectively; (3) the amount of adsorption ontosoil (Asoil) and Fe minerals (AFe) in each vial wascalculated by multiplying the mass of adsorbent (ingram) in that vial with qeq-soil and qeq-Fe; (4) the amountof adsorption by prediction (Aprediction) was the sum ofAsoil and AFe.
2.5.3 Adsorption Modeling in Flow Cell Experiments
The Mo mass balance in the flow cell, modified fromBar-Tal et al. (1990) and Seyfried et al. (1989), isdefined as
Cin J ¼ Cout J þMdq
dtð6Þ
Where Cin and Cout are Mo concentrations in influ-ent and effluent solutions (in milligram per liter), J isthe flow rate (in liter per hour), M is the mass of soiland Fe minerals in the flow cell (in kilogram), t is thetime (in hour), and q is sorbed concentration (in milli-gram per kilogram). Under ideal mixing conditions in aflow reactor, Cout is equal to the concentration in theflow cell (C, in milligram per liter). For testing ofvarious sorption scenarios, different expressions ofEqs. 2 to 4 were substituted for q in Eq. 6. The modelwas programmed in this work with Matlab® language(The Mathwork, USA).
2.5.4 Evaluation of Modeling
The root mean squared error (RMSE) was used in thebatch experiments III and IV to evaluate the modelingand used as the objective function in the flow cellexperiments for optimization. The function, taken fromZhang et al. (2012), is defined as:
RMSE ¼ 100
E•
ffiffiffiffiffiffiffiffiffiffiffiffiffiffiffiffiffiffiffiffiffiffiffiffiffiffiffi
X
i¼1
n Si−Eið Þ2n
v
u
u
t ð7Þ
where Si and Ei are the simulated and experimentalvalues of adsorption amount in each vial (in micro-gram) in batch experiments, and the simulated andexperimental Cout in the flow cell experiments, n is
the number of measurement data, and E is the averageof n experimental values. The optimization wasperformed using the fmincon function of theMATLAB Optimization Toolbox (Mathworks, USA),which applies a sequential quadratic programming al-gorithm. Two statistical criteria (the efficiency coeffi-
cient Ef and the mean difference D ) were in comple-ment used to evaluate the simulation performance(Smith et al. 1997).
2.6 Chemical and Data Analysis
All samples from the kinetic, batch, and flow cellexperiments were acidified with concentrated nitricacid and refrigerated before analyses. The concentra-tions of Mo and Br were analyzed using ICP-MS.Limits of detection (taken as three times the standarddeviation of the blank, divided by the slope of the
Water Air Soil Pollut (2013) 224:1743 Page 5 of 16, 1743
calibration graph) were 2.14 μg/L for Mo and3.28 μg/L for Br.
3 Results
3.1 The Properties of the Industrial Soil
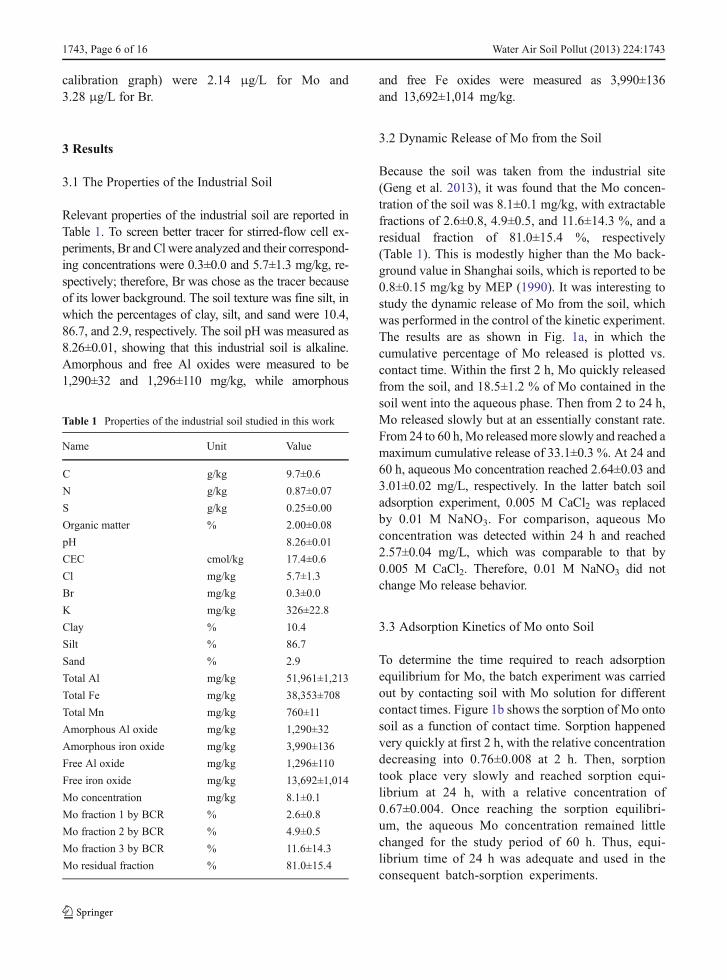
Relevant properties of the industrial soil are reported inTable 1. To screen better tracer for stirred-flow cell ex-periments, Br and Cl were analyzed and their correspond-ing concentrations were 0.3±0.0 and 5.7±1.3 mg/kg, re-spectively; therefore, Br was chose as the tracer becauseof its lower background. The soil texture was fine silt, inwhich the percentages of clay, silt, and sand were 10.4,86.7, and 2.9, respectively. The soil pH was measured as8.26±0.01, showing that this industrial soil is alkaline.Amorphous and free Al oxides were measured to be1,290±32 and 1,296±110 mg/kg, while amorphous
and free Fe oxides were measured as 3,990±136and 13,692±1,014 mg/kg.
3.2 Dynamic Release of Mo from the Soil
Because the soil was taken from the industrial site(Geng et al. 2013), it was found that the Mo concen-tration of the soil was 8.1±0.1 mg/kg, with extractablefractions of 2.6±0.8, 4.9±0.5, and 11.6±14.3 %, and aresidual fraction of 81.0±15.4 %, respectively(Table 1). This is modestly higher than the Mo back-ground value in Shanghai soils, which is reported to be0.8±0.15 mg/kg by MEP (1990). It was interesting tostudy the dynamic release of Mo from the soil, whichwas performed in the control of the kinetic experiment.The results are as shown in Fig. 1a, in which thecumulative percentage of Mo released is plotted vs.contact time. Within the first 2 h, Mo quickly releasedfrom the soil, and 18.5±1.2 % of Mo contained in thesoil went into the aqueous phase. Then from 2 to 24 h,Mo released slowly but at an essentially constant rate.From 24 to 60 h,Mo releasedmore slowly and reached amaximum cumulative release of 33.1±0.3 %. At 24 and60 h, aqueous Mo concentration reached 2.64±0.03 and3.01±0.02 mg/L, respectively. In the latter batch soiladsorption experiment, 0.005 M CaCl2 was replacedby 0.01 M NaNO3. For comparison, aqueous Moconcentration was detected within 24 h and reached2.57±0.04 mg/L, which was comparable to that by0.005 M CaCl2. Therefore, 0.01 M NaNO3 did notchange Mo release behavior.
3.3 Adsorption Kinetics of Mo onto Soil
To determine the time required to reach adsorptionequilibrium for Mo, the batch experiment was carriedout by contacting soil with Mo solution for differentcontact times. Figure 1b shows the sorption of Mo ontosoil as a function of contact time. Sorption happenedvery quickly at first 2 h, with the relative concentrationdecreasing into 0.76±0.008 at 2 h. Then, sorptiontook place very slowly and reached sorption equi-librium at 24 h, with a relative concentration of0.67±0.004. Once reaching the sorption equilibri-um, the aqueous Mo concentration remained littlechanged for the study period of 60 h. Thus, equi-librium time of 24 h was adequate and used in theconsequent batch-sorption experiments.
Table 1 Properties of the industrial soil studied in this work
Name Unit Value
C g/kg 9.7±0.6
N g/kg 0.87±0.07
S g/kg 0.25±0.00
Organic matter % 2.00±0.08
pH 8.26±0.01
CEC cmol/kg 17.4±0.6
Cl mg/kg 5.7±1.3
Br mg/kg 0.3±0.0
K mg/kg 326±22.8
Clay % 10.4
Silt % 86.7
Sand % 2.9
Total Al mg/kg 51,961±1,213
Total Fe mg/kg 38,353±708
Total Mn mg/kg 760±11
Amorphous Al oxide mg/kg 1,290±32
Amorphous iron oxide mg/kg 3,990±136
Free Al oxide mg/kg 1,296±110
Free iron oxide mg/kg 13,692±1,014
Mo concentration mg/kg 8.1±0.1
Mo fraction 1 by BCR % 2.6±0.8
Mo fraction 2 by BCR % 4.9±0.5
Mo fraction 3 by BCR % 11.6±14.3
Mo residual fraction % 81.0±15.4
1743, Page 6 of 16 Water Air Soil Pollut (2013) 224:1743
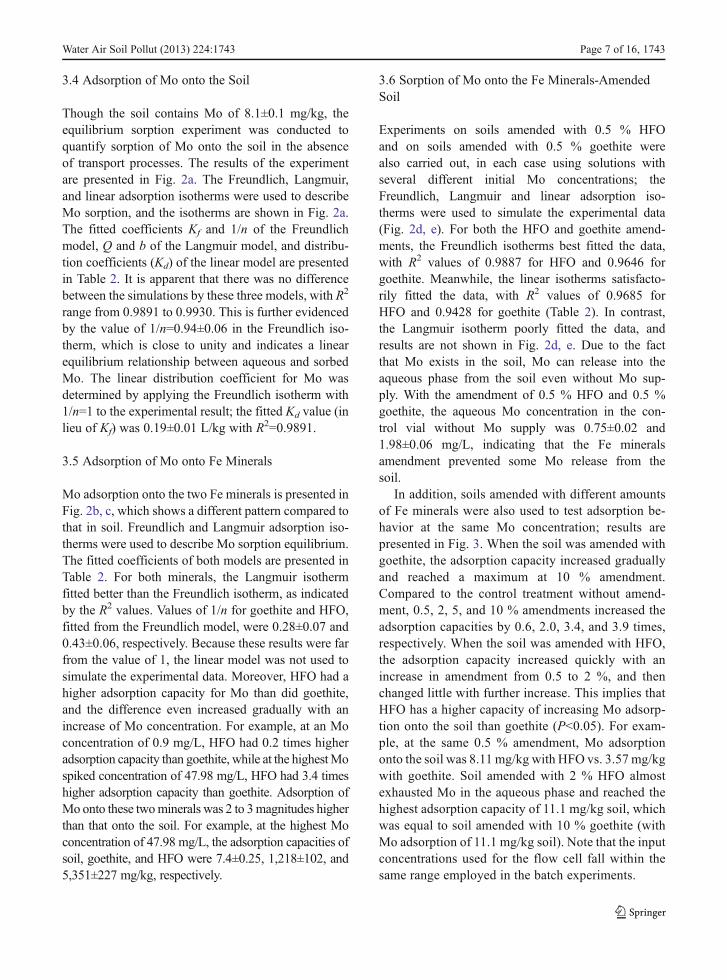
3.4 Adsorption of Mo onto the Soil
Though the soil contains Mo of 8.1±0.1 mg/kg, theequilibrium sorption experiment was conducted toquantify sorption of Mo onto the soil in the absenceof transport processes. The results of the experimentare presented in Fig. 2a. The Freundlich, Langmuir,and linear adsorption isotherms were used to describeMo sorption, and the isotherms are shown in Fig. 2a.The fitted coefficients Kf and 1/n of the Freundlichmodel, Q and b of the Langmuir model, and distribu-tion coefficients (Kd) of the linear model are presentedin Table 2. It is apparent that there was no differencebetween the simulations by these three models, with R2
range from 0.9891 to 0.9930. This is further evidencedby the value of 1/n=0.94±0.06 in the Freundlich iso-therm, which is close to unity and indicates a linearequilibrium relationship between aqueous and sorbedMo. The linear distribution coefficient for Mo wasdetermined by applying the Freundlich isotherm with1/n=1 to the experimental result; the fitted Kd value (inlieu of Kf) was 0.19±0.01 L/kg with R2=0.9891.
3.5 Adsorption of Mo onto Fe Minerals
Mo adsorption onto the two Fe minerals is presented inFig. 2b, c, which shows a different pattern compared tothat in soil. Freundlich and Langmuir adsorption iso-therms were used to describe Mo sorption equilibrium.The fitted coefficients of both models are presented inTable 2. For both minerals, the Langmuir isothermfitted better than the Freundlich isotherm, as indicatedby the R2 values. Values of 1/n for goethite and HFO,fitted from the Freundlich model, were 0.28±0.07 and0.43±0.06, respectively. Because these results were farfrom the value of 1, the linear model was not used tosimulate the experimental data. Moreover, HFO had ahigher adsorption capacity for Mo than did goethite,and the difference even increased gradually with anincrease of Mo concentration. For example, at an Moconcentration of 0.9 mg/L, HFO had 0.2 times higheradsorption capacity than goethite, while at the highestMospiked concentration of 47.98 mg/L, HFO had 3.4 timeshigher adsorption capacity than goethite. Adsorption ofMo onto these twominerals was 2 to 3magnitudes higherthan that onto the soil. For example, at the highest Moconcentration of 47.98 mg/L, the adsorption capacities ofsoil, goethite, and HFO were 7.4±0.25, 1,218±102, and5,351±227 mg/kg, respectively.
3.6 Sorption of Mo onto the Fe Minerals-AmendedSoil
Experiments on soils amended with 0.5 % HFOand on soils amended with 0.5 % goethite werealso carried out, in each case using solutions withseveral different initial Mo concentrations; theFreundlich, Langmuir and linear adsorption iso-therms were used to simulate the experimental data(Fig. 2d, e). For both the HFO and goethite amend-ments, the Freundlich isotherms best fitted the data,with R2 values of 0.9887 for HFO and 0.9646 forgoethite. Meanwhile, the linear isotherms satisfacto-rily fitted the data, with R2 values of 0.9685 forHFO and 0.9428 for goethite (Table 2). In contrast,the Langmuir isotherm poorly fitted the data, andresults are not shown in Fig. 2d, e. Due to the factthat Mo exists in the soil, Mo can release into theaqueous phase from the soil even without Mo sup-ply. With the amendment of 0.5 % HFO and 0.5 %goethite, the aqueous Mo concentration in the con-trol vial without Mo supply was 0.75±0.02 and1.98±0.06 mg/L, indicating that the Fe mineralsamendment prevented some Mo release from thesoil.
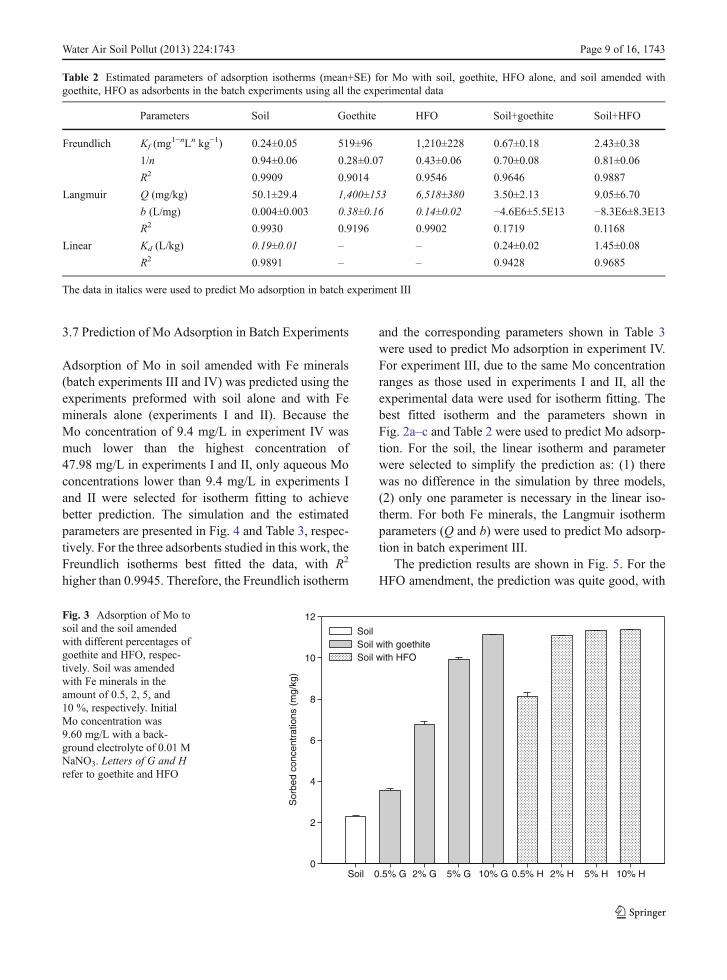
In addition, soils amended with different amountsof Fe minerals were also used to test adsorption be-havior at the same Mo concentration; results arepresented in Fig. 3. When the soil was amended withgoethite, the adsorption capacity increased graduallyand reached a maximum at 10 % amendment.Compared to the control treatment without amend-ment, 0.5, 2, 5, and 10 % amendments increased theadsorption capacities by 0.6, 2.0, 3.4, and 3.9 times,respectively. When the soil was amended with HFO,the adsorption capacity increased quickly with anincrease in amendment from 0.5 to 2 %, and thenchanged little with further increase. This implies thatHFO has a higher capacity of increasing Mo adsorp-tion onto the soil than goethite (P<0.05). For exam-ple, at the same 0.5 % amendment, Mo adsorptiononto the soil was 8.11 mg/kg with HFO vs. 3.57 mg/kgwith goethite. Soil amended with 2 % HFO almostexhausted Mo in the aqueous phase and reached thehighest adsorption capacity of 11.1 mg/kg soil, whichwas equal to soil amended with 10 % goethite (withMo adsorption of 11.1 mg/kg soil). Note that the inputconcentrations used for the flow cell fall within thesame range employed in the batch experiments.
Water Air Soil Pollut (2013) 224:1743 Page 7 of 16, 1743

0 10 20 30 40
Sor
bed
conc
entr
atio
ns (
mg/
kg)
0
2
4
6
8
Experimental dataLinear modelLangmuir modelFreundlich model
a
b c
0 10 20 30 40 50
Sor
bed
conc
entr
atio
ns (
mg/
kg)
0
200
400
600
800
1000
1200
1400
1600
1800
0 10 20 30 40 500
1000
2000
3000
4000
5000
6000
7000
Mo concentrations in the equilibrium solution (mg/L)0 10 20 30 40 50
Sor
bed
conc
entr
atio
ns (
mg/
kg)
0
2
4
6
8
10
12
0 5 10 15 20 250
5
10
15
20
25
30
35d e
Fig. 2 Adsorption isotherm of Mo with soil (a), goethite (b),HFO alone (c), soil amended with 0.5 % goethite (d), and 0.5 %HFO (e) as adsorbent, respectively, in batch experiments. Thesolutions had seven initial Mo concentrations (0, 0.96, 1.92,4.80, 9.60, 19.19, and 47.98 mg/L) with a background electrolyteof 0.01 M NaNO3. Two millimolar TAPS adjusted to pH 8.4 was
used to keep the solution in the constant pH for goethite (b) andHFO (c) experiments. Data was simultaneously simulated by theFreundlich, linear, and Langmuir models. Due to poor simula-tion, the simulations of the linear model are not shown in b and c,and those of the Langmuir model are not shown in d and e
1743, Page 8 of 16 Water Air Soil Pollut (2013) 224:1743
3.7 Prediction of Mo Adsorption in Batch Experiments
Adsorption of Mo in soil amended with Fe minerals(batch experiments III and IV) was predicted using theexperiments preformed with soil alone and with Feminerals alone (experiments I and II). Because theMo concentration of 9.4 mg/L in experiment IV wasmuch lower than the highest concentration of47.98 mg/L in experiments I and II, only aqueous Moconcentrations lower than 9.4 mg/L in experiments Iand II were selected for isotherm fitting to achievebetter prediction. The simulation and the estimatedparameters are presented in Fig. 4 and Table 3, respec-tively. For the three adsorbents studied in this work, theFreundlich isotherms best fitted the data, with R2
higher than 0.9945. Therefore, the Freundlich isotherm
and the corresponding parameters shown in Table 3were used to predict Mo adsorption in experiment IV.For experiment III, due to the same Mo concentrationranges as those used in experiments I and II, all theexperimental data were used for isotherm fitting. Thebest fitted isotherm and the parameters shown inFig. 2a–c and Table 2 were used to predict Mo adsorp-tion. For the soil, the linear isotherm and parameterwere selected to simplify the prediction as: (1) therewas no difference in the simulation by three models,(2) only one parameter is necessary in the linear iso-therm. For both Fe minerals, the Langmuir isothermparameters (Q and b) were used to predict Mo adsorp-tion in batch experiment III.
The prediction results are shown in Fig. 5. For theHFO amendment, the prediction was quite good, with
Table 2 Estimated parameters of adsorption isotherms (mean+SE) for Mo with soil, goethite, HFO alone, and soil amended withgoethite, HFO as adsorbents in the batch experiments using all the experimental data
Parameters Soil Goethite HFO Soil+goethite Soil+HFO
Freundlich Kf (mg1−nLn kg−1) 0.24±0.05 519±96 1,210±228 0.67±0.18 2.43±0.38
1/n 0.94±0.06 0.28±0.07 0.43±0.06 0.70±0.08 0.81±0.06
R2 0.9909 0.9014 0.9546 0.9646 0.9887
Langmuir Q (mg/kg) 50.1±29.4 1,400±153 6,518±380 3.50±2.13 9.05±6.70
b (L/mg) 0.004±0.003 0.38±0.16 0.14±0.02 −4.6E6±5.5E13 −8.3E6±8.3E13R2 0.9930 0.9196 0.9902 0.1719 0.1168
Linear Kd (L/kg) 0.19±0.01 – – 0.24±0.02 1.45±0.08
R2 0.9891 – – 0.9428 0.9685
The data in italics were used to predict Mo adsorption in batch experiment III
Soil 0.5% G 2% G 5% G 10% G 0.5% H 2% H 5% H 10% H
Sor
bed
conc
entr
atio
ns (
mg/
kg)
0
2
4
6
8
10
12
SoilSoil with goethiteSoil with HFO
Fig. 3 Adsorption of Mo tosoil and the soil amendedwith different percentages ofgoethite and HFO, respec-tively. Soil was amendedwith Fe minerals in theamount of 0.5, 2, 5, and10 %, respectively. InitialMo concentration was9.60 mg/L with a back-ground electrolyte of 0.01 MNaNO3. Letters of G and Hrefer to goethite and HFO
Water Air Soil Pollut (2013) 224:1743 Page 9 of 16, 1743

Mo concentrations in the equilibrium solution (mg/L)0 2 4 6 8 10
Sor
bed
conc
entr
atio
ns (
mg/
kg)
0
200
400
600
800
1000
0 2 4 60
500
1000
1500
2000
2500
3000
Mo concentrations in the equilibrium solution (mg/L)
0 2 4 6 8 10
Sor
bed
conc
entr
atio
ns (
mg/
kg)
0,0
0,5
1,0
1,5
2,0
2,5
3,0
Experimental dataFreundlich modelLangmuir modelLinear model
a
c
b
Fig. 4 Simulation of adsorption isotherms of goethite (a), HFO(b), and soil (c) by the Freundlich, linear, and Langmuir modelsusing part of the experimental data. Based on the aqueous Mo
concentrations in batch experiment IV, only four initial Moconcentrations (0.96, 1.92, 4.80, and 9.60 mg/L) were selectedfor simulation
Table 3 Estimated parametersof adsorption isotherms(mean+SE) for Mo with soil,goethite, and HFO alone asadsorbents in the batch experi-ments using part of theexperimental data
The data in italics were used topredict Mo adsorption inbatch experiment IV
Parameters Soil Goethite HFO
Freundlich Kf (mg1−n Ln kg−1) 0.08±0.02 455±17 890±21
1/n 1.47±0.09 0.34±0.02 0.61±0.02
R2 0.9945 0.9960 0.9992
Langmuir Q (mg/kg) – 990±104 4,220±625
b (L/mg) – 0.93±0.33 0.26±0.08
R2 0.9652 0.9902
Linear Kd (L/kg) 0.20±0.02 – –
R2 0.9365 – –
1743, Page 10 of 16 Water Air Soil Pollut (2013) 224:1743
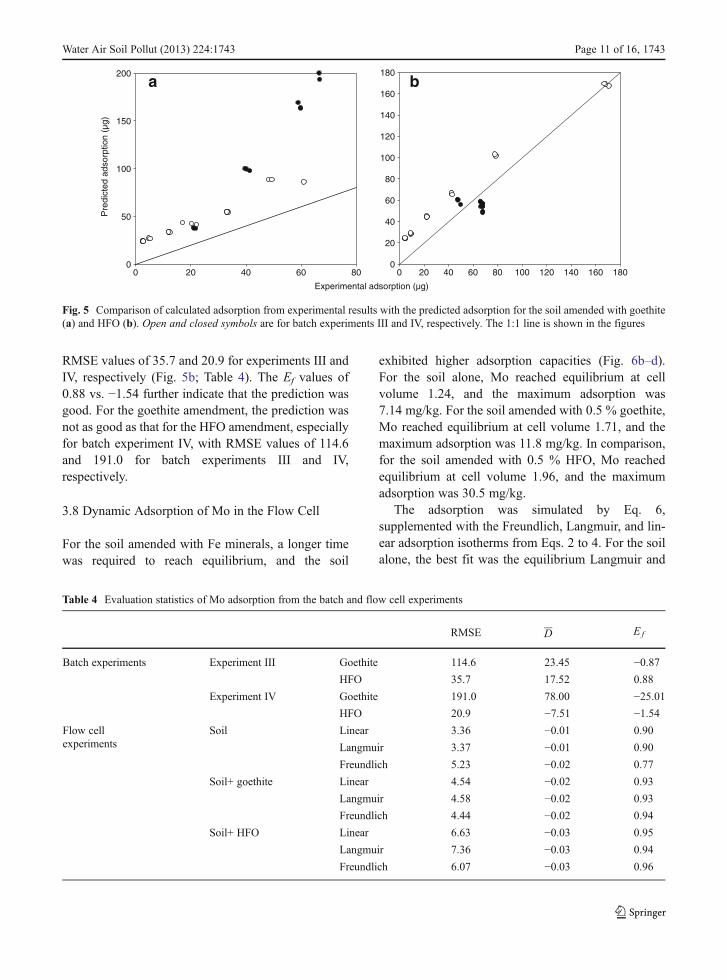
RMSE values of 35.7 and 20.9 for experiments III andIV, respectively (Fig. 5b; Table 4). The Ef values of0.88 vs. −1.54 further indicate that the prediction wasgood. For the goethite amendment, the prediction wasnot as good as that for the HFO amendment, especiallyfor batch experiment IV, with RMSE values of 114.6and 191.0 for batch experiments III and IV,respectively.
3.8 Dynamic Adsorption of Mo in the Flow Cell
For the soil amended with Fe minerals, a longer timewas required to reach equilibrium, and the soil
exhibited higher adsorption capacities (Fig. 6b–d).For the soil alone, Mo reached equilibrium at cellvolume 1.24, and the maximum adsorption was7.14 mg/kg. For the soil amended with 0.5 % goethite,Mo reached equilibrium at cell volume 1.71, and themaximum adsorption was 11.8 mg/kg. In comparison,for the soil amended with 0.5 % HFO, Mo reachedequilibrium at cell volume 1.96, and the maximumadsorption was 30.5 mg/kg.
The adsorption was simulated by Eq. 6,supplemented with the Freundlich, Langmuir, and lin-ear adsorption isotherms from Eqs. 2 to 4. For the soilalone, the best fit was the equilibrium Langmuir and
0 20 40 60 80 100 120 140 160 1800
20
40
60
80
100
120
140
160
180
Experimental adsorption (µg)
0 20 40 60 80
Pre
dict
ed a
dsor
ptio
n (µ
g)
0
50
100
150
200a b
Fig. 5 Comparison of calculated adsorption from experimental results with the predicted adsorption for the soil amended with goethite(a) and HFO (b). Open and closed symbols are for batch experiments III and IV, respectively. The 1:1 line is shown in the figures
Table 4 Evaluation statistics of Mo adsorption from the batch and flow cell experiments
RMSE D E f
Batch experiments Experiment III Goethite 114.6 23.45 −0.87HFO 35.7 17.52 0.88
Experiment IV Goethite 191.0 78.00 −25.01HFO 20.9 −7.51 −1.54
Flow cellexperiments
Soil Linear 3.36 −0.01 0.90
Langmuir 3.37 −0.01 0.90
Freundlich 5.23 −0.02 0.77
Soil+ goethite Linear 4.54 −0.02 0.93
Langmuir 4.58 −0.02 0.93
Freundlich 4.44 −0.02 0.94
Soil+ HFO Linear 6.63 −0.03 0.95
Langmuir 7.36 −0.03 0.94
Freundlich 6.07 −0.03 0.96
Water Air Soil Pollut (2013) 224:1743 Page 11 of 16, 1743

linear isotherms, with RMSE 3.36 to 3.37, mean dif-ference −0.01, and efficiency coefficient 0.90(Table 4). The Freundlich isotherm fitted the data well,but the efficiency coefficient of 0.77 was somewhatlower. For the soil amended with 0.5 % goethite, therewas no difference between these three sorption iso-therm models, as can be seen from Fig. 6c, or in theevaluation of modeling (RMSE 4.44 to 4.58, meandifference −0.02, and efficiency coefficient 0.93 to0.94). For the soil amended with 0.5 % HFO, the bestfit was the Freundlich isotherm, with the lowest RMSEvalue of 6.07, lower mean difference of −0.03, and thehighest efficiency coefficient of 0.96. The Langmuirand linear isotherms also satisfactorily fitted the
experimental data, with RMSE 6.63 to 7.36, meandifference −0.03, and efficiency coefficient 0.94 to0.95.
4 Discussion
Several aspects of the work reported here merit com-ment. Firstly, the results suggest a mechanism, throughwhich CaCl2 solution should extract much higher Mofrom the soil than do the extractants in BCR. When0.005 M CaCl2 was replaced by 0.01 M NaNO3, Morelease from the soil remained virtually the same, with2.64±0.03 vs. 2.57±0.04 mg/L at the 24 h sampling
0 1 2 3 4 5
C/C
0
0.0
0.2
0.4
0.6
0.8
1.0
1.2
SoilGoethite HFO
Mo
0 1 2 3 4 50.0
0.2
0.4
0.6
0.8
1.0
1.2
Experimental dataLinearLangmuir Freundlich
Cell volumes
0 1 2 3 4 50.0
0.2
0.4
0.6
0.8
1.0
1.2
Experimental dataLinearLangmuir Freundlich
0 1 2 3 4 50.0
0.2
0.4
0.6
0.8
1.0
1.2
Experimental dataLinearLangmuir Freundlich
a b
c d
Fig. 6 Dynamic processes of Br and Mo by the soil and the soiladded with 0.5 % Fe minerals. Panel a is the nonreactive tracerBr with time. Panels b–d are the Mo dynamics of soil alone, soil
amended with 0.5 % of goethite, and soil amended with 0.5 %HFO, respectively. Adsorption of Mo onto the solid phase wassimulated by the Freundlich, linear, and Langmuir models
1743, Page 12 of 16 Water Air Soil Pollut (2013) 224:1743

time. The content of extractable Mo from all steps ofthe sequential extraction procedure was compared withthe aqua regia leachable contents and the distributionof Mo in the following respective fractions: (1) ex-changeable and associated with carbonates, (2) associ-ated with easily and moderately reducible iron (Fe) andmanganese (Mn) oxyhydroxides, (3) associated withorganic matter and sulfides, and (4) bound-residue Moin mineral lattice (Žemberyová et al. 2010). The per-centage of Mo in the three extractants and the residuewas 2.6±0.8, 4.9±0.5, 11.6±14.3, and 81.0±15.4 %,respectively (Table 1). According to the definition,only Mo that is exchangeable and associated withcarbonates is available to living organisms. However,0.005 MCaCl2 can extract 18.5±1.2 % of adsorbed Moat 2 h and 33.1±0.3 % at 60 h (Fig. 1a). At 2 h, theamount extracted by CaCl2 solution was equal to theamount extracted by three extractants in BCR.However, at 60 h, even 14.1 % of the bound residuedefined in BCR was extracted by the CaCl2 solution.
According to Žemberyová et al. (2010), the threeextractants in BCR are acetic acid (0.11 M), hydroxyl-amine hydrochloride (0.5 M, adjusted pH=2), and hy-drogen peroxide (8.8 M, adjusted pH=2–3), respective-ly. Studies of adsorption of Mo onto soils indicate anadsorption maximum at pH 3–5 and significantly lessadsorption at higher pH values (up to pH 8) (Goldberget al. 1996; Manning and Goldberg 1996; Goldbergand Forster 1998; Goldberg et al. 1998. In acidic soils,Mo exists in soil pore water as a weak acid, H2MoO4;however, it is likely to exist primarily as MoO4
2− insystems with pH >4. The speciation of MoO4
2− isincreasingly soluble at high pH; for example, elevatedconcentrations of Mo were reported in limed and/oralkaline streams (Borg et al. 2001; Sjöstedt et al. 2009).The soil in the present study exhibited an alkaline pHof 8.26±0.01. This adequately explains why the CaCl2solution could extract more Mo from the soil thancould the acidic extractants in BCR. These resultsshow that BCR will underestimate the risk of Mo inalkaline soils and is not a suitable method for assessingmobility and availability of Mo in alkaline soils.
Secondly, an additivity principle was successfullyused to predict Mo adsorption on soil amended withHFO, but not on soil amended with goethite (Fig. 5).For goethite, when the amendment was 0.5 % in batchexperiment III, the prediction was reasonable.However, with the increased amendment in batch ex-periment IV, the prediction was not as good (Fig. 5a).
The additivity principle has been successfully used topredict Mo adsorption in a sandy soil, where the mainadsorbents are oxalate—extractable Fe and Al,dithionite–citrate–bicarbonate—extractable Fe, andhumic acid (Bibak and Borggaard 1994). Goethitehas reactive surface hydroxyls bound to Fe ions.Zhang and Sparks (1989) have postulated and verifiedthat Mo adsorption onto goethite contains two steps:the first is the formation of an ion-pair complexthrough the electrostatic attraction between the proton-ated surface and the MoO4
2− anion; the next is a ligandexchange process, where one H2O is replaced by oneadsorbed MoO4
2− from the surface. In addition, thelimited ionic strength dependence for Mo adsorptionon goethite serves as the supporting evidence for innersphere surface complexation. Ligand exchange is amechanism by which ions become specificallyadsorbed as inner sphere surface complexes. Innersphere surface complexes contain no water moleculesbetween the adsorbing ion and the surface functionalgroup (Sposito 1985). The point of zero charge (PZC)of variable charge minerals is shifted to a more acidicpH value following the specific adsorption of anions.Thus, adsorption of Mo lowers the PZC of goethite,providing a mechanism of specific adsorption(McKenzie 1983). This suggests that when goethitewas applied into the soil, some of the reactive hy-droxyls on the goethite surface reacted with the soiland lost the capacity to sorb Mo.
Thirdly, the best fit sorption isotherms and estimat-ed parameters were different among batch and flowcell experiments. (1) For the soil alone, there was nosignificant difference between the Freundlich,Langmuir, and linear adsorption isotherms in batchexperiments (Fig. 2a). However, in the flow cell exper-iment, the best fit were the equilibrium Langmuir andlinear isotherms, while the Freundlich isotherm fittedthe data well, but yielded a lower efficiency coefficient,0.77 (Fig. 6b). Moreover, the estimated parameter forthe linear isotherm was slightly different in the batchand flow cell results, with Kd 0.19 L/kg for the batchresults vs. 0.32 L/kg for the flow cell results (Tables 2and 5). (2) For the soil amended with goethite, theFreundlich isotherm gave the best fit in the batchexperiment (Fig. 2d). In contrast, in the flow cell sys-tems, Fig. 6c shows there was no difference betweenthe three models. However, for the Freundlich iso-therm, the estimated parameters differed between batchand flow cell results, with Kf equal to 0.67 in the batch
Water Air Soil Pollut (2013) 224:1743 Page 13 of 16, 1743

results vs. 0.29 in the flow cell results, and 1/n equal to0.70 in the batch results vs. 0.86 in the flow cellexperiments (Tables 2 and 5). (3) For the soil amendedwith HFO, the best fit was the Freundlich isothermboth in the batch and flow cell systems (Figs. 2e and6d). Nevertheless, the estimated parameters were dif-ferent, with Kf 2.43 vs. 0.58 and 1/n 0.81 vs. 0.83 in thebatch and flow cell experiments, respectively (Tables 2and 5).
Compared to batch systems, flow cell experimentsprovide several advantages, such as continuous sam-pling and an increased total solute mass in contact withthe solid surface, and minimal mass transfer limitationsin terms of film or particle diffusion (Seyfried et al.1989; Selim and Amacher 1997). In addition, flow cellexperiments allow for variations in solute–solid con-tact times over the course of an experiment based oncontrolled changes in flow rates (Limousin et al. 2007)or flow interruptions (stop–flow events). Therefore, theadsorption isotherm and estimated parameters fromflow cell experiments should be more suitable forsimulation of column experiments.
Lastly, the Kd values in our industrial soil, ingoethite-amended soil, and in HFO-amended soil were0.19, 0.24, and 1.45 L/kg in the batch experiments and0.32, 0.49, and 1.11 L/kg in the flow cell experiments,respectively. Carroll et al. (2006) measured Mo adsorp-tion onto an agricultural soil and onto a biosolid-amended soil (with 10 % amendment) using both batchand column approaches. For the batch experiments,they report values of Kd equal to 0.29 L/kg for soilvs. 1.24 L/kg for biosolid-amended soil; for the columnexperiments, they report values of 0.35 L/kg for soil vs.1.3 L/kg L/kg for biosolid-amended soil. Therefore,when a site is contaminated by Mo at high concentra-tions, e.g., 32.5 mg/L in the groundwater at our indus-trial site (Geng et al. 2013), it is infeasible to immobi-lize Mo into the soil matrix and reduce Mo availability
by amending the soil with additive agents, such asbiosolid or Fe minerals. In effect, the weak sorptionof Mo onto solids implies that it can easily betransported offsite in flowing groundwater, and thatalternative remedial options are required
Column experiments will be carried out to assessfurther the fate of Mo in industrial soil and in such soilsamended with the Fe minerals. For our industrial site,permeable reactive barriers (PRB) may be an effectiveoption to remediate Mo. Adsorption of Mo onto two Feminerals was 2 to 3 magnitudes higher than that ontothe soil; at the highest Mo supply of 47.98 mg/L, theadsorption capacities of soil, goethite, and HFO were7.4±0.25, 1,218±102, and 5,351±227 mg/kg, respec-tively. However, the adsorption capacities of these twoFe minerals are not adequate, and they could not serveas effective and economic adsorption materials in aPRB installation because a large amount of Fe mineralswould be required in the barrier. In the future, materialswith potentially high Mo adsorption capacities shouldbe identified, screened, and characterized.
5 Conclusions
Mo has a higher mobility in the alkaline industrial soil,evidenced by 14.1 % of the bound residue wasextracted by CaCl2 solution. Soils amended with Feminerals were found to have a higher Mo adsorptioncapacity, with HFO yielding stronger sorption thangoethite. However, this amendment produced the max-imum Kd of 1.45 L/kg, which renders it infeasible toimmobilize Mo into the soil matrix and reduce Moavailability by amending the soil with Fe minerals. Inthe future, materials with potentially high Mo adsorp-tion capacities, such as nano Fe, should be identified,screened, and characterized for effective permeablereactive barriers application.
Table 5 Parameter values esti-mated from the flow cellexperiments
Predicted parameters Soil Soil+ goethite Soil+ HFO
Freundlich Kf (mg1−n Ln kg−1) 0.0001 0.2906 0.5799
1/n 0.2901 0.8583 0.8296
Langmuir Q (mg/kg) 500 500 200
b (L/mg) 0.0007 0.0010 0.0063
Linear Kd (L/kg) 0.32 0.49 1.11
1743, Page 14 of 16 Water Air Soil Pollut (2013) 224:1743

Acknowledgments The authors would like to thank the NaturalScience Foundation of China (grant no. 21107072), State KeyLaboratory of Soil and Sustainable Agriculture (Institute of SoilScience, Chinese Academy of Sciences, grant no.Y052010026),China Postdoctoral Science Foundation (grant no. 2012M520408),and Ministry of Environmental Protection of China (grant no.201109052) for the financial support of this work.
References
Aboul-Kassim, T. A. T., & Simoneit, B. R. T. (2001). Pollutant-solid phase interactions: mechanism, chemistry and model-ing. Berlin: Springer.
Bar-Tal, A., Sparks, D. L., Pesek, J. D., & Feigenbaum, S.(1990). Analyses of adsorption-kinetics using a stirred-flow chamber: 1 Theory and critical tests. Soil ScienceSociety of America Journal, 54, 1273–1278.
Bartels, J. M. (1996). Part 3: Chemical methods. In: J. M.Bigham (Ed.), Methods of soil analysis. Madison: SoilScience Society of America, Inc & American Society ofAgronomy, Inc., pp. 639–664
Bibak, A. J. P. M., & Borggaard, O. K. (1994). Content anddistribution of cobalt, copper, manganese and molybdenumin Danish spodosols and ultisols. Acta AgriculturaeScandinavica Section B Soil and Plant Science, 44(4),208–213.
Borg, H., Ek, J., & Holm, K. (2001). Influence of acidificationand liming on the distribution of trace elements in surfacewaters. Water, Air, and Soil Pollution, 130, 1757–1762.
Carroll, K. C., Artiola, J. F., & Brusseau, M. L. (2006). Transportof molybdenum in a biosolid-amended alkaline soil.Chemosphere, 65, 778–785.
Cong, Q., Yuan, X., Qu, J., & Zhang, H. W. (2009). Theanalysis and assessment on the pollution condition ofheavy metals in the soil in the farmland around themolybdenum ore areas. Environmental Monitoring inChina, 25, 47–51.
Davranche, M., & Bollinger, J. C. (2000). Release of metals fromiron oxyhydroxides under reductive conditions: effect ofmetal/solid interactions. Journal of Colloid and InterfaceScience, 232, 165–173.
Elliott, H., & Taylor, M. (2000). Molybdenum content of watertreatment residuals. Journal of Environmental Quality, 29,1835–1839.
Geng, C. N., Gao, Y. J., Li, D., Jian, X. P., & Hu. Q. H. (2013).Contamination investigation and risk assessment of molyb-denum on an industrial site in China. Journal ofGeochemical Exploration (under review).
Goldberg, S., Lesch, S. M., & Suarez, D. L. (2002). Predictingmolybdenum adsorption by soils using soil chemical pa-rameters in the constant capacitance model. Soil ScienceSociety of America Journal, 66, 1836–1842.
Goldberg, S., Forster, H. S., &Godfrey, C. L. (1996).Molybdenumadsorption on oxides, clay minerals and soils. SoilScience Society of America Journal, 60, 425–432.
Goldberg, S., Su, C., & Forster, H. S. (1998). Sorption of mo-lybdenum on oxides, clay minerals and soils: mechanismsand models. In E. C. Jenne (Ed.), Adsorption of metals by
geomedia: variables, mechanisms and model applications(pp. 401–426). San Diego: Proc. Am. Chem. Soc. Symp.Academic Press.
Gonzalez, B. R., Appeh, H., Schalscha, E. B., & Bingham, F. T.(1974). Molybdate adsorption characteristics of volcanic-ash-derived soils in Chile. Proceedings-Soil Science Societyof America, 38, 903–906.
Guo, W., Chen, H., Zhang, Q. Z., & Wang, Y. D. (2011). Effectsof biochar application on total nitrogen and alkali-hydrolyzable nitrogen content in the topsoil of the high-yield cropland in north China Plain. Ecology andEnvironmental Sciences, 20(3), 425–428.
Lemly, A. D. (1994). Agriculture and wildlife: ecological impli-cations of subsurface irrigation drainage. Journal of AridEnvironments, 28, 85–94.
Lenoble, V., Bouras, O., Deluchat, V., Serpaud, B., & Bollinger, J.(2002). Arsenic adsorption onto pillared clays and iron ox-ides. Journal of Colloid and Interface Science, 255, 52–58.
Li, X. L., Li, F. C., Chen, G. Y., Xie, C. R., Wang, J. P., & Li, W.J. (2011). Comparative study on grain-size measured bylaser diffraction and sedimentation techniques. Soils,43(1), 130–134. In Chinese.
Limousin, G., Gaudet, J. P., Charlet, L., Szenknect, S., Barthes,V., & Krimissa, M. (2007). Sorption isotherms: a review onphysical bases, modeling and measurement. AppliedGeochemistry, 22, 249–275.
Lin, C. X., Chu, C. X., Lu, W. Z., Long, J., Liu, Y., & Xu, S. J.(2004). Chemical characteristics of mangrove soils in theFutian Nature Reserve, Shenzhen. Ecologic Science, 23(2),118–123 (in Chinese).
Lu, L., & Liu, S. (2011). Determination of chloride content insoil by ion chromatography. Journal of Agriculture, 39–42(in Chinese).
Lu, R. K. (1999). Analysis method of soil agriculturalchemistry. Beijing: China Agricultural Science andTechnology.
Manning, B. A., & Goldberg, S. (1996). Modeling arsenatecompetitive adsorption on kaolinite, montmorillonite andillite. Clays and Clay Minerals, 44, 609–623.
MEP (Ministry of Environmental Protection). (1990). Soil ele-ments background in China. Beijing: Chinese EnvironmentalScience.
O’Connor, G. A., Brobst, R. B., Chaney, R. L., Kincaid, R. L.,McDowell, L. R., Pierzynski, G. M., et al. (2001). A mod-ified risk assessment to establish molybdenum standards forland application of biosolids. Journal of EnvironmentalQuality, 30, 1490–1507.
Zhang, P. C., & Sparks, D. L. (1989). Kinetics and mechanismsof molybdate adsorption/desorption at the goethite/waterinterface using pressure-jump relaxation. Soil ScienceSociety of America Journal, 53, 1028–1034.
Qu, J., Yuan, X., Wang, L. L., & Wang, N. (2007). Analysis andassessment on the pollution condition of heavy metals in thesoil of molybdenum mine. Environmental ProtectionScience, 33(36–38), 48.
Selim, H. M., & Amacher, M. C. (1997). Reactivity and trans-port of heavy metals in soils. Boca Raton: CRC.
Seyfried, M. S., Sparks, D. L., Bartal, A., & Feigenbaum, S.(1989). Kinetics of calcium magnesium exchange on soilusing a stirredflow reaction chamber. Soil Science Society ofAmerica Journal, 53, 406–410.
Water Air Soil Pollut (2013) 224:1743 Page 15 of 16, 1743

SBQTS (Shandong Bureau of Quality and TechnicalSupervision). (2010).Determination of chloride ion contentin soil—ion chromatography method. Shandong, China:DB37/T 1555–2010 (in Chinese).
Yang, S. F., Lin, C. F., Lin Angela, Y. C., & Hong Andy, P. K.(2011). Sorption and biodegradation of sulfonamide antibi-otics by activated sludge: experimental assessment usingbatch data obtained under aerobic conditions. WaterResearch, 45, 3389–3397.
Sjöstedt, S., Wällstedt, T., Gustafsson, J. P., & Borg, H. (2009).Speciation of aluminum, arsenic and molybdenum in ex-cessively limed lakes. Science of the Total Environment,407, 5119–5127.
Smith, P., Smith, J. U., Powlson, D. S., McGill, W. B., Arah, J. R.M., Chertov, O. G., et al. (1997). A comparison of the perfor-mance of nine soil organic matter models using datasets fromseven long-term experiments. Geoderma, 81, 153–225.
Sposito, G. (1985). Chemical models of inorganic pollutants in soils.CRC Critical Reviews in Environmental Control, 15, 1–24.
Theng, B. K. G. (1971). Adsorption of molybdate by some crys-talline and amorphous soil clays. New Zealand Journal ofScience, 14, 1040–1056.
Jiang, W., Zhang, S. Z., Shan, X. Q., Feng, M. H., Zhu, Y. G., &McLaren, R. G. (2005). Adsorption of arsenate on soils.Part 1: Laboratory batch experiments using 16 Chinese soilswith different physiochemical properties. EnvironmentalPollution, 138, 278–284.
Xie, R. J., & MacKenzie, A. F. (1991). Molybdate sorption–desorption in soils treated with phosphate. Geoderma, 48,321–333.
Xie, R. J., MacKenzie, A. F., & Lou, Z. J. (1993). Causal modellingof pH and phosphate effects on molybdate sorption inthree temperate soils. Soil Science, 155(6), 385–397.
Žemberyová, M., Hagarová, I., Zimová, J., Barteková, J., &Kuss, H. M. (2010). Determination of molybdenum inextracts of soil and sewage sludge CRMs after fractionationby means of BCRmodified sequential extraction procedure.Talanta, 82, 582–586.
Zhang, M. K. (2004). Evaluation of phosphorus leachability insand soils by means of soil P test. Actapedologica Sinica,41(6), 996–1000 (in Chinese).
Zhang, Y., Lashermes, G., Houot, S., Doublet, J., Steyer, J. P., Zhu,Y.G., et al. (2012).Modelling of organicmatter dynamic duringthe composting process.Waste Management, 32, 19–30.
1743, Page 16 of 16 Water Air Soil Pollut (2013) 224:1743