adsorption and oxidation of asphaltenes onto in situ
TRANSCRIPT

University of Calgary
PRISM: University of Calgary's Digital Repository
Graduate Studies The Vault: Electronic Theses and Dissertations
2014-01-29
Adsorption and Oxidation of Asphaltenes onto in situ
Prepared and Commercial Nanoparticles
Abu Tarboush, Belal
Abu Tarboush, B. (2014). Adsorption and Oxidation of Asphaltenes onto in situ Prepared and
Commercial Nanoparticles (Unpublished doctoral thesis). University of Calgary, Calgary, AB.
doi:10.11575/PRISM/24715
http://hdl.handle.net/11023/1326
doctoral thesis
University of Calgary graduate students retain copyright ownership and moral rights for their
thesis. You may use this material in any way that is permitted by the Copyright Act or through
licensing that has been assigned to the document. For uses that are not allowable under
copyright legislation or licensing, you are required to seek permission.
Downloaded from PRISM: https://prism.ucalgary.ca

UNIVERSITY OF CALGARY
Adsorption and Oxidation of Asphaltenes onto in situ Prepared and Commercial
Nanoparticles
By
Belal Abu Tarboush
A THESIS
SUBMITTED TO THE FACULTY OF GRADUATE STUDIES
IN PARTIAL FULFILMENT OF THE REQUIREMENTS FOR THE
DEGREE OF DOCTOR OF PHILOSOPHY
DEPARTMENT OF CHEMICAL AND PETROLEUM ENGINEERING
CALGARY, ALBERTA
JANUARY 2014
© Belal Abu Tarboush 2014

ii
Abstract
Removal of asphaltenes from heavy oil improves the quality of oil and makes it easier to
process. In the current work, in situ prepared NiO and Fe2O3 nanoparticles within heavy
oil, display much higher affinity towards asphaltenes adsorption than commercial ones.
Nanoparticle preparation followed a method developed by our group and XRD, EDX
and TEM analyses confirmed the formation of NiO nanoparticles of 125 nm and Fe2O3
nanoparticles of 63±5 nm mean diameter. Kinetic experiments showed that, while
equilibrium could be achieved in less than 2 h for both in-situ prepared and commercial
NiO particles, much higher adsorption took place onto the in-situ prepared ones, owing
to their better dispersion. An uptake in the order of 2.8 and 2.7 g asphaltenes/g
nanoparticles was reported for in-situ prepared NiO and Fe2O3 nanoparticles,
respectively. Commercial NiO and Fe2O3 nanoparticles of the same size range and
subject to the same experimental conditions only adsorbed 15% and 25% of the above
values, respectively. Degassing temperature was found to have a major effect on the
surface area. For in situ prepared Fe2O3, surface area evaluated by BET method
following degassing the sample at 200oC was found to be significantly lower than the
one evaluated at 300oC. SEM analysis for non-heat treated and heat treated, at 300°C,
in-situ prepared Fe2O3 showed that heat treatment caused more resolution and
provided more definition of the capped nanoparticles with the agglomerated cluster. The
difference between the heat treated and non-heat treated samples supports the
adsorption model in which hydrocarbons were adsorbed onto the nanoparticles and not
vice versa. Monolayer adsorption on the nanoparticles was reported from the toluene
model solutions. Contrary to literature findings on adsorption from model solutions onto

iii
nanoparticles, our results support a model of sequential oxidation of adsorbed
asphaltenes and multilayer adsorption of asphaltenes from heavy oils onto in-situ
prepared and commercial NiO nanoparticles. The thermal behavior of the multilayered
asphaltenes suggests new interpretation of the role of the nanoparticles.

iv
Acknowledgements
I would like to express my deep appreciation and acknowledgments to my supervisor
Dr. Maen Husein for his help and direction throughout this research experience. I would
also like to extend my appreciation to Dr. Nader Mahinpey, Dr. Alex De Visscher for
being part of supervisory committee.
I owe deep gratitude to my great friends, Ahmad Al-As’ad, Hussein Sahli, Salman Al-
Khaldi, Adebola Sadiq Kasumu and Zied Ouled Ameur for their constant support and all
the joyful moments we have experienced together.
I would like also to convey my special thanks and appreciation to Dr. Pedro R Pereira
Almao for facilitating the use of his equipment. Special thanks to Dr. Azfar Hassan for
his help with the TGA analyses, Dr. Francisco Lopez-Linares, Lante Carbognani for
their help with SimDist and SARA analyses and Dr. Tobias Fürstenhaupt for helping
with the TEM/EDX analysis. I would also like to acknowledge
Great thanks and love to my wife, Fatima, my kids, Aws and Alma, for being patient
during my busy time. My family members, brothers and sisters, your continuous
encouragement were really important for me. Also I would like to present this thesis to
the soul of my mom and dad who provided us with the item of greatness.
Finally, I would extend my gratitude to the financial support I had from the Natural
Sciences and Engineering Research Council of Canada (NSERC).

v
Dedication
To The Soul of My Mom and Dad and To
All of My Family

vi
Table of Contents
Abstract ............................................................................................................................ii
Acknowledgements .........................................................................................................iv
Dedication ....................................................................................................................... v
Table of Contents ............................................................................................................vi
List of Tables ................................................................................................................... x
List of Figures ..................................................................................................................xi
Chapter One: Introduction ............................................................................................... 1
1.1 Background ............................................................................................................ 1
1.2 Objectives .............................................................................................................. 5
1.3 Thesis outline ......................................................................................................... 7
Chapter Two: Literature Review ...................................................................................... 8
2.1 Background ............................................................................................................ 8
2.1.1 Heavy oil Fractions .......................................................................................... 8
2.1.1.1 Saturates ...................................................................................................... 9
2.1.1.2 Aromatics ...................................................................................................... 9
2.1.1.3 Resins ........................................................................................................... 9
2.1.1.4 Asphaltenes ................................................................................................ 11
2.2 Asphaltenes and Resins Structure and Interactions ............................................ 13
2.3 Asphaltenes and Resins Challenges ................................................................... 16
2.4 Asphaltenes Adsorption ....................................................................................... 17
2.5 Nanoparticles Preparation .................................................................................... 19
2.6 Oxidation Behavior of Crude Oils ......................................................................... 22
2.6.1 Low Temperature Range ............................................................................... 22
2.6.2 Negative Gradient Temperature Region ........................................................ 23
2.6.3 High Temperature Range .............................................................................. 24
2.7 The Use of Thermal Analysis Techniques on Heavy Oil Studies ......................... 24
Chapter Three: Adsorption of asphaltenes from heavy oil onto in-situ prepared NiO
nanoparticles ................................................................................................................. 27
3.1 Objective .............................................................................................................. 27
3.2 Materials and methods ......................................................................................... 27

vii
3.2.1 Materials ........................................................................................................ 27
3.2.2 Methods ......................................................................................................... 28
3.2.2.1 Preparation of the oil matrix and the heavy oil model solution ................. 28
3.2.2.2 In-situ preparation of ultradispersed NiO nanoparticles ........................... 28
3.2.2.3 Nanoparticles Recovery and Characterization ........................................ 28
3.2.2.4 Characterization of the adsorbed material and the oil after adsorption .... 30
3.2.2.5. Adsorption kinetics ................................................................................. 31
3.2.2.6 Thermogravimetric analysis ..................................................................... 32
3.3 Results and Discussion ........................................................................................ 32
3.3.1 Characterization of the in-situ prepared NiO nanoparticles ........................... 32
3.3.3 Characterization of the adsorbed species and the adsorbed species-free oil 41
Chapter Four: : Oxidation of adsorbed asphaltenes onto NiO nanoparticles................. 47
4.1 Objectives ............................................................................................................ 47
4.2. Materials and Methods ........................................................................................ 48
4.2.1 Materials ........................................................................................................ 48
4.2.2 Methods ......................................................................................................... 48
4.2.2.1 Preparation of the oil matrix and the toluene model solution ................... 48
4.2.2.2 In-situ preparation of ultradispersed NiO nanoparticles ........................... 49
4.2.2.3 Asphaltenes oxidation ............................................................................. 49
4.3 Results and Discussion ........................................................................................ 50
4.3.1 TG/DTA profile of as-received commercial NiO nanoparticles ....................... 50
4.3.2 Effect of virgin asphaltenes sample size ........................................................ 52
4.3.3 TG/DTA profile for adsorbed asphaltenes onto NiO nanoparticles ................ 56
4.3.4 Effect of DCM washing .................................................................................. 59
Chapter Five: : Analysis of TG/DTA data for adsorbed species onto NiO nanoparticles69
5.1 Introduction .......................................................................................................... 69
5.2 Oxidation Analysis ............................................................................................... 72
5.2.1 The oxidation of Athabasca asphaltenes and Athabasca and Arabian heavy oil
matrixes .................................................................................................................. 72
5.2.2 The oxidation of Athabasca asphaltenes, in the presence and absence of NiO
nanoparticles .......................................................................................................... 75

viii
5.3 Activation energy calculations .............................................................................. 79
5.4 Effect of heat treatment ........................................................................................ 81
5.5 Possible Impurities ............................................................................................... 89
5.6 Explanation of the adsorption model .................................................................... 95
Chapter Six: Adsorption of asphaltenes from heavy oil onto in-situ prepared Fe2O3
nanoparticles ................................................................................................................. 97
6.1 Objectives ............................................................................................................ 97
6.2 Material and Methods .......................................................................................... 97
6.2.1 Materials ........................................................................................................ 97
6.2.2 Methods ......................................................................................................... 98
6.2.2.1 Preparation of the oil matrix and the heavy oil model solution ................. 98
6.2.2.2 In-situ preparation of ultradispersed Fe2O3 nanoparticles ....................... 98
6.2.2.3 Nanoparticle recovery and characterization ............................................ 99
6.2.2.4 Characterization of the adsorbed material and the oil after adsorption .. 100
6.2.2.5 Adsorption kinetics ................................................................................ 101
6.2.2.6 The effect of nanoparticle origin, concentration, heat treatment and water
content ............................................................................................................... 101
6.2.2.7 Thermogravimetric analysis ................................................................... 102
6.3 Results and Discussion ...................................................................................... 102
6.3.1 Characterization of the in-situ prepared Fe2O3 nanoparticles ...................... 102
6.3.2 Adsorption kinetics ....................................................................................... 108
6.3.3 Effect of washing with heptane or DCM ....................................................... 110
6.3.4 Thermal behavior of adsorbed species ........................................................ 111
6.3.5 Effect of nanoparticles concentration ........................................................... 118
6.3.6 The effect of heat treatment and water content on uptake by commercial
Fe2O3 nanoparticles .............................................................................................. 121
Chapter Seven: Conclusions, Contributions, and Recommendations ......................... 123
7.1 Conclusions ....................................................................................................... 123
7.2 Contributions ...................................................................................................... 126
7.6 Recommendations ............................................................................................. 127
References .................................................................................................................. 128
Appendix ..................................................................................................................... 138

ix
x
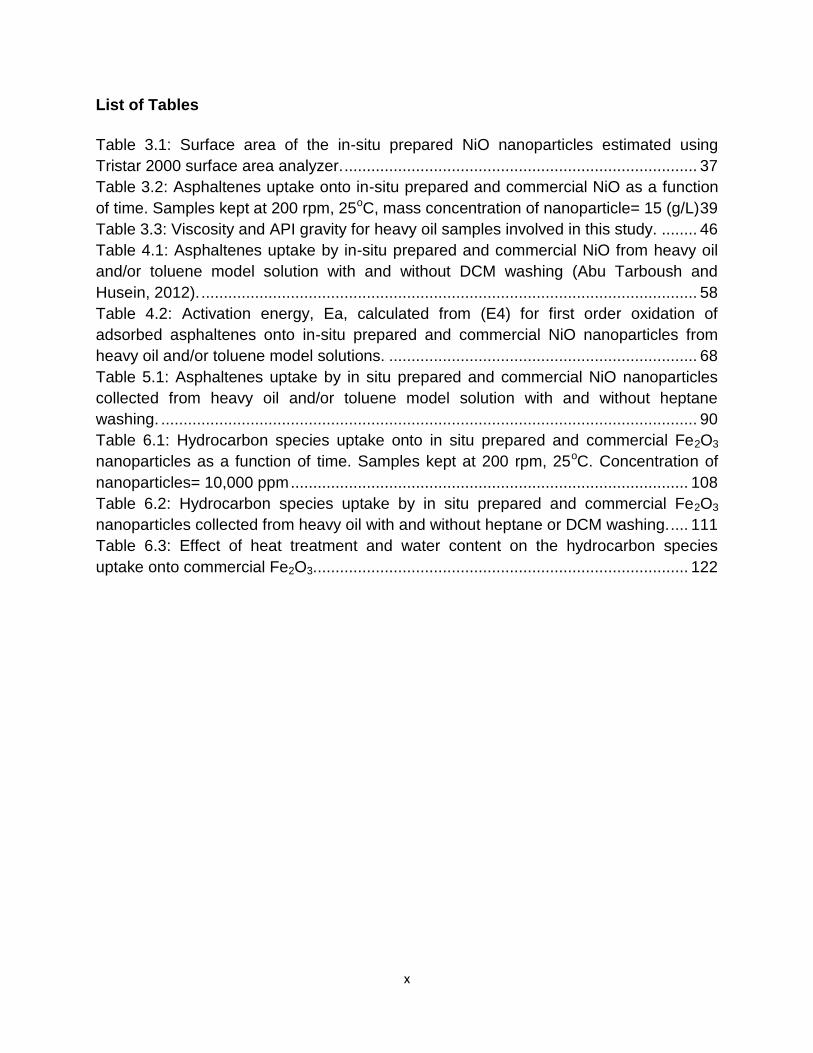
List of Tables
Table 3.1: Surface area of the in-situ prepared NiO nanoparticles estimated using
Tristar 2000 surface area analyzer. ............................................................................... 37
Table 3.2: Asphaltenes uptake onto in-situ prepared and commercial NiO as a function
of time. Samples kept at 200 rpm, 25oC, mass concentration of nanoparticle= 15 (g/L) 39
Table 3.3: Viscosity and API gravity for heavy oil samples involved in this study. ........ 46
Table 4.1: Asphaltenes uptake by in-situ prepared and commercial NiO from heavy oil
and/or toluene model solution with and without DCM washing (Abu Tarboush and
Husein, 2012). ............................................................................................................... 58
Table 4.2: Activation energy, Ea, calculated from (E4) for first order oxidation of
adsorbed asphaltenes onto in-situ prepared and commercial NiO nanoparticles from
heavy oil and/or toluene model solutions. ..................................................................... 68
Table 5.1: Asphaltenes uptake by in situ prepared and commercial NiO nanoparticles
collected from heavy oil and/or toluene model solution with and without heptane
washing. ........................................................................................................................ 90
Table 6.1: Hydrocarbon species uptake onto in situ prepared and commercial Fe2O3
nanoparticles as a function of time. Samples kept at 200 rpm, 25oC. Concentration of
nanoparticles= 10,000 ppm ......................................................................................... 108
Table 6.2: Hydrocarbon species uptake by in situ prepared and commercial Fe2O3
nanoparticles collected from heavy oil with and without heptane or DCM washing. .... 111
Table 6.3: Effect of heat treatment and water content on the hydrocarbon species
uptake onto commercial Fe2O3. ................................................................................... 122

xi
List of Figures
Figure 2.1: General fractionation Scheme for Heavy oil (Speight, 2006). ...................... 10
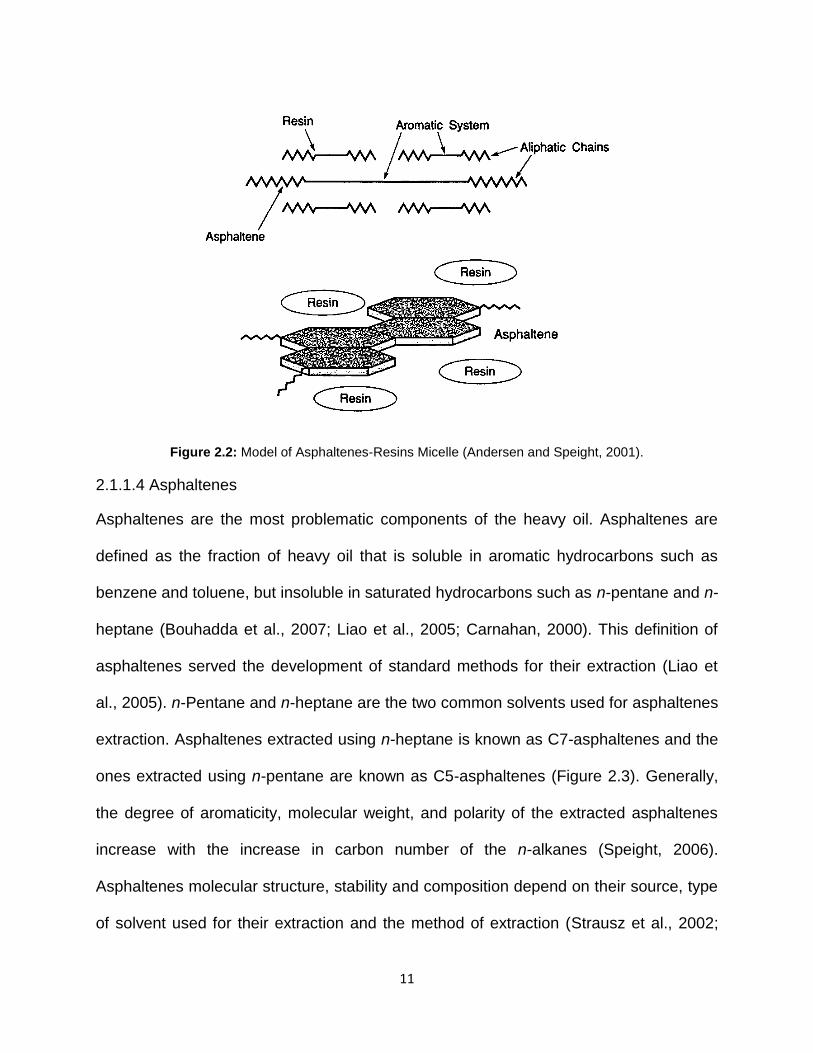
Figure 2.2: Model of Asphaltenes-Resins Micelle (Andersen and Speight, 2001). ........ 11
Figure 2.3: n-Pentane and n-Heptane Asphaltenes Photographs (Xing, 2008). ............ 12
Figure 2.4: Proposed Asphaltenes Molecule Structure (Murgich et al., 1999). .............. 13
Figure 2.5: Physical and Chemical Techniques for Formation on Nanoparticles
(Toshima & Yonezawa, 1998) ....................................................................................... 21
Figure 2.6: Schematic diagram of water droplet in a (w/o) microemulsion system. ....... 22
Figure 2.7: TGA and DTG traces for heavy oil on air environment (Indiarajos et al.,
1996) ............................................................................................................................. 26
Figure 3.1: (a) X-ray diffraction pattern; (b) TEM image; (c) particle size distribution
histogram; (d) EDX analysis of the in-situ prepared NiO nanoparticles. ........................ 34
Figure 3.2: SEM images of powders of in-situ prepared NiO collected from heavy oil a)
without heat treatment and b) with heat treatment at 250oC. ........................................ 38
Figure 3.3: TG % mass as a function of temperature for a) in-house prepared NiO
(control); b) commercial NiO (control); c) in-situ prepared NiO recovered from heavy oil;
d) commercial NiO recovered from heavy oil; e) virgin asphaltenes. Heating rate=
10oC/min; air flow= 100cm3/min. ................................................................................... 38
Figure 3.4: FTIR spectrum for adsorbed species onto a) in-situ prepared NiO in heavy
oil; b) commercial NiO in heavy oil; and c) commercial NiO in toluene model solution. 43
Figure 4.1: TG/DTA profiles of a) rate of mass loss, and b) heat flow versus temperature
for the as-received commercial NiO, Co3O4 and Fe3O4 nanoparticles. Heating rate=
10oC/min; air flow= 100cm3/min. ................................................................................... 51
Figure 4.2: TG/DTA plot of a) rate of mass loss, and b) heat flow versus temperature for
samples with low and high masses of virgin asphaltenes. Heating rate= 10oC/min; air
flow= 100 cm3/min. ........................................................................................................ 55
Figure 4.3: TG/DTA plot of a) rate of mass loss, and b) heat flow versus temperature for
asphaltenes adsorbed onto in-situ prepared and commercial NiO nanoparticles from
heavy oil and/or toluene model solution. Heating rate= 10 oC/min; air flow= 100 cm3/min.
...................................................................................................................................... 57
Figure 4.4: Mass loss per unit area of additive versus temperature for in-situ prepared
and commercial NiO nanoparticles collected from heavy oil and/or toluene model
solution. ......................................................................................................................... 62
Figure 4.5: Percent conversion, α, versus temperature for virgin and adsorbed
asphaltenes onto in situ prepared and commercial NiO nanoparticles collected from
heavy oil and/or toluene model solution. ....................................................................... 65
Figure 5.1: TG/DTA plot of (a) rate of mass loss, and (b) heat flow versus temperature
for Athabasca and Arabian oil matrixes composed of 80 wt% VGO and 20 wt% VR and
Athabasca C7-precipitated asphaltenes. Heating rate = 10oC/min; air flow = 100
cm3/min. ........................................................................................................................ 73

xii
Figure 5.2: DTA plot of heat flow versus temperature in the HTO for Athabasca and
Arabian oil matrixes composed of 80 wt% VGO and 20 wt% VR and Athabasca C7-
precipitated asphaltenes. Heating rate= 10oC/min; air flow = 100 cm3/min. .................. 76
Figure 5.3: DTA plot of heat flow versus temperature for low and high mass of virgin
Athabasca C7-precipitated asphaltenes and C7-precipitated asphaltenes adsorbed form
model solution onto commercial NiO nanoparticles. Heating rate = 10oC/min; air
flow=100 cm3/min .......................................................................................................... 78
Figure 5.4: Fraction conversion, α, for asphaltenes adsorbed onto commercial NiO
nanoparticles while a) considering all mass loss belonging to adsorbed species;
b)accounting for mass loss due to nanoparticle . .......................................................... 80
Figure 5.5: TG/DTA plot of rate of (a) mass loss and (b) heat flow versus temperature
for adsorbed species onto commercial NiO added following heat treated oil in presence
of NiO nanoparticles at 300oC for 12h.Heating rate=10oC/min; air flow =100 cm3/min . 84
Figure 5.6: FTIR spectrum for species adsorbed onto commercial NiO nanoparticles
collected from the Arabian heavy oil matrix, where the nanoparticles were heat treated
with the heavy oil at 300oC for 12 h. .............................................................................. 86
Figure 5.7: X-ray diffraction pattern of the in situ prepared NiO nanoparticles in the
heavy oil matrix at 300°C and 4 h. ................................................................................ 88
Figure 5.8: TG/DTA plot of rate of (a) mass loss, and (b) heat flow versus temperature
for in-situ NiO commercial NiO in heavy oil matrix and commercial NiO in model solution
unwashed and washed with heptane and DCM. Heating rate = 10oC/min; air flow =100
cm3/min ......................................................................................................................... 91
Figure 6.1: a) X-ray diffraction pattern; b) TEM image; c) particle size distribution
histogram; d) EDX analysis of the in-situ prepared Fe2O3 nanoparticles. ............... 105
Figure 6.2: SEM images of powders of in-situ prepared Fe2O3 collected from heavy oil
a) without heat treatment and b) with heat treatment at 300oC. .................................. 107
Figure 6.3:TG/DTA plot of rate of (a) mass loss, and (b) heat flow versus temperature
for in-situ Fe2O3 and commercial Fe2O3 in heavy oil matrix unwashed and washed with
heptaneandDCM.Heatingrate=10◦C/min;airflow=100cm3/min. ......................... 112
Figure 6.4: DTA plot ofheatflowversustemperature.Heatingrate=10◦C/min;airflow
= 100 cm3/min ............................................................................................................. 115
Figure 6.5: Mass loss per unit area of additive versus temperature for in situ prepared
and commercial Fe2O3 nanoparticles collected from heavy oil without washing and with
heptane and DCM washing. ........................................................................................ 117
Figure 6.6: Effect of in situ prepared and commercial Fe2O3 nanoparticle concentration
on uptake. Note: some of the error bars are too small to appear. ............................... 120

1
Chapter One: Introduction
1.1 Background
Bitumen as well as heavy and extra heavy oil contain high concentrations of
asphaltenes which contribute to their high specific gravity and viscosity therefore,
complicate their recovery and processing (Nassar et al., 2011a; Nassar and Pereira-
Almao, 2010; Nassar et al., 2010; Yi et al., 2009; Sakanishi, et al., 2004). Asphaltenes
are defined as the fraction of heavy oil that is soluble in aromatic hydrocarbons such as
benzene and toluene, but insoluble in saturated hydrocarbons such as n-pentane and n-
heptane (Bouhadda et al., 2007; Liao et al., 2005; Carnahan, 2000). The presence of
polar functional groups in asphaltenes confers surface activity on these molecules,
which may lead to appearance of surface charges on interfaces (Marczewski and
Szymula, 2002). Consequently, asphaltenes strongly adsorb onto mineral surfaces and
reservoir rocks creating deposits which limit utilization and recovery of heavy oil from
reservoirs. Additionally, they get adsorbed and deposited on steel surfaces which inhibit
consistent flow of crude oil in the piping system, resulting in huge increase in
operational costs as well as adverse impact on production rates (Abdulrazag et al.,
2007; Mansoori et al., 2007; Goual and Firoozabadi 2002; Sheu, 2002). Furthermore,
asphaltenes adsorption onto the upgrading catalyst surface deactivates catalysts and
the metallic heteroatoms of the adsorbed asphaltenes and resins lead to catalyst
poisoning (Takahashi et al., 2005).
On the other hand, asphaltenes could be removed exploiting the same property which
contributes to their disruptive nature. The high surface activity of asphaltenes enabled
removal of these molecules via adsorption onto metallic surfaces, such as gold (Xie and

2
Karan, 2005; Ekholm et al., 2002) and steel (Abdallah and Taylor, 2007), metal oxide
surfaces such as iron, titanium and aluminium oxides (Fe2O3, TiO2, and Al2O3) (Nassar,
2010; Marczewski and Szymula, 2002), mineral surfaces, such as clay (Marlow et al.,
1987), calcite and kaolin (Marczewski and Szymula, 2002), and metal oxide
nanoparticles (Nassar, 2010; Nassar et al., 2011a-c). Among the several adsorbents
nanoparticles showed fast adsorption kinetics and high adsorption capacity. This was
attributed to the high surface area and high degree of dispersion, which reduced the
mass transfer barrier (Nassar, 2010; Husein et al., 2010). More specifically, Nassar et
al. (2012a, 2011a-c) used commercial NiO nanoparticles and reported high asphaltenes
adsorption from toluene model solutions. Moreover, Nassar et al. (2011a,b) reported
appreciable rates of oxidation and gasification of adsorbed asphaltenes onto the
commercial NiO nanoparticles at low temperatures. Nevertheless, it is believed that in-
situ prepared nanoparticles display better performance, since their sizes and stability
are better controlled (Nassar and Husein, 2007a,b; Nassar and Husein 2010). More
recently, Abdrabo and Husein (2012) prepared NiO nanoparticles in-situ in heavy oil
and reported stable dispersions with particle size in the range of 5 to 25 nm.
Thermogravimetry (TGA) and differential scanning calorimetry (DSC) have been widely
employed for studying the thermal behavior of crude oils and their fractions (Karacan
and Kök, 1997). These instruments enable simultaneous measurement of mass and
heat variations with temperature, and, hence, provide good insight on the nature of
reactions taking place. Plots of the differential thermogravimetry (DTG) and DSC were
used to draw maps with most probable reactions in a given temperature interval.
Tadema (1959) was the first to use differential thermal analysis (DTA) to characterize

3
the thermal behavior of crude oil. He identified a low temperature oxidation (LTO) region
between 220 and 350oC and a high temperature oxidation (HTO) region above 350oC.
Kök (1993) studied the pyrolysis and oxidation of two heavy crudes using DSC and
TGA. Under inert atmosphere, he identified a distillation region between 25 and 400oC
and a visbreaking region between 400 and 600oC, whereas under oxidizing
atmosphere, three reaction zones were identified and labeled as LTO, up to 390oC, fuel
deposition (FD), between 390 and 490oC, and HTO, above 490oC. Kök and Iscan (Kök
and Iscan, 2001) later named the second region as medium temperature oxidation
(MTO). In an attempt to identify major reactants within a reaction zone, Ciajolo and
Barbella (1984) explored the pyrolysis and oxidation of some heavy oils and their
separate fractions. Using DTG plots, under inert atmosphere, they reported volatilization
of paraffinic and aromatic fractions below 400oC, and pyrolysis of polar and asphaltenic
fractions, leading to carbon residue formation, above 550oC. Under oxidizing
atmosphere, on the other hand, simultaneous evaporation and liquid phase oxidation of
the paraffinic and aromatic fractions occurred below 400oC, pyrolysis of oxidized polar
materials, asphaltenes and some aromatics dominated between 400oC and 550oC, and,
finally, combustion of the carbonaceous residue proceeded at above 500oC. For crudes
with high asphaltenic fractions, understanding the thermal behavior of asphaltenes
becomes an essential component of heavy oil upgrading (Ali and Saleem 1991) and
leads to more effective modes of utilizing such crudes. Ciajolo and Barbella (1984)
reported that, even under oxidizing atmosphere, asphaltenes are stable and do not
undergo evaporation until 520oC, where pyrolysis and polymerization reactions take
place and carbonaceous residue accompanied by low molecular weight gases form.

4
Moschopedis et al. (1978), on the other hand, attributed mass loss of Athabasca
asphaltenes under inert atmosphere below 350oC to the elimination of groups located
on the periphery. Ali and Saleem (1991) studied the thermal behavior of Arabian
asphaltenes and reported complete conversion, with minimum carbon residue, under
severe pyrolysis condition of above 520oC.
Burger and Sahuquet (1972) used DTA plots to study the catalytic effect of some
metallic additives on crude oil combustion and reported zones for low temperature
partial oxidation, combustion of crude oil fractions and, finally, coke combustion.
Moreover, they concluded that the presence of heavy metals oxides not only increased
coke deposition but also catalyzed the HTO reactions. Drici and Vossoughi (1985)
investigated the effect of clays, silica and alumina, with different specific surface areas,
on the combustion of crude oils using DSC and DTG plots. Their results showed that
reducing the crude oil/surface area ratio improved LTO peaks and induced appreciable
fractional heat shift to lower temperatures, independent of the chemical structure of the
solid additives. Furthermore, Drici and Vossoughi (1987) showed that nickel, vanadium,
and ferric oxides significantly improve the endothermic reactions such as thermal or
catalytic cracking. Nevertheless, in the presence of large solid surface, surface
reactions became predominant. Jia et al (2012) distinguished between surface and
catalytic effects by using additives with similar granular size and analyzing the
differences in activation energy of the reactions involved. It should be noted that in all
the studies investigating catalytic additives, conclusions on catalytic role were drawn
from lower activation energy of a given reaction brought about by shifting the major

5
reaction peak and/or the temperature range to lower temperatures in the presence of
the additive.
1.2 Objectives
The proposed work contributes to the in situ upgrading of heavy oil. Specifically, it
investigates the adsorption and oxidation of asphaltenes and heavy hydrocarbons onto
in situ prepared as well as commercial nanoparticles. Our research group has shown
that heavy oil matrices under SAGD conditions are very well represented by (w/o)
microemulsion systems (Nassar and Husein, 2010), and had demonstrated that (w/o)
microemulsion methods can be successfully employed to form wide variety of well
dispersed metal oxides nanoparticles in heavy oil (Nassar et al., 2010; Nassar and
Husein, 2010). (w/o) Microemulsion technique will be used for the formation of the said
ultradispersed nanoparticles. NiO and Fe2O3 nanoparticles were in situ prepared using a
single step (w/o) microemulsion that includes water in a real heavy oil matrix.
Adsorption and oxidation of asphaltenes and other hydrocarbons on the in situ prepared
nanoparticles was investigated. It is worth mentioning that, in the open literature, no
reports have discussed the in situ preparation of these nanoparticles using single step
(w/o) microemulsion.
The thesis is divided into three main phases:
Phase one: In situ preparation of ultradispersed nanoparticles in the heavy oil matrix
and their characterization:
1. In this work, NiO and Fe2O3 nanoparticles were successfully prepared in heavy oil
matrix composed of Arabian Light Vacuum Gas Oil, ALVGO, and Arabian Light

6
Vacuum Residue, ALVR employing the (w/o) microemulsion approach with the
aid of asphaltenes as naturally occurring surface active agent.
2. Characterization of the in situ prepared nanoparticles, which involves
nanoparticles identification using X-ray diffraction (XRD), nanoparticle size
determination using transmission electron microscopy (TEM), nanoparticles
surface area using surface area analyzer and scanning electron microscopy
(SEM) was used to account for probable aggregation.
Phase two: Study asphaltenes/hydrocarbons adsorption
1. Study the kinetics of asphaltenes/hydrocarbons adsorption onto in situ prepared
and commercial nanoparticles using thermogravimetric analysis (TGA).
2. Explore upgrading of heavy oil upon adsorption of asphaltenes and heavy
fractions onto the in-situ prepared NiO and Fe2O3 nanoparticles.
3. Conduct a comparison study between adsorption capacities of the in situ
prepared as well as the commercial NiO and Fe2O3.
4. Characterize adsorbed material through Fourier transform infrared (FTIR) and
TGA analyses of washed and unwashed samples of adsorbed materials.
Phase three: Thermal analysis of asphaltenes/hydrocarbons using TGA
1. Study the uptake and the thermal behavior of asphaltenes/hydrocarbons in
presence and absence of NiO and Fe2O3 nanoparticles.
2. Investigate the catalytic and surface roles of the in situ prepared nanoparticles
toward asphaltenes/hydrocarbons oxidation.

7
1.3 Thesis outline
This thesis is comprised of seven chapters outlined as follows:
Chapter two surveys the literature pertaining to asphaltenes structure, challenges
encountered in heavy oil processing due to the presence of asphaltenes and the
adsorption of asphaltenes onto common adsorbents.
Chapter three describes the in situ preparation of NiO nanoparticles in the heavy oil and
evaluates the adsorption capacity of as-prepared nanoparticles.
Chapter four analyzes the thermal behavior of asphaltenes under oxidizing atmosphere
in presence and absence of NiO nanoparticles.
Chapter five provides an in depth analysis for the thermal behaviour of the adsorbed
asphaltenes/hydrocarbons onto NiO nanoparticles.
Chapter six describes the in situ preparation of Fe2O3 nanoparticles in the heavy oil,
evaluates the adsorption capacity of the in situ prepared nanoparticles toward
asphaltenes/ hydrocarbons and studies the thermal behaviour of the adsorbed species.
In Chapter seven, the conclusions, contributions, and recommendations for future work
are provided; include major findings from results and analysis of Chapters three, four,
five and six.

8
Chapter Two: Literature Review
This chapter presents a brief review on petroleum fractions, physical and chemical
characteristics of asphaltenes and asphaltenes adsorption and oxidation. Moreover, a
literature review on nanoparticles preparation is presented in detail.
2.1 Background
Alberta oilsands contain bitumen, the heaviest and thickest component of crude oil. The
current processes employed for the recovery and extraction of bitumen form oilsands
are complicated, expensive, and most importantly environmentally unfriendly (Nassar et
al., 2011a; Nassar and Pereira-Almao, 2010; Nassar et al., 2010; Yi et al., 2009).
Moreover, bitumen needs to be upgraded into lighter crude before it can be utilized.
Upgrading of the recovered bitumen, which is currently carried out on surface,
consumes large quantities of hydrogen. This hydrogen is typically supplied from steam
reforming of natural gas or naphtha. On the other hand, asphaltenes are the major
cause for the high density and viscosity of bitumen and heavy oil. Thus, removing these
components improves the in-situ recovery processes (Nassar, 2010; Nassar et al.,
2011b; Sakanishi, et al., 2004).
2.1.1 Heavy oil Fractions
Heavy oil is a complex mixture of hydrocarbons, hetero-atoms such as sulphur, oxygen
and nitrogen and compounds containing metallic ingredients in particular, vanadium,
nickel, iron and copper (Speight, 2006). The structure of the heavy oil becomes more
complicated due to the wide variety of its composition. These varieties can vary not only
with respect to the location and the age of oil field but also with the depth of individual
wells (Speight, 2006).

9
In order to simplify the description of the heavy oil fractions, which is composed of
hundreds of molecular species, a classification method based on their solubility and
polarity has been developed. Mainly, there are four major fractions, saturates,
aromatics, resins and asphaltenes know as SARA fractions (Speight, 2006; Rahimi and
Gentzis, 2006) (Figure 2.1).
2.1.1.1 Saturates
Saturates are the lightest fraction of the crude oil that comprise mainly two hydrocarbon
components, paraffins and naphthenes. Paraffins are straight or branched hydrocarbon
without any ring structure while the naphthenes contain one or more rings which may
have several alkyl side chains (Speight, 2006). In addition to that, the paraffinic
hydrocarbons decrease with increasing boiling point fraction of heavy oil and are only
present in low boiling point fractions and are barely found in high boiling point which
occurs as alkyl side chains on the aromatic and naphthenic systems. The naphthenic
hydrocarbons, meanwhile, increase with increasing boiling point (Speight, 2006).
2.1.1.2 Aromatics
Aromatics are non-polar-carbon-chains that contain one or more aromatic nuclei such
as benzene, naphthalene, and phenanthrene ring (Speight, 2006).
2.1.1.3 Resins
Resins, in heavy oil, are the key component responsible to maintain the stability of
petroleum and prevent separation of asphaltenes as a separate phase. Resins are less
polar than asphaltenes; they normally interact with asphaltenes aggregates and prevent
them from associating and agglomerating (Acevedo et al., 1995; Espinat et al., 1993;

10
Speight, 2006; Spiecker et al., 2003). In addition, when added to asphaltenes
agglomerates, resins disrupt their association and re-disperse the asphaltenes
aggregates in the oil (Spiecker et al., 2003). Due to the difference in molecular weight
between resins and asphaltenes, and because the mole fraction of resins are larger
than asphaltenes, micelles are expected to have more resins (Andersen and Speight,
2001) (Figure 2.2). In addition to that, resins can also work as inhibitor that can slow
down asphaltenes aggregation when mixing n-paraffins with crude oils (Al-Sahhaf et al.,
2002). Resins can be precipitated using butane and propane and they are soluble in
most organic liquids, except lower alcohols and acetone, and in the liquids that
precipitate asphaltenes (Andersen and Speight, 2001; Goual and Firoozabadi, 2004)
Figure 2.1: General fractionation Scheme for Heavy oil (Speight, 2006).
11
Figure 2.2: Model of Asphaltenes-Resins Micelle (Andersen and Speight, 2001).
2.1.1.4 Asphaltenes
Asphaltenes are the most problematic components of the heavy oil. Asphaltenes are
defined as the fraction of heavy oil that is soluble in aromatic hydrocarbons such as
benzene and toluene, but insoluble in saturated hydrocarbons such as n-pentane and n-
heptane (Bouhadda et al., 2007; Liao et al., 2005; Carnahan, 2000). This definition of
asphaltenes served the development of standard methods for their extraction (Liao et
al., 2005). n-Pentane and n-heptane are the two common solvents used for asphaltenes
extraction. Asphaltenes extracted using n-heptane is known as C7-asphaltenes and the
ones extracted using n-pentane are known as C5-asphaltenes (Figure 2.3). Generally,
the degree of aromaticity, molecular weight, and polarity of the extracted asphaltenes
increase with the increase in carbon number of the n-alkanes (Speight, 2006).
Asphaltenes molecular structure, stability and composition depend on their source, type
of solvent used for their extraction and the method of extraction (Strausz et al., 2002;

12
Groenzin and Mullins, 2000; Marlow et al., 1987). For example, the hydrogen to carbon
ratio (H/C) of the C7-asphaltenes is lower than that of the C5- asphaltenes (Speight,
2006). Despite the fact that they do not have single distinct chemical structure,
asphaltenes contain polynuclear aromatic components that include few alkyl groups per
aromatic ring (Carnahan, 2000) (Figure 2.4).
Figure 2.3: n-Pentane and n-Heptane Asphaltenes Photographs (Xing, 2008).
n-C5 n-C7

13
Figure 2.4: Proposed Asphaltenes Molecule Structure (Murgich et al., 1999).
2.2 Asphaltenes and Resins Structure and Interactions
There are structural similarities between asphaltenes and resins (Koots and Speight,
1975), which facilitate the formation of the micelles and, thus, help with asphaltenes
stabilization. Nonetheless, asphaltenes and resins have some differences in size,
physical appearance, polarity and aromaticity (Speight 2006). Once compared with
resins, asphaltenes are soluble in aromatic solvent such as benzene and toluene and
insoluble in pentane or heptane, while resins are soluble in alkanes (Speight, 2004).
Asphaltenes are dark brown to black friable solids and their structure contains between

14
40-80 carbon atoms and typically some sulphur, nitrogen, oxygen, and several metallic
heteroatoms; mainly, nickel and vanadium, with an average aromatic sheet composed
of 4-10 benzene condensed rings that form monomers having an average sheet
dimension between 1.1-1.7 nm (Bouhadda et al., 2007; Carnahan, 2000; Groenzin, and
Mullins, 2000; Speight, 2006). Elemental analysis of different asphaltenes samples
exhibit that their H/C ratio is between 1.1 and 1.2 (Speight, 2006; Carnahan, 2000;
Speight, and Moschopedis, 1981). Since hydrogen and carbon content of different
asphaltenes varies over a narrow range, the variation in heteroatom’s content, in
particular oxygen and sulfur, from one asphaltenes sample to another is believed to be
the main reason behind the differences in asphaltenes behavior. In general,
asphaltenes have no specific melting point but decompose when temperature exceed
350 ◦C (Speight, 2006; Speight, and Moschopedis, 1981; Moschopedis, et al., 1978).
Resins, on the other hand, which are a red to brown semi liquid oil fraction (Speight,
2006) are defined as the fraction of the de-asphalted oil that is strongly adsorbed on
surface-active materials such as alumina and silica. They can only be desorbed using a
solvent such as pyridine or a mixture of toluene and methanol (Buenrostro-Gonzalez et
al., 2004). Resins belonging to the same crude are less polar (Goual and
Firoozabadi,2002), contain less aromatics and have less condensed structure and lower
molar mass than asphaltenes (Speight, 2004). Speight (2006), using spectroscopic
analysis, confirmed the presence of hydroxyl groups, ester, acids and carbonyl
functions in the resins fraction. Moreover, resins have relatively longer aliphatic-side
chains with naphthenic rings and polar functions (Firoozabadi, 1999; Speight, 2006; Wu
et al., 1998). This structure is believed to conform some surfactant properties onto the

15
resins (Goual and Firoozabadi, 2004; Al-Sahhaf et al., 2002). For example, in the
presence of water, resins tend to diffuse first to the interface before being replaced by
asphaltenes (Magual et al., 2006). The resins to asphaltenes ratio control the amount of
adsorbed asphaltenes on water (Goual et al., 2005). Still, resins were not found to
significantly stabilize water in model oil emulsions on their own (McLean and Kilpatrick,
1997).
Asphaltenes and resins get involved in networking and self-association and tend to
precipitate and adsorb on different surfaces (Nikookar et al., 2008; Evdokimov et al.,
2003). This behaviour, which distinguishes them from other oil constituents, occurs by
intermolecular aromatic plane stacking arising from multiple interactions. The
intermolecular forces involved in the association of asphaltenes are under discussion in
literature with a controversy concerning the relative importance of each of these forces
(Carlos da Silva Ramos et al., 2001). These forces include van der Waals forces (Wiehe
and Liang, 1996), hydrogen bonding (Moschopedis and Speight, 1976) and charge-
transfer interactions (Siffert et al., 1990). Large asphaltenes particles do, in fact, self-
associate forming small aggregates by weaker interaction forces. Asphaltenes self-
aggregate when their concentration exceeds a certain level into nanoaggregates that
are stable at the reservoir conditions (Mullins, 2010; Andreatta et al., 2005). Both, the
critical nanoaggregate concentration (CNAC) and the critical cluster concentration
(CCC) are crude oil dependent and represent a balance between the light and heavy
fractions of the crude (Goual, 2012; Goual et al., 2011). Resins not only adsorbed onto
the micellar surface, but also fill in the solvent voids in the asphaltenic aggregates
created by the network structure of asphaltenes (Spiecker et al., 2003).

16
2.3 Asphaltenes and Resins Challenges
For given conditions of temperature and pressure, asphaltenes stable concentration and
crude oil stability depend on a fine balance between asphaltenes, resins and the lighter
fraction contents of the crude oil (Speight, 2004). Therefore, any disturbance in the
thermodynamic parameters such as pressure, temperature and composition may lead
to asphaltenes precipitation and deposition. In fact temperature has the least effect on
asphaltenes precipitation, meanwhile pressure and asphaltenes content have the major
effect (Hammami et al., 1999). It is also interesting to note that oil with high asphaltenes
content has fewer tendencies to precipitate due to the high resin content (Goual and
Firoozabadi, 2002). Asphaltenes deposition can take place through several
chronological and parallel steps including precipitation, flocculation, and migration of the
flocculated asphaltenes toward the surface, then adhesion of the asphaltenes to the
surface, followed by cohesion of precipitated/flocculated asphaltenes with the already
adsorbed asphaltenes onto the surface (Karan et al., 2003). Asphaltenes precipitation
includes the formation of a solid phase or a dense liquid as a result of change in
thermodynamic equilibrium within the crude oil components, whereas deposition
involves the attachment or sticking of this solid or dense liquid phase onto the surface
(Karan et al., 2003). In general, the presence of functional groups in the asphaltenes
molecules allow them to become surface active and create surface charges at the
interface, thus get adsorbed to these surfaces. It should be noted that precipitation does
not always result in deposition. Despite these differences, the two terms are used
interchangeably in the literature (Karan et al., 2003). Precipitated asphaltenes can
transport to the surface and adhere to the surface in the form of asphaltenes molecules

17
or as aggregates by virtue of attractive forces between asphaltenes molecules that
allow them to self-associate. The formation of precipitated asphaltenes layer on a
surface can occur through adhesion and is called deposition, whereas the multilayer
formation can occur by cohesion, which results from interaction between
adsorbed/adhered asphaltenes and precipitated/flocculated asphaltenes (Andreatta et
al., 2005). It is also possible for nano-aggregates of asphaltenes molecules to get
adsorbed/adhere directly onto a surface (Andreatta et al., 2005).
2.4 Asphaltenes Adsorption
Adsorption, strictly speaking, refers to the preferential partitioning of a solute between
the bulk solvent and the interfacial region adjacent to the solid adsorbent due to
differences in chemical potential. Asphaltenes may adsorb on surfaces as colloidal
aggregates of various sizes, or as individual molecules (Andreatta et al., 2005). The
carboxylic and phenolic weak acidic groups control the adsorption properties and the
surface charges of asphaltenes (Sztukowski et al., 2003). The presence of functional
groups in the asphaltene molecules allow them to become surface active and create
surface charges at the interface (Marczewski, and Szymula, 2002). The analysis of a
single layer of adsorbed asphaltenes on stainless steel surface showed the presence of
several functional groups such as, carboxylic, pyrrolic, pyridinic, thiophenic, and sulfite
(Abdallah and Taylor, 2007). These properties of asphaltenes render bitumen and
heavy oil recovery and upgrading problematic. Asphaltenes molecules depict the
highest molecular weight, polarity, and surface activity of all the different components of
the crude (Sayyouh et al., 1991; Syunyaev et al., 2009). Asphaltenes strongly adsorb on
mineral surfaces and reservoir rocks creating deposits which limit utilization and

18
recovery of heavy oil from reservoirs. Additionally, they get adsorbed and deposited on
steel surfaces which inhibit consistent flow of crude oil in the piping system, resulting in
huge increase in operational costs as well as adverse impact on production rates
(Abdulrazag et al., 2007; Mansoori et al., 2007; Goual Firoozabadi, 2002; Sheu, 2002).
Furthermore, asphaltenes adsorption onto the upgrading catalyst surface deactivates
catalysts and the metallic heteroatoms of the adsorbed asphaltenes and resins lead to
catalyst poisoning (Nassar, 2010; Takahashi et al., 2005). Also, oil spills can cause
asphaltenes adsorption on soil particles causing extra pollution problems (Nassar,
2010). These problems, together with the need to increase production rates, mandate
research aiming at in situ removal of asphaltenes from heavy oil and bitumen. One
possible way of removing asphaltenes from these systems is adsorption onto surfaces
large enough to induce significant reduction in the viscosity of heavy oil and bitumen.
Several researchers investigated the adsorption of asphaltenes onto different
adsorbents including metallic surfaces, such as gold (Kui and Karan, 2005; Ekholm et
al., 2002) and steel (Abdallah and Taylor, 2007), metal oxide surfaces such as iron,
titanium and aluminium oxides (Fe2O3, TiO2, and Al2O3) (Nassar, 2010; Marczewski
and Szymula, 2002), mineral surfaces, such as clay (Marlow et al., 1987), calcite and
kaolin (Marczewski and Szymula, 2002), and metal and metal oxide nanoparticles
(Nassar, 2010; Nassar et al., 2011a-c). Recently, the use of nanoparticles as an
asphaltenes adsorbents gained considerable attention due to their high surface area as
well as high degree of dispersion which reduces the mass transfer limitation therefore,
resulting in having faster adsorption rates and higher adsorption capacity. (Nassar,
2010). Alboudwarej et al. (2005) investigated the adsorption of asphaltenes, resins and

19
asphaltenes-resins mixture from toluene model solutions. They reported an increasing
trend in the mass saturation adsorption in the order of resins, asphaltenes-resin
followed by asphaltenes. This can be attributed to the fact that, when co-existing in a
liquid mixture, resins reduce the extent of asphaltenes self-aggregation, which results in
reducing the molar mass of the asphaltenes aggregates, thus, reducing the mass
saturation adsorption. Conversely, Ekholm et al. (2002) studied the interaction between
adsorbed asphaltenes and resins dissolved in toluene. They reported that resins do not
desorb pre-adsorbed asphaltenes neither do they adsorb onto them. This finding
suggests that the interaction between the resins and asphaltenes surface is less than
that of asphaltenes and the adsorbent surface.
2.5 Nanoparticles Preparation
Nanoparticles are particles that are between 1 and 100 nm in diameter. Their properties
are different from the bulk particles counterparts (Christian et al., 2008; Husein and
Nassar, 2008). They show higher catalytic activity, adsorption kinetics, and selectivity,
and most importantly they are highly mobile in porous media, due to their small size,
which makes them ideal for in-situ, within reservoir, applications.
Nanoparticles, of wide range of materials, can be prepared by two methods, physical
and chemical techniques (Toshima and Yonezawa, 1998) as shown in Figure 2.5.
Under the chemical approach, there are five techniques for formation of nanoparticle (i)
chemical co-precipitation, (ii) electrochemical, (iii) sonochemical, (iv) sol-gel processing,
and (v) microemulsion (Husein and Nassar, 2008). It is important to mention that all
these techniques require the presence of stabilizing agent in order to prevent
aggregation of the resultant nanoparticles.
20
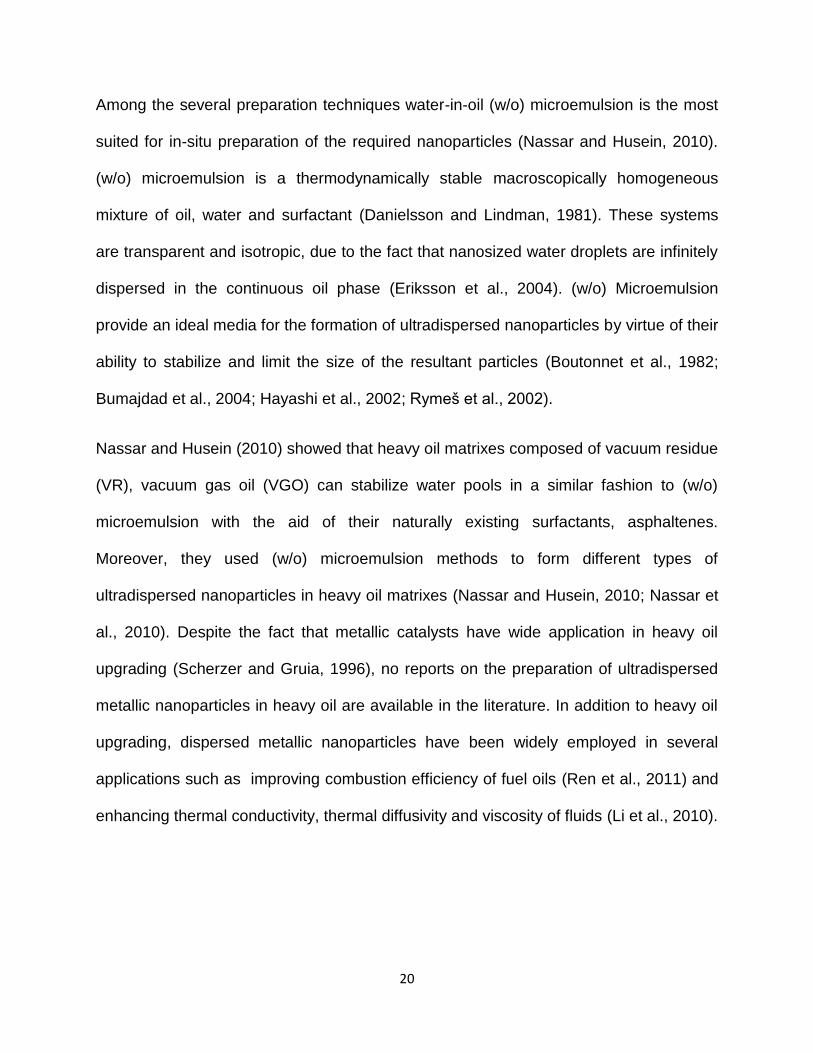
Among the several preparation techniques water-in-oil (w/o) microemulsion is the most
suited for in-situ preparation of the required nanoparticles (Nassar and Husein, 2010).
(w/o) microemulsion is a thermodynamically stable macroscopically homogeneous
mixture of oil, water and surfactant (Danielsson and Lindman, 1981). These systems
are transparent and isotropic, due to the fact that nanosized water droplets are infinitely
dispersed in the continuous oil phase (Eriksson et al., 2004). (w/o) Microemulsion
provide an ideal media for the formation of ultradispersed nanoparticles by virtue of their
ability to stabilize and limit the size of the resultant particles (Boutonnet et al., 1982;
Bumajdad et al., 2004; Hayashi et al., 2002; Rymešetal.,2002).
Nassar and Husein (2010) showed that heavy oil matrixes composed of vacuum residue
(VR), vacuum gas oil (VGO) can stabilize water pools in a similar fashion to (w/o)
microemulsion with the aid of their naturally existing surfactants, asphaltenes.
Moreover, they used (w/o) microemulsion methods to form different types of
ultradispersed nanoparticles in heavy oil matrixes (Nassar and Husein, 2010; Nassar et
al., 2010). Despite the fact that metallic catalysts have wide application in heavy oil
upgrading (Scherzer and Gruia, 1996), no reports on the preparation of ultradispersed
metallic nanoparticles in heavy oil are available in the literature. In addition to heavy oil
upgrading, dispersed metallic nanoparticles have been widely employed in several
applications such as improving combustion efficiency of fuel oils (Ren et al., 2011) and
enhancing thermal conductivity, thermal diffusivity and viscosity of fluids (Li et al., 2010).

21
Figure 2.5: Physical and Chemical Techniques for Formation on Nanoparticles (Toshima & Yonezawa,
1998)
Figure 2.6 shows a schematic diagram of a water droplet surrounded by surfactant
molecules in a continuous oil medium. The very well dispersed water droplets of the
(w/o) microemulsion can be utilized as nano-reactors where reactions leading to the
formation of well dispersed nanoparticles can be carried out. In fact, (w/o)
microemulsion were used to prepare homogeneous mono-dispersed nanoparticles with
predetermined size and shape (Petit et al., 1993; Pileni, 1993; Pileni et al., 1992).

22
Figure 2.6: Schematic diagram of water droplet in a (w/o) microemulsion system.
2.6 Oxidation Behavior of Crude Oils
The oil oxidation reaction involves three oxidation regions; Low Temperature Range
(LTR), Negative Temperature Gradient Region (NTGR) and High Temperature Range
(HTR) (Kök, 1993; Moore et al, 1992; Tadema 1959). In another study, Kök (1993)
described three oxidation reaction zones, low temperature oxidation (LTO), fuel
deposition (FD) and High temperature oxidation. Later, Kök and Iscan (2001) named the
second region as medium temperature oxidation (MTO).
2.6.1 Low Temperature Range
The low temperature oxidation occur below 300oC and the air interaction with heavy oil
below this temperature is different than in the case of bitumen where the physical and

23
the chemical properties are significantly different (Kök, 1993; Tadema, 1959). The low
temperature oxidation reactions produce different products than complete combustion
where low temperature oxidation reactions typically produce unstable intermediate
oxidized hydrocarbons. These product significantly impact oil viscosity and mobility
(Alexander et al., 1962). On the other hand, complete combustion occurs at a much
elevated temperature and will mainly produce CO2 and H2O.
Low temperature oxidation reactions will result in partial oxidation of the hydrocarbons
and will produce oxygenated hydrocarbons such as carboxylic acid, aldehydes, ketones
and alcohols (Burger and Sahuquetet, 1972). Typically, low temperature oxidation will
degrade the oil quality since the resultant products from the low temperature oxidation
reaction have higher viscosity and lower API gravity than the original oil (Alexander et
al, 1962). In addition, these low temperature reactions promote the formation of high
molecular weight compounds such as asphaltenes since these reactions will convert the
aromatic and resin to asphaltenes (Moschopedis and Speight, 1975).
2.6.2 Negative Gradient Temperature Region
The transit region between the low temperature oxidation region and the high
temperature oxidation region is called the negative gradient temperature region. This
region is characterized by the fact that at this temperature range the oxygen uptake
decreases with increasing the temperature. This behavior is an indication that the vapor
phase at equilibrium with the oil liquid phase is outside the flammability range (Martinez
Correa, 2013). The liquid phase oxidation reactions produce non-volatile combustible
residue on the oil surface. This phase restricts the oxygen transfer to the liquid and the
volatile fractions from the vapor phase. The negative gradient temperature region

24
occurs at a temperature range between 200oC -350oC and the exact temperature
depends on the nature of the heavy oil and the amount of available oxygen. This region
serves as a boundary that if exceeded high temperature oxidation reactions will occur
(Moore et al, 1998).
2.6.3 High Temperature Range
The high temperature oxidation reactions occur usually above 350oC with the presence
of sufficient amount of oxygen. Kök (1993) refer to high temperature range for reactions
takes place above 450oC. The oxidation reactions that occur at this range is
characterized by the complete combustion and the primary products are CO2, and H2O
(Tadema, 1959). Recent studies by (Barzin et al, 2010) indicate that combustion
reaction occurring in the vapor phase are significant contributors to energy and hence
carbon oxides and water generation.
2.7 The Use of Thermal Analysis Techniques on Heavy Oil Studies
Thermogravimetric analysis (TGA) and Differential scanning calorimetry (DSC) have
been used for years to study the thermal behavior of minerals and other inorganic
substances when subject to temperature changes. Tadema (1959) was the first to use
these instruments to investigate thermal behavior of petroleum fluids. Thermal behavior
of heavy oil contains a broad range of compounds ranging from very light components
that are volatile and evaporate at relatively low temperatures to the very heavy
substance which don’t evaporate at low decomposition temperatures. In general, the
light portion of the heavy oil can be isolated and defined easily when the oil undergoes a
controlled temperature increase. Meanwhile, the heavier fractions which contain the
non-boiling fractions, such as asphaltenes, can only be separated into groups of
25
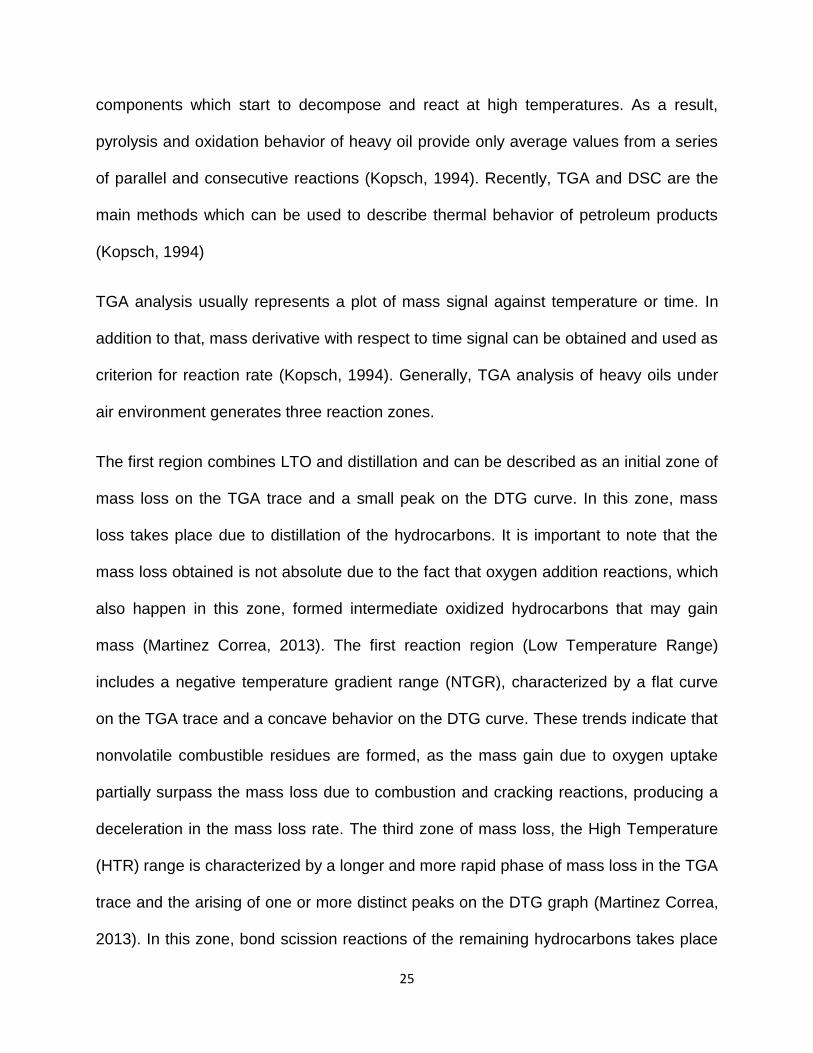
components which start to decompose and react at high temperatures. As a result,
pyrolysis and oxidation behavior of heavy oil provide only average values from a series
of parallel and consecutive reactions (Kopsch, 1994). Recently, TGA and DSC are the
main methods which can be used to describe thermal behavior of petroleum products
(Kopsch, 1994)
TGA analysis usually represents a plot of mass signal against temperature or time. In
addition to that, mass derivative with respect to time signal can be obtained and used as
criterion for reaction rate (Kopsch, 1994). Generally, TGA analysis of heavy oils under
air environment generates three reaction zones.
The first region combines LTO and distillation and can be described as an initial zone of
mass loss on the TGA trace and a small peak on the DTG curve. In this zone, mass
loss takes place due to distillation of the hydrocarbons. It is important to note that the
mass loss obtained is not absolute due to the fact that oxygen addition reactions, which
also happen in this zone, formed intermediate oxidized hydrocarbons that may gain
mass (Martinez Correa, 2013). The first reaction region (Low Temperature Range)
includes a negative temperature gradient range (NTGR), characterized by a flat curve
on the TGA trace and a concave behavior on the DTG curve. These trends indicate that
nonvolatile combustible residues are formed, as the mass gain due to oxygen uptake
partially surpass the mass loss due to combustion and cracking reactions, producing a
deceleration in the mass loss rate. The third zone of mass loss, the High Temperature
(HTR) range is characterized by a longer and more rapid phase of mass loss in the TGA
trace and the arising of one or more distinct peaks on the DTG graph (Martinez Correa,
2013). In this zone, bond scission reactions of the remaining hydrocarbons takes place
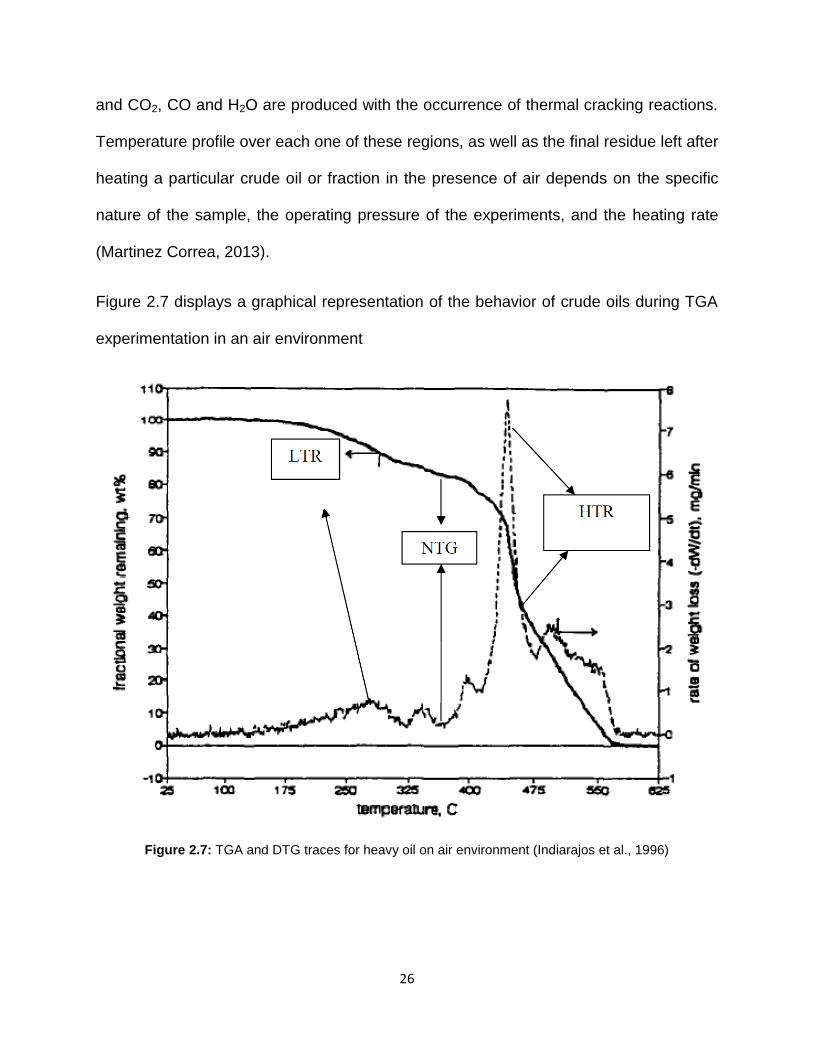
26
and CO2, CO and H2O are produced with the occurrence of thermal cracking reactions.
Temperature profile over each one of these regions, as well as the final residue left after
heating a particular crude oil or fraction in the presence of air depends on the specific
nature of the sample, the operating pressure of the experiments, and the heating rate
(Martinez Correa, 2013).
Figure 2.7 displays a graphical representation of the behavior of crude oils during TGA
experimentation in an air environment
Figure 2.7: TGA and DTG traces for heavy oil on air environment (Indiarajos et al., 1996)

27
Chapter Three: Adsorption of asphaltenes from heavy oil onto in-situ
prepared NiO nanoparticles
3.1 Objective
This investigation evaluates asphaltenes adsorption from heavy oil composed of
Arabian vacuum gas oil and Arabian vacuum residue onto in-situ prepared NiO
nanoparticles and compares it to commercially available NiO nanoparticles. The effect
of asphaltenes removal on the heavy oil was assessed by measuring the viscosity and
API gravity of the resultant oil. A detailed study on the oxidation of asphaltenes
adsorbed onto the in-situ prepared nanoparticles is presented in the second chapter.
3.2 Materials and methods
3.2.1 Materials
Heavy oil prepared by mixing of Arabian light vacuum residue, ALVR, and Arabian light
vacuum gas oil, ALVGO, was used as the continuous phase, unless otherwise stated.
Nickel (II) nitrate hexahydrate (99.9985%, Puratronic, Alfa Aesar, USA) was used as the
precursor salt. Commercially available nanoparticles of nickel oxide (NiO) (dp< 50 nm,
99.8%, Sigma-Aldrich, USA) were used for comparison. Dichloromethane (DCM)
(anhydrous, ≥ 99.8%, Sigma Aldrich, USA) was used to wash the nanoparticles
following their recovery from the oil phase, and methanol (99.8%, Sigma-Aldrich, USA)
was used to disperse the recovered particles for the transmission electron microscopy
imaging. Toluene (99.8%, VWR, Canada) was used to prepare the model solution of
C7 in toluene. All chemicals were used as received without further purification.

28
3.2.2 Methods
3.2.2.1 Preparation of the oil matrix and the heavy oil model solution
A specified amount of ALVR was heated to 70oC to reduce its viscosity and used to
prepare a mixture of 20 wt% ALVR and 80 wt% ALVGO. The matrix was then left
shaking for 1 hour at 200 rpm and 25oC. Model solution of 7000 ppm C7-asphaltenes
(Athabsca asphaltenes extracted from Athabasca vacuum residue by heptane) was
prepared by dissolving certain amount of C7-asphaltenes in toluene. The C7-
asphaltenes were extracted following a procedure detailed elsewhere (Nassar et al.,
2011b).
3.2.2.2 In-situ preparation of ultradispersed NiO nanoparticles
The in-situ preparation of NiO nanoparticles followed a procedure developed by
Abdrabo and Husein (2012). Briefly, 2.5 ml of 4 M aqueous nickel (II) nitrate
hexahydrate solution was added to 50 ml of the oil matrix, and the sample was
vigorously mixed using a vortex mixer for 5 min. Following mixing no phase separation
occurred and the oil matrix visually appeared as a single phase. The sample was then
introduced to a Parr reactor unit (PARR Instrument Company, USA) where it was heat
treated in the tightly sealed reactor unit at 300oC for 12 h. A control sample of the same
composition, missing only the precursor salt, was subjected to the same heat treatment
in order to account for any asphaltenes precipitation due to the heat treatment
(Alboudwarej, et al., 2005, Arteaga-Larios, et al., 2004).
3.2.2.3 Nanoparticles Recovery and Characterization
The particles were recovered by centrifuging the oil matrix at 5,000 rpm for 20 min,
decanting the upper phase and collecting and washing the lower phase several times

29
with toluene until a clear toluene phase was obtained. It should be noted here that
centrifuging the control sample did not result in any precipitation. Moreover, for the
experiments involving determining the chemisorbed asphaltenes and surface area
estimation, the precipitate was further washed with DCM.
The particles were dried after washing and introduced to an Ultima III Multipurpose
Diffraction System (Rigaku Corporation, The Woodland, TX, USA) for XRD analysis.
The instrument employs a Cu-Kαradiationwhichoperatesat40kVand44mAwithaθ-
2θ goniometer. The structure of the particles was identified by comparing the patterns
with database provided by JADE program, ©Materials Data XRD Pattern Processing
Identification & Quantification.
The particle size distribution was determined using transmission electron microscopy,
TEM. A small amount of the powder used for XRD analysis was dispersed in 5 ml of
methanol using sonication. One drop of the methanol dispersion was deposited on a
copper grid covered with carbon film, and was left to evaporate for 24 h. In order to
avoid possible aggregation upon methanol evaporation, only a thin layer was deposited
on the copper grid. The grid was then introduced to a Tecnai TF20 G2 FEG-TEM (FEI,
USA) with a FEI low background double tilt holder (Type PW6595/15). Bright field
images were digitized on a 1024x1024 pixel Gatan GIF 794 CCD (Gatan, Pleasanton,
California, USA) or a Gatan UltraScan 4000 CCD at 2048x2048 pixels. Energy
dispersive X-ray spectroscopy, EDX, was collected with an EDAX CM-20T detector.
Several photographs of the nanoparticles were taken from different locations on the
copper grid and particle size distribution histograms were constructed using ES Vision
software.

30
The surface area of the in-situ prepared NiO nanoparticles was estimated using N2
adsorption and desorption at 77 K. The NiO sample, after washing with DCM, was first
treated and degassed at 150oC and 250oC under N2 flow overnight. The sample was
then introduced to a Micrometrics Tristar 2000 surface area analyzer (Micrometrics
Instrument Corporation, USA) where the surface area was calculated using the
Brunauer-Emmett-Teller (BET) equation. The external surface area was obtained from
the t-plot provided by the instrument. In order to account for probable aggregation
resulting from particle heating, which is part of the degassing step of the BET surface
area analysis, scanning electron microscope (SEM) (Philips XL30 ESEM, USA) was
used to provide photographs of powders of in-situ prepared nanoparticles directly after
collection and drying, and powders that were heat treated at 250oC following drying.
3.2.2.4 Characterization of the adsorbed material and the oil after adsorption
Characterization of the adsorbed material was accomplished using Fourier Transform
Infrared Spectroscopy (FTIR), which was recorded on a Nicolet Avatar 380
spectrophotometer (Vendor, country) (Carbognani et al., 2008; Wilt et al., 1998). FTIR
analysis of three different samples was conducted as follows. Sample one included in-
situ prepared NiO after recovery from the heavy oil matrix and washing with toluene.
Samples two and three included commercial NiO particles recovered from heavy oil
matrix and heavy oil model solution, respectively.
Oil characterization, before and after asphaltenes adsorption, was conducted using
density and viscosity measurement. Three sets of samples were tested. The first set
included control samples of the heavy oil matrix and the heavy oil matrix following heat
treatment at the same preparation conditions. The second set included heavy oil

31
matrixes where in-situ NiO nanoparticles were prepared, however, in one of the
samples the particles were removed by centrifugation. The third set included heavy oil
matrixes where commercial NiO was added, however, in one of the samples the
particles were removed by centrifugation. Viscosity measurements were determined
using a cone-plate Brookfield viscometer model RV DV-II+PROCP (Brookfield
Engineering Laboratories, USA). Setup temperatures were maintained with a
recirculating glycol bath (Brookfield model TC-102). The analysis involved placing a
small quantity of the oil in the cone while ensuring it wets all the cone surface. The
analyses were conducted at 25oC and 60 rpm. The density measurement was
conducted following the procedures detailed by Carbognani et al. (2011).
3.2.2.5. Adsorption kinetics
The kinetics of asphaltenes adsorption onto in-situ prepared NiO nanoparticles as well
as commercially available NiO was studied using batch-adsorption experiments. A 30
mL volume of the oil matrix was mixed with 0.45 g of the nanoparticles at 200 rpm and
25oC. For the in-situ particles, time zero corresponded to the instant when the sample
was cooled down to 25oC. In order to account for the effect of heat treatment between
the in-situ prepared and the commercial particles, a sample containing commercial NiO
particles was mixed with the heavy oil matrix and heat treated at 300oC for the same
time duration as the in-situ prepared particles. This sample also contained the same
amount of water introduced during the in-situ preparation of the NiO particles. The
nanoparticles, together with the adsorbed asphaltenes, were separated at specified
times by centrifuging the sample at 5,000 rpm for few min, and the particles were left to
dry in an oven at 90oC for 24 h. The dried nanoparticles containing the adsorbed

32
asphaltenes were, then, analyzed using the TGA as described below. In order to
determine the chemisorbed asphaltenes, some samples were washed several times
with DCM, until no color change occurred (Carbognani et al., 2008). Physisorbed
asphaltenes could, then, be calculated by subtracting the mass of the chemisorbed
asphaltenes from the total mass of adsorbed asphaltenes determined without the DCM
washing step.
3.2.2.6 Thermogravimetric analysis
To determine the amount of adsorbed asphaltenes, thermogravimetric analysis (TGA)
was carried out on Q600 SDT (TA Instruments, Inc., USA). Thermogravimetric analysis
involved heating a few mg of the sample, in order to minimize mass transfer limitations,
in the presence of air from 25oC to 800oC at a constant temperature ramp of 10oC/min,
while maintaining a constant flow rate of air of 100 cm3/min. The amount of adsorbed
asphaltenes was calculated from the mass loss provided by the TGA. A control sample
containing commercial NiO nanoparticles and in-house prepared NiO nanoparticle were
analyzed in order to determine mass loss associated with the nanoparticles. The in-
house NiO nanoparticles were prepared in aqueous medium starting from the same
precursors as the in-situ prepared particles and were subjected to the same heat
treatment. Mass loss due to nanoparticles was accounted for in the calculation of the
adsorbed asphaltenes.
3.3 Results and Discussion
3.3.1 Characterization of the in-situ prepared NiO nanoparticles
Figure 3.1a depicts the XRD pattern of the NiO nanoparticles prepared in the oil matrix
and collected and washed with DCM as outlined in the experimental section. As per

33
JADE program, all the major XRD peaks belong to NiO, whereas the other peaks are
minor and can be attributed to adsorbed heavy fractions (Abdrabo and Husein, 2012).
The mean particle diameter estimated by Scherrer’sequationfrom the XRD peak at 2θ=
43.64 is 10 nm (Drits et al., 1997). A representative TEM photograph and the
corresponding particle size distribution histogram are depicted in Figure 3.1b,c. The
mean particle diameter, based on number average, calculated from the input data to the
histogram is 12±9 nm, which is not very different from the XRD estimate. The wide size
distribution is attributed to aggregates in the range of 70 nm. Upon a close zoom in on
the TEM photograph, these aggregates in fact composed of much smaller particles, and
are believed to form as a consequence of interdigitation (Manna et al., 2001) of
asphaltenes-capped particles during drying. Also, the heat treatment step required for
the nanoparticle preparation leads to aggregation. The EDX elemental analysis shown
in Figure 3.1d indicates that, aside from copper and carbon which are components of
the TEM grid, the major elements of the nanoparticles are nickel and oxygen, which is in
line with the XRD result.

34
Figure 3.1: (a) X-ray diffraction pattern; (b) TEM image; (c) particle size distribution histogram; (d) EDX
analysis of the in-situ prepared NiO nanoparticles.
(a)
(b)

35
Figure 3.1: (a) X-ray diffraction pattern; (b) TEM image; (c) particle size distribution histogram; (d) EDX analysis of the in-situ prepared NiO nanoparticles.
0
100
200
300
400
500
600
700
800
0-10 10.0-20 20-30 30-40 40-50 >50
Fre
qu
en
cy
Diameter (nm)
(c)
(d)

36
The surface area evaluated by the BET method, and the external surface area
evaluated by the t-plot method, following degassing the sample at 150oC and 250oC,
are shown in Table 3.1. As seen in the table there is no major difference between the
BET and the external surface area, which suggests that the in-situ prepared NiO
particles are mainly non-porous (Nassar et al., 2011b). The dependence of surface area
on the degassing temperature suggests the existence of adsorbed species, even after
DCM washing. Therefore, the BET and external surface area estimates were
considered not representative. SEM images of Figure 3.2 for non-heat treated and heat
treated in-situ prepared NiO show that aggregated particles were obtained in both
cases. The extent of aggregation was, however, higher for the heat treated particles. It
should be noted, nevertheless, that SEM samples were not subjected to any dispersion
before photographs could be taken. Hence, SEM images were, also, considered not
representative of the in-situ prepared particles. Finally, the geometrical surface area
was calculated using the mean particle diameter estimated by the XRD and the TEM
analyses and was found to be 88 m2/g and 75 m2/g, respectively. The geometrical
surface area calculated from the TEM estimate was considered the most reliable
(Vossmeyer et al., 1994), besides the fact that particle preparation for TEM imaging
involves effective dispersion in methanol, and was used to calculate the number of
layers of adsorbed asphaltenes. It is worth noting that the commercial NiO nanoparticles
had a mean particle diameter of 12 nm and displayed values of specific surface area
and external surface area (Nassar et al., 2011c) in the range of the geometrical surface
area reported above for the in-situ prepared particles.

37
Table 3.1: Surface area of the in-situ prepared NiO nanoparticles estimated using Tristar 2000 surface
area analyzer.
Temperature
(oC)
Specific surface area (BET)
(m2/g)
External surface area (t-
Plot)
(m2/g)
150 7.74 8.2
250 19.5 16.6
3.3.2 Adsorption kinetics
Table 3.2 shows the mass of adsorbed species per g of the in-situ prepared as well as
commercial NiO nanoparticles. The commercial particles were used in order to provide
a benchmark. The values of g adsorbed per g adsorbent were calculated using the
thermogravimetric, TG, results for nanoparticles recovered from the heavy oil matrix
following mixing at 25oC and 200 rpm. The percent mass loss associated with the
nanoparticles was accounted for using control samples containing only the
nanoparticles. Figure 3.3 is a representative plot of the percent mass loss versus
temperature in the TGA experiments.

38
Figure 3.2: SEM images of powders of in-situ prepared NiO collected from heavy oil a) without heat
treatment and b) with heat treatment at 250oC.
Figure 3.3: TG % mass as a function of temperature for a) in-house prepared NiO (control); b) commercial NiO (control); c) in-situ prepared NiO recovered from heavy oil; d) commercial NiO recovered
from heavy oil; e) virgin asphaltenes. Heating rate= 10oC/min; air flow= 100cm
3/min.
0
20
40
60
80
100
0 200 400 600 800
Mas
s %
Temperature (◦C)
a
b
c
d
e
(a) (b)

39
Table 3.2: Asphaltenes uptake onto in-situ prepared and commercial NiO as a function of time. Samples
kept at 200 rpm, 25oC, mass concentration of nanoparticle= 15 (g/L)
Time (h) DCM Washing Uptake (g/g),
In-situ prepared NiO
Uptake (g/g),
Commercial NiO
2 No 2.69±0.10 0.42±0.06
8 No 2.85 0.43
24
No 2.78±0.36 0.41±0.04
Yes 0.42±0.07 0.19±0.01
Table 3.2 shows that equilibrium was established within the first 2 h. This rapid
adsorption kinetics, in comparison with typical porous adsorbents (Alboudwarej et al.,
2004; Acevedo et al., 2000; Acevedo et al., 1995), may be attributed to the absence of
pore diffusion, as suggested by the surface area measurements, coupled with low
external mass transfer limitations in the presence of ultradispersed sorbents (Husein et
al., 2010). Rapid kinetics was also reported for the adsorption of asphaltenes from
toluene model solutions onto dispersed commercial nanoparticles (Nassar et al.,
2011a,b,c; Nassar, 2010). It is worth noting, nevertheless, that at the condition of the
current experiment, T= 25oC, the viscosity of the heavy oil matrix is at least 65 times
higher than the viscosity of the toluene model solution.
The asphaltenes uptake reported in Table 3.2, ca. 2.8 g asphaltenes/g nanoparticles,
far exceeds values reported in the literature for classical adsorbents (Rudrake et al.,
2009; Alboudwarej et al., 2004; Acevedo et al., 2000; Acevedo et al., 1995) as well as
ultradispersed nanoparticle adsorbents from toluene model solution (Nassar et al.,
2011a-c; Nassar, 2010). It should be noted, nevertheless, that asphaltenes

40
concentration in the oil matrix used in the current study is roughly 40 g/L (Liu et al.,
1999); almost 10 times the maximum concentration used in model solutions. This high
concentration may promote adsorption of aggregated asphaltenes. Nevertheless,
control samples containing no nanoparticles showed no sign of separation of such
aggregates. Washing with DCM in order to remove loosely adsorbed species, which
might be asphaltenes together with the attached resins (Nikookar et al.,
2008; Evdokimov et al., 2003), decreased the update to 0.42 g asphaltenes/g NiO
nanoparticles, which is still much higher than uptake reported in the literature (Nassar et
al., 2011a,b,c; Nassar, 2010; Rudrake et al., 2009; Alboudwarej et al., 2004; Acevedo et
al., 2000; Acevedo et al., 1995). It is believed that DCM washing removes the outer
layers of adsorbed species as explained below.
Another important observation to take from Table 3.2, is that the in-situ prepared
particles exhibited much higher adsorption capacity when compared with the
commercial NiO nanoparticles. In order to account for any role heating while preparing
the in-situ particles might have on the uptake of asphaltenes, commercial NiO
nanoparticles were mixed and heat treated with the heavy oil matrix at the same
temperature for the same time duration. The uptake after 24 h of equilibration time at
25oC was 0.38 g/g, which is very close to the uptake value reported in Table 3.2 for
commercial NiO nanoparticles without heat treatment. It is, therefore, concluded that
heavy oil matrixes interact better and are better able to control the size and stability of
particles nucleated and grew within their structure. This conclusion is in line with
observations made for (w/o) microemulsion systems (Husein and Nassar, 2008; Petit et
al., 1993; Pileni, 1993; Pileni et al., 1992), since these systems well represent heavy oil

41
matrixes (Nassar and Husein, 2010). In contrast, commercial nanoparticles tend to
aggregate, which in addition to reducing their total surface area, may lead to
precipitation and the rise of internal and external mass transfer limitations.
Using asphaltenes uptake from Table 3.2, and assuming perfectly spherical
nanoparticles of diameter= 12 nm, perfectly spherical asphaltene molecules of average
molecular weight of 2280 g/mole (Rahimi et al., 2006) and diameter= 1.2 nm (Bouhadda
et al., 2007; Shirokoff et al., 1997) and even distribution of adsorbed asphaltenes, the
surface coverage of the in-situ prepared and the commercial NiO was calculated to be 9
and 2, respectively. Multilayer adsorption has been reported for asphaltenes adsorption
onto minerals (Acevedo, et al., 2000; Acevedo, et al., 1995), and was attributed to
adsorption of aggregates of asphaltenes (Langevin et al., 2004). The effect of the
multilayer adsorption on asphaltenes oxidation will be considered in details in the
oxidation study.
3.3.3 Characterization of the adsorbed species and the adsorbed species-free oil
Figure 3.4 depicts the FTIR spectroscopy of adsorbed species from heavy oil onto in-
situ prepared and commercial NiO nanoparticles. Moreover, FTIR spectroscopy of
adsorbed asphaltenes from toluene model solution onto commercial NiO nanoparticles
is provided for comparison. FTIR results help identifying functional groups adsorbed
onto the surface (Carbognani et al., 2008; Wilt et al., 1998), and subsequently the
nature of the adsorbed species. Figure 3.4 shows that the major peaks are identical,
regardless of the medium and the origin of the adsorbent, which, in turn, suggests that
asphaltenes are the major constituents of the adsorbed species.

42
The peaks in Figure 3.3 can be assigned as follows. Around 1032 cm-1 the small peak
belongs to ethers or esters linkage present in the asphaltenes molecules (Wilt et al.,
1998). The peak around 1459 cm-1 corresponds to CH2 bending modes with some
contribution from CH3 bending modes, while the sharp peak around 1377 cm-1 can be
attributed to methyl bending vibrations (Sarmah et al., 2010; Wilt et al., 1998). For the
in-situ NiO particles, the broad peak at 1602 cm-1 can be assigned to the aromatic C=C
stretching vibrations (Calemma et al., 1995; Sarmah et al., 2010), whereas for the
commercial NiO in the heavy oil, the large broad band at 3454 cm-1 corresponds to the
presence of water (Wilt et al., 1998). This broad peak did not appear in the in-situ
prepared NiO particles, since water is believed to evaporate as a result of the high
temperature treatment.

43
Figure 3.4: FTIR spectrum for adsorbed species onto a) in-situ prepared NiO in heavy oil; b) commercial
NiO in heavy oil; and c) commercial NiO in toluene model solution.

44
Figure 3.4: FTIR spectrum for adsorbed species onto a) in-situ prepared NiO in heavy oil; b) commercial
NiO in heavy oil; and c) commercial NiO in toluene model solution.

45
The viscosity of the heavy oil samples involved in this study was determined in the
presence and absence of dispersed NiO nanoparticles. Meanwhile, the API gravity was
only measured for samples in the absence of the NiO nanoparticles. The results are
shown in Table 3.3. In general, samples containing the nanoparticle, in-situ prepared or
commercial, displayed higher viscosity than the original heavy oil matrix. This may be
attributed to the role dispersed particle play in cross linking adsorbed long chain
hydrocarbon. Luo and Gu (2007) reported higher viscosity in the presence of
aggregated asphaltenes, which in this study is promoted by the presence of dispersed
nanoparticles. The removal of the nanoparticles together with the adsorbed species, on
the other hand, did not seem to reduce the viscosity and API gravity of the original
heavy oil. This may be attributed to the fact that centrifugation is never able to remove
all the nanoparticles from the matrix and there will always be dispersed nanoparticles in
the oil matrix. Recently, Mohammadi et al. (2011) used TiO2 nanoparticles to enhance
the stability of asphaltenes nanoaggregates through formation of hydrogen bonds at
acidic conditions.
The fact that heavy oil samples where in-situ particles were prepared displays much
higher viscosity in the presence of the particles than in the absence of these particles
suggests that the particles were very well dispersed in the heavy oil matrix. The same
thing, however, cannot be said about the commercial NiO particles suggesting that the
commercial NiO nanoparticles were not well dispersed. This conclusion further supports
the discussion pertaining to the higher uptake by the in-situ prepared particles.
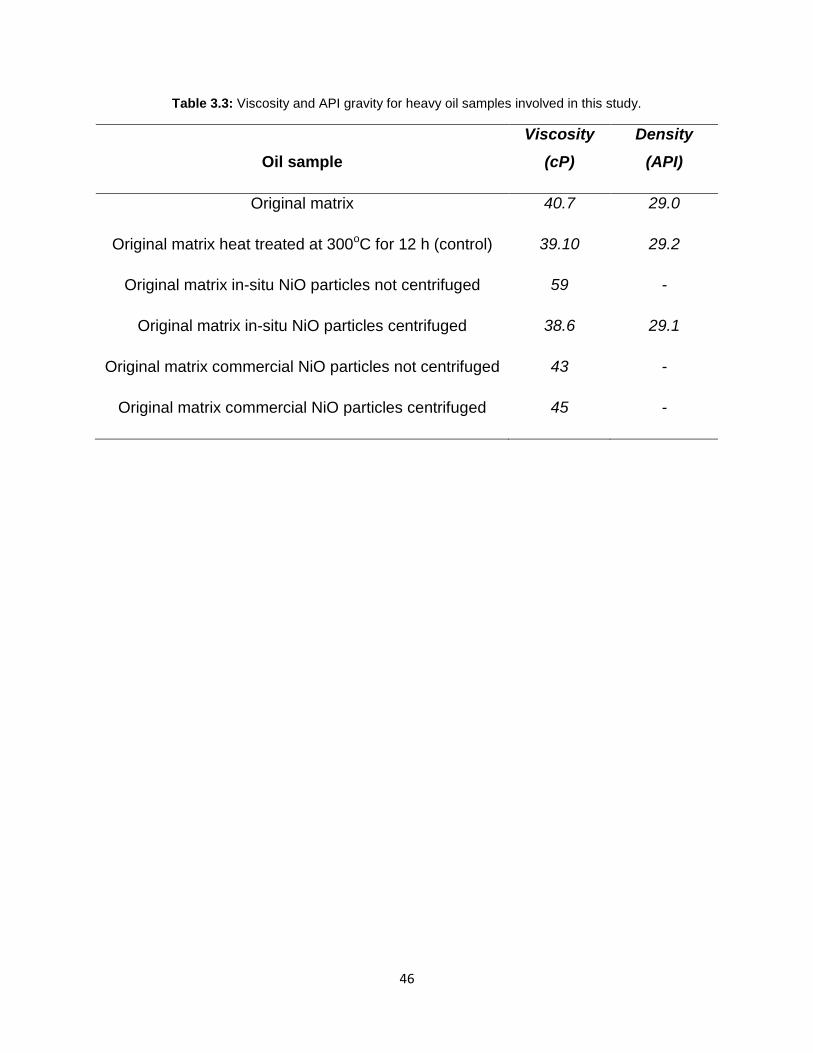
46
Table 3.3: Viscosity and API gravity for heavy oil samples involved in this study.
Oil sample
Viscosity
(cP)
Density
(API)
Original matrix 40.7 29.0
Original matrix heat treated at 300oC for 12 h (control) 39.10 29.2
Original matrix in-situ NiO particles not centrifuged 59 -
Original matrix in-situ NiO particles centrifuged 38.6 29.1
Original matrix commercial NiO particles not centrifuged 43 -
Original matrix commercial NiO particles centrifuged 45 -
47
Chapter Four: : Oxidation of adsorbed asphaltenes onto NiO
nanoparticles
4.1 Objectives
Recently, Nassar et al. compared the thermal behavior of virgin and adsorbed
asphaltenes from toluene model solution onto commercial metal oxide nanoparticles
(Nassar et al., 2011a-c). Using DTG and heat flow results they observed a major shift in
the peaks and reaction zones between virgin and adsorbed asphaltenes under inert and
oxidizing atmospheres (Nassar et al, 2012a; Nassar et al, 2011a-c). For example, under
inert atmosphere, virgin asphaltenes undergo loss of alkyl appendages below 350oC,
opening of polyaromatic rings between 350 oC and 500oC and cracking above 500oC,
whereas under oxidizing atmosphere no significant reactions occur below 400oC, LTO
and bond scission reactions occur between 400 oC and 450oC and combustion occurs
above 450oC. For adsorbed asphaltenes, on the other hand, only one DTG and a
corresponding heat flow peaks appeared between 200 oC and 400oC under inert and
oxidizing atmospheres. The authors interpreted this shift as a major degree of catalytic
activity, especially when NiO nanoparticles were used. However, a careful look at the
area under the DTG curve for adsorbed asphaltenes onto NiO nanoparticles, as
reported by Nassar et al. (2011a-c), reveals a total mass loss of ca. 14 wt%. Such a
loss exceeds the maximum adsorption capacity of 62 mg asphaltenes/g NiO particle
reported by Nassar et al. (Nassar et al., 2011b, c). This observation, together with our
recent studies on in-situ formation of NiO nanoparticles in heavy oil system (Abu
Tarboush and Husein, 2012a; Abdrabo and Husein, 2012), which enabled multilayer
adsorption, revealed a different interpretation of the previous results (Nassar et al.,
2011a-c) and instigated the following investigation.

48
4.2. Materials and Methods
4.2.1 Materials
A mixture of Arabian light vacuum residue, ALVR, and Arabian light vacuum gas oil,
ALVGO, was used as the continuous phase, unless otherwise stated. Nickel (II) nitrate
hexahydrate (99.9985%, Puratronic, Alfa Aesar, USA) was used as the precursor salt
for NiO. Toluene (99.8%, VWR, Canada) was used to prepare heavy oil model
solutions. Commercially available nanoparticles of nickel Oxide (NiO) (dp< 50 nm,
99.8%, Sigma-Aldrich, USA), cobalt oxide (Co3O4) (dp< 50 nm, 99.8%, Sigma-Aldrich,
USA), and iron (III) oxide (Fe3O4) (dp=20-30 nm, 98%, Nanostructured and Amorphous
MaterialsInc.,USA)wereusedforcomparison.Dichloromethane(DCM)(anhydrous,≥
99.8%, Sigma Aldrich, USA) was used to wash the nanoparticles following their
recovery from the oil phase. All chemicals were used as received without further
purification.
4.2.2 Methods
4.2.2.1 Preparation of the oil matrix and the toluene model solution
The oil phase was prepared as follows. A specified amount of ALVR was heated to
70oC to reduce its viscosity and used to prepare a mixture of 20 wt% ALVR and 80 wt%
ALVGO. The matrix was then left shaking for 1 h at 200 rpm and 25oC.
Heavy oil model solutions were prepared by dissolving certain amount of C7
asphaltenes in toluene to give 1000 and 7000 ppm solutions. Athabasca C7
asphaltenes were originally extracted from Athabasca vacuum residue by heptane
following a standard procedure detailed elsewhere (Nassar et al, 2011b,c).

49
4.2.2.2 In-situ preparation of ultradispersed NiO nanoparticles
The in-situ preparation of NiO nanoparticles followed a procedure developed by our
group (Abu Tarboush and Husein, 2012a; Abdrabo and Husein, 2012). In brief, ca.
15,000 ppm of dispersed NiO nanoparticles in heavy oil was prepared by adding 2.5 ml
of 4 M aqueous nickel (II) nitrate hexahydrate solution to 50 ml of the oil matrix followed
by vigorous mixing in a vortex mixer for 5 min until the heavy oil matrix displayed
visually stable single phase system. The sample was then introduced to a tightly sealed
Parr reactor unit (PARR Instrument Company, USA) where it was heat treated to 300oC
for 12 h. A control sample of the same composition, missing only the precursor salt, was
subjected to the same heat treatment in order to account for any asphaltenes
precipitation due to the heat treatment (Tanaka et al., 2003; Takanohashi et al., 2003).
4.2.2.3 Asphaltenes oxidation
Asphaltenes oxidation was conducted using a Q600 SDT TGA unit (TA Instruments,
Inc., USA). Asphaltenes oxidation involved heating few mg of the sample, in order to
minimize mass transfer limitations (Nassar et al., 2011a-c), from 25oC to 800oC at a
constant temperature ramp of 10oC/min, while maintaining a constant flow rate of air of
100 cm3/min. The amount of adsorbed asphaltenes was calculated from the total mass
loss provided by the TGA. Control samples containing commercial nanoparticles were
analyzed in order to determine mass loss associated with the nanoparticles. Mass loss
due to nanoparticles was accounted for in the calculation of the adsorbed asphaltenes.
The type of reactions involved, on the other hand, was inferred from the differential
thermal analysis (DTG) in combination with the heat flow data. Three replicates were
prepared for some samples and a standard error of less than 1% was calculated.
50
4.3 Results and Discussion
4.3.1 TG/DTA profile of as-received commercial NiO nanoparticles
Figure 4.1a shows that the mass loss associated with the as-received commercial NiO
particles, purchased from the same vendor as Nassar et al. (2011a-c), is ca. 7 wt%.
This mass loss is comparable to the mass loss reported for adsorbed asphaltenes
(Nassar et al., 2011b,c), and should account for the total of ca. 15 wt% loss obtained
from the DTG curve of Nassar et al. (2011b,c). More importantly, the major DTG peak of
Figure 4.1a in fact overlaps with the ones reported by Nassar et al. (2011a-c) as shifts
in the pyrolysis, gasification and oxidation temperatures of adsorbed asphaltenes.
Equally important is the fact that the inset temperature of oxidation reported by Nassar
et al. (2011a-c) may very well be attributed to the thermal behavior of the as-received
NiO nanoparticles.
Figure 4.1a also shows the DTG profiles for other commercial nanoparticles employed
by the same group; namely Co3O4 and Fe3O4. The mass loss associated with the as-
received Co3O4 and Fe3O4 nanoparticles is lower than that of NiO nanoparticles. The
difference in the DTG profiles of the as-received nanoparticles, which seems to have
been overlooked by Nassar et al. (2011a-c), may explain why NiO was deemed the best
“catalyst”. Figure 4.1b displays broad peaks for heat flow appearing in the region
between 150 and 500oC.

51
Figure 4.1: TG/DTA profiles of a) rate of mass loss, and b) heat flow versus temperature for the as-received commercial NiO, Co3O4 and Fe3O4 nanoparticles. Heating rate= 10
oC/min; air flow= 100cm
3/min.
0
0.04
0.08
0.12
0.16
0.2
0.24
0.28
0.32
0 100 200 300 400 500 600 700 800
Mas
s lo
ss r
ate
(%
/◦C
)
Temperature (◦C)
NiO
Co3O4
Fe3O4
(a)
-5
-4
-3
-2
-1
0
1
2
0 100 200 300 400 500 600 700 800
He
at f
low
(W
/g)
Temperature (◦C)
NiO
Co3O4
Fe3O4
(b)
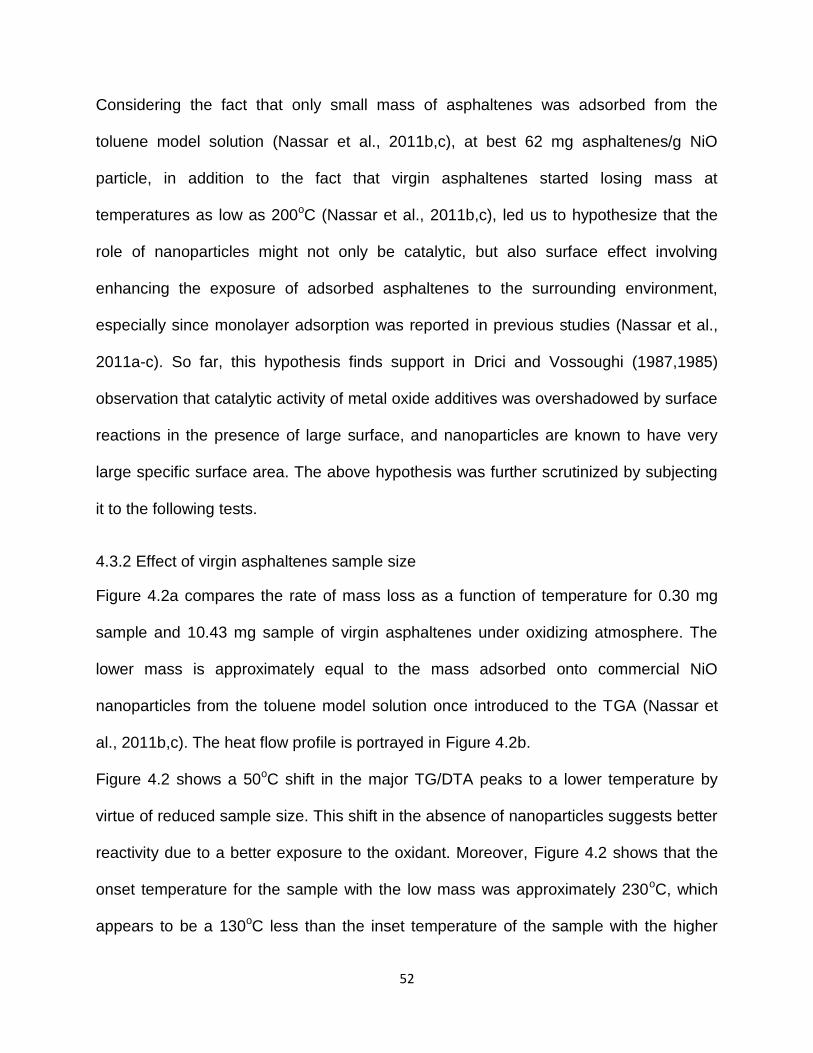
52
Considering the fact that only small mass of asphaltenes was adsorbed from the
toluene model solution (Nassar et al., 2011b,c), at best 62 mg asphaltenes/g NiO
particle, in addition to the fact that virgin asphaltenes started losing mass at
temperatures as low as 200oC (Nassar et al., 2011b,c), led us to hypothesize that the
role of nanoparticles might not only be catalytic, but also surface effect involving
enhancing the exposure of adsorbed asphaltenes to the surrounding environment,
especially since monolayer adsorption was reported in previous studies (Nassar et al.,
2011a-c). So far, this hypothesis finds support in Drici and Vossoughi (1987,1985)
observation that catalytic activity of metal oxide additives was overshadowed by surface
reactions in the presence of large surface, and nanoparticles are known to have very
large specific surface area. The above hypothesis was further scrutinized by subjecting
it to the following tests.
4.3.2 Effect of virgin asphaltenes sample size
Figure 4.2a compares the rate of mass loss as a function of temperature for 0.30 mg
sample and 10.43 mg sample of virgin asphaltenes under oxidizing atmosphere. The
lower mass is approximately equal to the mass adsorbed onto commercial NiO
nanoparticles from the toluene model solution once introduced to the TGA (Nassar et
al., 2011b,c). The heat flow profile is portrayed in Figure 4.2b.
Figure 4.2 shows a 50oC shift in the major TG/DTA peaks to a lower temperature by
virtue of reduced sample size. This shift in the absence of nanoparticles suggests better
reactivity due to a better exposure to the oxidant. Moreover, Figure 4.2 shows that the
onset temperature for the sample with the low mass was approximately 230oC, which
appears to be a 130oC less than the inset temperature of the sample with the higher

53
mass. This clearer manifestation of the inset temperature in the absence of
nanoparticles, again, suggests higher percentage of molecules with enhanced reactivity
as a result of better exposure to the environment. The higher reactivity was also
captured by the heat flow profiles of Figure 4.2b, which showed more heat evolution per
gram of the sample with lower mass of asphaltenes. In general, under oxidizing
atmosphere, the DTG profile of the high mass of asphaltenes can be divided into three
major regions: i) 200oC to 400oC, ii) 400 oC to 500oC and iii) 500 oC to 580oC, while for
the low mass the second and third regions seem to have amalgamated into one region
between 400oC and 550oC. The first region carries insignificant mass loss for the high
mass of asphaltenes (Nassar et al., 2011b,c), while account for 12 wt% loss for the low
mass. Figure 4.2b clearly displays the endothermic reactions between 380oC and 420oC
in the case of low mass, which can be attributed to LTO and bond scission reactions.
Those reactions appear to have taken place between 420oC and 470oC in the case of
high mass (Nassar et al., 2011b,c). Combustion reactions, which took place between
500oC and 580oC for the high mass of asphaltenes (Nassar et al., 2011b,c) seem to
have occurred between 400oC and 500oC for the low mass, probably combined with
some other LTO and bond scission reactions. If one keeps in mind that asphaltenes are
never pure compounds and contain species with different tendencies towards thermal
decomposition and oxidation, one concludes that, in the absence of additives, mass
loss during thermogravimetric analysis depends on the tendency of the species to react
as well as the level of exposure to the surrounding environment. Moschopedis et al.
(1978) attributed mass losses of Athabasca asphaltenes under inert atmosphere at T<

54
350oC to elimination of groups located on the periphery, which, in a way implies a role
for the exposure to the surrounding environment.

55
Figure 4.2: TG/DTA plot of a) rate of mass loss, and b) heat flow versus temperature for samples with low and high masses of virgin asphaltenes. Heating rate= 10
oC/min; air flow= 100 cm
3/min.
0
0.2
0.4
0.6
0.8
1
1.2
1.4
0 200 400 600 800
Mas
s lo
ss r
ate
(%
/◦C
)
Temperature (◦C)
10.34 mg C7 asphaltenes
0.304 mg C7 asphaltenes
(a)
-15
-10
-5
0
5
10
15
20
25
30
35
0 200 400 600 800
He
at f
low
(W
/g)
Temperature (◦C)
10.34 mg C7 asphaltenes
0.304 mg C7 asphaltenes
(b)

56
To summarize, this experiment showed that shifts in reaction peaks and intervals is not
only limited to a catalytic effect but also occurs as a result of better exposure to the
surrounding environment.
4.3.3 TG/DTA profile for adsorbed asphaltenes onto NiO nanoparticles
Figure 4.3a portrays the DTG profiles under oxidizing atmosphere of commercial and in-
situ prepared NiO nanoparticles following their extraction from heavy oil. For the
commercial nanoparticles, two major regions can be identified, one between 150oC and
300oC and another between 300oC and 500oC. The mass loss associated with the
nanoparticles shown in Figure 4.1a spans the two regions. Table 4.1 shows two layers
of adsorbed asphaltenes per a particle of commercial NiO, as per theoretical
calculations (Abu Tarboush and Husein, 2012a). The regions identified above may
belong to sequential mass loss of these layers. It appears that the outer layer reacts at
a lower temperature as a consequence of better exposure to the surrounding
atmosphere. For the in-situ prepared NiO particles, on the other hand, the DTG profile
consists of many peaks, which in turn, reflect the multilayer adsorption reported in Table
4.1 (Abu Tarboush and Husein, 2012a). The fact that the heat flow profile of Figure 4.3b
shows exothermic trend only suggests that probably every layer is mainly undergoing
oxidation reaction. It is worth noting that the percent mass loss in the range between
150-300oC is much higher for the in-situ prepared NiO, even though the total amount of
adsorbed species is higher for the in-situ prepared particles as shown in Table 4.1. This
translates into higher rate of oxidation in the presence of in-situ prepared particles.

57
Figure 4.3: TG/DTA plot of a) rate of mass loss, and b) heat flow versus temperature for asphaltenes adsorbed onto in-situ prepared and commercial NiO nanoparticles from heavy oil and/or toluene model
solution. Heating rate= 10 oC/min; air flow= 100 cm
3/min.
0
0.1
0.2
0.3
0.4
0.5
0.6
0.7
0.8
0 100 200 300 400 500 600 700 800
Mas
s lo
ss r
ate
(%
/◦C
)
Temperature (◦C)
In-situ NiO
In-situ NiO-DCM wash
Commercial NiO
Commercial NiO-DCM wash
Commercial NiO-model
Commercial NiO-model-DCM wash
(a)
-15
-10
-5
0
5
10
15
20
25
0 100 200 300 400 500 600 700 800
He
at f
low
(W
/g)
Temperature (◦C)
In-situ NiO
In-situ NiO-DCM wash
Commercial NiO
Commercial NiO-DCM wash
Commercial NiO-model
Commercial NiO-model-DCM wash
(b)

58
Table 4.1: Asphaltenes uptake by in-situ prepared and commercial NiO from heavy oil and/or toluene
model solution with and without DCM washing (Abu Tarboush and Husein, 2012).
Sample
No DCM Washing
DCM Washing
Uptake
(g/g)
Number of
adsorbed
layers/particle
Uptake
(g/g)
Number of
adsorbed
layers/particle
In-situ prepared NiO
(heavy oil)
2.78 9.00 0.474 2.00
Commercial NiO (heavy oil) 0.41 1.5 0.081 0.30
Commercial NiO (toluene) 0.082 0.30 0.072 0.30
Following the above explanation, it appears that the in-situ prepared NiO nanoparticles
have better capability of exposing adsorbed asphaltenes to the surrounding
atmosphere, especially the outer most layers. Abu Tarboush and Husein (2012a)
concluded that in-situ prepared NiO interact better with the mother heavy oil matrix. The
inner most layers, on the other hand, suffered from lack of exposure and, hence, started
reacting at higher temperatures. This may explain why the reactions were completed at
500oC for the commercial particles, while extended to 550oC for the in-situ prepared
ones.
The above explanation of the results, which is based on sequential oxidation of
adsorbed layers (Li et al., 2010), does not necessarily exclude reaction tendency of the
different adsorbed species. Nassar et al. (Nassar et al., 2012b) detailed the effect of the
nature of the chemical species on its adsorption affinity. It is, therefore, believed that the
different layers arrange as per their chemical nature, which, in turn, dictates their

59
tendency toward reactions. The above explanation of the results, on the other hand,
excludes catalytic oxidation, since it entails that the inner layers of adsorbed
asphaltenes, and more pertinent the chemically adsorbed species, tend to react at
higher temperatures. The above explanation further supports the role of NiO particles of
enhancing reactivity via exposing asphaltenes to the surrounding environment, since it
entails that the outer layers, far from the surface active sites, tend to react at lower
temperatures. One may argue, nevertheless, that both commercial and in-situ prepared
particles have lost their catalytic reactivity in a heavy oil medium as a result of multilayer
adsorption. If this would to be true, and assuming NiO nanoparticles play no role other
than a catalyst, profiles similar to those shown in Figure 4.2 for the samples with high
mass of asphaltenes with minimal mass loss below 350oC should appear. Table 4.1
confirms that the mass of adsorbed species onto in-situ prepared NiO nanoparticles is
appreciable. In order to further scrutinize the explanation involving sequential oxidation
of adsorbed layers, TG/DTA profiles of species adsorbed onto commercial and in-situ
prepared NiO nanoparticles from heavy oil media were collected following DCM
washing. Furthermore, TG/DTA profiles for asphaltenes adsorbed onto commercial NiO
nanoparticles from toluene model solution were also collected before and after DCM
washing in order to provide comparison with the literature (Nassar et al., 2011a-c).
4.3.4 Effect of DCM washing
Figure 4.3 depicts the rate of mass loss and heat flow for in-situ prepared NiO particles
together with the adsorbed asphaltenes following DCM washing. Two main regions
appear: i) 300oC -430oC and ii) 430oC -500oC. Mass loss for T> 600oC can be attributed
to carbonaceous residue (Ciajolo and Barbella, 1984). Comparison with the unwashed

60
sample suggests that washing seems to have eliminated the outer layers of adsorbed
species which would have, otherwise, undergone reaction at T< 300oC. Table 4.1
shows that approximately 2 layers of asphaltenes were adsorbed onto the in-situ
prepared NiO following DCM washing. It seem likely that DCM washing has freed the
loosely, physically, adsorbed species and left behind the asphaltenic species which
have higher affinity towards the surface (Abu Tarboush and Husein, 2012a) and tend to
undergo oxidation at higher temperatures (Nassar et al., 2011b,c; Ciajolo and Barbella,
1984). Still, mass loss of adsorbed asphaltenes took place at much lower temperatures
than the sample of high mass of asphaltenes in Figure 4.2.
One can still argue that with more than one layer of adsorbed species, the catalyst
might have been deactivated. Therefore, the TG/DTA profiles of commercial NiO
nanoparticles containing adsorbed species from heavy oil medium with and without
DCM washing was included in Figure 4.3. As per Nassar et al. (2011a-c), commercial
NiO nanoparticles are excellent catalysts, and as per Table 4.1, less than one layer of
adsorbed species existed following DCM washing, which should, in principle, exclude a
possible deactivation scenario. Comparing the thermal behavior with and without DCM
washing confirms higher onset temperature and elimination of species with higher
tendency to react at low temperatures upon DCM washing, which, given that less than
one layer of adsorbed material existed, suggests no catalytic role of NiO nanoparticles.
One thing to note here, is the fact that the significant reduction in the adsorbed mass
between the unwashed and the DCM washed samples did not cause a shift in the
oxidation peak toward lower oxidation temperature as observed in Figure 4.2. This is

61
probably due to the fact that chemically adsorbed species are more difficult to release
from the surface.
At this level of adsorbed mass, artefact arising from mass loss associated with the as-
received NiO nanoparticles, Figure 4.1 should not be overlooked. This may explain the
lower onset temperature for the commercial nanoparticles when compared to the in-situ
prepared ones. It should be noted that mass loss associated with the in-situ prepared
NiO nanoparticles was less than 33% of the commercial NiO, and mainly appeared as a
broad peak in the region between 300 and 500oC (Abu Tarboush and Husein, 2012a).

62
Figure 4.4: Mass loss per unit area of additive versus temperature for in-situ prepared and commercial
NiO nanoparticles collected from heavy oil and/or toluene model solution.
0.00E+00
5.00E-04
1.00E-03
1.50E-03
2.00E-03
2.50E-03
3.00E-03
3.50E-03
4.00E-03
4.50E-03
5.00E-03
0.00E+00
1.00E-02
2.00E-02
3.00E-02
4.00E-02
5.00E-02
6.00E-02
7.00E-02
8.00E-02
9.00E-02
1.00E-01
0 200 400 600 800 1000
Mas
s Lo
ss p
er
Surf
ace
Are
a (m
g/m
2 )
We
igh
t Lo
ss P
er
Surf
ace
Are
a (m
g/m
2 )
Temperature (°C)
In-situ NiO
In-situ NiO-DCM wash
Commercial NiO
Commercial NiO-DCMwashCommercial NiO-model
Commercial NiO-model-DCM wash

63
Figure 4.3 depicts the TG/TGA profiles for C7 asphaltenes adsorbed onto commercial
NiO nanoparticles from toluene model solution before and after DCM washing. It should
be noted that, a comparison between the DTG profiles for C7 asphaltenes in Figure 4.3
with the DTG profile of the high mass of asphaltenes in Figure 4.2 was used by Nassar
et al. (2011b,c) as the basis for concluding catalytic role of NiO commercial
nanoparticles.
Figure 4.3 shows minor differences between the total mass loss of washed and
unwashed samples, which confirms that all asphaltenes are chemically adsorbed
(Carbognani et al., 2008). Once more, mass loss and heat evolution associated with the
as-received NiO nanoparticles should not be overlooked in these samples. Table 4.1
indicates that less than one layer of asphaltenes was adsorbed on those nanoparticles,
yet a comparison between the trends in Figure 4.3 suggests higher reactivity in the
range between 200 oC and 400oC for the samples collected from heavy oil, be it in-situ
formed or commercial nanoparticles.
A more readily comparison between the different adsorbents/media can be provided by
plotting the mass loss per unit area of the adsorbent versus temperature. Figure 4.4
displays such a plot, which reflects the potency of the nanoparticle additive as an
adsorbent and promoter for the oxidation. Figure 4.4 confirms that the performance of
in-situ prepared NiO nanoparticles surpasses the performance of commercial NiO
nanoparticles to a great extent, and once washed with DCM, it displaces similar
performance to the unwashed commercial NiO nanoparticles collected from heavy oil
medium, since they both carry comparable mass of adsorbed species. The minor
differences in the two curves can be attributed to the different nature of adsorbed

64
species, as detailed earlier. Commercial NiO collected from the model solution, on the
other hand, displays the worse performance as an adsorbent and promoter for the
reaction. It should be noted that, following Nassar et al. (Nassar et al., 2011a-c)
analysis, a plot of the percent conversion, α, calculated from equation (E1) below,
versus temperature, as given in Figure 4.5, does not reflect these facts.
mm
mm t
0
0 (E1)
where, 0m is the initial mass of the sample, m is the final mass of the sample, and tm
is the mass of the sample at any time.

65
Figure 4.5: Percentconversion,α,versus temperature for virgin and adsorbed asphaltenes onto in situ
prepared and commercial NiO nanoparticles collected from heavy oil and/or toluene model solution.
0
0.1
0.2
0.3
0.4
0.5
0.6
0.7
0.8
0.9
1
0 100 200 300 400 500 600 700 800
α
Temperature (◦C)
In-situ NiO
In-situ NiO-DCM wash
Commercial NiO
Commercial NiO-DCMwashCommercial NiO-modelCommercial NiO-model-DCM washAsphaltenes

66
While α serves as a simple parameter to depict the fractional mass shift in the presence
of an additive, in a similar fashion to the fractional heat shift (Drici and Vossoughi 1985),
we believe its use to reflect the role of the additive as a promoter for reactions should be
restricted to cases were the same initial mass of reactant is employed; with and without
the additive. That said, the importance of α lies in the fact that it provides a mass-
independent parameter to evaluate the rate constant for a given reaction. In order to
provide such a parameter based on the above analysis, the following reaction equations
were derived as per Coats and Redfern (1964).
n
ta
ot mm
RT
Ek
dt
dm))](exp([
(E2)
dTRT
Ek
mm
dm ao
n
t
t )exp()(
(E3)
where, n is the reaction order, ko is the frequency factor with units dependant on “n” and
dt
dT (oC/min). Equation (E2) explicitly captures the proportionality between the
reaction rate and the mass available for the reaction. Integration of (E3) from the initial
time to any time during the reaction gives (Coats and Redfern, 1964; Nassar et al.,
2011a-c),
1 , ] ] )(1
ln[ln[
1 , ]*1
ln[
]2
1)[ln(
2
2
11
0
nmm
mm
T
nTn
mmmm
RT
E
E
RT
E
Rk
o
t
n
t
n
a
aa
o
(E4)
67
For a first order reaction, and assuming constant Ea over the temperature range for a
given reaction and assuming the term 02
aE
RT (Nassar et al., 2011a-c), a plot of RHS
of (E4) versus (T
1) should give a straight line with a slope= (
R
Ea ). Table 4.2 depicts
values of the activation energy, Ea, in a temperature range between 280oC and 400oC
(Nassar et al. 2011b,c) for washed and unwashed samples of adsorbed species onto in-
situ prepared and commercial NiO nanoparticles collected from heavy oil and/or toluene
model solution. Comparison between the activation energy of the reaction of adsorbed
species onto in-situ prepared NiO nanoparticles with and without washing confirms the
difference in nature of the adsorbed species as well as the rate determining step.
Without DCM washing, the value of Ea (Bartholomew and Farrauto, 2006) reflects that
the oxidation is limited by the mass transfer of the solid reactant, while following DCM
washing the higher activation energy reflects the nature of adsorbed species and the
fact that it is more difficult to combust chemically adsorbed species. The same
conclusion can be drawn from Ea calculations for the commercial NiO nanoparticles
collected from heavy oil media, which showed less than one layer of adsorbed
asphaltenes following DCM washing. This confirms our earlier conclusion that NiO
nanoparticles did not play a catalytic role. The difference in activation energies of
oxidation from toluene model solution with and without DCM washing is minimal.

68
Table 4.2: Activation energy, Ea, calculated from (E4) for first order oxidation of adsorbed asphaltenes
onto in-situ prepared and commercial NiO nanoparticles from heavy oil and/or toluene model solutions.
Sample
No DCM Washing
DCM Washing
Ea
(kJ/mol)
R2 Ea
(kJ/mol)
R2
In-situ prepared NiO
(heavy oil)
7.00 0.91 55.7 0.96
Commercial NiO (heavy oil) 51.6 0.98 57.3 0.93
Commercial NiO (toluene) 39.6 0.95 36.3 0.92

69
Chapter Five: : Analysis of TG/DTA data for adsorbed species onto NiO
nanoparticles
5.1 Introduction
Thermogravimetry (TGA) and differential scanning calorimetry (DSC) measure mass
and heat interactions between a sample and its surrounding atmosphere, hence provide
ground for identifying most probable reactions for a given temperature or temperature
interval (Abu Tarboush and Husein, 2012b; Karacan and Kok, 1997; Kok and Pamir,
1995(. Both instruments enable precise control over the operating parameters, which
supports a model environment that may not necessarily reflect bench or large-scale
operations (Kok and Pamir, 1995; Morgan et al., 1986). Nevertheless, kinetic
parameters obtained from such studies prove effective in modeling unit processes (Kok
and Gundogar, 2013; Flynn, 1997; Morgan et al., 1986). Though, relying only on one of
the two instruments may lead to misinterpretation of the results, especially if mixtures
rather than pure substances are involved and/or multiple reactions are taking place. For
example, during analysis of the thermal behavior of crude oil and its fractions, zones of
low heat flow were associated with high mass loss and vice versa (Karacan and Kok,
1997; Ranjbar and Pusch, 1991). Consequently, heat flow profiles alone may not be
representative of specific heat of reactions, especially if the method of calculating the
heat flow per unit mass is based on division by the initial mass of the sample (Abu
Tarboush and Husein, 2012b, Nassar et al., 2011a-d). Such analysis, on the other
hand, may perfectly apply for determining the specific enthalpy of melting for a pure
substance (Fang et al., 2009). Another important aspect is to consider the temperature
program when comparing literature values for low temperature (LTO), medium

70
temperature (MTO) and high temperature (HTO) oxidation zones (Kok and Gundogar,
2013) as well as gasification, pyrolysis, etc. zones of crude oils and their fractions.
In the previous chapter we relied on TGA, differential thermal gravimetry (DTG) and
differential thermal analysis (DTA) results to conclude that oxidation of adsorbed
asphaltenes onto NiO nanoparticles was promoted by surface rather than catalytic
effects (Abu Tarboush and Husein, 2012b). Our conclusion was based on multilayer
adsorption of asphaltenes obtained by surface coverage calculations backed by uptake
results and FTIR measurements that suggested adsorbed asphaltenes onto the surface.
Our calculations and experimental approach was later challenged by Nassar et al.
(2013), who attributed shifts in reaction zones; including oxidation, gasification and
pyrolysis of asphaltenes adsorbed onto nano/microparticles to a catalytic effect (Nassar
et al., 2011a-c). In their studies, Nassar et al. (2011a-c) employed asphaltenes,
originally extracted from Athabasca vacuum residue using heptane, adsorbed from
toluene model solutions onto different commercial nanoparticles. These adsorbed
asphaltenes were oxidized under isothermal and non-isothermal conditions and their
oxidation profiles in terms of DTG and DTA were compared with virgin C7-Athabasca
asphaltenes and conclusions on catalytic activities were made from shifts in the peaks
with respect to virgin asphaltenes (Nassar et al., 2011a, b). One major conclusion
Nassar et al. posed is that no pure virgin asphaltenes will oxidize below 400oC (Nassar
et al., 2013; 2011a). Even though, if a reaction is to take place at a given temperature,
e.g. lower than 400oC in the case of adsorbed asphaltenes, it implies no thermodynamic
limitations exist and, in principle, either kinetic and/or mass transfer limitations have
been relaxed. Typically, mixing is employed to differentiate between the two factors

71
(Wang et al., 2008; Chen and Wang, 2004; Del Bianco et al., 1993). However, this
parameter cannot be manipulated within the context of the TGA and the DSC
instruments, therefore, researchers tended to employ small sample volumes and
assume this leads to no mass transfer limitations. In our previous publication we
demonstrated that reducing the mass of a sample of virgin asphaltenes produced 50oC
shift to a lower temperature in the major oxidation peak (Abu Tarboush and Husein,
2012b). We interpreted this observation as a manifestation of mass transfer limitation,
which is in line with previous literature (Gold, 1980). Furthermore, possible role for mass
transfer finds roots in results presented by Nassar et al., where adsorbed species
displayed the same oxidation trends, independent of their chemical nature (Nassar et
al., 2012b). Besides, DTG profiles for different types of reactions presented by Nassar
et al.; (Nassar et al., 2011a,b), gasification (Nassar et al., 2011c) and pyrolysis (Nassar
et al., 2012) were identical for a given nanoparticle. This fact supports the explanation
proposing that nanoparticle DTG profile overshadowed profile of adsorbed species,
especially for NiO nanoparticles, where more than 50% of the mass loss was
contributed by the nanoparticles. Another thing to note in regards to Nassar et al.’s
results, DTA peaks for pyrolyzed adsorbed asphaltenes showed zones of major
exotherms (Nassar et al., 2012), which is not consistent with literature (Kok and
Gundogar, 2013).
Nassar et al. (2011a-c) relied on calculations pertaining to the fraction of reactant
consumedattimet,“”,and used the rate expression, equation 1, introduced by Coats
and Redfern (1964) to calculate activation energy. Careful consideration of the
parameter“”andequation1byCoatsandRedfern(1964),forn=1,suggeststhatthis
72
approach applies only to cases where the whole reacting mass is exposed to the same
reaction conditions (Silbermann et al., 2013), i.e. lumped system approach. Our attempt
to show the root of equation 1 of Coats and Redfern (1964) and our analysis which
raised a flag regarding the useof “” incaseswheremass transfer limitationsplaya
role, equation 2 of Abu Tarboush and Husein (2012 b), were misinterpreted by Nassar
et al. (2013).
In this chapter, we provide new experimental results and calculations, which support our
previous conclusion on the role of surface effect while studying the thermal behavior of
adsorbed asphaltenes onto NiO nanoparticles. In addition, we highlight some facts that
were misinterpreted in Nassar et al. (2013) publication.
5.2 Oxidation Analysis
5.2.1 The oxidation of Athabasca asphaltenes and Athabasca and Arabian heavy oil matrixes
In their publication Nassar et al. (2013) raised a concern regarding our use of Arabian
heavy oil matrix (Abu Tarboush and Husein, 2012b), while comparing the oxidation of
adsorbed Athabasca and Arabian asphaltenes. This concern referred to composition
and molecular property differences between the two sources of asphaltenes.
Figure 5.1 compares the TG/DTA profiles for the Arabian oil matrix consisting of 20 wt%
vacuum residue (VR) and 80 wt% vacuum gas oil (VGO) employed in our previous
publication (Abu Tarboush and Husein, 2012a,b), Athabasca oil matrix having the same
composition and virgin C7-precipitated Athabasca asphaltenes. Two major oxidation
regions can be identified for the two oil matrixes, a low temperature oxidation (LTO)
region between 100oC -380°C and a high temperature oxidation (HTO) region

73
Figure 5.1: TG/DTA plot of (a) rate of mass loss, and (b) heat flow versus temperature for Athabasca and Arabian oil matrixes composed of 80 wt% VGO and 20 wt% VR and Athabasca C7-precipitated
asphaltenes. Heating rate = 10oC/min; air flow = 100 cm
3/min.

74
between 400oC -600°C. Even though, mass loss started at a lower temperature for the
Arabian matrix, which suggests higher fraction of lighter compounds, for both oil
matrixes the LTO region corresponded to 80-85 wt% of the total mass loss, which is
mainly contributed by the VGO fraction of the matrixes. The HTO region corresponded
to 15-20 wt% of the total mass loss, which is mainly contributed by the VR fraction of
the oil matrixes. It is important to note that the asphaltenes content of the matrixes
comes mainly from the VR fraction (Carbognani et al., 2007; Banerjee et al., 1986). For
Athabasca C7-asphaltenes, mass loss only started at temperatures exceeding 350°C,
which is consistent with the literature (Abu Tarboush and Husein, 2012b; Nassar et al,
2012; Nassar et al., 2011a; Speight, 2006).
The high temperature oxidation range exhibits similar features for the three samples,
which suggests that this oxidation range corresponds to asphaltenes and other heavy
components of the oil matrixes (Kok and Gundogar, 2013). It is worth noting that resins
were found to have similar thermal behavior to asphaltenes and were combusted within
the same temperature range under the same TGA operating parameters (Guo et al.,
2008). Athabasca and Arabian matrixes as well as virgin asphaltenes displayed three
main peaks, a small peak (~390oC for Athabasca matrix, ~450oC for Arabian matrix, and
~370°C for virgin Asphaltenes), a medium peak (between 400oC -500oC for Athabasca
matrix, 450oC -480oC for Arabian matrix, and 430oC -480°C for virgin Asphaltenes) and
a large peak (between 500oC -600oC for Athabasca matrix, 480oC -560oC for Arabian
matrix, and 480oC -560°C for virgin Asphaltenes). The major difference in the heat flow
profiles of Figure 5.1b can be attributed to the fact that heat flow data was divided by
the initial mass of the sample.

75
Figure 5.2 shows the heat flow profiles for the three samples when dividing by the mass
loss pertaining to the HTO. Figure 5.2 shows comparable peaks amongst the 3
samples, especially if one starts from the same datum as per Roger and Morris
approach (Kok and Gundogar, 2013). The differences between the TG/DTA profiles for
the three samples can be explained by differences in the composition of the heavy
fractions.
Similarity in thermal behavior among asphaltenes collected from different locations is
not unique to our study, and had been extensively reported in the literature (Gray et al.,
2004; Zhang et al., 2006; Kopsch,1994; Ali and Saleem, 1991).
5.2.2 The oxidation of Athabasca asphaltenes, in the presence and absence of NiO nanoparticles
Nassar et al.’s (2011a-c) observation on major oxidation peaks, upon which they
established the catalytic interpretation of the results, is misleading. Nassar et al. (2013)
accurately noted that the shift of the major oxidation peak for asphaltenes should be
extracted through simultaneous analysis of the TG/DTA profiles. The heat flow data
reported in their work (Nassar et al., 2011a-c), however, are average heat flows
calculated by dividing by the initial mass of the sample. This average is not
representative for two reasons. On one hand, for the case of asphaltenes adsorbed
onto commercial NiO nanoparticles from model solutions, approximately 85% of the
mass remain in the crucible. The unconverted mass will not contribute towards heat of
reaction, whereas it consumes sensible heat as the sample temperature increases. On
the other hand, higher temperatures correspond to higher reaction rates and, therefore,

76
Figure 5.2: DTA plot of heat flow versus temperature in the HTO for Athabasca and Arabian oil matrixes composed of 80 wt% VGO and 20 wt% VR and Athabasca C7-precipitated asphaltenes. Heating rate=
10oC/min; air flow = 100 cm
3/min.
-30
-20
-10
0
10
20
30
40
410 460 510 560 610 660 710 760He
at F
low
(W
/g)
Temperature (°C)
Athabasca Matrix Arabian Matrix Athabsca Asphaltenes

77
more mass loss. Consequently, a peak size based on average heat flow does not reflect
temperature ranges with higher reaction rates.
To illustrate, the heat flow data, for the small asphaltenes sample reported in our earlier
study (Abu Tarboush and Husein, 2012b), were dissected into two zones; namely LTO
(0°C-420°C) and HTO (420°C-550°C). Average heat flows were calculated by dividing
instrument output by the total mass lost in each zone. Figure 5.3 confirms that the major
oxidation peak in fact corresponds to LTO zone. For comparison, heat flow profile for
asphaltenes adsorbed from toluene model solutions onto commercial NiO
nanoparticles, corrected for the mass loss of asphaltenes only, was also added. Figure
5.3 shows that the corrected heat flow profile fill within the LTO zone of the small mass
of asphaltenes. On the other hand, heat flow data for virgin asphaltenes was added
without adjustments to Figure 5.3, since almost all of it fill within the HTO zone.
Therefore, we conclude that the small and large peak comparison presented by Nassar
et al. (2013) is deficient due to artefact belonging to inappropriate selection of mass.
In light of these results, and as previously reported by our group (Abu Tarboush and
Husein, 2012b), a shift in the TG/DTA peaks to lower temperatures taking place as a
result of reduction in sample size in the absence of nanoparticles, suggests better
reactivity due to a better exposure to the oxidant.

78
Figure 5.3: DTA plot of heat flow versus temperature for low and high mass of virgin Athabasca C7-precipitated asphaltenes and C7-precipitated asphaltenes adsorbed form model solution onto commercial
NiO nanoparticles. Heating rate = 10oC/min; air flow=100 cm
3/min

79
5.3 Activation energy calculations
As described in the introduction, the basic equation employed by Coats and Redfern
(1964) to extract kinetic data from thermogravimetric measurements, equation 1 with n=
1, is based on the assumption that the entire sample is exposed to the same conditions
and no mass transfer limitations are encountered. When considering the thermal
behavior of adsorbed materials onto nanoparticles, depending on the type of
nanoparticles and adsorbed species and the degree of agglomeration, one may safely
assume no such limitations exist, however, such an assumption should not be taken for
granted, especially for virgin asphaltenes (Nassar et al., 2011a).
Even if one accepts the assumption of no mass transfer limitations for asphaltenes
adsorbed from model solution onto commercial NiO nanoparticles (Nassar et al.,
2011a), one should still deduct mass losses due to virgin NiO nanoparticles from the
total loss while calculating , especially since it accounts for more than 60% of the total
loss. Our earlier remark alluding to this (Abu Tarboush and Husein, 2012b) was entirely
downplayed by Nassar et al. (2013). Therefore, we decided to carry on the following
analysis.
Figure 5.4 compares versus temperature profiles for adsorbed asphaltenes onto
commercial NiO nanoparticles while accounting for mass loss due to nanoparticles
versus considering the whole mass loss belonging to adsorbed asphaltenes. It is clear
from the figure that much lower onset temperature is obtained when one accounts for
mass loss due to nanoparticles. Recall, the onset of versus temperature curve was
employed by Nassar et al. (2011a-c) to reflect catalytic activity. In our previous
publication (Abu Tarboush and Husein, 2012b) we suggested that NiO was deemed as

80
Figure 5.4: Fraction conversion, α, for asphaltenes adsorbed onto commercial NiO nanoparticles while a) considering all mass loss belonging to adsorbed species; b)accounting for mass loss due to nanoparticle .
0
0.1
0.2
0.3
0.4
0.5
0.6
0.7
0.8
0.9
1
0 100 200 300 400 500 600 700 800 900
Alp
ha
(α)
Temperature (°C)
a b

81
the most effective catalyst by Nassar et al. (2011a) as a result of ignoring to account for
mass loss due to virgin NiO nanoparticles. In order to further support this discussion,
activation energy, Ea, calculated per Nassar et al. (2011a) while deducting the mass
loss due to NiO nanoparticles was found to be 77 kJ/mole, versus 39.5 kJ/mol (Abu
Tarboush and Husein, 2012b) when considering the whole mass loss belonging to
adsorbedasphaltenes.ContrarytoNassaretal.’s(2013)expectation,thevalueofEa is
indeed very sensitive to mass losses due to nanoparticles and activation energy
approximately doubled when one excludes mass losses due to NiO nanoparticles from
calculation. The same analysis would apply to other methods of Ea calculation
proposed by Nassar et al. (1122c), since the error is inherent in calculation.
5.4 Effect of heat treatment
Heating at 300°C for 12 h was deemed necessary for the preparation of the in situ NiO
nanoparticles (Abu Tarboush and Husein, 2012a). In order to provide common ground
for comparison with the commercial NiO nanoparticles, two samples having the same
concentration of the commercial NiO nanoparticles as well as water content were
exposed to the same heat treatment except that in one sample the heavy oil was heat
treated before the addition of nanoparticles. In the other sample, heat treatment
commenced in the presence of both nanoparticles and water (Abu Tarboush and
Husein, 2012a). No major differences were detected in the two samples in terms of
uptake; 0.37±0.03 g/g when NiO nanoparticles were heat treated with the oil and
0.41±0.04 g/g when NiO nanoparticles were added following the heat treatment (Abu
Tarboush and Husein, 2012a). The experimental result included in Abu Tarboush and

82
Husein (2012a) and claimed by Nassar et al. (2013) to represent adsorption onto a
spent catalyst, in fact belongs to the commercial NiO nanoparticles added to the heavy
oil matrix following heat treatment for 12 h at 300oC. Figure 5.5 compares the TG/DTA
profiles for the two samples. The DTG profile for the sample where heat treatment
commenced in the presence of NiO nanoparticles shows a relatively large peak
between 600-800oC, which can be accurately interpreted as reaction of carbonaceous
material resulting from cracking (Nassar et al., 2013; Ranjbar and Pusch, 1991).
However, again, this was not the sample discussed in our previous publication (Abu
Tarboush and Husein, 2012b).
In our previous work (Abu Tarboush and Husein, 2012a), FTIR spectroscopy of
adsorbed species from heavy oil onto in situ prepared and commercial NiO
nanoparticles were reported. For comparison purposes, FTIR spectroscopy of adsorbed
asphaltenes from toluene model solution onto commercial NiO nanoparticles was also
reported. The model solution was prepared by dissolving C7-Athabasca asphaltenes in
toluene. The FTIR analysis for the three samples showed no differences in the major
peaks, and the adsorbed materials from the three samples were found to be similar in
nature. Therefore, the claim that those adsorbed species could be resins (Nassar et al.,
2013) is not valid. Moreover, the similarity in FTIR spectrum between the three samples
suggeststhatNassaretal.’s(2013)speculationthatthe12hheattreatingtimeforthe
in situ prepared nanoparticles result in different types of molecular structure is not
accurate. In support of our conclusion, Huang (2006) studied the effect of heat
treatment on asphaltenes structure using FTIR and reported that, up to 450°C, the FTIR

83
spectrum for the heat treated and un-heat treated asphaltenes were similar with slight
loss in aromatic properties for the heat treated samples.

84
Figure 5.5: TG/DTA plot of rate of (a) mass loss and (b) heat flow versus temperature for adsorbed species onto commercial NiO added following heat treated oil in presence of NiO nanoparticles at 300
oC
for 12h.Heating rate=10oC/min; air flow =100 cm
3/min

85
Further to this point, and in order to explore the effect of NiO nanoparticles on the
characteristics of heat treated oil, the FTIR spectroscopy of adsorbed species from
heavy oil onto commercial NiO nanoparticles for the sample involving heat treatment in
the presence of the nanoparticles is shown in Figure 5.6. The FTIR spectra should be
compared to our previous results (Abu Tarboush and Husein, 2012a), and in particular
the sample belonging to adsorbed species onto commercial NiO nanoparticles added
following the heat treatment. Figure 5.6 shows that the peak around 1033 cm-1, which
can be assigned for ether or ester linkage present in asphaltenes molecules (Wilt and
Welch, 1998), is much more pronounced, whereas the peaks for wavelengths greater
than 2500 cm-1, which can be assigned to aliphatic C-H stretch (Calemma et al., 1995)
and water (Wilt and Welch, 1998) are very small. This speaks to the difference in nature
of the adsorbed species upon heat treatment in the presence and absence of NiO
nanoparticles.
In their publication, Nassar et al. (2013) explain that the high viscosity data reported
earlier by Abu Tarboush and Husein (2012a) are due to catalytic thermal
cracking/oxidation, which took place during heat treatment. Not excluding this
explanation, but low temperature oxidation (LTO) might be another reason for the high
viscosity data. These reactions result in the partial oxidation of hydrocarbons at
temperatures less than those needed for complete combustion, which result in
producing oxygenated hydrocarbons such as carboxylic acid, aldehydes, ketones and
alcohols (Burger, et al., 1972) that have higher viscosities, lower volatilities and lower
gravities than the original oils (Alexander et al., 1962). Moschopedis and Speight (1975)
reported that LTO reactions promote the formation of compounds with higher molecular

86
Figure 5.6: FTIR spectrum for species adsorbed onto commercial NiO nanoparticles collected from the
Arabian heavy oil matrix, where the nanoparticles were heat treated with the heavy oil at 300oC for 12 h.

87
weights by increasing the concentration of asphaltenes in oil and by reducing its
aromatic and resin concentrations. Moreover, the catalytic thermal cracking/oxidation
interpretation provided by Nassar et al. (2013) does not provide any explanation why
the in situ prepared samples exhibited high viscosity values before centrifugation. As for
the speculation that produced gases or light fractions would have been evaporated
during sample recovery, transportation, etc. (Nassar et al., 2013), it is important to
emphasize on what have been reported in our previous publication (Abu Tarboush and
Husein, 2012a). All experiments were conducted in a closed reactor and once samples
were taken, they were kept tightly sealed.
Finally, it should be noted that attempts to prepare the in situ NiO nanoparticles upon
heating the Arabian heavy oil matrix containing the aqueous Ni(NO3)2 precursor at
300oC for 4 h did not result in sharp XRD peaks as shown in Figure 5.7. Therefore, we
conclude the 12 h heating was indeed necessary for the preparation of the in situ
particles and did not involve much catalytic cracking at 300oC.
Given all of the above, the discussion by Nassar et al. (2013) pertaining to time zero,
spent catalyst and cracked samples is not relevant to our previous publication (Abu
Tarboush and Husein, 2012a,b) and Figures 2 and 3 of Nassar et al. (2013) are not
representative of our earlier experimental procedure (Abu Tarboush and Husein,
2012a).

88
Figure 5.7: X-ray diffraction pattern of the in situ prepared NiO nanoparticles in the heavy oil matrix at
300°C and 4 h.

89
5.5 Possible Impurities
The concern raised by Nassar et al. (2013) regarding possible species, beside
asphaltenes, also adsorbed onto nanoparticles recovered from the heavy oil system is
valid, especially since FTIR spectrum pertains more to material adsorbed at the surface
and, therefore, does not preclude species such as resins, which can be entrained or
adsorbed onto the asphaltenes. Making use of the definition of asphaltenes as the
fraction of crude oil that is heptane insoluble (Bouhadda et al., 2007; Liao et al., 2005),
we decided to employ heptane washing. Ideally, material leftover following heptane
washing should be asphaltenes, especially since adsorbed material onto the surface
was characterized by FTIR to be so (Abu Tarboush and Husein, 2012a).
Table 1 below suggests that very little drop in the uptake occurred following washing the
in situ prepared NiO nanoparticles retrieved from the Arabian heavy oil matrix with
heptane for several times. This suggests that most of the adsorbed species are in fact
asphaltenes, especially in light of the fact that the same observation was reported for
the commercial NiO nanoparticles collected from the model solution as shown in Table
1. For commercial NiO nanoparticles added to the Arabian heavy oil matrix following
heat treatment at 300oC for 12 h, on the other hand, appreciable difference in the
uptake before and after heptane washing is observed in Table 5.1.

90
Table 5.1: Asphaltenes uptake by in situ prepared and commercial NiO nanoparticles collected from
heavy oil and/or toluene model solution with and without heptane washing.
Sample
Unwashed Heptane Washing
Uptake
(g/g)
Adsorbed
layers/particle
Uptake
(g/g)
Adsorbed
layers/particle
In situ prepared NiO
(heavy oil) 2.9 9.4 2.87 9.3
Commercial NiO (heavy
oil) 0.41 1.5 0.21 0.80
Commercial NiO (model) 0.094 0.34 0.093 0.33
Figure 5.8 portrays the TG/DTA profiles for commercial and in situ prepared NiO
retrieved from the Arabian heavy oil matrix and toluene model solutions following
washing with heptane. Even though the same value of uptake was reported, the DTG
profiles of the in situ prepared NiO nanoparticles under oxidizing atmosphere portray
100oC shift to higher temperatures relative to the unwashed sample. The same shift
was observed upon washing the in situ particles with DCM. The DTA peaks of Figure 8b
show major oxidation peaks associated with the DTG peaks for heptane washed in situ
particles. These peaks also displayed the same features as DCM washed in situ
prepared particles, at least in the region preceding the complete combustion of the
adsorbed asphaltenes. Even though 9 layers were adsorbed onto heptane washed in
situ particles, as per our previous publication (Abu Tarboush and Husein, 2012a), the
onset combustion temperature of the adsorbed asphaltenes, ca. 200oC, was much
lower than 400oC proclaimed by Nassar et al. (2013) as the combustion temperature of
virgin asphaltenes. It is worth noting that the outer layers of adsorbed asphaltenes are
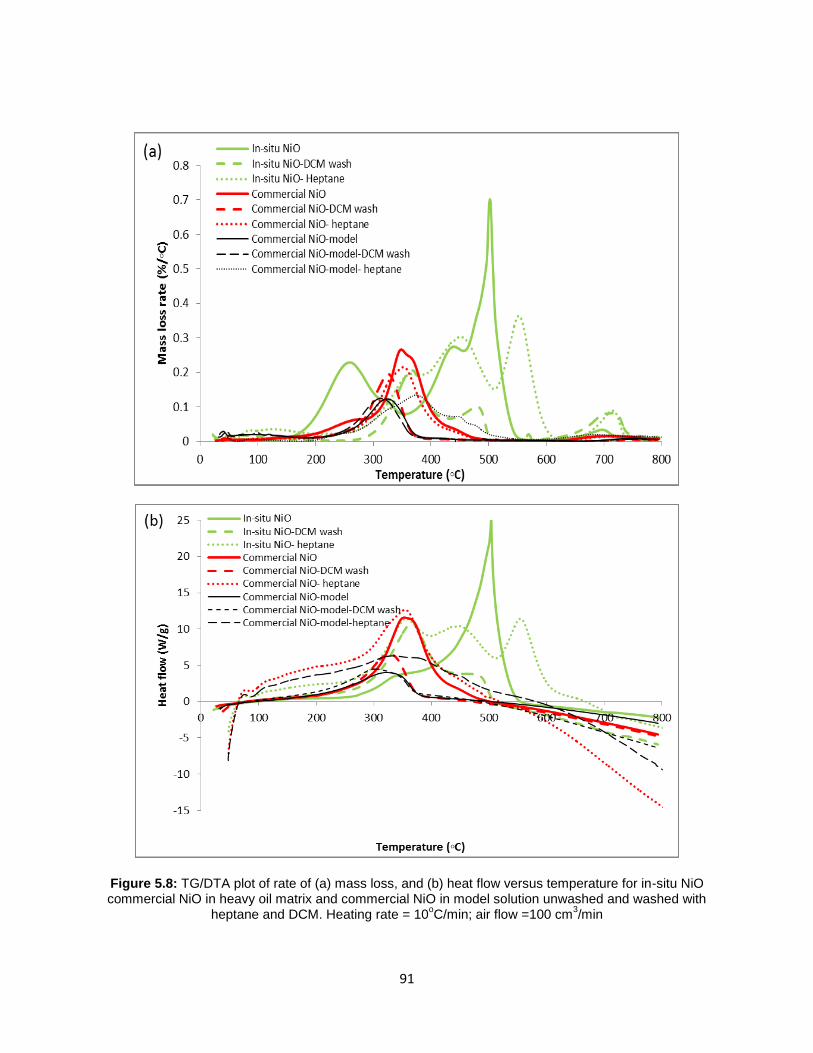
91
Figure 5.8: TG/DTA plot of rate of (a) mass loss, and (b) heat flow versus temperature for in-situ NiO commercial NiO in heavy oil matrix and commercial NiO in model solution unwashed and washed with
heptane and DCM. Heating rate = 10oC/min; air flow =100 cm
3/min

92
far enough from any catalytic sites, as detailed in our previous publication (Abu
Tarboush and Husein, 2012b).
A closer comparison with our previous publication for in situ prepared particles shows
that the onset temperatures for mass loss for the unwashed, heptane washed and DCM
washed samples are at 150°C, 200°C, and 280°C, respectively. The broad peak in this
range, 200oC -300°C, belonging to the unwashed sample partially disappears upon
washing with heptane, whereas for the same sample washed with DCM the peak
completely disappears. Therefore, the claim that adsorbed materials in this range are
only light materials attached to asphaltenes (Nassar et al., 2013) is not very accurate.
DCM washing, on the other hand, is capable of removing loosely adsorbed asphaltenes.
More tightly adsorbed species have been reported to be removed at higher
temperatures from surfaces (Li et al., 2010). Per our surface effect model (Abu
Tarboush and Husein, 2012b), the difference between unwashed and heptane washed
in situ prepared NiO nanoparticles can be explained by a possible reduction in the
overall surface exposed to the oxidant upon heptane washing. So even though the
onset temperatures for DTG and DTA profiles were as low as 100oC, there was not
sufficient oxidation to make these peaks significant.
For the unwashed commercial NiO nanoparticles in the heavy oil, the major DTG peak
appears between 300oC -400°C. In the range between 200oC -300°C unwashed
commercial sample shows a small, relatively broad, peak which disappears upon
washing with heptane or DCM. Otherwise, no major differences between the unwashed
and heptane washed sample is detected while the DCM washed sample portrays a
slight shift toward lower oxidation temperature, from 350°C to 320°C compared to the
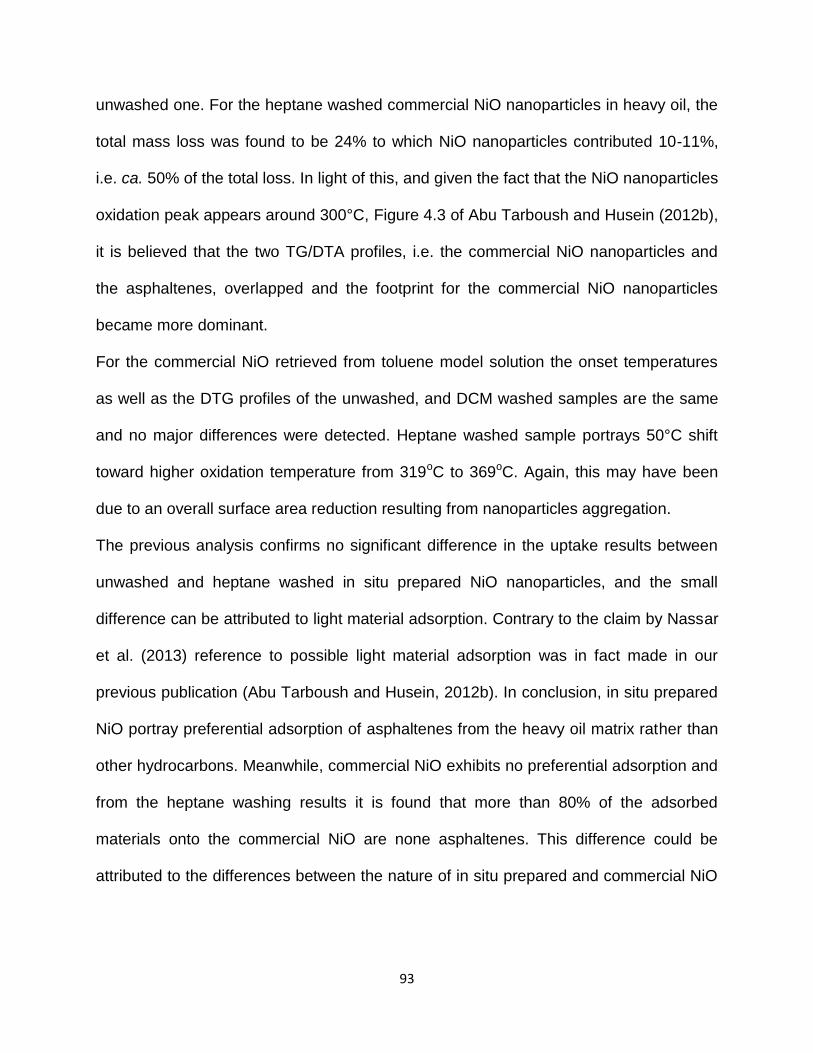
93
unwashed one. For the heptane washed commercial NiO nanoparticles in heavy oil, the
total mass loss was found to be 24% to which NiO nanoparticles contributed 10-11%,
i.e. ca. 50% of the total loss. In light of this, and given the fact that the NiO nanoparticles
oxidation peak appears around 300°C, Figure 4.3 of Abu Tarboush and Husein (2012b),
it is believed that the two TG/DTA profiles, i.e. the commercial NiO nanoparticles and
the asphaltenes, overlapped and the footprint for the commercial NiO nanoparticles
became more dominant.
For the commercial NiO retrieved from toluene model solution the onset temperatures
as well as the DTG profiles of the unwashed, and DCM washed samples are the same
and no major differences were detected. Heptane washed sample portrays 50°C shift
toward higher oxidation temperature from 319oC to 369oC. Again, this may have been
due to an overall surface area reduction resulting from nanoparticles aggregation.
The previous analysis confirms no significant difference in the uptake results between
unwashed and heptane washed in situ prepared NiO nanoparticles, and the small
difference can be attributed to light material adsorption. Contrary to the claim by Nassar
et al. (2013) reference to possible light material adsorption was in fact made in our
previous publication (Abu Tarboush and Husein, 2012b). In conclusion, in situ prepared
NiO portray preferential adsorption of asphaltenes from the heavy oil matrix rather than
other hydrocarbons. Meanwhile, commercial NiO exhibits no preferential adsorption and
from the heptane washing results it is found that more than 80% of the adsorbed
materials onto the commercial NiO are none asphaltenes. This difference could be
attributed to the differences between the nature of in situ prepared and commercial NiO

94
which leads to differences in the type of interactions between adsorbent and adsorbate
in the two cases.
In the Modified Yen’s Model, the role of resins in stabilizing the asphaltenes
nanoaggregates (Mullins, 2010) is less important than what was thought. This model
projects asphaltenes molecules as islands of condensed polycyclic aromatic
hydrocarbons (PAH) surrounded by alkyl chains (Goual and Firoozabadi, 2002; Mullins,
2010; Dickie and Yen, 1967). The PAH core contains most of the heteroatoms and,
hence is more likely to undergo van der Waals interactions with the other asphaltenes
molecules. Subsequently, nanoaggregates of asphaltenes would also consist of polar
PAH core with the alkyl chains branched towards the dispersion medium. As such, the
alkyl chains conforms steric stabilization onto the nanoaggregates and the stabilizing
role of resins becomes less important (Eyssautier et al., 2011; Mullins et al., 2011;
Mullins, 2010). In support of this model, Leon et al. (1999) reported that the composition
of the dispersion medium has no major effect on the stability of asphaltenes in crude
oils. Nevertheless, this representation of asphaltenes nanoaggregates did not
completely eliminate resins from the picture and it is concluded that about 15% of the
nanoaggregate consists of resins (Mullins, 2010). This percentage of resins is, however,
less than what is needed to stabilize the asphaltenes aggregates (Mullins, 2010) as per
the widely accepted model (Premuzic and Lin, 1999; Li et al.,1997; Buckley, 1998;
Swanson, 1942; Pfeiffer and Saal, 1940).

95
5.6 Explanation of the adsorption model
Nassar et al. (2013) proposed an adsorption model in which they speculated that at high
asphaltenes concentration, nanoparticles get adsorbed onto asphaltenes aggregates.
No experimental results were provided to support such a model. On the other hand, our
proposed asphaltenes adsorption model involved multilayer adsorption of asphaltenes
onto the nanoparticles (Abu Tarboush and Husein, 2012a). This model was built based
not only on surface coverage and uptake analysis, but also on observations and results
pertaining to surface characterization. For example, FTIR analysis of Figure 3.4 of Abu
Tarboush and Husein (2012a) shows no finger print for NiO nanoparticles. If the in situ
prepared NiO nanoparticles get adsorbed on asphaltenes flocs, as per Nassar et al.
(2013) model, then its corresponding spectrum, around 437 cm-1 (Wang et al., 2005),
should appear clearly. Moreover, Nassar et al. (2013) used our SEM analysis of the in
situ prepared NiO nanoparticles, Figure 3.2 of Abu Tarboush and Husein (2012a), to
argue that nanoparticles get adsorbed onto asphaltenes aggregates. In fact, SEM
images of this figure show no sign of nanoparticles on the outer surface of the
agglomerates. Equally important is the TEM/EDX analyses of Figure 3.1b and d of Abu
Tarboush and Husein (2012a), which show particles in the nano size domain with some
adsorbed carbon, which is believed to be adsorbed hydrocarbons onto particles. These
samples were subjected to extensive washing with DCM. Finally, XRD was employed to
identify the in situ prepared NiO. In order to perform the XRD analysis, the in situ
prepared NiO nanoparticles were recovered from the heavy oil and also washed with
DCM as per procedures published earlier (Abu Tarboush and Husein, 2012a). XRD
pattern, Figure 3.1a of Abu Tarboush and Husein (2012a), reveals that all the major

96
XRD peaks belongs to NiO, while the other peaks are minor and can be attributed to the
adsorbed heavy fractions (Abdrabo and Husein, 2012).
In conclusion, our proposed model of multilayer adsorption finds lots of support from
experimental results, while the model by Nassar et al. (2013) was mostly based on
speculations.

97
Chapter Six: Adsorption of asphaltenes from heavy oil onto in-situ
prepared Fe2O3 nanoparticles
In the third chapter we investigated the adsorption of asphaltenes from heavy oil matrix
onto in-situ prepared NiO and commercial available nanoparticles. In addition to that,
adsorption of asphaltenes from model solution onto commercially available NiO
nanoparticles was studied. Based on literature reports on iron oxide nanoparticles high
adsorption affinity and catalytic activity, Iron oxide nanoparticles were targeted in this
study. Adsorption of asphaltenes from model solution onto iron oxide (Fe2O3 and Fe3O4)
has been reported (Nassar et al., 2012; Nassar et al., 2011 a-c; Marczewski and
Szymula, 2002).
6.1 Objectives
This study investigates asphaltenes adsorption from heavy oil composed of Arabian
vacuum gas oil and Arabian vacuum residue onto in situ prepared Fe2O3 nanoparticles
and compares it to commercially available Fe2O3 nanoparticles. The concentration of
the in-situ prepared Fe2O3 was also evaluated.
6.2 Material and Methods
6.2.1 Materials
Heavy oil prepared by mixing of Arabian light vacuum residue, ALVR, and Arabian light
vacuum gas oil, ALVGO, was used as the continuous phase, unless otherwise stated.
Iron (III) nitrate nonahydrate (Sigma-Aldrich, Canada) was used as the precursor salt.
Commercial iron (II) oxide (Fe2O3) nanoparticles (dp=20-30 nm, 98%, Sigma-Aldrich,
Canada) were used for comparison. Toluene (99.8%, VWR, Canada) was used to
prepare the model solution of Athabasca asphaltenes in toluene. Athabasca

98
asphaltenes were extracted from Athabasca vacuum residue using n-heptane, C7-
asphaltenes. n-Heptane (99% HPLC grade, Sigma Aldrich, ON) was used to wash the
recovered precipitate, which includes nanoparticles and adsorbed materials following
their extraction from the oil. Dichloromethane (DCM) (anhydrous, ≥ 99.8%, Sigma
Aldrich, USA) was used to further wash the nanoparticles for microscopy imaging and
determination of chemisorbed species. Methanol (99.8%, Sigma-Aldrich, USA) was
used to disperse the recovered particles for transmission electron microscopy imaging.
All chemicals were used as received without further purification.
6.2.2 Methods
6.2.2.1 Preparation of the oil matrix and the heavy oil model solution
More details on the preparation procedure can be found elsewhere in chapter three. In
brief, a specified amount of ALVR was heated to 70oC to reduce its viscosity and used
to prepare a mixture of 20 wt% ALVR and 80 wt% ALVGO. The matrix was then left
shaking for 1 h at 200 rpm and 25oC. For comparison, model solution of 33000 ppm
Athabasca C7-asphaltenes in toluene was also used.
6.2.2.2 In-situ preparation of ultradispersed Fe2O3 nanoparticles
The in-situ preparation of Fe2O3 nanoparticles can be summarized as follows. A volume
of 2 ml of 4 M aqueous iron (III) nitrate nonahydrate solution was added to 50 ml of the
oil matrix, and the sample was vigorously mixed using a vortex mixer for 5 min.
Following mixing no phase separation occurred and the oil matrix appeared as a single
phase to the naked eye. The sample was then introduced to a Parr reactor unit (PARR
Instrument Company, USA), where it was heat treated in the tightly sealed reactor unit
at 200oC for 4 h under 160 rpm mixing.

99
6.2.2.3 Nanoparticle recovery and characterization
Particle recovery from the oil matrix was accomplished by centrifuging the oil matrix at
5,000 rpm for 10 min and decanting the upper phase. The lower phase was collected
and washed several times with toluene until a clear toluene phase was produced. It is
important to note that centrifuging the control samples did not result in any precipitation.
On the other hand, for the experiments involving determining the chemisorbed
asphaltenes and surface area, the precipitate was further washed with DCM.
After washing with toluene, the particles were dried and introduced to an Ultima III
Multipurpose Diffraction System (Rigaku Corporation, The Woodland, TX, USA) for
XRD analysis. The instrument uses a Cu-Kαradiationwhichoperatesat40kVand44
mA with a θ-2θ goniometer. The structure of the particles was identified by comparing
the patterns with database provided by JADE program, ©Materials Data XRD Pattern
Processing Identification & Quantification.
Transmission electron microscopy (TEM) was used to determine the particle size
distribution. A Tecnai TF20 G2 FEG-TEM (FEI, USA) with a FEI low background
double tilt holder (Type PW6595/15) was used. Moreover, energy dispersive X-ray
spectroscopy, EDX, was collected with an EDAX CM-20T detector installed onto the
TEM. Details on sample preparation and instrument setting can be found in chapter
three. Several photographs of the nanoparticles were taken from different locations and
particle size distribution histograms were constructed using ES Vision software.
In-situ prepared iron oxide nanoparticles surface area was estimated using N2
adsorption and desorption at 77 K. Following washing with DCM, Fe2O3 nanoparticles
were first heat treated and degassed at 200oC and 300oC under N2 flow overnight. The
sample was then introduced to a Micromeritics Tristar 2000 surface area analyzer

100
(Micromeritics Instrument Corporation, USA), where the surface area was calculated
using the Brunauer-Emmet-Teller (BET) equation. Lastly, scanning electron microscope
(SEM) (Philips XL30 ESEM, USA) was used to provide another mean for estimating
particles size and possible agglomeration resulting from the heat treatment steps. Fe2O3
nanoparticles were scanned before heat treatment step required for degassing and
following heat treatment at 300oC.
6.2.2.4 Characterization of the adsorbed material and the oil after adsorption
Characterization of the adsorbed material was accomplished by carrying out
thermogravimetric analysis of unwashed, heptane washed and DCM washed samples,
as explained below.
To study the effect of adsorption on the quality of the oil, the viscosity and sulfur content
were measured before and after adsorption. Control samples of the heavy oil matrix
and the heavy oil matrix subjected to heat treatment at the same preparation conditions
were tested for their viscosity. Also, viscosities of heavy oil matrix containing the as-
prepared in-situ Fe2O3 nanoparticles and another following centrifugation were
collected. Viscosity measurements were determined using a cone-plate Brookfield
viscometer model RV DV-II+PROCP (Brookfield Engineering Laboratories, USA).
Temperature was controlled using a recirculating glycol bath (Brookfield model TC-102).
The analysis involved placing a small quantity of the oil in the cone while ensuring it
wets the entire cone surface. The analyses were conducted at 25oC and 60 rpm. For
sulfur content analysis three samples were tested, control sample of the heavy oil
matrix, the heavy oil matrix subjected to heat treatment and a sample where the in situ
prepare particles were prepared and the nanoparticles were recovered by centrifuging.
101
Sulfur analysis was carried out on Trace Sulfur Analyzer Model TS-100 from Mitsubishi
Chemical Analytech.
6.2.2.5 Adsorption kinetics
The kinetics of hydrocarbon adsorption onto the in-situ prepared Fe2O3 nanoparticles
was studied using batch-adsorption experiments, as described in the preparation step.
The nanoparticles, together with the adsorbed hydrocarbons, were separated at
specified times by centrifuging the sample at 5,000 rpm for 10 min, and the particles
were left to dry in an oven at 80oC for 3 days. The dried nanoparticles containing the
adsorbed species were, then, analyzed using thermal gravimetric analysis, TGA,
coupled with differential scanning calorimetry DSC, as described below. In order to
determine the chemisorbed hydrocarbons, DCM washed samples were used.
Physisorbed hydrocarbons could, then, be calculated from the difference in mass before
and after DCM washing. Some samples were washed with n-heptane in order to
calculate the percentage of asphaltenes in the adsorbed materials.
6.2.2.6 The effect of nanoparticle origin, concentration, heat treatment and water
content
The effect of nanoparticle origin and concentration on the hydrocarbon uptake was
studied by increasing the content of the in situ prepared as well as commercial Fe2O3
from 1000 to 10,000 ppm. It is worth mentioning that the water content for these
samples was kept constant. Moreover, for the commercial Fe2O3 nanoparticles, the
effect of water content as well as the effect of heat treatment in the presence and
absence of the nanoparticles on the hydrocarbon uptake was studied. Briefly, two sets
of experiments were conducted. The first set contained two samples in which both

102
commercial Fe2O3 nanoparticles and water were added before and after the oil was heat
treated. The second set includes two samples having the same components of the
previous set, except for the water, and undergoes the same heat treatment, before and
after nanoparticles were added.
6.2.2.7 Thermogravimetric analysis
The amount of adsorbed asphaltenes was determined using thermogravimetric analysis
(TGA) on Q600 SDT (TA Instruments, Inc., USA). Thermogravimetric analysis involve
heating few mg of the sample, in the presence of air, from 25oC to 800oC at a constant
temperature ramp of 10oC/min, while maintaining a constant flow rate of air of 100
cm3/min. The amount of adsorbed hydrocarbons was calculated from the mass loss
provided by the TGA. To determine the mass loss associated with the nanoparticles,
control sample containing only in-house prepared Fe2O3 was analyzed using the TGA.
The in-house Fe2O3 was prepared in aqueous medium starting from the same
precursors as the in situ prepared particles and were subjected to the same heat
treatment. Mass loss due to nanoparticles was accounted for in the calculation of the
adsorbed hydrocarbons. Differential thermogravimetry (DTG) and heat flow (DTA)
profiles were collected from the instrument in order to study the nature of reactions
taking place.
6.3 Results and Discussion
6.3.1 Characterization of the in-situ prepared Fe2O3 nanoparticles
Figure 6.1a depicts the XRD pattern of the Fe2O3 nanoparticles prepared in the oil
matrix and collected and washed with DCM as outlined in the experimental section. As

103
per JADE program, all the major XRD peaks belong to Fe2O3, whereas the other peaks
are minor and can be attributed to adsorbed heavy fractions (Abu Tarboush and Husein,
2012a).ThemeanparticlediameterestimatedbyScherrer’sequation(Dritsetal.,1997)
from the XRD peak at 2θ= 33.46 is 30 nm. A representative TEM photograph and the
corresponding particle size distribution histogram are depicted in Figure 6.1b,c. The
mean particle diameter, based on number average, calculated from the input data to the
histogram is 63±5 nm, which is similar to the XRD estimate. Figure 6.1b shows some
aggregates in the range of 70 nm, however, a zoom in on these aggregates reveals a
collection of much smaller particles, which are believed to form as a consequence of
interdigitation, during drying, of capped particles. The EDX elemental analysis shown in
Figure 6.1d indicates that, aside from copper and carbon which are components of the
TEM grid, the major elements of the nanoparticles are iron and oxygen, which is in line
with the XRD result.
The surface area evaluated by the BET method following degassing the sample at
200oC and 300oC were found to be 9 and 62.7 m2/g. This data shows that degassing
temperature has a big effect on the surface area. This dependence can be explained, in
light of TEM results, as internal pores within the agglomerated particles that were made
available as a result of removing adsorbed/deposited hydrocarbons by heating.
Therefore, the BET surface area estimates were considered not representative of the
surface area of the as-prepared dispersed nanoparticles. In order to further support this
explanation, SEM analysis was conducted for non-heat treated and heat treated, at
300°C, in-situ prepared Fe2O3. Figure 6.2 shows that heat treatment introduced more
resolution and provided more definition of the capped nanoparticles with the

104
agglomerated cluster. This difference in SEM images of the heat treated and non-heat
treated samples supports an adsorption model in which hydrocarbons get adsorbed
onto the nanoparticles (Abu Tarboush and Husein, 2012b) and not vice versa (Nassar
et al., 2013). It should be noted, nevertheless, that SEM samples were not subjected to
any dispersion before photographs were taken, and therefore were not considered
representative of the dispersed in situ prepared particles.
The geometrical surface area was calculated using the mean particle diameter
estimated by the XRD and the TEM analyses and was found to be 30 m2/g and 25 m2/g,
respectively and the geometrical surface area calculated from the TEM estimate was
considered the most reliable (Abu Tarboush and Husein, 2012a; Vossmeyer et al.,
1994).

105
Figure 6.1: a) X-ray diffraction pattern; b) TEM image; c) particle size distribution histogram; d) EDX
analysis of the in-situ prepared Fe2O3 nanoparticles.
(a)
(b)

106
Figure 6.1: a) X-ray diffraction pattern; b) TEM image; c) particle size distribution histogram; d) EDX analysis of the in-situ prepared Fe2O3 nanoparticles.
0
10
20
30
40
50
60
70
80
0-10 10-20.0 20-30 30-40 40-50
Fre
qu
ancy
Diameter (nm)
(C)
Energy (keV)
Counts
6.0 4.0 2.0 0.0
800
600
400
200
0
C
O
S S
Fe
Fe
Fe Fe
Fe
Cu Cu
Cu
(d)
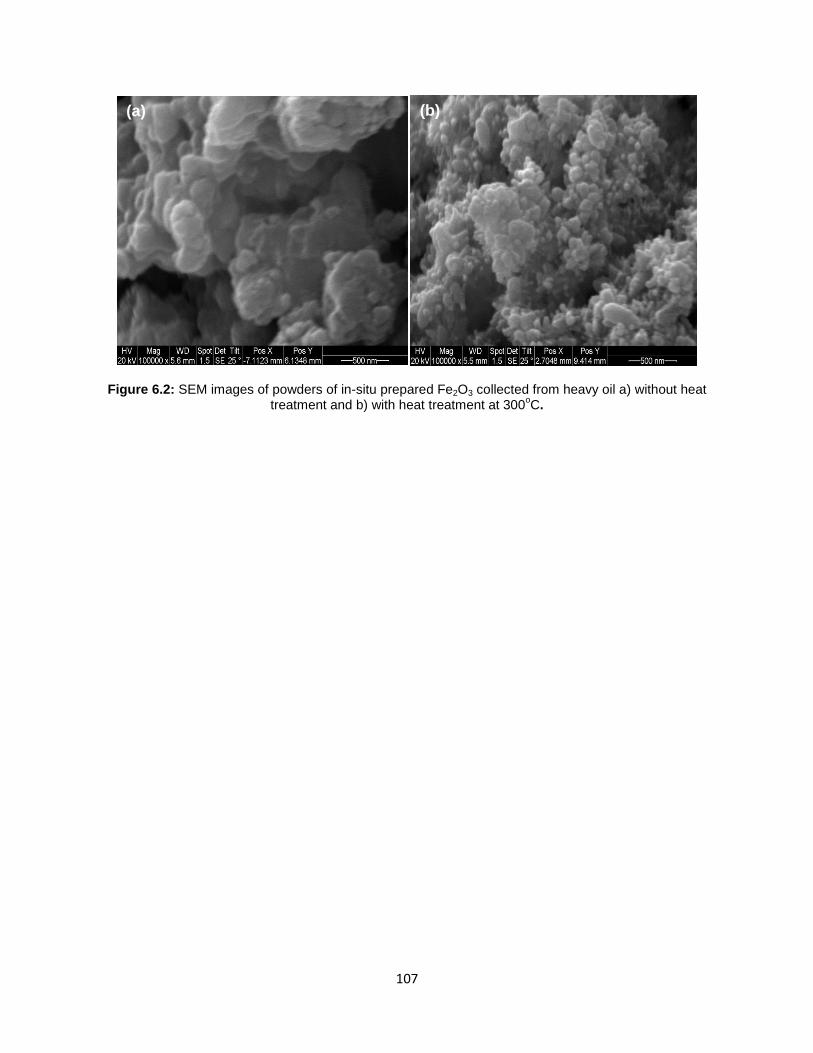
107
Figure 6.2: SEM images of powders of in-situ prepared Fe2O3 collected from heavy oil a) without heat treatment and b) with heat treatment at 300
oC.
(a) (b)

108
6.3.2 Adsorption kinetics
Table 6.1 shows the mass of adsorbed species per g of the in situ prepared as well as
commercial Fe2O3 nanoparticles. These values were calculated using the
thermogravimetric, TG, results for nanoparticles recovered from the heavy oil matrix
following mixing for 4 hrs at 211oC and 231 rpm. For the commercial nanoparticles, on
the other hand, the nanoparticles were added to an oil matrix following subjecting the
particle-free matrix to the above conditions. The percent mass loss associated with the
nanoparticles was accounted for using control samples containing only the commercial
nanoparticles and the in-house prepared Fe2O3.
Table 6.1: Hydrocarbon species uptake onto in situ prepared and commercial Fe2O3 nanoparticles as a
function of time. Samples kept at 200 rpm, 25oC. Concentration of nanoparticles= 10,000 ppm
Time (h) Uptake (g/g),
In-situ prepared Fe2O3
Uptake (g/g),
Commercial Fe2O3
1 1.9±0.12 0.55±0.07
4 1.2±0.5 0.72±0.13
24 2.7±0.20 0.89 ± 0.2
According to the data presented in Table 6.2 the bulk of adsorption took place in
the first one hour and further increase in the uptake with time was noticed.
Nevertheless, the increase falls within the experimental errors. This rapid adsorption
kinetics, when compared with typical porous adsorbents (Acevedo et al., 2000; Acevedo
et al., 1995), may be attributed to the absence of pore diffusion (Abu Tarboush and
Husein, 2012a), coupled with low external mass transfer limitations in the presence of
ultradispersed adsorbents (Abu Tarboush and Husein, 2012a; Husein, et al., 2010).

109
Hydrocarbon species uptake by in situ prepared nanoparticles, 2.7 g/g nanoparticles, far
exceeds values reported in the literature for porous adsorbents (Rudrake et al., 2009;
Acevedo et al., 2000; Acevedo et al., 1995) and are very close to values reported in our
previous work on NiO nanoparticles (Abu Tarbush and Husein, 2012a). Dispersed
commercial nanoparticles displayed fast adsorption kinetics towards asphaltenes from
toluene model solutions (Nassar et al., 2011a-c; Nassar, 2010). Nevertheless, at the
condition of the current experiment, T= 25oC, the viscosity of the heavy oil matrix is at
least 60 times higher than the viscosity of the toluene model solution. On the other
hand, asphaltenes concentration in the oil matrix is roughly 40 g/L (Liu et al., 1999),
almost 10 times the maximum concentration used in model solutions (Nassar et al.,
2011a-c). It is important to mention that this high concentration may promote adsorption
of aggregated asphaltenes, nevertheless, control samples containing no nanoparticles
showed no sign of separation of such aggregates.
Uptake data for the commercial Fe2O3 exhibited much lower adsorption capacity,
roughly 25%, than the in situ prepared Fe2O3. This is believed to be due to the severe
aggregation problems associated with the commercial Fe2O3 nanoparticles which not
only reduce their total surface area, but also result in precipitation of aggregated
particles and induce an increase in the internal and external mass transfer limitations
(Abu Tarboush and Husein, 2012a). On the other hand, in situ prepared nanoparticles,
and by virtue of their preparation technique, homogeneously distribute within the heavy
oil matrix (Abu Tarboush and Husein, 2012a).

110
6.3.3 Effect of washing with heptane or DCM
In light of the workable definition of asphaltenes as the heptane insoluble fraction of
crude oil (Bouhadda et al., 2007; Liao et al., 2005), heptane washing was employed in
order to account for the asphaltenes in the adsorbed materials. Aside from chemically
adsorbed material at the surface of the nanoparticles, ideally asphaltenes should be the
only material left adsorbed following heptane washing.
As shown in Table 6.2, for the in situ prepared particles, heptane washing decreased
the uptake by less than 1%, whereas DCM decreased the uptake by 84%. DCM
washing targets the removal of loosely, physically, adsorbed species (Carbognani et al.,
2008), which in this case appear to be mainly asphaltenes. The rest of the adsorbed
material, though minor, might be the attached resins (Nikookar et al., 2008; Evdokimov
et al., 2003). This huge reduction in uptake upon DCM washing suggests that more than
80% of the adsorbed hydrocarbons onto in situ prepared particles are in fact, physically
adsorbed. Despite this reduction in uptake, uptake is still much higher than values
reported in the literature (Nassar et al., 2011a, b, c; Nassar, 2010; Rudrake et al., 2009;
Acevedo et al., 2000; Acevedo et al., 1995), probably due to the huge surface available
for adsorption as well as the relatively high content of asphaltenes in the heavy oil
sample.
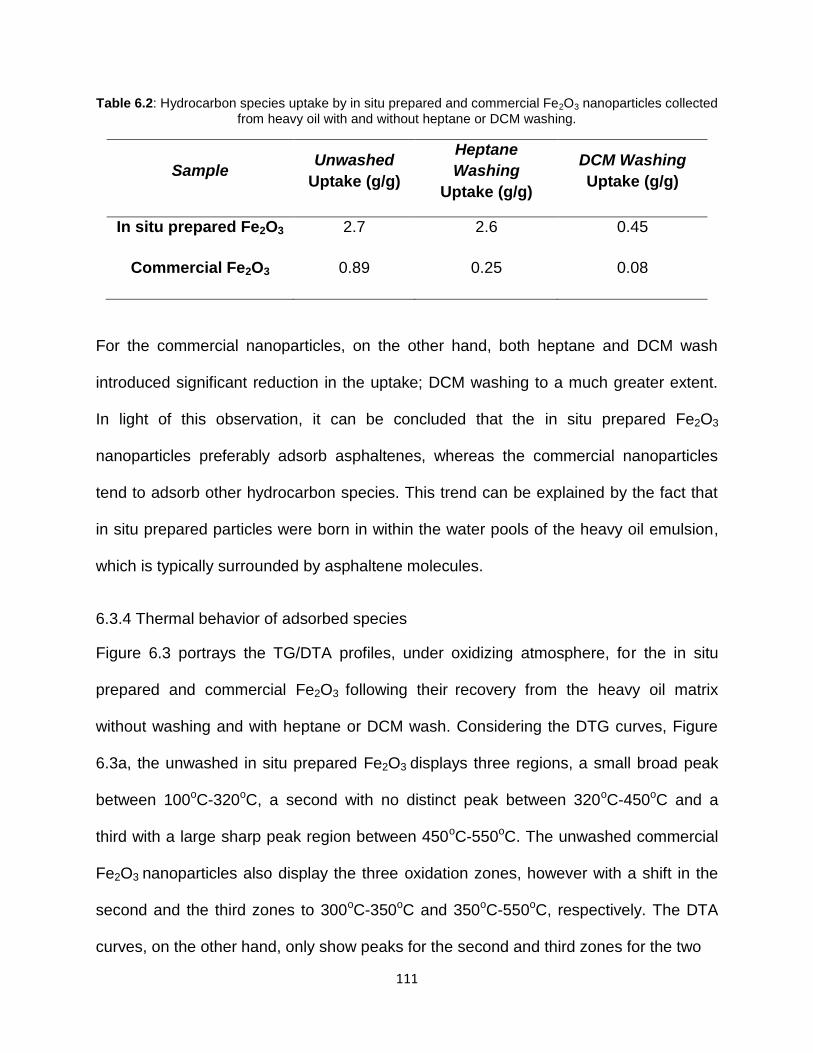
111
Table 6.2: Hydrocarbon species uptake by in situ prepared and commercial Fe2O3 nanoparticles collected
from heavy oil with and without heptane or DCM washing.
Sample Unwashed
Uptake (g/g)
Heptane
Washing
Uptake (g/g)
DCM Washing
Uptake (g/g)
In situ prepared Fe2O3 2.7 2.6 0.45
Commercial Fe2O3 0.89 0.25 0.08
For the commercial nanoparticles, on the other hand, both heptane and DCM wash
introduced significant reduction in the uptake; DCM washing to a much greater extent.
In light of this observation, it can be concluded that the in situ prepared Fe2O3
nanoparticles preferably adsorb asphaltenes, whereas the commercial nanoparticles
tend to adsorb other hydrocarbon species. This trend can be explained by the fact that
in situ prepared particles were born in within the water pools of the heavy oil emulsion,
which is typically surrounded by asphaltene molecules.
6.3.4 Thermal behavior of adsorbed species
Figure 6.3 portrays the TG/DTA profiles, under oxidizing atmosphere, for the in situ
prepared and commercial Fe2O3 following their recovery from the heavy oil matrix
without washing and with heptane or DCM wash. Considering the DTG curves, Figure
6.3a, the unwashed in situ prepared Fe2O3 displays three regions, a small broad peak
between 100oC-320oC, a second with no distinct peak between 320oC-450oC and a
third with a large sharp peak region between 450oC-550oC. The unwashed commercial
Fe2O3 nanoparticles also display the three oxidation zones, however with a shift in the
second and the third zones to 300oC-350oC and 350oC-550oC, respectively. The DTA
curves, on the other hand, only show peaks for the second and third zones for the two

112
Figure 6.3:TG/DTA plot of rate of (a) mass loss, and (b) heat flow versus temperature for in-situ Fe2O3
and commercial Fe2O3 in heavy oil matrix unwashed and washed with heptane and DCM. Heating rate = 10◦C/min;airflow=100cm
3/min.

113
nanoparticles. In light of results on the effect of washing, differences in thermal behavior
for in situ prepared and commercial particles can be attributed in part to the difference in
nature of the adsorbed species. When it comes to the in situ prepared particles, and
given the fact that 17 layers of asphaltenes were found to adsorb onto the particles, the
results can be explained by our previous model of sequential oxidation of adsorbed
layers (Abu Tarboush and Husein, 2012b). This huge number of adsorbed asphaltenes
layers, following heptane washing, can be explained by the fact that these adsorbed
asphaltenes are adsorbed as groups of aggregates. Accordingly, the outer most layers
react at a lower temperature as a consequence of better exposure to the surrounding
atmosphere. This explanation excludes catalytic role of the nanoparticles, since it
implies that asphaltenes far from possible catalytic sites oxidize first as a consequence
of better exposure to the surrounding atmosphere. This is in particular true, since heat
flow profiles of Figure 6.3b exhibit exothermic trend only.
While heptane washing did not impact the uptake for the in situ prepared Fe2O3
nanoparticles, it resulted in a disappearance of the peak between 100oC-300oC,
maintained a peak between 300oC-400oC and the appearance of a new peak at 450oC.
In the meantime, the third region peak shifts toward higher oxidation temperature,
~520oC. The heat flow profile of Figure 6.3b reflected the same oxidation zones. These
changes in the thermal behavior of adsorbed asphaltenes can be explained within the
context of sequential oxidation of adsorbed asphaltenes with a probable decrease in the
surface area as a result of heptane washing. Given the corresponding mass loss in the
two zones, it can be seen that two oxidation peaks appear clearly in both zones which
was not the case before dividing the heat flow over the corresponding mass loss where

114
only one major oxidation peak appeared in the second oxidation zone, as shown in
Figure 6.4. Heptane washing for the commercial Fe2O3 portrayed two regions located
between 300oC-450oC and 450oC-520oC, while the peak between 100oC-300oC
disappeared. The disappearance of the peak between 100oC-300oC can be explained
as light hydrocarbons which were washed away with heptane or a reduction in the
overall surface area in a similar fashion to the above explanation.
Interestingly, DCM washing for the in situ prepared Fe2O3 results in a trend where two
broad regions can be identified, the first region between 100 oC-300 oC and the second
region between 300-530oC. This pattern represents a middle pattern between the
unwashed and heptane washed commercial Fe2O3. There is a slight peak that appears
at 550oC which can be attributed to carbonaceous residue (Ciajolo and Barbella, 1984).
For the commercial Fe2O3 following washing with DCM the produced pattern match to a
high extent the trend seen for the heptane washed commercial Fe2O3 with smaller peak
size.

115
Figure 6.4: DTAplotofheatflowversustemperature.Heatingrate=10◦C/min;airflow=100cm3/min

116
Another presentation for the uptake of different adsorbents/washing medium can be
provided by plotting the mass loss per unit area of the adsorbent versus temperature.
Figure 6.5 represents such a plot, which reflects the potency of the nanoparticle additive
as an adsorbent and promoter for the oxidation. Figure 6.5 supports the findings that the
performance of in-situ prepared Fe2O3 nanoparticles significantly surpasses the
performance of commercial Fe2O3 nanoparticles. DCM washed in situ prepared Fe2O3
and heptane washed commercial Fe2O3 show very similar performance, since they both
have comparable uptake of asphaltenes. Interestingly is the DCM washed commercial
Fe2O3 which shows a comparable curve compared to unwashed one. In fact this can be
explained due to the reduction in surface area associated with DCM washing which
means that part of the nanoparticles are being lost.

117
Figure 6.5: Mass loss per unit area of additive versus temperature for in situ prepared and commercial
Fe2O3 nanoparticles collected from heavy oil without washing and with heptane and DCM washing.

118
6.3.5 Effect of nanoparticles concentration
The effect of the concentration of the in situ prepared as well as the commercial Fe2O3
nanoparticles on hydrocarbon uptake was investigated by increasing the nanoparticle
concentration from 1,000 ppm to 10,000 ppm. Figure 6.6 shows the uptake results.
Increasing the concentration of the in situ prepared nanoparticles from 1,000 ppm to
5,000 ppm resulted in decreasing the hydrocarbons uptake roughly 20%. This decrease
can be attributed to the fact that at lower nanoparticles concentration i.e. 1000 ppm
most of the nanoparticles surfaces are available for adsorption and this will lead to high
uptake values and the nanoparticle will grow in size as a result of continuous adsorption
of hydrocarbons, consequently, the nanoparticle will be destabilized and will be easier
to separate from the oil matrix (Al-As' ad, 2013; Crittenden et al., 2005; Stumm and
O'Melia, 1968). On the other hand, increasing the nanoparticles concentration to 5000
ppm reduces the number of hydrocarbons molecules per nanoparticle which will
decrease the uptake per single nanoparticle and as a result the nanoparticle size will be
smaller than the low concentration case, therefore, the resultant hydrocarbons/
nanoparticle complex will be more stable (small nanoparticle size) in the oil matrix and
this will result in more difficult separation of the hydrocarbons/ nanoparticle complex
from the oil matrix (Al-As' ad, 2013; Crittenden et al., 2005; Stumm and O'Melia, 1968).
Further increase in the nanoparticles concentration will result in having a more severe
aggregation be it for either nanoparticles itself or nanoparticles/hydrocarbons complex.
In the first hypothesis, nanoparticles aggregates will grow in size to a limit that allow
them to settle and while settling those aggregates will sweep out and adsorb more
hydrocarbons (Al-As' ad, 2013; Crittenden et al., 2005; Stumm and O'Melia, 1968). In
the second hypothesis, nanoparticles/hydrocarbons complex will start aggregation

119
resulting in having bigger size aggregates and those aggregates will start settling and
involve in sweeping behavior which result in significant increase in the hydrocarbons
uptake as shown in Figure 6.6.
For the commercial nanoparticles, on the other hand, increasing particle concentration
from 1,000 ppm to 5,000 ppm did not change the uptake, but once the nanoparticles
concentration was doubled from 5,000 to 10,000 ppm, significant decrease in the
uptake was observed. This decrease in the uptake can be attributed to higher degree of
nanoparticles aggregation, which commercial nanoparticles usually encountered, than
in situ prepared ones. Aggregated particles contribute very little to adsorption and thus
present an ineffective mass contributing only to the denominator of uptake calculation.

120
Figure 6.6: Effect of in situ prepared and commercial Fe2O3 nanoparticle concentration on uptake. Note:
some of the error bars are too small to appear.
0
0.5
1
1.5
2
2.5
1000 5000 10000
Hyd
roca
rbo
n s
pe
cie
s u
pta
ke (
g/g)
Fe2O3 Concentration (ppm)
In-situ prepared Fe2O3 Commercial Fe2O3

121
6.3.6 The effect of heat treatment and water content on uptake by commercial Fe2O3 nanoparticles
In comparison with commercial Fe2O3, in situ prepared Fe2O3 nanoparticles exhibited
much higher adsorption capacity as evident in Table 1. In order to account for any role
the heating step while preparing the in situ nanoparticles may have on the hydrocarbon
species uptake, commercial Fe2O3 nanoparticles were mixed and heat treated with the
heavy oil matrix at the same temperature for the same time duration. Then, the oil
matrix was left to cool down to 25oC. The uptake after 24 h of equilibration time at 25oC
was 0.75 g/g, which is close to the uptake value reported in Table 1 for commercial
Fe2O3 nanoparticles added to the oil matrix following the heat treatment, 0.89 g/g.
Therefore, it appears that heat treatment has no significant effect on hydrocarbon
uptake of the commercial Fe2O3. Interestingly, these findings are in line with our
previous results for NiO nanoparticles (Abu Tarboush and Husein, 2012b).
The effect of adding water to the heavy oil matrix was also studied, since heating
in the presence of water promotes aquathermolysis reactions (Yi et al., 2009), which
may result in different hydrocarbon species. Insignificant differences were found
between the sample containing water and the one without water as can be seen in
Table 3. With respect to commercial nanoparticle addition sequence, the presence of
water slightly reduced the uptake for the sample where the commercial Fe2O3
nanoparticles were added to the heavy oil prior to heat treatment. Similar trend was
reported by Dean and McAtee (1986) who found that water pre-sorbs on the surface of
the clays leading to reduced asphaltenes adsorption. They also reported that adsorption
experiments conducted at elevated temperatures between 40oC-82°C didn’t
considerably change adsorption data. In another study, (Bantignies et al., 1998) used

122
FTIR and X-ray absorption spectroscopy to characterize the absorption phenomenon of
asphaltenes on kaolinite, at microscopic level, in the presence and absence of water.
They reported that when asphaltenes adsorbed on kaolinite in presence of water, FTIR
results showed that the hydroxyl group (OH) surface of the kaolinite is sensitive to
contact with asphaltenes. They also found that asphaltenes adsorption process involved
in the presence of water is different than the one taking place in the absence of water.
Table 6.3: Effect of heat treatment and water content on the hydrocarbon species uptake onto
commercial Fe2O3.
Uptake (g/g)
Commercial Fe2O3 added
prior to heat treatment
Uptake (g/g)
Commercial Fe2O3 added
following heat treatment
With water 0.55 ± 0.06 0.76 ± 0.12
Without water 0.63± 0.1 0.87 ± 0.2

123
Chapter Seven: Conclusions, Contributions, and Recommendations
7.1 Conclusions
The current study stemmed from a hypothesis that in situ prepared nanoparticles better
interact and are better stabilized by the mother solution. Consequently, once formed in-
situ in heavy oil, these particles should, in principle, show higher asphaltenes
adsorption. Nickel oxide and iron oxide nanoparticles were targeted in this study
following literature reports on their high adsorption affinity and catalytic activity, and a
representative heavy oil matrix formed by mixing Arabian vacuum residue and vacuum
gasoilwasusedasthemother“solution”.
Dispersed nickel oxide nanoparticles of 129 nm mean diameter were successfully
prepared and characterized, and their adsorption kinetics and asphaltenes uptake were
determined. FTIR and heptane washing results confirmed that the adsorbed species are
indeed asphaltenes and uptake in the order of 2.8 g asphaltenes/g nanoparticles was
reported. This uptake is unsurpassed and is reflective of the intimate interaction with
heavy oil matrix. Commercial NiO nanoparticles of the same size range, subject to the
same experimental conditions, only adsorbed 15% of the above value. The fact that
asphaltenes, rather than other species, were adsorbed is important for establishing the
multilayer adsorption, which implies asphaltenes oxidize in the outer layers first without
experiencing any catalytic effect. Thermal analysis for the adsorbed asphaltenes onto in
situ prepared NiO nanoparticles has been also conducted. This study detailed the
oxidation of mono and multilayer adsorbed asphaltenes onto NiO nanoparticles.
Contrary to previous literature, observations made here led to the conclusion that NiO
nanoparticles did not have catalytic activity toward oxidation of adsorbed species, but

124
rather, limited their role to better exposing the adsorbed asphaltenes to the surrounding
environment. Findings pertaining to oxidation of a sample of small mass of virgin
asphaltenes, adsorbed asphaltenes onto in-situ prepared and commercial NiO
nanoparticles from heavy oil and/or toluene media with and without DCM washing all
supported the sequential mass loss of adsorbed layers. The fact that the outer layers,
farther from the active sites, reacted first, supported surface exposure as opposed to
catalytic role of the nanoparticle additive. Activation energy calculated following Coats-
Redfern method, which was used by earlier studies to demonstrate catalytic role of
metal oxide nanoparticles, revealed lower activation energy within the context of
sequential oxidation hypothesis.
The thermal behavior of crude oils reflects multi components undergoing multiple
reactions and, hence, composition-dependent TG/DTA profiles. It does not necessarily
imply that the thermal behavior of a given constituent, e.g. asphaltenes, is crude
dependent. In addition, the fact that multiple reactions are encountered mandates that
specific heat of reactions, e.g. LTO, HTO, etc. are calculated by dividing by the mass
loss pertinent to a given temperature zone. Only then reliable comparison between
major and minor oxidation zones can be made. Moreover, equations employing direct
proportionality between the rate of conversion and the fraction available for reaction, i.e.
n= 1, to calculate activation energy imply no mass transfer limitations and assume a
lumped system approach. If such an assumption is acceptable for small amount of
adsorbed asphaltenes onto nanoparticles, it should not be extended to virgin
asphaltenes. Moreover, it is essential to account for mass loss due to adsorbent

125
nanoparticles while calculating the fraction of material converted,, independent of the
method chosen to calculate activation energy from thermogravimetry data.
Results from iron oxide investigation were in line of the above conclusions and support
a model of sequential oxidation of adsorbed asphaltenes, at least when it comes to in-
situ prepared nanoparticles. Other hydrocarbons were found to be adsorbed onto
commercial nanoparticles, as per results obtained from heptane washing. Dispersed
iron oxide nanoparticles of 63±5 nm were successfully prepared and characterized
using XRD, and TEM. Surface area evaluated by BET method following degassing the
sample at 200oC was found to be significantly lower than the one evaluated at 300oC.
Degassing temperature has a major effect on the surface area due to the fact that
heating step will remove part of the adsorbed/deposited hydrocarbons which cause the
formation of internal pores within the agglomerated particles. SEM analysis for non-heat
treated and heat treated, at 300°C, in-situ prepared Fe2O3 show that heat treatment
caused more resolution and provided more definition of the capped nanoparticles with
the agglomerated cluster. The difference between the heat treated and non-heat treated
samples supports the adsorption model in which hydrocarbons were adsorbed onto the
nanoparticles and not vice versa.
Their adsorption kinetics and asphaltenes uptake were determined and uptake in the
order of 2.7 g asphaltenes/g nanoparticles was reported. Meanwhile, commercial Fe2O3
nanoparticles of the same size range and subject to the same experimental conditions
only adsorbed 25% of the above value. In addition to asphaltenes adsorption,
commercial nanoparticles also adsorbed other types of hydrocarbons.

126
7.2 Contributions
The original contributions to knowledge from this study can be summarized as follows:
1. Expanding on a method originally used for NiO nanoparticle formation to prepare
Fe2O3 nanoparticles and identifying the relevant conditions leading to the iron oxide
nanoparticle product. This method is based on (w/o) microemulsion approach and
leads to dispersed metal oxide nanoparticle formation from inexpensive precursors
and using these in situ prepared NiO and Fe2O3 nanoparticles as adsorbents for
asphaltenes.
2. The amount of the adsorbed asphaltenes is at least 10 times higher than the
reported data for conventional adsorbents.
3. Geometrical surface area, calculated from particle size analysis using TEM, is the
most appropriate method to calculate the surface area of the dispersed
nanoparticles, as long as particle aggregation upon collection does not limit the
resolution.
4. Thermal behavior of the adsorbed species, asphaltenes/hydrocarbons, onto NiO and
Fe2O3 nanoparticles was investigated under an oxidizing atmosphere.
5. Oxidation of adsorbed asphaltenes onto nanoparticles is enhanced by surface rather
than a catalytic effect.
6. Asphaltenes adsorption model was investigated and it was confirmed that
asphaltenes are being adsorbed onto the nanoparticles rather than the other way
around.
7. Studying the effect of washing on the thermal behaviour of the adsorbed
asphaltenes, i.e. the removal of any deposited and precipitated asphaltenes.
8. Examine the effect of sample size on thermal behaviour of asphaltenes.

127
7.3 Recommendations
Based on the results of this research, the following recommendations can be suggested
for further study on using ultradispersed nanoparticles in heavy oil upgrading:
1. Investigate the performance of the in situ prepared nanoparticles toward
asphaltenes pyrolysis and gasification.
2. Study the effect of in situ prepared nanoparticles on heavy oil upgrading.
3. Investigate the possibility for using the in situ prepared nanoparticles as precipitation
inhibitor.
4. Evaluate the quality of the used nanoparticles and test the possibility to re-use the
spent particles.
5. In situ prepared nanoparticles are recommended to be used as adsorbent instead of
the commercial one.
6. Explore the possibility of forming in situ nanoparticles at relatively shorter time and
lower temperature and investigate their adsorption capacity toward asphaltenes and
other hydrocarbons.

128
References
Abdrabo, A. E., & Husein, M. M. (2012). Method for converting demetallization products into dispersed metal oxide nanoparticles in heavy oil. Energy & Fuels, 26, 810-815.
Abdallah, W. A., & Taylor, S. D. (2007). Surface characterization of adsorbed asphaltene on a stainless steel surface. Nuclear Instruments and Methods in Physics Research Section B: Beam Interactions with Materials and Atoms, 258, 213-217.
Abu Tarboush, B. J., & Husein, M. M. (2012). Adsorption of asphaltenes from heavy oil onto in situ prepared NiO nanoparticles. J Colloid Interface Sci, 378, 64-69.
Abu Tarboush, B. J., & Husein, M. M. (2012). Oxidation of asphaltenes adsorbed onto NiO nanoparticles. Applied Catalysis A: General, 445–446, 166-171.
Acevedo, S., Ranaudo, M. A., Escobar, G., Gutierrez, L., & Ortega, P. (1995). Adsorption of asphaltenes and resins on organic and inorganic substrates and their correlation with precipitation problems in production well tubing. Fuel, 74, 595-598.
Acevedo,S.,Ranaudo,M.a.A., arc a,C., Castillo, J., Fernández, A., Caetano, M., et al. (2000). Importance of asphaltene aggregation in solution in determining the adsorption of this sample on mineral surfaces. Colloids and Surfaces A: Physicochemical and Engineering Aspects, 166, 145-152.
Al-As' ad, A. (2013). Treatment of SAGD water using low coagulant dose and Fenton oxidation. Department of Chemical and Petroleum Engineering, University of Calgary, Calgary, Alberta.
Alboudwarej, H., Jakher, R. K., Svrcek, W. Y., & Yarranton, H. W. (2004). Spectrophotometric Measurement of Asphaltene Concentration. Petroleum Science and Technology, 22, 647-664.
Alboudwarej, H., Pole, D., Svrcek, W. Y., & Yarranton, H. W. (2005). Adsorption of asphaltenes on metals. Industrial & Engineering Chemistry Research, 44, 5585-5592.
Alemma, V., Lwanski, P., Nali, M., Scotti, R., & Montanari, L. (1995). Structural characterization of asphaltenes of different origins. Energy & Fuels, 9, 225-230.
Alexander, J.D., Martin, W. Land Dew, J.N. (1962). Factors affecting fuel availability and composition during in –situ combustion. Journal of Petroleum Thecnology, 14, 1154-1164.
Ali, M. F., & Saleem, M. (1991). Thermal decomposition of saudi crude oil asphaltenes. Fuel Science and Technology International, 9, 461-484.
Al-Sahhaf, T. A., Fahim, M. A., & Elkilani, A. S. (2002). Retardation of asphaltene precipitation by addition of toluene, resins, deasphalted oil and surfactants. Fluid phase equilibria, 194, 1045-1057.
Andersen, S. I., & Speight, J. G. (2001). Petroleum resins: Separation, character, and role in petroleum. Petroleum science and technology, 19, 1-34.
Andreatta, G., Bostrom, N., & Mullins, O. C. (2005). High-Q ultrasonic determination of the critical nanoaggregate concentration of asphaltenes and the critical micelle concentration of standard surfactants. Langmuir, 21, 2728-2736.

129
Arteaga-Larios, F., Sheu, E. Y., & Pérez, E. (2004). Asphaltene flocculation, precipitation, and liesegang ring. Energy & Fuels, 18, 1324-1328.
Banerjee, D. K., Laidler, K. J., Nandi, B. N., & Patmore, D. J. (1986). Kinetic studies of coke formation in hydrocarbon fractions of heavy crudes. Fuel, 65, 480-484.
Bantignies, J.-L., Cartier dit Moulin, C., & Dexpert, H. (1998). Asphaltene adsorption on kaolinite characterized by infrared and X-ray absorption spectroscopies. Journal of Petroleum Science and Engineering, 20, 233-237.
Bartholomew C.H., Farrauto R.J., Introduction fundamental catalytic phenomena in fundamentals of industrial catalytic processes, 2nd ed., Wiley-Interscience, Hoboken, NJ, 2006.
Barzin, Y, R G Moore, S A Mehta, D G Mallory, M Ursenbach, and F Tabasinejad. "Role of vapor phase in oxidation/combustion kinetics of high-pressure air injection (HPAI)." Society of Petroleum Engineers (SPE), 2010: Florence, Italy.
Bouhadda, Y., Bormann, D., Sheu, E., Bendedouch, D., Krallafa, A., & Daaou, M. (2007). Characterization of Algerian Hassi-Messaoud asphaltene structure using Raman spectrometry and X-ray diffraction. Fuel, 86, 1855-1864.
Boutonnet, M., Kizling, J., Stenius, P., & Maire, G. (1982). The preparation of monodisperse colloidal metal particles from microemulsions. Colloids and Surfaces, 5(3), 209-225.
Buckley, J. S., Hirasaki, G. J., Liu, Y., Von Drasek, S., Wang, J. X., & Gill, B. S. (1998). Asphaltene precipitation and solvent properties of crude oils. Petroleum Science and Technology, 16, 251-285.
Buenrostro-Gonzalez, E., Lira-Galeana, C., Gil-Villegas, A., & Wu, J. (2004). Asphaltene precipitation in crude oils: Theory and experiments. AIChE Journal, 50, 2552-2570.
Bumajdad, A., Zaki, M. I., Eastoe, J., & Pasupulety, L. (2004). Microemulsion-based synthesis of CeO2 powders with high surface area and high-temperature stabilities. Langmuir, 20(25), 11223-11233.
Burger, J G, and Sahuquet B C. (1972). Chemical Aspects of In-Situ Combustion - Heat of Combustion and Kinetics. SPE, 12, 5, 410-422.
Calemma, V., Iwanski, P., Nali, M., Scotti, R., & Montanari, L. (1995). Structural characterization of asphaltenes of different origins. Energy & Fuels, 9, 225-230.
Carbognani, L., Carbognani-Arambarri, L., Lopez-Linares, F., & Pereira-Almao, P. (2011). Suitable Density Determination for heavy hydrocarbons by solution pycnometry: virgin and thermal cracked athabasca vacuum residue fractions. Energy & Fuels, 25, 3663-3670.
Carbognani, L., González, M. F., Lopez-Linares, F., Sosa Stull, C., & Pereira-Almao, P. (2008). Selective adsorption of thermal cracked heavy molecules. Energy & Fuels, 22, 1739-1746.
Carbognani, L., Gonzalez, M. F., & Pereira-Almao, P. (2007). Characterization of athabasca vacuum residue and Its visbroken products. stability and fast hydrocarbon group-type distributions. Energy & Fuels, 21, 1631-1639.
Carlos da Silva Ramos, A., Haraguchi, L., Notrispe, F. R., Loh, W., & Mohamed, R. S. (2001). Interfacial and colloidal behavior of asphaltenes obtained from Brazilian crude oils. Journal of Petroleum Science and Engineering, 32, 201-216.
130
Carnahan, N. F. (2000). Precipitation of asphaltenes in heavy oil and tar sands.Developments in petroleum science, 40, 319-333.
Ciajolo, A., & Barbella, R. (1984). Pyrolysis and oxidation of heavy fuel oils and their fractions in a thermogravimetric apparatus. Fuel, 63, 657-661.
Chen, J. P., & Wang, L. (2004). Characterization of metal adsorption kinetic properties in batch and fixed-bed reactors. Chemosphere, 54, 397-404.
Christian, P., Kammer, F., Baalousha, M., & Hofmann, T. (2008). Nanoparticles: structure, properties, preparation and behaviour in environmental media. Ecotoxicology, 17, 326-343.
Coats, A. W., & Redfern, J. P. (1964). Kinetic parameters from thermogravimetric data. [10.1038/201068a0]. Nature, 201, 68-69.
Cortés, F. B., Mejía, J. M., Ruiz, M. A., Benjumea, P., & Riffel, D. B. (2012). Sorption of asphaltenes onto nanoparticles of nickel oxide supported on nanoparticulated silica gel. Energy & Fuels, 26, 1725-1730.
Crittenden, J.; Trussell, R.; Hand, D.; Howe, K.; Tchobanoglous, G.Water treatment: principles and design, 2nd ed.; John Wiley & Sons: Hoboken, NJ, 2005.
Danielsson, I., & Lindman, B. (1981). The definition of microemulsion. Colloids and Surfaces, 3(4), 391-392.
Dean, K. R., & McAtee Jr, J. L. (1986). Asphaltene adsorption on clay. Applied Clay Science, 1, 313-319.
Del Bianco, A., Panariti, N., Di Carlo, S., Elmouchnino, J., Fixari, B., & Le Perchec, P. (1993). Thermocatalytic hydroconversion of heavy petroleum cuts with dispersed catalyst. Applied Catalysis A: General, 94, 1-16.
Dickie, J. P., & Yen, T. F. (1967). Macrostructures of the asphaltic fractions by various instrumental methods. Analytical Chemistry, 39, 1847-1852.
Drici, O., and Vossoughi, S. (1985). Study of the surface area effect on crude oil combustion by thermal analysis techniques. Journal of petroleum technology, 37(4), 731-735.
Drici, O., & Vossoughi, S. (1987). Catalytic effect of heavy metal oxides on crude oil combustion. SPE Reservoir Engineering, 2(4), 591-595.
Drits, V. A., Srodon, J., & Eberl, D. D. (1997). XRD measurement of mean crystallite thickness of illite and illite/smectite; reappraisal of the Kubler index and the Scherrer equation. Clays and Clay Minerals, 45, 461-475.
Ekholm, P., Blomberg, E., Claesson, P., Auflem, I. H., Sjöblom, J., & Kornfeldt, A. (2002). A Quartz crystal microbalance study of the adsorption of asphaltenes and resins onto a hydrophilic surface. Journal of Colloid and Interface Science, 247, 342-350.
Eriksson, S., Nylén, U., Rojas, S., & Boutonnet, M. (2004). Preparation of catalysts from microemulsions and their applications in heterogeneous catalysis. Applied Catalysis A: General, 265(2), 207-219.
Espinat, D., Ravey, J. C., Guille, V., Lambard, J., Zemb, T., & Cotton, J. P. (1993). Colloidal macrostructure of crude oil studied by neutron and X-ray small angle scattering techniques. Journal De Physique. IV : JP, 3, 181-184.
Evdokimov, I. N., Eliseev, N. Y., & Akhmetov, B. R. (2003). Assembly of asphaltene molecular aggregates as studied by near-UV/visible spectroscopy: I. Structure of
131
the absorbance spectrum. Journal of Petroleum Science and Engineering, 37, 135-143.
Eyssautier, J. l., Levitz, P., Espinat, D., Jestin, J., Gummel, J. r. m., Grillo, I., et al. (2011). Insight into asphaltene nanoaggregate structure inferred by small angle neutron and X-ray scattering. The Journal of Physical Chemistry B, 115, 6827-6837.
Fang, G., Li, H., Yang, F., Liu, X., & Wu, S. (2009). Preparation and characterization of nano-encapsulated n-tetradecane as phase change material for thermal energy storage. Chemical Engineering Journal, 153, 217-221.
Fathi, M. M., & Pereira-Almao, P. (2011). Catalytic aquaprocessing of arab light vacuum residue via short space times. Energy & Fuels, 25, 4867-4877.
Fathi, M. M., & Pereira-Almao, P. (2012). Kinetic modeling of arab light vacuum residue upgrading by aquaprocessing at high space velocities. Industrial & Engineering Chemistry Research, 52, 612-623.
Firoozabadi, A., Thermodynamics of hydrocarbon reservoirs, McGraw-Hill, New York (1999).
Flynn, J.H. (1997).The ‘Temperature Integral’— Its use and abuse. Thermochimica Acta, 300, 83-92.
Gold, P. I. (1980). Thermal analysis of exothermic processes in coal pyrolysis. Thermochimica Acta, 42, 135-152.
Goual, L. (2012). "Petroleum asphaltenes" in "Crude Oil Emulsions- Composition Stability and Charecterization",Abdul-Raouf, M. (Ed). ISBN: 978-953-51-0220-5, InTech, Available from: http://www.intechopen.com/books/crude-oil-emulsions-composition-stability-and-charecterization/petroleum-asphaltenes.
Goual, L., & Firoozabadi, A. (2002). Measuring asphaltenes and resins, and dipole moment in petroleum fluids. AIChE Journal, 48, 2646-2663.
Goual, L., & Firoozabadi, A. (2004). Effect of resins and DBSA on asphaltene precipitation from petroleum fluids. AIChE journal, 50, 470-479.
Goual, L., Horváth-Szabó, G., Masliyah, J. H., & Xu, Z. (2005). Adsorption of bituminous components at oil/water interfaces investigated by quartz crystal microbalance: implications to the stability of water-in-oil emulsions. Langmuir, 21, 8278-8289.
Goual, L., Sedghi, M., Zeng, H., Mostowfi, F., McFarlane, R., & Mullins, O. C. (2011). On the formation and properties of asphaltene nanoaggregates and clusters by DC-conductivity and centrifugation. Fuel, 90, 2480-2490.
Gray, M. R., Assenheimer, G., Boddez, L., & McCaffrey, W. C. (2004). Melting and fluid behavior of asphaltene filmsat200−500°C.Energy & Fuels, 18, 1419-1423.
Groenzin, H., & Mullins, O. C. (2000). Molecular size and structure of asphaltenes from various sources. Energy & Fuels, 14, 677-684.
Guo, A., Zhang, X., & Wang, Z. (2008). Simulated delayed coking characteristics of petroleum residues and fractions by thermogravimetry. Fuel Processing Technology, 89, 643-650.
Hammami, A., Phelps, C. H., Monger-McClure, T., & Little, T. M. (1999). Asphaltene precipitation from live oils: Anexperimental investigation of onset conditions and reversibility. Energy & Fuels, 14, 14-18.

132
Hayashi, H., Kishida, M., & Wakabayashi, K. (2002). Metal-support interaction and catalysis of the catalysts prepared using microemulsion. Catalysis Surveys from Asia, 6(1-2), 9-17.
Huang, J. (2006). Thermal degradation of asphaltene and infrared characterization of its degraded fractions. Petroleum Science and Technology, 24, 1089-1095.
Husein, M. M., & Nassar, N. N. (2008). Nanoparticle preparation using the single microemulsions scheme. Current Nanoscience, 4, 370-380.
Husein, M. M., Patruyo, L., Pereira-Almao, P., & Nassar, N. N. (2010). Scavenging H(2)S((g)) from oil phases by means of ultradispersed sorbents. J Colloid Interface Sci, 342, 253-260.
Indrijarso, S., Oklany, J. S., Millington, A., Price, D., & Hughes, R. (1996). Thermogravimetric studies of systems pertinent to the in-situ combustion process for enhanced oil recovery. Part 1. Development of a high-pressure thermobalance. Thermochimica Acta, 277, 41-52.
Jia, H., Zhao, J. Z., Pu, W. F., Liao, R., & Wang, L. L. (2012). The influence of clay minerals types on the oxidation thermokinetics of crude oil. Energy Sources, Part A: Recovery, Utilization, and Environmental Effects, 34, 877-886.
Karan, K., Hammami, A., Flannery, M., & Artur Stankiewicz, B. (2003). Evaluation of asphaltene instability and a chemical control during production of live oils. Petroleum Science and Technology, 21, 629-645.
Karacan, O., & Kok, M. V. (1997). Pyrolysis analysis of crude oils and their fractions. Energy & Fuels, 11, 385-391.
Kok, M. V. (1993). Use of thermal equipment to evaluate crude oils. Thermochimica Acta, 214, 315-324.
Kok, M. V., & Gundogar, A. S. (2013). DSC study on combustion and pyrolysis behaviors of Turkish crude oils. Fuel Processing Technology, 116, 110-115.
Kök, M., and Iscan, A. (2001). Catalytic effects of metallic additives on the combustion properties of crude oils by thermal analysis techniques. Journal of Thermal Analysis and Calorimetry, 64, 1311-1318.
Kök, M. V., & Pamir, M. R. (1995). Pyrolysis and combustion studies of fossil fuels by thermal analysis methods. Journal of Analytical and Applied Pyrolysis, 35, 145-156.
Koots, J. A., & Speight, J. G. (1975). Relation of petroleum resins to asphaltenes. Fuel, 54, 179-184.
Kopsch, H. (1994). On the thermal behavior of petroleum asphaltenes. Thermochimica Acta, 235, 271-275.
Langevin, D., Poteau, S., Hénaut, I., & Argillier, J., F. (2004). Propriétés des émulsions de pétrole brut et leurs applications au transport des bruts lourds. Oil & Gas Science and Technology - Rev. IFP, 59, 511-521.
León, O., Rogel, E., Espidel, J., & Torres, . (1999). Asphaltenes: structural characterization, self-association, and stability behavior. Energy & Fuels, 14, 6-10.
Li, D., Hong, B., Fang, W., Guo, Y., & Lin, R. (2010). Preparation of well-dispersed silver nanoparticles for oil-based nanofluids. Industrial & Engineering Chemistry Research, 49, 1697-1702.

133
Li, S., Liu, C., Que, G., Liang, W., & Zhu, Y. (1997). A study of the interactions responsible for colloidal structures in petroleum residua. Fuel, 76, 1459-1463.
Liao, Z., Zhou, H., Graciaa, A., Chrostowska, A., Creux, P., & Geng, A. (2005). Adsorption/occlusion characteristics of asphaltenes: Some implication for asphaltene structural features. Energy & Fuels, 19, 180-186.
Liu, C., Zhu, C., Jin, L., Shen, R., & Liang, W. (1999). Step by step modeling for thermal reactivities and chemical compositions of vacuum residues and their SFEF asphalts. Fuel Processing Technology, 59, 51-67.
Long, R. B., & Speight, J. G. (1989). Studies in petroleum composition development of a compositional map for various feedstocks. Oil & Gas Science and Technology - Rev. IFP, 44, 205-217.
Luo, P., & Gu, Y. (2007). Effects of asphaltene content on the heavy oil viscosity at different temperatures. Fuel, 86, 1069-1078.
Magual, A., Horváth-Szabó, G., & Masliyah, J. H. (2005). Acoustic and electroacoustic spectroscopy of water-in-diluted-bitumen emulsions. Langmuir, 21, 8649-8657.
Manna, A., Imae, T., Iida, M., & Hisamatsu, N. (2001). Formation of silver nanoparticles from a n-hexadecylethylenediamine silver nitrate complex. Langmuir, 17, 6000-6004.
Mansoori, G. A., Vazquez, D., & Shariaty-Niassar, M. (2007). Polydispersity of heavy organics in crude oils and their role in oil well fouling. Journal of Petroleum Science and Engineering, 58, 375-390.
Maqbool, T., Balgoa, A. T., & Fogler, H. S. (2009). Revisiting asphaltene precipitation from crude oils: A case of neglected kinetic effects. Energy & Fuels, 23, 3681-3686.
Marczewski, A. W., & Szymula, M. (2002). Adsorption of asphaltenes from toluene on mineral surface. Colloids and Surfaces A: Physicochemical and Engineering Aspects, 208, 259-266.
Marlow, B. J., Sresty, G. C., Hughes, R. D., & Mahajan, O. P. (1987). Colloidal stabilization of clays by asphaltenes in hydrocarbon media. Colloids and Surfaces, 24, 283-297.
Martinez Correa, S. L. (2013). Analysis of athabasca bitumen and its fractions using high pressure thermogravimetry–evolved gas thermal techniques.
McLean, J. D., & Kilpatrick, P. K. (1997). Effects of asphaltene solvency on stability of water-in-crude-oil emulsions. Journal of Colloid and Interface Science, 189, 242-253.
Mohammadi, M., Akbari, M., Fakhroueian, Z., Bahramian, A., Azin, R., & Arya, S. (2011). Inhibition of asphaltene precipitation by TiO2, SiO2, and ZrO2 Nanofluids. Energy & Fuels, 25, 3150-3156.
Morgan, P. A., Robertson, S. D., & Unsworth, J. F. (1986). Combustion studies by thermogravimetric analysis: 1. Coal oxidation. Fuel, 65, 1546-1551.
Moschopedis, S. E., Parkash, S., & Speight, J. G. (1978). Thermal decomposition of asphaltenes. Fuel, 57, 431-434.
Moschopedis, S. E., & Speight, J. G. (1976). Investigation of hydrogen bonding by oxygen functions in Athabasca bitumen. Fuel, 55, 187-192.
Moschopedis, S. E., & Speight, J. G. (1975). Oxidation of a bitumen. Fuel, 54, 210-212.

134
Moore, R G, S A Mehta, M Ursenbach, and C J Laureshen. "Strategies for successful air injection-based IOR processes." 7th International Conference of Heavy Crude and Tar Sands, Beijin, China, 1998.
Mullins, O. C. (2010). The modified Yen model. Energy & Fuels, 24, 2179-2207. Mullins, O.C.; Andrews, A.B.; Pomerantz, A.E.; Dong, C.; Zuo, J.Y.; Pfeiffer, T.; Latifzai,
A.S.; Elshahawi, H.; Barré, L. & Larter, S. (2011). Impact of Asphaltene nanoscience on understanding oilfield reservoirs. Paper SPE 146649 presented at the SPE Annual Technical Conference and Exhibition, Denver, 30 October-2 November, 2011.
Murgich, J., Abanero, J. A., & Strausz, O. P. (1999). Molecular recognition in aggregates formed by asphaltene and resin molecules from the athabasca oil sand. Energy & Fuels, 13, 278-286.
Nassar, N. N. (2010). Asphaltene adsorption onto alumina nanoparticles: knetics and thermodynamic studies. Energy & Fuels, 24, 4116-4122.
Nassar, N. N., Hassan, A., & Pereira-Almao, P. (2013). Clarifying the catalytic role of NiO nanoparticles in the oxidation of asphaltenes. Applied Catalysis A: General, 462–463, 116-120.
Nassar, N., Hassan, A., & Pereira-Almao, P. (2012a). Thermogravimetric studies on catalytic effect of metal oxide nanoparticles on asphaltene pyrolysis under inert conditions. Journal of Thermal Analysis and Calorimetry, 110, 1327-1332.
Nassar, N. N., Hassan, A., Carbognani, L., Lopez-Linares, F., & Pereira-Almao, P. (2012b). Iron oxide nanoparticles for rapid adsorption and enhanced catalytic oxidation of thermally cracked asphaltenes. Fuel, 95, 257-262.
Nassar, N. N., Hassan, A., & Pereira-Almao, P. (2011a). Application of nanotechnology for heavy oil upgrading: catalytic steam gasification/cracking of asphaltenes. Energy & Fuels, 25, 1566-1570.
Nassar, N. N., Hassan, A., & Pereira-Almao, P. (2011b). Comparative oxidation of adsorbed asphaltenes onto transition metal oxide nanoparticles. Colloids and Surfaces A: Physicochemical and Engineering Aspects, 384, 145-149.
Nassar, N. N., Hassan, A., & Pereira-Almao, P. (2011c). Metal oxide nanoparticles for asphaltene adsorption and oxidation. Energy & Fuels, 25, 1017-1023.
Nassar, N. N., Hassan, A., Carbognani, L., Lopez-Linares, F., & Pereira-Almao, P. (2012). Iron oxide nanoparticles for rapid adsorption and enhanced catalytic oxidation of thermally cracked asphaltenes. Fuel, 95, 257-262.
Nassar, N. N., & Husein, M. M. (2007a). Effect of microemulsion variables on copper oxide nanoparticle uptake by AOT microemulsions. Journal of Colloid and Interface Science, 316, 442-450.
Nassar, N. N., & Husein, M. M. (2007b). Study and modeling of iron hydroxide nanoparticle uptake by AOT (w/o) microemulsions. Langmuir, 23, 13093-13103.
Nassar, N. N., & Husein, M. M. (2010). Ultradispersed particles in heavy oil: Part I, preparation and stabilization of iron oxide/hydroxide. Fuel Processing Technology, 91, 164-168.
Nassar, N. N., Husein, M. M., & Pereira-Almao, P. (2010). Ultradispersed particles in heavy oil: Part II, sorption of H2S(g). Fuel Processing Technology, 91, 169-174.

135
Nassar, N. N., & Pereira-Almao, P. (2010). Capturing H2S(g) by in situ-prepared ultradispersed metal oxide particles in an oilsand-packed bed column. Energy & Fuels, 24, 5903-5906.
Nikookar, M., Pazuki, G. R., Omidkhah, M. R., & Sahranavard, L. (2008). Modification of a thermodynamic model and an equation of state for accurate calculation of asphaltene precipitation phase behavior. Fuel, 87, 85-91.
Rahimi, P. M., & Gentzis, T. (2006). The chemistry of bitumen and heavy oil processing Practical Advances in Petroleum Processing (pp. 597-634): Springer.
Ranjbar, M., & Pusch, G. (1991). Pyrolysis and combustion kinetics of crude oils, asphaltenes and resins in relation to thermal recovery processes. Journal of Analytical and Applied Pyrolysis, 20, 185-196.
Petit, C., Lixon, P., & Pileni, M. P. (1993). In situ synthesis of silver nanocluster in AOT reverse micelles. The Journal of Physical Chemistry, 97, 12974-12983.
Pileni, M. P. (1993). Reverse micelles as microreactors. The Journal of Physical Chemistry, 97, 6961-6973.
Pileni, M. P., Motte, L., & Petit, C. (1992). Synthesis of cadmium sulfide in situ in reverse micelles: influence of the preparation modes on size, polydispersity, and photochemical reactions. Chemistry of Materials, 4, 338-345.
Pfeiffer, J. P., & Saal, R. N. J. (1940). Asphaltic bitumen as colloid system. The Journal of Physical Chemistry, 44, 139-149.
Ren, Y. Q., Huang, Z. N., & Fu, Y. (2011). Evaluation on combustion properties of nanoparticle as fuel additive. Advanced materials Research, 335, 1516-1519.
Rosenvold, R. J., Dubow, J. B., & Rajeshwar, K. (1982). Thermal analyses of Ohio bituminous coals. Thermochimica Acta, 53, 321-332.
Premuzic, E. T., & Lin, M. S. (1999). Induced biochemical conversions of heavy crude oils. Journal of Petroleum Science and Engineering, 22, 171-180.
Rudrake, A., Karan, K., & Horton, J. H. (2009). A combined QCM and XPS investigation of asphaltene adsorption on metal surfaces. Journal of Colloid and Interface Science, 332, 22-31.
Rymeš,J.,Ehret, .,Hilaire,L.,Boutonnet,M.,&Jirátová,K.(2002).Microemulsionsinthe preparation of highly active combustion catalysts. Catalysis today, 75(1), 297-303.
Sakanishi, K., Saito, I., Watanabe, I., & Mochida, I. (2004). Dissolution and demetallation treatment of asphaltene in resid using adsorbent and oil-soluble Mo complex. Fuel, 83, 1889-1893.
Sarmah, M. K., Borthakur, A., & Dutta, A. (2010). Interfacial and thermal characterization of asphaltenes separated from crude oils having different geological origins. Petroleum Science and Technology, 28, 1068-1077.
Sayyouh, M. H., Hemeida, A. M., Al-Blehed, M. S., & Desouky, S. M. (1991). Role of polar compounds in crude oils on rock wettability. Journal of Petroleum Science and Engineering, 6, 225-233.
Scherzer, J., & Gruia, A. J. (1996). Hydrocracking science and technology (Vol. 66): CRC Press.
Sheu, E. Y. (2001). Petroleum AsphalteneProperties, Characterization, and Issues. Energy & Fuels, 16, 74-82.

136
Shirokoff, J. W., Siddiqui, M. N., & Ali, M. F. (1997). Characterization of the structure of saudi crude asphaltenes by X-ray diffraction. Energy & Fuels, 11, 561-565.
Siffert, B., Kuczinski, J., & Papirer, E. (1990). Relationship between electrical charge and flocculation of heavy oil distillation residues in organic medium. Journal of Colloid and Interface Science, 135, 107-117.
Silbermann, R., Gomez, A., Gates, I., & Mahinpey, N. (2013). Kinetic studies of a novel CO2 gasification method using coal from deep unmineable seams. Industrial & Engineering Chemistry Research, 52, 14787-14797.
Spiecker, P. M., Gawrys, K. L., Trail, C. B., & Kilpatrick, P. K. (2003). Effects of petroleum resins on asphaltene aggregation and water-in-oil emulsion formation. Colloids and surfaces A: Physicochemical and engineering aspects, 220, 9-27.
Speight, J. (2004). Petroleum Asphaltenes-Part 1: Asphaltenes, resins and the structure of petroleum. Oil & gas science and technology, 59, 467-477.
Speight, J. ., “The Chemistry and Technology of Petroleum,” Marcel Dekker, NewYork, (2006).
Speight, J. ., and S. E. Moschopedis, “On the molecular nature of petroleumasphaltenes”in“Chemistryofasphaltenes”Advancesin chemistry series, 195, J. W. Bunger, and N. C. Li, Eds., American Chemical Society, Washington, D. C., (1981).
Storm, D. A., DeCanio, S. J., DeTar, M. M., & Nero, V. P. (1990). Fuel, 69, 735. Storm, D. A., DeCanio, S. J., DeTar, M. M., & Nero, V. P. (1990). Upper bound on
number average molecular weight of asphaltenes. Fuel, 69, 735-738. Strausz, O. P., Peng, P. a., & Murgich, J. (2002). About the colloidal nature of
asphaltenes and the MW of covalent monomeric units. Energy & Fuels, 16, 809-822.
Stumm, W., & O'Melia, C. R. (1968). Stoichiometry of coagulation. Journal (American Water Works Association), 60(5), 514-539.
Subramanian, B., Mohammed Ibrahim, M., Murali, K. R., Vidhya, V. S., Sanjeeviraja, C., & Jayachandran, M. (2009). Structural, optoelectronic and electrochemical properties of nickel oxide films. Journal of Materials Science: Materials in Electronics, 20, 953-957.
Swanson, J. M. (1942). A Contribution to the physical chemistry of the asphalts. The Journal of Physical Chemistry, 46, 141-150.
Syunyaev, R. Z., Balabin, R. M., Akhatov, I. S., & Safieva, J. O. (2009). Adsorption of petroleum asphaltenes onto reservoir rock sands studied by near-infrared (NIR) spectroscopy. Energy & Fuels, 23, 1230-1236.
Sztukowski, D. M., Jafari, M., Alboudwarej, H., & Yarranton, H. W. (2003). Asphaltene self-association and water-in-hydrocarbon emulsions. Journal of Colloid and Interface Science, 265, 179-186.
Tadema, H. J. (1959, May). 22. Mechanism of oil production by underground combustion. In 5th World Petroleum Congress.
Takahashi, T., Higashi, H., & Kai, T. (2005). Development of a new hydrodemetallization catalyst for deep desulfurization of atmospheric residue and the effect of reaction temperature on catalyst deactivation. Catalysis Today, 104, 76-85.

137
Takanohashi, T., Sato, S., Saito, I., & Tanaka, R. (2002). Molecular dynamics simulation of the heat-induced relaxation of asphaltene aggregates. Energy & Fuels, 17, 135-139.
Tanaka, R., Hunt, J. E., Winans, R. E., Thiyagarajan, P., Sato, S., & Takanohashi, T. (2002). Aggregates structure analysis of petroleum asphaltenes with small-angle neutron scattering. Energy & Fuels, 17, 127-134.
Toshima, N., & Yonezawa, T. (1998). Bimetallic nanoparticles-novel materials for chemical and physical applications. [10.1039/A805753B]. New Journal of Chemistry, 22, 1179-1201.
Vossmeyer, T., Katsikas, L., Giersig, M., Popovic, I. G., Diesner, K., Chemseddine, A., et al. (1994). CdS nanoclusters: synthesis, characterization, size dependent oscillator strength, temperature shift of the excitonic transition energy, and reversible absorbance shift. The Journal of Physical Chemistry, 98, 7665-7673.
Wang, T. J., Baek, S. W., & Lee, J.-H. (2008). Kinetic parameter estimation of a diesel oxidation catalyst under actual vehicle operating conditions. Industrial & Engineering Chemistry Research, 47, 2528-2537.
Wang, Y., Zhu, J., Yang, X., Lu, L., & Wang, X. (2005). Preparation of NiO nanoparticles and their catalytic activity in the thermal decomposition of ammonium perchlorate. Thermochimica Acta, 437, 106-109.
Wiehe, I. A. (1992). A solvent-resid phase diagram for tracking resid conversion. Industrial & Engineering Chemistry Research, 31, 530-536.
Wiehe, I. A., & Liang, K. S. (1996). Asphaltenes, resins, and other petroleum macromolecules. Fluid Phase Equilibria, 117, 201-210.
Wilt, B. K., Welch, W. T., & Rankin, J. G. (1998). Determination of asphaltenes in petroleum crude oils by fourier transform infrared spectroscopy. Energy & Fuels, 12, 1008-1012.
Wu, J., Prausnitz, J. M., & Firoozabadi, A. (1998). Molecular-thermodynamic framework for asphaltene-oil equilibria. AIChE Journal, 44, 1188-1199.
Yen, T. F., & Chilingarian, G. V. (2000). Asphaltenes and asphalts, 2 (Vol. 2): Elsevier. Yi, Y., Li, S., Ding, F., & Yu, H. (2009). Change of asphaltene and resin properties after
catalytic aquathermolysis. Petroleum Science, 6, 194-200. Xie, K., & Karan, K. (2005). Kinetics and thermodynamics of asphaltene adsorption on
metal surfaces: Apreliminary study. Energy & Fuels, 19, 1252-1260. Xing C. (2008) Sorption of athabasca vacuum residue on acidic, neutral and basic
surfaces, Department of Chemical and Materials Engineering, University of Alberta, Edmonton, Alberta.
Yi, Y., Li, S., Ding, F., & Yu, H. (2009). Change of asphaltene and resin properties after catalytic aquathermolysis. Petroleum Science, 6, 194-200.
Zekri, A. Y., Shedid, S. A., & Alkashef, H. (2007). A new technique for treatment of permeability damage due to asphaltene deposition using laser technology. Journal of Petroleum Science and Engineering, 59, 300-308.
Zhang, Y., Takanohashi, T., Sato, S., Saito, I., & Tanaka, R. (2003). Observation of glass transition in asphaltenes. Energy & Fuels, 18, 283-284.

138
Appendix
Sample Calculation for the number of asphaltenes layers
Assumptions:
Asphaltenes Molecular Weight= 2280 g/mole (Rahimi et al., 2006)
Asphaltenes size= 1.2 nm (Bouhadda et al., 2007; Shirokoff et al., 1997)
Even distribution of adsorbed materials
NiO density=6.67 g/cm3
Calculated:
NiO nanoparticle diameter size= 12 nm
NiO radius (r) =6 nm
In-situ NiO uptake =2.7 g/g
NiO specific surface area=75m2/g
Calculation:
Surface area of one NiO nanoparticle= =4.5*10^-16 m2
Volume of one NiO nanoparticle= =9*10^-25 m3
Total Volume per 1 gm= 1*10^-6/ (6.67) =1.5*10^-7m3
Total number of NiO nanoparticles = Total volume / Volume of one NiO nanoparticle
=1.7*10^17NiO nanoparticles / g
Per ONE gram of NiO Nanoparticles:
Total number of moles of adsorbed asphaltenes= Mass / Molecular weight
= (0.41/2280)=0.0012 moles
Total surface coverage of asphaltenes =
(Numberofmoles)*(Avogadro’snumber)*(Surfaceareaperoneasphaltenemolecule)
=675 m2
Ratio of coverage = Total surface coverage of asphaltenes / Total surface area of NiO
nanoparticles per gram
=9 layer of asphaltenes