assessing integrity of insect rna - agilent · 2017-04-10 · assessing integrity of insect rna...
TRANSCRIPT

Assessing Integrity of Insect RNA
Application Note
AuthorsJeffrey A. Fabrick and J. Joe Hull Pest Management and Biocontrol Research Unit, Agricultural Research Service, United States Department of Agriculture, Maricopa, AZ, USA
Nucleic Acid Analysis
AbstractAssessing total RNA integrity is important for the success of downstream RNA applications. The Agilent 2100 Bioanalyzer system with the RNA Integrity Number (RIN) provides a quantitative measure of RNA degradation. Although RINs may not be ascertained for RNA from all organisms, namely those with unusual or complex RNA profiles, this Application Note demonstrates the applicability of total RNA quality assessment of different insect species with the 2100 Bioanalyzer system and its relevance to downstream quantitative RT-PCR experiments.

2
RNA extractionTotal RNA was extracted from insect tissues using a TissueLyser and TRI Reagent. For RNA degradation, tissues were homogenized in 2-mL round-bottom microfuge tubes with two steel beads in PBS buffer (700 µL) or TRI Reagent (positive controls), and held at room temperature for 0, 5, 10, 30, or 60 minutes. TRI Reagent (100 µL) was added at each respective time point to stop further RNA degradation. RNA concentration and 260/280 ratios were determined using a spectrophotometer. Genomic DNA was removed by treating 1 μg of total RNA with DNase I.
RNA analysisRNA samples were heated to 70 °C, and analyzed with the 2100 Bioanalyzer system using the RNA 6000 Nano kit according to the manufacturer’s instructions6. All analyses were performed using the Agilent 2100 Expert Software.
cDNA synthesis and real‑time qPCRcDNA was generated from 0.5 μg total RNA using an AffinityScript Multi Temperature cDNA synthesis kit following the manufacturer‘s recommended protocol at 55 °C for 60 minutes. qPCR was performed using Brilliant III SYBR on a qPCR thermocycler. After the initial denaturation step at 95 °C for 3 minutes, 40 cycles were performed at 95 °C for 5 seconds, and 67 °C for 10 seconds. Three technical replicates were performed for each sample. Table 1 summarizes the PCR primers.
ExperimentalMaterialsTissueLyser was obtained from Qiagen (Valencia, CA, USA). TRI Reagent, OPTIZYME DNase I and a NanoDrop 1000 spectrophotometer were from Thermo Fisher Scientific (Waltham, MA, USA). An Agilent 2100 Bioanalyzer system (G2940CA or G2943CA) and the RNA 6000 Nano Kit (p/n 5067-1511), AffinityScript Multiple Temperature Reverse Transcriptase (p/n 600105), and Brilliant III SYBR (p/n 600886) were from Agilent Technologies (Santa Clara, CA, USA). The CFX96 Touch Real-Time PCR Detection System from BioRad (Hercules, CA, USA) was used for quantitative RT-PCR.
SamplesAedes aegypti, Culex quinquefasciatus, Musca domestica, and Helicoverpa zea were purchased from Benzon Research (Carlisle, PA, USA). Drosophila melanogaster were purchased from Carolina Biological Supply (Burlington, NC, USA). Pectinophora gossypiella, Bemisia tabaci, and Lygus hesperus were obtained from laboratory strains reared at USDA-ARS, U.S. Arid Land Agricultural Research Center (Maricopa, AZ, USA). Apis mellifera hives were maintained at the University of Arizona Maricopa Agricultural Center (Maricopa, AZ, USA), with original source from the USDA-ARS Carl Hayden Bee Research Center (Tucson, AZ, USA). Camponotus floridanus and Zootermopsis nevadensis were kindly provided by Jürgen Liebig, Arizona State University (Tempe, AZ, USA) and Myzus persicae was kindly provided by Kerry Oliver, University of Georgia (Athens, GA, USA).
IntroductionIn general, the success of downstream RNA applications depends on the quality and integrity of the extracted total RNA. Therefore, evaluating levels of degradation in RNA samples is critical. Electrophoretic separation and visual inspection of the highly abundant ribosomal RNAs (rRNAs) – 16S and 23S in prokaryotes and 18S and 28S in eukaryotes – in RNA profiles are the most common methods for assessing the integrity of extracted total RNA. In addition to this visual inspection of the total RNA profile, the Agilent 2100 Bioanalyzer system provides a quantitative measure of the RNA integrity with the patented RNA Integrity Number (RIN)1, an established industry standard for RNA quality assessment before any RNA-dependent application.
Although the RNA profiles from eukaryotes are dominated by the presence of conserved 18S and 28S rRNA species, the total RNA profiles from insects differ substantially from other profiles, as the 28S rRNA of most insects contains an endogenous hidden break2-4. Denaturation causes the hydrogen bonds to dissociate, and two fragments of similar size are generated, and closely migrate with the 18S rRNA. Additionally, the 5.8S rRNA is base-paired to this 28S complex, and is also released under denaturing conditions. When RNA samples are not heat-denatured, the expected 18S and 28S rRNA peaks are observed in the total RNA profile5.
This Application Note describes the complexity of insect RNA, and the challenges associated with integrity determination using the 2100 Bioanalyzer system. Here, a large variety of insect species were analyzed for total RNA quality using the 2100 Bioanalyzer system, and the obtained RNA profiles and RIN were compared. In addition, the effect of degraded insect RNA on the outcome of quantitative RT-PCR experiments was evaluated.

3
Results and DiscussionRNA profiles of diverse insect speciesTotal RNA was extracted from various insect species (Ae. aegypti, C. quinquefasciatus, D. melanogaster, M. domestica, A. mellifera, C. floridanus, Z. nevadensis, H. zea, P. gossypiella, B. tabaci, L. hesperus, and M. persicae) using a TRI Reagent-based RNA extraction method with 70 °C heat treatment. The obtained total RNA samples were analyzed using the 2100 Bioanalyzer system and the RNA Nano kit (Figure 1).
Table 1. Nucleotide primers used in quantitative RT-PCR.
Primer Sequence (5’-3’)Dm actin rt 719 F GACCGACTACCTGATGAAGATCCDm actin rt 821 R AACATAGCACAGCTTCTCCTTGAAa GAPDH rt 736 F CTGAACAAGCCTGCTACTTATGCAa GAPDH 859 R TATCACCAACGAAGTCAGTGGAGLh GAPDH rt 307 F GAGAAGGCCTCTGCTCATTTAGALh GAPDH rt 414 R GTCATACGCTTCAAGGTTGACACLh actin rt 683 F TGGCCACCGCCGCGTCCTLh actin rt 787 R AGAGGGCTTCGGGGCACCTG
Figure 1. Electrophoretic separation of different insect total RNA using an Agilent 2100 Bioanalyzer system with the Eukaryotic Total RNA Nano assay. Representative electropherograms of Ae. aegypti (A), C. quinquefasciatus (B), D. melanogaster (C), M. domestica (D), A. mellifera (E), C. floridanus (F), Z. nevadensis (G), H. zea (H), P. gossypiella (I), B. tabaci (J), L. hesperus (K), and M. persicae (L) are shown. The peak at approximately 23 seconds corresponds to the Lower Marker.
A B C
D E F
G H I
J K L

4
Figures 1A-D shows electropherograms from representative Diptera (Ae. aegypti, C. quinquefasciatus, D. melanogaster, and M. domestica). Putative ribosomal 18S and 28S bands are visible in all dipterans. Two hymenopteran species (A. mellifera and C. floridanus) show diverse RNA profiles (Figures 1E and 1F) in which the A. mellifera pattern consists of a single major peak that contains both 18S and heat-labile 28S ribosomal RNA2. The C. floridanus RNA profile lacks both 18S and 28S bands. RNA from the isopteran termite Z. nevadensis shows an RNA profile unique to this species (Figure 1G), with four major distinct peaks. Representatives from Lepidoptera (H. zea and P. gossypiella) are shown in Figure 1H-I, and have similar profiles with overlapping putative 18S/28S peaks. Several hemipterans (B. tabaci, L. hesperus, and M. persicae) are shown in Figure 1J-L, each with unique RNA profiles. Specifically, the putative 28S peak is reduced in L. hesperus, and RNA peaks resolve at later retention times for M. persicae.
Figure 1 demonstrates that the total RNA electropherogram traces differ substantially depending on the insect species. This needs to be considered when judging the total RNA quality based on the profile.
The Agilent 2100 Expert software not only provides the electropherograms for each RNA sample, but it also automatically calculates RIN based on the RNA profile. RIN values range from 1–10, and indicate RNA integrity, with lower values indicating poor quality and higher values indicating good quality RNA.
Table 2. RNA integrity analysis of insect total RNA with the Agilent 2100 Bioanalyzer system.
Order Insect genus/species Insect common name RIN Figure 1 panelDiptera Aedes aegypti Yellow fever mosquito 6.5 A
Culex quinquefasciatus Southern house mosquito nd* BDrosophila melanogaster Fruit fly nd* CMusca domestica House fly 6.4 D
Hymenoptera Apis mellifera Honey bee nd* ECamponotus floridanus Florida carpenter ant 2.4 F
Isoptera Zootermopsis nevadensis Dampwood termite 7.3 GLepidoptera Helicoverpa zea Corn earworm 5.9 H
Pectinophora gossypiella Pink bollworm 5.2 IHemiptera Bemisia tabaci Sweet potato white fly 5.5 J
Lygus hesperus Western tarnished plant bug nd* KMyzus persicae Green peach aphid nd* L
*nd indicates that no RIN was determined from the Agilent 2100 Expert Software algorithm.
Because RIN was specifically developed for the analysis of the eukaryotic total RNA, it was evaluated if RIN was also meaningful for insect RNA samples that have different RNA profiles, as shown in Figure 1.
Table 2 summarizes the determined RIN values for each species from the 2100 Expert Software. Because of the eukaryotic total RNA algorithm used and the relative positioning of putative 18S, 28S, and other minor peaks found in RNA from different insects, RINs were not always automatically calculated. For example, RINs were not determined for C. quinquefasciatus, D. melanogaster, A. mellifera, L. hesperus, and M. persicae, although many of these profiles seem to contain intact ribosomal RNAs (Figure 1). RINs were calculated for some insect RNA (Ae. aegypti, M. domestica, C. floridanus, Z. nevadensis, H. zea, P. gossypiella, and B. tabaci).
Because of the unique profiles of insect RNA and the differences in rRNA, RIN was calculated for some insect species but not for others and the validity of RIN for insect total RNA was not proven.
Insect RNA degradation depends on RNA extractionAlthough RIN cannot be reliably used for insect RNA, the electropherogram is a useful tool for the assessment of RNA degradation. As a demonstration, total insect RNA from L. hesperus, D. melanogaster, and Ae. aegypti was extracted in TRI Reagent or PBS at room temperature for 0, 5, 10, 30, or 60 minutes, and analyzed with the 2100 Bioanalyzer system and the RNA Nano 6000 kit. Figure 2 shows the obtained electropherograms.
The electropherograms clearly show RNA degradation over time when extracted directly in PBS for L. hesperus, D. melanogaster, and Ae. aegypti (Figure 2). In contrast, the RNA profiles and putative 18S and 28S RNA peaks are preserved when RNA is extracted using TRI Reagent, even after 1 hour at room temperature. The RNA profiles show clear evidence of degradation with fragmentation of RNA and decrease in fluorescence intensity of 18S and 28S peaks, after only 5 minutes in PBS. The degradation further increases with the incubation time. This demonstrates that the total RNA electropherograms from the 2100 Bioanalyzer system provide useful information to judge RNA integrity within insect species.

5
Figure 2A. Time course degradation of insect RNA. Total RNA samples from L. hesperus were extracted in TRI Reagent (shown as blue traces in the first column) or PBS (shown as red traces in the second column) at room temperature for 0, 5, 10, 30, or 60 minutes and analyzed with an Agilent 2100 Bioanalyzer system and the RNA Nano 6000 kit.
L. hesperus
t = 0 min
t = 5 min
t = 10 min
t = 30 min
t = 60 min
t = 0 min
t = 5 min
t = 10 min
t = 30 min
t = 60 min
TRI Reagent PBS

6
D. melanogaster
t = 0 min
t = 5 min
t = 10 min
t = 30 min
t = 60 min
t = 0 min
t = 5 min
t = 10 min
t = 30 min
t = 60 min
PBSTRI Reagent
Figure 2B. Time course degradation of insect RNA. Total RNA samples from D. melanogaster were extracted in TRI Reagent (shown as blue traces in the first column) or PBS (shown as red traces in the second column) at room temperature for 0, 5, 10, 30, or 60 minutes and analyzed with an Agilent 2100 Bioanalyzer system and the RNA Nano 6000 kit.

7
A. aegypti
t = 0 min
t = 5 min
t = 10 min
t = 30 min
t = 60 min
t = 0 min
t = 5 min
t = 10 min
t = 30 min
t = 60 min
PBSTRI Reagent
Figure 2C. Time course degradation of insect RNA. Total RNA samples from Ae. aegypti were extracted in TRI Reagent (shown as blue traces in the first column) or PBS (shown as red traces in the second column) at room temperature for 0, 5, 10, 30, or 60 minutes and analyzed with an Agilent 2100 Bioanalyzer system and the RNA Nano 6000 kit.
8
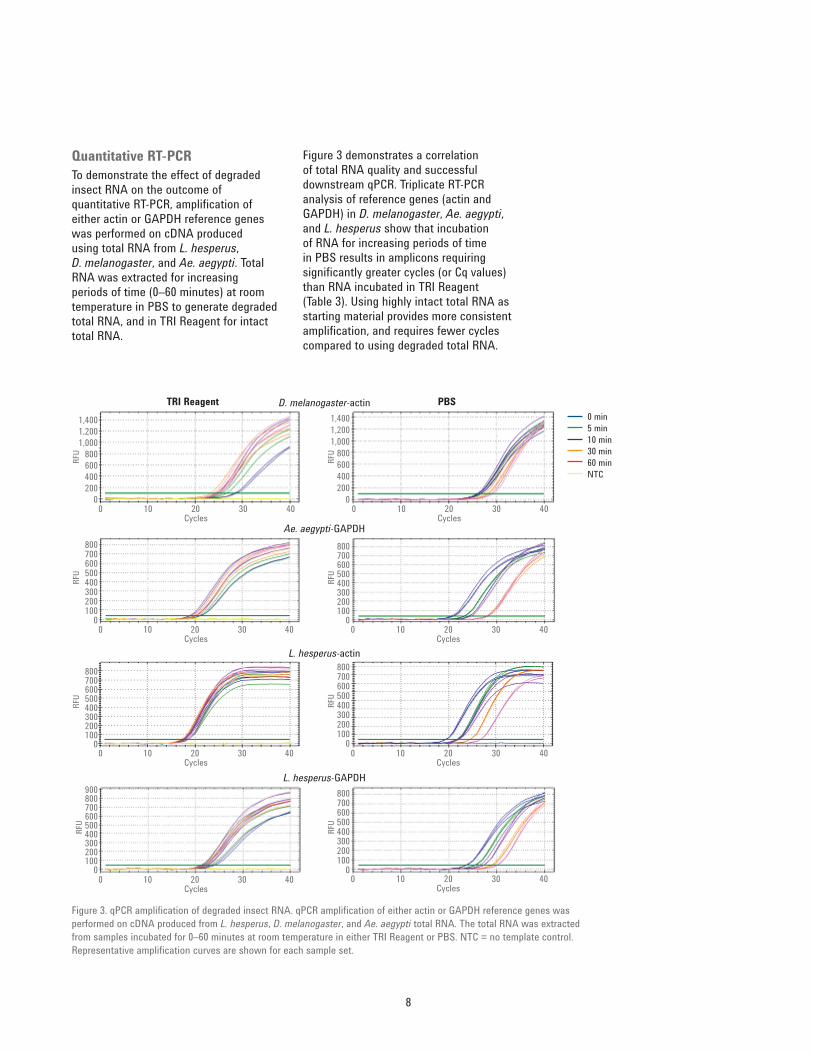
Figure 3 demonstrates a correlation of total RNA quality and successful downstream qPCR. Triplicate RT-PCR analysis of reference genes (actin and GAPDH) in D. melanogaster, Ae. aegypti, and L. hesperus show that incubation of RNA for increasing periods of time in PBS results in amplicons requiring significantly greater cycles (or Cq values) than RNA incubated in TRI Reagent (Table 3). Using highly intact total RNA as starting material provides more consistent amplification, and requires fewer cycles compared to using degraded total RNA.
Quantitative RT‑PCRTo demonstrate the effect of degraded insect RNA on the outcome of quantitative RT-PCR, amplification of either actin or GAPDH reference genes was performed on cDNA produced using total RNA from L. hesperus, D. melanogaster, and Ae. aegypti. Total RNA was extracted for increasing periods of time (0–60 minutes) at room temperature in PBS to generate degraded total RNA, and in TRI Reagent for intact total RNA.
TRI Reagent D. melanogaster-actin
Ae. aegypti-GAPDH
L. hesperus-actin
L. hesperus-GAPDH
PBS0 min5 min10 min30 min60 minNTC
Cycles0
0200400600800
1,0001,2001,400
10 20 30 40
RFU
Cycles0
0100200300400500600700800
10 20 30 40
Cycles0 10 20 30 40
Cycles0 10 20 30 40
Cycles0 10 20 30 40
Cycles0 10 20 30 40
Cycles0 10 20 30 40
RFU
0100200300400500600700800
RFU
0100200300400500600700800
RFU
0100200300400500600700800
RFU
0100200300400500600700800
RFU
0100200300400500600700800900
RFU
Cycles0
0200400600800
1,0001,2001,400
10 20 30 40
RFU
Figure 3. qPCR amplification of degraded insect RNA. qPCR amplification of either actin or GAPDH reference genes was performed on cDNA produced from L. hesperus, D. melanogaster, and Ae. aegypti total RNA. The total RNA was extracted from samples incubated for 0–60 minutes at room temperature in either TRI Reagent or PBS. NTC = no template control. Representative amplification curves are shown for each sample set.
9
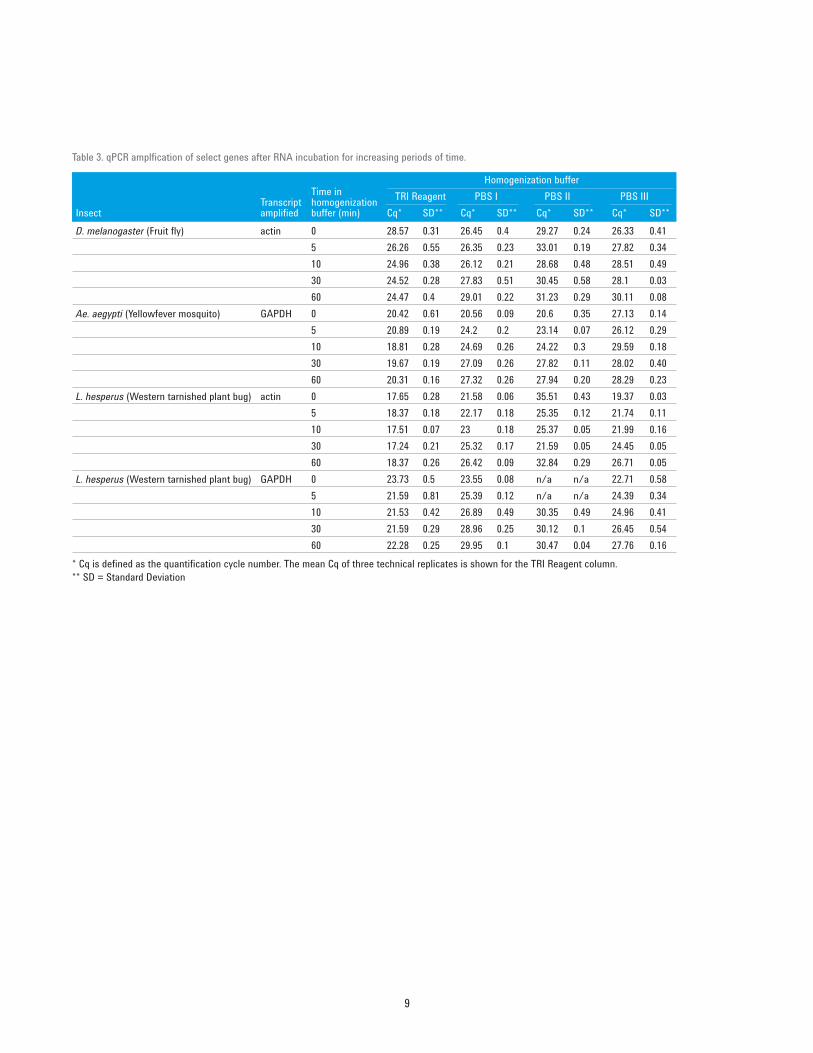
* Cq is defined as the quantification cycle number. The mean Cq of three technical replicates is shown for the TRI Reagent column.** SD = Standard Deviation
Table 3. qPCR amplfication of select genes after RNA incubation for increasing periods of time.
InsectTranscript amplified
Time in homogenization buffer (min)
Homogenization bufferTRI Reagent PBS I PBS II PBS III
Cq* SD** Cq* SD** Cq* SD** Cq* SD**D. melanogaster (Fruit fly) actin 0 28.57 0.31 26.45 0.4 29.27 0.24 26.33 0.41
5 26.26 0.55 26.35 0.23 33.01 0.19 27.82 0.34 10 24.96 0.38 26.12 0.21 28.68 0.48 28.51 0.49 30 24.52 0.28 27.83 0.51 30.45 0.58 28.1 0.03 60 24.47 0.4 29.01 0.22 31.23 0.29 30.11 0.08Ae. aegypti (Yellowfever mosquito) GAPDH 0 20.42 0.61 20.56 0.09 20.6 0.35 27.13 0.14
5 20.89 0.19 24.2 0.2 23.14 0.07 26.12 0.29 10 18.81 0.28 24.69 0.26 24.22 0.3 29.59 0.18 30 19.67 0.19 27.09 0.26 27.82 0.11 28.02 0.40 60 20.31 0.16 27.32 0.26 27.94 0.20 28.29 0.23L. hesperus (Western tarnished plant bug) actin 0 17.65 0.28 21.58 0.06 35.51 0.43 19.37 0.03
5 18.37 0.18 22.17 0.18 25.35 0.12 21.74 0.1110 17.51 0.07 23 0.18 25.37 0.05 21.99 0.1630 17.24 0.21 25.32 0.17 21.59 0.05 24.45 0.05
60 18.37 0.26 26.42 0.09 32.84 0.29 26.71 0.05L. hesperus (Western tarnished plant bug) GAPDH 0 23.73 0.5 23.55 0.08 n/a n/a 22.71 0.58
5 21.59 0.81 25.39 0.12 n/a n/a 24.39 0.3410 21.53 0.42 26.89 0.49 30.35 0.49 24.96 0.41
30 21.59 0.29 28.96 0.25 30.12 0.1 26.45 0.54 60 22.28 0.25 29.95 0.1 30.47 0.04 27.76 0.16

10
References1. Schroeder, A.; et al. The RIN: an RNA
integrity number for assigning integrity values to RNA measurements. BMC Molecular Biology 2006, 7:3.
2. Winnebeck, E. C.; Millar, C. D.; Warman, G. R. Why does insect RNA look degraded? J. Insect Sci. 2010, 10:159.
3. Jordan, B. R.; Jourdan, R.; Jacq, B. Late steps in the maturation of Drosophila 26 S ribosomal RNA: generation of 5-8 S and 2 S RNAs by cleavages occurring in the cytoplasm. J. Mol. Biol. 1976, 101, 85-105.
4. Macharia, R. W.; Ombura, F. L.; Aroko, E. O. Insects’ RNA Profiling Reveals Absence of “Hidden Break” in 28S Ribosomal RNA Molecule of Onion Thrips, Thrips tabaci. J. Nucleic Acids 2015, 965294.
5. Ridgeway, J. A.; Timm, A. E. Comparison of RNA isolation methods from insect larvae. J. Insect Sci. 2014, 14.
6. Agilent RNA 6000 Nano Kit Guide. Agilent Technologies, publication number G2938-90034 Rev. B, 2013.
AcknowledgmentsWe thank Melissa Liu and Isabell Pechtl (Agilent) for helpful discussions and comments on previous versions of this Application Note, and Amber Ford (USDA-ARS) for technical support. This is a cooperative investigation between USDA-ARS and Agilent Technologies. Mention of trade names or commercial products in this article is solely for the purpose of providing specific information and does not imply recommendation or endorsement by the U.S. Department of Agriculture. The USDA is an equal opportunity provider and employer.
ConclusionThe Agilent 2100 Bioanalyzer system can be used to analyze total RNA from diverse species. Although the data calculate RIN values (developed for eukaryotic total RNA), which may not be practical for all insect species, they also provide total RNA electropherograms, which display suitable information for the evaluation of RNA integrity across insect species. The total RNA integrity determined with the 2100 Bioanalyzer system correlates with the quality of downstream quantitative RT-PCR experiments.

11

www.agilent.com/genomics/bioanalyzer
For Research Use Only. Not for use in diagnostic procedures.
This information is subject to change without notice.
© Agilent Technologies, Inc., 2017 Published in the USA, April 1, 2017 5991-7903EN