assessing household energy savings and consumer behavior ... · carried out in padang, west sumatra...
TRANSCRIPT
Abstract— Indonesia's electrification ratio is still around
80.1%, which means that approximately 19.9% of households
in Indonesia have not been getting the flow of electrical energy.
Household electricity consumptions in Indonesia are generally
still dominated by the public urban. In the city of Padang, West
Sumatera, Indonesia, about 94.10% are power users of
government services (PLN). The most important thing of the
issue is human resources efficient energy. Consumer behavior
in utilizing electricity becomes significant. Intensive questioner
survey, in-depth interview and statistical analysis are carried
out to collect scientific evidences of the behavioral based
changes instruments to reduce electricity consumption in
household sector. The questioner was developed to include five
factors assuming affect the electricity consumption pattern in
household sector. They are: attitude, energy price, household
income, knowledge and other determinants. The survey was
carried out in Padang, West Sumatra Province, Indonesia.
About 210 questioner papers were proportionally distributed to
households in 11 districts in Padang. Stratified sampling was
used as a method to select respondents. The results show that
the household size, income, payment methods and size of house
are factors affecting electricity saving behavior in residential
sector. Household expenses on electricity are strongly
influenced by gender, type of job, level of education, size of
house, income, payment method and level of installed power.
These results provide a scientific evidence for stakeholders on
the potential of controlling electricity consumption and
designing energy policy by government in residential sector.
Keywords— Electricity, Energy Saving, Household,
Behavior, Policy.
I. INTRODUCTION
HE energy need of Indonesian country is directly
proportional to its population. It is proved by the
increase ratio of Indonesia’s population which is
followed by the increase of final energy consumption [1].
This fact is a challenge, since most of the energy derived
from non-renewable sources and in a limited numbers. In
this case, the electrical energy deserves serious attention as
one of the energy used. The electricity placed as the highest
Manuscript received January 6, 2015; revised January 20, 2015. This
work was supported in part by the financial of Andalas University.
Prima Fithri is with the Andalas University, Padang, West Sumatera,
Indonesia (corresponding author to provide phone: 08126730706; fax:
0751-72566; e-mail: [email protected]).
Lusi Susanti was with Andalas University, Padang, West Sumatera,
Indonesia. She is now with the Department of Industrial Engineering,
Andalas University, Padang, West Sumatera, Indonesia (e-mail:
Karin Bestarina is with the Industrial Engineering, Andalas University,
Padang, West Sumatera, Indonesia, student of Industrial Engineering
Andalas University (e-mail: [email protected]).
ranks fourth of energy consumed after fuels, biomass energy,
and coal. Although the use of electricity continues to rise,
according to the data from the Directorate General of
Electricity Ministry of Energy and Mineral Resources in
2013, Indonesia's electrification ratio is still around 80.1%.
Indonesian Government trives for the electrification ratio
reached until 100% in 2020 through a national energy
policy. This target would have to be balanced with the
ability to supply electricity to the customers by the Power
Users of Government Services, here in after referred to PLN.
Many solutions have been formulated to meet the demand
of PLN power, including power generation, periodic
maintenance of equipment, intensification, and energy
conservation. According to existing literatures, occupant
behaviour plays a major role on the amount energy used in
house [2-12]. In relation to the savings program, user’s habit
must be changed in using the energy wisely which will
provide a sustainable impact [13]. Some advantages of the
user’s behavior changes to use energy efficiently: the
effectiveness can be felt faster than the improvement of the
supporting infrastructure which takes years, it is very
efficient in terms of costs and the savings impact can be felt
directly by the people [14].
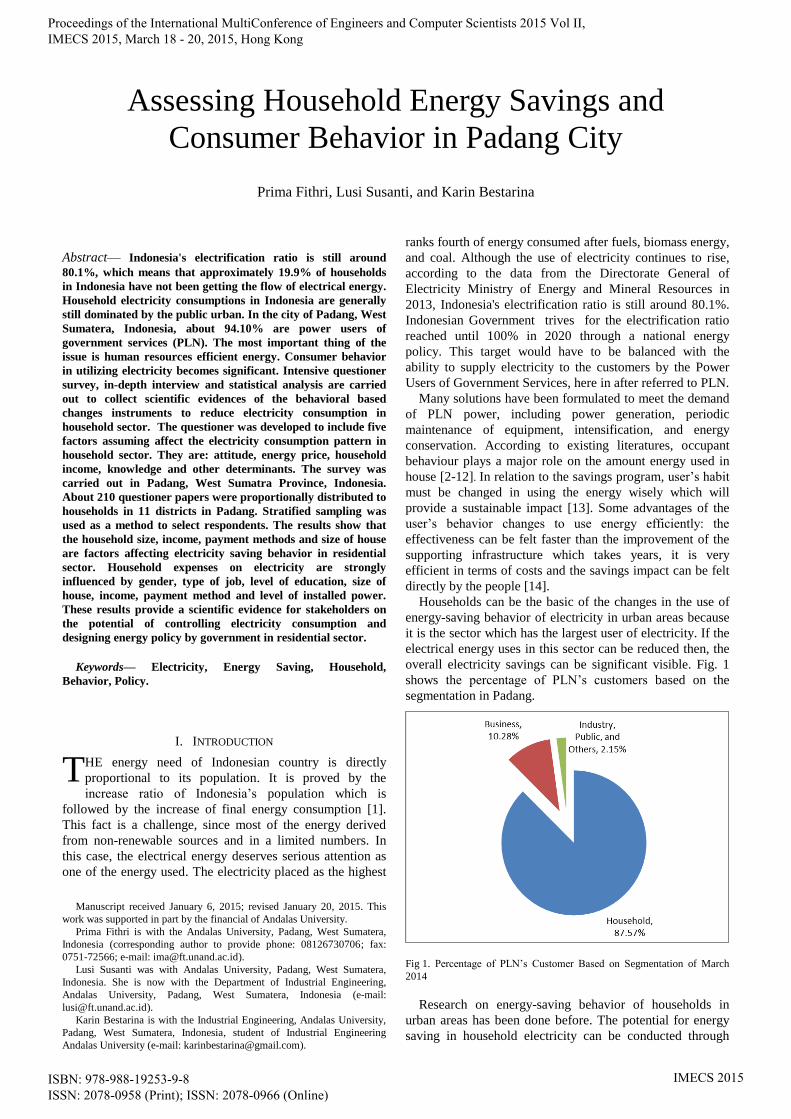
Households can be the basic of the changes in the use of
energy-saving behavior of electricity in urban areas because
it is the sector which has the largest user of electricity. If the
electrical energy uses in this sector can be reduced then, the
overall electricity savings can be significant visible. Fig. 1
shows the percentage of PLN’s customers based on the
segmentation in Padang.
Fig 1. Percentage of PLN’s Customer Based on Segmentation of March
2014
Research on energy-saving behavior of households in
urban areas has been done before. The potential for energy
saving in household electricity can be conducted through
Assessing Household Energy Savings and
Consumer Behavior in Padang City
Prima Fithri, Lusi Susanti, and Karin Bestarina
T
Proceedings of the International MultiConference of Engineers and Computer Scientists 2015 Vol II, IMECS 2015, March 18 - 20, 2015, Hong Kong
ISBN: 978-988-19253-9-8 ISSN: 2078-0958 (Print); ISSN: 2078-0966 (Online)
IMECS 2015

three approaches : the efficiency of household appliances,
the energy saving campaign, and the government policies
[15]. In line with these studies, Sukarno (2013) explained
that the lifestyle and the household appliances become the
main factor of electrical energy consumption in the
household sector [16]. Wang et al., 2011; Li et al., 2009;
Ouyang and Hokao, 2009; Zhou et al., 2008; Xiaohua and
Zhemnin, 2005 also have surveys about household energy
consumption in Asia, which there are several factors that
affect households energy-saving behaviors [17-21]. Padang
city with the population of 765,450 and the wide area of
694.96 km2, being one of the cities with a rapid growth rate.
The development of infrastructure and facilities are done
continuously which followed by the increase in electricity
consumption. Febrizal (2012), has been conducting research
to predict a large escalation in the consumption of electrical
energy in Padang city in 2012-2020 [22]. The prediction
can be seen in Fig 2.
Fig 2. Prediction of Electricity Consumption Padang City 2014-2020
(million KWh)
Therefore, this study is aimed to investigate the current
behavior that related to the energy savings in the household
sector in Padang, what factors encourage energy savings
behavior, and the possible potential savings. The results of
this study are expected to be one of the PLN’s references for
interested parties in setting the policy.
II. RESEARCH METHODS
The study design determines the sort of questions that can
be asked in a structural interview. There were 210
households randomly selected to be investigated. The
population of the data was the PLN’s customers which
belong to West Sumatra Region. The samples were chosen
randomly to represent 11 sub-districts. The respondents were
recruited through a door-to-door way. Data were collected in
April 2014.
List of questions consist of two parts : household’s
characteristics and electricity saving behavior. The following
household characteristics are assumed to have an influence
on energy-saving behavior including sex, age, occupation,
floor area, household income, family number, education
level, method of payment of electricity, number of
appliances and customer class. The trigger factors of energy-
saving behavior, namely:
Attitude
Most of the literature that discusses the energy savings in
households suggests that there is a relation between attitudes
and behavior. The influence of behavior is on micro-
personal level. The government policies will not run
properly if each individual does not align with their own
policy. Individual attitudes in using the energy are triggered
by socio-economic factors. In this study, the attitudes which
is investigated is related to the action in the peak load hours,
the action of discharge the electrical equipment when not in
use, and the action to encourage energy saving habits to the
family members.
Household Income
The most dominant factor of energy saving electrical
household income is the sum of household, but in the form
of a complex relationship. Several previous studies
suggested that the steeper rate of household income the
lower level of concern for the environment. But, it still has a
relationship with an individual's basic attitude. There is a
theory that is commonly used to determine the correlation
between energy consumption with household income, the
theory of the Kuznets relationship. The relationship can be
shown from Fig 3.
Fig 3. Kuznets Curve
Prices
Price does not have very significant impact. These factors
may affect the patterns electricity consumption at household
followed by the number of family members, age, socio-
economic situation of the family members, the number and
types of household appliances. This research will be
investigated the response of the family member to the
household electricity tariffs and the actions taken when
electricity rates have increased or decreased.
Knowledge
Most of the studies in energy use assumes that the public
are aware of the amount and the type of energy used. In fact,
most of the households do not really know what kind of
energy they pay when using a number of tools to support
their daily activities, due to the lack of information received.
Basically, people need information in order to have
knowledge about saving energy consumption. Consistent
information through social interaction within the community
is able to trigger an effective energy-saving behavior. So
that, it is important to study further the knowledge of
households in using electricity.
Proceedings of the International MultiConference of Engineers and Computer Scientists 2015 Vol II, IMECS 2015, March 18 - 20, 2015, Hong Kong
ISBN: 978-988-19253-9-8 ISSN: 2078-0958 (Print); ISSN: 2078-0966 (Online)
IMECS 2015

Other Determinants
There are many other factors that influence energy-saving
behavior of households, one of those factors is the size and
the composition of the household, as well as the design of
the house. The design of the house is related to the building
area, the ventilation, and the lighting systems, as well as the
room condition.
III. RESULTS AND DISCUSSION
A. Characteristics of Respondents
Data of demography shows that the majority of
respondents are female with a percentage of 63% and 37%
men. Most of the respondents are people aged >50 years
(40%), aged 41-50 years (40%), aged 31-40 years (15%),
aged 21-30years (3%), and aged <21 years (2%).
Respondents are in various kinds of jobs such as, 23% are
government/private employees, 21% are housewives, 19%
are self-employment, 15% are traders, 10% are teachers, 6%
are retired, 2% are laborers, 1% are farmers, and 2% are
others.
Based on the education level of family members, 1%
graduates doctor degree, 10% graduates master degree, 59%
graduates bachelor/undergraduate degree, 24% graduates
high school, 5% graduates junior high school graduates, and
1% graduates primary school. Based on income per month
(in Indonesian Rupiah, 1 USD ≈ 12,000 IDR), 7% has
income >10 million, 15% has income 5-10 million, 38% has
income3-5 million, 24% has income 1.5-3 million, and 16%
has income<1.5 million.
Based on the method of electricity payment, 89% using
post paid electricity and the remaining 11% have used a
prepaid electricity. Based on the classification of the
installed power, 47% registered as a customer with 900 VA
power, 27% power 1300 VA, 2200 VA power12%, 12% and
450VApower, and as much as 2% was recorded using the
power > 2200 VA.
B. Characteristics of Appliances
The use of electronic equipment can provide information
on the implications of household electricity consumption. In
addition, the type and amount of electronic equipment used
reflects the attitude and behavior patterns of the households.
It can be targeted to potential electrical energy savings.
Based on the interview, it is known that most of electronic
equipment used by households is used for cooking purposes.
Each of the household has at least one unit of Rice cooker,
water dispenser, refrigerator, blender juice. The need for air
conditioning equipment is quite large, considering the city of
Padang is in the tropical region crossed by the equator. A
total of 61among 210 homes have both AC and electric fan.
For lighting needs, 63 households still do not use energy-
saving lamps. The majority argues that the price for energy
saving lamps is too high while it does not necessarily have
significant benefits in reducing electricity bills. Almost all
of the households have supporting machines in doing their
activities such as iron, machine washing. Television became
the primary source of entertainment for the respondents, the
total number of television households in the sample that is
280 units. For example, one of the respondents has at least 1
to 5 television units. Most respondents have started to use
laptop than computer (see Table I).
TABLE I.
THE PROPORTION OF THE USE OF ELECTRONIC
EQUIPMENT
1 items 2 items 3 items >3 items
Rice cooker 186 16 0 0
Water dispenser 153 2 0 0
Refrigerator 186 13 0 0
Juice blender 144 4 0 0
Electric stove 8 0 0 0
Handy mixer 87 0 0 0
Microwave 24 0 0 0
Coffee maker 6 0 0 0
Toaster 32 0 0 0
Food processor 2 0 0 0
Air conditioner 38 12 0 0
Electric fan 93 59 27 11
Television 141 41 16 2
Personal Computer 54 5 0 0
Laptop 68 53 15 7
DVD/CD Player 90 2 0 0
Video game 31 1 0 2
Handphone 26 33 33 85
Washing machine 142 5 0 0
Iron 191 9 0 0
Water pumps 106 3 0 0
Har dryer 14 1 0 0
Vacuum cleaner 27 1 0 0
CFL 61 20 7 59
Incandescent bulb 11 24 9 51
Number of household based on the
appliance possession
Appliance
C. Household’s Characteristics and Behavior
Correlation
Attitude
Household characteristics that influence the attitude of
energy saving in the household are the income, the number
of family members, and the building area of the house. The
area of the house and the family income influence
significantly. When the peak load, 39% of households
turning off two or more lights while 11% of non-lethal
electrical equipment while power is still adequate dominated
by households with middle to upper incomes. The action of
turn off the electronic equipment during the peak load was
motivated by the hope of cheaper electricity bills. The
results showed that most of the respondents (98%) suggested
energy-saving habits to their family members.
Electricity Price
The household response to the energy price is influenced
by the head of household’s occupation, the level of
education, and the income. The level of education and
household income has significant influence. The households
with the highest education level of family members is in high
school, but has arrange of 3-5 million income considered
that the electricity rates is cheap. The households with level
of education is undergraduate degree with 1-3million income
per month also found the electricity rates is cheap. 51% of
the households choose to reduce power consumption when
the electricity rates increase. However, only 11% of
households who choose to replace equipment with more
energy efficient.
Household Income
Proceedings of the International MultiConference of Engineers and Computer Scientists 2015 Vol II, IMECS 2015, March 18 - 20, 2015, Hong Kong
ISBN: 978-988-19253-9-8 ISSN: 2078-0958 (Print); ISSN: 2078-0966 (Online)
IMECS 2015

Gender, housing size, jobs, education level, household
income, electricity bill payment method, and customer class
influence household spending on electricity and electronic
equipment.20% of respondents said replacing electronic
equipment with more energy efficient when getting more
income. From the survey15% of households know not to use
energy saving lamps (CFL). The level of education greatly
affects the choice. Average household that does not use
energy-saving light is the highest level of junior and senior
high school education. They argued that the price of the
energy-saving lamps are more expensive.
Knowledge
Household knowledge about energy saving attitude is
influenced by gender, age, house size, number of family
members, income, utility bills payment method, and
customer class. Age very significant influence on the
probability of respondents informed electrical energy saving.
Media is considered to be a potential for energy-efficient
information dissemination is a television, chosen as much as
91% of respondents.
Other Determinants
Home building design influence on power consumption,
especially lighting needs. 35% of households do not pay
attention to the house design in an effort to save electricity.
Mostly, because they do not have knowledge of it, while
other households have limited fund for the re-design of the
house. Other factors include the priority of respondents in
choosing electronic equipment. Fig 4 shows that 39%
households purchase electric appliances because of the
quality of the equipment. Only 3% households think that
electric power in watt is important factor on choosing the
electric appliances.
Fig 4. Factor’s driving in purchase electric appliances
IV. CONCLUSION
This research observes the behavior patterns of electrical
energy saving in households and seeks the potential of
electricity saving through behavioral changing in this sector.
Padang demography related to the number of samples
participated in this study are classified into the social,
economic, and use of technology aspects. The results of the
interviews show that households tend to unconcern about
their electricity saving habit because the energy prices are
reasonably cheap so that in range of affordability of the
households to pay, especially for households who have
middle to high income. The households tend to consume
more electricity as long they afford to pay the electricity
bills. The households in Padang are not so well informed
about energy efficient equipment, so it is not a priority in
their effort to control power consumption. Households need
to be more educated through sufficient information primarily
from broadcast media to help them taking action in
behaviorally change in electricity energy saving. These
findings will provide a scientific evidence for stakeholders
on the potential of controlling electricity consumption and
designing energy policy by government in residential sector.
ACKNOWLEDGMENT
This research was financial supported by Andalas
University West Sumatera Indonesia, the author would like
to thank and give special thank to household’s samples of
electricity user at Padang region.
REFERENCES
[1] Ministry of Handbook of Energy and Economic Statistics of
Indonesia.(2012). Ministry of Energy and Mineral Resources of the
Republic of Indonesia.
[2] C. Seligman, J.M. Darley, L. Becker, Behavioural approaches to
residential energyconservation, Energy and Buildings 1 (1977) 325–
337.
[3] P.C. Stern, Energy Efficiency in Buildings: Behavioural issues,
National AcademyPress, Washington, DC, 1985.
[4] P.C. Stern, Towards a coherent theory of environmentally significant
behaviour,Journal of Social Issues 56 (2000) 407–424.
[5] J. Owens, H. Wilhite, Household energy behaviour in Nordic
countries: an unre-alized energy saving potential, Energy 13 (1988)
853–859.
[6] L. Lutzenhiser, Social and behavioural aspects of energy use, Annual
Review ofEnergy and the Environment 18 (1993) 247–289.
[7] C. Mullaly, Home energy use behaviour: a necessary component of
successfullocal government home energy conservation programs,
Energy Policy 26 (1998)1041–1052.
[8] L. Steg, Promoting household energy conservation, Energy Policy 36
(2008)4449–4453.
[9] O. Guerra-Santin, L. Itard, H. Visscher, The effect of occupancy and
buildingcharacteristics on energy use for space and water heating in
Dutch residentialstock, Energy and Buildings 41 (2009) 1223–1232.
[10] O. Guerra-Santin, L. Itard, Occupants’ behaviour: determinants and
effects onresidential heating consumption, Building Research and
Information 38 (2010)318–338.
[11] K. Gram-Hansen, Residential heat comfort practices: understanding
users,Building Research and Information 38 (2010) 175–186.
[12] K. Gram-Hansen, Households’ energy use – which is the more
important: effi-cient technologies or user practices, in: Proceedings of
the World RenewableEnergy Congress, Linkoping, Sweden, 2011.
[13] C. J. Andrews, H. C. Putra, and.C. Brennan, ―Simulation Modeling of
Occupant Behavior in Commercial Buildings,‖ Center for Green
Building, Rutgers University, 2013.
[14] Z. Wang, B. Zhang, J. Yin, and Y. Zhang, ―Determinants and Policy
Implications for Household Electricity-Saving Behaviour: Evidence
from Beijing, China,‖ in Energy Policy, 39, 3550-3557, 2011.
[15] M. E. Wijaya, and T. Tetsuo, ―Electricity Saving Potential in
Indonesian Households: A Techno-Socio-Economic Analysis,‖ 4th
International Conference on Sustainable Energy and Environment,
Bangkok, 2012, pp. 565-571.
[16] I. Sukarno, M. Hiroshi, and L. Susanti, ―Energy Consumption Based
on a Cohort Model in a Local City of Indonesia,‖ 12th International
Conference on Sustainable Energy Technologies, Hongkong, 2013.
[17] Wang, Z., et al., 2011. Determinants and policy implications for
household electricity- saving behavior: evidence from Beijing, China.
Energy Policy 39, 3550–3557.
[18] Li, G., Niu, S., Ma, L., Zhang, X., 2009. Assesment of environmental
and economic costs of rural household energy consumption in Loess
Hilly Region, Gansu Province, China. Renewable Energy 34, 1438–
1444.
[19] Ouyang, J., Hokao, K., 2009. Energy saving potential by improving
occupants behavior in urban residential sector in Hangzhou City,
China. Energy Policy 41, 711–720.
Proceedings of the International MultiConference of Engineers and Computer Scientists 2015 Vol II, IMECS 2015, March 18 - 20, 2015, Hong Kong
ISBN: 978-988-19253-9-8 ISSN: 2078-0958 (Print); ISSN: 2078-0966 (Online)
IMECS 2015
[20] Zhou, Z., Wu, W., Chen, Q., Chen, S., 2008. Study on sustainable
development of rural household energy in northern China. Renewable
and Sustainable Energy Reviews 12, 2227–2239.
[21] Xiaohua, X., Zhenmin, F., 2005. Study on affecting factors and
standard of rural household energy consumption in China. Renewable
and Sustainable Energy Reviews 9, 101–110.
[22] Y. Febrizal, ―Electricity Energy Needs Prediction of Padang City
Until 2020,‖ Electrical Departement Journal of ITP, No. 1. Januari
2012.
Proceedings of the International MultiConference of Engineers and Computer Scientists 2015 Vol II, IMECS 2015, March 18 - 20, 2015, Hong Kong
ISBN: 978-988-19253-9-8 ISSN: 2078-0958 (Print); ISSN: 2078-0966 (Online)
IMECS 2015