assessing environmental contamination from a pentachlorophenol fire: screening soils for...
TRANSCRIPT
Chemosphere, Vol.17, No.9, pp 1831-1850, 1988 0045-6535/88 $3.00 + .00 Printed in Great Britain Perqamon Press plc
ASSESSING ENVIRONMENTAL CONTAMINATION FROM A PENTACHLOROPHENOL FIRE:
SCREENING SOILS FOR OCTACHLORODIBENZO-~-DIOXIN
William M. Draper* and Jane Phillips,
California Public Health Foundation,
2151 Berkeley Way, Berkeley, CA 94704
Martha Harnly
State of California Department of Health Services,
Epidemiological Studies and Surveillanc~ Section,
2151 Berkeley Way, Berkeley, CA 94704
Robert D. Stephens
State of California Department of Health Services,
Hazardous Materials Laboratory,
2151 Berkeley Way, Berkeley, CA 94704
ABSTRACT
Evaluation of environmental contamination caused by pentachlorophenol (PCP)
fires is extremely costly and time consuming because elaborate measurements
of polychlorinated dibenzodioxin and furan (PCDD/F) isomers are required.
Large geographic areas may potentially be affected greatly increasing the
number of samples required for adequate investigation. Our laboratory has
developed a rapid gas chromatography procedure for measurement of soil-bound
octachlorodibenzo-~-dioxin (OCDD), a probe for PCP combustion products.
Congener profile analyses of PCP combustion samples in our laboratory and
others have revealed that OCDD is the principal PCDD/F product and, thus, a
useful marker for these substances. For the screening procedure, composited
soil samples are sieved and Soxhlet extracted with hexane. Quantitative
analysis of OCDD in soil extracts is accomplished by capillary gas-liquid
chromatography (GLC) using on- column injection and a 63Ni electron capture
detector. Recoveries were >99% (at 20 ug/kg) and, without supplemental sample
cleanup, the method detection limit was 6 ug/kg, adequate for detection of
1831

1832
OCDD above expected background levels. OCDD levels determined by this method
agreed with those measured by gas chromatography-mass spectrometry (GC-MS).
The OCDD screening procedure was used to investigate contamination from a
recent industrial fire in northern California that consumed an estimated
4,500 kg of PCP and was predicted to impact an area of about 2,000 km 2. For
this incident a weighted, stratified sampling scheme was used to locate
sampling points in communities in the path of the plume. Environmental
sampling was stratified on ground level exposure concentration (or
deposition) contours predicted by atmospheric dispersion modeling conducted
by Systems Applications Inc. (San Rafael, CA). The number of samples
collected in each contour was determined by the predicted degree of
deposition as well as population.
The combined application of soil screening for OCDD and sampling based on
human exposure potential provides a rapid means for evaluating PCDD/F
contamination caused by PCP fires.
INTRODUCTION
Northern California PCP Fire
In the spring of 1987 a fire occurred at a wood treatment facility located
near the north-central California community of Oroville. Preliminary
estimations by the site operator indicated that about 4,500 kg of
pentachlorophenol were consumed on combustion of a wood treatment mixture
consisting of liquified butane (85% w/w), PCP (5%), isopropyl ether (5%) and
No. 2 fuel oil (5%). The fire was fueled by the contents of a single hopper
on which the emission estimates were based, although a second vapor plume was
observed rising from a silo containing technical PCP and partially engulfed in
flames.
The fire produced a dense plume of black smoke thoughout its 6.5 hour
duration indicating incomplete combustion and the formation of submicron
aerosols. Signs of dermal exposure to PCP aerosols and symptoms of PCP
poisoning were observed in over I00 residents within 2 to 3 miles of the
site. The major concern among public health officials, however, was the
potential for exposure to extremely toxic PCDD/F produced on incomplete
combustion of the pesticide.
1833
Contaminants in Technical PCP and PCP Pyrolysis.
Technical PCP contains numerous byproducts including tetra- and tri-
chlorophenols, hexachlorobenzene and PCDD/F (1,2). Recent European
production batches of PCP contain -i mg PCDD/F per g of technical product,
principally the hepta- and octachloro- congeners (3). Furthermore,
predioxins (polychlorinated phenoxyphenols) constitute about 3 to 6% by
weight of the commercial pesticide.
Pyrolysis or low temperature combustion (e.g., <900°C) of PCP greatly
increases the PCDD/F content (4 - 8). PCDD/F formation has been observed on
incineration of a variety of chlorinated phenols, chlorophenol-containing
wood preserving formulations, treatment residues and treated wood (7). The
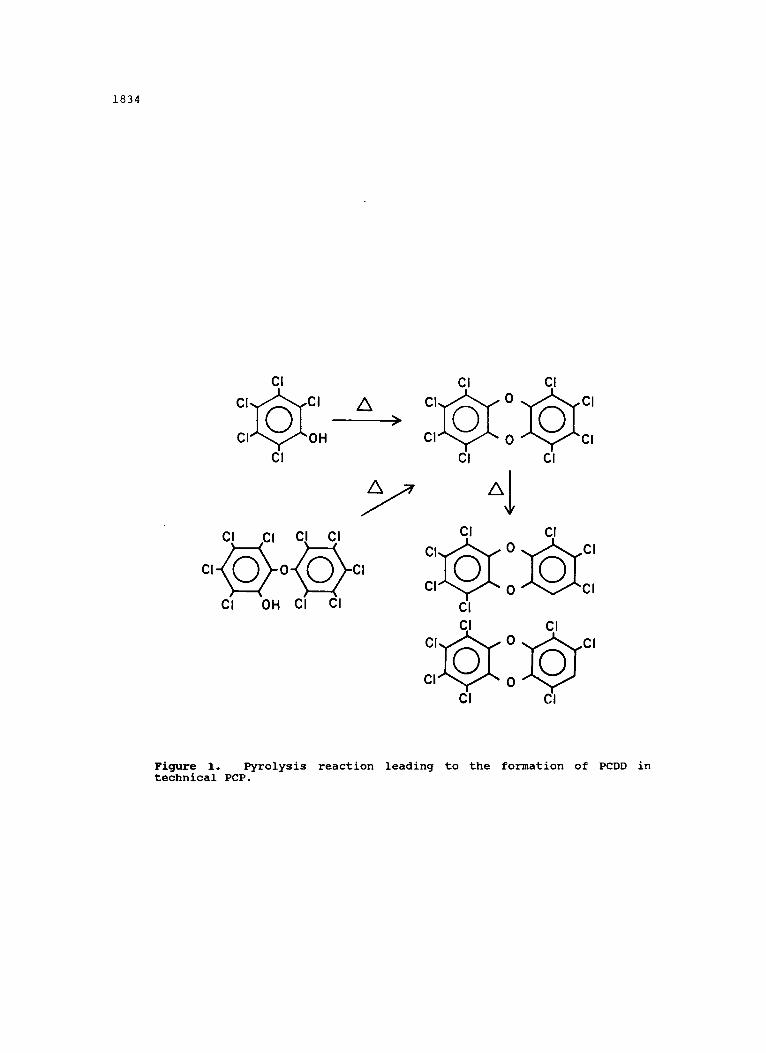
heating of PCP is believed to form chlorinated dioxins by dimerization and
dechlorination reactions, and cyclization of predioxin contaminants (9)
(Figure i.). As indicated in Figure 1 pyrolysis of PCP preferentially
increases the OCDD content (8,10).
The chemical composition of the combustion products at the California fire
was examined at the Hazardous Materials Laboratory by isomer- specific
analyses of soil, vegetation, surface wipes, and bulk samples from the burn
area at the wood treatment plant. Of these samples one charred PCP sample
collected beneath the butane hopper cone provided an indication of the
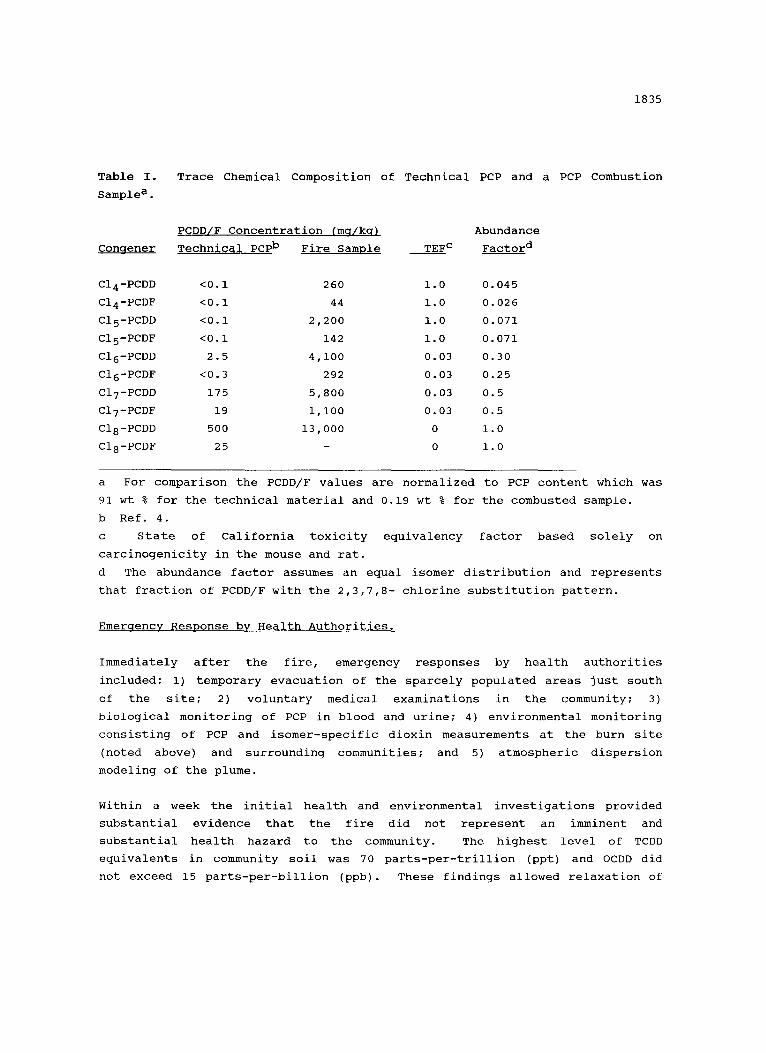
composition of the combusted material. This product was greatly enriched in
tetra- through octa- isomers (Table I.) as indicated by the congener data.
The production of these compounds would be expected in the 700 - 800°C
temperatures developed in the butane fire.
The charred material analyzed and (presumably combustion aerosols emitted)
were substantially more toxic than PCP. The technical material was estimated
to contain 2.9 parts-per-million (ppm) TCDD equivalents while the pyrolyzed
product contained 321 ppm TCDD equivalents.
1834
Cl CI.,~Cl
Cl'~,,,r~ OH Cl
A
Cl OH Cl Cl
>
Cl Cl Cl~ 0 ~Cl
Cl 0 Cl Cl CI
Cl CI Cl~ 0 ~Cl
Cl 0 Cl Cl Cl Cl c, o c,
Cl 0 Cl Cl
Figure 1. Pyrolysis reaction leading to the formation of PCDD in technical PCP.
1835
Table I.
Sample a .
Trace Chemical Composition of Technical PCP and a PCP Combustion
PCDD/F Concentration (ma/kq) Abundance
Congener Technical PCP b Fire Sample TEF c Factor d
CI4-PCDD <0.i 260 1.0 0.045
CI4-PCDF <0.I 44 1.0 0.026
CI5-PCDD <0.i 2,200 1.0 0.071
CI5-PCDF <0.i 142 1.0 0.071
CI6-PCDD 2.5 4,100 0.03 0.30
CI6-PCDF <0.3 292 0.03 0.25
CI7-PCDD 175 5,800 0.03 0.5
CI7-PCDF 19 i,i00 0.03 0.5
CI8-PCDD 500 13,000 0 1.0
CI8-PCDF 25 - 0 1.0
a For comparison the PCDD/F values are normalized to PCP content which was
91 wt % for the technical material and 0.19 wt % for the combusted sample.
b Ref. 4.
c State of California toxicity equivalency factor based solely on
carcinogenicity in the mouse and rat.
d The abundance factor assumes an equal isomer distribution and represents
that fraction of PCDD/F with the 2,3,7,8- chlorine substitution pattern.
Emergency Response by Health Authorities.
Immediately after the fire, emergency responses by health authorities
included: i) temporary evacuation of the sparcely populated areas just south
of the site; 2) voluntary medical examinations in the community; 3)
biological monitoring of PCP in blood and urine; 4) environmental monitoring
consisting of PCP and isomer-specific dioxin measurements at the burn site
(noted above) and surrounding communities; and 5) atmospheric dispersion
modeling of the plume.
Within a week the initial health and environmental investigations provided
substantial evidence that the fire did not represent an imminent and
substantial health hazard to the community. The highest level of TCDD
equivalents in community soil was 70 parts-per-trillion (ppt) and OCDD did
not exceed 15 parts-per-billion (ppb). These findings allowed relaxation of
1836
emergency measures and commencement of cleanup in the burn area. There were,
however, lingering concerns that toxic substances released from the fire had
contaminated the community and continued to represent a threat to public
health. Theoretically, the fine combustion aerosols produced in the fire
would not be expected to undergo rapid deposition due to their low
sedimentation velocity, but no experimental data were available to support
this view.
Objectives of this Study
The objective of this work was to define the distribution of PCP combustion
products over an extended area. Atmospheric dispersion modeling was used to
predict areas of maximum ground-level impact and, in combination with census
data, the sampling intensity. OCDD was selected as a marker for PCDD/F
because of its: i) abundance in pyrolyzed PCP; 2) similarity in environmental
fate and mobility to the more toxic PCDD/F; and 3) speed and low cost of
analysis. The methods developed for this study may prove generally useful in
evaluating future contamination from PCP fires or those of other chlorinated
aromatic compounds.
EXPERIMENTAL SECTION
Quantitative Analysis for OCDD in Soil
Korfmacher and coworkers (11,12) described an analytical procedure for
determination of OCDD and CIT-PCDD in dust and surface wipe samples from
building interiors contaminated by PCB-transformer fires. The present soil
method is similar except that the cleanup steps involving partition of the
extracts with acid and base, and high pressure liquid chromatography on an
active carbon column were unnecessary for the soil matrix.
Chemicals. OCDD was obtained from Cambridge Isotope Laboratories (Woburn,
MA). Solvents were commercially-available, pesticide grade and other
chemicals were reagent grade.
Soil Extraction. Soil composites were mixed thoroughly by agitation and
passed through a #18 sieve (i.0 mm openings). The total sample weight and
fines weight were recorded. A portion of the fine soil fraction (i0.0 +/-
0.I g) was added to a paper Soxhlet thimble with a wad of glass wool to
retain the sample. The Soxhlet receiver was charged with 200 mL of hexane

1837
and glass beads and samples were extracted for three hours after the first
cycling. Extracts were cooled and reduced just-to-dryness on a rotary flash
evaporator and the residue dissolved in isooctane. The isooctane was dried
by passing the solution through a sodium sulfate column prepared in a Pasteur
pipet. The final sample volume was adjusted to 5.0 mL giving 2.0 g soil
equivalent/mL of solvent.
Quantitation of OCDD. A Hewlett-Packard 5890A gas chromatograph (Avondale,
PA) fitted with a 63Ni electron capture (EC) detector and a J & W Scientific
capillary on-column injector (Rancho Cordova, CA) was used for quantitative
analysis. A Spectra-Physics Model No. 4290 recording integrator (San Jose,
CA) was used to measure peak areas. The instrument operating conditions were
as follows: range, 3; attenuation, I; digitizer attenuation, 4; detector
temp., 325°C; detector purge gas, 60 mL/min argon-methane (90:10, v/v) ; column
head pressure; 9.0 psi; carrier gas flow, 1.8 mL He/min; injector purge flow,
12 mL/min. The GLC column was a 30 m X 0.32 mm ID fused silica capillary with
a chemically-bonded 0.25 um SPB-5 silicone phase (equivalent to SE-54)
(Supelco, Bellefonte, PA). The column originally had an efficiency of -2,500
effective plates/m and a 97% coating efficiency, but had been used extensively
and was previously cleaned by rinsing with pentane and methylene chloride.
Purged splitless injection with inlet temperatures between 175 and 250 °C
(purge off time, 1 min; initial column temp., 80°C for 2 min; temp. programmed
at 40°C/min to 280°C; OCDD tR, -35 min) was evaluated in preliminary studies
and found to be inadequate due to poor peak shape and reproducibility.
Two uL injections were used routinely. The oven temperature was isothermal
at 285°C resulting in a retention time of about ii minutes for OCDD.
External calibration was by peak area relative to a 40 pg/uL standard in
isooctane -- for determination of detector linearity standards between 1 and
400 pg/uL were used. OCDD was identified by retention time (tR) with an
acceptance criterion of +/- 0.i min.
Method Detection Limit Study
A soil sample from the Oroville area was mixed and sieved as described above.
Ten g samples were placed in Soxhlet thimbles and spiked at 20 ug/kg by
addition of 200 uL of a 1.0 ng OCDD/uL isooctane solution. Replicate analyses
of spiked (n = 7) and unspiked soil were used to determine method precision
and accuracy.
1838
Atmospheric Dispersion Modelinq
The dispersion of gaseous and fine aerosol emissions was modeled by Systems
Applications Inc. (San Rafael, CA) with the objective of reconstructing
ground-level pollutant concentrations (13). This information was needed to
identify potentially exposed populations and quide further environmental
sampling. A U. S. Environmental Protection Agency (EPA) model, INPUFF of the
UNAMAP VI model package, was used. This model predicts the plume rise and
path from inputed meteorology data (e.g., surface temperature, temperature
aloft, wind speed and direction, atmospheric stability, mixing height) and
data on the characteristics of the fire (e.g., flare dimensions, heat
produced). Other forms of evidence including videotape footage, photographs
and eyewitness accounts were examined for corroboration. The EPA model was
used because it allowed the inputed factors to vary by time of day and had
regulatory recognizance.
Modeling revealed that the plume initially moved south from the site, away
from population centers. The plume rose 50 to 60 m due to the intense heat
generated and emissions penetrated the inversion layer minimizing impacts at
ground level. As the fire progressed both the meteorologic conditions, and
the characteristics of the fire changed. The wind direction shifted from a
northerly to a southerly direction and both the wind speed and the mixing
height increased. The height of the flare diminished as both the fuel
consumed and heat generated declined. During the late stages of the fire the
plume did not climb as high into the atmosphere and was carried north toward
more highly populated areas.
Modeling predicted that the gaseous and fine particle emissions were
dispersed over a large geographic area providing a sizable dilution factor.
Maximum impacts normalized over the 6.5 hour fire were predicted along two
paths, one to the southwest (SW) and the second to the north (N). Within
each path, modeling predicted areas of maximum concentration and isopleths
of lesser concentration surrounding each maximum. Predicted deposition
within the isopleths was unitized relative to the maxima because of the lack
of reliable data on PCP consumed and the composition of emissions. This
provided information on relative impacts to surrounding communities, but no
predictions as to air or soil concentrations.
1839
Stratified Sampling Based on Plume Modeling and Census Data
Thirty sites were sampled during the initial survey. The number of sampling
sites within each isopleth was decided by weighting on the modeled relative
ground-level exposure and on population within each isopleth. To estimate the
population the 1980 U. S. census enumeration district centroids in each
maximum and isopleth were summed, and the proportion of the total population
in the two plume paths was calculated. The proportion was then multiplied by
the exposure intensity to produce a combined deposition and population
weighting factor. The fraction of the total samples collected in each maximum
and isopleth was then equal to the relative weight of the combined weighting
factor for the isopleth or maximum.
The specific sample locations within each maximum and isopleth were
determined by systematic sampling. A fine grid (over 2,000 cells) was
superimposed over each geographic isopleth and maximum. Grid cells with
streams, lakes, and other bodies of water were deleted. The number of grid
cells in each isopleth was divided by the total number of alloted samples in
each isopleth to equal n and a sample location was then selected at every nth
cell.
Soil Sampling
At the designated sampling site a grid was layed out to identify four points
at the corners of a 4 foot square where a i0 X i0 cm area was marked with a
template. The surrounding soil was cleared away and approximately 2 cm of the
elevated plateau were collected. The four samples were combined in a glass
sample container with a Teflon-lined closure giving a composite of -700 g.
0CDD Measurements by GC-MS
The PCP combustion sample was analyzed for PCDD/F using EPA method 8280 with
sample extraction modifications developed by C. Rappe and coworkers. The
sample was Soxhlet extracted with toluene for over 8 hours followed by
extract cleanup on silica/sulfuric acid, potassium silicate, alumina and
carbon columns. Final extracts (i0 to i00 uL) were analyzed bY GC/MS using
electron impact ionization and multiple ion detection. Recoveries of
isotopically-labeled internal standards were consistently above 50%. To
confirm OCDD in soil extracts the original extract was diluted, spiked by
1840
addition of labeled internal standards, and then analyzed directly for tetra-
through octa- PCDD/F.
RESULTS
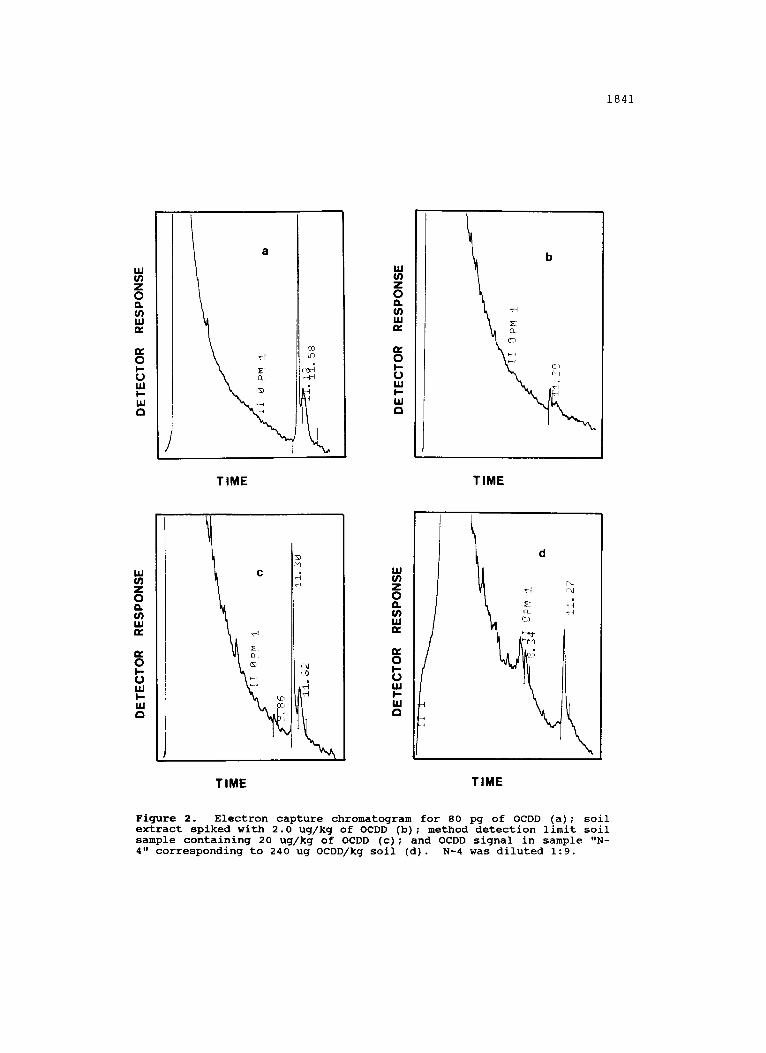
Analysis of OCDD in soil
When using an on column capillary injector OCDD exhibited a sharp
chromatographic peak and excellent reproducibility and linearity. The
practical instrument detection limit was -5 X 10 -12 g. Soil samples
subjected to the analytical procedure were free of interfering signals and
were only distinguishable from solvent injections by their broader solvent
peak and minor shoulder peaks. Soil extracts fortified with OCDD at 2 ug/kg
of soil (Figure 2.) gave a distinct chromatographic signal quantified as 1.9
ug/kg (RSD = 11%, n = 5).
To determine the method detection limit (MDL) seven soil samples were spiked
at 20 ug/kg and then carried through the entire analysis procedure. The mean
and standard deviation of these measurements were 20 +/- 2.1 ug/kg
corresponding to an MDL of about 6 ug/kg. With 2 uL manual sample injections
the expected precision was about 10% RSD indicating that the MDL may actually
be lower than estimated here.
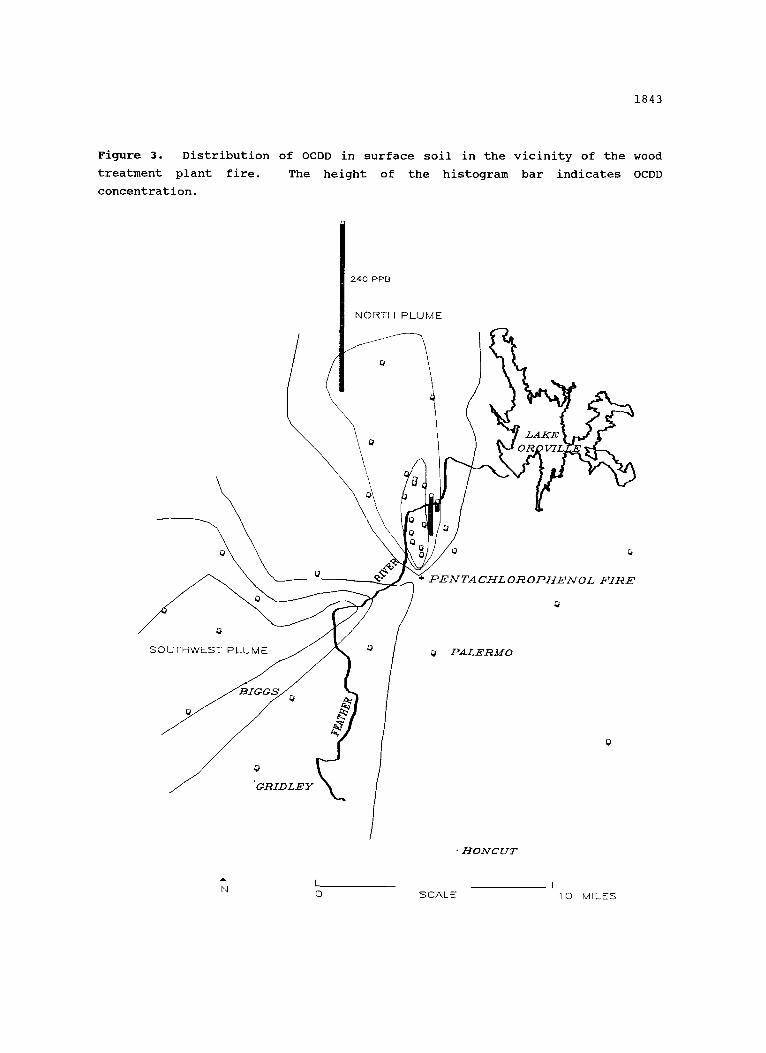
Soil OCDD Distribution in the Community
The majority of the soil samples taken were coarse sand with the fine
fraction accounting for between 7 and 71% of the sample weight (Table II.).
OCDD was not detected anywhere in the southwest path of the plume where
surface soil from i0 sites was analyzed (Figure 3.). OCDD also was not
detected in three "background" sites in the Palermo area east of the wood
treatment plant. To the north of the fire OCDD was detected at 4 of the 20
sites tested and measured levels were 6.5, 34, 59 and 240 ug/kg. OCDD was
not detected in 16 of 20 of the sites located to the north of the fire.
OCDD was confirmed in the high concentration extract by GC/MS analysis using
an isotopically-labeled internal OCDD standard. By this procedure the OCDD
content was estimated at 290 ug/kg.
1841
W U~ Z 0
Ul uJ
0 I-- U u l I,,- W
/
0 : i , L I I ,
• ¢ - I
\
UJ (/1 Z 0 a. (n i i i
n, 0 I - U ILl I-- i i i C3
b
T I M E T I M E
uJ (/1 Z 0 a. (/1 uJ
¢v
0
U uJ I-- ILl
t
i
W u l Z 0 o. (/1 ,,,/ 0 I,,- U W I-,- w D
l } cl r.-
- ( , I
T I M E T I M E
Figure 2. Electron capture chromatogram for 80 pg of OCDD (a) ; soil extract spiked with 2.0 ug/kg of OCDD (b); method detection limit soil sample containing 20 ug/kg of OCDD (c); and OCDD signal in sample "N- 4" corresponding to 240 ug OCDD/kg soil (d). N-4 was diluted 1:9.
1842
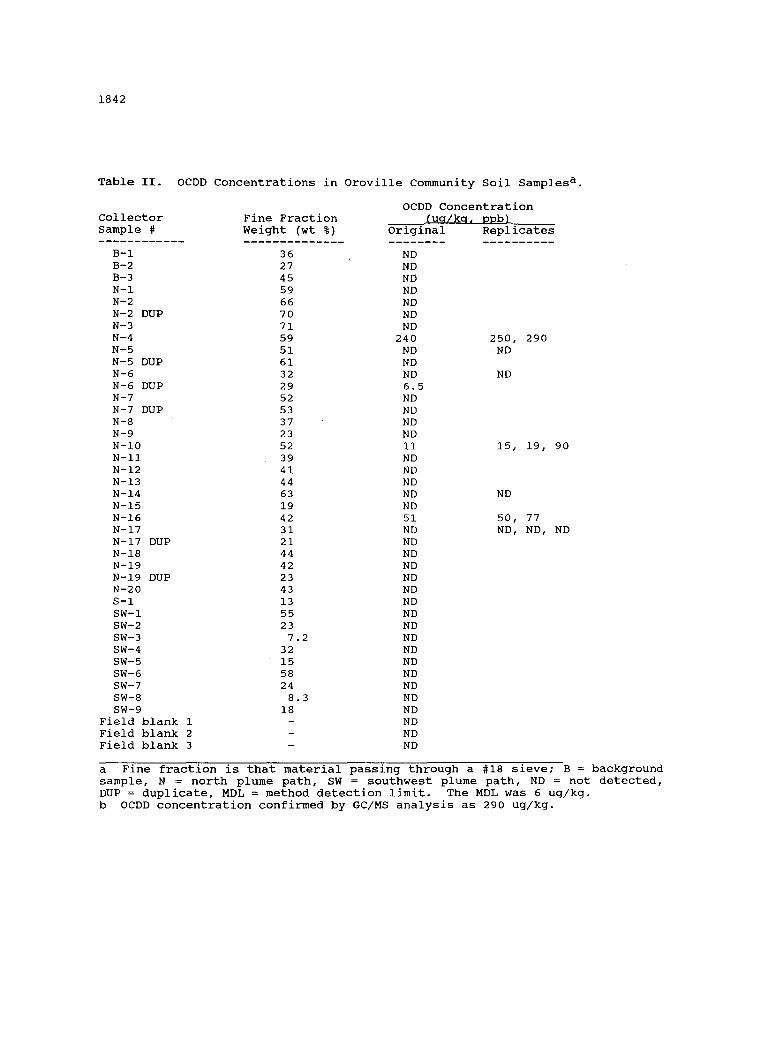
Table II. OCDD Concentrations in Oroville Community Soil Samples a.
OCDD Concentration Collector Fine Fraction Cuq/ka. DDb} Sample # Weight (wt %) Original Replicates
B-I 36 ND B-2 27 ND B-3 45 ND N-I 59 ND N-2 66 ND N-2 DUP 70 ND N-3 71 ND N-4 59 240 250, 290 N-5 51 ND ND N-5 DUP 61 ND N-6 32 ND ND N-6 DUP 29 6.5 N-7 52 ND N-7 DUP 53 ND N-8 37 ND N-9 23 ND N-10 52 ii 15, 19, 90 N-II 39 ND N-12 41 ND N-13 44 ND N-14 63 ND ND N-15 19 ND N-16 42 51 50, 77 N-17 31 ND ND, ND, ND N-17 DUP 21 ND N-18 44 ND N-19 42 ND N-19 DUP 23 ND N-20 43 ND S-I 13 ND SW-I 55 ND SW-2 23 ND SW-3 7.2 ND SW-4 32 ND SW-5 15 ND SW-6 58 ND SW-7 24 ND SW-8 8.3 ND SW-9 18 ND
Field blank 1 - ND Field blank 2 - ND Field blank 3 - ND
a Fine fraction is that material passing through a #18 sieve; B = background sample, N = north plume path, SW = southwest plume path, ND = not detected, DUP = duplicate, MDL = method detection limit. The MDL was 6 ug/kg. b OCDD concentration confirmed by GC/MS analysis as 290 ug/kg.
1843
Figure 3. Distribution of OCDD in surface soil in the vicinity of the wood
treatment plant fire. The height of the histogram bar indicates OCDD
concentration.
240 PPB
N O R T H P L U M E
/
/ / / , / • 0
PENTA CHLOROPHENOL FIRE
0
S O U T H W E S T P L U M E 0 PALERMO
GRIDLEY
"HONCUT
O S C A L E 1 0 M I L E S

1844
DISCUSSION
Rationale for selectinq OCDD as a marker
A marker or surrogate for PCDD/F must satisfy certain requirements among
which ease of analysis is of obvious importance. Many of the technical
challenges associated with PCDD/F analysis do not plague OCDD measurement.
Extensive sample cleanup is required in PCDD/F analysis due to a variety of
interferences including chlorinated- biphenyls, diphenyl ethers,
phenoxyphenols, and other compounds, some of which are much more abundant in
the environment than the dioxins. Due to its high molecular weight, OCDD
elutes late in a relatively clean portion of the gas chromatogram after
pesticides and most PCBs on non polar columns (ll).
OCDD is perchlorinated and therefore the difficulties in distinguishing the
75 PCDD and 135 PCDF isomers are avoided. Finally, because of its high
abundance in PeP combustion samples, analysis at the ppb level is adequate
whereas multicomponent dioxin analyses demand detectabilities in the low ppt
range. As a result requirements for instrumentation, highly trained
laboratory personnel, turn around times and laboratory costs are minimized.
The occurrence of the marker should correlate with the compounds of interest,
in this case the toxic chlorinated congeners. The correlation is less
critical if the marker is used in screening as opposed to a true surrogate for
purposes of human health risk assessment, or establishing cleanup levels.
Thompson and coworkers have successfully used OCDD as a reliable surrogate for
PCDD/F produced on incineration of PCB, but only after a thorough
investigation of the relationship between OCDD and PCDD/F concentrations
(12,14).
Our objective in screening was to extend analytical resources and maximize
the yield of useful data. The occurrence of a high number of elevated OCDD
values, or a consistent pattern of OCDD contamination, indicates the need for
congener or isomer specific PCDD/F measurements.
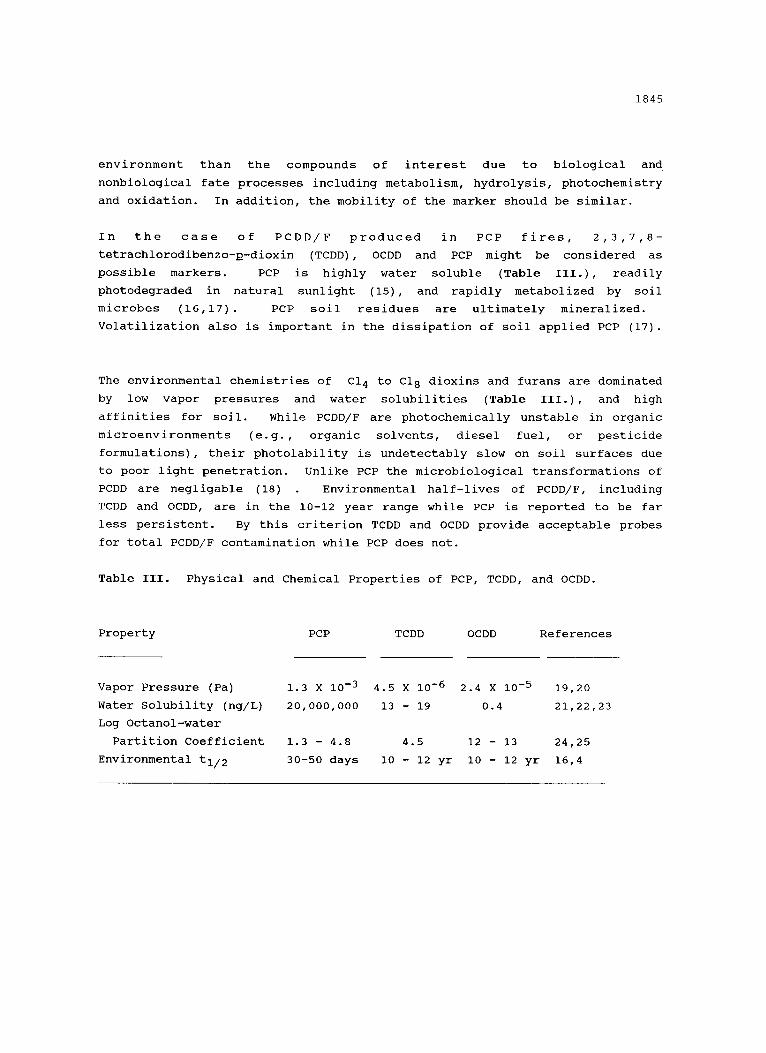
Finally, the marker must have physical and chemical properties (Table III.)
that ensure similar behavior to the compounds of interest in the environment
(e.g., fate, transport and persistence). The least acceptable condition is
that in which the marker molecule is considerably more labile in the
1845
environment than the compounds of interest due to biological and
nonbiological fate processes including metabolism, hydrolysis, photochemistry
and oxidation. In addition, the mobility of the marker should be similar.
In the case of PCDD/F produced in PCP fires, 2,3,7,8-
tetrachlorodibenzo-D-dioxin (TCDD) , OCDD and PCP might be considered as
possible markers. PCP is highly water soluble (Table III.) , readily
photodegraded in natural sunlight (15) , and rapidly metabolized by soil
microbes (16,17) . PCP soil residues are ultimately mineralized.
Volatilization also is important in the dissipation of soil applied PCP (17).
The environmental chemistries of Cl 4 to Cl 8 dioxins and furans are dominated
by low vapor pressures and water solubilities (Table III.), and high
affinities for soil. While PCDD/F are photochemically unstable in organic
microenvironments (e.g., organic solvents, diesel fuel, or pesticide
formulations), their photolability is undetectably slow on soil surfaces due
to poor light penetration. Unlike PeP the microbiological transformations of
PCDD are negligable (18) Environmental half-lives of PCDD/F, including
TCDD and OCDD, are in the 10-12 year range while PCP is reported to be far
less persistent. By this criterion TCDD and OCDD provide acceptable probes
for total PCDD/F contamination while PCP does not.
Table III. Physical and Chemical Properties of PCP, TCDD, and OCDD.
Property PCP TCDD OCDD References
Vapor Pressure (Pa)
Water Solubility (ng/L)
Log Octanol-water
Partition Coefficient
Environmental tl/2
1.3 X 10 -3 4.5 X 10 -6 2.4 X 10 -5 19,20
20,000,000 13 - 19 0.4 21,22,23
1.3 - 4.8
30-50 days
4.5 12 - 13 24,25
i0 - 12 yr I0 - 12 yr 1 6 , 4
1846
Interpretation of the Oroville Community Data.
The OCDD measurements in the Oroville area provide little evidence of
widespread PCDD/F contamination resulting from the fire, or any other event.
In the unlikely case that the deposition of particulate aerosols had
contaminated the community, a relatively uniform OCDD distribution,
particularly in areas of level terrain, would be expected in the near surface
soil. We conclude that there was little or no deposition of combustion
products where the plume tracked to the southwest and then north.
The detection of OCDD at high ppb levels at a single isolated location i0
miles to the north of the fire is probably related to the use of PCP in wood
treatment. The site sampled was within 20 feet of a preservative-treated
telephone pole at a cattle loading platform.
One limitation in using OCDD as a marker is its common occurrence in the
environment. OCDD is the most abundant PCDD/F compound in the environmental
compartments including air (26), sediments (27) and human adipose (28).
Background values as high as 5 ug/kg occur in the U. S. (e.g., in Lake Ontario
sediments). The widespread use of chlorinated phenols in wood preservatives
may give occassional spikes as suspected in the case of the elevated value in
this study. Atmospheric deposition in contrast would be expected to show a
more consistent and extensive contamination pattern.
Applicability of OCDD Screeninq to Fires Involving other Chlorinated Aromatic
Compounds.
Clearly OCDD is the most abundant PCDD/F produced on pyrolysis or combustion
of PCP and its salts. The lower chlorinated phenols, however, are distinctly
different and may produce little if any OCDD on combustion and relatively high
CI4-PCDD (Figure 4.) . Pyrolysis of 2, 4, 5-T herbicide or
2,4,5-trichlorophenol gives an 0.2 to 0.5% yield of TCDD and only traces of
OCDD (30). For chlorinated aromatics where OCDD is a relatively minor
incomplete combustion product compared to other PCDD/F, the utility of OCDD
as a marker should be reevaluated in relation to the goals of the
environmental monitoring program.

1847
u) ~J
o_o •
0o< .~0~ ~.0 w-
Oo~ ; r-,,, .
<
~00"0
L LO0"O
I~1 t, O 0 0 ' O
EO0"O
o
tn
co
tn
,q-
o o
ILl Z UJ
z 0 o
(J
~ 0 ~ > 0
0 r-~ r- .
o~
~.~ ~
0 04~
~ C O ~ 0 ~ 0 ~o "~q~
C4~
0 ' ~
~.~ g .
IM~.t
~ -,.-I 0 ~ 0
e ~ m
0,--1 I11
~'~ .~ .~
tn
1848
CONCLUSIONS
Environmental contamination from PCP fires is extremely costly due to the
requirement for sophisticated and time-consuming quantitation of PCDD/F
isomers, and the potential for contamination of large areas. After initial
chemical characterization of the pyrolyzed product with rigorous GC/MS
procedures, follow up screening by EC-GLC may prove valuable in identifying
potentially contaminated samples. The use of atmospheric dispersion modeling
and census data to define exposure potentials provides a rational approach to
guide environmental sampling.
ACKNOWLEDGEMENT
We thank Mark Leary, Linda Hennessy, and Jim Papararo of the CDHS, Toxic
Substances Control Division for collecting soil samples. Ted Belsky, Ruth
Chang, and Doug Hayward performed the isomer specific PCDD/F analyses. David
Siegel of the CDHS, Hazard Evaluation Section commented on the TEF estimates.
This work was presented at the 1988 Waste Testing and Quality Assurance
Symposium held in Washington, DC.
LITERATURE CITED
i. Rappe, C.; Gara, A.; Buser, H.R., Chemosphere 1978, i_22, 981.
2. Buser, H.R.; Bosshardt, H. P. J. Assoc. Off. Anal. Chem. 1976, 59, 562.
3. Cull, M.R.; Dobbs, A.J.; Goudot, M.; Schultz, N., Chemosphere 1984, 1/3,
115"7.
4. Rappe, C. Environ. Sci. Technol. 1984, I_88, 78A.
5. Rappe, C.; Marklund, S.; Bergqvist, P.A..; Hansson, M. Chlorinated
Dioxins Dibenzofurans Total Environment Symposium Proceedings, 1982, Edited
by G. Choudhary, L. Keith, and C. Rappe, Butterworth: Boston, Mass, 1983, pp.
91-124.
6. Rappe, C. ; Marklund, S. Pesticide chemistry.: Human Welfare
Environ.,Proc. Int. Congr. Pestic. Chem., 5th 1982, Edited by J. Miyamoto and
P. Kearney, Pergamon: Oxford, UK, 1983, pp. 317-322.

1849
7. Bridle, T.; Afghan, B.; Wilkinson, R.; Carron, J.; Sachdev, A. Proc. -
APCA Annu. Meet. 1984, 77th, l, 84-11.2.
8. Chemical Abstracts I00: 187191.
9. Rappe, C. ; Marklund, S., Chemosphere 1978, 3, 269.
i0. Rappe, C.; Buser, H.R.; Bosshardt, H.P. Ann. N. Y. Acad. Sci. 1979, 320,
i.
ii. Korfmacher, W.A.; Rushing, L.G.; Nestorick, D.M.; Thompson, H.C., Jr.;
Mitchum, R.K.; Kominsky, J.R., J. High Resolut. Chromatogr. Chromatogr.
Commun. 1985, 8, 12.
12. Korfmacher, W.A.; Rushing, L.G.; Nestorick, D.M.; Thompson, H.C., Jr.;
Mitchum, R.K.; Kominsky, J.R., Chemosphere 1985, 14, 847.
13. Modeling the Dispersion of a Plume Resulting from a Fire at the Koppers
Feather River Wood Treatment Plant, Systems Application, Inc., San Rafeal, CA,
May 19, 1987.
14. Thompson, H.C., Jr.; Kendall, D. C.; Korfmacher, W. A.; Rowland, K.L.;
Rushing, L. G.; Chen, J.J.; Kominsky, J.R.; Smith, L.M.; Stalling, D.L.
Environ. Sci. Technol. 1986, 20, 597.
15. Wong, A.S. ; Crosby, D.G., In: Pentachlorophenol: Chemistry,
Pharmacology, and Environmental Toxicology, edited by K. Rao, Plenum, New
York, 1978, pp. 19-25.
16. Kaufmann, D.D., In: Pentachlorophenol: Chemistry, Pharmacology, and
Environmental Toxicology, Edited by K. Rao, Plenum, New York, 1978.
17. Weiss, U.; Scheunert, I.; Klein, W.; Korte, F., J. Agric. Food Chem.
1982, 300, 1191.
18. Kearney, P.C., presented at the 2n_dd International Workshop on
Chlorinated Dioxins and Related Compounds, Arlington, VA, Oct. 25-29, 1981.
19. Cull, M.R.; Dobbs, A.J.; Williams, N., Chemosphere 1983, 12, 483.

1850
20. Rordorf, B. F., Chemosphere 1985, 14, 885.
21. Bailey, G. W.; White, J.L. Residue Rev. 1965, i0, 97.
22. Marple, L.; Brunck, R.; Throop, L. Environ. Sci. Technol. 1986, 2_O0, 180.
23. Friesen, K.J. ; Sarna, L.P.; Webster, G.R.B., Chemosphere 1985, 14, 1267.
24. Kaiser, K.L.; Valdmanis, I. Can. J. Chem. 1982, 60, 2104.
25. Sarna, L.P.; Hodge, P.E.; Webster, G.R.B., Chemosphere 1984, 13, 975.
Eitzer, B. D.; Hites, R.A., Intern. J. Environ. Anal. Chem. 1986, 27, 26.
215.
27. Czuczwa, J.M.; McVeety, B.D. ; Hites, R.A. Science 1984, 226, 568.
28. Hardell, L.; Domellof, L.; Nygren, M.; Hansson, M.; Rappe, C., Preprint
extended abstract ACS Division of Environmental Chemistry, Miami, FL, April,
1985, pp. 167-168.
29. Nestrick, T.J.; Lamparski, L.L., Anal. Chem. 1982, 54, 2292.
30. Lahaniatis, E.S.; Clausen, E.; Bieniek, D.; Korte, F. Chemosphere 1985,
14, 233.
(Received in Germany 6 June 1988; accepted 7 July 1988)