assessing data for the sustainable development goals in ... · assessing data for the sustainable...
TRANSCRIPT

---------------------------------- ----------------------------------
------------------------------
Assessing Data for the Sustainable
Development Goals in Tanzania
Blandina Kilama
Constantine George
Lucas Katera
Neema Rutatina
February 2016
Dar es Salaam, Tanzania

2
Content Acknowledgements .......................................................................................................................... 3 Acronyms and Abbreviations ............................................................................................................ 4 List of Tables, Figures and Boxes .................................................................................................... 5 Report Highlights.............................................................................................................................. 7 Introduction .................................................................................................................................... 15 Research Process .......................................................................................................................... 17 Post-2015 Priorities for Tanzania ................................................................................................... 19 End Poverty .................................................................................................................................. 21 Ensure Quality Education for All ..................................................................................................... 24 Create Jobs, Sustainable Livelihoods and Inclusive Growth for All ................................................. 27 Ensure Energy and Develop Infrastructure for Al l ........................................................................... 29 Establish a Sustainable, Healthy and Resilient Environment for All ................................................ 33 Establish Open, Accountable, Inclusive and Effective Institutions, Rule of Law and a Peaceful
and Inclusive Society ..................................................................................................................... 36 Establish a Global Partnership for Sustainable Development ......................................................... 39 Ensure Access to Quality Health Care for All ................................................................................. 43 Measuring Progress on Post-2015 in Tanzania .............................................................................. 46 Political Economy of the Data Revolution ....................................................................................... 56 Conclusion ..................................................................................................................................... 61 References ..................................................................................................................................... 63 Annex 1: Goals and Targets Identified During United Nations Consultations on the Post-2015
Agenda in Tanzania ....................................................................................................................... 65 Annex 2. List of Participants at Inception Workshop in Dar es Salaam ........................................... 66 Annex 3. List of Key Informant Interviewees ................................................................................... 67 Annex 4. Targets and Iindicators Examined for Tanzania ............................................................... 68
Annex 5. Targets and Indicators and Data Sources ........................................................................ 79 Annex 6. Data Quality Assessment Framework .............................................................................. 86

3
Acknowledgements
The Tanzania research team is grateful to the Think Tank Initiative and Southern Voice on Post-MDG
International Development Goals for supporting this project. We acknowledge support from the Southern
Voice Secretariat based at the Centre for Policy Dialogue (CPD) in Dhaka, Bangladesh, under the stellar
leadership of Dr. Debapriya Bhattacharya. We are grateful to Professor Mustafizur Rahman, Executive
Director of CPD, for actively participating in different forums and, most importantly, allowing us to seek
assistance from CPD staff. We thank our colleagues at the Norman Paterson School of International
Affairs (NPSIA) and The North-South Institute, especially Shannon Kindornay for organisational and
technical support. Special thanks go to participants at the inception workshop, focus group discussions
and validation workshop for their valuable comments. We are thankful for views from and discussions
held outside of Tanzania, which allowed us to strengthen the report. We also acknowledge the helpful
comments received from peer reviewers. Finally, our thanks go to Professor Samuel Wangwe, the then
Executive Director of REPOA, for allowing us to undertake this project, Dr. Donald Mmari, the current
Executive Director and the then Director of Research on Growth and Development, for monitoring the
project, Khadijah Omari, Events Management Officer, for logistical support and Hannah Mwandoloma,
Communications Officer, for handling matters related to communications. All errors and omissions remain
ours.

4
Acronyms and Abbreviations
BEST Basic Education Statistics in Tanzania
CSO civil society organisation
GDP gross domestic product
HIV/AIDS human immunodeficiency virus/acquired immune deficiency syndrome
ICT information and communications technology
JAST Joint Assistance Strategy for Tanzania
MDG Millennium Development Goal
MKUKUTA Mkakati wa Kukuza Uchumi na Kupunguza Umasikini Tanzania
NBS National Bureau of Statistics
NSGRP National Strategy for Growth and Reduction of Poverty
OCGS Office of Chief Government Statistician
PARIS21
PPP
Partnership in Statistics for Development in the 21st Century
purchasing power parity
REPOA
SDG
TEES
TSMP
Policy Research for Development
Sustainable Development Goal
Tanzania Employment and Earnings Survey
Tanzania Statistical Master Plan

5
List of Tables, Figures and Boxes
Tables and Figures
Table 1 End poverty: Targets and indicators 23
Table 2 Ensure quality education for all: Targets and indicators 25
Table 3 Create jobs, sustainable livelihoods and inclusive growth for all: Targets and
indicators
28
Table 4 Ensure sustainable energy and develop infrastructure for all: Targets and
indicators
31
Figure 1 Key challenges facing Tanzanian transport infrastructure 32
Table 5 Establish a sustainable, healthy and resilient environment for all: Targets and
indicators
34
Table 6 Establish open, accountable, inclusive and effective institutions, rule of law and a
peaceful and inclusive society: Targets and indicators
37
Table 7 Establish a global partnership for sustainable development: Targets and
indicators
41
Figure 2 Dimensions that hamper access to health services 43
Table 8 Data availability for measuring progress against global targets and indicators 51
Table 9 Key data sources for monitoring the SDGs in Tanzania 52
Table 10 Results of the data quality assessment 55
Table 4.1
Table 4.2
Table 4.3
Table 4.4
Table 4.5
Table 4.6
Table 4.7
End poverty: Targets and indicators
Ensure quality education for all: Targets and indicators
Create jobs, sustainable livelihoods, and inclusive growth for all: Targets and
indicators
Ensure sustainable energy and develop infrastructure for all: Targets and
indicators
Establish a sustainable, healthy and resilient environment for all: Targets and
indicators
Establish open, accountable, inclusive and effective institutions, rule of law and a
peaceful and inclusive society: Targets and indicators
Establish a global partnership for sustainable development: Targets and
indicators
68
69
70
72
74
76
77
Table 5.1 End poverty: Targets, indicators and data sources 79
Table 5.2 Ensure quality education for all: Targets, indicators and data sources 79
Table 5.3 Create jobs, sustainable livelihoods, and inclusive growth for all: Targets,
indicators and data sources
80
Table 5.4 Ensure sustainable energy and develop infrastructure for all: Targets, indicators
and data sources
82
Table 5.5 Establish a sustainable, healthy and resilient environment for all: Targets,
indicators and data sources
83
Table 5.6 Establish open, accountable, inclusive and effective institutions, rule of law and a
peaceful and inclusive society: Targets, indicators and data sources
84
Table 5.7 Establish a global partnership for sustainable development: Targets, indicators
and data sources
85

6
Boxes
Box 1 Extract from the National Environmental Policy 33
Box 2 Categories of data produced by NBS 47

7
Report Highlights
The year 2015 marked the end of the Millennium Development Goals (MDGs). Targets for many of the
goals were not reached by developing countries, including Tanzania. Scholars in the global South claim
that not achieving the MDGs is partly due to the fact that some targets and indicators were not realistic for
developing countries. The framework of the post-2015 development agenda, finalised and adopted in
September 2015 as the Sustainable Development Goals (SDGs), differs from that of the MDGs in
significant ways. The new framework is universal, meaning that it applies to both developing and
developed countries. Countries have greater space to determine their own development targets and
corresponding indicators by which they measure progress. The range of issues prioritised in the new
framework is broader and more complex. To better understand progress within a country, progress will be
measured in a disaggregated way. To support this framework, a “data revolution” has been called for to
enable governments and policy-makers to better track development progress and equip people with the
information they need to demand more from their governments.
Recognising the importance of tracking development progress, the Centre for Policy Dialogue and
Carleton University’s Norman Paterson School of International Affairs, in association with Southern Voice
on Post-MDG International Development Goals, are leading an initiative titled the Post-2015 Data Test.
The initiative aims to road-test a select set of candidate post-2015 goals, targets and indicators in a
number of low-, middle- and high-income countries. It assesses the adequacy of data available for
measuring post-2015 progress at the country level, seeking to inform debates and decisions on the
architecture and priorities of the data revolution. It also identifies opportunities and challenges that may
arise from a universal, country-relevant post-2015 framework, including key gaps in data availability and
accessibility.
The Tanzania case study of the Post-2015 Data Test, which was conducted by Dar es Salaam-based
research institute REPOA, highlights a number of issues. First is the importance of the SDGs in that they
are very relevant for Tanzania. Second, there are various initiatives at the national level that support the
data revolution and information about which data will be available and when. Thus, the SDGs provide an
excellent complement to these initiatives and should spur changes at the national level. Also, the issue of
capacity building among official and non-official data producers needs to be considered going forward.
Finally, the issue of financial sustainability to maintain the quality and consistency of statistics is
important.
SDG Priorities in Tanzania
Of the SDGs adopted in September 2015, the Post-2015 Data Test initiative touches on 12 of the 17
goals through the seven goal areas selected for study. The inception workshop for the Tanzania study
was held at REPOA in Dar es Salaam in 2014. It informed the study by convening stakeholders to refine
the proposed research objectives, methodology and implementation and outreach plans. The workshop
examined the appropriateness of specific goals, targets and indicators for Tanzania as well as the current
state of data availability, quality and accessibility in the country. To supplement information gathered
during the inception workshop, REPOA conducted key informant interviews with various stakeholders,
including officials from the National Bureau of Statistics (NBS), in order to assess perceptions of data
gaps, challenges associated with a universal, country-relevant framework and expectations for the data

8
revolution. What follows are Tanzania’s key priorities with respect to the seven goal areas examined
under the Post-2015 Data Test.
End Poverty
In recent years, Tanzania’s annual gross domestic product growth rate has averaged about 7 percent.
However, this growth has not been pro-poor, with stark disparities occurring between urban and rural
areas. Among the Tanzanian government’s priorities are employment generation linked to poverty
reduction, commercialisation of agricultural products and agro-processing. Overall, Tanzania’s economic
outlook is relatively positive, with its economy showing resilience amidst the slowdown in global output
owing to the recent global financial crisis. Such high economic growth suggests that Tanzania offers
attractive investment opportunities based on increasing consumer demand. However, the main concern is
the overall distribution of income, which determines the sustainability of high growth rates over the long
term. The severity of the impact on overall human development progress makes this goal area relevant in
Tanzania. The national priorities related to ending poverty identified for Tanzania for the post-2015 period
include eradicating extreme poverty, hunger and inequality with targets on reducing poverty, reducing
hunger, ensuring food security and nutrition, and reducing income inequality. Major challenges include
climate change and the Tanzanian government’s fiscal capacity. Improving the investment climate by
improving governance would likely boost investor confidence. Also, encouraging domestic savings is
important to foster investment from domestic sources.
Ensure Quality Education for All
Access to quality education at the primary, secondary and tertiary levels is a prerequisite for socio-
economic and political development in any society. The enrolment rate in primary schools has been
declining, but gender parity in access has been achieved. The net enrolment rate in secondary schools
has steadily increased and higher education has expanded even faster. However, there is an urgent need
to improve education quality, which depends on an increase in the equitable deployment of qualified
teachers and resources to all areas to the country. With respect to education, national priorities can be
divided into three areas: quality education at all levels, availability of public pre-primary and other early
childhood care and education programmes, and equitable access for all at all levels of education. The
global targets and indicators examined in this study largely coincide with the country’s national priorities.
Given that the global indicators largely focus on quantity, the proposed national indicators capture issues
related to quality and access to education for excluded groups. Challenges going forward include
increasing the supply of teaching and learning resources alongside the expansion of education
infrastructure, improving the situation of teachers in terms of salary levels, and enhancing the
coordination and implementation of related interventions and projects such as improving roads to schools.
Create Jobs, Sustainable Livelihoods and Inclusive Growth for All
Quality economic growth is achieved when the growth process is inclusive and benefits are equitably
shared. An indicator of quality growth is the generation of decent employment. Achieving decent and
productive employment is a national priority with targets on overall employment, youth employment,
women’s employment and women’s share in total employment. Youth unemployment has been regarded
as a major problem. In addition, young people are being driven to move to urban areas due to the
differences in livelihood sources and job expectations between rural and urban areas ending in the
informal sector. In cities and towns, they scramble for limited formal employment opportunities. A major

9
concern is that the formal employment sector cannot sustain the growing population of job seekers.
Young people also are not prepared for self-employment. The agricultural sector, which is the largest
employer in the economy, must be improved. Ultimately, the industrialisation process, especially the
establishment of small and medium-sized enterprises, will generate linkages with the agricultural sector
and, in turn, employment that will guarantee poverty reduction. Challenges include weak governance and
accountability, high population growth, insecurity, lack of good policies and legislation or lack of their
enforcement, people not participating in setting development goals and priorities, and not least youth
being less prepared to face life challenges and demands or simply not willing to work hard. The latter can
be addressed through government commitment, effective transformation of the mindset of young people,
and cultural change in favour of promoting attitudes of self-development, social values and the spirit of
self-reliance. When unemployment is generated due to structural changes taking place in the economy,
the government is responsible for dealing with it through policy and planning platforms. To effectively
address the issue of unemployment, labour market statistics must be strengthened.
Ensure Sustainable Energy and Develop Infrastructure for All
With regard to energy, the electricity supply in Tanzania is not yet consistent with promises made in
national energy policies. The problems of intermittent power supply, low voltage, frequent rationing and
outages are among the constraints on the production of goods and services in the country. The main
source of energy in Tanzania is biomass, specifically fuelwood and charcoal, with approximately 10
percent of energy supplied by commercial sources – petroleum, hydro, natural gas and coal – and
electricity accounting for about 6 percent of total energy consumption. Few alternative energy sources,
such as mini hydro, wind, biogas, solar and geothermal, have been commercially exploited despite their
potential availability in the country. With regard to infrastructure, the information and communications
technology network in Tanzania remains unable to meet demand, especially from businesses.
Connections are limited to urban areas and a few semi-urban communities. Targets and indicators related
to information and communications technology have enormous potential to boost development by, for
instance, facilitating greater access to market and health information and financial services. Moreover,
Tanzania has the lowest road density in the East African region and the performance of railways declined
substantially due to dilapidated infrastructure, but Tanzania has established itself as a crucial national and
international trade gateway and air transport plays an important role in the economy, particularly in the
tourism and horticulture sectors.
The global targets related to access to energy and infrastructure are very relevant for the country as
access is often limited. The proposed national target and indicators for Tanzania focus on making sure
that access to energy and infrastructure is sustainable. Challenges in the energy sector include shortages
of power generation, aging infrastructure and poor service delivery, inefficiency of the Tanzania Electric
Supply Company, untimely implementation of the Power System Master Plan and institutional
weaknesses due to incomplete reforms in the energy sector. Improving sustainable energy access
requires heavy investment in the energy sector. The recent discovery of natural gas and oil in southern
Tanzania may provide a solution to energy problems in the country. The government, however, needs to
make sure that contractual agreements with investors in the energy sector benefit the country.
Challenges in transport include inadequate integration of the road network, markets and productive areas,
inadequate investment in the maintenance and rehabilitation of railways, inadequate exploitation of the
potential of marine transport to meet domestic, regional and international demands and complement other
modes of transport, and the need for improved and maintained air transport facilities and services. The
government needs to focus on the improvement of infrastructure, which has a bearing on growth and

10
development. Infrastructure improvement should aim to take advantage of the country’s strategic role as
a hub for a number of eastern, central and southern African countries.
Establish a Sustainable, Healthy and Resilient Environment for All
The Environmental Management Act of 2004 includes provisions for institutional responsibilities with
regard to environmental management, environmental impact assessments, strategic environmental
assessments, pollution prevention and control, waste management, environmental standards, state-of-
environment reporting, enforcement of the act and a National Environmental Trust Fund. A number of
other environmental management strategies have been established around sectors and areas of critical
interest such as arid lands, mountainous lands, wetlands, agricultural and pastoral lands, coastal and
marine areas, water, forests, deserts, pollution and biodiversity. Tanzania strives to mainstream various
regional and international agreements and conventions on the environment in its development
frameworks. Tanzania has been able to enforce the conduction of environmental impact assessments in
all significant projects. Conservation has increased in protected terrestrial and marine areas and
afforestation has increased.
Like many other developing countries, Tanzania is expected to be increasingly affected by climate
change. Warmer temperatures and altered precipitation patterns are likely to impact agricultural
production, while higher sea levels may impact coastal communities, including the cities of Dar es Salaam
and Tanga. Since the main source of electricity in the country is hydro, persistent drought will likely have
an adverse impact on energy supply. Challenges include climate change and increasing air and water
pollution, while opportunities including the strategic exploitation of REDD+, biofuel farming and the Clean
Development Mechanism. Significant funding to address environmental risks and climate change
adaptation deficits is essential and the government should promote robust projects and programmes that
can adequately cope with environmental challenges as well as further develop its national climate change
strategy to promote climate-resilient, low-carbon growth.
Establish open, accountable, inclusive and effect institutions and rule of law and peaceful and inclusive
society
The Tanzania National Development Vision 2025 and Long Term Perspective Plan underscore the
centrality of improved governance for growth and development. They envision prevalence of the rule of
law, government accountability to the people, deepening of democracy, political openness and tolerance,
sustenance of peace, political stability, national unity and security and active participation in the
maintenance of regional peace and security.
Good governance practices are emerging. Political leaders are freely elected through inter-party
competition, albeit in some cases on uneven playing fields. There are free print and electronic media that
promote civic education and criticise shortcomings in both politics and society. Various governance
institutions have been established including the National Electoral Commission and the Commission for
Human Rights and Good Governance. Challenges include the credibility, trustworthiness and efficacy of
these and other institutions. The Prevention and Combating of Corruption Bureau, for instance, has failed
to address high-level corruption as indicated by the Controller and Auditor General’s annual reports. Key
priorities for Tanzania that have emerged include enhanced democratic governance, the rule of law and
due process, human rights, transparency and accountability, devolution and decentralised governance,
sound budgetary policies and priorities, and administrative and bureaucratic consistency. Collecting data

11
on governance has been a challenge in Tanzania and many other development countries. The increase
in demand for and use of data in recent years necessitates an increase in the financial and human
resources needed to collect data.
Establish a Global Partnership for Sustainable Development
Tanzania has continued to do well on official development assistance, external debt management and
coordination of resource flows from development partners. Dialogue between the government and
development partners continues to be open, but more needs to be done on aid predictability. Not all
development partners are using government systems. There are also concerns about funds that flow into
the country outside the exchequer system. The government, according to the Joint Assistance Strategy
for Tanzania for the 2006–10 period, takes general budget support as the preferred form of aid delivery.
Development partners have adopted the strategy as the basis for guiding their development cooperation
and technical assistance in order to enhance aid effectiveness in Tanzania. There has been improvement
in the quality of communication to build trust but performance and financial commitments have not be as
positive as expected. Performance on good governance indicators remains a source of tension.
Tanzania has been struggling with capacity issues in creating competitive export strategies for small and
medium-sized enterprises and the private sector in general to access external markets. Interventions
have focused on improving the investment climate, business environment and international
competitiveness. There is a need for aid to be pertinent and meet recipient priorities. There is also a need
to establish a strategy on strengthening the domestic economy so as to reduce aid dependency and
make more effective use of domestic resources for development, such as minerals, water, natural
attractions, and recently discovered natural gas and oil. Besides formal and informal small and medium-
sized enterprises, building capacity for export development should extend to smallholder farmers. It is
important to engage with emerging non-traditional donors on aid, investment, trade and technology and
knowledge transfers, including technical cooperation. Other external financial flows and foreign direct
investment are equally important, but should be directed to productive uses so that they have an impact
on growth and poverty reduction.
Ensure Access to Quality Health Care for All
In addition to the seven goal areas identified by the initiative, the Tanzania case study included an
additional goal on health given its importance in the country. Limited access to quality health services by
the majority of the Tanzanian population has undermined health outcomes. Evidence includes higher
rates of maternal and infant mortality, outbreak of cholera, incidences of tuberculosis, and widespread
malnutrition. In addition, inadequate enforcement of health policies, such as free health services that aim
to support special groups including pregnant women, children and elders, undermine health outcomes.
Notably, corruption in the health sector is a serious problem that affects accessibility, particularly the poor
and other marginalised and vulnerable groups. Strategic interventions and measures that aim to address
both demand- and supply-side factors are necessary since barriers to access may not always be mutually
exclusive and may interact and reinforce each other. Furthermore, communicable and other diseases,
such as HIV/AIDS and malaria, as well as diarrhoea, pneumonia, malnutrition and complications of low
birth weight continue to overburden the health sector. Non-communicable diseases, such as cancer and
cardiovascular diseases, currently account for the most deaths and their prevalence has been rising.
Preventive actions and efficient strategies are urgently needed to deal with risk factors like smoking,
alcohol, promiscuity and physical inactivity, particularly among youth. National priorities include skills

12
development, resource management, and an incentive structure to retain health professionals to the
country and attract them to underserved areas, better hospital facilities and supplies, an effective
monitoring and evaluation framework, an accountability mechanism, the enforcement of effective policies,
the establishment of universal health insurance coverage, and improving access to water and sanitation.
Since resources are limited, it is important to prioritise certain areas in which progress would have the
most impact.
Data for Measuring Progress Post-2015
The central institution in mainland Tanzania in the national statistical system is the NBS, while in Zanzibar
it is the Office of Chief Government Statistician. Local government authorities collect and process data
from primary providers such as villages, wards, health facilities, agricultural extension offices or schools.
Various ministries, agencies and institutions also collect data from primary data providers and produce
statistics as part of their administrative work. Other notable producers of official data include the Bank of
Tanzania. Unofficial data producers include academic and research institutions and businesses. Data
users include the academic and research institutions, civil society organisations and the government. The
main challenge that the country faces is with regard to reconciling inconsistent data from various sources,
such as large businesses in the private sector. Collaboration between and among think tanks, civil society
organisations and the NBS offers potential for these actors to add value to each other’s work. There is
potential to make use of all sources of data.
The debate on the recently passed Statistics Act of 2015 reflects different views in Tanzania, specifically
whether this act benefits or is detrimental to statistical information. The Statistics Act of 2015 will have a
major influence on the SDGs. For those who see this act positively, the NBS will assure the quality of
statistics from other sources and integrate them into the monitoring system. Those who look at the law
negatively argue that the NBS and government will challenge other stakeholders’ statistics and limit
monitoring. A notable concern is with regards to the act making it illegal to (i) publish or communicate
(what is labelled) false or misleading statistical information and (ii) without lawful authorisation of the NBS,
publish or communicate statistical information that may result in the distortion of facts. There is no
protection for those acting in good faith and a minimum of 12 months imprisonment and/or heavy
penalties. Such a move, it is argued that would hamper public debate and a better way would have been
to raise users’ awareness of methodological issues and various dimensions of bad statistics.
With regard to data availability, data was available for 76 percent of the 45 targets and indicators tested
under the Post-2015 Data Test by all countries in the study. In a number of cases however, data is not
accessible while in others calculation from existing data sources is required. Of the seven goals that
Tanzania focused on for this exercise, data are lacking for the goal areas on governance, energy and
infrastructure and environment. Data on governance are only available for four of the nine indicators
examined from official sources, though unofficial data could fill some gaps, notwithstanding the challenge
noted above with the passing of the new Statistics Act. For energy and infrastructure, data is available for
five of the eight indicators while only two of the five indicators examined for the environment are available.
Looking beyond the indicators examined for these goal areas, more generally, there is limited data for
these goal areas, particularly when compared to education, health and poverty. The data revolution has a
potential role to play in addressing key data gaps particularly in areas such as gender-based violence,
peace and security, justice and human rights. In the case of national priorities identified by the team for

13
Tanzania, data availability is low. Of the 36 indicators examined to reflect national priorities under the
SDGs, data is available for half. Data on the environment is the most limited.
Various data sources could be used to monitor progress on the SDGs in Tanzania. The most relevant
would be the Household Budget Survey, Basic Education Statistics in Tanzania, Population and Housing
Census, Integrated Labour Force Survey, Employment and Earnings Survey and Tanzania Demographic
and Health Survey. Administrative data, data from perception surveys and some national representative
data can fill the data gaps. Given data availability in Tanzania, 2010 is a feasible baseline year.
Generally, the data collected by government entities are of good quality and useful in monitoring progress
on targets and indicators. However, datasets have limited degrees of disaggregation, making it difficult to
address disparities that exist at sub-national levels and among different social groups. Datasets
generated by private entities may complement those produced by government entities, but most also
cannot be sufficiently disaggregated.
Most of the data produced by government entities is of fairly good quality, except for in the area of
timeliness. These data are nationally representative but limited human and financial resources result in
slow data production. For data produced by unofficial sources, the main problems have been accuracy as
well as accessibility and clarity. Unofficial sources do not always use a national master sample, resulting
in higher sampling errors or smaller sample sizes. In terms of accessibility, private entities sometimes
have certain embargoes and other restrictions. The data quality assessment indicates that more efforts
are needed to enable accurate assessment of progress on the SDGs. SDG monitoring will require high-
quality and comprehensive data for all indicators, the production of which appears to be a challenge in
Tanzania.
Lessons Learned and Key Recommendations
The SDGs provide a framework for sustainable development, which now must be applied in Tanzania.
Substantially boosting financial and human resources within government entities as well as other data
producers and users must be an overarching priority in Tanzania. There is a need to strengthen domestic
resource mobilisation and seek other sources of development finance given the economic crisis in the
developed world. Other sources of funding such as philanthropic organisations and emerging economies
should also be explored. Additional finance is needed to address the resource gap in terms of physical
infrastructure that is necessary for productive working environments, such as the facilities of the NBS and
the Office of Chief Government Statistician, transport facilities, information and communications
technology infrastructure, and modern computers and software. Notably, available human resources are
insufficient in number and capacity to efficiently undertake data collection and management in both
mainland Tanzania and Zanzibar. The numbers and qualifications of staff are by any standard below the
requirements to produce the needed data, thus there is a need for capacity building. Given this context,
the NBS could establish steady institutional partnerships with one or several experienced national
statistical offices for continued strengthening of the entire national statistical system and the transfer of
technology to improve outcomes.
Based on the findings of the Tanzania case study, the key challenges in implementing and monitoring the
SDGs are data availability and consistency. Data gaps can result from various factors. Politically, the
government may have a preference for conventional statistics over perception surveys, which would
constitute a political barrier that needs to be addressed to resolve the problem of data gaps. It is essential
14
to acknowledge the political realities in which data are collected while taking into account the challenges
that exist in addressing the political sensitivity of data. Data collected in Tanzania, almost all of which are
produced and hosted by the Tanzanian government, are sponsored by donors that may simply want
national-level data for comparative purposes. In many cases, data provided at levels lower than the
national level would be more useful. The technical aspects of data disaggregation may be easier to tackle
than the political aspects. Moreover, legal barriers also need to be addressed. The NBS collects and
analyses data, but sometimes analysis in the form of a general report being produced can take more than
two years. If the government maintains that data will only be released after the production of a general
report, then analytical capacity should be strengthened to increase the speed of data analysis and
publication. Otherwise, the government should allow the release of data earlier but ask researchers and
analysts to share their results with the NBS before they are published.
The data revolution has a potential role to play in boosting data availability, specifically ensuring the
necessary frequencies and disaggregation at all levels. The use of robust sample sizes would enable
better sub-national analysis and improved comparisons according to location and gender. However,
various institutions produce data based on their functions in society but data production is not harmonised
in such a way that other institutions may utilise those data instead of repeating the collection of data. A
similar situation exists when it comes to data that support the production of statistics, such as geo-data in
a geographic information system. Population and other statistics should form “layers” in a national geo-
data bank, where statistics support geo-data and other data. There have been improvements in this area,
but obstacles to sharing data still exist, even within the public sector. Harmonising datasets from various
sources would likely solve the problem of data gaps and enable the comparative analysis of data
collected by different sources. Harmonisation can be achieved by building the capacities of various data
producers. There is a need for think tanks, civil society organisations and the NBS in Tanzania to
collaborate and add value to each other’s work. While public and private entities have different resource
bases, their varied objectives and roles in the production of statistics, especially given common
methodologies for data collection, should improve all sources of data.

15
Introduction
The year 2015 marked the end of the Millennium Development Goals (MDGs). Targets for many of the
goals were not reached by developing countries. Scholars in the global South claim that not achieving the
MDGs is partly due to the fact that some targets and indicators were not realistic for developing countries.
Put differently, they did not consider local contexts. Many efforts have been made by scholars in the
South to ensure that the succeeding set of goals, targets and indicators reflect local contexts.
The realities in developing countries such as Tanzania,1 where national development priorities are aligned
with the MDGs, are a testament to that claim. Tanzania has much to celebrate, as the country has
achieved some of the MDGs, but at the same time many challenges remain. Despite a serious
commitment to the MDGs, Tanzania’s progress has varied across goals and localities. Tanzania’s
Country Report on the Millennium Development Goals 2010 (see URT 2011b) indicates that the country
will likely achieve only two MDGs – MDG 2 on achieving universal primary education and MDG 6 on
combatting HIV/AIDS, malaria and other diseases. If the pace of development is increased, it could
achieve MDG 3 on promoting gender equality and empowering women, MDG 4 on reducing child
mortality and MDG 8 on developing a global partnership for development. Two important MDGs will not
be met, namely MDG 1 on eradicating extreme poverty and hunger and MDG 5 on improving maternal
health.
The framework of the post-2015 development agenda, finalised and adopted in September 2015 as the
Sustainable Development Goals (SDGs), differs from that of the MDGs in significant ways. The new
framework is universal, meaning that it applies to both developing and developed countries. Countries
have greater space to determine their own development targets and corresponding indicators by which
they measure progress. The range of issues prioritised in the new framework is broader and more
complex. To better understand progress within a country, progress will be measured in a disaggregated
way. To support this framework, a “data revolution” has been called for to enable governments and
policy-makers to better track development progress and equip people with the information they need to
demand more from their governments.
Recognising the importance of tracking development progress, the Centre for Policy Dialogue and
Carleton University’s Norman Paterson School of International Affairs, in association with Southern Voice
on Post-MDG International Development Goals, are leading an initiative titled the Post-2015 Data Test.
The initiative aims to road-test a select set of candidate post-2015 goals, targets and indicators in a
number of low-, middle- and high-income countries. In doing so, it assesses the adequacy of data
available for measuring post-2015 progress at the country level, seeking to inform debates and decisions
on the architecture and priorities of the data revolution. It also identifies opportunities and challenges that
may arise from a universal, country-relevant post-2015 framework, including key gaps in data availability
and accessibility. Furthermore, the initiative seeks to enhance the capacity of Southern think tanks to
undertake analysis and contribute to the global policy processes shaping the post-2015 agenda, while
also ensuring that the global processes are informed by country-level realities.
1 The United Republic of Tanzania is a federation of mainland Tanzania and the island state of Zanzibar, which retains significant autonomy with its own parliament and president.

16
The Tanzanian government took interest in engaging its population on the issue of the post-2015 agenda
through consultations with different stakeholders, including marginalised and vulnerable groups. These
national consultations, which were part of the global post-2015 consultation process of the United
Nations, had the objectives of contributing to the global discussion on the SDGs and generating
information to inform mid- and long-term development plans and strategies.2 Within the government, the
Planning Commission is leading the process going forward, with the main undertaking now being how to
localise the SDGs. Among the country’s think tanks, REPOA, in association with Southern Voice, is
responsible for the research in the present report, which contains the Tanzania case study of the Post-
2015 Data Test. Various stakeholders, including data producers and users, were consulted and their
views served as important inputs into this report.
A number of issues are highlighted in this report. First is the importance of the SDGs in that they are very
relevant for Tanzania. Second, there are various initiatives at the national level that support the data
revolution and information about which data will be available and when. Thus, the SDGs provide an
excellent complement to these initiatives and should spur changes at the national level. Also, the issue of
capacity building among official and non-official data producers needs to be considered going forward.
Finally, the issue of financial sustainability to maintain the quality and consistency of statistics is
important.
This report contributes in the following areas: (i) it lays the groundwork for the implementation of the
SDGs by starting the process of identifying national priorities, (ii) it helps identify data bottlenecks, (iii) it
intensifies the debate on the importance of formulating policies using data and information and (iv) it
offers recommendations for implementing the SDGs and measuring progress that can be used by
stakeholders. The report is organised into six sections. Following this introduction, the next section
outlines the research process. The following section provides an overview of post-2015 priorities for
Tanzania. The next two sections focus on the data situation in Tanzania for the selected candidate post-
2015 goals, targets and indicators, with one detailing data for measuring progress and the other
examining the political economy dimensions of the data revolution in Tanzania. The final section
summarises key findings and concludes.
2 For more information, see www.ncp2015.go.tz and Annex 1.

17
Research Process
Research Team
The research in this report was conducted by REPOA. The research team comprised two experienced
researcher, Blandin Kilama and Lucas Katera, and two assistant researchers, Constantine George and
Neema Rutatina.
Research Objectives
The main objectives of this research were to road-test some of the candidate goals, targets and
indicators, assess data adequacy in terms of availability, quality and accessibility, and examine the
political economy dimensions of the data revolution in Tanzania. Under the Post-2015 Data Test initiative,
research teams were tasked with identifying national-level targets and indicators for a selection of
candidate SDGs.3 The goal areas tested in Tanzania were the following:
poverty employment and inclusive growth
education governance
energy and infrastructure environmental sustainability and disaster resilience
global partnership for sustainable development
Each country examined 5–6 targets and approximately 8–12 indicators for each of the goal areas listed.
The Centre for Policy Dialogue, Norman Paterson School of International Affairs and Southern Voice pre-
determined some targets and indicators to be examined in all countries for each goal area of the initiative,
which will allow for comparison of data availability across country studies. Throughout the study these
targets and indicators are referred to as “global.” Within the “national” set of targets and indicators, teams
were instructed to ensure that at least one target and corresponding indicator(s) connect to another goal
area.
Methodology
The Tanzania case study was conducted according to the Methodology and Implementation Guide
prepared for the initiative (see Bhattacharya, Higgins and Kindornay 2014). Research involved an
inception workshop, a literature review, key informant interviews, focus group discussions, a data-
mapping exercise and peer review. Desk-based research was carried out to establish the state of data
availability given both national and international sources. Each country study focused on: (i) identification
of key national priorities for the post-2015 framework to inform the selection of targets and indicators at
the country level; (ii) identification of problems that were experienced in view of the baseline reference
year, data availability and data generation in the context of the MDGs; (iii) identification of national and
international sources for country-specific data; (iv) suitability of a particular year for consideration as the
baseline year for the SDGs; (v) in view of candidates for post-2015 goals and targets, identification of
data needs and conduction of an audit of data availability at the national level and from international
sources; and (vi) identification of areas where data will need to be generated, keeping in view the SDGs.
3 See Bhattacharya, Higgins and Kindornay (2014) for further details on how candidate goals were selected and the key priority areas included under each goal. It should be noted that the candidate goals were selected before the adoption of the finalised SDGs. The seven goal areas examined here capture elements of 12 of the 17 finalised SDGs.

18
The inception workshop was held at REPOA in Tanzania’s capital, Dar es Salaam. Its aim was to inform
the design of the Tanzania case study under the Post-2015 Data Test by convening stakeholders to
refine the proposed research objectives, methodology and implementation and outreach plans. The
workshop was attended by a wide range of stakeholders – a total of 29 participants – representing
diverse institutions involved in the collection, analysis and use of data (see Annex 2). The workshop
examined the appropriateness of specific goals, targets and indicators for Tanzania as well as the current
state of data availability, quality and accessibility in the country.
To supplement information gathered during the inception workshop, REPOA conducted key informant
interviews with various stakeholders, including officials from the National Bureau of Statistics (NBS) and
National Environment Management Council (see Annex 3), in order to assess perceptions of data gaps,
challenges associated with a universal, country-relevant framework and expectations for the data
revolution. The interviews helped the research team gain an in-depth understanding of how data are
generated, the reliability and robustness of data, accessibility of data and the future plans of key
institutions. Additionally, the team was able to come up with recommendations for addressing data gaps
and generating new data at the national level in the context of the SDGs.
Lessons Learned
During the research process, the research team learned that it is essential to acknowledge the political
realities in which data are collected while taking into account the challenges that exist in addressing the
political sensitivity of data. Data collected in Tanzania, almost all of which are produced and hosted by the
Tanzanian government, are sponsored by donors that may simply want national-level data for
comparative purposes. In many cases, data provided at levels lower than the national level would be
more useful. The technical aspects of data disaggregation may be easier to tackle than the political
aspects.
Moreover, various institutions produce data based on their functions in society but data production is not
harmonised in such a way that other institutions may utilise those data instead of repeating the collection
of data on the same phenomena within the country, especially in the areas of environment and
governance, where data were found to be lacking. A similar situation exists when it comes to data that
support the production of statistics, such as geo-data in a geographic information system. Geo-data are
vital for demarcation in censuses, a tool for geography-based sampling and an excellent means for data
presentation. Population statistics and other statistics should form “layers” in a national geo-data bank,
where statistics support geo-data and other data. Tanzania has experienced difficulties in joining various
types of data in a geographic information system in spite of the fact that almost all data are produced and
hosted by the government. There have been improvements in this area, but obstacles to sharing data still
exist, even within the public sector. Information can be equivalent to power and is not always shared.
The research team also learned that there is a need for think tanks, civil society organisations (CSOs)
and the NBS in Tanzania to collaborate and add value to each other’s work. The differences in capacity
and experience between CSOs and the NBS suggest that cooperation will improve data and statistics.
While public and private entities have different resource bases, their varied objectives and roles in the
production of statistics, especially given common methodologies for data collection, should improve all
sources of data.

19
Post-2015 Priorities for Tanzania
Experience with the MDGs
Tanzania was one of the 189 countries that signed the Millennium Declaration and thus endorsed the
MDGs at the United Nations General Assembly in September 2000. The MDGs have become a
cornerstone of development policy around the world and remain an overarching framework for the core
development activities of all stakeholders (URT 2013). In Tanzania, the MDGs have been integrated into
medium-term programmes over time. The first was the Poverty Reduction Strategy Paper for the 2000–01
fiscal year to 2003–04. Then there was the second-generation National Strategy for Growth and
Reduction of Poverty (NSGRP) I for 2005–06 to 2009–10 (URT 2005) and NSGRP II for 2010–11 to
2014–15 (URT 2010)4 , Five Year Development Plan (2011/12-2015/16) as well as the Poverty Monitoring
Master Plan (URT 2001) and various sectoral monitoring arrangements. With regard to Zanzibar, the
Zanzibar Poverty Reduction Plan of 2002 was succeeded by the Zanzibar Strategies for Growth and the
Reduction of Poverty for the 2007–10 and 2010–15 periods (RGoZ 2002; 2007; 2010).
Beginning in the mid-1980s, Tanzania undertook market-oriented economic policy reforms, including the
liberalisation of internal and external trade, privatisation of state-owned enterprises and various sectoral
reforms. By the end of the 1990s, the country had moved in the direction of poverty reduction strategies
and, as mentioned, endorsed the MDGs in 2000. Tanzania’s gross domestic product (GDP) growth rate
improved during the 2000s. The country attained an average annual growth rate of 7 percent, despite
shocks including drought, intermittent power cuts and the global financial crisis of 2008–09, all of which
affected export earnings, capital and investment flows and tourism. In Zanzibar, the annual growth rate
mostly remained around 5 percent, well below the target of 10 percent by 2010 in the Zanzibar Poverty
Reduction Plan. The agricultural sector – mainly subsistence farming – employs more than one-third of
Zanzibar’s population. Zanzibar’s manufacturing sector has tended to underperform. It currently accounts
for only 4 percent of GDP, down from 5.9 percent of GDP in 2003 (URT 2011c). Despite its serious
commitment to the MDGs, Tanzania’s progress has varied across goals and localities. As mentioned,
Tanzania’s Country Report on the Millennium Development Goals 2010 (see URT 2011b) indicates that
the country will likely achieve only MDGs 2 and 6.
Post-2015 Context
As part of the Tanzanian government’s recent efforts to transition the country from low- to middle-income
status, it adopted the Malaysian model of development. The Big Results Now initiative, which has also
been adopted by Rwanda and Nigeria, is a Malaysian development strategy to be implemented in
Tanzania from 2014 to 2018. The initiative involves new working methods to effectively and efficiently
realise the Tanzania National Development Vision 20255 and implementation focuses on six priority areas
of the economy: (i) energy and natural gas, (ii) agriculture, (iii) water, (iv) education, (v) transport and (vi)
mobilisation of resources. Ministries are required to prepare budgets for five-year development plans,
which must align with government efforts to realise the vision.
4 The NSGRP is also referred to by its Kiswahili acronym, MKUKUTA, which stands for Mkakati wa Kukuza Uchumi na Kupunguza Umasikini Tanzania. 5 This includes speeding up the implementation of Five Year Development Plan (2011/12-2015/16).

20
Tanzania’s Engagement on Post-2015
Three areas of agreement with regard to the relevance of goals, monitoring progress and resource
mobilisation emerged during the national consultations in Tanzania that were part of the global post-2015
consultation process of the United Nations. It was agreed that an agenda with many goals is difficult to
achieve and very difficult to monitor. Thus, it would be beneficial to reduce the number of goals to
facilitate the monitoring of progress. It was also agreed that the issues of resource mobilisation and
utilisation should be explicitly included in the post-2015 agenda. It was noted that the NSGRP was
designed to align with MDGs and the Poverty Monitoring Master Plan was designed to track
implementation.
It was agreed that the success of the SDGs ultimately lies with resource mobilisation, specifically
engaging more human and financial resources. In view of the ongoing economic crisis in the developed
world and the resulting decrease in official development assistance flows, Tanzania will have to look for
other sources of development finance, including through domestic resource mobilisation. Philanthropic
organisations and emerging economies such as China may be other potential sources of finance, but
strengthening tax collection would be more sustainable. It was agreed that that the goal on global
partnership for sustainable development, in addition to having a resource mobilisation component, should
be cross-cutting.
Selecting Goals, Targets and Indicators
The messages arising from the national consultations in Tanzania provided very important inputs into the
research and consultative processes conducted by REPOA as part of the Post-2015 Data Test. In
proposing national targets and indicators, the research team drew largely from existing plans and
strategies and took into account national priorities. The plans and strategies include the NSGRP II, Big
Results Now and Medium Term Plan. It is crucial for plans such as the Medium Term Plan and Poverty
Monitoring Master Plan to examine whether all the issues of relevance to Tanzania are covered as far as
environmental sustainability is concerned. Local plans, priorities and targets should be taken into account,
with the understanding that the SDGs can help push neglected agendas like that on the environment, for
example.
The sections that follow outline Tanzania’s key priorities with respect to the seven goal areas examined
under the Post-2015 Data Test. Annex 4 provides a consolidated table of all global and national targets
and indicators examined for Tanzania.

21
End Poverty
Current Context
The severity of the impact of poverty on overall human development progress makes an SDG on ending
poverty in all its forms everywhere as relevant as MDG 1 on eradicating extreme poverty and hunger. The
proposed goal goes beyond MDG 1 by focusing on advancing income equality, which was not considered
in the MDGs. The key to achieving this goal would be to promote inclusive growth that benefits all rather
than a particular segment of the population.
In recent years, Tanzania’s annual GDP growth rate has averaged about 7 percent. However, this growth
has not been pro-poor, with stark disparities occurring between urban and rural areas. The agricultural
sector, which largely employs the poor, has grown at an annual rate of only around 4.5 percent, thus
falling behind GDP growth. Among the Tanzanian government’s priorities are employment generation
linked to poverty reduction, commercialisation of agricultural products and agro-processing. The
agricultural sector requires increased investment and an enhanced role for the private sector to spur
growth (ESRF 2013).
Overall, Tanzania’s economic outlook is relatively positive, with its economy showing resilience amidst the
slowdown in global output owing to the recent global financial crisis. Since Tanzania’s annual GDP
growth rate averaged about 7 percent over the last decade, the country achieved the NSGRP I target of
average annual GDP growth of 6–8 percent by 2010. Notably, this rate exceeded the average growth rate
of member countries of the East African Community and Southern African Development Community
(Bank of Tanzania 2012). Such high economic growth suggests that Tanzania offers attractive investment
opportunities based on increasing consumer demand. However, the main concern is the overall
distribution of income, which determines the sustainability of high growth rates over the long term.
Household Income, Poverty and Inequality
Despite relatively high growth, with GDP increasing from 1.6 percent in 1992 to 7 percent in 2007, poverty
reduction has been slow and uneven. The proportion of the population living below the national poverty
line decreased from 38.6 percent, as indicated in the 1991–92 Household Budget Survey, to 33.6 percent
according to the 2007 Household Budget Survey (NBS 2009). Inequalities exist in various forms and at
different levels. Urban-rural differences are in terms of average incomes, reflecting varied access to high-
paying jobs and social services such as education and health. The national data available on household
income poverty rates, which were collected using the 2007 Household Budget Survey, were published in
the Poverty and Human Development Report 2009 (see Research and Analysis Working Group 2009).
The report also included an in-depth poverty analysis focusing on household consumption, income and
asset ownership. The poverty estimates for 2007 indicate that significant economic growth since 2000–01
did not translate into income poverty reduction. The proportion of the population below the basic needs
poverty line declined only slightly from 35.7 percent in 2000–01 to 33.6 percent in 2007, while the
incidence of food poverty fell from 18.7 percent to 16.6 percent over the same period. Poverty rates were
highest in rural areas and the overwhelming majority of poor Tanzanians – 74 percent – remained
primarily dependent on subsistence farming. Since 2007, growth has more or less continued at the same

22
pace except with a slight dip as a result of the global financial crisis. Based on past trends and the slight
slowdown in the growth rate, the poverty reduction target under NSGRP I was not met and the country is
off track regarding attaining the MDG target for poverty reduction by the end of 2015. In response,
NSGRP II seeks to accelerate the reduction of income poverty by adopting an inclusive growth strategy
focused on productivity gains and decent employment (URT 2010).
Overall growth performance conceals unequal performance across sectors. Of particular concern is the
agricultural sector, the growth rate of which averaged 4.4 percent over the 2000–08 period, which was far
below the NSGRP I target of 10 percent by 2010. Agriculture deserves special attention because a
persistent decline would translate into deepening poverty for the majority of the population. Fast-growing
sectors, including the mining, construction, communication, trade and tourism, and financial sectors, are
not able to absorb all of the job seekers graduating from colleges and schools, let alone the job seekers
who are less educated in both rural and urban areas. Notably, the fast-growing sectors have attracted the
most foreign direct investment, but they do not provide adequate markets for products from slow-growing
sectors such as raw materials and intermediate inputs. Fast-growing sectors do not have adequate
arrangements that are purposefully set to link up with and benefit slow-growing sectors by way of markets
for their products or, as in other countries, sub-contracting local firms. Establishing supermarkets and
tourist hotels that source groceries from local producers would involve elevating local producers’
capacities to reliably produce and supply products that meet required health and environmental
standards. Many agricultural products that could be exported do not meet international sanitary and
phyto-sanitary standards. The absence of capacity building and similar efforts explains why growth in
some sectors is not trickling down.
Moreover, foreign direct investment seems to be lower than expected. Concerns have been raised by the
private sector with regard to the investment climate and business environment, specifically taxes and tax
administration, unreliable electricity and high associated costs, telecommunications in general and
corruption. Similar problems on a different scale beset rural areas, especially those engaged in non-farm
activities. Rural areas remain relatively disadvantaged due to low investment in rural roads, rural
electrification and telecommunications as well as a lack of banking services.
Exports remain concentrated on primary commodities, particularly traditional crops such as sisal, cotton,
coffee, tea, tobacco, cashew nuts and pyrethrum. Gold exports have recently featured prominently.
However, rising imports have kept the balance of trade in deficit. Overall, the country has been able to
keep external foreign reserves for about four to six months of imports of goods and services (Bank of
Tanzania 2014). Furthermore, funding and project funding have experienced fluctuating trends. Aid
predictability remains a problem since some aid is still channelled off-budget. Due to debt relief, the debt-
to-GDP ratio has decreased. Through improvements in the domestic investment environment and
international competitiveness as well as participation in international negotiations on market access,
Tanzania continues its efforts to diversify exports and adopt new technologies.
National Priorities
Based on this context, a number of national priorities related to ending poverty have been identified for
Tanzania for the post-2015 period (see Table 1). These include eradicating extreme poverty, hunger and
inequality with targets on (i) reducing poverty, (ii) reducing hunger, (iii) ensuring food security and nutrition
and (iv) reducing income inequality. The proposed global targets are relevant for Tanzania because

23
poverty remains high, with recent estimates being 28 percent of the population live below the basic needs
poverty line and 10 percent of the population live below the food poverty line (NBS 2013). The proposed
national targets and indicators were developed by consulting existing plans and strategies.
Table 1. End poverty: Targets and indicators
Target Indicator
Global
End extreme income poverty Proportion of population below US$1.25 (PPP) per day
Reduce poverty Proportion of population below US$2 (PPP) per day
Proportion of population living below national poverty line
Share of employed persons living below the nationally-defined poverty line
Reduce the proportion of people who suffer from hunger
Prevalence of child stunting in boys and girls under 5, %
National
Reduce income inequality gap by x%
Ratio of income/consumption of top 20% to bottom 20%
Reduce hunger Proportion of population below minimum level of dietary energy consumption
Food self-sufficiency ratio
Proportion of households that take no more than one meal per day
Proportion of districts reported to have food shortages
Reduce multidimensional poverty Multidimensional Poverty Index
Challenges to Ending Poverty
Climate change is rendering the global economy vulnerable, specifically in terms of health, agriculture,
water resources, forestry, grasslands, livestock, coastal resources, and wildlife and biodiversity. In
Tanzania, frequent extreme weather events in recent years have led to the destruction of crops, public
schools, health facilities, roads, railways, business properties and various household assets. Climate
change is expected to shrink the country’s rangelands that are important for keeping livestock, which is
very problematic because approximately 60 percent of the rangelands are already infested by the tsetse
fly, making them unsuitable for livestock pastures and human settlements. Such developments
exacerbate conflicts between livestock keepers and farmers. Other climate change impacts include
reduced runoff, which diminishes river flows and decreases the water available for irrigation and electricity
generation.
The global financial crisis as well as recent food and fuel crises have had deleterious effects on
Tanzania’s productive and service sectors. The country has been directly affected by reductions in
financial flows, foreign direct investment, official development assistance and short-term capital flows.
Trade and exports have also been negatively affected. These consequences have strained the Tanzanian
government’s fiscal capacity for public investment and the private sector’s ability to engage in economic
activities given tighter credit market conditions and reduced external demand. Improving the investment
climate by improving governance would likely boost investor confidence. Also, encouraging domestic
savings is important to foster investment from domestic sources.

24
Ensure Quality Education for All
Current Context
The global post-2015 consultation process of the United Nations identified the need to focus more on the
quality than the quantity of social services, especially with regard to health and education. Tanzania will
likely achieve MDG 2 on achieving universal primary education, but the quality of education has been a
major concern for all. This concern was voiced during the Tanzanian government’s national consultations
on the post-2015 agenda and REPOA’s consultative processes as part of the Post-2015 Data Test. The
lack of skills and access to quality education were considered to be pressing issues by youth and CSOs.
Access to quality education at the primary, secondary and tertiary levels is a prerequisite for socio-
economic and political development in any society. Conversely, low educational attainment and poverty
are closely associated. According to Basic Education Statistics in Tanzania (BEST), literacy rates in the
country improved marginally for women (from 67 percent in 2004–05 to 72 percent in 2011), but less for
men (from 80 to 82 percent over the same period), though literacy remains higher among men by 10
percentage points. Substantial progress has been made to increase access to education. The net
enrolment rate in primary schools increased from 66 percent in 2001 to a peak of 97 percent in 2007 and
2008. Since 2008, the net enrolment rate steadily declined and stood at 94 percent in 2011, a trend that
must be reversed. In 2011, it was estimated that nearly half a million 7 to 13 year-olds did not enrol in
school. Overall, however, gender parity in access to primary education has been achieved (URT 2011a).
The transition rate from primary to secondary school also rose dramatically from 12 percent in 2002 to 60
percent in 2006, but then fell to 45 percent in 2010. The net enrolment rate in secondary schools steadily
increased from 6 percent in 2002 to 35 percent in 2011, which is an impressive achievement, but the rate
falls short of the NSGRP target of 50 percent. Higher education has expanded even faster. The number
of students in higher education institutions jumped over the last 10 years from less than 31,000 in the
2002–03 academic year to almost 140,000 students in 2010–11 (URT 2011a).
An analysis of learning outcomes, however, paints a worrying picture of the quality of education received
by Tanzanian children. A large-scale national survey conducted in 2011 revealed alarmingly poor
numeracy and literacy skills among primary school–aged children. The findings indicate an urgent need to
improve education quality, which depends on an increase in the equitable deployment of qualified
teachers and resources to all areas to the country. The significant decline in the number of students who
pass the National Form Four Examinations also points to the need to address education quality.
National Priorities
The focus group discussions that informed the Tanzania case study largely reaffirmed the importance of
the broad education issues identified by other policy processes that dealt with education. With respect to
the proposed goal on education, national priorities can be divided into three areas: quality education at all
levels, availability of public pre-primary and other early childhood care and education programmes, and
equitable access for all at all levels of education.

25
Table 2 provides an overview of the global and national targets and indicators examined for Tanzania.
The global targets and indicators examined in this study largely coincide with the country’s national
priorities. Given that the global indicators largely focus on quantity, the proposed national indicators
capture issues related to quality and access to education for excluded groups.
Challenges
Good budget execution has made it possible for the government to expand capacities – recruit more
teachers, increase education materials and build classrooms – and, as a result, the pupil-teacher ratio
improved from 1:58 in 2007 to 1:50 in 2008. However, a number of challenges remain. First, the
expansion of education infrastructure has not been matched by expansion in complementary inputs to
address education quality. Improving quality requires a steady supply of teaching and learning resources
(e.g., libraries, laboratories, teachers’ houses and sanitation facilities), which have lagged behind
enrolment at all levels of education mainly due to financial constraints. Improving quality also involves
improving the situation of teachers. Specifically, salary levels must be increased (for comparison, a taxi
driver in Dar es Salaam tends to earn more than a teacher). Corruption in the education system
contributes to lowering the quality of services. Realising education outcomes will require increased
budget allocations to the education sector to improve school environments, particularly though boosting
teachers’ motivation with better learning materials and infrastructure.
Second, there has been inadequate coordination of relevant related interventions. For instance, poor
roads hinder the transportation of construction materials to build or improve schools, teachers and staff to
Table 2. Ensure quality education for all: Targets and indicators
Target Indicator
Global
Ensure all children have access to early childhood and quality primary and secondary education
% of girls and boys receiving at least one year in pre-primary programmes
% of girls and boys who complete primary school
% of girls and boys who complete secondary school
% of girls and boys who achieve a passing grade in national learning assessments at the primary school level
Increase the number of adults with skills, including technical and vocational skills
Proportion of individuals enrolled in a Technical and Vocational Education and Training institution
National
Expansion of higher education, Technical and Vocational Education and Training
Pupil-teacher ratios in secondary schools, Technical and Vocational Education and Training institutions
Percentage of qualified teachers in secondary schools, Technical and Vocational Education and Training institutions
Access to quality primary and secondary education
Pupil-to-textbook ratio
Ensure the continuity, socio-economic equality and gender parity of enrolled students
Transition rate from Standard 7 to Form 1
Improved access to education for children with disabilities
Ensure universal access to resources and basic infrastructure services for education
Percentage of students with improved pass rates in a given year compared to previous years
Public expenditure on education, %

26
those schools and individuals who track community contributions in underserved and remote areas.
Moreover, the unavailability of water in some communities has meant that girls spend a lot of time helping
parents fetch water, causing them to lose hours or even days of schooling.
Third, the global financial crisis has compromised both individual and government capacity to implement
projects, such as village roads that impact the provision of education services. In addition, natural
calamities associated with climate change have led to the destruction of public schools and other
infrastructure, which interrupts schooling.
Fourth, in light of global competition in the education and labour markets, challenges in the near future
will likely include:
Changing the education system so that “basic education for all” refers to secondary school plus
vocational training, which would give each child an opportunity to acquire skills.
Devising ways to promote mathematics and science among all students and build the capacities
of mathematics and science teachers at all levels.
Addressing quality of education even at the primary level with due consideration to adequate
teaching, teacher training programmes, syllabi, teaching and learning materials, and school
environments including buildings and laboratories.
Improving access to education and completion rates of girls at the secondary and vocational
education levels.
Other emerging issues related to education quality include the low number of teachers in schools and the
teachers who are available are often unqualified. Many schools have no science teachers and no
laboratories and suffer from shortages of classrooms and teachers’ houses (NBS 2013). In addition,
direct and indirect expenses pose a challenge to most parents. In higher education, few individuals have
the opportunity to enrol and student loans are problematic. School environments have been described as
usually unfavourable with respect to insecurity, child abuse and lack of special facilities for children with
disabilities.

27
Create Jobs, Sustainable Livelihoods and Inclusive Growth for All
Current Context
“Achieve full and productive employment and decent work for all” is a target under MDG 1, but much
attention has not been paid to it. The issue of unemployment, particularly youth unemployment, has
gained momentum in recent years and remains a major concern in Tanzania. Participants in the
consultations conducted by the Tanzanian government and REPOA emphasised the importance of
creating decent employment. Many demanded growth through structural economic transformation that
generates employment. The issue of applying science, technology, innovation and research and
development to transform the economy, increase productivity and boost international competitiveness
came up numerous times during the consultations. These priorities are reflected in Table 3, which
provides an overview of the global and national targets and indicators examined for Tanzania. Achieving
decent and productive employment is a national priority with targets on (i) overall employment, (ii) youth
employment, (iii) women’s employment and (iv) women’s share in total employment.
Quality economic growth is achieved when the growth process is inclusive and benefits are equitably
shared. An indicator of quality growth is the generation of decent employment. High unemployment in
Tanzania is a persistent problem that was cited by almost all groups during the consultations. In some
quarters, youth unemployment has been regarded as a “time bomb.” A major concern is the growing
informal sector and that the formal employment sector cannot sustain the growing population of job
seekers. Young people also are not prepared for self-employment. The agricultural sector, which is the
largest employer in the economy, must be improved. Ultimately, the industrialisation process, especially
the establishment of small and medium-sized enterprises, will generate linkages with the agricultural
sector and, in turn, employment that will guarantee poverty reduction.
In addition, young people are being driven to move to urban areas due to the differences in livelihood
sources and job expectations between rural and urban areas. In cities and towns, they scramble for
limited formal employment opportunities. Of concern is the rapid growth of poor segments of urban
populations and environmental degradation due to rural-urban migration, as evident in the large numbers
of people living in urban slums, most of which are in neglected areas in terms of access to social services.
Many participants in the consultations stressed the importance of economic growth that goes hand in
hand with economic transformation due to this situation.

28
Table 3. Create jobs, sustainable livelihoods and inclusive growth for all: Targets and indicators
Target Indicator
Global
Achieve full and productive employment for all, including women and young people
Labour force participation rate
Time-related underemployment (thousands)
Ensure equal pay for equal work Mean nominal monthly earnings of employees (local currency)
Support inclusive growth and reduce inequality
Gini coefficient
Palma ratio
Growth rate of income of the bottom 40%
Gross fixed capital formation (% of GDP)
National
Ensure equal pay for equal work
Existence of national legislation that guarantees equal pay for equal work
Improve productivity by x% Productive employment as % of total employment
Ensure universal access to social protection
% of population receiving cash for work
% of population coved by health insurance
Full, productive and decent employment % of the eligible population receiving cash transfers
Cross-cutting: Ensure sustainable energy and develop infrastructure for all
Improve growth and employment outcomes by ensuring universal access to financial services and basic infrastructure
% of population with access to financial services and basic infrastructure (transportation, ICT, water and sanitation, etc.)
Cross-cutting: Establish open, accountable, inclusive and effective institutions, rule of law and a peaceful and inclusive society
Eliminate child labour % decrease of child labour at the labour market
Challenges
Unemployment in a growing economy is largely caused by weak governance and accountability, high
population growth, insecurity, lack of good policies and legislation or lack of their enforcement, people not
participating in setting development goals and priorities, and not least youth being less prepared to face
life challenges and demands or simply not willing to work hard. The latter can be addressed through
government commitment, effective transformation of the mindset of young people, and cultural change in
favour of promoting attitudes of self-development, social values and the spirit of self-reliance. These
things should be integrated into the education system starting at primary level. When unemployment is
generated due to structural changes taking place in the economy, the government is responsible for
dealing with it through policy and planning platforms.
Notably, some participants in the consultations reported that there has been insufficient systematic focus
by the government on making growth inclusive and creating decent jobs. In other words, efforts on the
promotion of equitable economic growth have not been satisfactory. Implementation of the SDGs should
address and monitor the issue of unemployment. To effectively do that, labour market statistics must be
strengthened.

29
Ensure Energy and Develop Infrastructure for All
Current Context: Energy
Energy is essential for the proper functioning of nearly all sectors in an economy. The availability and
quality of energy determines the success or failure of development endeavours. As such, the importance
of the energy sector in an economy cannot be over-emphasised. In Tanzania, the electricity supply is not
yet consistent with promises made in national energy policies. The problems of intermittent power supply,
low voltage, frequent rationing and outages are among the constraints on the production of goods and
services in the country.
The main source of energy in Tanzania is biomass, specifically fuelwood and charcoal, which accounts
for about 85.5 percent of total energy consumption (URT 2014). More than 80 percent of energy derived
from biomass is consumed in rural areas. Approximately 10 percent of total energy is supplied by
commercial sources – petroleum, hydro, natural gas and coal – and electricity accounts for about 6
percent of total energy consumption. Few alternative energy sources, such as mini hydro, wind, biogas,
solar and geothermal, have been commercially exploited despite their potential availability in the country.
Power generation has been growing at an annual rate of 6 percent and contributed on average around
1.8 percent of GDP per year over the 2000–09 period.
Notably, the Tanzania Electric Supply Company indicates that the estimate of suppressed demand for
electric power in 2009 was 769 megawatts, with average production reaching 697 megawatts, which was
below demand by 10.3 percent. Installed capacity was forecasted to increase from 1,100 megawatts in
2010 to 2,780 megawatts in 2015. Demand was projected to increase from 907 megawatts in 2010 to
2,250 megawatts in 2015. These forecasts show that Tanzania would have a surplus supply of electricity
in 2015 if programmes were implemented according to plan (URT 2011d). The Tanzania Electric Supply
Company has put up an Electricity Supply Industry Reform Strategy and Roadmap covering year’s 2014
to 2025 taking into consideration the needs for the Tanzania’s Vision 2025. Among other things the
strategy aims to increase electricity connection from 24% (as of 2014) to 50% in 2025.
Current Context: Infrastructure
Information and Communications Technology
The information and communications technology (ICT) network in Tanzania remains unable to meet
demand, especially from businesses. Connections are limited to urban areas and a few semi-urban
communities (URT 2011d). Few if any people in rural areas have access to internet services. On a
positive note, approximately 13.4 million adult Tanzanians have access to a mobile phone (URT 2011d).
Some of these mobile phone users are connected to the internet. Targets and indicators related to ICT
have enormous potential to boost development by, for instance, facilitating greater access to market and
health information and financial services.

30
Transport Systems
Tanzania has the lowest road density in the East African region with only 103 metres per square
kilometre and only 7.4 metres per square kilometre are paved roads. Available statistics indicate that only
28 percent of the rural population live within 2 kilometres of an all-weather road. Trunk roads, which are of
strategic importance in general economic growth and fostering market linkages with neighbouring
landlocked countries and the rest of the African continent, have an approximate length of 12,786
kilometres, of which only 40.4 percent is paved (URT 2011d).
Over the past decade, the performance of railways declined substantially due to dilapidated infrastructure.
Problems include inadequate investment in the maintenance and rehabilitation of railways, old
locomotives and wagons and outdated though permanent railways that have high maintenance costs. As
a result, Tanzania’s railways have been outperformed in terms of trade by other regional corridors such
as the Northern Corridor that connects Mombasa to Kampala, the Maputo Corridor and various corridors
running through South Africa. Nevertheless, efficient operation of the railway system has enormous
economic potential for Tanzania on the basis of the country’s strategic geographical location in relation to
surrounding landlocked countries. This potential source of growth has not been fully exploited.
In the area of marine transport, Tanzania has established itself as a crucial national and international
trade gateway. The combined traffic handled at its three major seaports increased at an average annual
rate of 8 percent over the 2003–09 period. Forecasts indicate tremendous expected growth in demand for
port services in Tanzania linked to high growth of trade, both domestic and with neighbouring countries.
With such domestic growth and the global expansion of economic activities, port development is
inevitable.
Air transport plays an important role in the economy, particularly in the tourism and horticulture sectors.
However, basic infrastructure and facilities (e.g., runways, aprons, taxiways, buildings and fire tenders) at
most of the airports in Tanzania are generally in poor condition. Regardless, there was a slight increase in
the number of domestic and international passengers from 961,985 in 2005 to 1,087,329 in 2008, after
which there was a decrease to 988,637 in 2009. The average increase over the period was 6.4 percent.
Cargo transported by air declined from 30,108 tonnes in 2008 to 27,279 tonnes in 2009. This
performance does not correspond to the available potential given Tanzania’s strategic geographical
location (URT 2011d).
National Priorities
A number of national priorities have been identified for Tanzania by taking into account both global
minimum targets and targets identified at the national level. The proposed global targets are very relevant
for the country as they focus on access to energy and infrastructure, which is often limited. The proposed
national target and indicators focus on making sure that access to energy and infrastructure is
sustainable. Sustainability is important because current energy sources constitute a threat to the
environment, which may affect future access to energy sources. Table 4 summarises the global and
national targets and indicators for Tanzania.

31
Table 4. Ensure sustainable energy and develop infrastructure for all: Targets andindicators
Target Indicator
Global
Ensure full access to developed infrastructure and communication technology
Internet users (per 1,000 people)
Average bandwidth speed (megabits/second)
% of the population with access to an all-season road
% of adults with an account at a formal financial institution
Ensure access to energy and improve efficiency and sustainability of energy supply, including renewable energy
# of hours per day households have access to electricity on average
Rate of improvement in energy intensity
Share of the population with access to modern cooking solutions (%)
Share of renewable energy to total energy consumption
National
Ensure sustainable energy % change in clean energy consumption across sectors
Final consumption of different types of renewable energy
% of national expenditure used to produce renewable resources
Challenges and Opportunities
Energy
There are many challenges facing the energy sector, including: shortages of power generation and
reserve margins; high levels of system losses; poor quality of supply, with voltage fluctuations outside
rated values and power outages due to aging infrastructure and poor service delivery; high liquid fuel
prices in the world markets; inefficiency of the Tanzania Electric Supply Company due to its hidden costs;
under-pricing; revenue collection and distribution losses; sub-optimal operation and over-dependency on
hydro, which is prone to suffer from the vagaries of weather; untimely implementation of the Electricity
Supply Industry Reform Strategy and Roadmap , Power System Master Plan; and institutional
weaknesses due to incomplete reforms in the energy sector. Nevertheless, opportunities exist.
Opportunities in the energy sector include: the potential to develop alternative sources of energy and
diversify energy sources; develop the potential of hydro; readily available internal and regional markets;
and the potential of Tanzania emerging as a power exporter for the Eastern Africa Power Pool. Attaining
the proposed targets requires heavy investment in the energy sector. The recent discovery of natural gas
and oil in southern Tanzania may provide a solution to energy problems in the country. The government,
however, needs to make sure that contractual agreements with investors in the energy sector benefit the
country. The experience of the mining sector shows that contracts signed between investors and the
government mostly benefitted the former over the latter.
Infrastructure
Tanzania faces a number of significant challenges with respect to improving transport systems, as
outlined in Figure 1.

32
Figure 1. Key challenges facing Tanzanian transport infrastructure
Nevertheless, opportunities exist in all areas of transport. With respect to the road network, opportunities
include the East African Community Road Master Plan for which financing is needed, the existence of a
public-private partnership legal and institutional framework, the government’s commitment to allocate 1
percent of GDP to research and development (part of which could be directed towards research on low-
volume road seals) and the existence of labour-based technologies. Regarding rail transport,
opportunities include the growth of Tanzania’s economy, potential of increasing productivity in the
country’s main sectors and growing economies of neighbouring landlocked countries. Other opportunities
include existing financing instruments for regional projects from international financial institutions, such as
the World Bank (e.g., the Multilateral Investment Guarantee Agency), International Finance Corporation
and African Development Bank. Non-concessional loans, sovereign wealth funds and public-private
partnerships are also options. One major opportunity for marine transport is Tanzania’s potential to serve
as a regional logistical hub for growing landlocked countries. Others include agricultural and mining
outputs being shipped to regional and international markets and public-private partnerships. Finally, the
growing tourism, horticulture and fishing sectors are some of the opportunities that can be exploited by air
transport. To attain this SDG, the government needs to focus on the improvement of infrastructure, which
has a bearing on growth and development. Infrastructure improvement should aim to take advantage of
the country’s strategic role as a hub for a number of eastern, central and southern African countries.
Road transport
• Inadequate integration of the road network, markets and productive areas
• Unplanned urbanisation and traffic congestion in urban areas
• Insufficient funds for construction and maintenance of roads
• Poor storm water drainage, especially capacity and capability of local construction industries
• Unstable road network due to a high percentage of unpaved roadsthat are highly vulnerable to rain
Rail transport
• Dilapidated infrastructure
• Inadequate investment in the maintenance and rehabilitation of railways
• Old locomotives and wagons
• Outdated though permanent railways that have high maintenance costs
Marine transport
• Inadequate exploitation of the potential of marine transport to meet domestic, regional and international demands and complement other modes of transport
• This is a result of:
• low capacity of port infrastructure
• ineffective operational systems
• inefficiency of railway systems in transporting cargo from ports
• Stiff competition from other ports in the region
Air transport
• Need for improved and maintained air transport facilities and services, including carriers and services to meet domestic and international air transport needs

33
Establish a Sustainable, Healthy and Resilient Environment for All
Current Context
Environmental policy and management involve directives and interventions that deal with national
environmental problems identified through the National Environmental Action Plan (URT 1994),
National Environmental Policy (URT 1997) (see Box 1) and Environmental Management Act (URT 2004).
The Environmental Management Act includes provisions for institutional responsibilities with regard to
environmental management, environmental impact assessments, strategic environmental assessments,
pollution prevention and control, waste management, environmental standards, state-of-environment
reporting, enforcement of the act and a National Environmental Trust Fund. A number of other
environmental management strategies have been established around sectors and areas of critical interest
such as arid lands, mountainous lands, wetlands, agricultural and pastoral lands, coastal and marine
areas, water, forests, deserts, pollution and biodiversity. Tanzania strives to mainstream various regional
and international agreements and conventions on the environment in its development frameworks. The
environment has been mainstreamed in both iterations of the country’s NSGRP.
Box 1. Extract from the National Environmental Policy Tanzania took an active part in the preparations for, and during the United Nations Conference on
environment and development which enshrined the integration of environmental concerns and
economic development in the Rio Declaration on Environment and Development, and Agenda 21. It is
working closely with other countries in the Region and the International community to contribute
towards a peaceful, healthier and better global environment for present and future generations.
Tanzania has become a party, and is implementing a number of global and Regional Environmental
Treaties, as a basis for global and regional cooperation in the pursuit for sustainable development. It
is host to important sub-regional programmes and projects conceived and implemented in concert
with neighbouring countries, as a basis for harmonised management actions and approaches, and as
a form of preventive diplomacy (URT 1997).
Tanzania has been able to enforce the conduction of environmental impact assessments in all significant
projects. Conservation has increased in protected terrestrial and marine areas. Afforestation has
increased, the National Forest Programme was completed to implement the 1998 Forest Policy and the
Eastern Arc Mountain Forests Conservation Strategy was established in 2008. Further environmental
protection is implemented by policies that emphasise the technical efficiency of vehicles (e.g., tax on old
cars), increasing the efficiency of biomass cook stoves, waste management including landfills and
wastewater treatment, and encouraging the use of liquefied petroleum gas and electricity instead of
fuelwood.
Like many other developing countries, Tanzania is expected to be increasingly affected by climate
change. Warmer temperatures and altered precipitation patterns are likely to impact agricultural
production, while higher sea levels may impact coastal communities, including the cities of Dar es Salaam
and Tanga. Since the main source of electricity in the country is hydro, persistent drought will likely have
an adverse impact on energy supply. However, there are no indicators in the current monitoring system

34
for the NSGRP that capture information on the impacts of climate change and interventions to mitigate
those impacts.
A number of national priorities on the environment have been identified for Tanzania by taking into
account its development priorities such as sustainable energy and agricultural sector productivity. Natural
resources such as water, forests and biodiversity, which are expected to be severely impacted by warmer
temperatures, a situation that would undermine the population’s health and livelihoods, were considered
in identifying targets and indicators. Participants in the consultations conducted by the Tanzanian
government and REPOA provided important inputs in identifying relevant targets and indicators. Table 5
summarises the examined global and national targets and indicators for Tanzania.
Table 5. Establish a sustainable, healthy and resilient environment for all: Targets and indicators
Target Indicator
Global
Build resilience and reduce deaths from natural hazards
Disaster deaths per 1,000 inhabitants
Safeguard ecosystems and biodiversity
Net loss in forest area (% of land area)
Trends in coverage of protected areas
Publish and use economic, social and environmental accounts in all governments and companies
Share of large tax unit taxpayers using integrated reporting6
Existence of national and sub-national government publishing according to the System of Environmental-Economic Accounting7
National
Publish and use economic, social and environmental accounts in all governments and large companies8
Proportion of government entities and large companies (capitalisation above US$100 million equivalent) publishing economic, social and environmental accounts
Existence of regulations that require government entities and large companies (capitalisation above US$100 million equivalent) to publish economic, social and environmental accounts
Mainstream environmental sustainability in government policies, strategies, budgets and plans
Number of operational national programmes or action plans incorporating sustainable production and consumption
Enterprises undertaking environmental assessments and complying with standards
Certified experts by environmental thematic area for practicing environmental assessments
Safeguard ecosystems, species and genetic diversity
Percentage of native plant and animal species endangered versus secured
Mountain ecosystems and biodiversity secured
Marine ecosystems and biodiversity secured
6 Integrated reporting is a process founded on integrated thinking that results in a periodic integrated report by an organisation about value creation over time and related communications regarding aspects of value creation. An integrated report is a concise communication about how an organisation’s strategy, governance, performance and prospects, in the context of its external environment, lead to the creation of value in the short, medium and long term (IIRC 2013). Large taxpayers are very different from other categories of taxpayers and present certain significant risks to effective tax administration. Key characteristics of large businesses include: concentration of revenues, complexity of business and tax dealings, withholding agent or intermediary role, use of professional tax advisors and possession of in-house tax organisation. Businesses may be publicly listed corporations, multinational companies or private groups (OECD 2009). 7 This is primarily a “yes-no” indicator and has binary variables that can only have two possible values. 8 This national target is similar to the global one, but insists on large companies being champions of environmental protection because their activities are disproportionately responsible for pollution.

35
Challenges and Opportunities
Climate change will likely compound the already existing problems of land degradation, deforestation and
wildlife and habitat loss. Increasing air and water pollution is a major challenge that requires more diligent
attention to the increasing scale of various productive and extractive activities and growing unplanned
urban settlements. Smarter ways to dispose of plastic materials need to be devised, especially in urban
areas. However, opportunities have arisen from these new challenges, particularly those related to
climate change. For instance, REDD+ (which refers to reducing emissions from deforestation and forest
degradation in developing countries, and the role of conservation, sustainable management of forests and
enhancement of forest carbon stocks in developing countries), biofuel farming and the Clean
Development Mechanism could be strategically exploited and can contribute to poverty reduction
initiatives. The government has developed a national REDD+ strategy to ensure the conservation and/or
enhancement of its unique biodiversity values and forest ecosystems so that the corresponding benefits,
goods and services are equitably shared by all stakeholders for the adaptation, mitigation and adoption of
a low-carbon development pathway under all processes as required by the United Nations Framework
Convention on Climate Change (Kahyarara 2014).
Significant funding to address environmental risks and climate change adaptation deficits is essential to
reduce the impacts of climate change. Environmental efforts in Tanzania depend heavily on donor
funding. Such dependence is not sustainable because, with time, moral hazard will develop to the extent
that environmental protection obligations will need to be integrated with economic activities (Kahyarara
2014). In this regard, support for conservation tends to be integrated with development and reducing the
vulnerability of the poor by building their adaptive capacities. Going forward, an innovative approach that
builds on existing experiences and knowledge must be adopted. An important first step in the
development of environmental resilience is to acknowledge the risks arising from climatic variability that
are already built into the design of development projects and programmes. This is the only way to
promote robust projects and programmes that can adequately cope with environmental challenges. The
government should further develop its national climate change strategy to promote climate-resilient, low-
carbon growth. An integrated strategy would encourage synergies, reduce conflicts and ensure that
Tanzania can take advantage of opportunities arising from international negotiations.
36
Establish Open, Accountable, Inclusive and Effective Institutions, Rule of Law and a Peaceful and Inclusive Society
Current Context
Governance can be defined as the exercise of political, economic and administrative authority to manage
national affairs. Good governance is a function of efficient, effective interaction among key government
institutions, on the one hand, and their interface with the private sector and civil society on the other.
Democracy and good governance form the foundation of economic growth, poverty eradication and
sustainable development. Such governance entails moral, ethical and cultural considerations, respect for
the rule of law, human rights and right to development, absence of corruption and ownership of a
country’s development agenda. Good governance, an area that was absent from the MDGs, was
considered to be a key concern for sustainable development during the consultations conducted by the
Tanzanian government and REPOA. Capacity building in this area at the national and local levels was
considered vital.
The MDGs did not explicitly address governance issues but subsumed them under MDG 1 on eradicating
extreme poverty and hunger and MDG 8 on developing a global partnership for development. Only good
governance practices will promote both the mobilisation of local and external resources and their prudent
utilisation for pro-poor growth and development. The governance issues examined for Tanzania, which
emerged during the consultations, include democratic decentralised governance, participatory
development management, transparency and accountability, and the rule of law and human rights (see
Table 6). The Tanzania National Development Vision 2025 and Long Term Perspective Plan, both of
which underscore the centrality of improved governance for growth and development, were also taken
into account. They envision (i) prevalence of the rule of law, (ii) government accountability to the people,
(iii) deepening of democracy, political openness and tolerance, (iv) sustaining peace, political stability,
national unity and security and (v) active participation in the maintenance of regional peace and security.
Since the introduction of plural political systems in 1992, Tanzania has witnessed improved political,
economic and administrative governance, especially in the areas of democracy, political tolerance,
national cohesion and business climate. After years of political acrimony in Zanzibar, particularly after the
2000 elections, the election of an inclusive government in favour of national unity in 2010 has stabilised
Zanzibar politics and ended social tensions. Good governance practices are emerging, specifically the
sustenance of peace and security, which contribute to macroeconomic stability. Political leaders are freely
elected through inter-party competition, albeit in some cases on uneven playing fields. There are free
print and electronic media that promote civic education and criticise shortcomings in both politics and
society. Various governance institutions have been established including the National Electoral
Commission and the Commission for Human Rights and Good Governance.
Challenges include the credibility, trustworthiness and efficacy of these and other institutions. The
Prevention and Combating of Corruption Bureau, for instance, has failed to address high-level corruption
as indicated by the Controller and Auditor General’s annual reports. There are also weaknesses in the
criminal justice system, specifically the police, Office of the Director of Public Prosecutions and the courts.
Moreover, the African Peer Review Mechanism and national post-2015 consultations highlighted the
following challenges: corruption, poor service delivery, over-centralisation of power (especially in the
presidency), devolution and empowerment of sub-national governance systems and the sustenance of

37
the Tanganyika–Zanzibar union (URT 2013). Key priorities for Tanzania that have emerged include
enhanced democratic governance, the rule of law and due process, human rights, transparency and
accountability, devolution and decentralised governance, sound budgetary policies and priorities, and
administrative and bureaucratic consistency (see URT 2013).
National targets and indicators have been selected by taking in account both the consultations conducted
by the Tanzanian government and REPOA and global minimum targets. Many proposals emerged from
the consultations, but they are consistent with the global minimum targets. Hence, there are few national
targets and indicators because Tanzania’s priorities are well captured by the global targets and indicators.
Table 6 summarises the proposed global and national targets and indicators for Tanzania.
Challenges and Opportunities
Collecting data on governance has been a challenge in Tanzania and many other development countries.
The increase in demand for and use of data in recent years necessitates an increase in the financial and
human resources needed to collect data. Given high poverty rates in the country, more attention has
been given to poverty and social services data than governance data. Governance data in Tanzania have
been collected by CSOs.
Table 6. Establish open, accountable, inclusive and effective institutions, rule of law and a peaceful and inclusive society: Targets and indicators
Target Indicator
Global
Provide free and universal legal identity, such as birth registrations
Percentage of children under 5 who are registered with the civil authority
Proportion of adults with a basic legal identity document
Monitor and end discrimination and inequalities in public service delivery, the rule of law, access to justice and participation in political and economic life on the basis of social status
Average time between filing a case and receiving a verdict
Proportion of seats held by women and minorities in national- or local-level government
% of adults with an account at a formal financial institution, disaggregated by sex
Improve personal safety Prevalence of violence against women, including domestic violence
Violent death per 100,000 people
Reduce bribery and corruption in all forms
Survey data regarding bribes or gifts for service from a government official – “In the past year, how often (if ever) have you had to pay a bribe, give a gift, or do a favour to government officials in order to get a document or receive a service”
Improve transparency in the revenue system
Share of eligible taxpayers who submit their taxes
National
Respect human rights % of people belonging to social groups
% of people who can freely discuss their views
% of people who are free to join a political party
Respect rule of law and improve access to justice
% of court cases outstanding for two or more years
Number of available attorneys/accessibility to attorneys
Provide free and universal legal identity
Percentage of newborns registered at birth

38
Progress on governance indicators has been mixed, with some showing improvement and others not,
which suggests that more efforts are needed to attain tangible outcomes. Indicators on citizens’
participation and human rights have shown improvements, while results related to corruption have not
been impressive (URT 2011d). Citizens generally perceive that the government has not being doing its
best to address corruption, especially high-level corruption. More efforts are needed in this area,
particularly because corruption has a bearing on other targets.

39
Establish a Global Partnership for Sustainable Development
Current Context
For low-income countries, global partnership seeks to improve the gains from the international trading
and financial system, promote market access and fairer trade rules and tackle debt. It also aims to work
with pharmaceutical companies to improve access to affordable essential drugs and cooperate with the
private sector to make available the benefits of new technologies, specifically ICT. While debt levels have
dropped overall, the demand for official development assistance has increased since the global financial
crisis as disbursed aid has decreased. In order to enhance aid effectiveness and enable poor countries to
reduce aid dependence, mechanisms for mutually holding accountable both developed and developing
countries are gaining attention in the follow-up to the Paris Declaration on Aid Effectiveness of 2005,
Accra Agenda for Action of 2008 and Busan Partnership for Effective Development Cooperation of 2011.
Otherwise, progress on the various indicators of the impact of global partnership has been mixed.
Under MDG 8, countries committed to a target on developing further an open, rule-based, predictable,
non-discriminatory trading and financial system. This target includes a commitment to good governance,
development and poverty reduction. Good governance is assessed in the way that it is integrated into a
country’s development strategies, especially strategies on poverty reduction, social well-being and
economic growth. It is one of the conditions for continued official development assistance and legitimacy
of governments, covering accountability for the resources received, results, rule of law and human rights.
Good governance is reported on annually in the Tanzanian government’s NSGRP Annual Implementation
Reports.
Tanzania has continued to do well on official development assistance, external debt management and
coordination of resource flows from development partners. Dialogue between the government and
development partners continues to be open, but more needs to be done on aid predictability. Not all
development partners are using government systems (e.g., exchequer, audit and procurement). There
are also concerns about funds that flow into the country outside the exchequer system. The government,
according to the Joint Assistance Strategy for Tanzania (JAST) for the 2006–10 period, takes general
budget support as the preferred form of aid delivery. The Tanzania Assistance Strategy of 2002, later
upgraded into the JAST in 2006, upholds the objective of providing a framework for partnership and
strengthening donor coordination, harmonisation and national ownership in the development process and
aid effectiveness procedures. JAST is framed within the context of the international commitment to aid
effectiveness, particularly the Paris Declaration and Accra Agenda for Action. Development partners have
adopted JAST as the basis for guiding their development cooperation and technical assistance in order to
enhance aid effectiveness in Tanzania. There has been improvement in the quality of communication to
build trust but performance and financial commitments have not be as positive as expected. Performance
on good governance indicators remains a source of tension.
MDG 8 involves duty-free, quota-free access for the least developed countries’ exports, an enhanced
programme of debt relief for heavily indebted poor countries and cancellation of official bilateral debt, and
more generous official development assistance for countries committed to poverty reduction. However,
duties paid on imports from developing countries remain high, tariff levels and structures continue to act

40
as barriers to trade and non-tariff barriers are proliferating. Improved trade transparency would be a major
step towards greater fairness in international trade. However, the breakdown of negotiations on the Doha
Development Round within the World Trade Organization, which was launched in 2001 and continues
today, shows that an “open, equitable, rule-based, predictable and non-discriminatory multilateral trading
and financial system” has yet to be realised.
Tanzania has been struggling with capacity issues in creating competitive export strategies for small and
medium-sized enterprises and the private sector in general to access external markets. Tanzania
participates in the Aid for Trade initiation of the World Trade Organization, specifically the Integrated
Framework for Trade-Related Technical Assistance initiatives, aiming to mainstream trade capacity into
national development and poverty reduction and development strategies. Ongoing interventions have
focused on improving the investment climate, business environment and international competitiveness.
Due to Tanzania’s falling ranking in the World Bank’s Doing Business reports, the president ordered the
development of the 2009 Roadmap on Improving Tanzania’s Performance in Doing Business
implemented through a three-year Comprehensive Action Plan. The competitiveness agenda has been
widened to include availability and quality of infrastructure services, such as electricity, water and ICT,
and scrutiny of related regulatory frameworks, financing and access to domestic, regional and
international markets. In Zanzibar, different measures have been taken to improve the business
environment, including the launching of Zanzibar doing business report and preparing a roadmap on
improving the business environment. The report Doing Business in Zanzibar 2010 analyses Zanzibar’s
business regulations and compares the ease doing business in the isles with the mainland Tanzania and
182 countries (World Bank 2010). Recommended actions for improved market access include the
strategic choice of goods and services that are aligned with demand at prices that permit reasonable
profits, promotion of decent work and access to trade intelligence and building capacity to analyse
preferential and regional trade agreements, which often overlap in inconsistent ways.
With regard to official development assistance, a number of challenges exist in aid management.
Specifically, institutional capacity (e.g., human resources) and the public finance management system for
administering external aid require strengthening. Funding delays, irregularities and unpredictability,
especially with regard to funds channelled through project modalities, are issues that continue to slow
implementation (URT 2011b).
Implementation Bottlenecks
Notably, the results of the Paris Declaration Monitoring Survey of 2008 indicate some trends that call for
short- and long-term interventions. Critical trends include: a decline in the percentage of aid flows aligned
with national priorities; disbursements channelled outside the exchequer tend to distort and weaken
government systems, particularly regarding accountability; a decrease in the predictability of aid; and the
allocation of 4.5 percent for general budget support for Zanzibar from mainland Tanzania proved to be too
low to accommodate its budget requirements. The recent phenomenon of channelling aid through global
initiatives has added another challenging dimension in aid coordination and harmonisation. Besides
adding to transaction costs, these initiatives increase difficulties in controlling the quality of aid, especially
in ensuring continuity and alignment to the national priorities. The global financial crisis made financiers
and investors risk averse, which lead to a slowdown in foreign direct investment and official development
assistance. In Tanzania, it forced investors to postpone or shelve large investment projects. The
government has found it challenging to improve the investment climate, aid and trade relationships and
domestic accountability (URT 2011b).

41
National Priorities
Table 7 outlines key national priorities with respect to global partnership for Tanzania. The proposed
national targets are linked to (i) commitment and timely delivery of aid, (ii) effectiveness of development
aid and (iii) transparency and accountability. Participants in the consultations conducted by the Tanzanian
government and REPOA emphasised the need for aid to be pertinent and meet recipient priorities. All
participants stressed the need to establish a strategy on strengthening the domestic economy so as to
reduce aid dependency and make more effective use of domestic resources for development. This
follows from the fact that Tanzania is endowed with varied resources, such as minerals, water and natural
attractions, including Africa’s highest mountain, Kilimanjaro. Moreover, natural gas and oil were recently
discovered in southern Tanzania. All these resources have not been fully exploited.
Challenges and Opportunities
Along with existing trade policy and export development strategy, the Roadmap on Improving Tanzania’s
Performance in Doing Business should be part of the government’s ongoing efforts to develop the
productive capacities and competitiveness of Tanzanian companies, as it actively participates in global
trade negotiations that seek to lower tariff and non-tariff barriers in the markets of developed countries
and increases participation in the setting of international standards. Besides formal and informal small
and medium-sized enterprises, building capacity for export development should extend to smallholder
farmers.
Tanzania has an Independent Monitoring Group that periodically assesses the government and
development partners by using the JAST structure for engagement. JAST has been institutionalised and
Table 7. Establish a global partnership for sustainable development: Targets and indicators
Target Indicator
Global
Create an enabling environment for sustainable development
Low-income country debt forgiveness or reduction (% of GDP)
Share of trade in goods and services from low-income countries under duty-free, quota-free market access
Existence of laws for ensuring country-by-country reporting by multinational corporations, disclosure of beneficial ownership and the prevention of money laundering
Increase financing to productive capacity in low- and middle-income countries
Share of aid to the productive sector
Proportion of foreign direct investment to the productive sector
Share of South-South cooperation to the productive sector
National
Implement reforms to ensure stability and transparency of the international financial system
Share of non-performing loans in banking system’s total loan portfolio
Implementation of Basel International Banking Standards
Existence of banking transparency legislation to combat illicit financial flows
Proportion of total country imports (by value and excluding arms) from developing countries and least developed countries
Contribute further to an open, rule-based, predictable, non-discriminatory trading and financial system
Share of exports and imports to GDP

42
is linked to the national development strategy. Country assessments should also take cue from the
African Peer Review Mechanism and the proposed actions of the New Partnership for Africa’s
Development on putting aid to the most productive uses for growth and poverty reduction. It is important
to engage with emerging non-traditional donors on aid, investment, trade and technology and knowledge
transfers, including technical cooperation. Other external financial flows and foreign direct investment are
equally important, but should be directed to productive uses so that they have an impact on growth and
poverty reduction (URT 2011b).

43
Ensure Access to Quality Health Care for All
Given that health is an area of critical importance to Tanzania, the research team included it as an eighth
goal area in the examination of national priorities for the SDGs. Participants in the consultations
conducted by the Tanzanian government and REPOA insisted on addressing the challenges in and
around the health sector.
Current Context
Limited access to quality health services by the majority of the Tanzanian population has undermined health
outcomes. Evidence includes higher rates of maternal and infant mortality, outbreak of cholera and
incidences of tuberculosis. With respect to nutrition, about 42 percent of children under five years of age
have low height for age or are stunted, 5 percent have low weight for height or are wasted and 16 percent
have low weight for age reflecting both chronic and acute malnutrition. With regard to maternal mortality,
the maternal mortality ratio ranged from 353 to 556 deaths per 100,000 live births as of 2010. Such a high
ratio undermines progress towards achieving the target under MDG 5 of 133 deaths per 100,000 live births
in 2015 (URT 2011d). Figure 2 provides an overview of the dimensions that hinder access to health
services.
Figure 2. Dimensions that hamper access to health services
In addition, inadequate enforcement of health policies, such as free health services that aim to support
special groups including pregnant women, children and elders, undermine health outcomes. Notably,
corruption in the health sector is a serious problem that affects accessibility, particularly the poor and
other marginalised and vulnerable groups. Other problems related to human capital, especially lack of
competencies among health practitioners and low commitments resulting to low motivations have also
accounted for lower health outcomes. Strategic interventions and measures that aim to address both
demand-side factors (factors influencing the ability to use health services) and supply-side factors
(aspects inherent to the health sector that hinder service uptake) are necessary. Both sides of the
problem have to be addressed concurrently since barriers to access may not always be mutually
exclusive and may interact and reinforce each other.
Geography
• Service location
• Household location
Availablity
• Poor infrastructure
• Lack of or gaps in knowledge by health personnel
• Inappropriate application of available technology
• Lack of drugs and low quality of available drugs
Affordability
• Costs of services
• Household resources and willingness to pay
Acceptability
• Characteristics of health services
• User attitudes and expectations
44
Furthermore, communicable and other diseases, such as HIV/AIDS and malaria, as well as diarrhoea,
pneumonia, malnutrition and complications of low birth weight continue to overburden the health sector.
The significant number of outpatients is largely due to communicable diseases. Better strategies and
more efforts are required in order to address such diseases. Among these strategies, one is to continue
improving the sector to attract more private health service providers. The private sector has recently
emerged as the predominant source of ambulatory care, especially with regard to diagnosis and
treatment of most communicable diseases. Another key health-related issue is non-communicable
diseases, such as cancer and cardiovascular diseases. Non-communicable diseases currently account
for the most deaths and their prevalence has been rising. Preventive actions and efficient strategies are
urgently needed to deal with risk factors like smoking, alcohol, promiscuity and physical inactivity,
particularly among youth.
National Priorities
Low access to quality health services and the emergency of non-communicable diseases evidently have
been undermining health outcomes in Tanzania. However, since resources are limited, it is important to
prioritise certain areas in which progress would have the most impact.
Skills Development, Resource Management and Incentive Structure
Gaps in knowledge and incompetence among health service personnel undermine the provision of quality
health service. For example, 51 percent of births were assisted by a skilled birth attendant in 2010, while
only one in five women who required emergency obstetric care actually received it (URT 2011d). Lack of
knowledge creates opportunities for incorrect medication to be prescribed and the inappropriate
application of available technology, which can lead to deaths due to negligence. Skills development
among health service personnel as well as proper management and rationalisation of the distribution of
human and financial resources in the health sector are needed. In addition, there is a need to create an
incentive structure that helps retain health professionals in the country and attracts health professionals to
underserved areas.
Better Hospital Facilities and Supplies
Among the factors that account for the high rate of maternal mortality is poor hospital environments.
Experience has shown that poor hospital environments, which lack facilities and drugs, cause many
pregnant women to decide to take the risk of delivering outside of hospitals, which increases the
likelihood of death. Improving hospital environments with better facilities and supplies, including quality
drugs, is necessary. Infrastructure development could be undertaken through public-private partnerships.
Effective Monitoring and Evaluation Framework
The lack of an effective monitoring and evaluation framework undermines efficacy and progress in the
health sector. There is a lack of capacity to receive feedback about interventions that have been
undertaken. For example, given the emergency of non-communicable diseases, there have been calls for
the development of indicators that will help existing frameworks to monitor progress and the impacts of
interventions. The lack of such indicators affects the capacity to implement changes when strategies
appear not to be working or simply need fine-tuning. Therefore, it is important to ensure that there is an

45
effective monitoring and evaluation framework that may well guide decisions towards better health
outcomes.
Accountability Mechanism
Instituting an accountability mechanism that covers health service personnel is important in order to
minimise deaths due to negligence. Each maternal death and other deaths need to be investigated to
determine the causes of death, including those that involve poor medical attention, and corrective
measures need to be continuously taken. One strategy could be to institute a counter-checking
mechanism so as to avoid business as usual.
Enforcement of Effective Policies
Several good policies are in place that focus on ensuring universal access to health services in the
country. However, lack of enforcement to implement established policies undermines the outcomes of
several health initiatives (e.g., free health services for special groups including pregnant women, children
and elders). There is a need to revisit and strengthen the institutional capacities of the health sector.
Establish Universal Health Insurance Coverage
Introduction of universal health insurance that covers all people, including the poor, would increase
accessibility to better health services and improve equity and equality in the utilisation of health services.
A proper framework that best accommodates local conditions will have better outcomes. More resources
should be allocated to finance such a framework. Strategic interventions leading to universal access to
sexual and reproductive health services, including family planning services, would significantly improve
maternal health outcomes by ensuring that those who need but cannot access family planning services,
most of whom are poor and marginalised women, will receive them. This would, in turn, reduce fertility
rates among the poor and promote the empowerment of women, which are key to sustainable
development. Ensuring women’s reproductive rights would mean that women have children by choice and
not by chance, which increases the probability of women being productive.
Improve Access to Water and Sanitation
The lack of safe and clean water and sanitation in communities, especially in schools, is an issue that
requires utmost attention and urgent interventions. The lack of access to safe and clean water and
sanitation undermines all other efforts in the health sector, particularly with regard to communicable
diseases. Such access would likely reduce the number of patients who demand health services for
diseases such as cholera, which results from poor hygiene. A significant decline in the number of patients
would leave ample resources and capacity for the provision of better health services for tougher
challenges. The allocation of more resources to increase the supply of safe and clean water and
sanitation in communities, in conjunction with continuous sanitation education and awareness campaigns,
would greatly improve public health.

46
Measuring Progress on Post-2015 in Tanzania
National Statistical System
Tanzania’s central statistics office, the NBS is a government agency that was established in 1999 as a
successor to the Central Bureau of Statistics. The NBS was established with the enactment of the
Statistics Act of 2002 and has the mandate of collecting data in Tanzania. The Statistics Act states that
the NBS deals with the collection, compilation, analysis and publication of statistical information on
economic, social and cultural activities. The NBS conducts censuses and surveys that yield a wide range
of economic, social and demographic data. The NBS also works very closely with Zanzibar’s Office of
Chief Government Statistician (OCGS), which was also established in 1999 and is responsible for the
development and management of official statistics on the island.
With regard to the national statistical system (NSS), the NBS is responsible for the organisation of
economic and social statistics with a view to coordinate and disseminate statistical information. The act
states that the functions of the NBS are:
to take any census in Tanzania;
to draw up an overall national statistics plan for official statistics and keep it under continuous
review;
to establish statistical standards and ensure their use by all producers of official statistics so as
among other things to facilitate the integration and comparison of the statistics produced both
nationally and internationally;
to co-ordinate statistical activities in the country so as (i) to avoid duplication of efforts in the
production of statistics; (ii) to ensure optimal utilisation of available resources; (iii) to reduce the
burden on respondents for providing statistical data; (iv) to ensure uniform standards of statistical
data;
to collect, compile, analyse and disseminate statistics and related information;
to maintain an inventory of all available official statistics in the country;
to assist users in obtaining international statistics;
to provide statistical services and professional assistance to official bodies and the public at large;
and
to act as a contact point for international organisations and foreign institutions in need of statistics
on matters relating to Tanzania.
The NBS has branches in various regions of Tanzania to enable the compilation of information. Many
improvements were made in order to collect data for both poverty monitoring in the country and
international comparisons under the MDGs. The NBS produces statistics using data collected with five
main instruments: censuses, household survey, agriculture survey, enterprise survey and a User
Satisfaction Survey (see Box 2).
In 2011, the NBS started to produce the Compendium of Statistical Classifications in Tanzania Mainland.
This document comprehensively compiles statistical classifications for data production and management
and covers various sectors of the economy. It has been prepared as part of the implementation process

47
of the Tanzania Statistical Master Plan (TSMP), adopted in 2009–10, that aims to establish a fully
coordinated and harmonised NSS in the country (see NBS and OCGS 2010; 2011; 2013).
A major problem is delays in data release, which often reduce the impacts of policy interventions. Also,
researchers who want to influence policy directions through their research sometimes lose interest in
using data that are more than three years old, especially for indicators that change within a short period of
time.
Box 2: Categories of data produced by the NBS
The census collects accurate figures about the population and its characteristics. While figures increase and decrease over time, characteristics such as gender and age composition take longer to change. The period between one census and another can thus be long. In Tanzania, the Population and Housing Census was conducted in 1968, 1978, 1988, 2002 and 2012.
Household surveys collect socio-economic information about households. The head of the household is usually responsible for the survey on behalf of household members. Such surveys include (i) the Household Budget Survey, which collects information about households’ demographic characteristics and income and expenditure patterns; (ii) Integrated Labour Force Survey, which collects information about households’ economic activities including time use in each activity undertaken by household members; (iii) National Panel Survey, which collects information similar to the Household Budget Survey but more frequently and with a smaller sample size (it provides continuous information on household socio-economic characteristics in between Household Budget Surveys); (iv) Tanzania Demographic and Health Survey, which provides information about demographic characteristics and the health status of household members. Other surveys are (v) the Tanzania HIV/AIDS and Malaria Indicator Survey, (vi) Manpower Survey; (vii) Core Welfare Indicator Survey and (viii) Disability Survey.
Agricultural surveys, such as the Agriculture Sample Census Survey, collect information on farming practices including land size, inputs and type of agriculture.
Enterprise surveys collect information about investment in the country, both large and small, local and foreign. They include: (i) Integrated Business (Baseline) Survey, (ii) Central Register of Establishments update, (iii) Comprehensive update of Central Register of Establishments, (iv) Comprehensive update of Central Register of Establishments, (v) Employment and Earnings Survey, (vi) Annual Survey of Industrial Production, (vii) Foreign Private Investment and (viii) Land Transport Survey.
Data Funders, Producers and Users
Funding Data Collection
The compilation of national data is the primary task of the NBS. The Statistics Act of 2002 allows the NBS
to source funds appropriated by parliament for the NBS, the funds borrowed, received by or made
available to it for the purpose of the discharge of its functions and the donations, grants and bequests that
it may receive from any person or body of persons. In 2010–11, the NBS received support from the
Tanzanian government, World Bank, Department for International Development of the United Kingdom,
United Nations Population Fund, European Union and United Nations Children’s Fund. In the late 2000s,
there was a significant increase in funding of statistical activities to prepare for the Population and
Housing Census of 2012 (see NBS and OCGS 2014). There was an increase in the share of the budget
allocated to the NBS from 0.05 percent to 0.5 percent between 2007–08 and 2011–12 (NBS and OCGS
2010).

48
As discussed below, data collection is done within the context of the TSMP, which is implemented with
JAST principles. Statistical activities have been aligned with government priorities. The biggest share of
the budget of the NBS is received from development partners that are interested in funding the TSMP.
The contribution of the Tanzanian government is allocated to indirect costs, mainly salaries, and direct
costs like utilities. Thus, while the TSMP is important for monitoring progress on MDG implementation, it
is potentially vulnerable to external dependency. Additional funding from the government may reduce this
potential vulnerability. As mentioned, the government has very much potential to increase domestic
resource mobilisation, given the country’s endowment of natural resources and its geographical location.
Infrastructure improvements can also increase the tax base through the formalisation of informal
businesses, which would provide more revenues. Apparently, the tax base is very narrow because of the
country’s large informal sector, which is mainly caused by poor infrastructure.
Data Producers
Tanzania’s NSS includes data producers, providers and users as well as statistical training institutions
and centres in mainland Tanzania and Zanzibar. The NSS has many different actors. Local government
authorities collect and process data from primary providers such as villages, wards, health facilities,
agricultural extension offices or schools. Various ministries, agencies and institutions also collect data
from primary data providers and produce statistics as part of their administrative work. Much of this
information is used as a basis for policy and programme formulation, planning and monitoring as well as
research and analysis. The central institution in mainland Tanzania in the NSS is the NBS, while in
Zanzibar it is the OCGS.
The NBS is mandated to, among other tasks, coordinate statistical activities in the country so as to
produce quality statistics that are comparable over time and across issue areas. It aims to have
comprehensive datasets that can be used by policy-makers and planners. The Concept and Definition for
Official Statistics in Tanzania Mainland is a very valuable document in this regard. In addition, plenty of
administrative data collected by the departments of different ministries are available. As noted during one
of the key informant interviews, the main challenge with administrative data is that some of the available
data are from routine data systems and administrative records, such as data on education enrolment.
These are the most frequently produced data even though they do not cut across all sectors – they are
specific and cover only certain segments of the population. The use of administrative data should
increase.
Other notable producers of official data include the Bank of Tanzania, which produces information related
to monitoring price stability. Annual accounts are produced through collaboration between the Bank of
Tanzania and NBS. Data that are produced include those on monetary supply, inflation rate trends,
interest rates, balance of payments, imports and exports of goods and services, prices of goods and
services, national debt and national savings. The compilation of data at the Bank of Tanzania involves the
use of both raw data and estimations to understand the economy. Economic review reports are produced
monthly, quarterly and annually.
Unofficial data producers include academic and research institutions and businesses. At REPOA, for
instance, data on the perceptions of people are collected through Afrobarometer9 and Views of the
People surveys. There are organisations that collect information on specific areas of interest. For
9 For more information, see www.afrobarometer.org.

49
instance, HakiElimu and Twaweza generate a lot of information on education in innovative ways. While
most unofficial data tends to critically assess the government’s performance, they have been recognised
by the government and used in government publications such as Poverty and Human Development
Reports (see Research and Analysis Working Group 2009; 2012), local government reform programmes
and other government processes. This is typically the case for the Afrobarometer and Views of the
People surveys. More importantly, unofficial data has been used by the opposition to criticise government
performance. Activist institutions have also been using such data to shape policy directions. There are
opportunities for collaboration among data producers. Although the institutions of the NSS are the
custodians of all national data and statistics, unofficial data producers may specialise in certain sectors or
issue areas and collaboration could improve datasets. In the absence of collaboration, there are
opportunities to access various datasets, but there are also challenges in terms of consistency.
The debate on the recently passed Statistics Act of 2015 reflects different views in Tanzania, specifically
whether this act benefits or is detrimental to statistical information. The biggest problem is that the act
makes it illegal to (i) publish or communicate (what is labelled) false or misleading statistical information
and (ii) without lawful authorisation of the NBS, publish or communicate statistical information that may
result in the distortion of facts. There is no protection for those acting in good faith and a minimum of 12
months imprisonment and/or heavy fines. Those against the new law – they are many – argue that it will
hamper public debate and a better way would have been to raise users’ awareness of methodological
issues and various dimensions of bad statistics. The Statistics Act of 2015 will have a major influence on
the SDGs. For those who see this act positively, the NBS will assure the quality of statistics from other
sources and integrate them into the monitoring system. Those who look at the law negatively argue that
the NBS and government will challenge other stakeholders’ statistics and limit monitoring.
Data Users
Data users include the academic and research institutions, CSOs and the government. Academic
institutions use data when publishing papers for both academic and non-academic purposes. Research
institutions mainly use data to inform policy and facilitate informed dialogue. Similarly, CSOs use data
depending on their areas of focus to inform policy. Ministries, departments and other government
institutions use data to enable them to formulate proper budgets and implement policies, programmes
and other activities. In Tanzania, a platform for data producers and users both within and outside
government exists in the form of annual policy dialogue workshops and five sector working groups. The
main challenge that the country faces is with regard to reconciling inconsistent data from various sources,
such as large businesses in the private sector. Collaboration between and among think tanks, CSOs and
the NBS offers potential for these actors to add value to each other’s work. There is potential to make use
of all sources of data.
Historical Evolution of the NSS
From a historical perspective, the evolution of the NSS from independence to date is well documented
(see NBS and OCGS 2010). This evolution is aimed at improving the quality of data collection so that
policy is informed by good statistics. However, the socio-economic reforms that were undertaken by the
government in past decades have created situations that make it difficult for the NBS to play its pivotal
role in the NSS. Situations have been created whereby some institutions, such as the Bank of Tanzania,
the Tanzania Revenue Authority and various ministries, departments and agencies, continue to produce

50
official statistics related to their operations that are not subjected to the standards and methodologies
required by the Statistics Act.
It is important to also note that the late 1990s and early 2000s were characterised by increased demand
for data and indicators to inform evidence-based policy-making. In this regard, the Tanzanian government
through the NBS and OCGS realised the importance of having a NSS in the country that addresses
demand, shortfalls and measures to be undertaken. To this end, the TSMP aims at strengthening the
NSS so that quality statistics are available for policy-makers in an objective, coordinated, timely and cost-
effective manner. It focuses on institutional reforms, human resource development, development of
statistical infrastructure, data development and dissemination, and physical infrastructure and equipment.
The TSMP is a comprehensive framework advocating for statistics, assessing and meeting user needs,
building capacity at all levels (with added focus on sectors), enhancing data quality, as well as mobilising
and leveraging both national and international resources. Therefore, the broad objective of the TSMP is to
coordinate, harmonise and effectively ensure that the statistics produced are timely, adequate and easily
accessible within the entire NSS.
Having the TSMP is an important improvement. The TSMP acts as a set of guidelines for data collection
and the production and dissemination of statistics but also as the document around which donors as well
as data producers and users can gather and discuss. The Partnership in Statistics for Development in the
21st Century, established in 1999 and widely known as PARIS21, has been instrumental in helping
governments and national statistical offices formulate statistical plans. However, resources to fund the
implementation of these plans have been difficult to come by in developing countries and Tanzania is no
exception. What is needed is for all stakeholders, including PARIS21, to drastically shift their emphasis
from the formulation of plans to the implementation of plans.
Data Availability
The NBS compiles a large amount of data that are available in different formats. The Population and
Housing Census is conducted once per decade, with the most recent census conducted in 2012 following
the one in 2002. The Household Budget Survey is conducted every five years, with the most recent being
conducted in 2012 following the one in 2007. Between Household Budget Surveys, the NBS conducts the
National Panel Survey to generate estimates of key statistics. In some cases data for the various targets
and indicators tested under the Post-2015 Data Test are available and accessible, while in a number of
others calculation from existing data sources is required or data need to be collected (see Table 8, next
page). The data revolution has a potential role to play in addressing key data gaps in areas such as
gender-based violence, peace and security, and justice and human rights. The frequency of data
collection should be increased. The use of new technology-based tools, such as mobile phones, may be
an important solution for collecting and disseminating data.
With regard to data availability, data is more readily available for the global indicators examined under the
study with 76 percent of the 45 indicators available. However, it should be noted that a significant portion
of these indicators (11) would require further calculate from existing data. In the case of nationally
selected indicators, data is available for 50 percent.

51
Of the seven goals that Tanzania focused on for this exercise, data are lacking for the goal areas on
governance, energy and infrastructure and environment for global indicators. Data on governance are
only available for four of the nine indicators examined from official sources. For energy and infrastructure,
data is available for five of the eight indicators while only two of the five indicators examined for the
environment are available. Looking beyond the indicators examined for these goal areas, more generally,
there is limited data for these goal areas, particularly when compared to education, health and poverty.
The data revolution has a potential role to play in addressing key data gaps particularly in areas such as
gender-based violence, peace and security, justice and human rights.
Administrative data, data from perception surveys and some national representative data can fill the data
gaps. Administrative data are routinely collected, but many indicators need to be modified to be
meaningful. The possibility of adding some variables to village registers needs to be utilised. With regard
to perception surveys in as much as they collect citizens’ views on some indicators, it remains difficult to
generate accurate estimates. Data on poverty are regularly collected by the NBS and are thus available.
Data on governance could also be derived from unofficial sources, nothwithstanding the challenges noted
above by the Statistics Act of 2015. Afrobarometer, for instance, provides data for most of the proposed
governance indicators, with data being collected every two years. However, the government is unlikely to
use them. Other goal areas have short datasets. A serious problem is the goal area on environment, for
which data are completely unavailable. Many efforts would be needed to collect the required data for
proper assessment of progress under this goal area.
Table 8. Data availability for measuring progress against proposed targets and indicators Goal area Targets Indicators Data for
indicator readily available
Calculation from existing data sources needed
Data to be collected
End Poverty
Global National
3 5 2 3
3 6 2 4
Ensure quality education for all Global 2 5 5
National 4 7 5 2 Create jobs, sustainable livelihoods and inclusive growth for all Global National
3 7 1 6
6 7 2 1 4 Ensure sustainable energy and develop infrastructure for all Global National
2 8 3 2 3
1 3 1 2 Establish sustainable, healthy and resilient environment for all Global National
3 5 2 3
3 8 8 Establish open, accountable, inclusive and effective institutions, rule of law and a peaceful and inclusive society Global National
5 9 4 5
3 6 6 Establish a global partnership for sustainable development Global National
2 6 6
2 5 1 4 Total Global National
20 45 23 11 11
19 36 10 8 18

52
Key Data Sources
Various data sources could be used to monitor progress on the SDGs in Tanzania. The most relevant
would be the Household Budget Survey, BEST, Population and Housing Census, Integrated Labour
Force Survey, Employment and Earnings Survey and Tanzania Demographic and Health Survey. Data
can also be sourced from the Tanzania Communications Regulatory Authority, FinScope Tanzania
Survey and National Panel Survey. Table 9 provides an overview of the key sources.
Table 9. Key data sources for monitoring the SDGs in Tanzania
Survey Description Year of latest survey
Household Budget Survey
The NBS conducts the Household Budget Survey with the main aim of obtaining information on consumption and expenditure at the household level for poverty mapping and analysis of changes in Tanzanians’ standards of living over a specific period of time. Data are available for 1991–92, 2000–01, 2007 and 2012.
2012
Basic Education Statistics in Tanzania (BEST)
The Ministry of Education and Vocational Training compiles the BEST by using the data of educational institutions. Data are provided at the national and regional levels and cover a period of five years. Data are available on pre-primary, primary and secondary education, adult vocational education and training, higher education, teacher education, school inspections and education finance. Of the 12 global and national education indicators examined, data for 10 can be sourced from BEST. Data are available on an annual basis.
2013
Population and Housing Census
The NBS conducts the Population and Housing Census with the aim of providing vital information on the age structure of the population. Data are important for planning, especially the preparation of social and economic development policies, monitoring of the quality of life and promotion of sustainable development. Data are available for 2002 and 2012 and are collected every 10 years.
2012
Integrated Labour Force Survey
The NBS conducts the Integrated Labour Force Survey with the aim of producing both qualitative and quantitative data on various characteristics of the labour force with a view to support the formulation of the government's training and employment policies. Data are available for 2000–01 and 2005–06.
2005–06
Employment and Earnings Survey
The NBS conducts the Employment and Earnings Survey with the aim of providing comprehensive data on the annual status of employment and earnings as well as the socio-economic characteristics of the labour market. Data are available for 2001, 2002, 2007, 2010–11 and 2012.
2012
Tanzania Demographic and Health Survey
The NBS conducts the Tanzania Demographic and Health Survey as part of the worldwide Demographic and Health Surveys programme that is designed to collect data on fertility, family planning, and maternal and child health. Data are available for 1991–92, 1996, 2004–05, 2010 and 2015.
2015

53
Table 9. Key data sources for monitoring the SDGs in Tanzania
Survey Description Year of latest survey
FinScope Tanzania Survey10
The FinScope Tanzania Survey, which is conducted by FinMark Trust and funded by the Financial Sector Deepening Trust, measures the demand for as well as access and barriers to the full range of financial services offered in Tanzania. The survey provides insights into consumer demand and other aspects with regard to transactions, savings, credit and insurance. Data are available for 2006, 2009 and 2013.
2013
National Panel Survey
Conducted by the NBS, the National Panel Survey collects information on a wide range of topics including agricultural production, non-farm income-generating activities, consumption expenditure and other socio-economic characteristics. Data are available for 2008–09, 2010–11 and 2012–13.
2012–13
Annex 5 summarises the data sources for the goals, targets and indicators examined in this study.
Baseline Data Availability
Given data availability in Tanzania, 2010 is a feasible baseline year. As evident in Table 9, data in all
cases except the Integrated Labour Force Survey are available for recent years. The frequency of data
collection is established in the TSMP. There are other datasets generated by private entities, such as
research institutions and non-governmental organisations, which solicit their own funding to finance data
collection. They are often financed by donors and the types of data collected depend on the focus and
interests of both the entities and donors. With the exception of Afrobarometer surveys, the latest of which
was conducted in 2014, surveys are unpredictable in terms of timing. The irregularity and foci of these
surveys sometimes makes them unreliable.
Disaggregated Data
Leaving no one behind means that everyone must be accounted for no matter where they are.
Information at the lowest levels enables accountability. Issues related to data disaggregation and
coordination were thoroughly discussed during the consultations and participants noted that data
disaggregation is crucial for no one to be left behind. In the datasets of government entities,
disaggregation is currently possible by urban/rural setting, gender, age group and in some cases social
group. Disaggregation by district or even ward is not possible but remains important because of
development disparities across Tanzania linked to colonialism and political influences. The areas where
colonialists had interests have relatively better infrastructure such as roads and education and health
facilities. Thus, a lack of disaggregation results in a misleading picture of the situation on the ground.
Detailed information on specific areas may only be available to those entities that collect data on a
specific area or subject in line with their interests. However, such entities produce data that do not have a
clear trend and sometimes do not use a national master sample, thus making some information
unreliable.
10 It should be noted that this is not an official data source, however it is routinely used by government and development partners.

54
Capacity Building
Capacity building with regard to the production of disaggregated data and analysis of emerging industries,
such as extractive industries, were discussed during the consultations. The need for global data to be
generated from national data was also mentioned. The data revolution should be spearheaded by various
groups, particularly policy-makers, researchers and statisticians. It was noted that the statistical capacities
of both data producers and users are currently low, resulting in the frequent use of external consultants
and delays in the production and dissemination of data. Participants in the consultations therefore
suggested strengthening local capacity for data production and analysis.
Data Quality
Generally, the data collected by government entities are of good quality and useful in monitoring progress
on targets and indicators. However, datasets have limited degrees of disaggregation, making it difficult to
address disparities that exist at sub-national levels and among different social groups. Datasets
generated by private entities may complement those produced by government entities, but most also
cannot be sufficiently disaggregated. In addition, as some private entities do not use a national master
sample or any other robust sampling procedure, such as spatial sampling, it is difficult to compare their
datasets with those produced by government entities. Since disparities exist between one place and
another, datasets cannot be generalised to provide a national picture.
Data Quality Assessment
The data quality assessment was done based on the following five criteria: relevance, accuracy and
reliability, timeliness and punctuality, accessibility and clarity, coherence and comparability (see Annex 6).
Research teams examined the quality of available data for global targets and indicators under each goal
area against the five criteria. Essentially, a basket of survey instruments was examined and an overall
score for each goal area was provided. The scores presented below represent the totals for each criterion
on a scale from 1 to 5. A score of 5 indicates that data for the goal area meet all criteria sub-components,
3 indicates that the data meet more than half of the criteria sub-components, while 1 means that no data
meet the criteria. A 4 denotes a situation where the majority of sub-components are met. A 2 represents
instances when less than half of the sub-components are met.
The research team did not only consider data sources but rather data together with their sources were
assessed and separately given scores according to each criterion. Data from national surveys tend to do
well against the five criteria. National surveys were given scores of 4 due to their level of disaggregation
and reliability. Data from government entities are considered reliable because they are collected using
accepted and standardised frameworks with representative samples. However, no data source was given
a score of 5 because data might have some minor errors due to estimations that might have been done.
Finally, a score of 2 was assigned to data from institutions without national representation and an official
framework. Most of these data, such as those from the National Environment Management Council, were
collected for particular purposes and focused on specific areas.
Table 10 outlines the results of the data quality assessment. Most of the data from government entities
were assigned higher scores in many respects except for timeliness. These data are nationally
representative but limited human and financial resources result in slow data production. For data
produced by unofficial sources, the main problems have been accuracy as well as accessibility and

55
clarity. Unofficial sources score lower on accuracy mainly because they may not have used a national
master sample, resulting in higher sampling errors or smaller sample sizes. They score lower on
accessibility because private entities sometimes have certain embargoes and other restrictions.
Table 10. Results of the data quality assessment
Goal area Relevance Accuracy and reliability
Timeliness and punctuality
Accessibility and clarity
Coherence and comparability
End poverty
4 4 2 4 4
Ensure quality education for all
4 3 2 4 4
Create jobs, sustainable livelihoods and inclusive growth for all
4 4 2 4 4
Ensure sustainable energy and develop infrastructure for all
4 4 2 4 4
Establish a sustainable, healthy and resilient environment for all
4 3 2 4 4
Establish open, accountable, inclusive and effective institutions, rule of law and a peaceful and inclusive society
4 4 2 3 4
Establish a global partnership for sustainable development
4 4 2 4 4
The data quality assessment indicates that more efforts are needed to enable accurate assessment of
progress on the SDGs. SDG monitoring will require high-quality and comprehensive data for all
indicators, the production of which appears to be a challenge in Tanzania. As has been demonstrated,
there is great variation in the quality of data across goal areas. While data for all goal areas are relevant,
they are not timely, which negatively affects all stakeholders’ abilities to carry out informed actions. Many
interventions come too late and thus have little impact. More efforts are needed to improve the timeliness
and punctuality of data for all goal areas. For interventions to have intended outcomes in the areas of
education as well as environment and disaster resilience, which are very important for sustainable
development, data need to be more accurate and reliable – more investment is crucial. Similarly,
investment to improve the accessibility and clarity of governance data should be a priority.

56
Political Economy of the Data Revolution
Background
The Tanzanian government has been implementing structural and institutional reforms in line with new
policy priorities that aim to improve socio-economic development. Consequently, there have been
interventions from ministries, departments, agencies, local authorities and other stakeholders that aim to
improve Tanzanians’ livelihoods. In order to measure the performance and results of such interventions,
quality statistics are required by all stakeholders involved in the development process. New indicators
have emerged to measure performance, the relative importance of indicators has changed and the
methods of collecting data for those indicators have also changed. These changes have been
accompanied by reforms within the NSS. Such reforms and changes are part of the data revolution. This
section covers the development of data availability in Tanzania, the drivers of data gaps and
improvements in data collection as well as the current state of data accessibility.
Current data collection practices follow the TSMP, which provides a comprehensive framework for
strengthening the NSS. The process of developing the TSMP began in 2006. An assessment of the NSS
was conducted in 2007 when 22 ministries, departments and agencies in mainland Tanzania and 15
ministries, departments and agencies in Zanzibar were assessed. This assessment focused on the then
current situation in the NSS including the existence of statistics units, management information systems,
departments, human resources, equipment, software, surveys and products, other data sources,
institutional legal and policy frameworks, and management, dissemination and coordination strategies.
The findings provided inputs that helped finalise the TSMP (see NBS and OCGS 2010). The TSMP is
implemented for five years from 2011–12 to 2015–16 and focuses on five substantive components, plus
an additional component for programme management (see NBS and OCGS 2013). These are:
Institutional development and legal reforms: The NBS and OCGS are reviewing the Statistics Act
and statistical regulations, respectively, as well as strengthening statistical units in ministries,
departments and agencies in order to increase the functionality of the NSS and ensure that the
production of official statistics and public service delivery are effectively coordinated under the
NBS and OCGS.
Human resource development: Skills upgrading, knowledge enhancement and improved
incentives are key to the implementation of the TSMP, specifically the enhanced capacity to
produce quality statistics.
Development of statistical infrastructure: The NSS needs to be supported by adequate statistical
infrastructure based on well-defined concepts, definitions and international standards and
classification schemes. Implementation of the TSMP necessitates updated sampling frames for
household-based surveys, harmonised statistical concepts and definitions in line with
international standards and classification schemes as well as development and effective usage of
spatial data systems.
Data development and dissemination: Several surveys supported by the TSMP are undertaken to
provide key information on public service delivery and basic data needed for macroeconomic
management, preparation of poverty reduction programmes and promotion of private sector
development. Equally important is the production of administrative data within the NSS, which
provides socio-economic data for the monitoring of results and early warning for decision makers

57
at various levels. Key factors in an enabling environment for data development and dissemination
will be strengthened to improve data quality, effectively use statistics and increase access to
information on public service delivery.
Physical infrastructure and equipment development: To attain improved working conditions and
increase the accessibility of information through ICT, physical infrastructure across the NSS must
be improved while equipping the NBS, OCGS, ministries, departments and agencies, and the
Eastern Africa Statistical Training Centre with appropriate ICT infrastructure and software.
Project management: The NBS has established the TSMP Coordination Team to be responsible
for coordination, planning and implementation of TSMP activities. For activities in Zanzibar, the
OCGS has also established a sister TSMP Coordination Team.
Understanding Drivers of Data Gaps and Improvements
Data gaps can result from various factors, such as political and institutional capacity. In recent years,
perception surveys have raised a number of concerns regarding the government’s efforts to address
common issues like corruption and poverty. There is evidently a need for data on why things are not
moving in expected directions.
Political and Legal Barriers
A number of political and legal barriers have led to data gaps in Tanzania. Data are collected depending
on the message that the government needs to convey to the population within the context of the NSGRP.
The government has tended to concentrate on demonstrating the impacts of interventions according to
data11. Consequently, the NBS has concentrated on poverty data, such as the number of people falling
below the poverty line, under-five mortality rates and similar information. While such data help measure
the government’s performance, equally important are perception surveys, which explain citizens’ thoughts
on the way their country is governed. The government’s performance can easily be judged based on
poverty data, but citizens may have expected better performance by the government. Thus, while
conventional statistics may show that the performance of the government has improved, perceptions
surveys may show dissatisfaction with this performance. Politically, the government may have a
preference for conventional statistics over perception surveys, which would constitute a political barrier
that needs to be addressed to resolve the problem of data gaps.
Legal barriers also need to be addressed. The NBS collects and analyses data, but sometimes analysis
in the form of a general report being produced can take more than two years. This is typically the case
with major surveys like the Household Budget Survey, Population and Housing Census and Agriculture
Sample Census Survey. This delay in releasing data may lead to recommendations that are already
outdated at the time the data are available for analysis by research institutions and CSOs. Thus, if the
government maintains that data will only be released after the production of a general report, then
analytical capacity should be strengthened to increase the speed of data analysis and publication.
Otherwise, the government should allow the release of data earlier but ask researchers and analysts to
share their results with the NBS before they are published. Increased capacity for coordination is a
requirement in the Statistics Act. Inadequacy in institutional capacity has led to data gaps for social and
11 Considerations of lower levels of administrative units, gender, and vulnerable groups are often left out with higher levels of aggregation.

58
economic indicators required for monitoring progress on development policies and initiatives outlined in
the Marrakech Action Plan for Statistics of 2004.
Financial and Human Resources
In terms of financial resources, the estimated budget for implementation of TSMP activities over the
period of 2009–10 to 2013–14 was US$64.4 million, which was to be used by both mainland Tanzania
and Zanzibar, with the former expected to use US$55.9 million and the latter US$8.5 million. In addition to
the Tanzanian government’s own budget, the World Bank and development partners such as the
Department for International Development of the United Kingdom contributed to financing this budget with
loans and grants (NBS and OCGS 2010). Annual expenditure is allocated on the basis of plans for
activities in a particular year. The NBS and OCGS coordinate to prepare a detailed Annual Work Plan and
budget for each year. The Annual Work Plan and budget are prepared on the basis of the Medium Term
Expenditure Framework applied by the Tanzanian government (NBS and OCGS 2013). Since the TSMP
is implemented according to the JAST principles, TSMP activities have been aligned with the
government’s priorities.
The funding provided is geared towards supporting core activities, especially training with regard to
mapping activities. Funders also offer support to strengthen economic statistics to enable the NSS to
provide timely and reliable statistics. Funders support the rebasing of national accounts, the consumer
price index, the producer price index and government finance statistics), strengthening geographic
information systems to contribute to census mapping work, and provision of equipment and software
necessary for project preparation. In terms of allocations to different activities, most of the funds were
intended for improving data management and dissemination activities (40.3 percent) and physical
infrastructure and equipment development (26.3 percent). The remaining funds were to be spent on
statistical infrastructure development (15.3 percent), human resource and capacity development (9
percent), project management and coordination activities (6.1 percent) and institutional development (3
percent) (NBS and OCGS 2010).
One of the biggest challenges in the implementation of the TSMP is heavy reliance on donor funds. Out
of the US$64.4 million budgeted, more than US$60 Million was received from donors (see NBS and
OCGS 2010). As mentioned, there is a need to strengthen domestic resource mobilisation and seek other
sources of development finance given the economic crisis in the developed world. Other sources of
funding such as philanthropic organisations and emerging economies should also be explored. In terms
of human resources, available human resources are insufficient in number and capacity to efficiently
undertake data collection and management in both mainland Tanzania and Zanzibar. An assessment at
ministries, departments and agencies showed that staff was inadequate, in terms of both quantity and
quality, to undertake statistical activities (NBS and OCGS 2010). The numbers and qualifications of staff
are by any standard below the requirements to produce the needed data, thus there is a need for capacity
building. Given this context, the NBS could establish steady institutional partnerships with one or several
experienced national statistical offices for continued strengthening of the entire NSS.
Physical Infrastucture
There is also a resource gap in terms of physical infrastructure that is necessary for productive working
environments. Currently, the NBS and OCGS lack the required facilities to accommodate their respective
headquarters staffs, computer centres, conferences, training activities, libraries and stores at single

59
locations. There is also a lack of transport facilities and ICT infrastructure for statistical activities within the
NSS. Transport facilities are required to strengthen the capacities of the NBS, OCGS and ministries,
departments and agencies to carry out data collection and coordinating activities. ICT infrastructure is
necessary for data management and dissemination. Most of the ministries, departments and agencies
indicated that they have a unit for statistics and/or a management information system unit with limited
equipment, such as computers, scanners and photocopiers. Due to inadequate working facilities, data are
processed and stored manually in some cases. Furthermore, most ministries, departments and agencies
indicated the lack of a one-stop centre for capturing data and, in turn, uncoordinated efforts in various
management information system initiatives that have led to data fragmentation and the duplication of
tasks (see NBS and OCGS 2010). Partnerships between institutions with more sophisticated data storage
methods may provide workable solutions to some of the problems resulting from inadequate
infrastructure.
Role of Technology
The importance of technology in data collection and management cannot be overemphasised. Necessary
technologies include modern computers and software that can be used to capture data. Most current
software is good for identifying errors in the process of data entry. The most used software is CSPro,
which is free and has a much more user-friendly interface for data entry than other commonly used
software like SPSS Statistics, which should reduce the likelihood of data entry errors. CSPro shares most
of the features offered by other statistical packages, such as required fields, validation rules and checking
rules. CSPro can also help in the management of the data entry process by capturing the start and end
times for entry of a survey or census questionnaire, giving the manager information about clerks’
efficiency and any cases of misconduct, such as copying records. CSPro files can be easily exported to
other statistical packages.
For capturing data, the most commonly used tools are desktop computers. Data are first recorded
manually in questionnaires and then entered into a computer using a statistical package. A major
challenge with this method is the spoiling of hard copies of questionnaires before data are entered into
computers. Another challenge is that data collection errors are identified long after data are collected,
making it difficult to make corrections, especially because enumerators can rarely return to respondents.
Recently, the NBS started to collect some data using tablets and mobile phones. Under this arrangement,
digitised questionnaires are found on tablets and mobile phones and responses during interviews are
entered directly into them. Once a questionnaire is complete and internet signals are available, data are
received immediately by the NBS. Feedback from the NBS to enumerators can be given as data is
collected rather than after data collection. Data management using technology is expected to improve
over time and SDG implementation will likely benefit from improvements. More sophisticated instruments
and methods for data collection will likely improve the quality of data capture and measurement of
indicators. Collaboration between experienced institutions and local ones is vital to enable the transfer of
technology to improve outcomes.
Data Availability–Transparency–Accountability Nexus
Having necessary data available is one aspect of promoting evidence-based policy formulation,
transparency and accountability. However, available datasets must also be accessible to citizens so that
they can understand progress, stagnation and regression on different indicators and assess them against
agreed targets, given the budget spent. It is only in this way that citizens can hold the government fully
60
accountable. As mentioned, there is a need to improve the timeliness and punctuality of data in Tanzania
for all goal areas. It is crucial to ensure that research institutions, CSOs and other analysts have the legal
mandate and capacity to use data and engage in dialogue with the government and citizens in order to
hold the government to account.
Data collected by the NBS can be accessed through special request after a general report has been
prepared. Given capacity constraints within the NBS, general reports are commonly published two years
from the time data were collected. Data accessibility is a major challenge because analysis by research
institutions and CSOs can only be done after a lag of two years, making some recommendations
outdated. Given that the NBS collects data using taxpayers’ money, data should be released to the public
with a shortened lag. Data accessibility and accountability is part of the international Open Government
Partnership initiative that the Tanzanian government joined in 2011 as part of its efforts to enhance good
governance at all levels.
With regard to data collected by private entities, accessibility depends on the motive behind the collection
of certain data. If data were collected by a research institution for the purpose of research and publication,
then accessing them takes time. Three years is the typical time period after which owners of data share
them with others. The Statistics Act of 2015 indicates that private data collectors are only allowed to
publish their data after they have been approved by the NBS if such data are to be considered official.
While this change aims to formalise private data, some activists consider it to be a deliberate measure to
stop private data collectors from collecting and disseminating data. In any case, releasing data after
having done analysis or gotten approval from the NBS delays the accessing of those data, which has
consequences for development.

61
Conclusion
Discussions on the MDGs and SDGs have increased both the demand for and supply of data for
measuring progress. A lot of data have been and will be collected. Most available datasets, particularly
those generated by the NBS, are disaggregated by gender and urban/rural setting. However, unless data
are meant to address an issue specific to a particular social group, the disaggregation of data has proven
difficult. Also, most datasets cannot be disaggregated by sub-national administrative levels of
government. Notably, different datasets on the same issues have been generated using differing
methodologies, making it difficult to compare the same variables across datasets. Harmonising datasets
from various sources would likely solve the problem of data gaps and enable the comparative analysis of
data collected by different sources. Harmonisation can be achieved by building the capacities of various
data producers.
The NBS and OCGS did not have sufficient capacity to produce the data needed to monitor progress on
MGD implementation. Low capacity may also affect the implementation of the SDGs if existing capacity
gaps are not addressed. Substantially boosting financial and human resources within government entities
as well as other data producers and users should be an overarching priority in Tanzania. Increasing
domestic resource mobilisation is an important step forward, but reliance on external support is inevitable
in the short to medium term. Many donors have been facing economic problems since the global financial
crisis and official development assistance has fallen, hence other approaches, like institutional
partnerships, may help strengthen statistical systems and enable the transfer of technology to improve
outcomes.
The SDGs provide a framework for sustainable development, which now must be applied in Tanzania. It
is important to recognise that countries have different baselines and levels of resources to invest in
achieving goals and targets, so the timing of achievements will most likely differ. The concept of zero or
global minimum standard targets is very much appreciated as it expresses an intention to eradicate
existing problems rather than alleviating them. However, the eradication of certain problems by 2030
seems too ambitious and hardly practical in a developing country such as Tanzania. This is mainly
because achieving the necessary goals and targets requires both financial and human resources, which
are lacking at the moment.
Based on the findings of the Tanzania study, the key challenges in implementing and monitoring the
SDGs are data availability and consistency. Data for targets like those under the goal areas on
environment and governance are scarcely available, not nationally representative and sometimes difficult
to quantify. Notably, most of the available data on governance are from perception surveys. Perceptions
can change within a very short span, making recommendations and the implementation of policies to
improve situations challenging. In addition, the challenge of data consistency for monitoring progress is
obvious. In Tanzania, poverty data are obtained from the Household Budget Survey, which is conducted
at inconsistent intervals, most recently five years and seven years. Between Household Budget Surveys,
the NBS conducts the smaller National Panel Survey. Estimations from this survey, however, may not be
comparable to the data collected by the Household Budget Survey. Discussions on the SDGs need to
consider these challenges and work out solutions for successful implementation.

62
While data for most indicators are available either directly from surveys or through calculations from
existing data sources, there are some indicators for which data availability remains a challenge. For
instance, data are lacking for most of the indicators under the goal areas on environment and
governance. From this perspective, the data revolution has a potential role to play in boosting data
availability, specifically ensuring the necessary frequencies and disaggregation at all levels. The
implication is that the available data only provide a general national picture of Tanzania. Given the size of
the country and its diversity, location-specific data are critical for evidence-based policy-making. In
addition to substantially boosting financial and human resources, using robust sample sizes would enable
better sub-national analysis and improved comparisons according to location and gender. Such changes
would allow for realistic assessment of progress on the SDGs.
63
References
Banerjee, Sudeshna Ghosh, Mikul Bhatia, Gabriela Elizondo
Azuela, Ivan Jaques, Ashok Sarkar, Elisa Portale, Irina
Bushueva, Nicolina Angelou, and Javier GustavoInon. 2013.
Global Tracking Framework. Vol. 3. Sustainable Energy for
All. Washington, DC: World Bank.
Bank of Tanzania. 2012. Annual Report 2010/11. Dar es
Salaam: Bank of Tanzania.
———. 2014. Annual Report 2013/14. Dar es Salaam: Bank
of Tanzania.
Bhattacharya, Debapriya, Kate Higgins, and Shannon
Kindornay. 2014. Methodology and Implementation
Guide.Post-2015 Data Test. Dhaka and Ottawa: Centre
for Policy Dialogue, The North-South Institute, and
Southern Voice on Post-MDG International Development
Goals.
BIP (Biodiversity Indicators Partnership). 2014. “Coverage of
Protected Areas.” Accessed July 10, 2014.
http://www.bipindicators.net/pacoverage.
Demirguc-Kunt, Asli, and Leora Klapper, 2012. “Measuring
Financial Inclusion: The Global Findex Database.” Policy
Research Working Paper 6025. Washington, DC: World
Bank.
ESRF (Economic and Social Research Foundation). 2013.
National Post-MDGs’ Development Agenda
Consultations Report: On CSOs, LGAs and Vulnerable
Groups. Dar es Salaam: ESRF.
FAO (Food and Agriculture Organization of the United
Nations). 2012. “FRA 2015: Terms and Definitions.”
Forest Resources Assessment Working Paper 180, FAO,
Rome.
Ho, Esther Sui-chu. 2013. Student Learning Assessment.
Asia-Pacific Education System Review Series No. 5.
Paris: United Nations Educational, Scientific and Cultural
Organization.
IEA (International Energy Agency). 2014. “Glossary: R.”
Accessed July 10, 2014.
http://www.iea.org/aboutus/glossary/r.
IIRC (International Integrated Reporting Council). 2013. The
International <IR> Framework. London: IIRC.
ILO (International Labour Organization). 2014. “Definitions.”
Accessed July 10, 2014.
http://laborsta.ilo.org/definition_E.html.
Kahyarara, Godius. 2014. “Aid and Environment in Africa: The
Case of Tanzania.” WIDER Working Paper 2014/077,
World Institute for Development Economics Research,
United Nations University, Helsinki.
NBS (National Bureau of Statistics). 2009. Household Budget
Survey 2007 – Tanzania Mainland. Dar es Salaam: NBS.
———. 2013. 2011/12 Household Budget Survey: Key
Findings. Dar es Salaam: NBS.
NBS (National Bureau of Statistics) and OCGS (Office of
Chief Government Statistician). 2010. Tanzania Statistical
Master Plan 2009/10-2013/14. Dar es Salaam: NBS and
OCGS.
———. 2013. Tanzania Statistical Master Plan: Annual Work
Plan FY 2013/2014. Dar es Salaam: NBS and OCGS.
———. 2014. 2012 Population and Housing Census: Basic
Demographic and Socio-Economic Profile; Key Findings.
Dar es Salaam: NBS and OCGS.
OECD (Organisation for Economic Co-operation and
Development). 2009. Forum on Tax Administration:
Compliance Management of Large Business Task Group.
Guidance Note. Paris: OECD.
———. 2011. “Energy Intensity.” In OECD Factbook 2011-
2012: Economic, Environmental and Social Statistics.
Paris: OECD.
Research and Analysis Working Group. 2009. Poverty and
Human Development Report 2009. Dar es Salaam:
Research and Analysis Working Group.
———. 2012. Poverty and Human Development Report 2011.
Dar es Salaam: Research and Analysis Working Group.
RGoZ (Revolutionary Government of Zanzibar). 2002.
Zanzibar Poverty Reduction Plan. Zanzibar City: RGoZ.
———. 2007. Zanzibar Strategy for Growth and the
Reduction of Poverty (ZSGRP). Zanzibar City: RGoZ.
———. 2010. Zanzibar Strategy for Growth and Reduction of
Poverty (ZSGRP II) 2010-2015; MKUZA II. Zanzibar City:
RGoZ.
UN (United Nations). 1993. Declaration on the Elimination of
Violence against Women. A/RES/48/104. New York: UN.
UNESCO (United Nations Educational, Scientific and Cultural
Organization). 2012. International Standard Classification
of Education: ISCED 2011. Montreal: UNESCO Institute
for Statistics.
UNEVOC (International Centre for Technical and Vocational
Education and Training). 2012. “What is TVET?”
Accessed July 10, 2014.
http://www.unevoc.unesco.org/go.php?q=What+is+TVET
.
UNICEF (United Nations Children’s Fund). 2014. “Statistics
by Area: Child Nutrition.” Accessed July 10, 2014.
http://www.childinfo.org/malnutrition.html.
UNISDR (United Nations Office for Disaster Risk Reduction).
2007. “Terminology.” Accessed August 12, 2014.
http://www.unisdr.org/we/inform/terminology.
UNODC (United Nations Office on Drugs and Crime). 2014.
Global Study on Homicide 2013. New York: United
Nations.
UNStats (United Nations Statistics Division). 2014. System of
Environmental-Economic Accounting (SEEA)—Central
Framework. New York: United Nations.
URT (United Republic of Tanzania). 1994. National
Environmental Action Plan. Dar es Salaam: URT.
———. 1997. National Environmental Policy. Dar es Salaam:
URT.
———. 2001. Poverty Monitoring Master Plan. Dar es
Salaam: URT.
———. 2004. Environmental Management Act. Dar es
Salaam: URT.
———. 2005. National Strategy for Growth and Reduction of
Poverty (NSGRP). Dar es Salaam: URT.

64
———. 2010. National Strategy for Growth and Reduction of
Poverty II: NSGRP II. Dar es Salaam: URT.
———. 2011a. Basic Education Statistics in Tanzania
(BEST). Dar es Salaam: URT.
———. 2011b. Country Report on the Millennium
Development Goals 2010. Dar es Salaam: URT.
———. 2011c. The Economic Survey 2010. Dar es Salaam:
URT.
———. 2011d. The Tanzania Five Year Development Plan
2011/12-2015/16: Unleashing Tanzania’s Latent Growth
Potentials. Dar es Salaam: URT.
———. 2013. National Post-MDGs Development Agenda
Consultations: The National Synthesis Report. Dar es
Salaam: URT.
———. 2014. Electricity Supply Industry Reform Strategy and
Roadmap 2014 - 2025. Dar es Salaam: URT.
World Bank. 2005. Connecting East Asia: A New Framework
for Infrastructure. Washington, DC: Asian Development
Bank, World Bank, and Japan Bank for International
Cooperation.
———. 2010. Doing Business in Zanzibar 2010. Washington,
DC. World Bank.
———. 2011. One Goal, Two Paths: Achieving Universal
Access to Modern Energy in East Asia and the Pacific.
Washington, DC: World Bank.
———. 2014a. “Debt Forgiveness or Reduction (Current
US$).” Accessed July 10, 2014.
http://data.worldbank.org/indicator/DT.DFR.DPPG.CD.
———. 2014b. “Gross Fixed Capital Formation (% of GDP).”
Accessed July 10, 2014.
http://data.worldbank.org/indicator/NE.GDI.FTOT.ZS.
———. 2014c. “Poverty Headcount Ratio at $1.25 a Day
(PPP) (% of Population).” Accessed July 29, 2014.
http://data.worldbank.org/indicator/SI.POV.DDAY.
———. 2014d. “Poverty Headcount Ratio at $2 a Day (PPP)
(% of Population).” Accessed July 29, 2014.
http://data.worldbank.org/indicator/SI.POV.2DAY.

65
Annex 1. Goals and Targets Identified during United Nations Consultations on the Post-2015 Agenda in Tanzania
Goal Targets related to…
1 Eradicate extreme poverty, hunger and inequality
reduce poverty reduce hunger ensuring food security and nutrition reduce income inequality
2 Achieve decent and productive employment
overall employment youth employment women’s particular women’s share in total employment
3 Ensure quality service delivery
health education water and sanitation
4 Eliminate gender inequality
equality in education employment gender-based violence female genital mutilation assets ownership
5 Combat diseases malaria HIV/AIDS tuberculosis non-communicable diseases
6 Reduce child and maternal mortality
infant mortality child mortality maternal mortality
7 Promote sustainable development
environmental management environmental impact assessments natural resource management population growth sustainable energy use adaptation to climate change effects
8 Improve governance rule of law and law enforcement anti-corruption freedom of expression participation and inclusiveness social protection
9 Enhancing effective development cooperation
commitment and timely delivery of aid development aid and implementation effectiveness transparency and accountability
10 Promoting peace and security
promoting democracy political accountability, justice and fairness
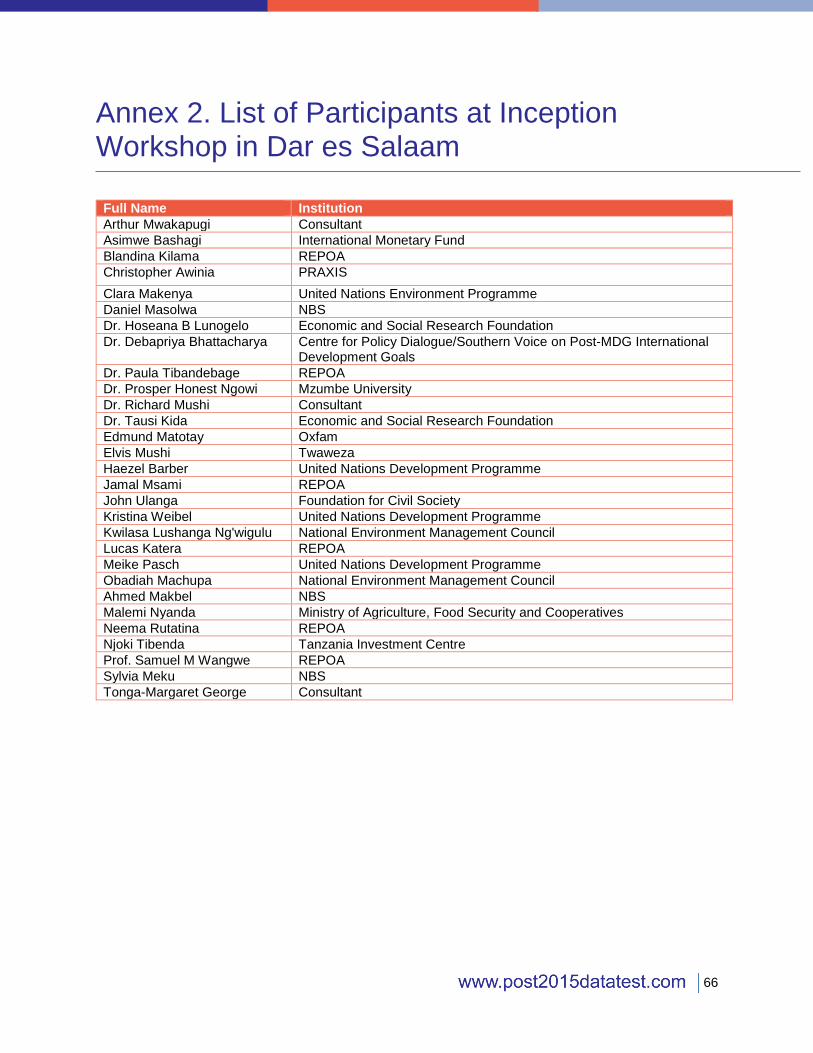
66
Annex 2. List of Participants at Inception Workshop in Dar es Salaam
Full Name Institution
Arthur Mwakapugi Consultant
Asimwe Bashagi International Monetary Fund
Blandina Kilama REPOA
Christopher Awinia PRAXIS
Clara Makenya United Nations Environment Programme
Daniel Masolwa NBS
Dr. Hoseana B Lunogelo Economic and Social Research Foundation
Dr. Debapriya Bhattacharya Centre for Policy Dialogue/Southern Voice on Post-MDG International Development Goals
Dr. Paula Tibandebage REPOA
Dr. Prosper Honest Ngowi Mzumbe University
Dr. Richard Mushi Consultant
Dr. Tausi Kida Economic and Social Research Foundation
Edmund Matotay Oxfam
Elvis Mushi Twaweza
Haezel Barber United Nations Development Programme
Jamal Msami REPOA
John Ulanga Foundation for Civil Society
Kristina Weibel United Nations Development Programme
Kwilasa Lushanga Ng'wigulu National Environment Management Council
Lucas Katera REPOA
Meike Pasch United Nations Development Programme
Obadiah Machupa National Environment Management Council
Ahmed Makbel NBS
Malemi Nyanda Ministry of Agriculture, Food Security and Cooperatives
Neema Rutatina REPOA
Njoki Tibenda Tanzania Investment Centre
Prof. Samuel M Wangwe REPOA
Sylvia Meku NBS
Tonga-Margaret George Consultant

67
Annex 3. List of Key Informant Interviewees
Name Institution
Rose Mtui Sallema National Environment Management Council
Ahmed Makbel NBS
Daniel Masolwa NBS
Dennis Rweyemamu UONGOZI Institute
Dr. H.B.L. Lunogelo Economic and Social Research Foundation
Patrick Orendorz Planning Commission
Asimwe Bashagi International Monetary Fund
Dr. Prosper Honest Ngowi Mzumbe University
Sylvia Meku NBS
Arnold Mapinduzi National Environment Management Council
Richard Martini United Nations Population Fund
Dr. Richard Mushi Consultant
Eliya Mtweve Ministry of Industry and Trade
Njoki Tibenda Tanzania Investment Centre
Kwilasa Lushanga Ng'wigulu National Environment Management Council
Christopher Awinia PRAXIS
Malemi Nyanda Ministry of Agriculture, Food Security and Cooperatives
John Ulanga Foundation for Civil Society
Memba Abbasy NBS
Collins Opiyo United Nations Population Fund
Elvis Mushi Twaweza
Elineema Kisanga University of Dar es Salaam
Clarra Makenya United Nations Development Programme
James Mbongo NBS
Dr. Tausi Kida Economic and Social Research Foundation
Richard Ngilangwa Economic and Social Research Foundation

68
Annex 4. Targets and Indicators Examined for Tanzania
Table 4.1 End poverty: Targets and indicators
Targets Indicators Definition/Note
Global
End extreme income poverty
Proportion of population below US$1.25 (PPP) per day
Refers to the percentage of the population living on less than US$1.25 at 2005 prices (World Bank 2014c).
Reduce poverty Proportion of population below US$2 (PPP) per day
Refers to the percentage of the population living on less than US$2 at 2005 prices (World Bank 2014d).
Proportion of population living below national poverty line
Refers to the number of individuals living below the nationally-defined poverty line as a proportion of the total population. The national poverty line is the threshold of the necessary calorific requirement.
Share of employed persons living below the nationally-defined poverty line
The working poor or the number of employed persons living in households with incomes below the nationally-defined poverty line are based on real disposable income and refer to a nationally-defined real absolute poverty line, whenever possible. Data are presented in terms of the yearly annual average. Here, the income concept refers to the household disposable income. If a relative poverty line is used, data are expressed as the number of employed persons living in households with incomes below the nationally defined relative poverty line. The poverty line is defined as the threshold below which individuals in the population are considered poor and above which they are considered non-poor. The threshold is generally defined as the per-capita monetary requirements an individual needs to afford the purchase of a basic bundle of goods and services (ILO 2014).
Reduce the proportion of people who suffer from hunger
Prevalence of child stunting in boys and girls under 5, %
Stunting: Proportion of under-fives falling below minus 2 standard deviations (moderate and severe) and minus 3 standard deviations (severe) from the median height-for-age of the reference population (UNICEF 2014).
National
Reduce income inequality gap by x%
Ratio of income/ consumption of top 20% to bottom 20%
Gini coefficient (Household Budget Survey, 2001 and 2009).
Reduce the proportion of people who
Proportion of population below minimum level of dietary energy consumption
Percentage of population whose food consumption do not meet the required dietary energy.

69
suffer from hunger
Food self-sufficiency ratio Refers to the ratio of production as a percentage of requirement (Research and Analysis Working Group 2009; 2012).
Proportion of households that take no more than one meal per day
Percentage of households living on only one meal in a day (Tanzania Demographic and Health Survey, Household Budget Survey, 2001 and 2009).
Proportion of districts reported to have food shortages
Refers to the ration of districts suffering food shortages to total number of districts (Research and Analysis Working Group 2009; 2012).
Reduce multidimensional poverty
Multidimensional Poverty Index Refers to the overlapping deprivations suffered by people at the same time.
Table 4.2 Ensure quality education for all: Targets and indicators
Targets Indicators Definition/Note
Global
Ensure all children have access to early childhood and quality primary and secondary education
% of girls and boys receiving at least one year in pre-primary programmes
Refers to the proportion of children (girls and boys) who have at least one year of pre-primary programmes.
% of girls and boys who complete primary school
Refers to proportion of girls and boys who complete primary school.
% of girls and boys who complete secondary school
Refers to proportion of girls and boys who complete secondary school.
% of girls and boys who achieve a passing grade in national learning assessments at the primary school level
Assessment of learning outcomes: Evaluation of an individual’s achievement of learning objectives, using a variety of assessment methods (written, oral and practical tests/examinations, projects and portfolios) during or at the end of an education programme (UNESCO 2012). National (or sub-national) assessment: Large-scale assessment surveys designed to describe the achievement of students in a curriculum area and to provide an estimate of the achievement level in the education system as a whole at a particular age or grade level. This normally involves administration of tests either to a sample or population of students (Ho 2013).
Increase the number of adults with skills, including technical and vocational skills
Proportion of individuals enrolled in a Technical and Vocational Education and Training institution
Technical and Vocational Education and Training is concerned with the acquisition of knowledge and skills for the world of work. Various terms have been used to describe elements of the field that are now conceived as comprising Technical and Vocational Education and Training. These include: Apprenticeship Training, Vocational Education, Technical Education, Technical-Vocational Education, Occupational Education, Vocational Education and Training, Professional and Vocational Education, Career and Technical Education, Workforce Education, Workplace Education, etc. Several of these terms are commonly used in specific geographic areas (UNEVOC 2012).

70
National
Expansion of higher education, Technical and Vocational Education
Pupil-teacher ratios in secondary schools, Technical and Vocational Education and Training institutions
Refers to average number of pupils per one teacher.
Percentage of qualified teachers in secondary schools, Technical and Vocational Education and Training institutions
Refers to number of qualified teachers as a percentage of all teachers at a specified level.
Access to quality primary and secondary education
Pupil-to-textbook ratio Refers to number of pupils per one textbook.
Ensure the continuity, socio-economic equality and gender parity of enrolled students
Transition rate from Standard 7 to Form 1
Refers to percentage of pupils who continue to Form 1 after completing Standard 7.
Improved access to education for children with disabilities
Refers to percentage of children with disabilities who attend schools.
Ensure universal access to resources and basic infrastructure services for education
Percentage of students with improved pass rates in a given year compared to previous years
Refers to percentage of pupils passing national examinations in a given year compared to the previous year.
Public expenditure on education, %
Refers to allocation to the education sector as a percentage of total government budget.
Table 4.3 Create jobs, sustainable livelihoods and inclusive growth for all: Targets and indicators
Targets Indicators Definition/Note
Global
Achieve full and productive employment work for all, including women and young people
Labour force participation rate The labour force participation rate is the labour force as a percent of the working age population (ILO 2014).
Time-related underemployment (thousands)
Persons in time-related underemployment comprise all persons in employment, who satisfy the following three criteria during the reference period: (i) are willing to work additional hours; (ii) are available to work additional hours (i.e., are ready, within a specified subsequent period, to work additional hours, given opportunities for additional work); and (iii) worked less than a threshold relating to working time (i.e., persons whose hours actually worked in all jobs during the reference period were below a threshold, to be

71
chosen according to national circumstances). For details, refer to the Resolution concerning the measurement of underemployment and inadequate employment situations (ILO 2014).
Ensure equal pay for equal work
Mean nominal monthly earnings of employees (local currency)
Data on earnings are presented, whenever possible, in nominal terms and on the basis of the mean of monthly earnings of all employees. The earnings of employees relate to the gross remuneration in cash and in kind paid to employees, as a rule at regular intervals, for time worked or work done together with remuneration for time not worked, such as annual vacation, other type of paid leave or holidays. Earnings exclude employers’ contributions in respect of their employees paid to social security and pension schemes and also the benefits received by employees under these schemes. Earnings also exclude severance and termination pay. Statistics of earnings relate to the gross remuneration of employees, (i.e., the total before any deductions are made by the employer). Data are disaggregated by economic activity according to the latest version of the International Standard Industrial Classification of All Economic Activities available for that year. Economic activity refers to the main activity of the establishment in which a person worked during the reference period and does not depend on the specific duties or functions of the person’s job, but on the characteristics of the economic unit in which this person works.
Support inclusive growth and reduce inequality
Gini coefficient Refers to the ratio of the income share of the top 10% to the bottom 40%.
Palma ratio The Gini coefficient is a number between zero and one that measures the relative degree of inequality in the distribution of income. The coefficient would register zero (minimum inequality) for a population in which each family (or unattached individual) received exactly the same income and it would register a coefficient of one (maximum inequality) if one family (or unattached individual) received all the income and the rest received none.
Growth rate of income of the bottom 40%
After-tax income quintiles are used to measure the growth rate of the bottom 40 percent for all family units. All the persons of the population are ranked from lowest to highest by the value of their adjusted family after-tax income. Then, the ranked population is divided into five groups of equal numbers of units, called quintiles. The lowest income quintile represents the 20 percent of the population whose income is lowest. By the same token, the highest quintile represents the 20 percent of the population whose income is highest. After-tax income is total income less income tax.
Gross fixed capital formation (% of GDP)
Gross fixed capital formation (formerly gross domestic fixed investment) includes land improvements (fences, ditches, drains, and so on); plant, machinery, and equipment purchases; and the construction of roads, railways, and the like, including schools, offices, hospitals, private residential dwellings, and commercial and industrial buildings (World Bank 2014b).
Growth rate of average per capita income / consumption in 2005 US$ (PPP) (lowest and top quintiles, total)

72
National
Ensure equal pay for equal work
Existence of national legislation that guarantees equal pay for equal work
Would serve as a binary indicator (yes/no) as to whether legislation exists.
Improve productivity by x%
Productive employment as % of total employment
Refers to the ratio of productive employment to total employment.
Ensure universal access to social protection
% of population receiving cash for work
Refers to the number of people receiving cash for work as a percentage of eligible population for cash for work.
% of population coved by health insurance
Refers to the number of people with health insurance as a proportion of total population.
Full, productive and decent employment
% of the eligible population receiving cash transfers
Refers to the number of eligible people receiving cash transfers as a proportion of total population eligible for cash transfers.
Cross-Cutting: Ensure sustainable energy and develop infrastructure for all
Improve growth and employment outcomes by ensuring universal access to financial services and basic infrastructure
% of population with access to financial services and basic infrastructure (transportation, ICT, water and sanitation, etc.)
Refers to the number of people with access to financial services as a proportion of total population.
Cross-Cutting: Establish open, accountable, inclusive and effective institutions, rule of law and a peaceful and inclusive society
Eliminate child labour
% decrease of child labour at the labour market
Refers to the number of children drawn out of child labour as a proportion of those working.
Table 4.4 Ensure sustainable energy and develop infrastructure for all: Targets and indicators
Targets Indicators Definition/Note
Global
Ensure full access to developed infrastructure and communication technology
Average bandwidth speed (megabits/second)
This indicator measures the number of people who use the internet for every 1,000 people.
Internet users (per 1,000 people)
Measurement of the ability of an electronic communications device or system (such as a computer network) to send and receive information, measured in megabits per second (mbit/s).
% of the population with access to an all-season road
“With access” means that the distance from a village or household to an all-season road is no more than 2 kilometres; otherwise, a walk of no more than 20 minutes or so is required

73
to reach an all-season road. An “all-season road” is a road that is motorable by the prevailing means of rural transport (often a pick-up or a truck that does not have four-wheel-drive) all year round. Predictable interruptions of short duration during inclement weather (e.g., heavy rainfall) are permitted, particularly on low volume roads (World Bank 2005).
% of adults with an account at a formal financial institution
Denotes the percentage of population with an account (self or together with someone else) at a bank, credit union, another financial institution (e.g. cooperative, microfinance institution), or the post office (if applicable) (modified slightly from World Bank Global Index Glossary).
Ensure access to energy and improve efficiency and sustainability of energy supply, including renewable energy
# of hours per day households have access to electricity on average
This indicator measures the number of hours for which electricity is available in a household within a given day.
Rate of improvement in energy intensity
Energy required per unit (currency) of GDP, measured in primary energy terms and GDP. Primary energy refers to energy sources as found in their natural state (as opposed to derived or secondary energy, which is the result of the transformation of primary or secondary sources) (OECD 2011).
Share of the population with access to modern cooking solutions (%)
Access to modern cooking solutions is defined as relying primarily on non-solid fuels for cooking. Non-solid fuels include: (i) liquid fuels (for example, kerosene, ethanol, or other biofuels); (ii) gaseous fuels (such as natural gas, liquefied petroleum gas, and biogas); and (iii) electricity. Solid fuels include: (i) traditional biomass (for example, wood, charcoal, agricultural residues, and dung); (ii) processed biomass (such as pellets, and briquettes); and (iii) other solid fuels (such as coal and lignite) (World Bank 2011b; Banerjee et al. 2013).
Share of renewable energy to total energy consumption
Energy that is derived from natural processes (e.g., sunlight and wind) that are replenished at a higher rate than they are consumed. Solar, wind, geothermal, hydro and biomass are common sources of renewable energy (IEA 2014).
National
Universal access to modern energy services by 2030
% change in particulate concentration in urban air
Ensuring sustainable energy
% change in clean energy consumption across sectors
Refers to the rate of using an alternative source of energy to wood fuel (including charcoal) as the main source of energy for cooking.
Final consumption of different types of renewable energy
Refers to the rate of using renewable energy.
% of national expenditure used to produce renewable resources
Refers to renewable energy expenditure as a percentage of total energy expenditure.

74
Table 4.5 Establish a sustainable, healthy and resilient environment for all: Targets and indicators
Targets Indicators Definition/Note
Global
Build resilience and reduce deaths from natural hazards
Disaster deaths per 1,000 inhabitants
Hazard: A dangerous phenomenon, substance, human activity or condition that may cause loss of life, injury or other health impacts, property damage, loss of livelihoods and services, social and economic disruption, or environmental damage. Includes: Avalanche, Cold Wave, Cyclone, Drought, Earthquake, Epidemic and Pandemic; Flood, Heat Wave, Insect Infestation; Landslide; NBC – Nuclear, Biological, Chemical; Storm Surge; Tornado; Tsunami; Volcano; Wildfire (UNISDR 2007). Disaster: A serious disruption of the functioning of a community or a society involving widespread human, material, economic or environmental losses and impacts, which exceeds the ability of the affected community or society to cope using its own resources (UNISDR 2007).
Safeguard ecosystems and biodiversity
Net loss in forest area (% of land area)
Forest: Land spanning more than 0.5 hectares with trees higher than 5 meters and a canopy cover of more than 10 percent, or trees able to reach these thresholds in situ. It does not include land that is predominantly under agricultural or urban land use (FAO 2012).
Trends in coverage of protected areas.
The protected area coverage indicator measures the policy response to biodiversity loss. An increase in protected area coverage indicates increased efforts by governments and civil society to protect land and sea areas with a view to achieve the long-term conservation of biodiversity with associated ecosystem services and cultural values (BIP 2014). Note: The data provided shows how protected areas are managed based on IUCN category and includes marine areas.
Publish and use economic, social and environmental accounts in all governments and companies
Share of large tax unit taxpayers using integrated reporting
Integrated reporting is a process founded on integrated thinking that results in a periodic integrated report by an organisation about value creation over time and related communications regarding aspects of value creation. An integrated report is a concise communication about how an organisation’s strategy, governance, performance and prospects, in the context of its external environment, lead to the creation of value in the short, medium and long term (IIRC 2013). Large taxpayers are very different from other categories of taxpayers and present certain significant risks to effective tax administration. Major characteristics of large business segment include: concentration of revenues, complexity of the business and tax dealing, withhold agent or intermediary role, uses of professional tax advisors and possession of in-house tax organisation. Businesses may be publicly listed corporations, multinational companies or private groups (OECD 2009).
Existence of government publishing according to the System of Environmental-Economic Accounting
The System of Environmental-Economic Accounting contains the internationally agreed standard concepts, definitions, classifications, accounting rules and tables for producing internationally comparable statistics on the environment and its relationship with the economy. Its framework follows a similar accounting structure as the System of National Accounts and uses concepts, definitions and classifications consistent with the System of

75
National Accounts in order to facilitate the integration of environmental and economic statistics (UNStats 2014).
National
Publish and use economic, social and environmental accounts in all governments and large companies
Proportion of government entities and large companies (capitalisation above US$100 million equivalent) publishing economic, social and environmental accounts
Refers to the number of government entities complying to these as a proportion of all government entities.
Existence of regulations that require government entities and large companies (capitalisation above US$100 million equivalent) to publish economic, social and environment accounts
Refers to the number of companies complying to these as a proportion of all companies with the threshold of above US$100 million equivalent.
Number of operational national programmes or action plans incorporating sustainable production and consumption
The assumption is that the existence of regulations increases compliance.
Mainstream environmental sustainability in government policies, strategies, budgets and plans
Enterprises undertaking environmental assessment and complying with standards
The assumption is that the existence of regulations increases compliance.
Certified experts by environmental thematic area for practicing environmental assessments
This indicator is for environmental experts, grouped by environmental thematic area, applied, registered and certified by the registration entity for practicing environmental impact assessments and or environmental audits in the country. To obtain the number requires data for application, registration and certification for environmental assessment expertness by issuance of environmental expert certificates.
Safeguard ecosystems, species and genetic diversity
Percentage of native plant and animal species endangered versus secured
Refers to the proportion of endangered native plants and animal species versus those that are secured.
Mountain ecosystems and biodiversity secured
This indicator assesses the status of mountain ecosystems and biodiversity in the country. Local government authorities are trained on the use of environmental management tools and the Millennium Ecosystem Assessment framework for effective environmental management.
Marine ecosystems and biodiversity secured
This indicator assesses the status of coastal and marine biodiversity (corals, mangroves, seagrasses, etc.) in the country. It also provides information on national and regional development projects that have environmental impact assessment certificates and/or Environmental Audit certificates. Geographic information systems and remote sensing data

76
from the Marine Highway Project and other private companies, such as Samaki Consultants, can be used.
Table 4.6 Establish open, accountable, inclusive and effective institutions, rule of law and a peaceful and inclusive society: Targets and indicators
Targets Indicators Definition/Note
Global
Provide free and universal legal identity, such as birth registrations
Percentage of children under 5 who are registered with the civil authority
Refers to the number of children under five registered with the civil authority as a percentage of the total population of children under five.
Proportion of adults with a basic legal identity document
Refers to the number of adults (individuals over 18 years of age) with a basic legal identity document as a percentage of the total adult population.
Monitor and end discrimination and inequalities in public service delivery, the rule of law, access to justice and participation in political and economic life on the basis of social status
Average time between filing a case and receiving a verdict
Refers to the average number of days that elapse from the time of filing a case and receiving a verdict.
Proportion of seats held by women and minorities in national or local level government
Refers to women and minorities in parliaments as the percentage of parliamentary seats held by women/minorities.
% of adults with an account at a formal financial institution, disaggregated by sex
Denotes the percentage of population with an account (self or together with someone else) at a bank, credit union, another financial institution (e.g. cooperative, microfinance institution), or the post office (if applicable) including individuals who have a debit card (Demirguc-Kunt and Klapper 2012). Note: This is the same indicator as used under energy and infrastructure, disaggregated by sex.
Improve personal safety
Prevalence of violence against women, including domestic violence
Violence against women is “any act of gender-based violence that results in, or is likely to result in, physical, sexual or mental harm or suffering to women, including threats of such acts, coercion or arbitrary deprivation of liberty, whether occurring in public or in private life” (UN 1993). Would likely be based on self-reporting (survey data).
Violent death per 100,000 people
Classification of violent death includes killings in war or conflicts, non-conflict deaths and self-inflicted deaths (suicides), while non-conflict deaths include intentional homicide, killings in self-defence, killings in legal interventions and non-intentional homicide (UNODC 2014).
Reduce bribery and corruption in all forms
Survey data regarding bribes or gifts for service from government official - “In the past year, how often (if ever) have you had to pay a bribe, give a gift, or do a favour to government officials in order to
Refers to the proportion of people who have paid a bribe in the past year at time of being surveyed.

77
get a document or receive a service”
Improve transparency in the revenue system
Share of eligible tax payers who submit tax returns
Refers to the proportion of eligible taxpayers who submit their taxes for a given tax year as a percentage of eligible taxpayers.
National
Respect human rights
% of people belonging to social groups
Social groups are meant to help people increase their bargaining power in line with their interests. Having increasingly more people joining together on common issues increases government accountability because a social group faces the government as a group, which has more bargaining power than an individual. Data on social groups are captured by perception surveys.
% of people who can freely discuss their views
Citizens may have different opinions on the same things and they should be free to voice their views in public without fearing repercussions. Relevant data are captured by perception surveys.
% of people who are free to join a political party
In a multi-party political system like that in Tanzania, people should feel free to join any political party. Joining a particular party should not be associated with the denial of public services from the government in power. Relevant data are captured by perception surveys.
Respect rule of law and improve access to justice
% of court cases outstanding for two or more years
Refers to the number of court cases that are not settled within two years as a percentage of all court cases lodged within the same period.
Number of available attorneys/accessibility to attorneys
Refers to the number of legal advisors per person.
Provide free and universal legal identity
Percentage of newborns registered at birth
Refers to the number of new-borns registered with Registration Insolvency and Trusteeship Agency (RITA) within 90days of birth as a percentage of the total births.
Table 4.7 Establish a global partnership for sustainable development: Targets and indicators
Targets Indicators Definition/Note
Global
Create an enabling environment for sustainable development
Low-income country debt forgiveness or reduction (% of GDP)
Debt forgiveness or reduction shows the change in debt stock due to debt forgiveness. It is derived by subtracting debt forgiven and debt stock reduction from debt buyback (World Bank 2014a).
Share of trade in goods and services from low-income countries under duty-free, quota-free market access
This indicator tracks the proportion of goods and services from low-income countries that enter Tanzania under preferential market access.
Existence of laws for ensuring country-by-country reporting by
This indicator is meant to provide an indication of countries’ efforts to address tax evasion and prevent money laundering.

78
multinational corporations, disclosure of beneficial ownership and the prevention of money laundering
Increase financing to productive capacity in low and middle-income countries
Share of aid to the productive sector
Aid is defined as official development assistance and other official flows. Productive sector is defined as infrastructure, agriculture, and manufacturing.
Proportion of foreign direct investment to the productive sector
Productive sector is defined as infrastructure, agriculture, manufacturing.
Share of south-south cooperation to the productive sector
Productive sector is defined as infrastructure, agriculture, manufacturing.
National
Implement reforms to ensure stability and transparency of the international financial system
Share of non-performing loans in banking system’s total loan portfolio
Refers to non-performing loans as a percentage of all loans.
Implementation of Basel International Banking Standards
The Basel International Banking Standards are a comprehensive set of reform measures developed by the Basel Committee on Banking Supervision to strengthen the regulation, supervision and risk management of the banking sector. These measures aim to improve the banking sector’s ability to absorb shocks arising from financial and economic stress (whatever the source), improve risk management and governance, and strengthen banks’ transparency and disclosures.
Existence of banking transparency legislation to combat illicit financial flows
This indicator tracks whether a country is making sure that only legal financial flows are in its banking system.
Proportion of total country imports (by value and excluding arms) from developing countries and least developed countries
Refers to the extent to which developing countries are trading among themselves (i.e., how much the developing countries use goods and services produced from countries with the same or similar levels of development).
Contribute further to an open, rule-based, predictable, non-discriminatory trading and investment system
Share of exports and imports to GDP
Refers to the extent to which the country is able to finance its imports with export earnings.

79
Annex 5. Targets and Indicators and Data Sources
Table 5.1 End poverty: Targets, indicators and data sources
Targets Indicators Data source(s) Year Frequency
Global
End extreme income poverty Reduce poverty
Proportion of population below US$1.25 (PPP) per day
Household Budget Survey 2001–02, 2007, 2012
5 years
Reduce the proportion of people who suffer from hunger
Proportion of population below US$2 (PPP) per day
Household Budget Survey 2001–02, 2007, 2012
5 years
Proportion of population living below national poverty line
Household Budget Survey 2001–02, 2007, 2012
5 years
Share of employed persons living below the nationally-defined poverty line
Household Budget Survey 2001–02, 2007, 2012
5 years
End extreme income poverty
Prevalence of child stunting in boys and girls under 5, %
Tanzania Demographic and Health Survey
1991–92, 1996, 1999, 2004–05
Selected years
National
Reduce income inequality gap by x%
Ratio of income/consumption of top 20% to bottom 20%
Household Budget Survey 2001–02, 2007, 2012
5 years
Reduce hunger
Proportion of population below minimum level of dietary energy consumption
Tanzania Demographic and Health Survey
1991–92, 1996, 1999, 2004–05
Selected years
Food self-sufficiency ratio n/a
Proportion of households that take no more than one meal per day
n/a
Proportion of districts reported to have food shortages
n/a
Table 5.2 Ensuring quality education for all: Targets, Indicators and data sources
Targets Indicators Data source(s) Year Frequency
Global
Ensure all children have access to early childhood and quality primary and secondary education
% of girls and boys receiving at least one year in pre-primary programmes
BEST 2004–12 Annual
% of girls and boys who complete primary school BEST/Population and Housing Census
1967–2012 Decade
% of girls and boys who complete secondary school
BEST/Population and Housing Census
1967–2012 Decade

80
% of girls and boys who achieve a passing grade in national learning assessments at the primary school level
BEST 2004–12 Annual
Increase the number of adults with skills, including technical and vocational skills
Proportion of individuals enrolled in a Technical and Vocational Education and Training institution
BEST 2004–12 Annual
National
Expansion of higher education, Technical and Vocational Education and Training
Pupil-teacher ratios in secondary schools, Technical and Vocational Education and Training institutions
BEST 2004–12 Annual
Percentage of qualified teachers in secondary schools, Technical and Vocational Education and Training institutions
BEST 2004–12 Annual
Access to quality primary and secondary education
Pupil-to-textbook ratio n/a
Ensure the continuity, socio-economic equality and gender parity of enrolled students
Transition rate from Standard 7 to Form 1 BEST 2004–12 Annual
Improved access to education for children with disabilities
BEST 2004–12 Annual
Ensure universal access to resources and basic infrastructure services for education
Percentage of students with improved pass rates in a given year compared to previous years
Tanzania Demographic and Health Survey
1991–92, 1996, 1999, 2004–05
Selected years
Household Budget Survey 2001–02, 2007, 2012
5 years
Public expenditure on education, % Basic Education Statistics Tanzania
2004–12 Annual
Table 5.3 Create jobs, sustainable livelihoods and inclusive growth for all: Targets, indicators and data sources
Targets Indicators Data source(s) Year Frequency
Global
Achieve full and productive employment work for all, including women and young people
Labour force participation rate National Panel Survey 2008–09, 2010–11, 2012–13
Two years
Integrated Labour Force Survey
1990–2013 Occasional
Time-related underemployment (thousands) Tanzania Employment and Earnings Survey (TEES)
1981–2013 Annual

81
Ensure equal pay for equal work
Mean nominal monthly earnings of employees (local currency)
Tanzania Demographic and Health Survey, Integrated Labour Force Survey, TEES
See elsewhere See elsewhere
Support inclusive growth and reduce inequality
Gini coefficient Household Budget Survey 2001–02, 2007, 2012
5 years
Palma ratio Household Budget Survey 2001–02, 2007, 2012
5 years
Growth rate of income of the bottom 40% Household Budget Survey 2001–02, 2007, 2012
5 years
Gross fixed capital formation (% of GDP) National accounts 1976–2013 Annual
Growth rate of average per capita income / consumption in 2005 US$ (PPP) (lowest and top quintiles, total)
National accounts 1976–2013 Annual
National
Ensure equal pay for equal work
Existence of national legislation that guarantees equal pay for equal work
Parliament of Tanzania On spot On spot
Improve productivity by x%
Productive employment as % of total employment TEES 1981–2013 Annual
Ensure universal access to social protection
% of population receiving cash for work n/a
% of population coved by health insurance Tanzania Demographic and Health Survey, Integrated Labour Force Survey, TEES
See elsewhere See elsewhere
Full, productive and decent employment
Percentage of the eligible population receiving cash transfers
Tanzania Demographic and Health Survey
1991–92, 1996, 1999, 2004–05
Selected years
Cross-Cutting
Eliminate child labour % decrease of child labour at the labour market National Panel Survey, Integrated Labour Force Survey
See elsewhere See elsewhere
Improve growth and employment outcomes by ensuring universal access to financial services and basic infrastructure
% of population with access to financial services and basic infrastructure (transportation, ICT, water and sanitation, etc.)
Household Budget Survey 2001–02, 2007, 2012
5 years
FinScope Tanzania Survey 2006–13 3 year

82
Table 5.4 Ensure sustainable energy and developed infrastructure for all: Targets, indicators and data sources
Targets Indicators Data source(s) Year Frequency
Global
Ensure full access to developed infrastructure and communication technology
Average bandwidth speed (Megabits/second) Tanzania Communications Regulatory Authority
1996–2013 Annual
Internet users (per 1000 people Tanzania Communications Regulatory Authority
1996–2013 Annual
% of the population with access to an all-season road
Household Budget Survey
2001–02, 2007, 2012
5 years
% of adults with an account at a formal financial institution
FinScope Tanzania Survey
2006–13 3 year
Ensure access to energy and improve efficiency and sustainability of energy supply, including renewable energy
# of hours per day households have access to electricity on average
Household Budget Survey
2001–02, 2007, 2012
5 years
Rate of improvement in energy intensity n/a
Share of the population with access to modern cooking solutions (%)
Household Budget Survey
2001–02, 2007, 2012
5 years
Share of renewable energy to total energy consumption
n/a
Universal access to modern energy services by 2030
Share of the population with access to reliable electricity (%)
n/a
Share of the population with access to modern cooking solutions (%)
Household Budget Survey
2001–02, 2007, 2012
5 years
% change in particulate concentration in urban air n/a
National
Ensuring sustainable energy
% change in clean energy consumption across sectors
n/a
Final consumption of different types of renewable energy
n/a
% of national expenditure used to produce renewable resources
Ministry of Energy and Minerals (budget)
Annual

83
Table 5.5 Establish a sustainable, healthy and resilient environment for all: Targets, indicators and data sources
Targets Indicators Data source(s) Year Frequency
Global
Build resilience and reduce deaths from natural hazards
Disaster deaths per 1,000 inhabitants n/a
Safeguard ecosystems and biodiversity
Net loss in forest area (% of land area) n/a
Trends in coverage of protected areas n/a
Publish and use economic, social and environmental accounts in all governments and companies
Share of large tax unit (LTU) taxpayers using integrated reporting
n/a
Existence of government publishing according to the System of Environmental-Economic Accounting
n/a
National
Publish and use economic, social and environmental accounts in all governments and large companies
Number of operational national programmes or action plans incorporating sustainable production and consumption
n/a
Proportion of large companies (capitalisation above US$100 million equivalent) publishing economic, social and environmental accounts
n/a
Existence of regulations that require large companies (capitalisation above US$100 million equivalent) to publish economic, social and environment accounts
n/a
Mainstream environmental sustainability in government policies, strategies, budgets and plans
Number of operational national programmes or action plans incorporating sustainable production and consumption
n/a
Enterprises undertaking environmental assessments and complying with standards.
n/a
Certified experts by environmental thematic area for practicing environmental assessments
n/a
Safeguard ecosystems, species and genetic diversity
Percentage of native plant and animal species endangered versus secured
n/a
Mountain ecosystems and biodiversity secured n/a
Marine ecosystems and biodiversity secured n/a

84
Table 5.6 Establish open, accountable, inclusive and effect institutions and rule of law and peaceful and inclusive society: Targets, Indicators and sources of data
Targets Indicators Data source(s) Year Frequency
Global
Provide free and universal legal identity, such as birth registrations
Percentage of children under 5 who are registered with the civil authority
Population and Housing Census
1967–2012 Decade
National Panel Survey 2008–09, 2010–11, 2012–13
Two years
Number of individuals with a basic legal identity document
National Electoral Commission, Ministry of Home Affairs
On spot On spot
Monitor and end discrimination and inequalities in public service delivery, the rule of law, access to justice and participation in political and economic life on the basis of social status
Average time between filing a case and receiving a verdict
n/a
Proportion of seats held by women and minorities in national or local level government
Parliament of Tanzania 2010 5 years
% of adults with an account at a formal financial institution, disaggregated by sex
Finscope Tanzania Survey 2006–13 3 years
Improve personal safety
Prevalence of violence against women, including domestic violence
Dawati wa Jinsia On spot On spot
Violent death per 100,000 people Tanzania Police Force, NBS On spot On spot
Reduce bribery and corruption in all forms
Proportion of people who had to pay a bribe in a reference period
Afrobarometer (unofficial) 2001–10 2 years
Improve transparency in the revenue system
Share of eligible tax payers who submit tax returns Tanzania Revenue Authority On spot On spot
Share of large tax unit taxpayers using integrated reporting
Tanzania Revenue Authority On spot On spot
National
Respect human rights
% of people belonging to social groups Afrobarometer 2001–10 2 years
% of people who can air their views freely Afrobarometer 2001–10 2 years
% of people free to join political party Afrobarometer 2001–10 2 years
Respect rule of law and improve access to justice
% of court cases outstanding for two or more years Ministry of Justice and Constitutional Affairs
On spot On spot
Number of available attorneys/accessibility to attorneys
Tanganyika Law Society On spot On spot

85
Provide free and universal legal identity
Percentage of newborns registered at birth Registration Insolvency and Trusteeship Agency
On spot On spot
GOAL 5.7 Establish a Global Partnership for Sustainable Development: Targets, indicators and sources of data
Targets Indicators Data source(s) Year Frequency
Global
Create an enabling environment for sustainable development
Low-income country debt forgiveness or reduction (% of GDP)
Ministry of Finance 2013 Annual
Share of trade in goods and services from low-income countries under duty-free, quota-free market access
Ministry of Industry and Trade, NBS
2013 Annual
Existence of laws for ensuring country-by-country reporting by multinational corporations, disclosure of beneficial ownership and the prevention of money laundering
n/a
Increase financing to productive capacity in low- and middle-income countries
Share of aid to the productive sector Ministry of Finance 2013 Annual
Proportion of foreign direct investment to the productive sector
Ministry of Finance, Tanzania Investment Centre
2013 Annual
Share of South-South cooperation to the productive sector
Ministry of Finance, Tanzania Investment Centre
2013 Annual
National
Implement reforms to ensure stability and transparency of the international financial system
Share of non-performing loans in banking system’s total loan portfolio
n/a
Implementation of Basel International Banking Standards
n/a
Existence of banking transparency legislation to combat illicit financial flows
n/a
Proportion of total country imports (by value and excluding arms) from developing countries and least developed countries
National accounts 2013 Annual
Contribute further to an open, rule-based, predictable, non-discriminatory trading and investment system
Share of exports and imports to GDP National accounts 2013 Annual

86
Annex 6. Data Quality Assessment Framework
Criteria Components (scale)
Sub-components (scale)
Relevance Completeness Main Question: How complete are the data?
Policy requirements for data collection
Guidelines for data collection
Procedures to coordinate statistical information
Procedures to perform regular programme reviews
Advisory council to advise on statistical priorities
Availability of metadata
User needs Main Question: Do the data correspond with user needs?
Agreements with user about the data content and priorities
Procedures to track user needs and uses of the statistics
Information about the survey objectives
Legislative requirement to consult with the user on data collection
User satisfaction Main Question: Do the data satisfy user needs?
Regular follow-ups with users to ensure user satisfaction
Periodic consultations with users to check for their feedback
Post-collection evaluations to compare data outcomes with user needs
Accuracy and reliability
Sampling and non-sampling errors Main Question: What procedures are in place to reduce sampling and non-sampling errors?
Measurement, evaluation and systematic documentation of sampling and non-sampling errors
Mechanisms to ensure survey samples closely represent the population under study
Quality assurance plan to prevent, monitor and evaluate non-sampling errors
Compilation of user feedback to assess the relevance of the statistical study for user purposes
Systematic and random errors Main Question: What procedures are in place to reduce systematic and random errors?
Systems to assess source data, intermediate results and statistical outputs
Procedures to measure and reduce errors
Regular assessment of data sources
Systematic comparison of data and results with data and results from other existing sources to ensure validity
Assessment report of statistical discrepancies in intermediate data
Revisions analysed to improve statistical process
Revision measures Main Question: What measures are in place to revise the data?
Policies for documenting principles and procedures for data revision
Transparent and standard procedures for revising data
Periodic quality reporting on the accuracy of data collected
Public access to revision policies
Information that clearly identifies preliminary and revised data
Information that shows timely correction of errors found in published statistics
Timeliness and punctuality
Timeliness Main Question: How quickly are the data released for dissemination or further processing?
Release policy distinguishing between statistical outputs and the corresponding release procedures and timeliness targets
Compliance with timeliness targets like the International Monetary Fund data dissemination standards
Official calendar to announce advance release dates of major statistics
Attainable schedule for the production process

87
Criteria Components (scale)
Sub-components (scale)
Maximum time allowed to elapse between the end of the reference period and the availability of the data
Procedures to ensure timely and effective flow of data from providers
Procedures to consult with users about the periodicity of the statistics
Punctuality Main Question: Whether the data are delivered according to the official due date?
Action or contingency plans to address delays in data release date
Procedures to regularly monitor the punctuality of every release as per the release calendar
Notifications provided for any divergences from the advanced release time and publication of new release dates
Formal explanations provided in the event of a delay
Accessibility and clarity
Accessibility Main Question: How easily are the data accessible?
Data dissemination strategy and policy, including clear pricing policy for governing the dissemination
Policy or guideline to ensure that the data are made available to all users (including any restrictions that may apply)
Strategies to release data, metadata and microdata
Availability of publication catalogues for users
Application of information and communication technology to disseminate data (in addition to hard copy publications)
Navigable website that allows users to access data and metadata and facilitates self-tabulation in a variety of formats
Periodic consultation with users to ensure dissemination formats satisfy user needs
Procedures to request data that are not readily available to the public
Clarity Main Question: How clearly are the data presented to all users?
Guidelines describing the appropriate content and preferred formats and style of the agency's outputs
Presentation of statistics that facilitate proper interpretation and meaningful comparisons
Regular production of up-to-date methodological documents and quality reports
Staff training and development programmes for writing about statistics
User support or information services for handling questions related to the data
Procedure to annotate differences between international standards, guidelines or good practices
Statistics presented in a clear and understandable manner
Explanatory texts accompany the data
Meaningful comparisons included in the publication
Metadata and microdata Main Question: How accessible and readable are the metadata and microdata?
Policies to provide documentation on concepts, scope, classifications, data sources, basis of recording, compilation methods, etc. with the release of statistical results
Procedures to ensure metadata are documented according to standardised metadata systems
Procedures to ensure metadata are updated regularly
Availability of microdata
Rules and protocols for accessing microdata
Consistency Policy promoting cooperation and exchange of knowledge between individual statistical programmes/domains

88
Criteria Components (scale)
Sub-components (scale)
Coherence and comparability
Main Question: How consistent are the data internally or cross-sectorally?
Specific guidelines for individual statistical programmes/domains to ensure outputs obtained from complementary sources are properly combined
Process-specific procedures to ensure outputs are internally coherent
Information provided to users on the effects of changes in methodologies on final estimates
Comparability Main Question: How comparably are the data over time?
Extent to which statistics derived from different sources or different periodicities are comparable
Clear explanation and reconciliation provided for any methodological changes or differences
Analysis of the major related statistics before designing a new individual statistical programme/domain
Comparison provided with other statistical sources that contain the same or similar information (including identification of divergences with explanations)
Standardisation Main Question: Are the data produced using common standards with respect to scope, definitions, classifications and units?
Common standards for concepts, definitions, units and classifications to promote coherence, consistency and comparability of the statistics
Periodic assessment of compliance with international and national standards for statistical production
Explanation provided for any deviations from international and national standards to users
Reference made to common repository of concepts, definitions and classifications when designing a new individual statistical programme/domain
Quality reporting includes assessment of internal consistency and comparability over time

89
Published on 17 February 2016
Centre for Policy Dialogue (CPD)
House – 6/2, Block – F, Kazi Nazrul Islam Road Lalmatia Housing Estate Dhaka 1207, Bangladesh
Telephone: (+88 02) 8124770, 9141734, 9141703 Fax: (+88 02) 8130951 Web: http://cpd.org.bd/
E-mail: [email protected]
The Norman Paterson School of International Affairs 5306 River Building
1125 Colonel By Drive Ottawa, Ontario K1S 5B6 Canada
Telephone: 613-520-6655 Fax: 613-520-2889
E-mail: [email protected] Web: https://carleton.ca/npsia/
Southern Voice on Post-MDG International Development Goals
House – 6/2, Block – F, Kazi Nazrul Islam Road Lalmatia Housing Estate Dhaka 1207, Bangladesh
Telephone: (+88 02) 8124770, 9141734, 9141703 Fax: (+88 02) 8130951
Web: http://southernvoice-postmdg.org E-mail: [email protected]