assessing consumers’ perceptions of health claims presentation of ific foundation consumer...
TRANSCRIPT
Assessing Consumers’ Perceptions of Health Claims
Presentation of IFIC Foundation Consumer Research on Health Claims and Other Label Statements
Wendy Reinhardt Kapsak, MS, RDDirector, Health and Nutrition
International Food Information Council (IFIC) and IFIC Foundation
Food and Drug Administration (FDA)Public Meeting
Thursday, November 17, 2005
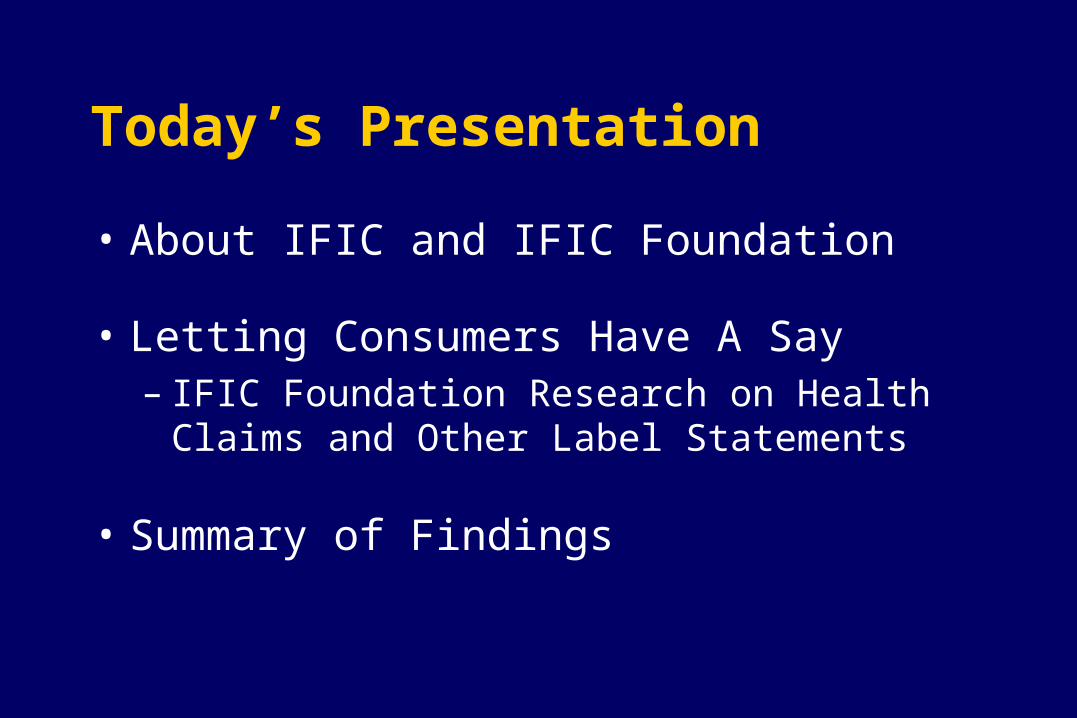
Today’s Presentation
• About IFIC and IFIC Foundation
• Letting Consumers Have A Say– IFIC Foundation Research on Health Claims and
Other Label Statements
• Summary of Findings
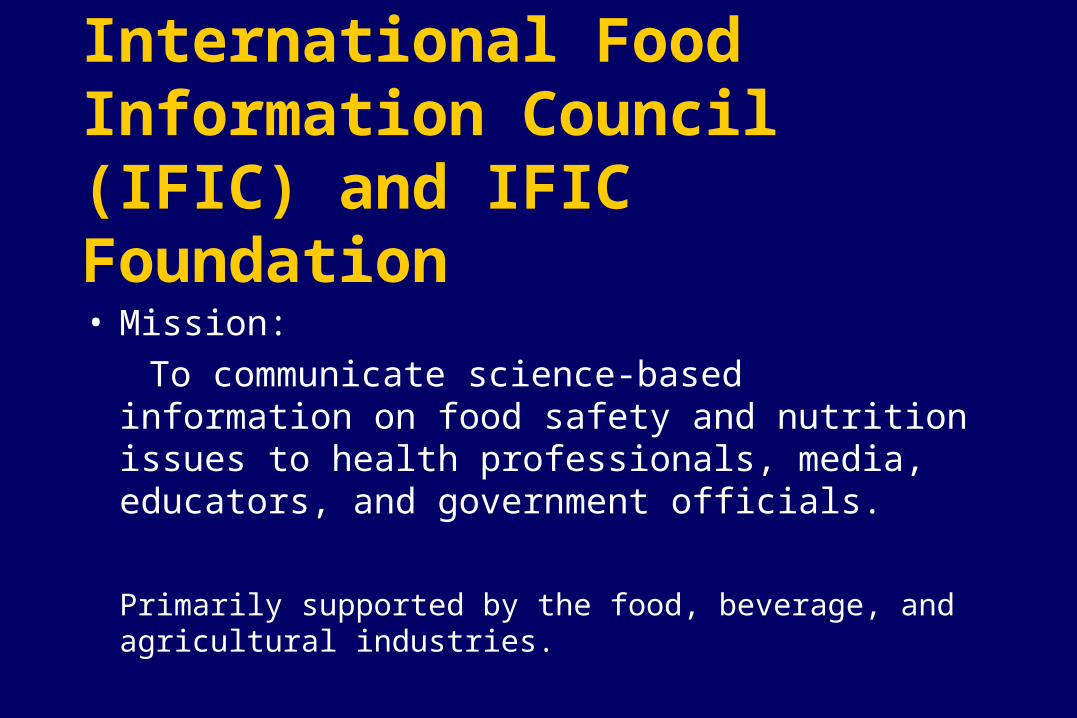
International Food Information Council (IFIC) and IFIC Foundation
• Mission:
To communicate science-based information on food safety and nutrition issues to health professionals, media, educators, and government officials.
Primarily supported by the food, beverage, and agricultural industries.

IFIC Foundation Web SiteIn English and Spanish
ific.orgific.organdand
ific.org/spific.org/sp
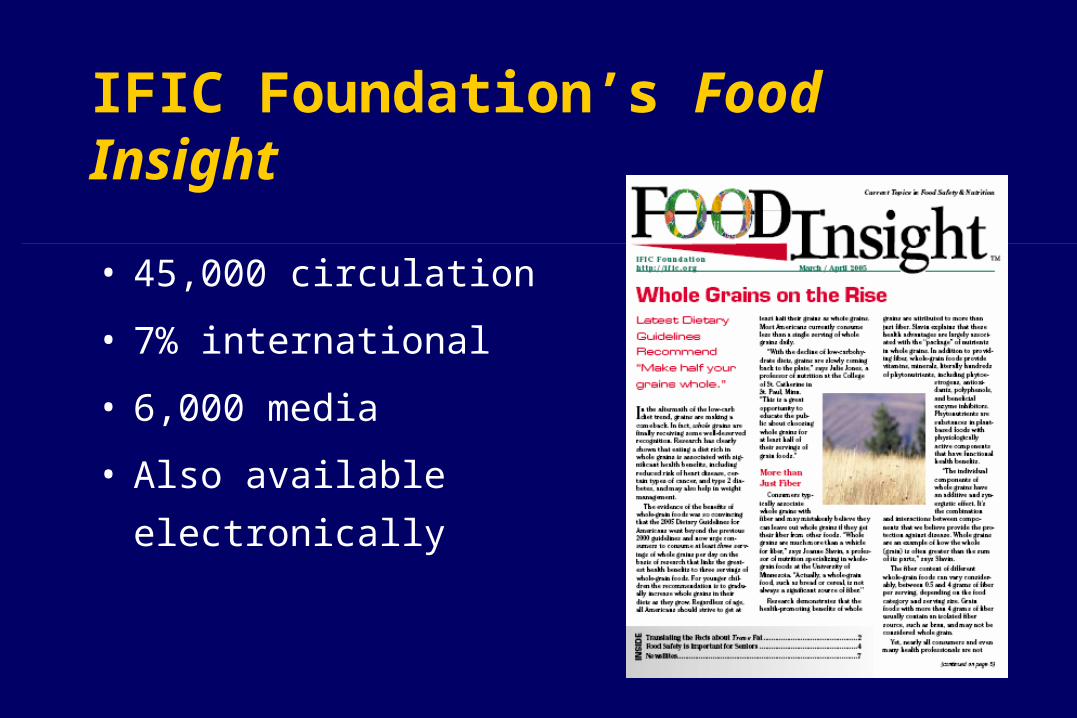
IFIC Foundation’s Food Insight
• 45,000 circulation
• 7% international
• 6,000 media
• Also available electronically
Qualified Health Claims (QHC)Consumer Research Objectives
1) Measure consumer reaction to the FDA-proposed 4 levels of health claims on basis of:
– Strength of scientific evidence– Overall healthfulness of the product– Perception of product quality– Perception of product safety– Purchase intent
2)Determine whether consumers differentiate between dietary guidance and health claims.
3)Examine the impact of structure-function claims and alternative language versus qualified and unqualified health claims.
QHC Consumer Research Objectives
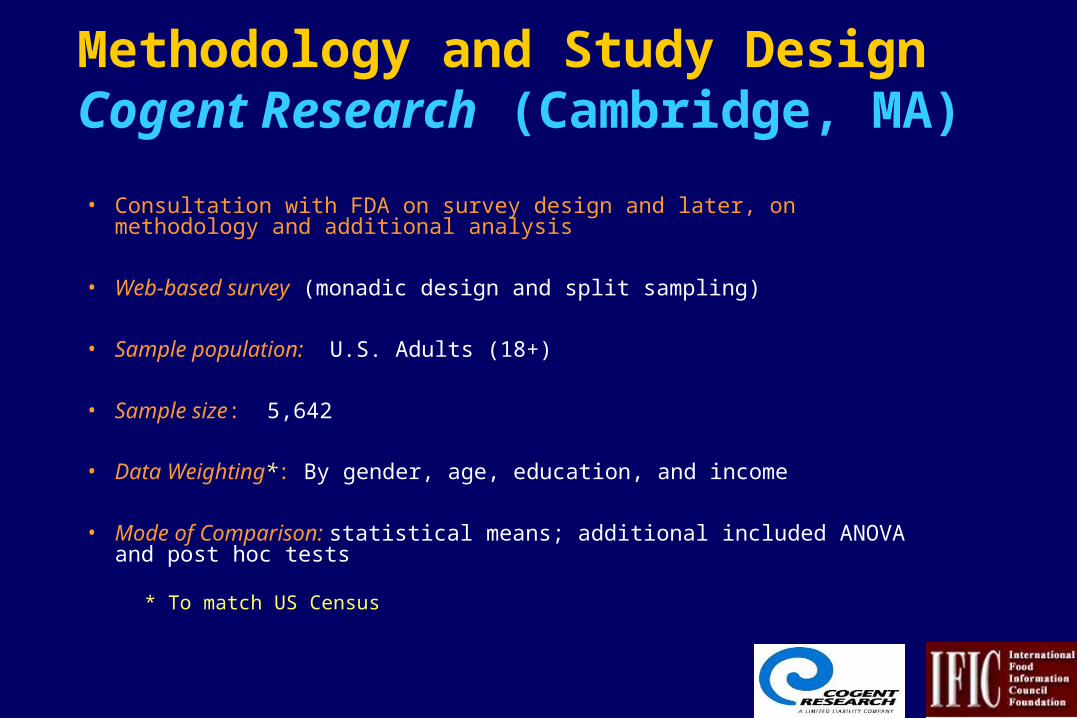
Methodology and Study Design Cogent Research (Cambridge, MA)
• Consultation with FDA on survey design and later, on methodology and additional analysis
• Web-based survey (monadic design and split sampling)
• Sample population: U.S. Adults (18+)
• Sample size: 5,642
• Data Weighting*: By gender, age, education, and income
• Mode of Comparison: statistical means; additional included ANOVA and post hoc tests
* To match US Census
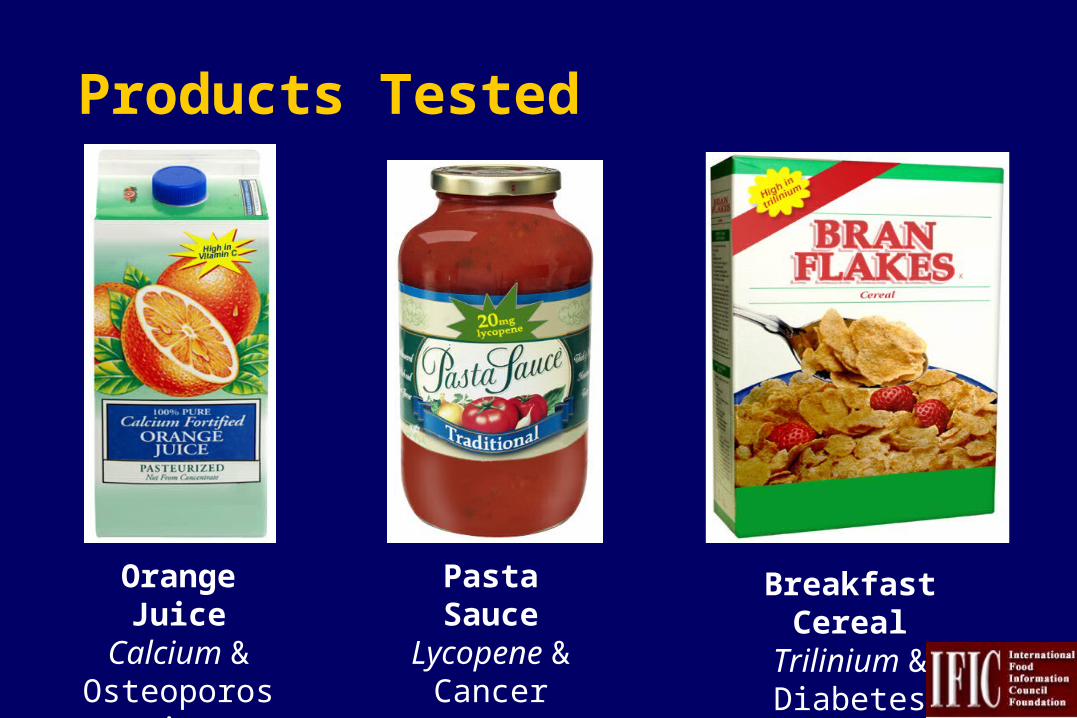
Orange JuiceCalcium &
Osteoporosis
Pasta SauceLycopene &
Cancer
Breakfast CerealTrilinium &Diabetes
Products Tested
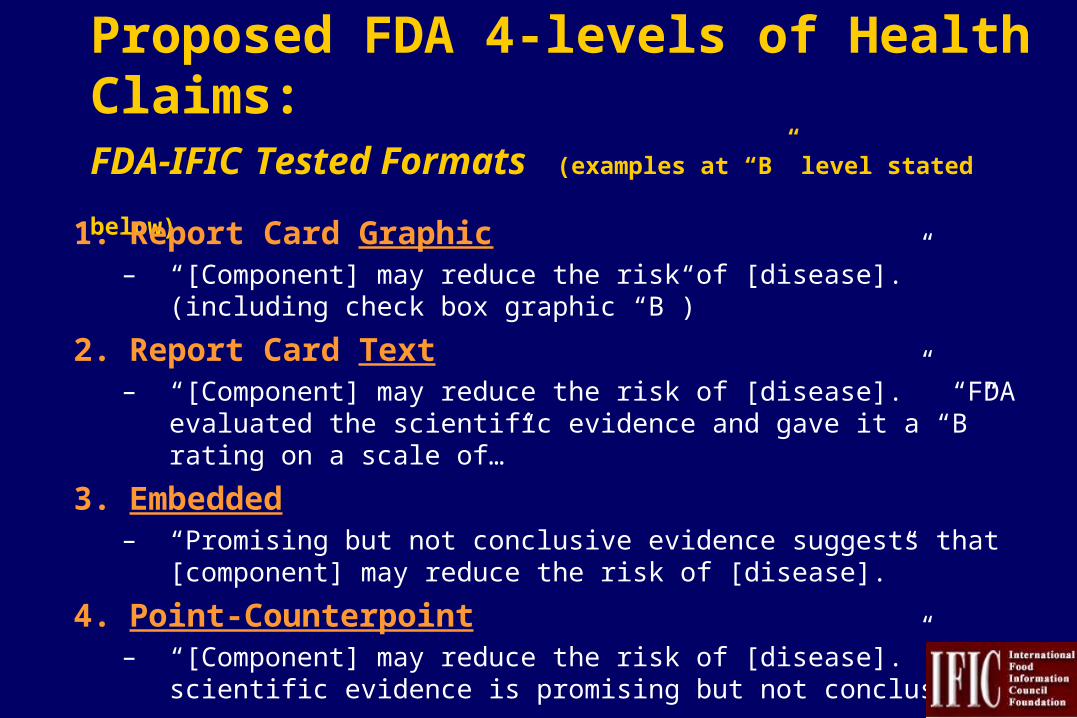
Proposed FDA 4-levels of Health Claims: FDA-IFIC Tested Formats (examples at “B” level stated below)
1. Report Card Graphic– “[Component] may reduce the risk of [disease].” (including check box
graphic “B”)
2. Report Card Text– “[Component] may reduce the risk of [disease].” “FDA evaluated the
scientific evidence and gave it a “B” rating on a scale of…”
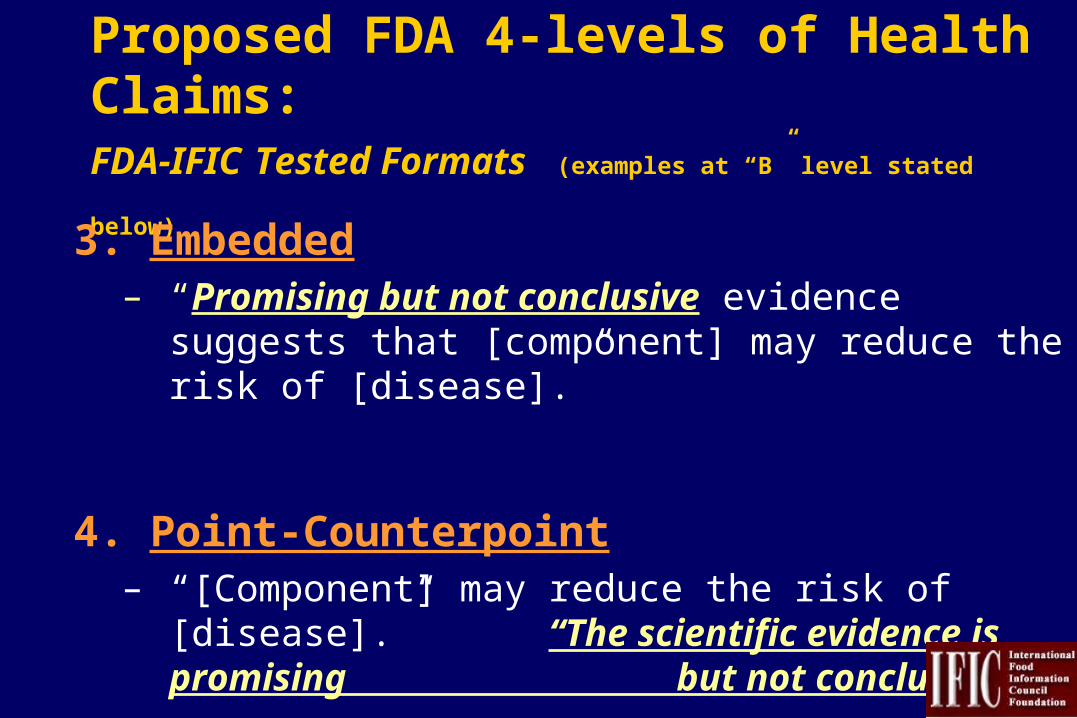
3. Embedded– “Promising but not conclusive evidence suggests that [component] may
reduce the risk of [disease].”
4. Point-Counterpoint– “[Component] may reduce the risk of [disease].” “The scientific evidence is
promising but not conclusive.”
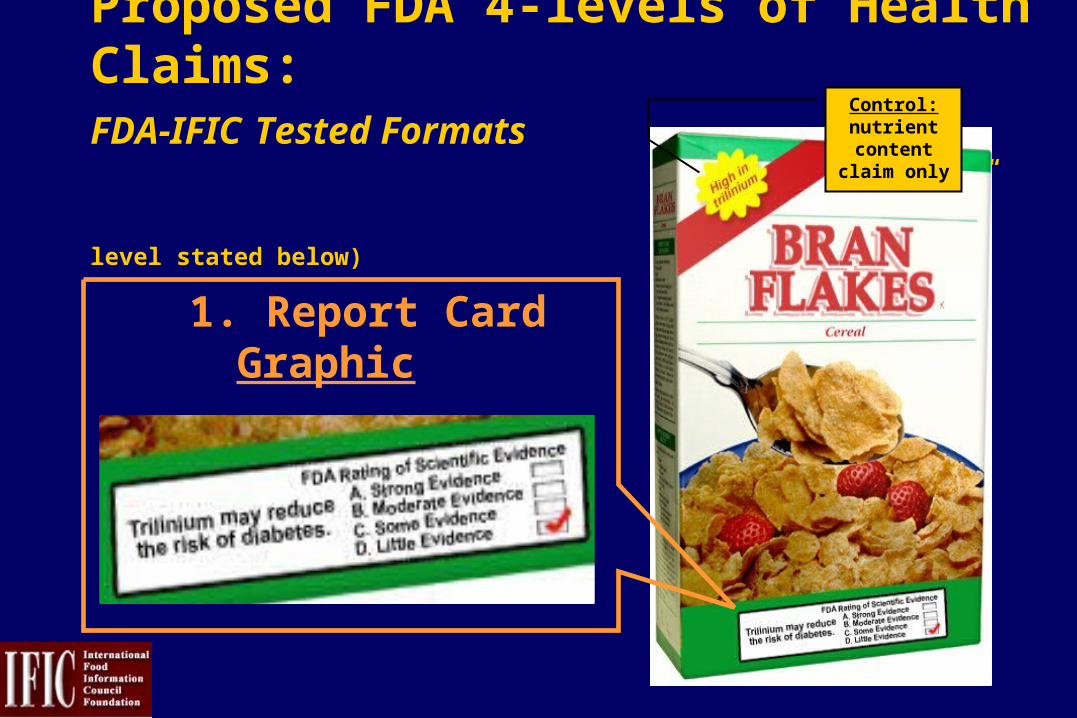
Proposed FDA 4-levels of Health Claims: FDA-IFIC Tested Formats (examples at “B” level stated below)
Control: nutrient content
claim only
1. Report Card Graphic
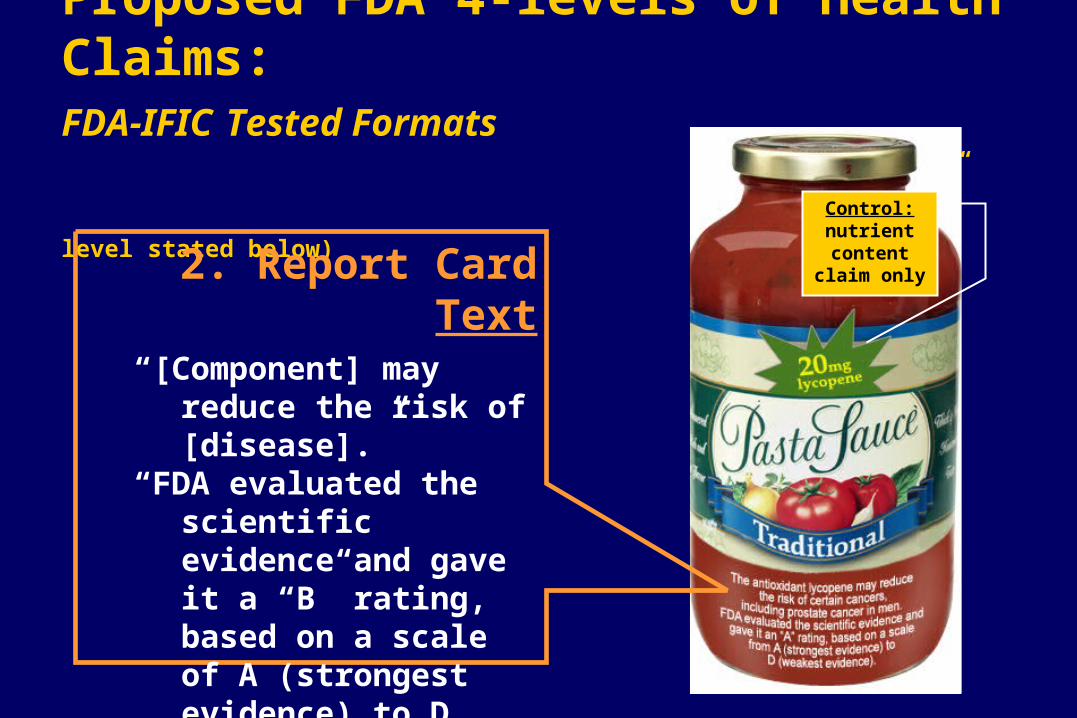
Proposed FDA 4-levels of Health Claims: FDA-IFIC Tested Formats (examples at “B” level stated below) Control:
nutrient content
claim only2. Report Card Text“[Component] may reduce
the risk of [disease].” “FDA evaluated the
scientific evidence and gave it a “B” rating, based on a scale of A (strongest evidence) to D (weakest evidence).
Proposed FDA 4-levels of Health Claims: FDA-IFIC Tested Formats (examples at “B” level stated below)
3. Embedded– “Promising but not conclusive evidence suggests
that [component] may reduce the risk of [disease].”
4. Point-Counterpoint– “[Component] may reduce the risk of [disease].”
“The scientific evidence is promising but not conclusive.”
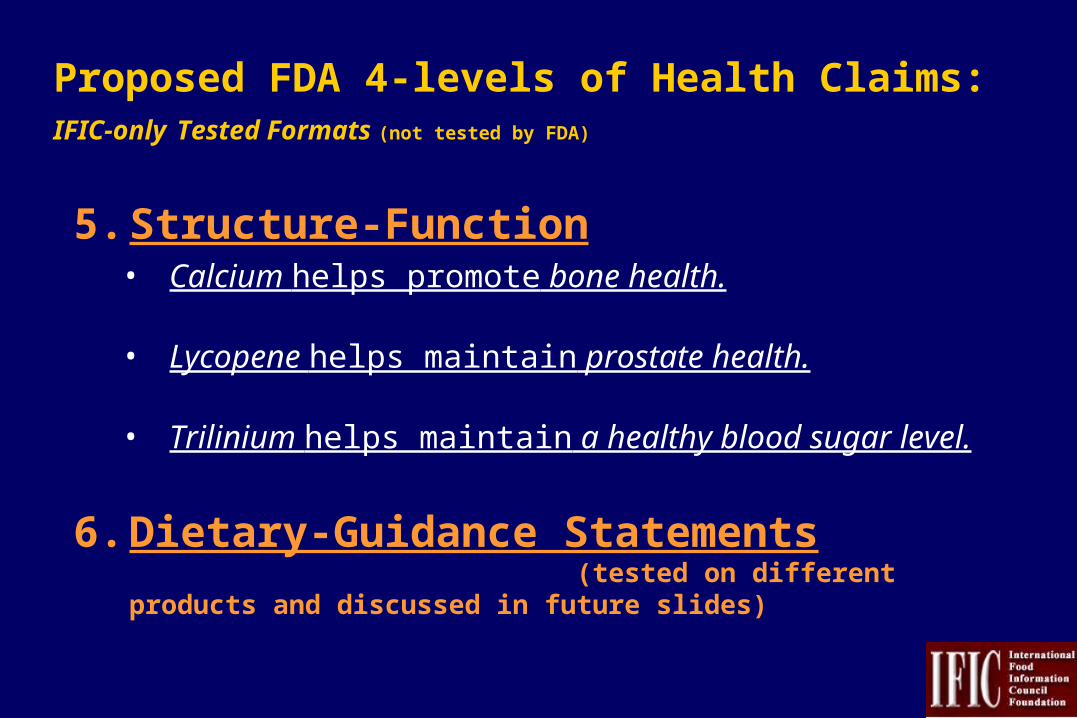
Proposed FDA 4-levels of Health Claims: IFIC-only Tested Formats (not tested by FDA)
5. Structure-Function• Calcium helps promote bone health.
• Lycopene helps maintain prostate health.
• Trilinium helps maintain a healthy blood sugar level.
6. Dietary-Guidance Statements (tested on different products and discussed in future slides)
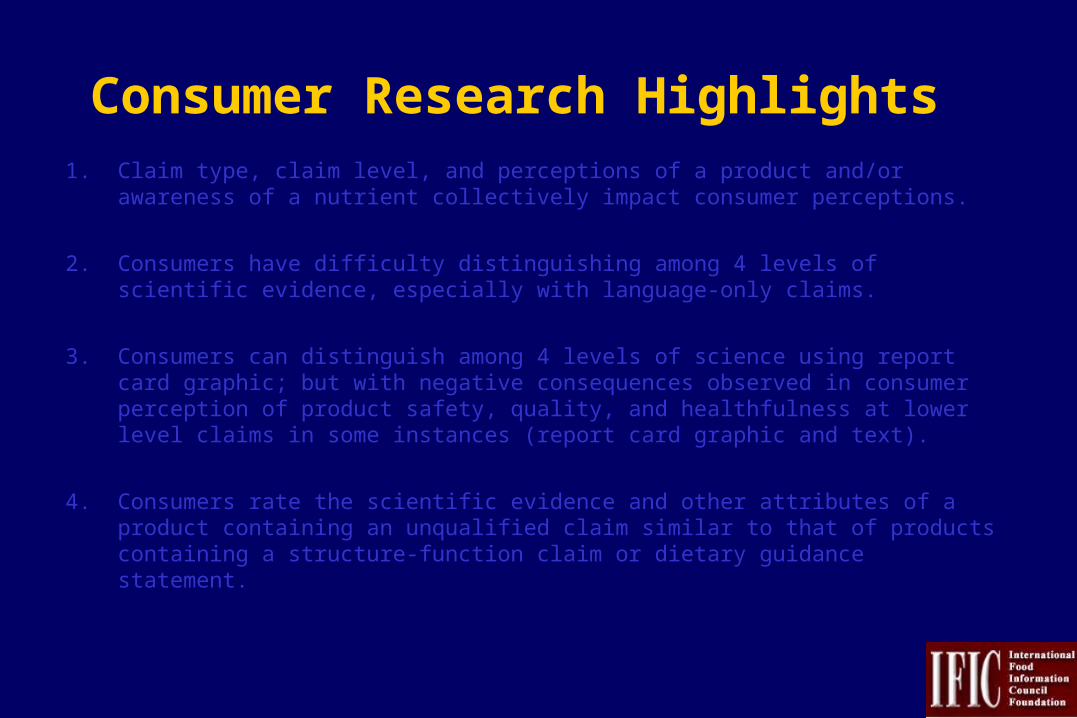
Consumer Research Highlights1. Claim type, claim level, and perceptions of a product and/or awareness of
a nutrient collectively impact consumer perceptions.
2. Consumers have difficulty distinguishing among 4 levels of scientific evidence, especially with language-only claims.
3. Consumers can distinguish among 4 levels of science using report card graphic; but with negative consequences observed in consumer perception of product safety, quality, and healthfulness at lower level claims in some instances (report card graphic and text).
4. Consumers rate the scientific evidence and other attributes of a product containing an unqualified claim similar to that of products containing a structure-function claim or dietary guidance statement.
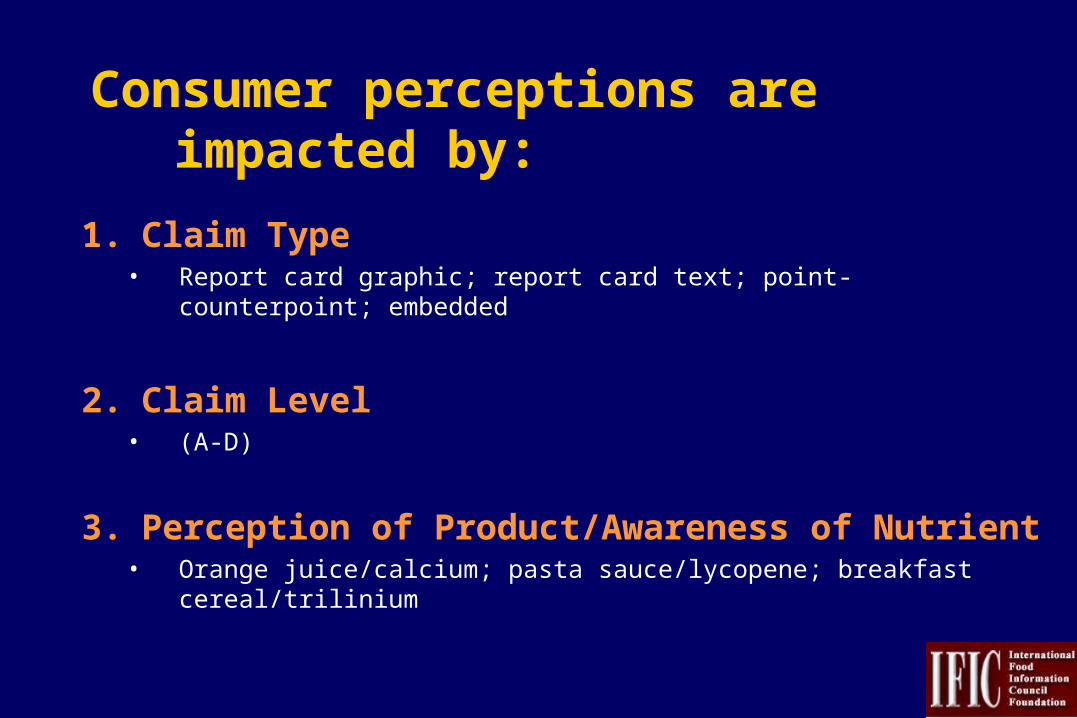
Consumer perceptions are impacted by:
1. Claim Type • Report card graphic; report card text; point-counterpoint; embedded
2. Claim Level • (A-D)
3. Perception of Product/Awareness of Nutrient• Orange juice/calcium; pasta sauce/lycopene; breakfast cereal/trilinium
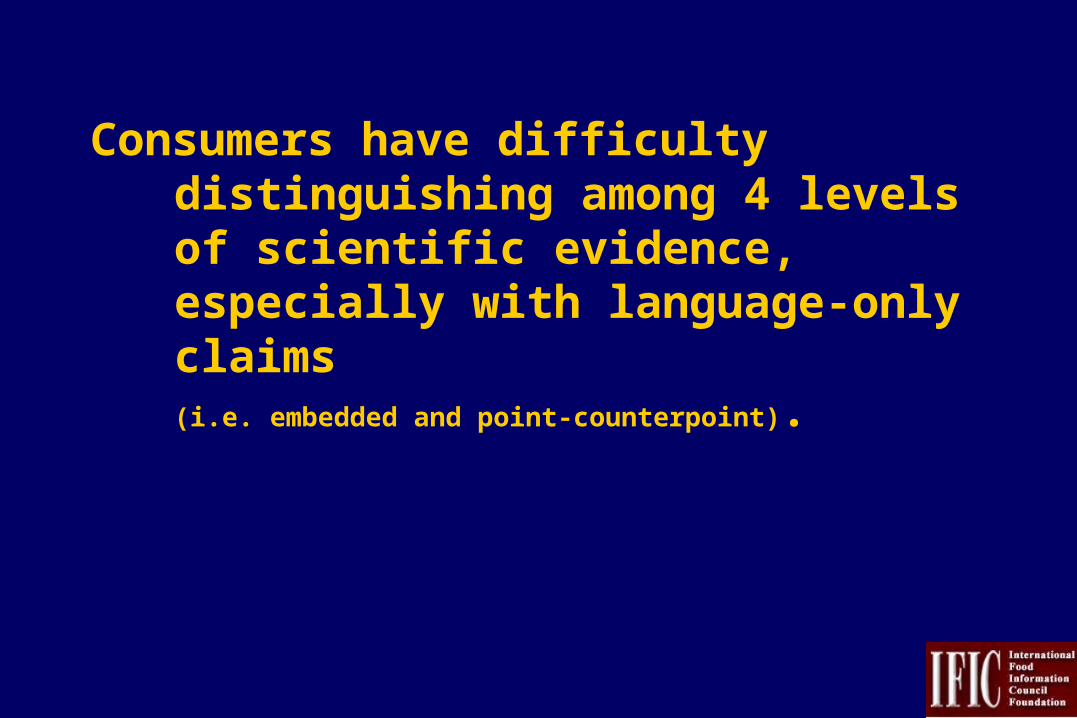
Consumers have difficulty distinguishing among 4 levels of scientific evidence, especially with language-only claims(i.e. embedded and point-counterpoint).
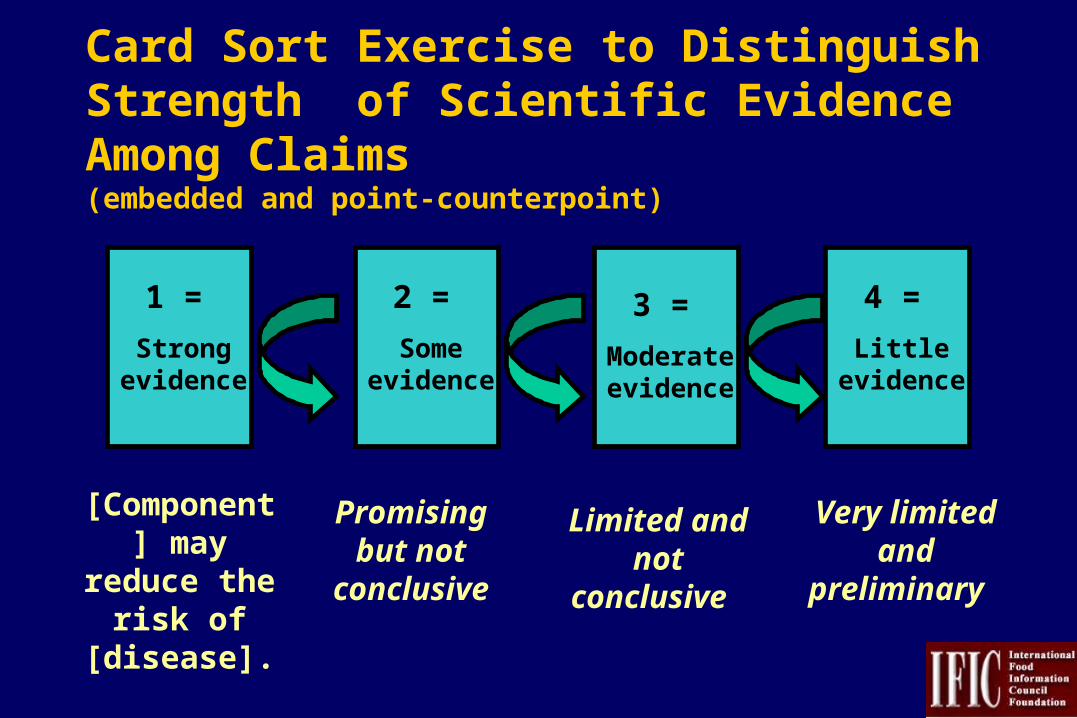
Card Sort Exercise to Distinguish Strength of Scientific Evidence Among Claims (embedded and point-counterpoint)
[Component] may reduce the risk of [disease].
Promising but not
conclusive
Limited and not
conclusive
Very limited and
preliminary
1 =
Strong evidence
2 =
Some evidence
3 =
Moderate evidence
4 =
Little evidence
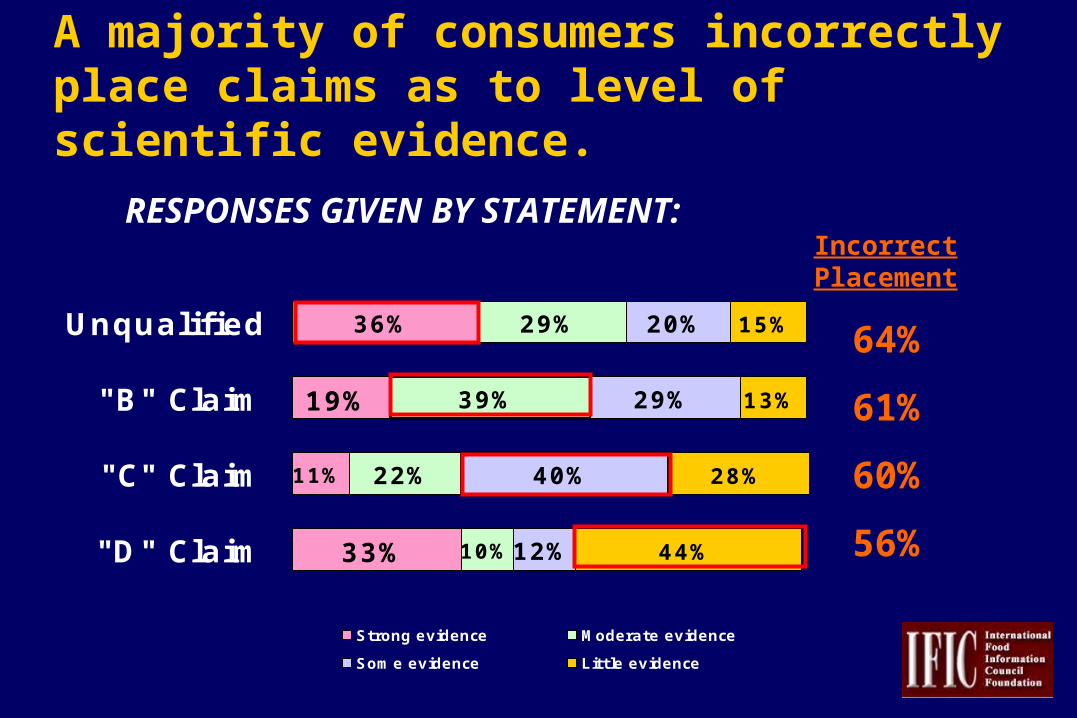
A majority of consumers incorrectly place claims as to level of scientific evidence.
RESPONSES GIVEN BY STATEMENT:
19%
33%
29%
22%
20%
29%
12%
13%
28%11%
36%
10%
39%
40%
44%
15%Unqualified
"B" Claim
"C" Claim
"D" Claim
Strong evidence Moderate evidence
Some evidence Little evidence
Incorrect Placement
64%
61%
60%
56%
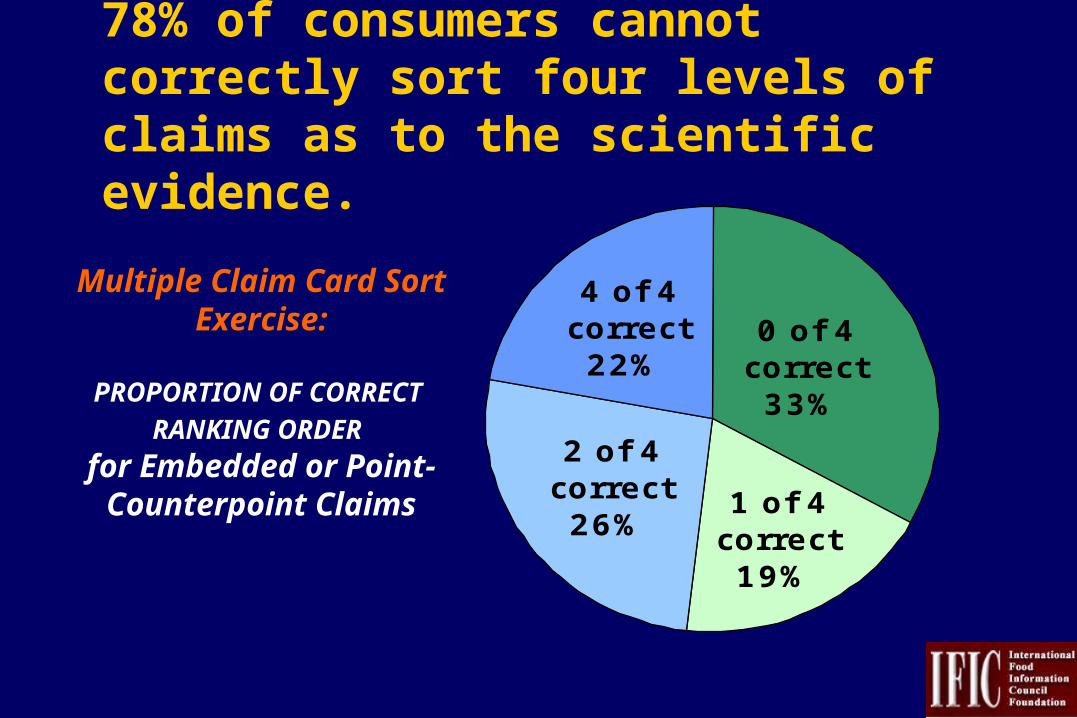
4 of 4 correct22%
2 of 4 correct26%
1 of 4 correct19%
0 of 4 correct33%
Multiple Claim Card Sort Exercise:
PROPORTION OF CORRECT RANKING ORDER
for Embedded or Point-Counterpoint Claims
78% of consumers cannot correctly sort four levels of claims as to the scientific evidence.
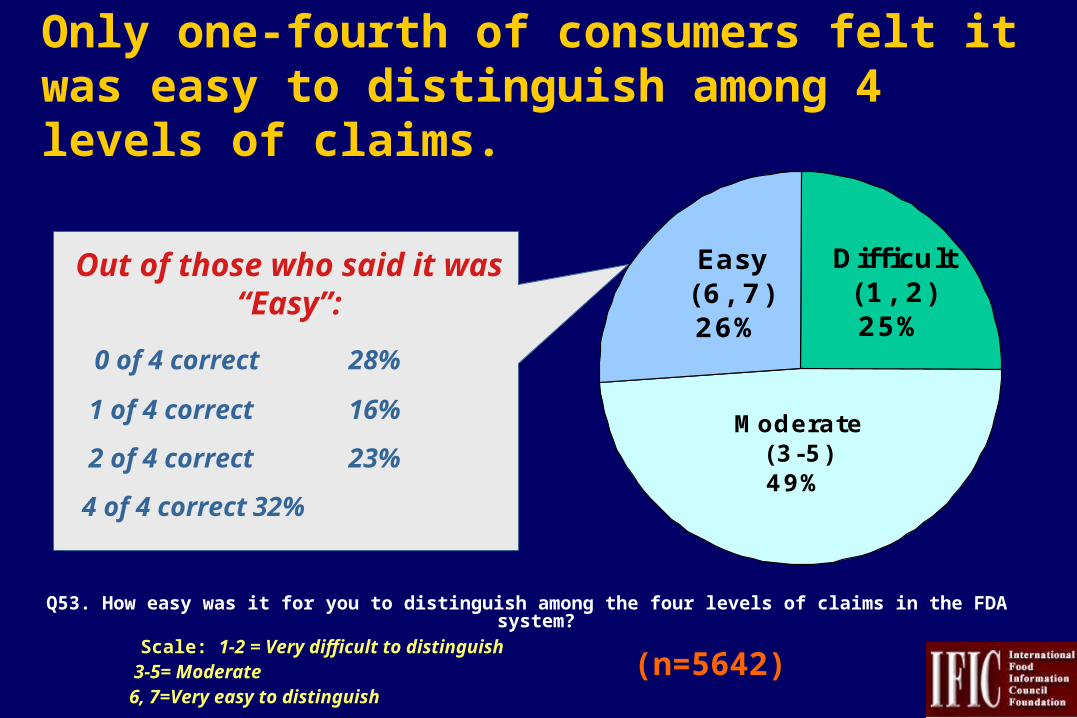
(n=5642)
Q53. How easy was it for you to distinguish among the four levels of claims in the FDA system? Scale: 1-2 = Very difficult to distinguish
3-5= Moderate 6, 7=Very easy to distinguish
Easy (6, 7)26%
Moderate (3-5)49%
Difficult (1, 2)25%
Out of those who said it was “Easy”:
0 of 4 correct 28%
1 of 4 correct 16%
2 of 4 correct 23%
4 of 4 correct 32%
Only one-fourth of consumers felt it was easy to distinguish among 4 levels of claims.
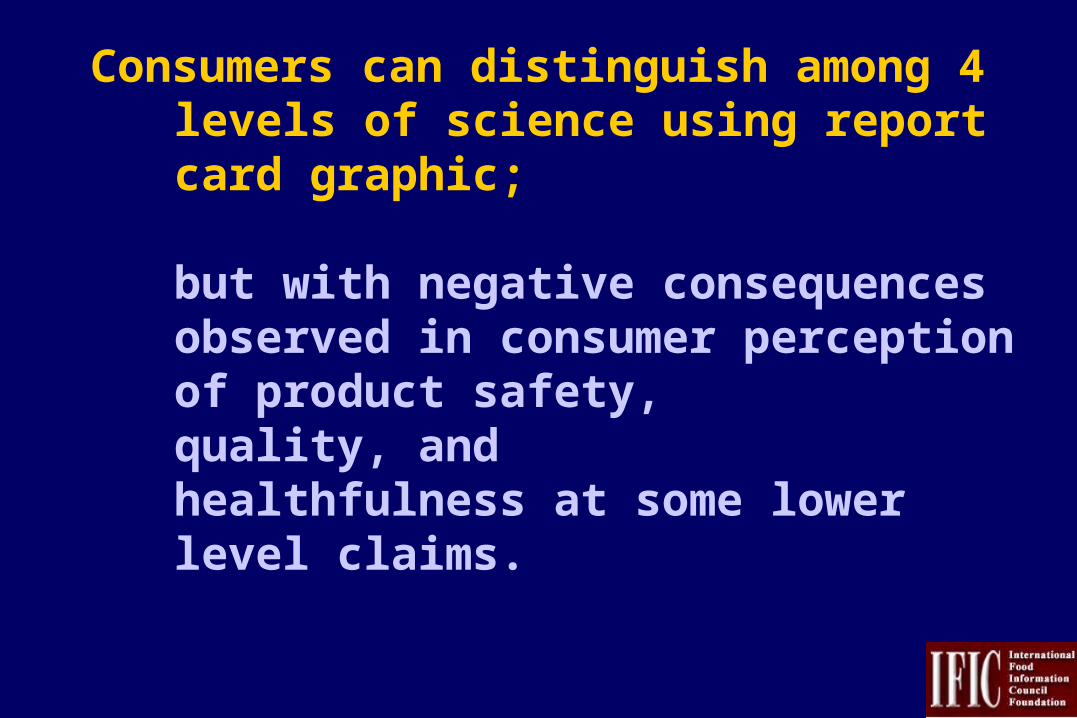
Consumers can distinguish among 4 levels of science using report card graphic;
but with negative consequences observed in consumer perception of product safety, quality, and healthfulness at some lower level claims.
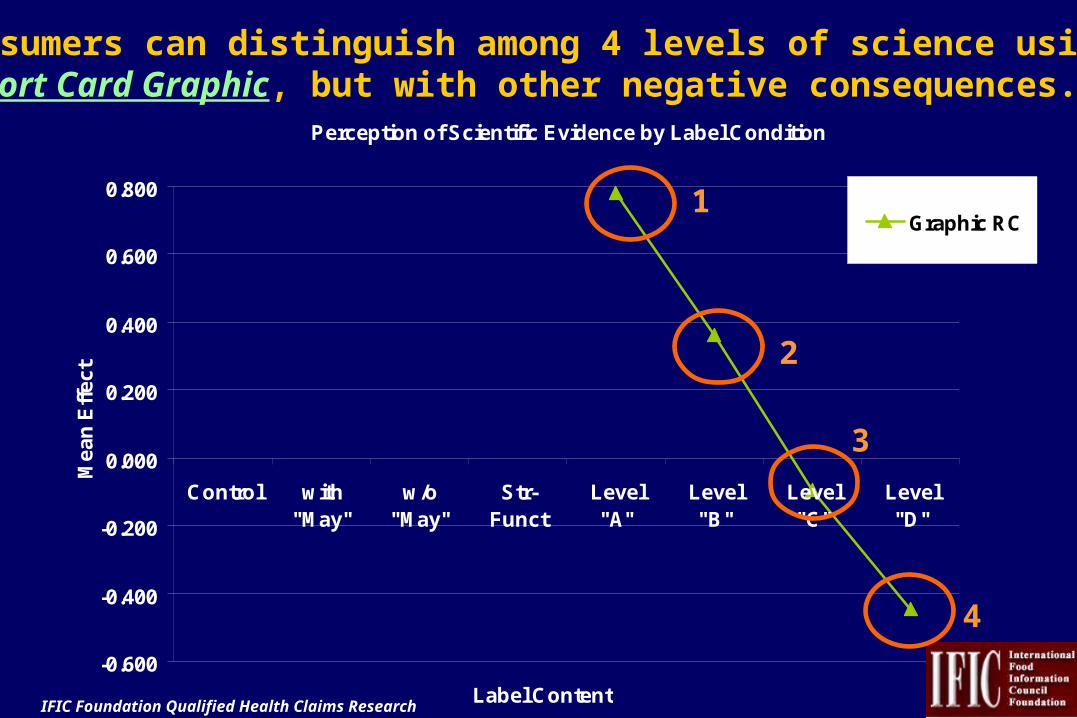
Perception of Scientific Evidence by Label Condition
-0.600
-0.400
-0.200
0.000
0.200
0.400
0.600
0.800
Control with"May"
w/o"May"
Str-Funct
Level"A"
Level"B"
Level"C"
Level"D"
Label Content
Me
an
Eff
ec
t
Graphic RC1
2
3
4
IFIC Foundation Qualified Health Claims Research http://ific.org
Consumers can distinguish among 4 levels of science using Report Card Graphic, but with other negative consequences.
1
2
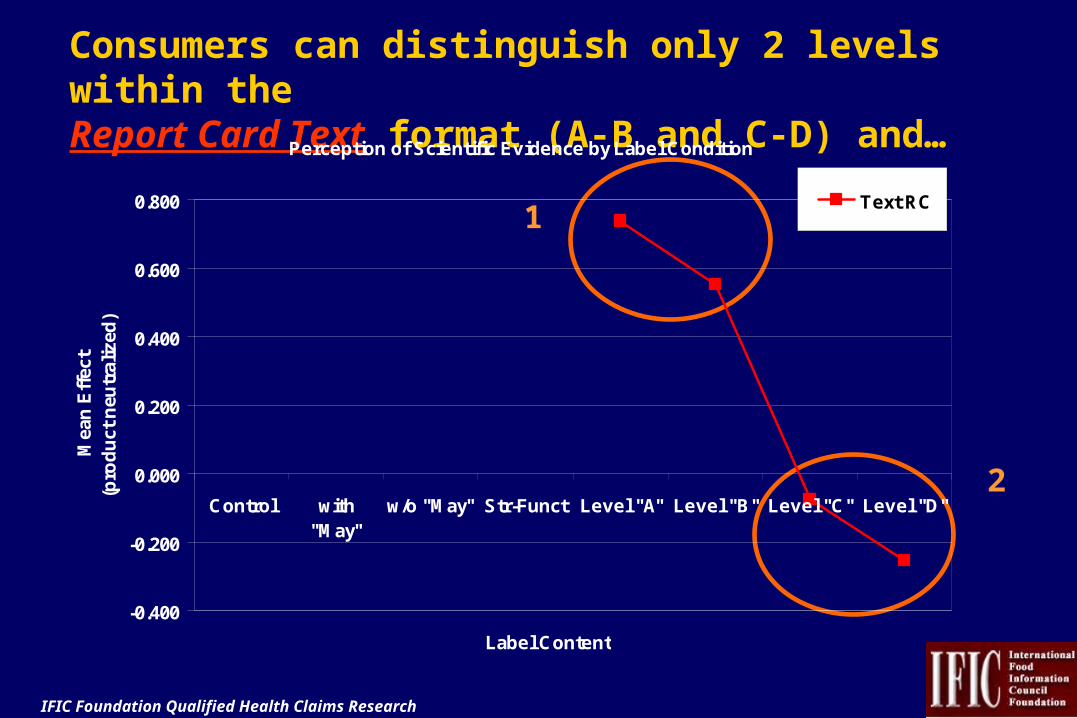
Consumers can distinguish only 2 levels within theReport Card Text format (A-B and C-D) and…
IFIC Foundation Qualified Health Claims Research http://ific.org
Perception of Scientific Evidence by Label Condition
-0.400
-0.200
0.000
0.200
0.400
0.600
0.800
Control with"May"
w/o "May" Str-Funct Level "A" Level "B" Level "C" Level "D"
Label Content
Mea
n E
ffec
t (p
rod
uct
neu
tral
ized
)
Text RC
12
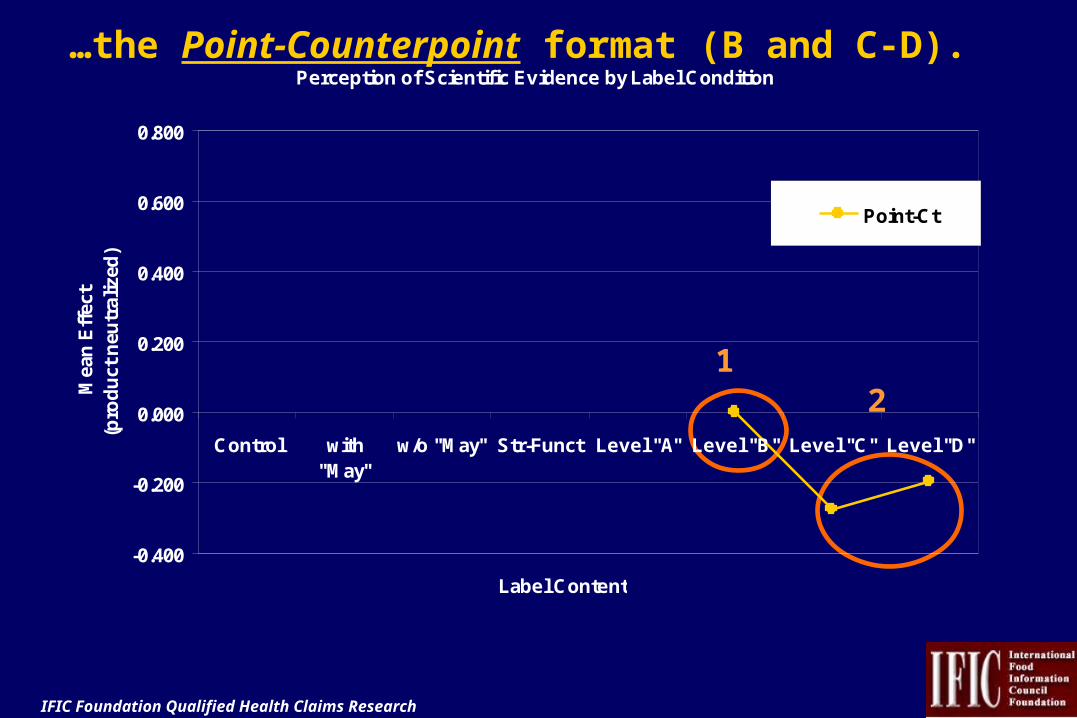
…the Point-Counterpoint format (B and C-D).
IFIC Foundation Qualified Health Claims Research http://ific.org
Perception of Scientific Evidence by Label Condition
-0.400
-0.200
0.000
0.200
0.400
0.600
0.800
Control with"May"
w/o "May" Str-Funct Level "A" Level "B" Level "C" Level "D"
Label Content
Mea
n E
ffec
t (p
rod
uct
neu
tral
ized
)
Point-Ct
Perception of Scientific Evidence by Label Condition
-0.400
-0.200
0.000
0.200
0.400
0.600
0.800
Control with"May"
w/o "May" Str-Funct Level "A" Level "B" Level "C" Level "D"
Label Content
Mea
n E
ffec
t (p
rod
uct
neu
tral
ized
)
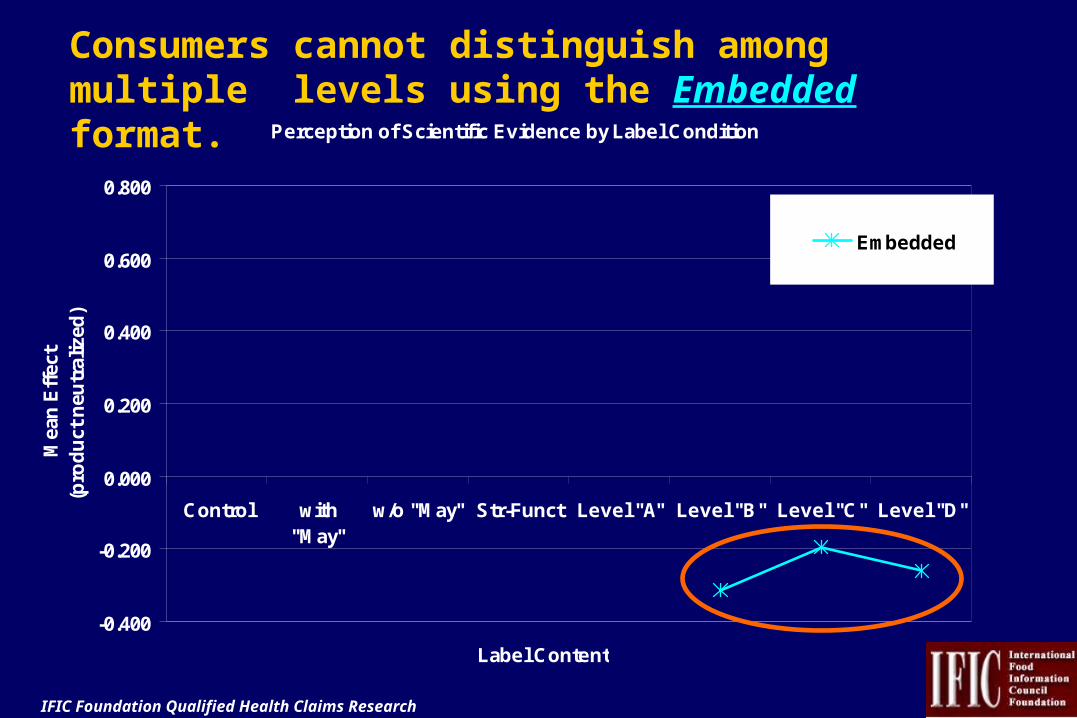
Embedded
Consumers cannot distinguish among multiple levels using the Embedded format.
IFIC Foundation Qualified Health Claims Research http://ific.org
Consumers can distinguish among 4 levels of science using report card graphic;
but with negative consequences observed in consumer perception of product safety, quality, and healthfulness at some lower level claims (report card graphic and text).
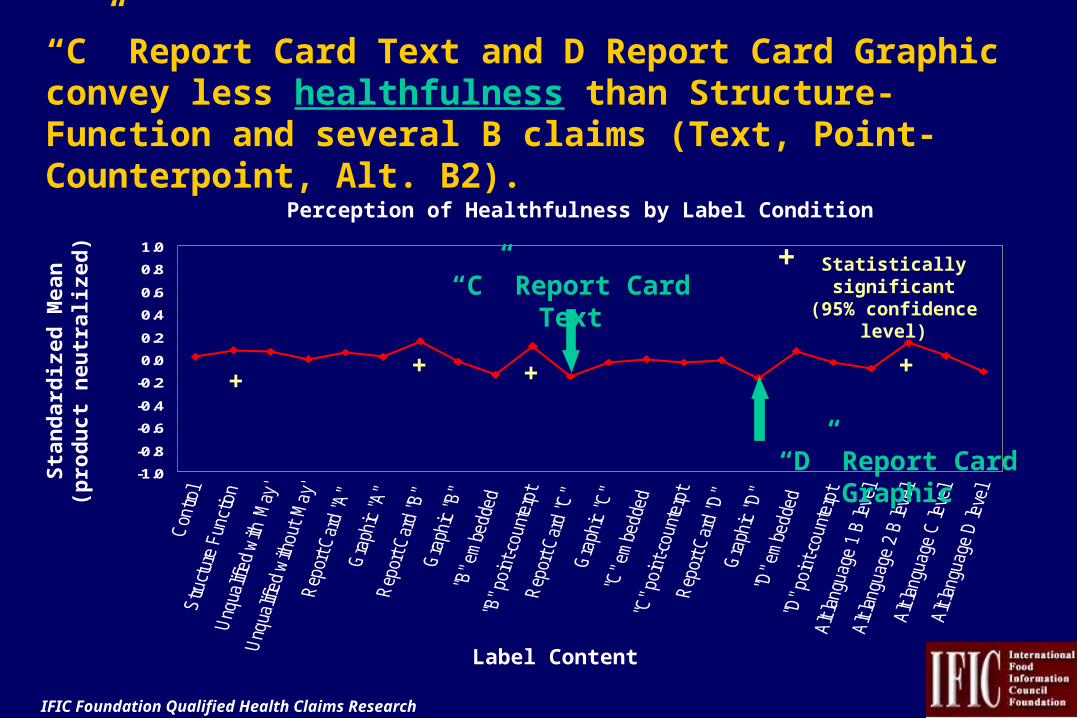
Perception of Healthfulness by Label Condition
Label Content
-1.0
-0.8
-0.6
-0.4
-0.2
0.0
0.2
0.4
0.6
0.8
1.0
IFIC Foundation Qualified Health Claims Research http://ific.org
Sta
nd
ard
ized
Mea
n(p
rod
uct
neu
tral
ized
)“C” Report Card Text and D Report Card Graphic convey less healthfulness than Structure-Function and several B claims (Text, Point-Counterpoint, Alt. B2).
Statistically significant(95% confidence level)“C” Report Card Text
“D” Report Card Graphic
+
++
+ +
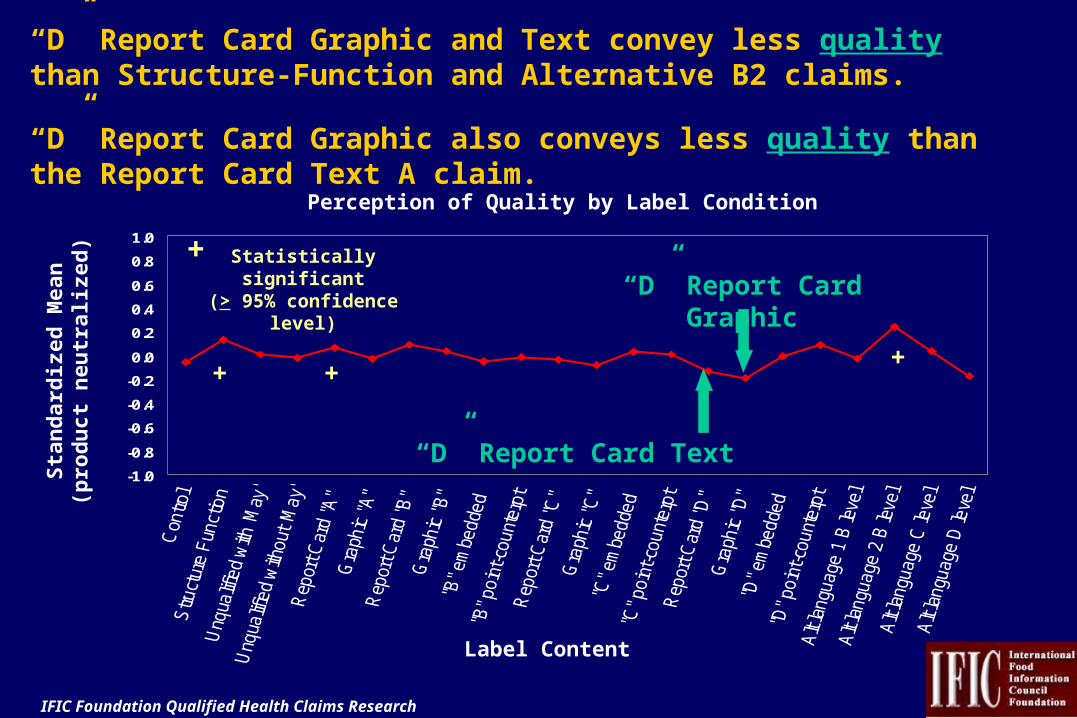
Perception of Quality by Label Condition
Label Content
Sta
nd
ard
ized
Mea
n(p
rod
uct
neu
tral
ized
)
-1.0
-0.8
-0.6
-0.4
-0.2
0.0
0.2
0.4
0.6
0.8
1.0
IFIC Foundation Qualified Health Claims Research http://ific.org
Statistically significant(> 95% confidence level)
“D” Report Card Graphic and Text convey less quality than Structure-Function and Alternative B2 claims.
“D” Report Card Graphic also conveys less quality than the Report Card Text A claim.
“D” Report Card Graphic+
“D” Report Card Text
++ +
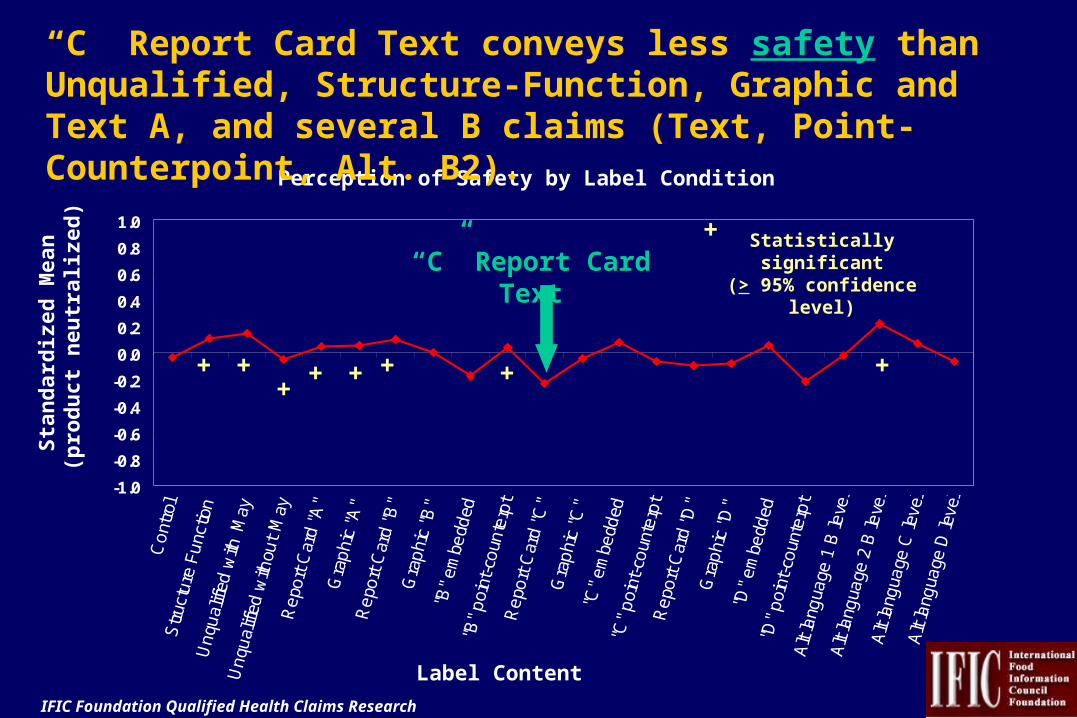
Perception of Safety by Label Condition
Label Content
Sta
nd
ard
ized
Mea
n
(pro
du
ct n
eutr
aliz
ed)
-1.0
-0.8
-0.6
-0.4
-0.2
0.0
0.2
0.4
0.6
0.8
1.0
“C” Report Card Text conveys less safety than Unqualified, Structure-Function, Graphic and Text A, and several B claims (Text, Point-Counterpoint, Alt. B2).
Statistically significant(> 95% confidence level)“C” Report Card Text
IFIC Foundation Qualified Health Claims Research http://ific.org
+
++++++ + +
*
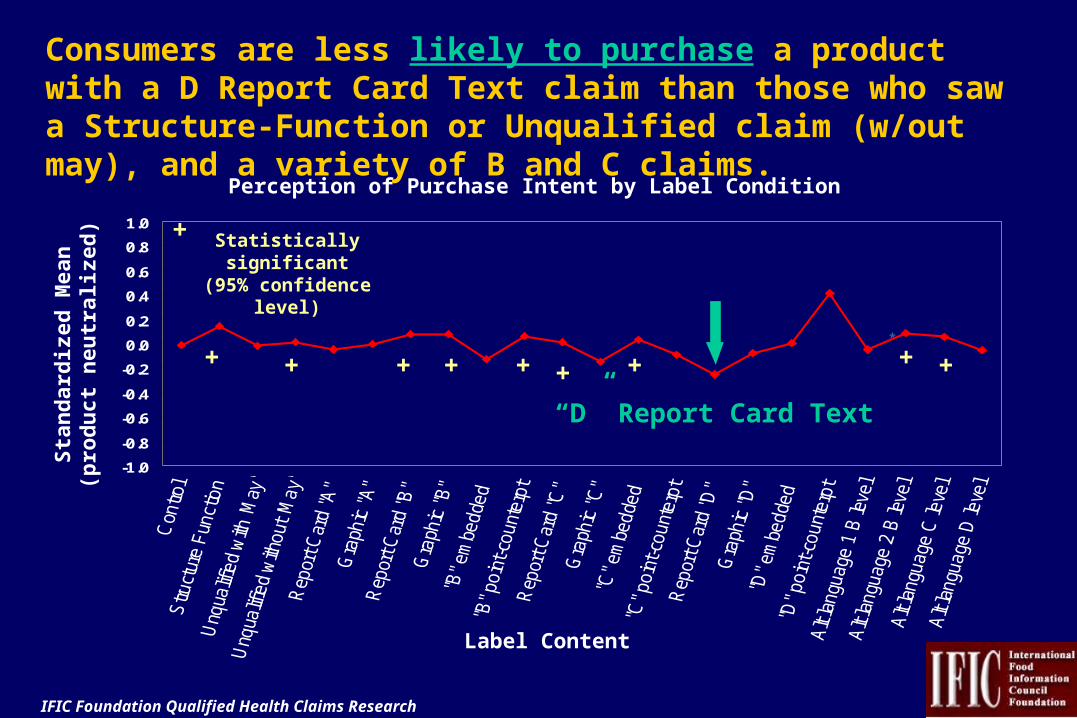
Perception of Purchase Intent by Label Condition
Label Content
-1.0
-0.8
-0.6
-0.4
-0.2
0.0
0.2
0.4
0.6
0.8
1.0
IFIC Foundation Qualified Health Claims Research http://ific.org
Sta
nd
ard
ized
Mea
n(p
rod
uct
neu
tral
ized
)
Consumers are less likely to purchase a product with a D Report Card Text claim than those who saw a Structure-Function or Unqualified claim (w/out may), and a variety of B and C claims.
Statistically significant(95% confidence level)
+
“D” Report Card Text
+ ++ + + + ++ +
Consumers rate the scientific evidence and other attributes of a product containing an unqualified claim similar to those products containing a structure-function claim or dietary guidance statement.

Perception of Scientific Evidence by Label Condition
-0.600
-0.400
-0.200
0.000
0.200
0.400
0.600
0.800
Label Content
Mea
n E
ffec
t
Control
with "May"
w/o "May"
Str-Funct
1 2
Unqualified claims (1) rated similar to structure-function claims (2) as to level of scientific evidence.
=
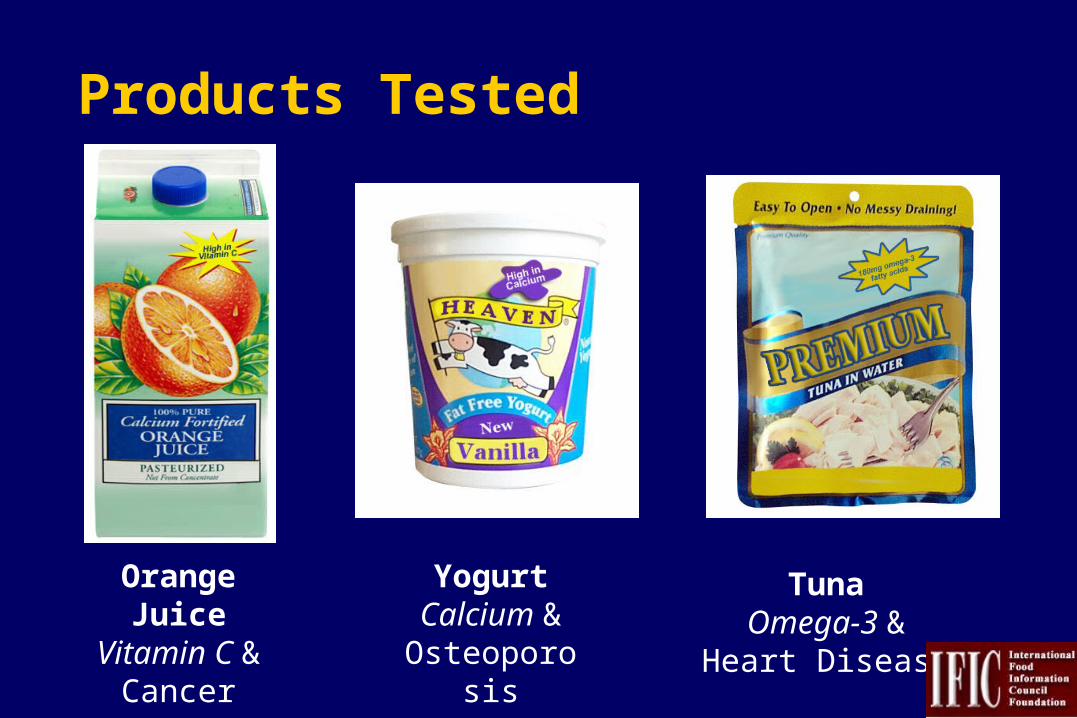
Orange JuiceVitamin C &
Cancer
YogurtCalcium &
Osteoporosis
TunaOmega-3 &
Heart Disease
Products Tested
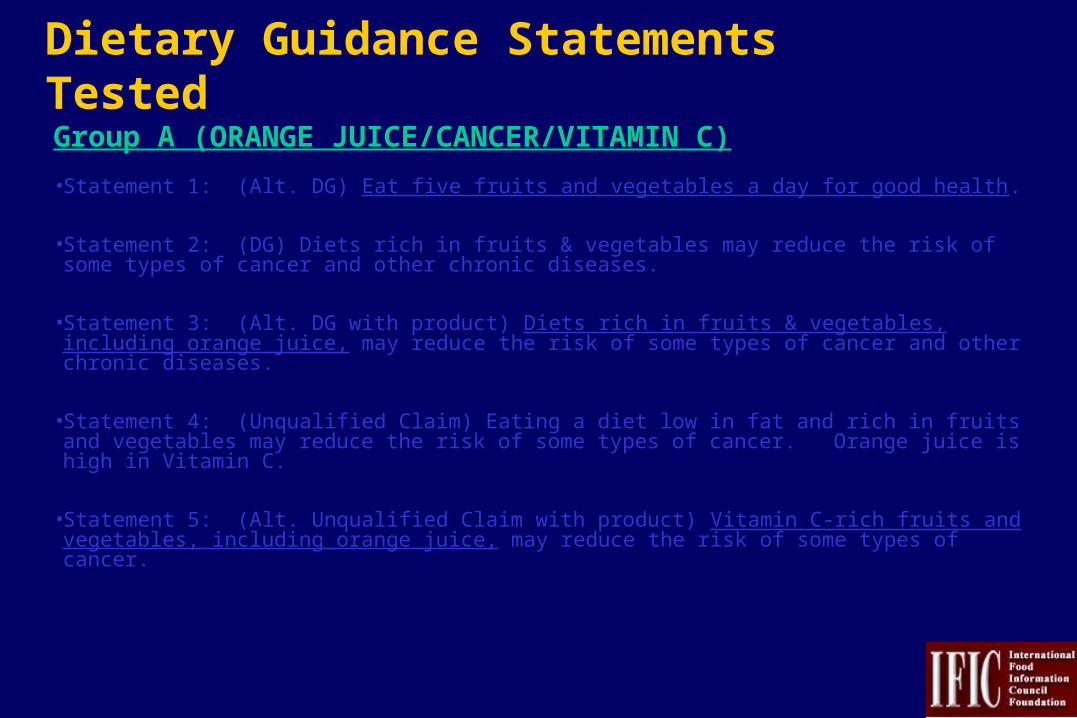
Dietary Guidance Statements Tested
Group A (ORANGE JUICE/CANCER/VITAMIN C)
•Statement 1: (Alt. DG) Eat five fruits and vegetables a day for good health.
•Statement 2: (DG) Diets rich in fruits & vegetables may reduce the risk of some types of cancer and other chronic diseases.
•Statement 3: (Alt. DG with product) Diets rich in fruits & vegetables, including orange juice, may reduce the risk of some types of cancer and other chronic diseases.
•Statement 4: (Unqualified Claim) Eating a diet low in fat and rich in fruits and vegetables may reduce the risk of some types of cancer. Orange juice is high in Vitamin C.
•Statement 5: (Alt. Unqualified Claim with product) Vitamin C-rich fruits and vegetables, including orange juice, may reduce the risk of some types of cancer.
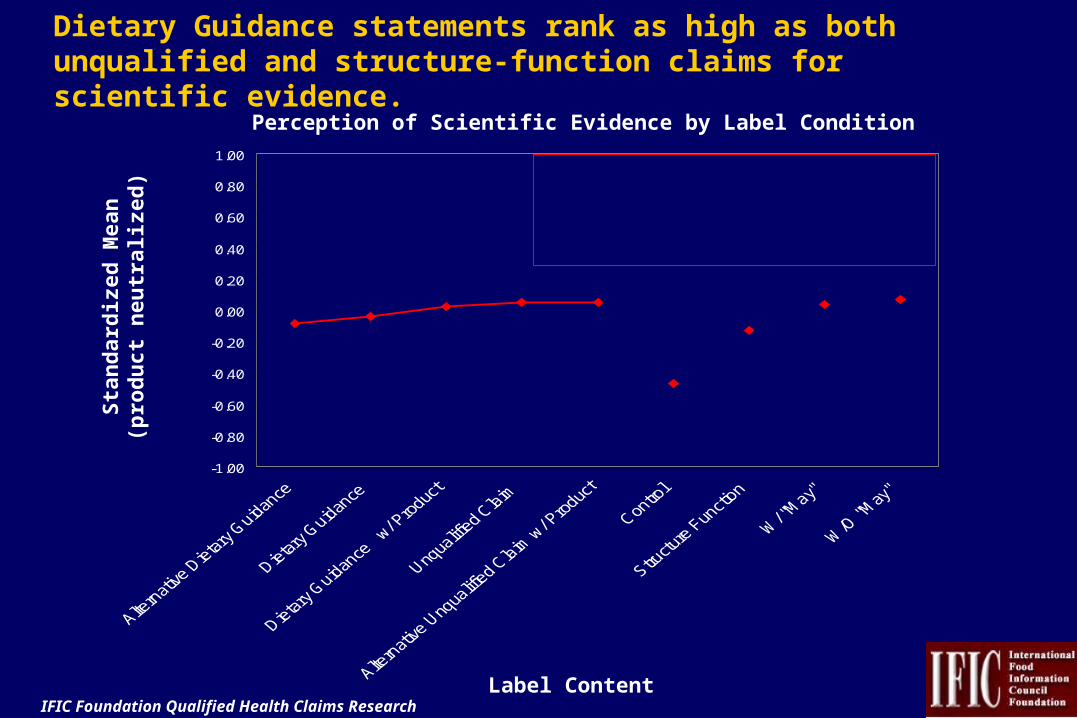
Perception of Scientific Evidence by Label Condition
Label Content
Dietary Guidance statements rank as high as both unqualified and structure-function claims for scientific evidence.
-1.00
-0.80
-0.60
-0.40
-0.20
0.00
0.20
0.40
0.60
0.80
1.00Control is the only point that is significantly lower than all the other points on this graph.
All other points, with the exception of control, are equal in consumer perception
of scientific evidence.
Sta
nd
ard
ized
Mea
n(p
rod
uct
neu
tral
ized
)
IFIC Foundation Qualified Health Claims Research http://ific.org
1. Claim type, claim level, and perceptions of a product and/or awareness of a nutrient collectively impact consumer perceptions.
2. Consumers have difficulty distinguishing among 4 levels of scientific evidence, especially with language-only claims.
3. Consumers can distinguish among 4 levels of science using report card graphic; but with negative consequences observed in consumer perception of product safety, quality, and healthfulness at lower level claims in some instances (report card graphic and text).
4. Consumers rate the scientific evidence and other attributes of a product containing an unqualified claim similar to that of products containing a structure-function claim or dietary guidance statement.
In Summary… Research Highlights
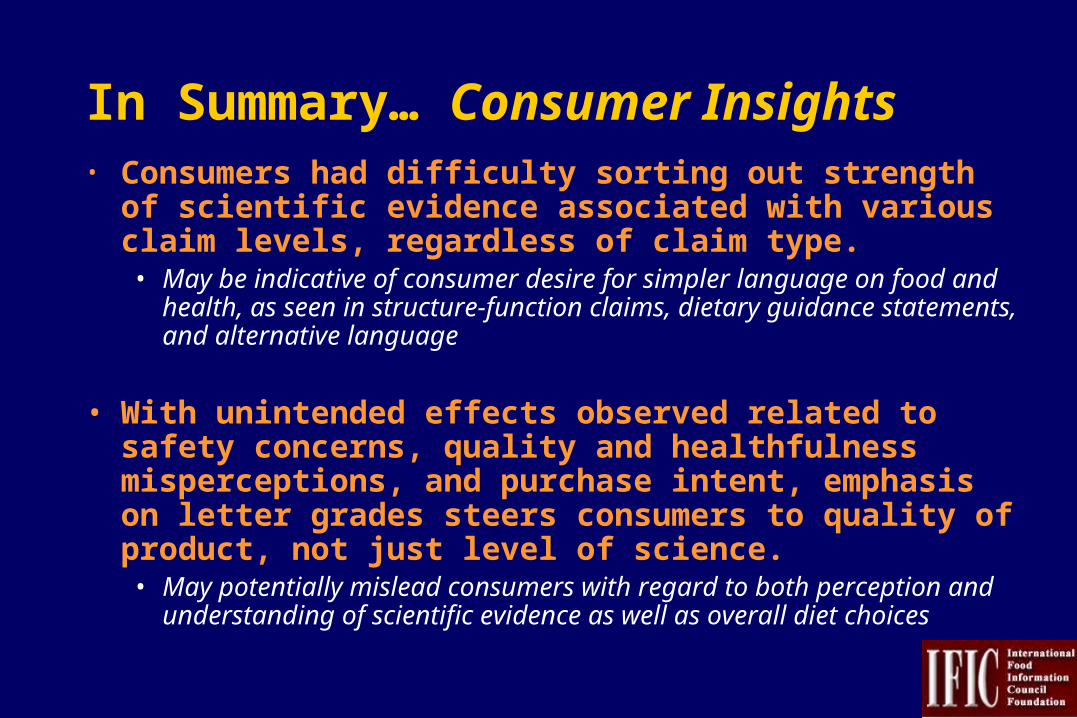
• Consumers had difficulty sorting out strength of scientific evidence associated with various claim levels, regardless of claim type.• May be indicative of consumer desire for simpler language on food and
health, as seen in structure-function claims, dietary guidance statements, and alternative language
• With unintended effects observed related to safety concerns, quality and healthfulness misperceptions, and purchase intent, emphasis on letter grades steers consumers to quality of product, not just level of science.• May potentially mislead consumers with regard to both perception and
understanding of scientific evidence as well as overall diet choices
In Summary… Consumer Insights
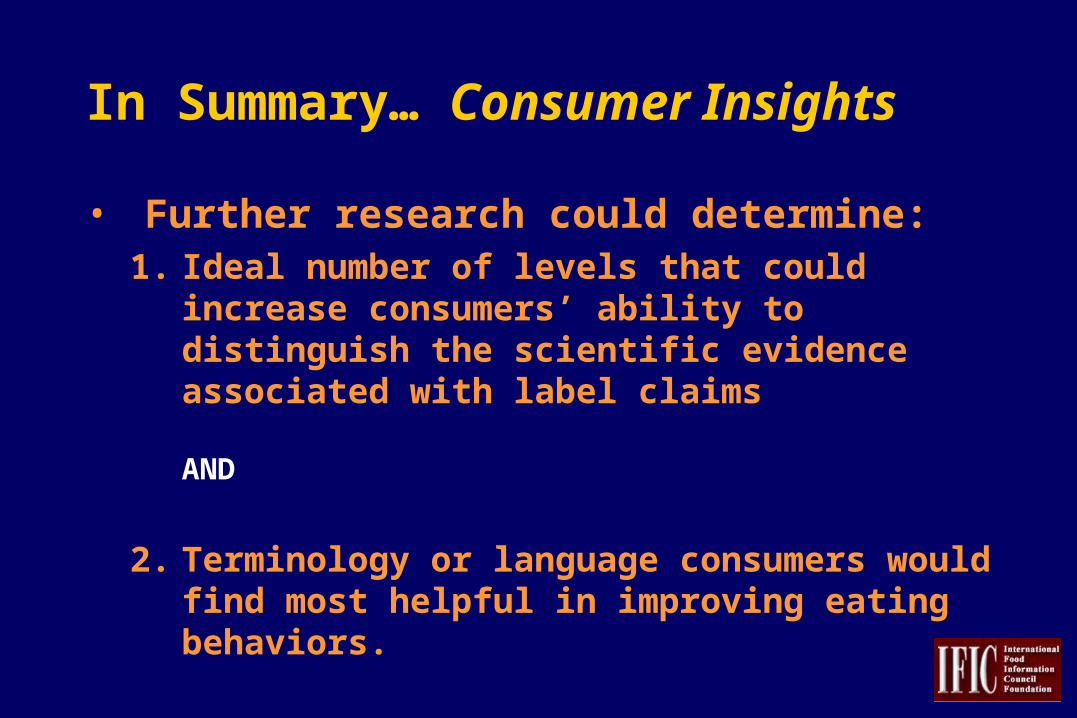
• Further research could determine:1. Ideal number of levels that could increase
consumers’ ability to distinguish the scientific evidence associated with label claims
AND
2. Terminology or language consumers would find most helpful in improving eating behaviors.
In Summary… Consumer Insights