assessing conndot’s portland cement concrete … cement concrete (pcc) testing methods ......
TRANSCRIPT
Assessing ConnDOT’sPortland Cement Concrete (PCC)
Testing MethodsFinal Report
Prepared by: John W. Henault, P.E.
March 2007
Report No. 2244-F-06-8
Connecticut Department of Transportation Bureau of Engineering and Highway Operations
Research and Materials
Keith R. Lane, P.E. Director of Research and Materials
James M. Sime, P.E. Manager of Research
A Project in Cooperation with the U.S. Department of Transportation Federal Highway Administration

ii
DISCLAIMER
The contents of this report reflect the views of the author who is
responsible for the facts and accuracy of the data presented herein. The contents
do not necessarily reflect the official views or policies of the Connecticut
Department of Transportation or the Federal Highway Administration. The report
does not constitute a standard, specification or regulation.
iii
Technical Report Documentation Page
Form DOT F 1700.7 (8-72) Reproduction of completed page authorized
1.Report No. 2244-F-06-8
2. Government Accession No. 3. Recipients Catalog No.
5. Report Date June 2007
4. Title and Subtitle
Assessing ConnDOT’s Portland Cement Concrete (PCC) Testing Methods – Final Report 6. Performing Organization Code
SPR-2244
7. Author(s) John W. Henault
8. Performing Organization Report No. 2244-F-06-8
10. Work Unit No. (TRIS)
11. Contract or Grant No. CT Study No. SPR-2244
9. Performing Organization Name and Address
Connecticut Department of Transportation Division of Research 280 West Street Rocky Hill, CT 06067-3502 13. Type of Report and Period Covered
Final Report September 2004 – June 2006
14. Sponsoring Agency Code SPR-2244
12. Sponsoring Agency Name and Address
Connecticut Department of Transportation 2800 Berlin Turnpike Newington, CT 06131-7546
15. Supplementary Notes Prepared in cooperation with the U.S. Department of Transportation, Federal Highway Administration.
16. Abstract This report presents results of a study to assess Connecticut Department of Transportation’s (ConnDOT’s) portland cement concrete (PCC) testing methods. The study was designed in order to investigate why some cured PCC specimens did not attain required 28-day strengths, although investigations of these low-strength test results revealed that many in-place PCC strengths were actually acceptable. Statistical analyses of historical data were performed with SPSS® software to identify when low-strength test results occur most often, and what PCC mix types are most problematic. Results showed that PCC rejections occur most often, on a percentage basis, during the summer months, and that higher strength mix types ( 3500 psi) are most problematic. Next, researchers made and cured test specimens side-by-side with construction inspectors to assess testing methods. Temperature and maturity probes were embedded in 6” x 12” cylindrical specimens to monitor curing. Based upon observations and data collected in the field, the author presents theories as to why PCC specimens did not attain specified strengths. The concrete maturity method for estimating strength was evaluated, and temperature profiling was performed with maturity kits. These included three different devices: Engius’ intelliRockTM II, Transtec Group’s Pocket Command CenterTM Kit, and International Road Dynamics’ (IRD) Concrete Maturity Monitor; which were compared to determine which, if any, is most appropriate for ConnDOT applications. The maturity method was also used to look at hot-weather concreting, cold-weather concreting and mass concreting operations.17. Key Words Portland Cement Concrete, PCC, Concrete Maturity Method, Hot-Weather Concreting, Cold-Weather Concreting, Mass Concrete, Concrete Temperature Profiling, Estimating Strength by the Maturity Method, ASTM C 31
18. Distribution Statement No restrictions. Hard copy of this document is available through the National Technical Information Service, Springfield, VA 22161. The report is available on-line from the National Transportation Library at http://ntl.bts.gov
19. Security Classif. (Of this report)
Unclassified
20. Security Classif.(Of this page) Unclassified
21. No. of Pages130
20.Price

iv
ACKNOWLEDGEMENTS
The Principal Investigator (PI), who authored this report, gratefully
acknowledges assistance provided by Connecticut Department of Transportation
(ConnDOT) personnel and consultants working on behalf of ConnDOT. Special thanks
are extended to Mr. Jeffery Scully who worked side-by-side with the PI testing
concrete in the field, and to Mr. Donald Larsen who reviewed two drafts of this
report. Contractor, PCC ready-mix plant and vendor cooperation are also
acknowledged and appreciated. Finally, the author, on behalf of the Division of
Research, thanks the Federal Highway Administration (FHWA) for their cooperation
and involvement in this project.
v
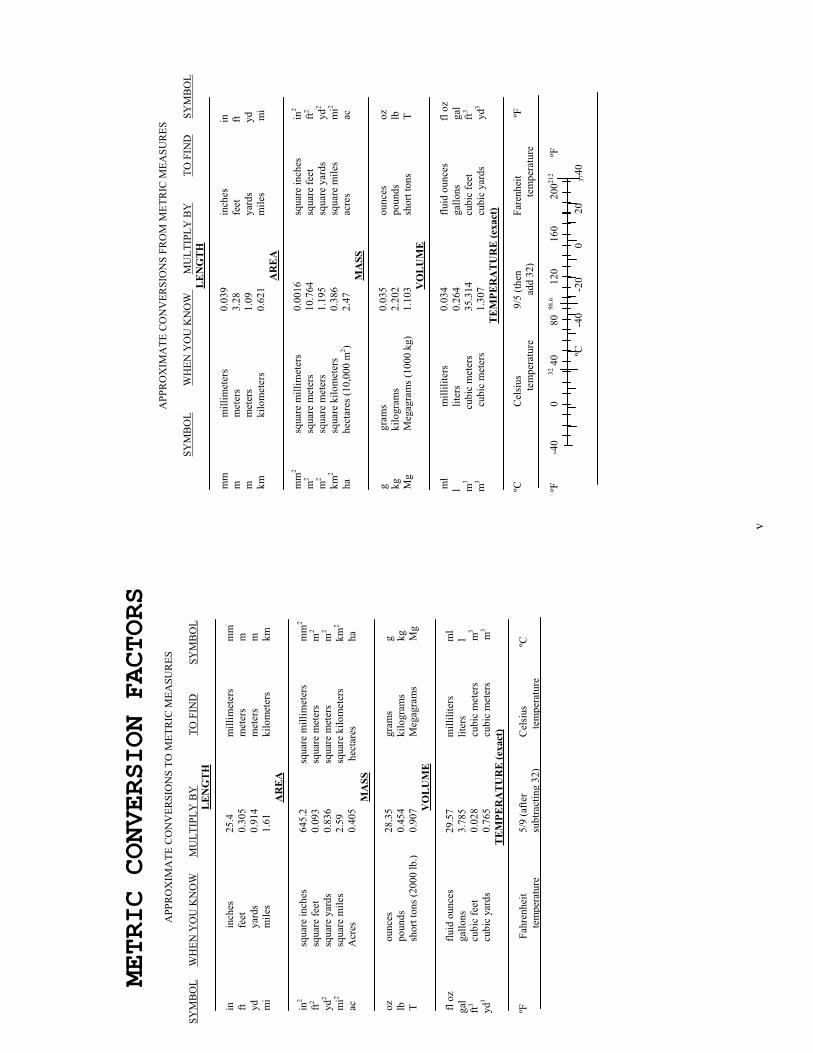
METRIC CONVERSION FACTORS
APP
RO
XIM
ATE
CO
NV
ERSI
ON
S TO
MET
RIC
MEA
SUR
ES
SYM
BO
L
WH
EN Y
OU
KN
OW
MU
LTIP
LY B
Y
T
O F
IND
S
YM
BO
LL
EN
GT
H
i
n
inch
es
25
.4
m
illim
eter
s m
m
f
t
feet
0.30
5
met
ers
m
yd
ya
rds
0.
914
m
eter
s
m
m
i
mile
s
1.61
kilo
met
ers
km
A
RE
A
i
n2
squ
are
inch
es
64
5.2
squ
are
mill
imet
ers
mm
2
f
t2
squ
are
feet
0.09
3
s
quar
e m
eter
s
m2
y
d2
squ
are
yard
s
0.83
6
s
quar
e m
eter
s
m2
m
i2
squ
are
mile
s
2.59
s
quar
e ki
lom
eter
s km
2
a
c
Acr
es
0.
405
he
ctar
es
ha
M
ASS
o
z
o
unce
s
28.3
5
gram
s
g
lb
pou
nds
0.
454
ki
logr
ams
kg
T
sh
ort t
ons (
2000
lb.)
0.90
7
Meg
agra
ms
Mg
VO
LU
ME
f
l oz
flui
d ou
nces
29.5
7
mill
ilite
rs
ml
g
al
gal
lons
3.
785
liter
s
l
ft
3
c
ubic
feet
0.
028
cubi
c m
eter
s m
3
y
d3
c
ubic
yar
ds
0.76
5
cu
bic
met
ers
m3
TE
MPE
RA
TU
RE
(exa
ct)
ºF
F
ahre
nhei
t
5/9
(afte
r
Cel
sius
ºC
te
mpe
ratu
re
subt
ract
ing
32)
te
mpe
ratu
re
APP
RO
XIM
ATE
CO
NV
ERSI
ON
S FR
OM
MET
RIC
MEA
SUR
ES
SYM
BO
L
WH
EN Y
OU
KN
OW
MU
LTIP
LY B
Y
TO
FIN
D
SY
MB
OL
LE
NG
TH
m
m
mill
imet
ers
0.
039
in
ches
in
m
m
eter
s
3.28
feet
ft
m
m
eter
s
1.09
yard
s
yd
k
m
kilo
met
ers
0.
621
m
iles
mi
AR
EA
m
m2
squ
are
mill
imet
ers
0.00
16
sq
uare
inch
es
in2
m
2
s
quar
e m
eter
s
10.7
64
sq
uare
feet
ft2
m
2
s
quar
e m
eter
s
1.19
5
squa
re y
ards
yd
2
k
m2
squ
are
kilo
met
ers
0.38
6
squa
re m
iles
mi2
h
a
h
ecta
res (
10,0
00 m
2 ) 2.
47
ac
res
ac
M
ASS
g
gram
s
0.03
5
ounc
es
oz
k
g
kilo
gram
s
2.20
2
poun
ds
lb
M
g
Meg
agra
ms (
1000
kg)
1.
103
sh
ort t
ons
T
VO
LU
ME
m
l
mill
ilite
rs
0.03
4
fluid
oun
ces
fl o
z
l
liter
s
0.26
4
gallo
ns
ga
l
m3
c
ubic
met
ers
35.3
14
cu
bic
feet
ft3
m3
cu
bic
met
ers
1.30
7
cubi
c ya
rds
yd3
TE
MPE
RA
TU
RE
(exa
ct)
ºC
Cel
sius
9
/5 (t
hen
Fa
renh
eit
ºF
tem
pera
ture
ad
d 32
)
te
mpe
ratu
re
ºF
-4
0 0
32
40
8
0 98
.6
120
1
60
200
212
ºF
ºC
-40
-20
0
2
0
37
40
vi
TABLE OF CONTENTS
Standard Title Page i
Disclaimer ii
Technical Report Documentation Page iii
Acknowledgements iv
Metric Conversion Factors v
Table of Contents vi
List of Figures viii
List of Tables xi
Introduction 1
Background and Significance 1
Problem Statement 2
Study Objectives 3
Literature Review 4
Cylindrical Test Specimens 4
Maturity Testing 6
Other Maturity Testing Literature 9
Hot-Weather Concreting Literature 11
Cold-Weather Concreting 12
Historical Data Analysis 14
Maturity Kit Comparison 20
Engius’ intelliRockTM II 20
Transtec Group’s Pocket COMMANDTM Center Kit 28
IRD’s Wireless Concrete Maturity Monitor 32
Construction Project Sites 37
Estimating Concrete Strength by the Maturity Method 39
Project 43-122 39
Project 25-133 48
vii
Project 58-285 55
A Maturity Application for Research 59
Hot-Weather Concreting 68
Project 63-579 68
Cold-Weather Concreting 76
Project 25-133 76
Project 43-122 79
Mass Concrete Applications 86
Project 63-473 86
PCC Field Testing on ConnDOT Projects 90
Conclusions 92
Assessing Concrete Testing Methods 92
Estimating Strength with Maturity 95
Temperature Profiling with Maturity Kits 97
Maturity Kit Comparisons 98
Recommendations 101
Concrete Testing Methods 101
Quality Assurance Program 102
Alternative Curing of Standard Cured Specimens 103
References 105
Appendix A 106
Appendix B 111
Appendix C 116
viii
LIST OF FIGURES
Figure 1 Bar chart showing monthly rejection rates for all four classes of concrete, combined.
15
Figure 2 Percent rejected vs. average monthly temperature. 16
Figure 3 Average 2004 monthly Class “A” concrete strengths. 18
Figure 4 Average 2004 monthly Class “F” concrete strengths. 19
Figure 5 intelliRockTM II Model KIT-02-MAT-1H28D-1R50L. 20
Figure 6 KIT-02 Reader opened to change batteries. 21
Figure 7 MAT-02-1H28D Loggers attached to reinforcing steel. 22
Figure 8 rockWareTM software. 23
Figure 9 Properties tab (left) and Notes tab (right). 23
Figure 10 Events tab (left) and Parameters tab (right). 24
Figure 11 Temperature tab. 24
Figure 12 Maturity tab. 25
Figure 13 Calibration Batch Data Worksheet. 26
Figure 14 Strength calculator worksheet. 27
Figure 15 Strength-Maturity relationship worksheet. 28
Figure 16 Adding/Editing file window. 30
Figure 17 Identify Sensors window. 31
Figure 18 Lab Maturity Data window. 31
Figure 19 View Sensors window. 32
Figure 20 Strength Calculator window. 32
Figure 21 i-Card III (left) and monitor with tag (right). 33
Figure 22 IQ32TE Tag (left) and probe (right) 33
Figure 23 Concrete Info tab (left) and Export window (right). 34
Figure 24 Concrete Types and Display Configuration options. 35
Figure 25 Maturity Method and Project Duration options. 36
Figure 26 Class “A” Modified trial batch, October 5, 2004. 40
Figure 27 Class “F” trial batch, October 5, 2004. 41
ix
Figure 28 Class “F” trial batch, October 26, 2004. 44
Figure 29 intelliRockTM probe installed in Bridge 181 WW 2A parapet sections (2nd and 4th).
47
Figure 30 Research staff testing concrete side-by-side with consultant inspector at Project 43-122.
47
Figure 31 Concrete for sidewalk and 6”x12” specimens. 56
Figure 32 Forms for concrete blocks. 59
Figure 33 Obtaining drilled cores from concrete blocks. 60
Figure 34 Logarithmic plot of mix CTCF2H data. 62
Figure 35 Normal plot of mix CTCF2H data. 62
Figure 36 Best-fit logarithmic regression curve for mix CTCF2H data.
63
Figure 37 Drilled cores after compression tests. 63
Figure 38 Logarithmic plot of mix CTCFAH data. 65
Figure 39 Normal plot of mix CTCFAH data. 65
Figure 40 Best-fit logarithmic regression curve for mix CTCF2H data.
66
Figure 41 Temperature versus time comparisons between blocks CTCF2H (no fly ash) and CTCFAH (w/ fly ash).
67
Figure 42 Hot-Weather Concreting at Project 63-595. 68
Figure 43 Temperature vs. Time for Hot-Weather Pour, July 29, 2005 [Class A Modified].
69
Figure 44 Maturity vs. Time for Hot-Weather Pour [Class A Modified].
70
Figure 45 Companion specimen with probe installed cured alongside acceptance specimens.
71
Figure 46 Temperature vs. Time for August 3, 2005 Pour [Class A Modified].
72
Figure 47 Maturity vs. Time for August 3, 2005 Pour [Class A Modified].
73
Figure 48 August 4th Pour at Project 63-579 in Hartford. 74
Figure 49 Temperature vs. Time for August 4, 2005 Pour [Class A Modified]
75
Figure 50 Cold-Weather concreting at Project 43-122. 76

x
Figure 51 Temperature vs. Time for February 3, 2005 Pour [Class F].
77
Figure 52 Maturity vs. Time for February 3, 2005 Pour[Class F].
78
Figure 53 Temperature vs. Time for Cold Weather Pour at Project 43-122 showing effect of 6-inch and 12-inch cover over probes [Class F].
80
Figure 54 Maturity vs. Time for Cold-Weather Pour at Project 43-122 showing effects of 6-inch and 12-inch cover over probes [Class F].
81
Figure 55 Bridge 182 SB Deck. Hot water hoses over rebar (left), and then covered in blankets (right).
83
Figure 56 Probes installed in deck at top and bottom. 83
Figure 57 Concrete Temperatures inside Bridge 182 SB Deck [Class F].
84
Figure 58 Concrete Maturities inside Bridge 182 SB Deck[Class F].
85
Figure 59 Bridge 1629 Stage 2 Footing for Abutment 2/Wingwall 2B.
86
Figure 60 Bridge 1629, Concrete Temperature versus Time [Class “A” (25% slag)].
88
Figure 61 Bridge 1629 Footing, Maturity versus Time for center and 5-inch cover sensors versus standard cured specimen.
89
Figure C-1 Photo of curing box with 9 specimens inside. 117
xi
LIST OF TABLES
Table 1 1997 to 2004 Summary of CMR and SiteManager PCC Compression Test Results for 6” x 12” Test Specimens (All Mix Classes).
14
Table 2 Summary of Work Performed. 38
Table 3 Laboratory Test Results for Suzio Class “A” Modified Trial Batch Sampled on October 5, 2004.
39
Table 4 Laboratory Test Results for Suzio Class “F” Trial Batch Sampled on October 5, 2004.
40
Table 5 Field Test Results for Suzio Trial Batches Sampled on October 5, 2004.
41
Table 6 Drilled Core Compressive Strengths versus Estimated Strengths by the Maturity Method for Suzio Trial Batches.
43
Table 7 Field Test Results for Suzio Class “F” Trial Batch Sampled on October 26, 2004.
44
Table 8 Laboratory Test Results for Suzio Class “F” Trial Batch Sampled on Oct 26, 2004.
45
Table 9 Field Test Results for Samples Taken from Project 43-122.
46
Table 10 Estimated Suzio Class “F” Concrete Strengths by the Maturity Method Applied to Field Cured Cylinders.
46
Table 11 Estimated Suzio Class “A” Modified Strengths by the Maturity Method Applied to Field Cured Cylinders.
47
Table 12 Laboratory Test Results for Tilcon-New Britain Class “F” Trial Batch Sampled on February 25, 2005.
49
Table 13 Laboratory Test Results for Tilcon-New Britain “Pavement” Concrete Trial Batch Sampled on February 25, 2005.
49
Table 14 Field Test Results for Tilcon-New Britain Trial Batches Sampled on February 25, 2005.
49
Table 15 Curve Fit Coefficients for Tilcon-New Britain Trial Batches Sampled on February 25, 2005.
50
Table 16 Drilled Core Compressive Strengths versus Estimated Strengths by the Maturity Method for Tilcon-New Britain Trial Batches Sampled on February 25, 2005.
50
Table 17 Field Tests Performed on Tilcon-New Britain “Pavement” Concrete Sampled on April 6, 7 and 20th, 2005.
52
xii
Table 18 Laboratory Test Results for Tilcon-New Britain“Pavement” Concrete Sampled at Sta 14+600 WB.
52
Table 19 Laboratory Test Results for Tilcon-New Britain“Pavement” Concrete Sampled at Sta 14+660 WB.
53
Table 20 Laboratory Test Results for Tilcon-New Britain “Pavement” Concrete Sampled at Sta 15+140 WB.
53
Table 21 Laboratory Test Results for Tilcon-New Britain“Pavement” Concrete Sampled at Sta 14+532 EB.
54
Table 22 Laboratory Test Results for Tilcon-New Britain“Pavement” Concrete Sampled at Sta 14+320 EB.
54
Table 23 Estimated Tilcon-New Britain “Pavement” Concrete Strengths by the Maturity Method Applied to Field Cured Cylinders.
55
Table 24 Field Tests Performed on Tilcon-Groton Class “F” Concrete Sampled on May 10, 16 and 17, 2005.
56
Table 25 Laboratory Test Results for Tilcon-Groton Class “F” Concrete Sampled on May 10, 2005.
57
Table 26 Curve Fit Coefficients for Tilcon–Groton Class “F” Concrete.
57
Table 27 Laboratory Results for Class “F” Sample Cast May 16, 2005.
58
Table 28 Laboratory Test Results for Class “F” Sample Cast May 17, 2005.
58
Table 29 Field Test Results for Batches CTCF2H and CTCFAH. 60
Table 30 Compressive Strength Test Results for Mix CTCF2H. 61
Table 31 Compressive Strength Test Results for Mix CTCFAH. 64
Table 32 Compressive Strengths for July 26, 2005 Pour [Class “A” Modified].
71
Table 33 Compressive Strengths for August 3, 2005 Pour [Class “A” Modified].
73
Table 34 Compressive Strengths for August 4, 2005 Pour [Class “A” Modified].
75
Table 35 Compressive Strength Data, February 3, 2005 Pour [Class “F” Concrete].
79
Table 36 Project 43-122 Cold-Weather Strengths for Concrete Poured on February 1, 2005 [Class “F”].
82
xiii
Table B-1 Batch Weights per Cubic Yard, Suzio – New Haven. 111
Table B-2 February 25, 2005 Batch Weights for Pavement and Class “F” Concretes, Tilcon – Plainville.
112
Table B-3 Comparisons of Trial Mix and Field Concrete Batch Weights per Cubic Yard, Tilcon – Plainville.
113
Table B-4 Batch Weights per Cubic Yard for Class “F” Concrete use for Sidewalk on Project 58-285.
114
Table B-5 Batch Weights for Mixes CTCF2H and CTCFAH. 115
1
INTRODUCTION
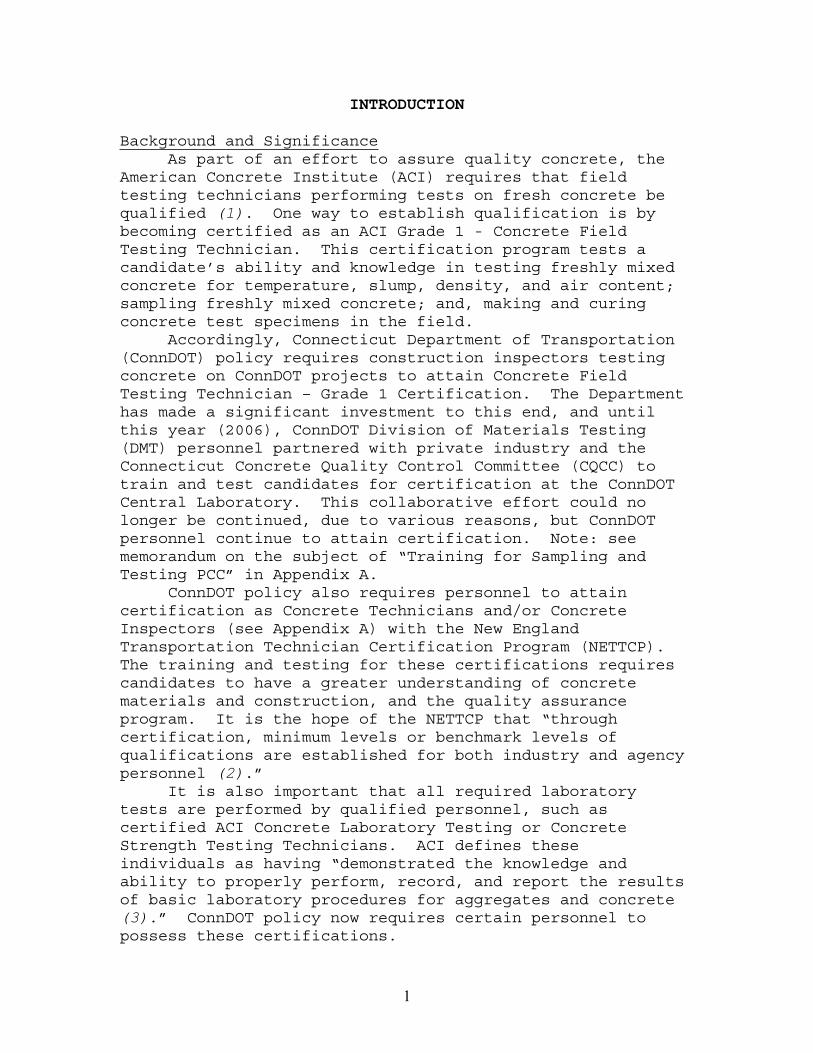
Background and SignificanceAs part of an effort to assure quality concrete, the
American Concrete Institute (ACI) requires that field testing technicians performing tests on fresh concrete be qualified (1). One way to establish qualification is by becoming certified as an ACI Grade 1 - Concrete Field Testing Technician. This certification program tests a candidate’s ability and knowledge in testing freshly mixed concrete for temperature, slump, density, and air content; sampling freshly mixed concrete; and, making and curing concrete test specimens in the field.
Accordingly, Connecticut Department of Transportation (ConnDOT) policy requires construction inspectors testing concrete on ConnDOT projects to attain Concrete Field Testing Technician – Grade 1 Certification. The Department has made a significant investment to this end, and until this year (2006), ConnDOT Division of Materials Testing (DMT) personnel partnered with private industry and the Connecticut Concrete Quality Control Committee (CQCC) to train and test candidates for certification at the ConnDOT Central Laboratory. This collaborative effort could no longer be continued, due to various reasons, but ConnDOT personnel continue to attain certification. Note: see memorandum on the subject of “Training for Sampling and Testing PCC” in Appendix A.
ConnDOT policy also requires personnel to attain certification as Concrete Technicians and/or Concrete Inspectors (see Appendix A) with the New England Transportation Technician Certification Program (NETTCP).The training and testing for these certifications requires candidates to have a greater understanding of concrete materials and construction, and the quality assurance program. It is the hope of the NETTCP that “through certification, minimum levels or benchmark levels of qualifications are established for both industry and agency personnel (2).”
It is also important that all required laboratory tests are performed by qualified personnel, such as certified ACI Concrete Laboratory Testing or Concrete Strength Testing Technicians. ACI defines these individuals as having “demonstrated the knowledge and ability to properly perform, record, and report the results of basic laboratory procedures for aggregates and concrete (3).” ConnDOT policy now requires certain personnel to possess these certifications.

2
ConnDOT uses three different types of concrete for structures. These include Class “A”, Class “C”, and Class “F”. The specified minimum 28-day strength for Class “A” concrete is 3000 psi, the minimum for Class “C” concrete is 3000 psi, and the minimum for Class “F” concrete is 4000 psi. For pavement, ConnDOT uses a “Pavement” concrete with a specified minimum strength of 3500 psi.
Unfortunately, strength test results do not always indicate conformance to specifications, even when proper equipment and methods are used by qualified personnel.When strength test results are lower than what is specified, further investigation is required. These investigations may include tests of drilled cores, evaluation of strength based upon Windsor Probe testing, or Swiss Hammer testing.
In recent years, several state highway agencies have researched the use of the concrete maturity concept as a nondestructive method for measuring in-place, real time concrete strength. The maturity meter system includes sensors, which are embedded in the concrete to measure temperature at specified times, and a data acquisition system to record these data. Once the system is calibrated to the concrete mix-design in question, a time-temperature history is used to predict a structure’s concrete strength (4). This would be helpful in determining whether a structure is capable of being put in service, when to remove forms or shoring, for checking the adequacy of curing methods, or for investigating low strength test results.
Problem StatementIn response to a Research Needs Statement (RNS)
prepared by a ConnDOT DMT Supervising Materials Testing Engineer this research project was proposed for inclusion in the State Planning and Research (SPR) Work Program in August 2004. It was proposed because, in spite of the Department’s efforts to assure quality concrete through training and certification programs, unacceptable rates of rejections for PCC still existed. When rejections occurred, subsequent investigations of low-strength test results often indicated that the in-place concrete met specifications. This suggests test specimens did not represent the in-place concrete, probably as a result of an improper cure. In other instances, investigations indicated the in-place concrete strength was marginal, which made it difficult to determine what factor(s) were to blame. Were the mixture proportions inadequate, or did the
3
specimen not attain its required strength in 28-days because it was improperly cured?
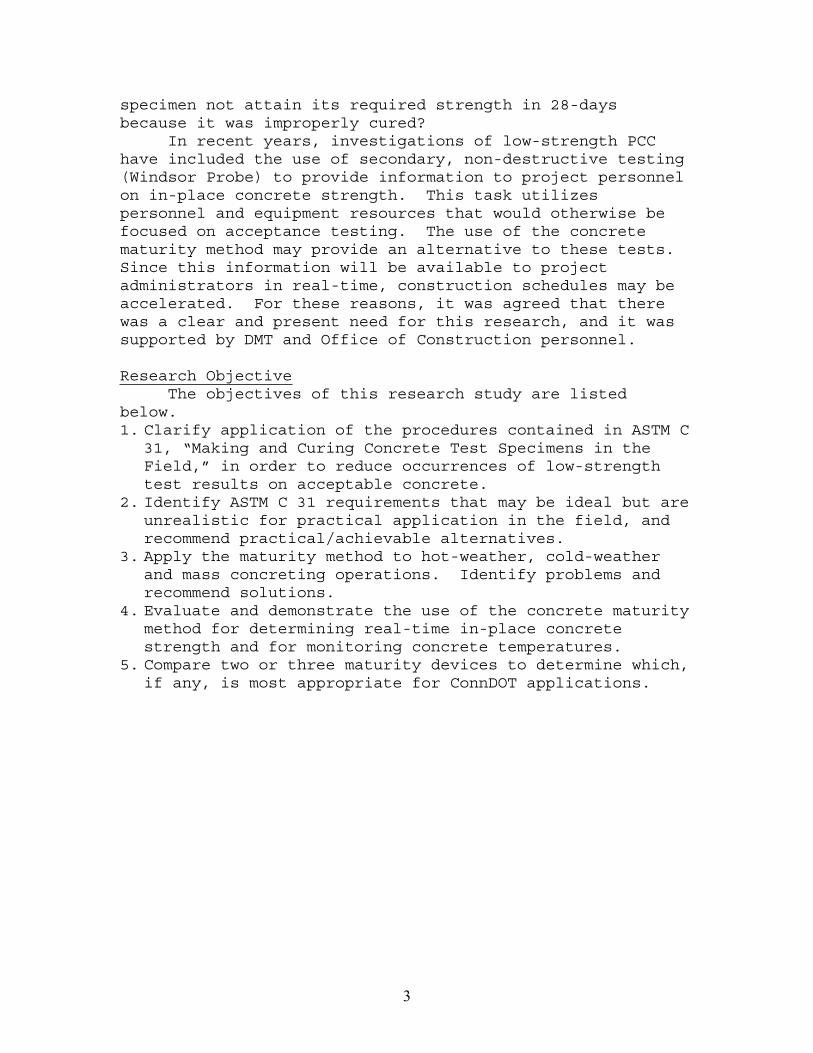
In recent years, investigations of low-strength PCC have included the use of secondary, non-destructive testing (Windsor Probe) to provide information to project personnel on in-place concrete strength. This task utilizes personnel and equipment resources that would otherwise be focused on acceptance testing. The use of the concrete maturity method may provide an alternative to these tests.Since this information will be available to project administrators in real-time, construction schedules may be accelerated. For these reasons, it was agreed that there was a clear and present need for this research, and it was supported by DMT and Office of Construction personnel.
Research ObjectiveThe objectives of this research study are listed
below.1. Clarify application of the procedures contained in ASTM C
31, “Making and Curing Concrete Test Specimens in the Field,” in order to reduce occurrences of low-strength test results on acceptable concrete.
2. Identify ASTM C 31 requirements that may be ideal but are unrealistic for practical application in the field, and recommend practical/achievable alternatives.
3. Apply the maturity method to hot-weather, cold-weather and mass concreting operations. Identify problems and recommend solutions.
4. Evaluate and demonstrate the use of the concrete maturity method for determining real-time in-place concrete strength and for monitoring concrete temperatures.
5. Compare two or three maturity devices to determine which, if any, is most appropriate for ConnDOT applications.
4
LITERATURE REVIEW
Cylindrical Test Specimens Since the first study objective was to clarify the application of the procedures contained in ASTM C 31, “Making and Curing Test Specimens in the Field,” the standard practice is worth reviewing in detail. ASTM C 31 “… covers procedures for making and curing cylinder and beam specimens from representative samples of fresh concrete for a construction project.” The focus of this discussion will be on cylinder specimens, because beam specimens are not required for ConnDOT projects. The significance and intended use of ASTM C 31 is to provide “… standardized requirements for making, curing, protecting, and transporting concrete test specimens under field conditions.” There are two methods for curing cylinder specimens, standard cured and field cured. It is important to note the ASTM C 31 practice states only standard cured specimen test results are to be used for acceptance testing for specified strength. Other purposes include checking the adequacy of the mix for strength, and quality control. The practice states that test results from field cured specimens are intended for 1) determining whether a structure is capable of being put in service, 2) comparison with test results of standard cured specimens or with test results from various in-place test methods, 3) checking the adequacy of curing and protection of concrete in the structure, or 4) determining when to remove forms or shoring. ASTM C 31 includes requirements for specimen dimensions. The practice states that cylinders used for acceptance testing for specified strength shall be 6 x 12 in., unless 4 x 8 in. specimens are specified by the owner or agency. ConnDOT currently specifies the use of only 6 x 12 in. cylinders. ASTM C 31 also states “the field technicians making and curing specimens for acceptance testing shall be certified ACI Field Testing Technicians, Grade I or equivalent.” In keeping with this requirement, ConnDOT concrete inspectors are required to attain individual certification. Procedures contained within ASTM C 172, “Practice for Sampling Freshly Mixed Concrete,” are to be used for obtaining samples used to fabricate test specimens. Field technicians are required to “record the identification of the sample with respect to the location of the concrete represented and the time of casting.”
5
Tests for slump, air content and temperature are required whenever specimens are made. These tests must be performed in accordance with their respective ASTM standards. Detailed procedures for molding specimens are provided. These procedures include requirements for identifying the specimens to ensure they represent the concrete in question. Procedures for curing specimens are divided into two1
primary sections: Standard Curing and Field Curing. Standard curing procedures include requirements for storage, initial curing and final curing. Standard cured cylinders are to be stored on a level surface, within ¼ in. per ft along a horizontal plane. Initially, for a period up to 48 hours, these specimens are to be kept “… in a temperature range from 60 and 80°F and in an environment preventing moisture loss …” If the specified strength is 6000 psi or greater, the initial temperature range is more stringent, between 68 and 78°F. Once the initial curing period is complete and within 30 minutes of removing the molds, standard cured specimens are to be cured “… with free water maintained on their surfaces at all times at a temperature of 73 +/- 3°F …” Final curing temperatures must be maintained until 3 hours prior to test, when specimens may be stored at a temperature between 68 and 86°F, provided free moisture continues to be maintained on their surfaces (spray with water and cover with wet burlap). The practice states that field cured cylinders are to be stored “in or on the structure as near to the point of deposit of the concrete represented as possible.” Once these specimens have been stored, they are required to be kept in an environment as near as possible to the structure they represent. In order to determine when a structure is capable of being put in service, molds are required to be stripped at the same time forms are removed. The practice specifies that standard cured specimens not be transported until at least 8 hours after final set2.During transporting, the specimens must be protected from damage from jarring, cold weather and moisture loss. It also states “transportation time shall not exceed 4 hours.” Finally, technicians are required to report the specimen identification number; location of concrete represented; date, time and name of individual molding specimens; slump, air content and concrete temperature test
1 A third section is also included for Structural Lightweight Concrete, which refers to ASTM C 330. 2 Setting time may be measured by ASTM C 403.
6
results; and, curing method. For standard cured specimens, technicians are required to “report the initial curing method with maximum and minimum temperatures and final curing method.” For field cured specimens, technicians are required to “report the location where stored, manner of protection from the elements, temperature and moisture environment, and time of removal from molds.” Compressive strength test results of standard cured cylindrical concrete specimens, made and cured in accordance with ASTM C 31, have been used for acceptance testing for specified strength since the early 1920’s. Of course, these test results only provide an estimate of the in-situ concrete compressive strength because of differences in a structure’s geometry and environmental conditions experienced. Once cylinder specimens have been made and cured, they are tested for strength by applying a compressive axial load in accordance with ASTM C 39, “Compressive Strength of Cylindrical Concrete Specimens.” A detailed review of this standard practice is not necessary, but Section 6, “Specimens”, will be discussed. Section 6 requires individual specimen diameters to be within 2% of one another, or else they shall not be tested.Specimens shall not depart from perpendicularity by more than approximately 1/8 in. in 12 in. ConnDOT procedures permit capping of compression test specimens in accordance with ASTM C 1231, “Use of Unbonded Caps in Determination of Compressive Strength of Hardened Concrete Cylinders.” This standard practice requires ends of specimens to be plane within 0.20 inches, a much less stringent requirement than that for uncapped specimens of 0.002 inches.
Maturity Testing Another main objective of this research project was to evaluate and demonstrate the use of the concrete maturity method for determining real-time in-place concrete strength. Accordingly, a detailed discussion of this practice is also appropriate as part of this literature review. ASTM Designation C 1074, first published in 1987, “provides a procedure for estimating concrete strength by means of the maturity method.” The maturity method requires the use of a maturity index, which can be “expressed either in terms of the temperature-time factor or in terms of the equivalent age at a specified temperature.” Before the method is used to estimate in-place concrete strength, a strength-maturity relationship, developed by laboratory tests on the concrete
7
mixture in question, must be established. Next, the temperature of the field concrete is monitored by embedding sensors into the fresh concrete and collecting temperature/time data. These data are used to calculate the maturity index of the field concrete. Finally, the maturity index of the field concrete is compared to the strength-maturity relationship, and the strength of the field concrete is estimated. These estimates of strength can be used for purposes of starting the following critical construction activities:
1. Removing formwork and reshoring, 2. Post-tensioning of tendons, 3. Termination of cold weather protection, and 4. Opening of roadways to traffic.
The practice states that there are some major limitations to the method, including:
1. Maintaining the concrete in a condition that permits hydration,
2. The effects of early-age concrete temperature are not taken into account when estimating the long-term ultimate strength, and
3. Estimates of strength must be supplemented by other indications.
When the maturity index is expressed in terms of the temperature-time factor (TTF), the maturity function is computed as follows:
M(t)= (Ta-To) t
where:
M(t) = the temperature-time factor at age t, degree-days or degree-hours,
t = a time interval, days or hours, Ta = average concrete temperature during time interval,
t, °C, and To = datum temperature, °C.
When the maturity index is expressed in terms of the equivalent age at a specified temperature, the maturity function is computed as follows:
te = e-Q[(1/Ta) – (1/Ts)] t
where:
8
te = equivalent age at a specified temperature Ts, daysor hours,
Q = activation energy divided by the gas constant, K, Ta = average temperature of concrete during time
interval t, Kelvin, Ts = Specified temperature, Kelvin, and t = time interval, days or hours.
Either thermocouple or themistor type devices are acceptable for monitoring concrete temperatures as a function of time. For the first 48 hours, the recording interval shall be no greater than ½ hour. Thereafter, the time interval shall not exceed 1 hour. The use of commercial maturity instruments, “that automatically compute and display either temperature-time factor or equivalent age,” are also permitted. The procedure to develop the strength maturity relationship requires that at least 15 cylindrical specimens be prepared from similar concrete whose strength is to be estimated. Next, temperature sensors are embedded into at least two of the specimens for monitoring. Then, the specimens are moist cured in a water bath or moist room. Specimens are compression tested at 1, 3, 7, 14, and 28 days. Two specimens are compression tested at each age and compared to see if the difference in strength between them exceeds 10% of their average strength. If it does, then a third specimen is tested and the average strength of the three is used, otherwise, the average of the two specimens is sufficient. At each test age, the maturity index is determined for each cylinder monitored and the average is calculated.Then, the average compressive strength is plotted versus maturity for each test age. A best-fit curve is drawn and used for estimating the strength of concrete in the field.This curve is called the strength-maturity relationship. Once the strength-maturity relationship is developed, temperature or maturity sensors can be embedded into field concrete in order to estimate the in-place strength. When determining when to begin critical construction operations, sensors should be installed “at locations in the structure that are critical in terms of exposure conditions and structural requirements.” The compressive strength is estimated by determining the maturity index and finding its corresponding compressive strength from the strength-maturity best-fit curve.
9
Finally, the practice states that before performing critical operations, such as formwork removal or post-tensioning, other tests shall be performed “to ensure that the concrete in the structure has a potential strength that is similar to that of the concrete used to develop the strength-maturity relationship.” These include in-place tests, such as Penetration Resistance of Hardened Concrete (ASTM C 803), Compressive Strength of Concrete Cylinders Cast in Place in Cylindrical Molds (ASTM C 873), Pullout Strength of Hardened Concrete (ASTM C 900) or Break-Off Number of Concrete (ASTM C 1150). Other appropriate techniques include the use of early-age compressive strength tests in accordance with ASTM C 918, and “compressive strength tests on specimens molded from samples of the concrete as-delivered and subjected to accelerated curing in accordance with [ASTM C 684].”
Other Maturity Method Literature In the summer of 2000, Tepke and Tikalsky distributed a 12-question concrete maturity survey to representatives of all the state highway agencies (SHAs) (6). Of the 50 states queried, 44 responded. Tepke reported that approximately 73 percent of states that responded indicated that they had or were currently involved in at least minor research with concrete maturity, and that about 30 percent had protocol or specifications governing its use. They correctly reported that the concrete maturity concept had not been researched in Connecticut, but indicated that ConnDOT officials were interested in maturity uses in other cold-weather states. South Dakota was the only state that indicated they used basic temperature data for monitoring cold-weather concreting. Of the six New England states, Rhode Island DOT was the only SHA reported to use the concrete maturity method. They use it to approve mixtures before 28-days.Maine, New Hampshire and Vermont all indicated that they had conducted concrete maturity research. Maine and New Hampshire deemed the method unnecessary for their applications, and Vermont reported that maturity is not commonly used on their projects. Massachusetts responded that they do not use the method and had not researched it.None of the New England states had a protocol for maturity method usage at the time of the survey (6). In the northeast, New Jersey and Pennsylvania DOTs appear to have the most experience with the maturity method, and survey results from both states on the use of the concept was positive (6). The consensus of New Jersey

10
DOT materials engineers was that the maturity method will provide better in-situ concrete strength estimates than cylindrical specimens (6), and Pennsylvania DOT funded further research on the concept to identify practical applications of the method for monitoring concrete temperatures and estimating concrete strength (7). Overall, a mixed response was received by the 44 states surveyed regarding the effectiveness of the maturity method. For example, Oklahoma officials reported that a protocol had not been adopted because they believed the method worked poorly and was cumbersome. They also indicated contractor feedback was negative. Conversely, South Dakota reported that a protocol was established because the method performed well, and they indicated contractor feedback was positive. Tepke concluded that most SHAs were not using the maturity method to its full potential; however, the survey was conducted during the summer of 2000, and some SHAs have reconsidered the concept since that time. For example, a well documented concrete maturity success story occurred during the year 2002 in Oklahoma (the state where officials responded they believed the method worked poorly). A bridge carrying Interstate 40 traffic over the Arkansas River was hit by a barge, causing four approach spans to collapse and putting the bridge out of service. The loss of this vital bridge, which is a major east-west transportation link, cost millions in commercial revenue and lost time. Rapid reconstruction was needed. One of the technologies employed was the concrete maturity method for estimating concrete strength (5). The Oklahoma Department of Transportation and contractor used the maturity method to estimate the in-place concrete strength to allow for the early removal of formwork, which helped contribute to completing the work 10 days ahead of schedule and just slightly over 2 months after the accident (5). In 2004, the aforementioned research in Pennsylvania (7) was published in the Journal of the Transportation Research Board. Two of the issues addressed in the paper included differences in strength-maturity relationships when slightly different mixture proportions were used, and temperature history profiles for various transportation structures. In their conclusions, they indicated that strength-maturity relationships were not significantly altered by slightly different (+/-5%) mixture proportions or water to cementitious material ratios. They also concluded that
11
high concrete temperatures significantly reduced long-term concrete strengths (7). The later conclusion may explain some of ConnDOT’s low strength test results occurring in warmer weather.
Hot-Weather Concreting Literature Weather conditions during concrete placement and curing operations play a significant role in the performance of concrete structures. Accordingly, precautions must be taken to account for hot, cold, windy, dry and humid conditions. If appropriate measures are taken, the quality of the concrete may not be compromised (8). Hot-weather conditions can be problematic to both contractors performing concrete work and to inspectors making and curing test specimens. High ambient temperatures can result in high concrete temperatures, which are potentially detrimental to concrete quality, including its ultimate compressive strength. The primary reason hot-weather poses a problem is that “the rate of hydration of portland cement varies exponentially with temperature (9).” Hover (9) indicated concrete poured at 90°F will hydrate at twice the speed as concrete poured at 70°F. High temperatures increase demand for water and accelerate slump loss, which often leads to the contractor adding water at the job site for better concrete workability. The water added under these conditions does not replace water lost to evaporation during transit (a common misconception). Instead, it replaces water consumed during hydration (9). Note: surface evaporation does occur later during finishing operations. Contractors must contend with faster setting rates and have more difficulties placing and finishing concrete work, as the concrete continues to hydrate and water begins to evaporate from the surface. In order to compensate, finishers will often sprinkle water onto the concrete surface (“bless”). This reduces the abrasion resistance of the concrete, but if it is done soon enough, it can make the surface more finishable as it breaks bonds between cement particles and pushes them further apart from one another. Hover (9) indicated that for certain applications and service conditions; an overall beneficial trade-off can be realized between surface texture and abrasion resistance, and so “blessing” the concrete is not always detrimental (overall). For this reason, the practice of
12
“blessing” should not be completely forbidden, but it should be avoided. In order to reduce surface drying, contractors should use fogging to raise the local relative humidity near the surface (9). Care must be taken to avoid accumulations of flowing or standing water, and “fog-water” should not be finished-into the concrete. The spray application of curing compounds make an excellent “intermediate” curing method between fogging and moist curing (9), as they reduce the rate of evaporation. Moist curing with wet burlap or other absorbent materials should commence as soon as final set is achieved. ConnDOT’s Standard Specification for Roads, Bridges, and Incidental Construction (FORM 816) currently requires fogging and moist curing for bridge deck applications. Inspectors must be sure to obtain representative concrete samples after any water is added at the jobsite in order to account for higher water to cement ratios, which decreases concrete strength. Tests for slump, concrete temperature and air content should be performed expeditiously. Test specimens should also be made expeditiously and protected from sun, wind and rapid evaporation in accordance with ASTM C 31. In order to meet initial curing temperature conditions (60°F to 80°F) specified in ASTM C 31, specimens should be kept on site in temperature controlled curing boxes. Hover (9) reported that such boxes are rare and has commonly seen specimens in black plastic molds sitting in the hot summer sun.
Cold-Weather Concreting ConnDOT Form 816 Section 6.01.03-12 “Concreting in Cold Weather” specifies requirements for cold-weather concreting between October 15 and April 15 of the subsequent year. This specification requires that temperatures surrounding the structure be kept above 60 °F for a period of 5 days after placing the concrete, and above 40 °F for an additional nine days. Next, it requires that temperatures be gradually lowered to that of the surrounding atmosphere, but maximum rates are not specified. The specification requires field cured specimens for testing, and once tests performed on these specimens achieve sufficient strength, the Engineer has the discretion to remove protection and heat from the structure. ACI Committee 306 defines cold weather “… as a period when for more than 3 successive days the average daily air temperature drops below 40°F and stays below 50°F for more
13
than one-half of any 24 hour period (8).” In view of that, ConnDOT Form 816 is conservative because it requires the use of cold-weather procedures between October 15th and April 15th regardless of average daily temperatures. Initially, precautions must be taken to protect fresh concrete from cold weather because the ultimate strength can be significantly reduced (up to approximately 50%) if it freezes within a few hours after placement (8). After a few hours have passed, the process of hydration usually reduces the degree of concrete saturation to a point at which it no longer freezes (8). After that, concrete must be protected from cold weather in order that it will continue to harden and gain strength. The temperature at which concrete strength gain ceases is about 14°F (8).Concrete will gain strength slowly between temperatures of 14°F and 40°F, and the rate increases between 40°F and 60°F. Temperatures between 60°F and 80°F are considered ideal for 28-day strength development, although each mix has its own curing characteristics.
14
HISTORICAL DATA ANALYSIS
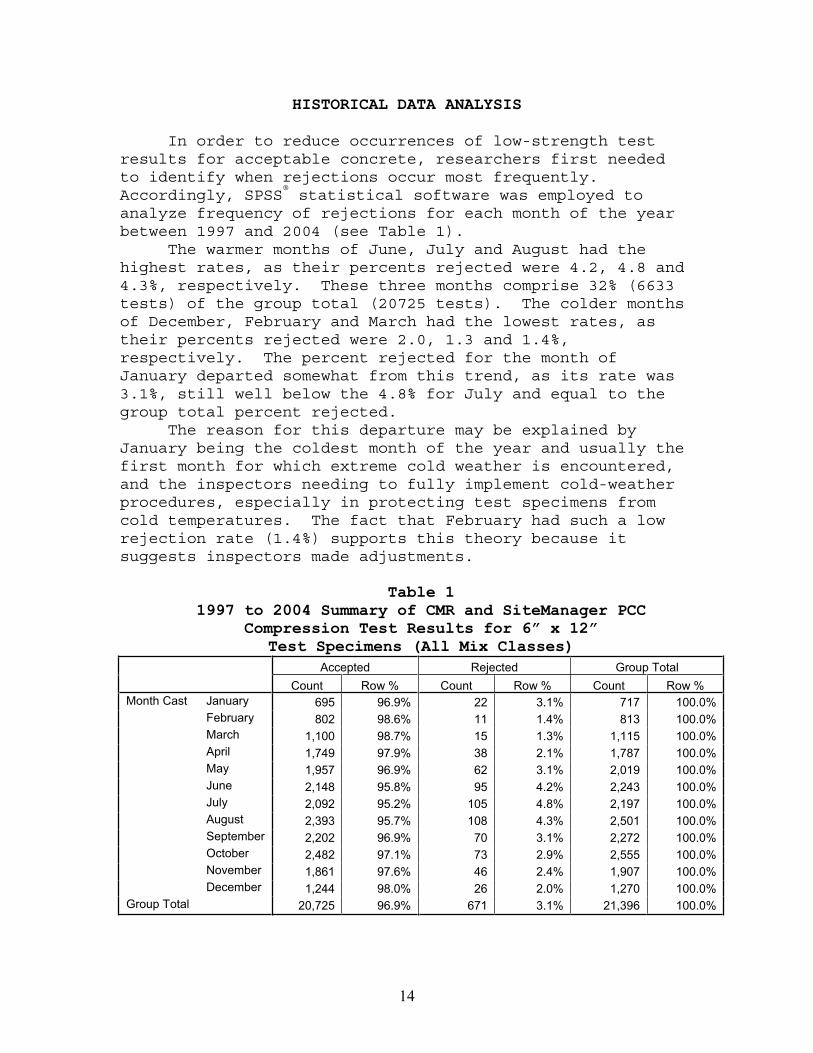
In order to reduce occurrences of low-strength test results for acceptable concrete, researchers first needed to identify when rejections occur most frequently.Accordingly, SPSS® statistical software was employed to analyze frequency of rejections for each month of the year between 1997 and 2004 (see Table 1). The warmer months of June, July and August had the highest rates, as their percents rejected were 4.2, 4.8 and 4.3%, respectively. These three months comprise 32% (6633 tests) of the group total (20725 tests). The colder months of December, February and March had the lowest rates, as their percents rejected were 2.0, 1.3 and 1.4%, respectively. The percent rejected for the month of January departed somewhat from this trend, as its rate was 3.1%, still well below the 4.8% for July and equal to the group total percent rejected. The reason for this departure may be explained by January being the coldest month of the year and usually the first month for which extreme cold weather is encountered, and the inspectors needing to fully implement cold-weather procedures, especially in protecting test specimens from cold temperatures. The fact that February had such a low rejection rate (1.4%) supports this theory because it suggests inspectors made adjustments.
Table 11997 to 2004 Summary of CMR and SiteManager PCC
Compression Test Results for 6” x 12”Test Specimens (All Mix Classes)
Accepted Rejected Group Total Count Row % Count Row % Count Row %
January 695 96.9% 22 3.1% 717 100.0%February 802 98.6% 11 1.4% 813 100.0%March 1,100 98.7% 15 1.3% 1,115 100.0%April 1,749 97.9% 38 2.1% 1,787 100.0%May 1,957 96.9% 62 3.1% 2,019 100.0%June 2,148 95.8% 95 4.2% 2,243 100.0%July 2,092 95.2% 105 4.8% 2,197 100.0%August 2,393 95.7% 108 4.3% 2,501 100.0%September 2,202 96.9% 70 3.1% 2,272 100.0%October 2,482 97.1% 73 2.9% 2,555 100.0%November 1,861 97.6% 46 2.4% 1,907 100.0%
Month Cast
December 1,244 98.0% 26 2.0% 1,270 100.0%Group Total 20,725 96.9% 671 3.1% 21,396 100.0%
15
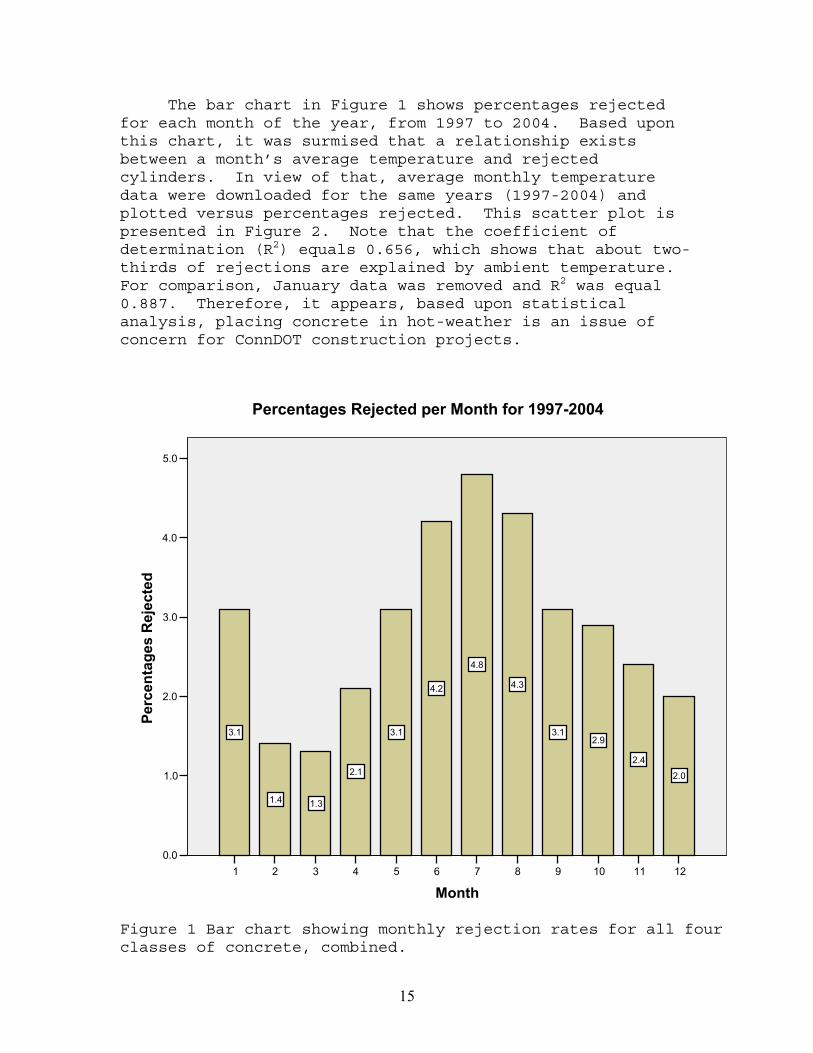
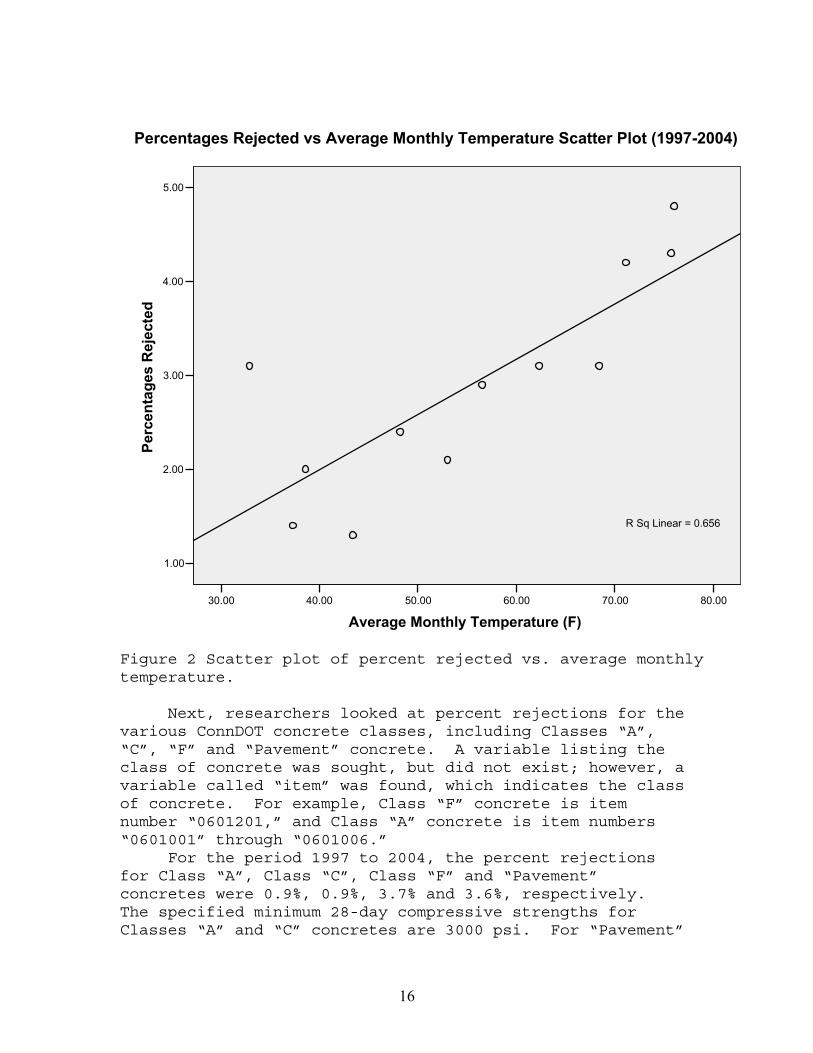
The bar chart in Figure 1 shows percentages rejected for each month of the year, from 1997 to 2004. Based upon this chart, it was surmised that a relationship exists between a month’s average temperature and rejected cylinders. In view of that, average monthly temperature data were downloaded for the same years (1997-2004) and plotted versus percentages rejected. This scatter plot is presented in Figure 2. Note that the coefficient of determination (R2) equals 0.656, which shows that about two-thirds of rejections are explained by ambient temperature.For comparison, January data was removed and R2 was equal 0.887. Therefore, it appears, based upon statistical analysis, placing concrete in hot-weather is an issue of concern for ConnDOT construction projects.
121110987654321
Month
5.0
4.0
3.0
2.0
1.0
0.0
Perc
enta
ges
Rej
ecte
d
2.0
2.4
2.93.1
4.3
4.8
4.2
3.1
2.1
1.31.4
3.1
Percentages Rejected per Month for 1997-2004
Figure 1 Bar chart showing monthly rejection rates for all four classes of concrete, combined.
16
80.0070.0060.0050.0040.0030.00
Average Monthly Temperature (F)
5.00
4.00
3.00
2.00
1.00
Perc
enta
ges
Rej
ecte
d
R Sq Linear = 0.656
Percentages Rejected vs Average Monthly Temperature Scatter Plot (1997-2004)
Figure 2 Scatter plot of percent rejected vs. average monthly temperature.
Next, researchers looked at percent rejections for the various ConnDOT concrete classes, including Classes “A”, “C”, “F” and “Pavement” concrete. A variable listing the class of concrete was sought, but did not exist; however, a variable called “item” was found, which indicates the class of concrete. For example, Class “F” concrete is item number “0601201,” and Class “A” concrete is item numbers “0601001” through “0601006.”
For the period 1997 to 2004, the percent rejections for Class “A”, Class “C”, Class “F” and “Pavement” concretes were 0.9%, 0.9%, 3.7% and 3.6%, respectively.The specified minimum 28-day compressive strengths for Classes “A” and “C” concretes are 3000 psi. For “Pavement”
17
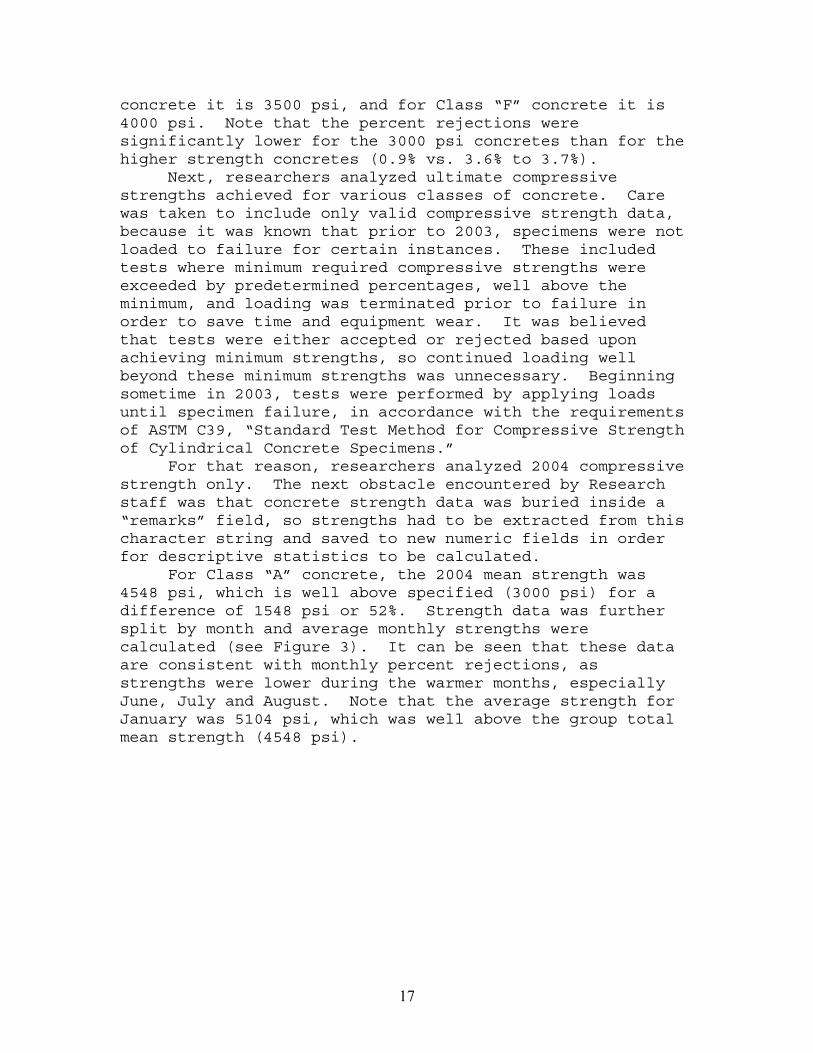
concrete it is 3500 psi, and for Class “F” concrete it is 4000 psi. Note that the percent rejections were significantly lower for the 3000 psi concretes than for the higher strength concretes (0.9% vs. 3.6% to 3.7%). Next, researchers analyzed ultimate compressive strengths achieved for various classes of concrete. Care was taken to include only valid compressive strength data, because it was known that prior to 2003, specimens were not loaded to failure for certain instances. These included tests where minimum required compressive strengths were exceeded by predetermined percentages, well above the minimum, and loading was terminated prior to failure in order to save time and equipment wear. It was believed that tests were either accepted or rejected based upon achieving minimum strengths, so continued loading well beyond these minimum strengths was unnecessary. Beginning sometime in 2003, tests were performed by applying loads until specimen failure, in accordance with the requirements of ASTM C39, “Standard Test Method for Compressive Strength of Cylindrical Concrete Specimens.” For that reason, researchers analyzed 2004 compressive strength only. The next obstacle encountered by Research staff was that concrete strength data was buried inside a “remarks” field, so strengths had to be extracted from this character string and saved to new numeric fields in order for descriptive statistics to be calculated. For Class “A” concrete, the 2004 mean strength was 4548 psi, which is well above specified (3000 psi) for a difference of 1548 psi or 52%. Strength data was further split by month and average monthly strengths were calculated (see Figure 3). It can be seen that these data are consistent with monthly percent rejections, as strengths were lower during the warmer months, especially June, July and August. Note that the average strength for January was 5104 psi, which was well above the group total mean strength (4548 psi).
18
December
November
October
September
August
JulyJune
MayApril
MarchFebruary
January
Month
6000
5500
5000
4500
4000
3500
3000
Ave
rage
Str
engt
h (p
si)
5003
4782
44684409
424442984320
46984821
5589
4745
5104
Mean Strength = 4548 psi
Average Monthly Class A Concrete Strengths for 2004
Figure 3 Average 2004 monthly Class “A” concrete strengths.
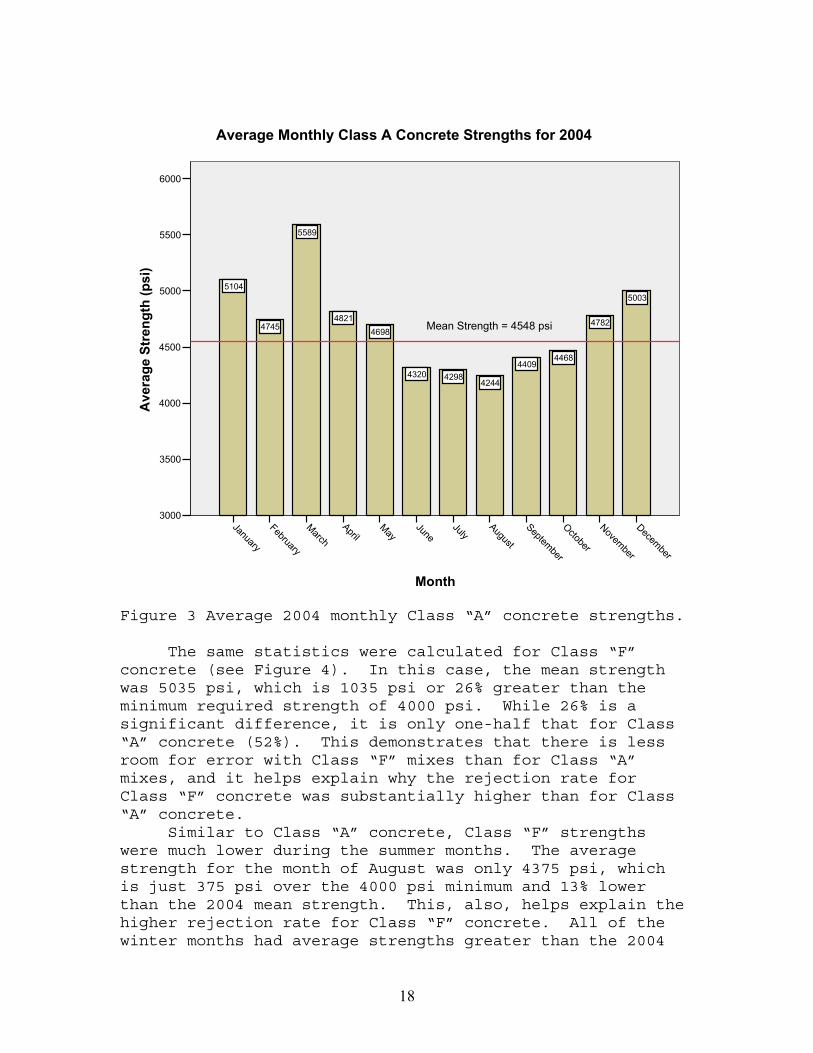
The same statistics were calculated for Class “F” concrete (see Figure 4). In this case, the mean strength was 5035 psi, which is 1035 psi or 26% greater than the minimum required strength of 4000 psi. While 26% is a significant difference, it is only one-half that for Class “A” concrete (52%). This demonstrates that there is less room for error with Class “F” mixes than for Class “A” mixes, and it helps explain why the rejection rate for Class “F” concrete was substantially higher than for Class “A” concrete. Similar to Class “A” concrete, Class “F” strengths were much lower during the summer months. The average strength for the month of August was only 4375 psi, which is just 375 psi over the 4000 psi minimum and 13% lower than the 2004 mean strength. This, also, helps explain the higher rejection rate for Class “F” concrete. All of the winter months had average strengths greater than the 2004
19
mean, and December’s average strength was 9% higher than the mean.
December
November
October
September
August
JulyJune
MayApril
MarchFebruary
January
Month
5500
5250
5000
4750
4500
4250
4000
Ave
rage
Str
engt
h (p
si)
5477
5114
4899
4614
4375
4784
4956
5377
5442
53465387
5194
Mean Strength = 5035 psi
Average Monthly Class F Concrete Strengths for 2004
Figure 4 Average 2004 monthly Class “F” concrete strengths.
20
MATURITY KIT COMPARISONS
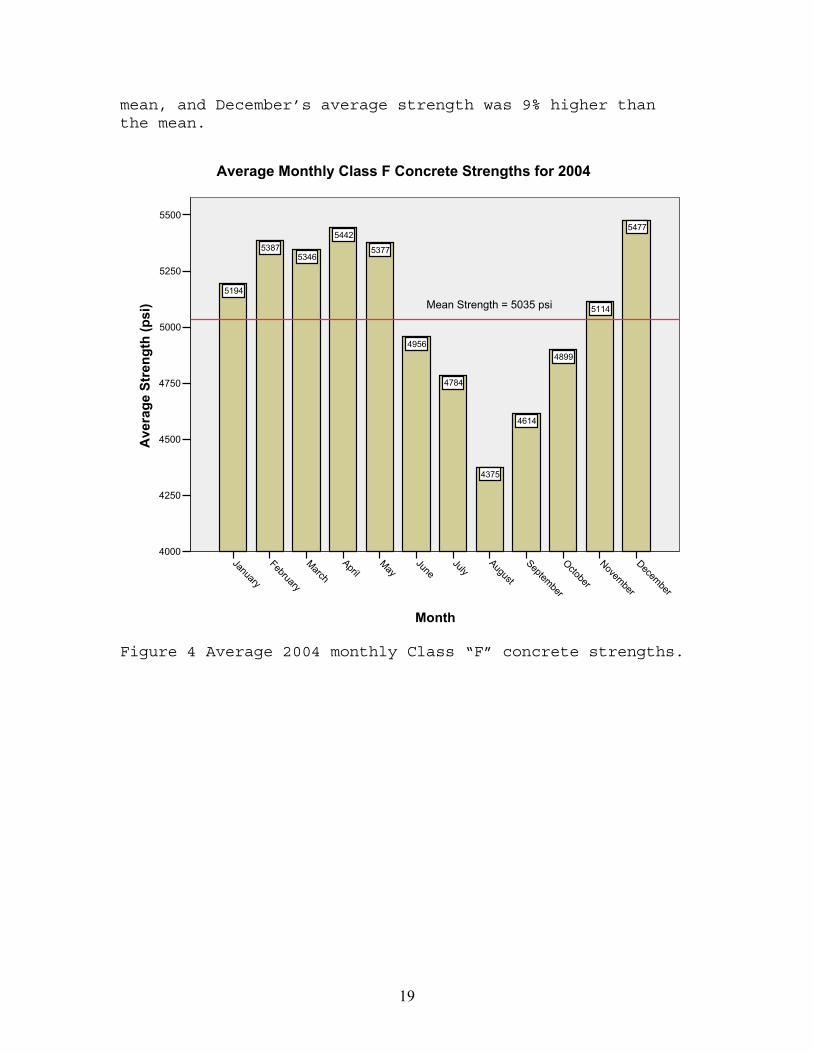
Three different maturity kits were evaluated during this study: Engius’ intelliRock II, Transtec Group’s Pocket Command Center Kit, and International Road Dynamics’ (IRD) Concrete Maturity Monitor. A discussion of each follows.
Engius’ intelliRock II The intelliRock II model KIT-02-MAT-1H28D-1R50L concrete maturity and temperature profiling system was purchased for this study. It includes 1 KIT-02 Reader, 50 MAT-02-1H28D intelliRock II Loggers, a rugged carrying case, and rockWareTM software (see Figure 5). The total cost for the kit, including a discount on the loggers, was $4,389.45. The loggers are sacrificial sensors that are embedded in concrete, and the reader is a hand-held device used to start the loggers, read data, download data and then upload data to a personal computer (PC). A permanent connection is not required between the reader and loggers, because the loggers are completely self-sufficient, i.e. loggers include not only a temperature measurement system, but also a battery, microprocessor and data storage capabilities. Because the reader does not have to be continuously connected to the loggers, it is kept safe from vandalism and accidents. Additionally, the intelliRock II system was designed to be tamperproof. It includes a data-lock function, in-situ hard-coded data, and encrypted files.
Figure 5 intelliRock II Model KIT-02-MAT-1H28D-1R50L.
21
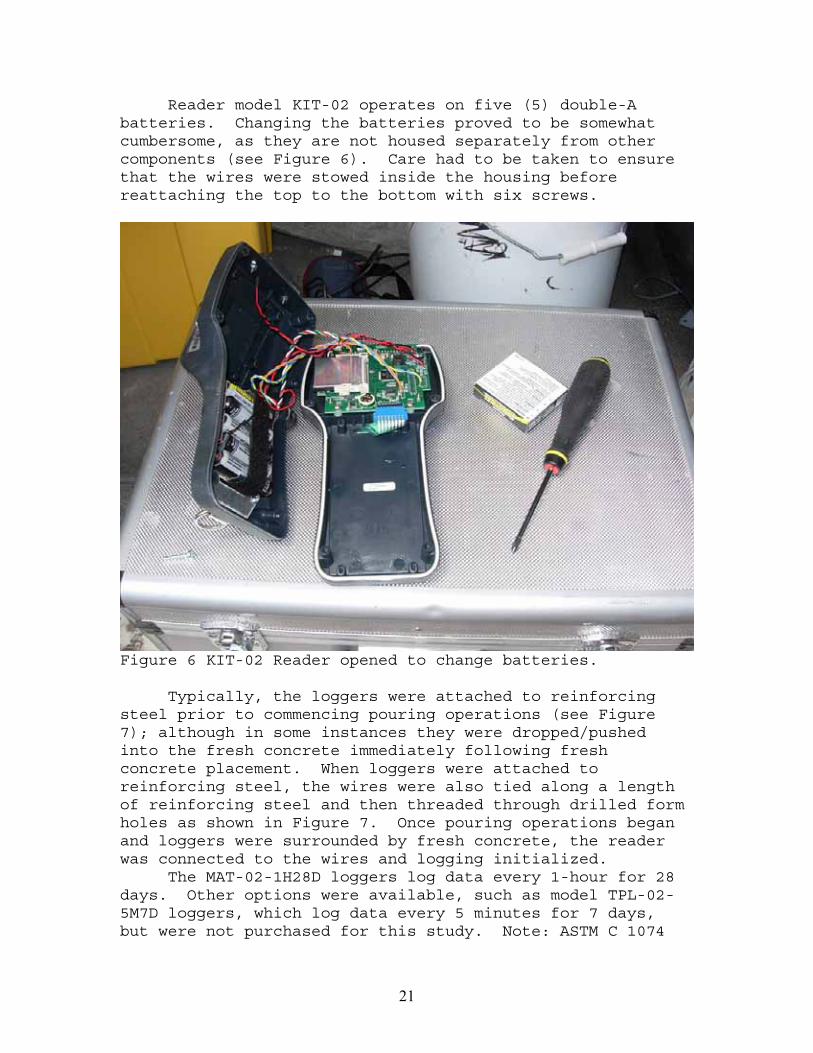
Reader model KIT-02 operates on five (5) double-A batteries. Changing the batteries proved to be somewhat cumbersome, as they are not housed separately from other components (see Figure 6). Care had to be taken to ensure that the wires were stowed inside the housing before reattaching the top to the bottom with six screws.
Figure 6 KIT-02 Reader opened to change batteries.
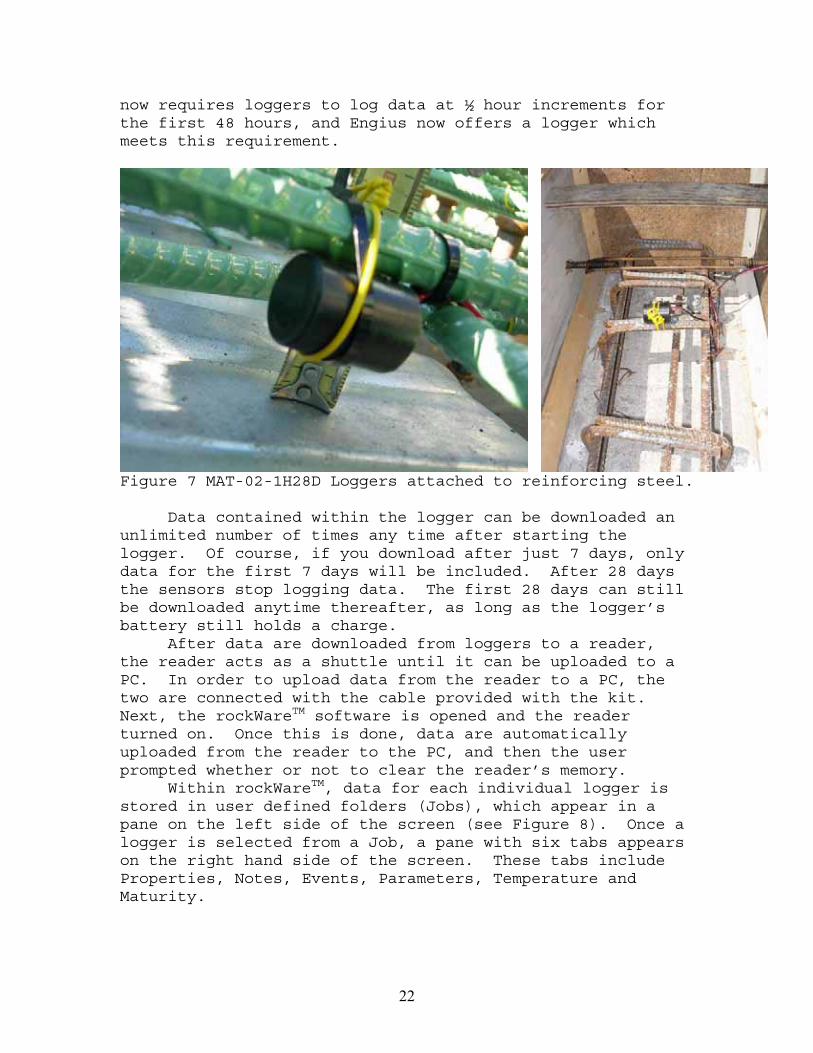
Typically, the loggers were attached to reinforcing steel prior to commencing pouring operations (see Figure 7); although in some instances they were dropped/pushed into the fresh concrete immediately following fresh concrete placement. When loggers were attached to reinforcing steel, the wires were also tied along a length of reinforcing steel and then threaded through drilled form holes as shown in Figure 7. Once pouring operations began and loggers were surrounded by fresh concrete, the reader was connected to the wires and logging initialized. The MAT-02-1H28D loggers log data every 1-hour for 28 days. Other options were available, such as model TPL-02-5M7D loggers, which log data every 5 minutes for 7 days, but were not purchased for this study. Note: ASTM C 1074
22
now requires loggers to log data at ½ hour increments for the first 48 hours, and Engius now offers a logger which meets this requirement.
Figure 7 MAT-02-1H28D Loggers attached to reinforcing steel.
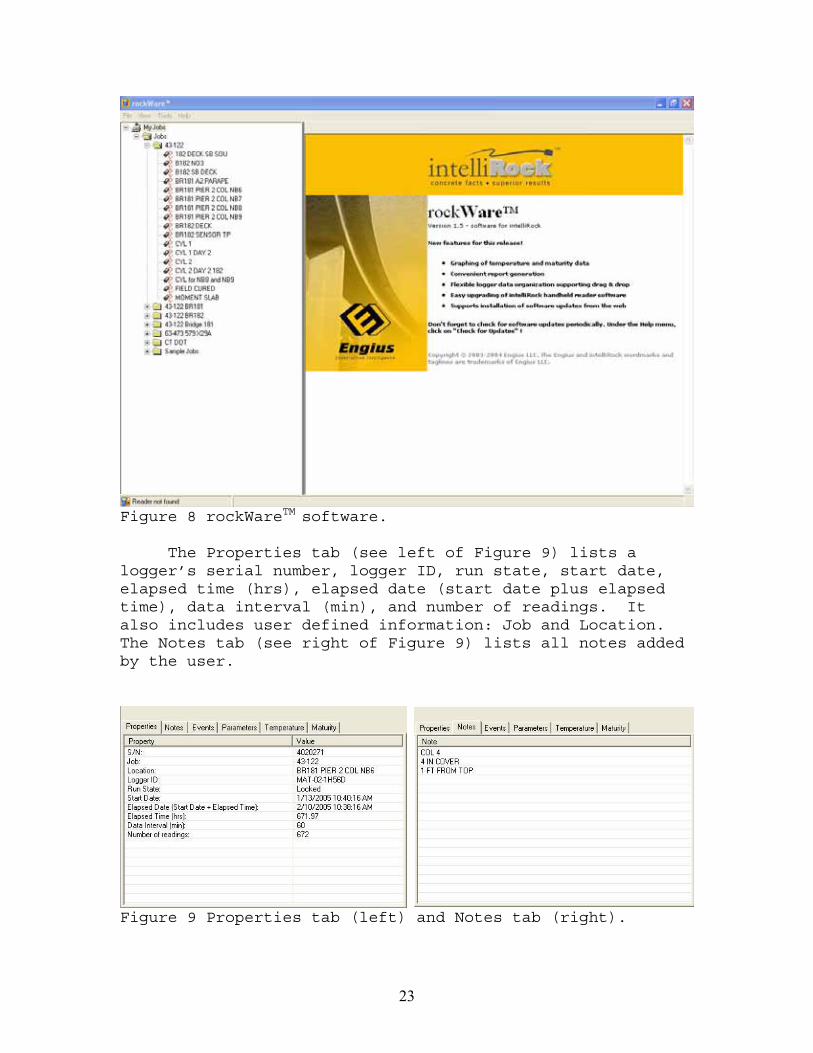
Data contained within the logger can be downloaded an unlimited number of times any time after starting the logger. Of course, if you download after just 7 days, only data for the first 7 days will be included. After 28 days the sensors stop logging data. The first 28 days can still be downloaded anytime thereafter, as long as the logger’s battery still holds a charge. After data are downloaded from loggers to a reader, the reader acts as a shuttle until it can be uploaded to a PC. In order to upload data from the reader to a PC, the two are connected with the cable provided with the kit.Next, the rockWareTM software is opened and the reader turned on. Once this is done, data are automatically uploaded from the reader to the PC, and then the user prompted whether or not to clear the reader’s memory. Within rockWareTM, data for each individual logger is stored in user defined folders (Jobs), which appear in a pane on the left side of the screen (see Figure 8). Once a logger is selected from a Job, a pane with six tabs appears on the right hand side of the screen. These tabs include Properties, Notes, Events, Parameters, Temperature and Maturity.
23
Figure 8 rockWareTM software.
The Properties tab (see left of Figure 9) lists a logger’s serial number, logger ID, run state, start date, elapsed time (hrs), elapsed date (start date plus elapsed time), data interval (min), and number of readings. It also includes user defined information: Job and Location.The Notes tab (see right of Figure 9) lists all notes added by the user.
Figure 9 Properties tab (left) and Notes tab (right).
24
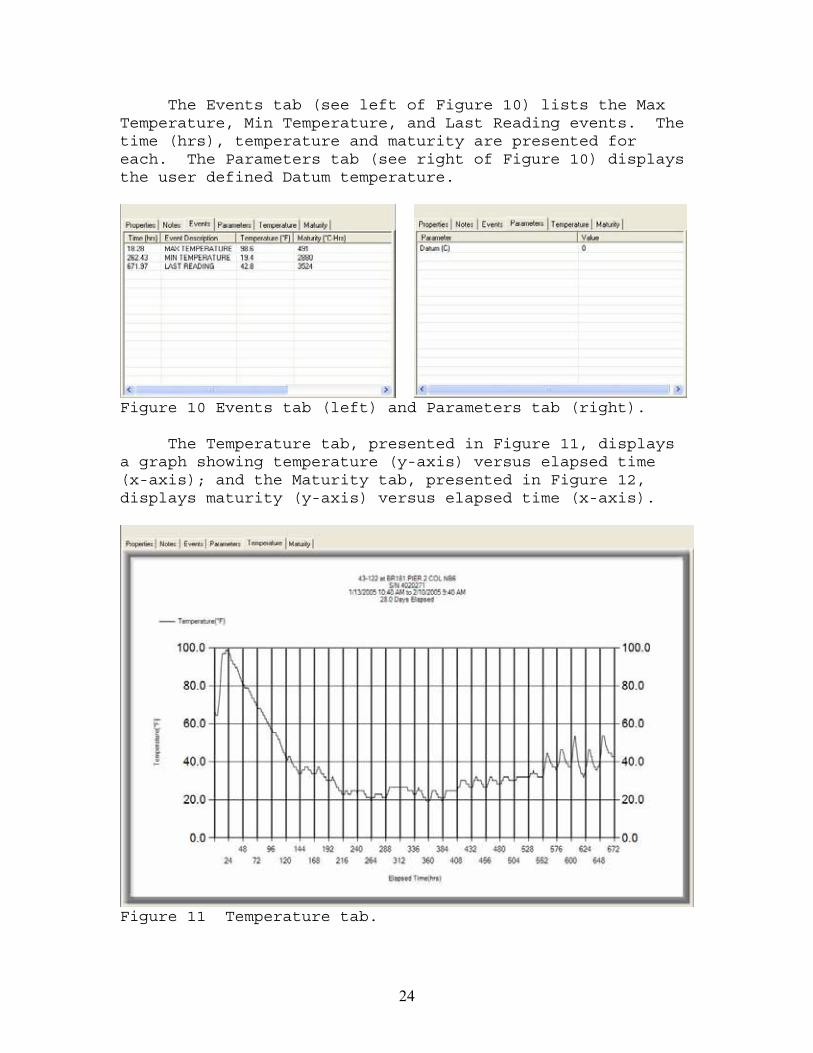
The Events tab (see left of Figure 10) lists the Max Temperature, Min Temperature, and Last Reading events. The time (hrs), temperature and maturity are presented for each. The Parameters tab (see right of Figure 10) displays the user defined Datum temperature.
Figure 10 Events tab (left) and Parameters tab (right).
The Temperature tab, presented in Figure 11, displays a graph showing temperature (y-axis) versus elapsed time (x-axis); and the Maturity tab, presented in Figure 12, displays maturity (y-axis) versus elapsed time (x-axis).
Figure 11 Temperature tab.
25
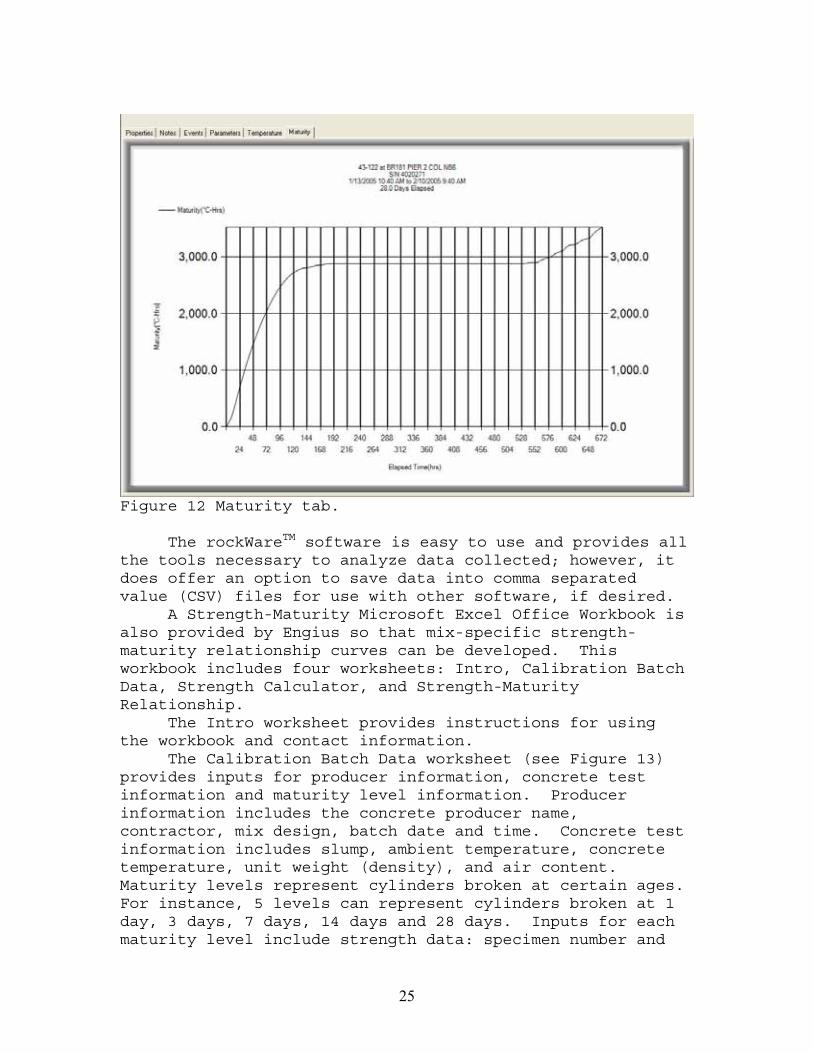
Figure 12 Maturity tab.
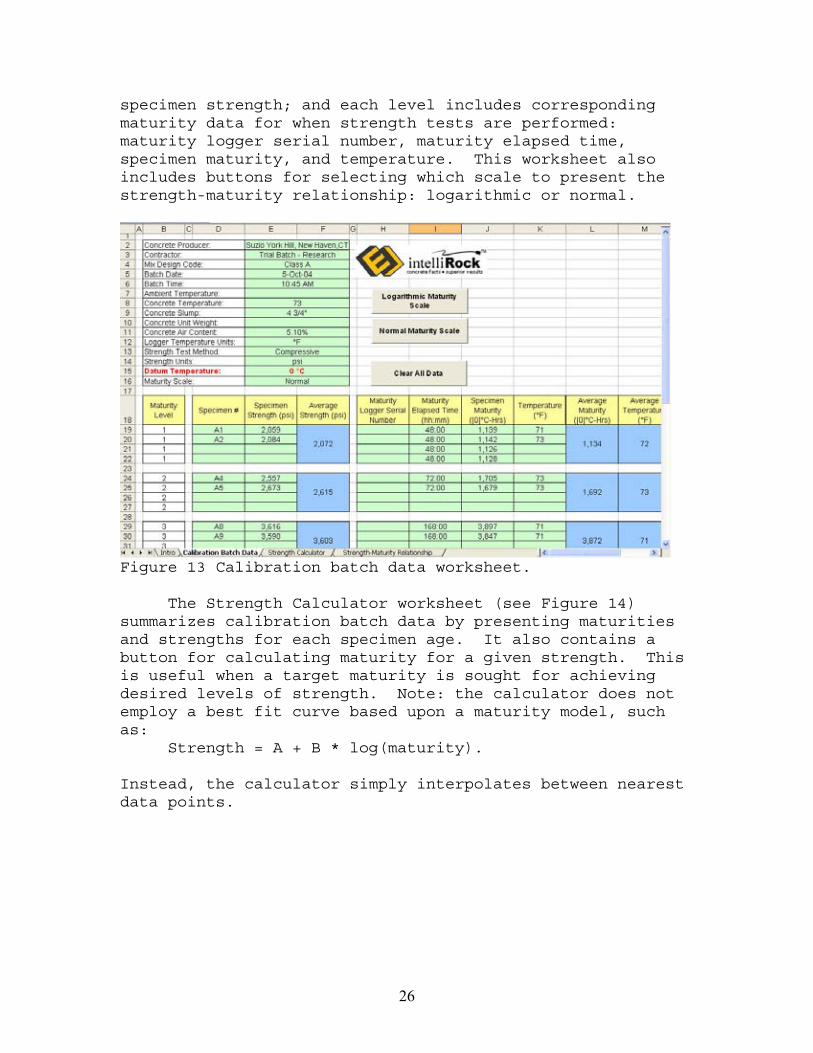
The rockWareTM software is easy to use and provides all the tools necessary to analyze data collected; however, it does offer an option to save data into comma separated value (CSV) files for use with other software, if desired. A Strength-Maturity Microsoft Excel Office Workbook is also provided by Engius so that mix-specific strength-maturity relationship curves can be developed. This workbook includes four worksheets: Intro, Calibration Batch Data, Strength Calculator, and Strength-Maturity Relationship. The Intro worksheet provides instructions for using the workbook and contact information. The Calibration Batch Data worksheet (see Figure 13) provides inputs for producer information, concrete test information and maturity level information. Producer information includes the concrete producer name, contractor, mix design, batch date and time. Concrete test information includes slump, ambient temperature, concrete temperature, unit weight (density), and air content.Maturity levels represent cylinders broken at certain ages.For instance, 5 levels can represent cylinders broken at 1 day, 3 days, 7 days, 14 days and 28 days. Inputs for each maturity level include strength data: specimen number and
26
specimen strength; and each level includes corresponding maturity data for when strength tests are performed: maturity logger serial number, maturity elapsed time, specimen maturity, and temperature. This worksheet also includes buttons for selecting which scale to present the strength-maturity relationship: logarithmic or normal.
Figure 13 Calibration batch data worksheet.
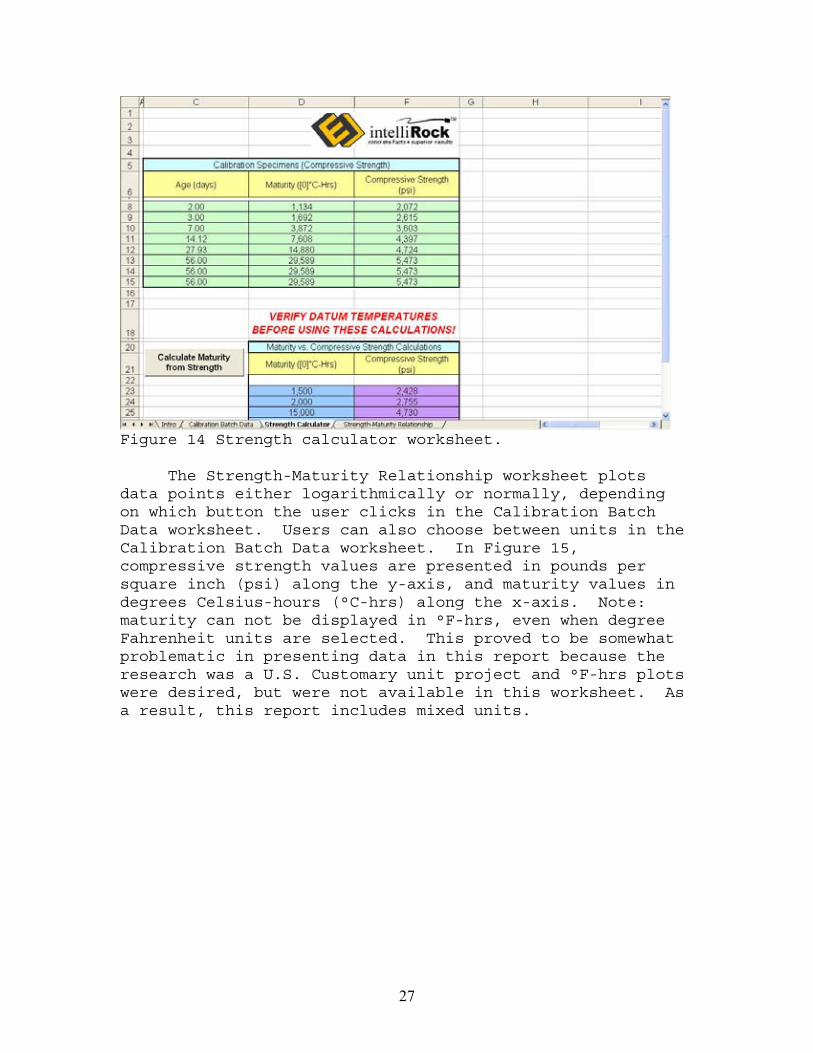
The Strength Calculator worksheet (see Figure 14) summarizes calibration batch data by presenting maturities and strengths for each specimen age. It also contains a button for calculating maturity for a given strength. This is useful when a target maturity is sought for achieving desired levels of strength. Note: the calculator does not employ a best fit curve based upon a maturity model, such as: Strength = A + B * log(maturity).
Instead, the calculator simply interpolates between nearest data points.
27
Figure 14 Strength calculator worksheet.
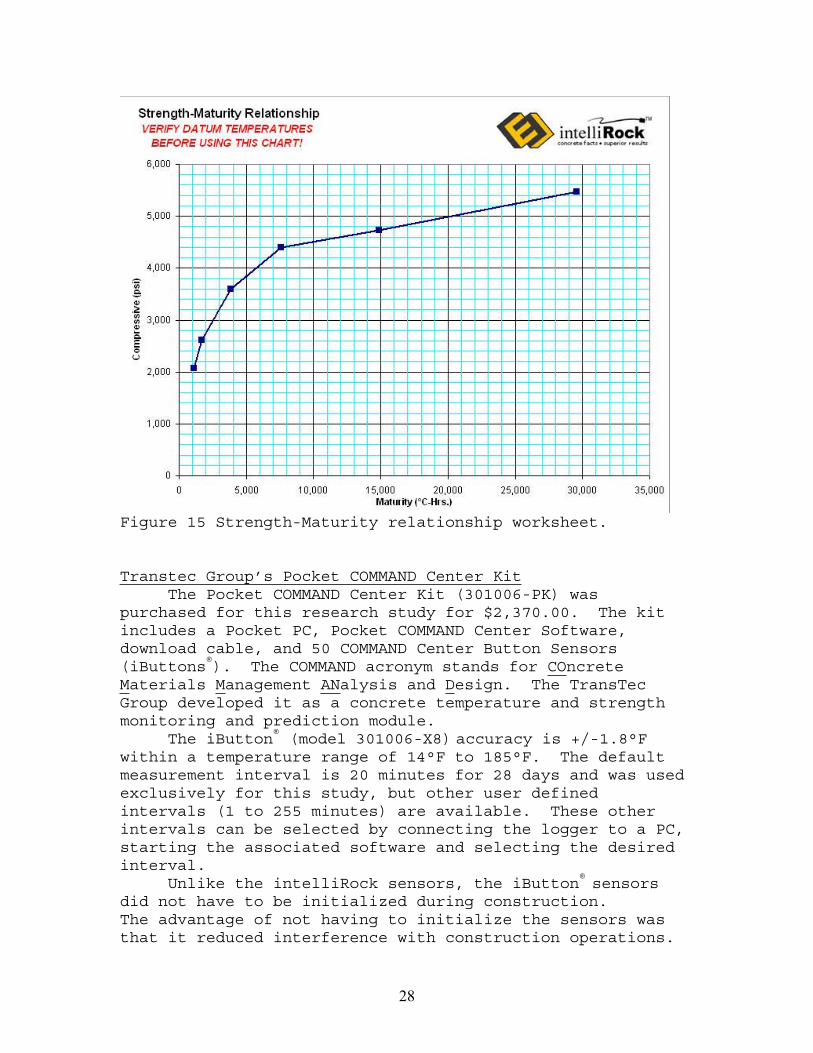
The Strength-Maturity Relationship worksheet plots data points either logarithmically or normally, depending on which button the user clicks in the Calibration Batch Data worksheet. Users can also choose between units in the Calibration Batch Data worksheet. In Figure 15, compressive strength values are presented in pounds per square inch (psi) along the y-axis, and maturity values in degrees Celsius-hours (°C-hrs) along the x-axis. Note: maturity can not be displayed in °F-hrs, even when degree Fahrenheit units are selected. This proved to be somewhat problematic in presenting data in this report because the research was a U.S. Customary unit project and °F-hrs plots were desired, but were not available in this worksheet. As a result, this report includes mixed units.
28
Figure 15 Strength-Maturity relationship worksheet.
Transtec Group’s Pocket COMMAND Center KitThe Pocket COMMAND Center Kit (301006-PK) was
purchased for this research study for $2,370.00. The kit includes a Pocket PC, Pocket COMMAND Center Software, download cable, and 50 COMMAND Center Button Sensors (iButtons®). The COMMAND acronym stands for COncreteMaterials Management ANalysis and Design. The TransTec Group developed it as a concrete temperature and strength monitoring and prediction module. The iButton® (model 301006-X8) accuracy is +/-1.8°F within a temperature range of 14°F to 185°F. The default measurement interval is 20 minutes for 28 days and was used exclusively for this study, but other user defined intervals (1 to 255 minutes) are available. These other intervals can be selected by connecting the logger to a PC, starting the associated software and selecting the desired interval. Unlike the intelliRock sensors, the iButton® sensorsdid not have to be initialized during construction.The advantage of not having to initialize the sensors was that it reduced interference with construction operations.
29
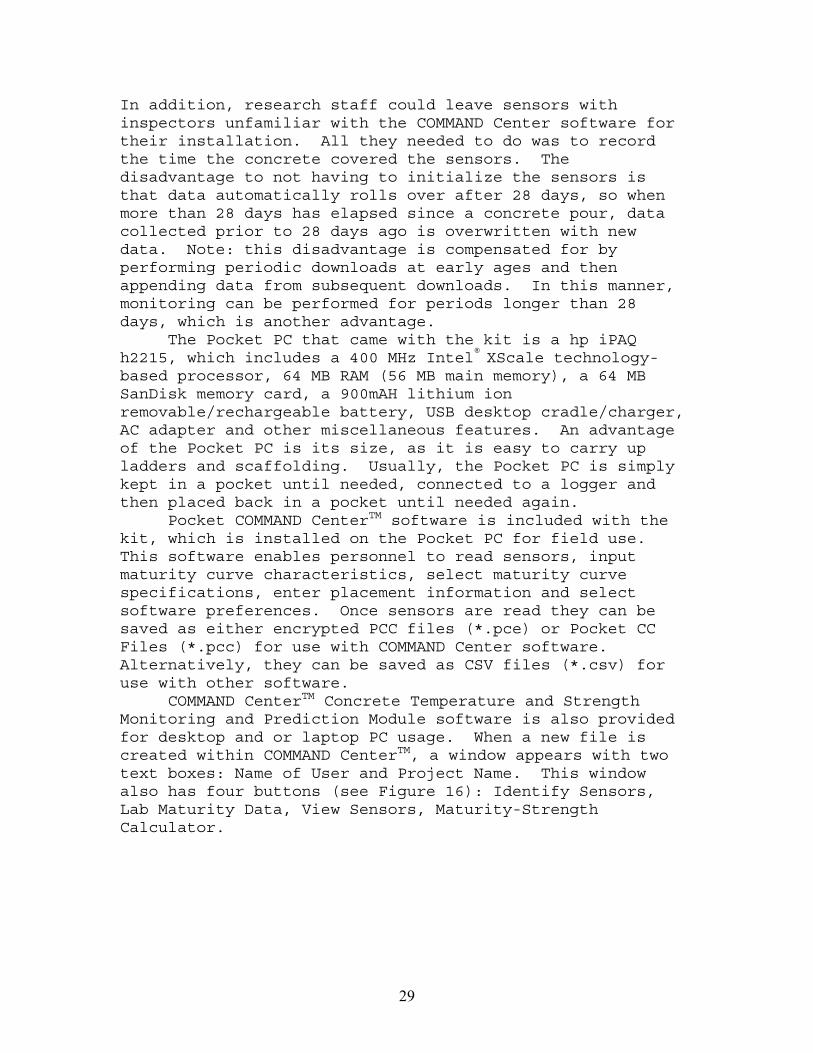
In addition, research staff could leave sensors with inspectors unfamiliar with the COMMAND Center software for their installation. All they needed to do was to record the time the concrete covered the sensors. The disadvantage to not having to initialize the sensors is that data automatically rolls over after 28 days, so when more than 28 days has elapsed since a concrete pour, data collected prior to 28 days ago is overwritten with new data. Note: this disadvantage is compensated for by performing periodic downloads at early ages and then appending data from subsequent downloads. In this manner, monitoring can be performed for periods longer than 28 days, which is another advantage. The Pocket PC that came with the kit is a hp iPAQ h2215, which includes a 400 MHz Intel® XScale technology-based processor, 64 MB RAM (56 MB main memory), a 64 MB SanDisk memory card, a 900mAH lithium ion removable/rechargeable battery, USB desktop cradle/charger, AC adapter and other miscellaneous features. An advantage of the Pocket PC is its size, as it is easy to carry up ladders and scaffolding. Usually, the Pocket PC is simply kept in a pocket until needed, connected to a logger and then placed back in a pocket until needed again. Pocket COMMAND CenterTM software is included with the kit, which is installed on the Pocket PC for field use.This software enables personnel to read sensors, input maturity curve characteristics, select maturity curve specifications, enter placement information and select software preferences. Once sensors are read they can be saved as either encrypted PCC files (*.pce) or Pocket CC Files (*.pcc) for use with COMMAND Center software.Alternatively, they can be saved as CSV files (*.csv) for use with other software. COMMAND CenterTM Concrete Temperature and Strength Monitoring and Prediction Module software is also provided for desktop and or laptop PC usage. When a new file is created within COMMAND CenterTM, a window appears with two text boxes: Name of User and Project Name. This window also has four buttons (see Figure 16): Identify Sensors, Lab Maturity Data, View Sensors, Maturity-Strength Calculator.
30
Figure 16 Adding/Editing file window.
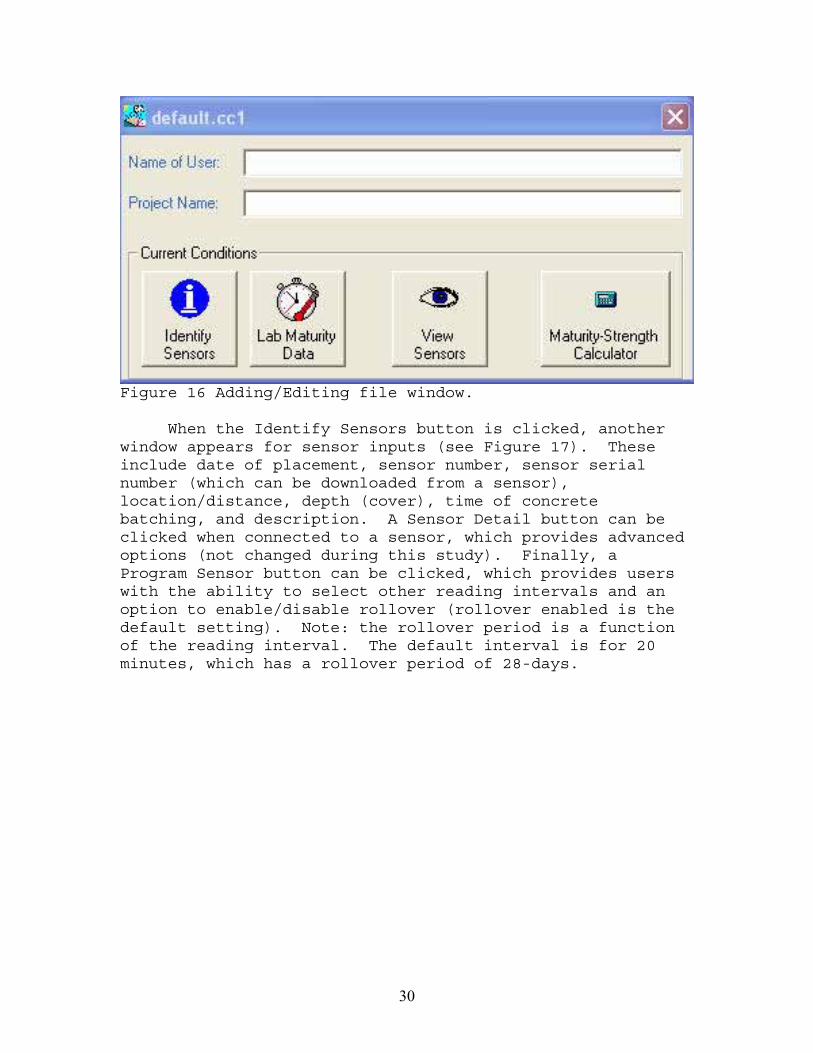
When the Identify Sensors button is clicked, another window appears for sensor inputs (see Figure 17). These include date of placement, sensor number, sensor serial number (which can be downloaded from a sensor), location/distance, depth (cover), time of concrete batching, and description. A Sensor Detail button can be clicked when connected to a sensor, which provides advanced options (not changed during this study). Finally, a Program Sensor button can be clicked, which provides users with the ability to select other reading intervals and an option to enable/disable rollover (rollover enabled is the default setting). Note: the rollover period is a function of the reading interval. The default interval is for 20 minutes, which has a rollover period of 28-days.
31
Figure 17 Identify Sensors window.
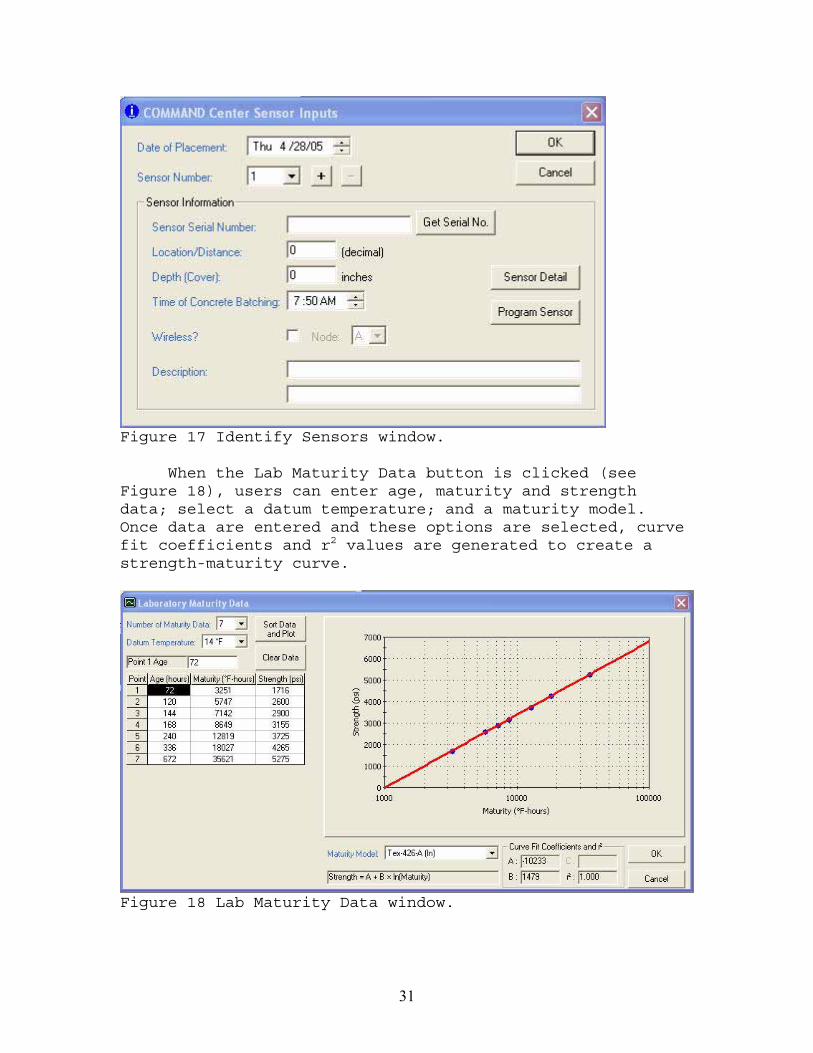
When the Lab Maturity Data button is clicked (see Figure 18), users can enter age, maturity and strength data; select a datum temperature; and a maturity model.Once data are entered and these options are selected, curve fit coefficients and r2 values are generated to create a strength-maturity curve.
Figure 18 Lab Maturity Data window.
32
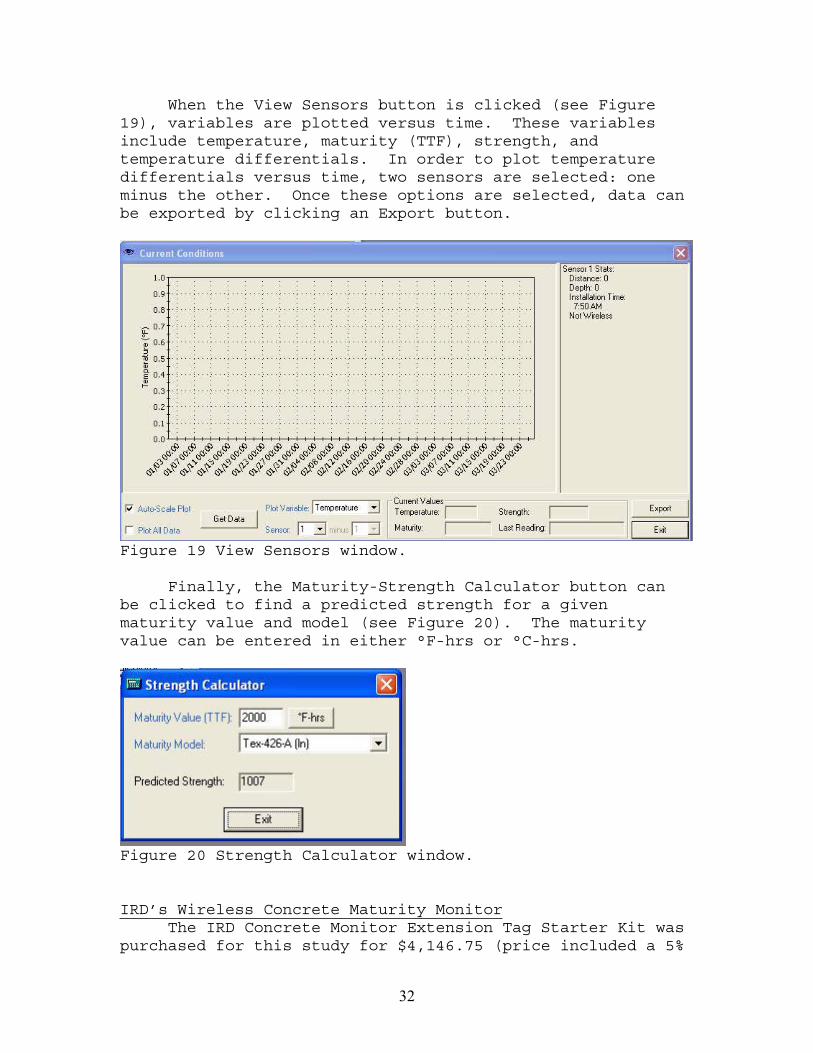
When the View Sensors button is clicked (see Figure 19), variables are plotted versus time. These variables include temperature, maturity (TTF), strength, and temperature differentials. In order to plot temperature differentials versus time, two sensors are selected: one minus the other. Once these options are selected, data can be exported by clicking an Export button.
Figure 19 View Sensors window.
Finally, the Maturity-Strength Calculator button can be clicked to find a predicted strength for a given maturity value and model (see Figure 20). The maturity value can be entered in either °F-hrs or °C-hrs.
Figure 20 Strength Calculator window.
IRD’s Wireless Concrete Maturity MonitorThe IRD Concrete Monitor Extension Tag Starter Kit was
purchased for this study for $4,146.75 (price included a 5%
33
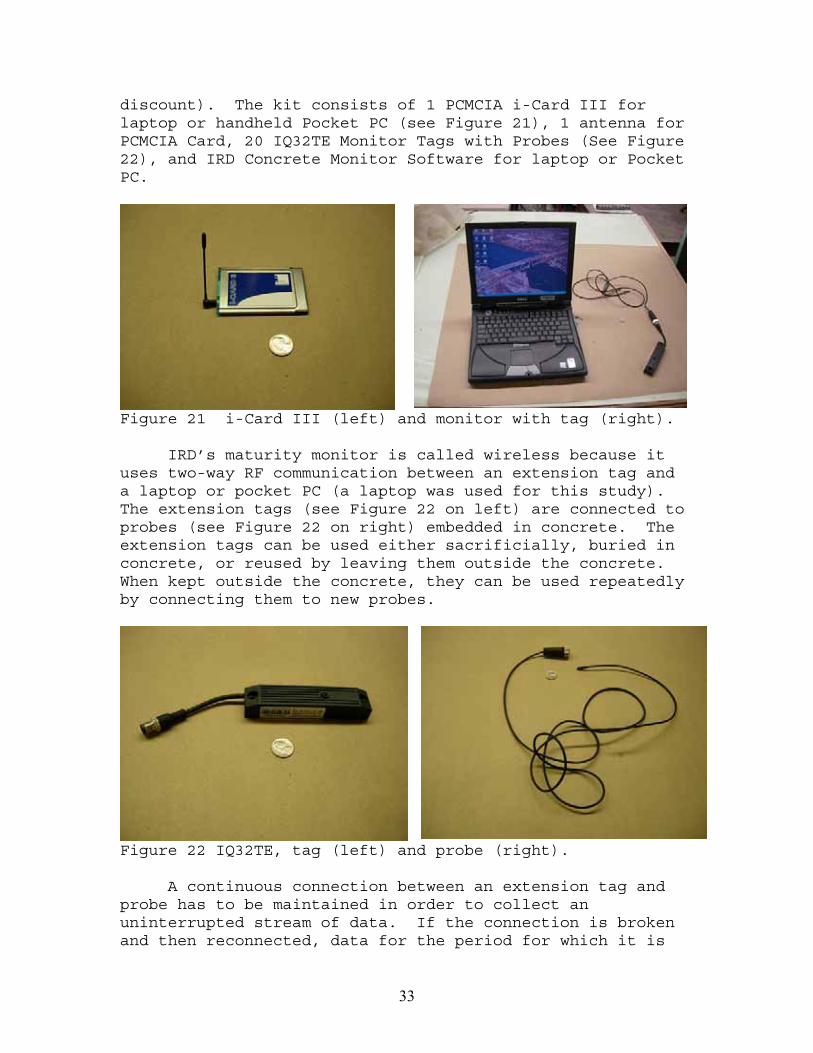
discount). The kit consists of 1 PCMCIA i-Card III for laptop or handheld Pocket PC (see Figure 21), 1 antenna for PCMCIA Card, 20 IQ32TE Monitor Tags with Probes (See Figure 22), and IRD Concrete Monitor Software for laptop or Pocket PC.
Figure 21 i-Card III (left) and monitor with tag (right).
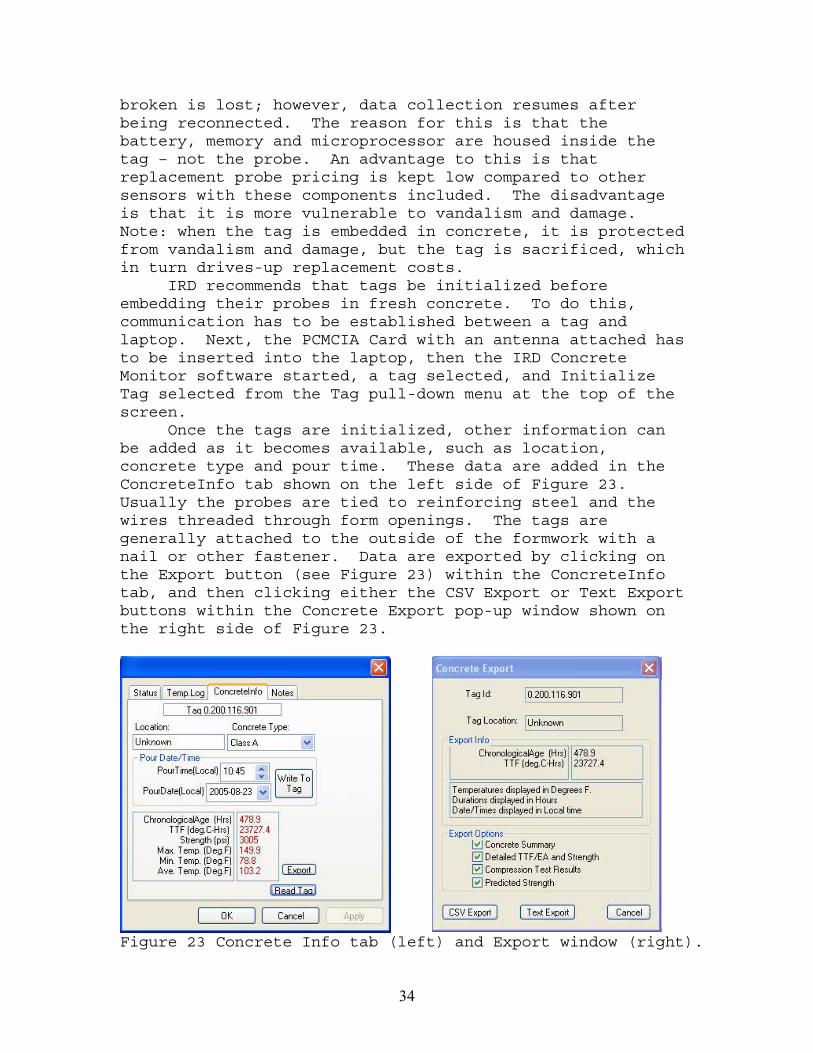
IRD’s maturity monitor is called wireless because it uses two-way RF communication between an extension tag and a laptop or pocket PC (a laptop was used for this study).The extension tags (see Figure 22 on left) are connected to probes (see Figure 22 on right) embedded in concrete. The extension tags can be used either sacrificially, buried in concrete, or reused by leaving them outside the concrete.When kept outside the concrete, they can be used repeatedly by connecting them to new probes.
Figure 22 IQ32TE, tag (left) and probe (right).
A continuous connection between an extension tag and probe has to be maintained in order to collect an uninterrupted stream of data. If the connection is broken and then reconnected, data for the period for which it is
34
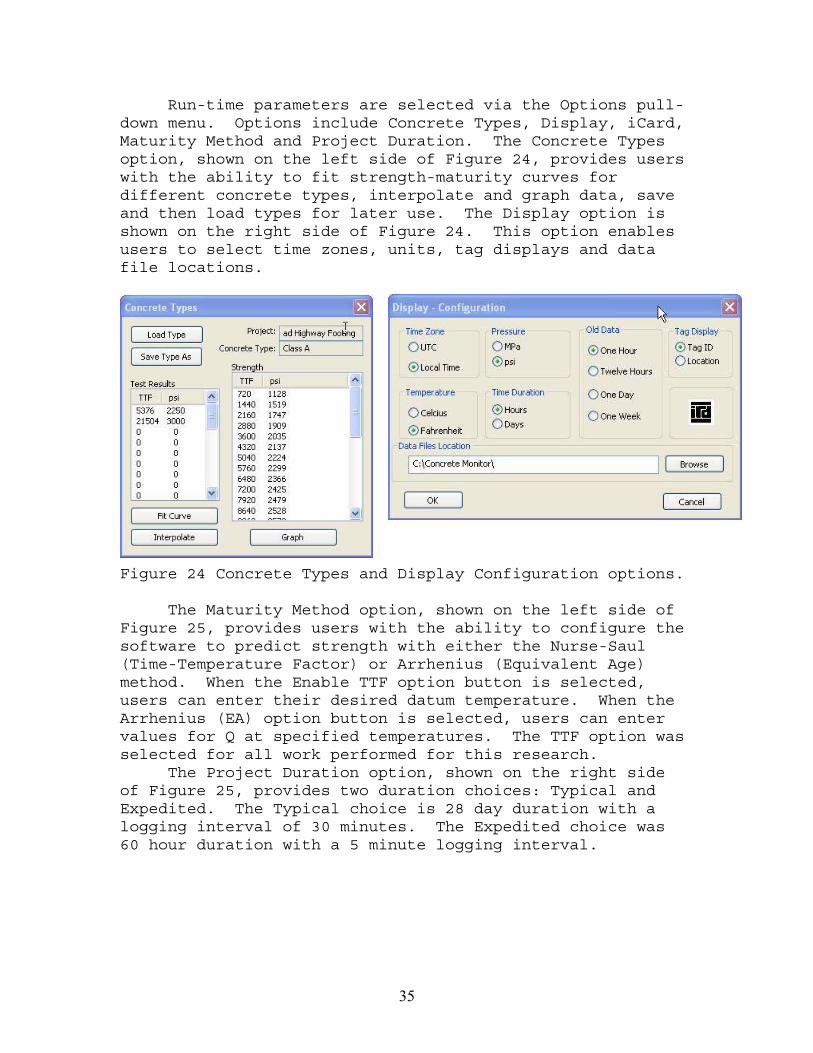
broken is lost; however, data collection resumes after being reconnected. The reason for this is that the battery, memory and microprocessor are housed inside the tag – not the probe. An advantage to this is that replacement probe pricing is kept low compared to other sensors with these components included. The disadvantage is that it is more vulnerable to vandalism and damage.Note: when the tag is embedded in concrete, it is protected from vandalism and damage, but the tag is sacrificed, which in turn drives-up replacement costs. IRD recommends that tags be initialized before embedding their probes in fresh concrete. To do this, communication has to be established between a tag and laptop. Next, the PCMCIA Card with an antenna attached has to be inserted into the laptop, then the IRD Concrete Monitor software started, a tag selected, and Initialize Tag selected from the Tag pull-down menu at the top of the screen. Once the tags are initialized, other information can be added as it becomes available, such as location, concrete type and pour time. These data are added in the ConcreteInfo tab shown on the left side of Figure 23.Usually the probes are tied to reinforcing steel and the wires threaded through form openings. The tags are generally attached to the outside of the formwork with a nail or other fastener. Data are exported by clicking on the Export button (see Figure 23) within the ConcreteInfo tab, and then clicking either the CSV Export or Text Export buttons within the Concrete Export pop-up window shown on the right side of Figure 23.
Figure 23 Concrete Info tab (left) and Export window (right).
35
Run-time parameters are selected via the Options pull-down menu. Options include Concrete Types, Display, iCard, Maturity Method and Project Duration. The Concrete Types option, shown on the left side of Figure 24, provides users with the ability to fit strength-maturity curves for different concrete types, interpolate and graph data, save and then load types for later use. The Display option is shown on the right side of Figure 24. This option enables users to select time zones, units, tag displays and data file locations.
Figure 24 Concrete Types and Display Configuration options.
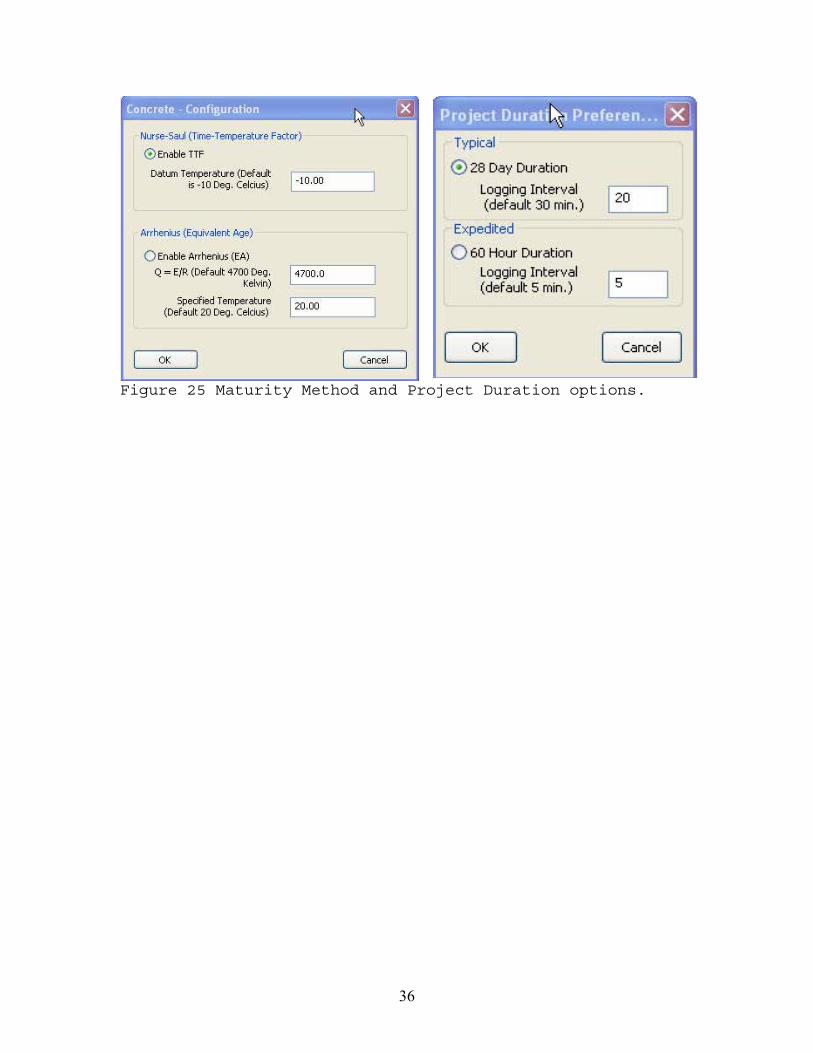
The Maturity Method option, shown on the left side of Figure 25, provides users with the ability to configure the software to predict strength with either the Nurse-Saul (Time-Temperature Factor) or Arrhenius (Equivalent Age) method. When the Enable TTF option button is selected, users can enter their desired datum temperature. When the Arrhenius (EA) option button is selected, users can enter values for Q at specified temperatures. The TTF option was selected for all work performed for this research. The Project Duration option, shown on the right side of Figure 25, provides two duration choices: Typical and Expedited. The Typical choice is 28 day duration with a logging interval of 30 minutes. The Expedited choice was 60 hour duration with a 5 minute logging interval.
36
Figure 25 Maturity Method and Project Duration options.
37
CONSTRUCTION PROJECT SITES
Research staff selected several ongoing concrete construction projects for this study. These included Projects 43-122 in East Haven (District 3), 25-133 in Cheshire (District 1), 58-285 in Groton (District 2), and 63-473/579/595 in Hartford (District 1). In addition, work on a concrete pour for an unrelated research study (SPR-2237) was performed at the Central Lab in Rocky Hill. The intelliRockTM Maturity Kit was used for all work on Projects 43-122 and 63-579, and was used for the unrelated research work at the Central Lab; the COMMANDTM Center kit was used for all work on Projects 25-133, 58-285 and 63-595; and the IRD Wireless Kit was used for all work on Project 63-473. Project 43-122 concreting operations were for various bridge substructure and superstructure components, including bridge decks, abutments, pier columns, parapet walls and moment slabs. Project 25-133 concrete work included pavement, a bridge deck and parapet wall. All Project 58-285 concrete work was for sidewalk. Finally, Project 63-473/579/595 work included a bridge deck, footing, abutment, parapet curb sections, and parapet wall. Field work performed during this study is presented in five different sections of this report. These include Estimating Concrete Strength by the Maturity Method, A Maturity Application for Research, Hot-Weather Concreting, Cold-Weather Concreting, and Mass Concrete Applications. Table 2 is presented in order to provide readers with an overview of the work presented in the following sections. The table presents the Project, Structure, Maturity Kit, and Application. Note that researchers were making observations and assessing concrete testing methods during all field work.
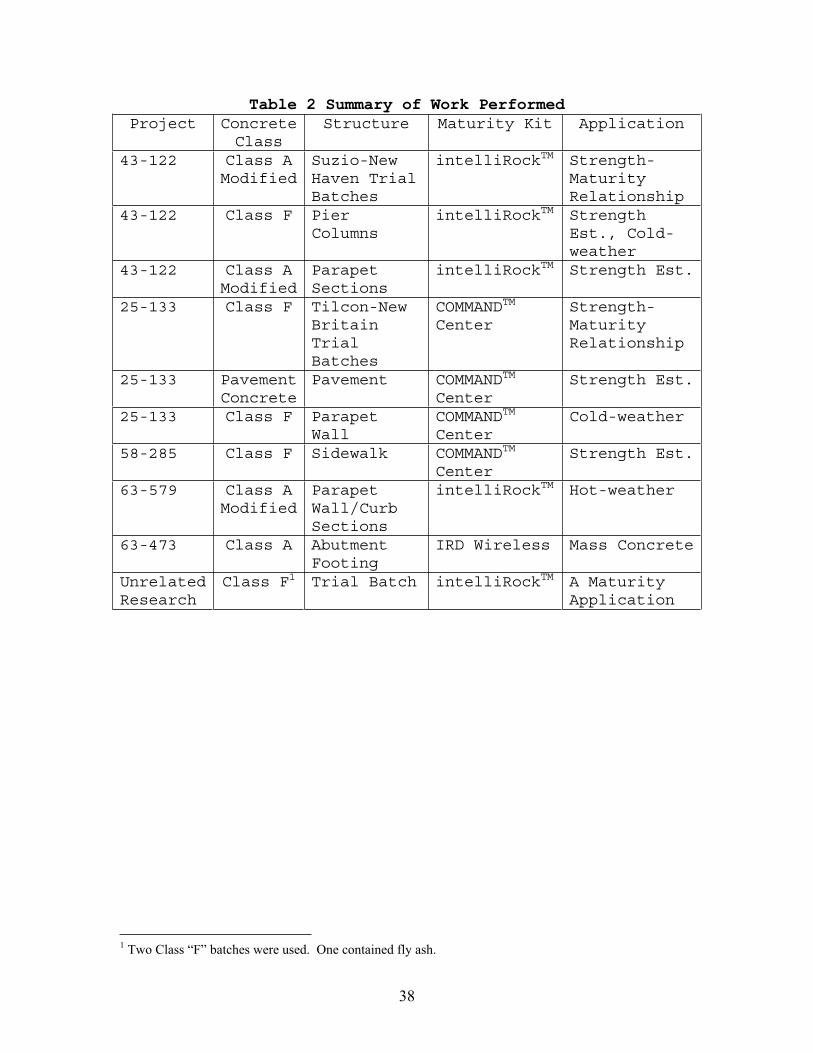
38
Table 2 Summary of Work Performed Project Concrete
ClassStructure Maturity Kit Application
43-122 Class A Modified
Suzio-NewHaven Trial Batches
intelliRockTM Strength-MaturityRelationship
43-122 Class F Pier Columns
intelliRockTM StrengthEst., Cold-weather
43-122 Class A Modified
ParapetSections
intelliRockTM Strength Est.
25-133 Class F Tilcon-New BritainTrialBatches
COMMANDTM
CenterStrength-MaturityRelationship
25-133 Pavement Concrete
Pavement COMMANDTM
CenterStrength Est.
25-133 Class F Parapet Wall
COMMANDTM
CenterCold-weather
58-285 Class F Sidewalk COMMANDTM
CenterStrength Est.
63-579 Class A Modified
ParapetWall/CurbSections
intelliRockTM Hot-weather
63-473 Class A Abutment Footing
IRD Wireless Mass Concrete
UnrelatedResearch
Class F1 Trial Batch intelliRockTM A Maturity Application
1 Two Class “F” batches were used. One contained fly ash.
39
ESTIMATING CONCRETE STRENGTH BY THE MATURITY METHOD
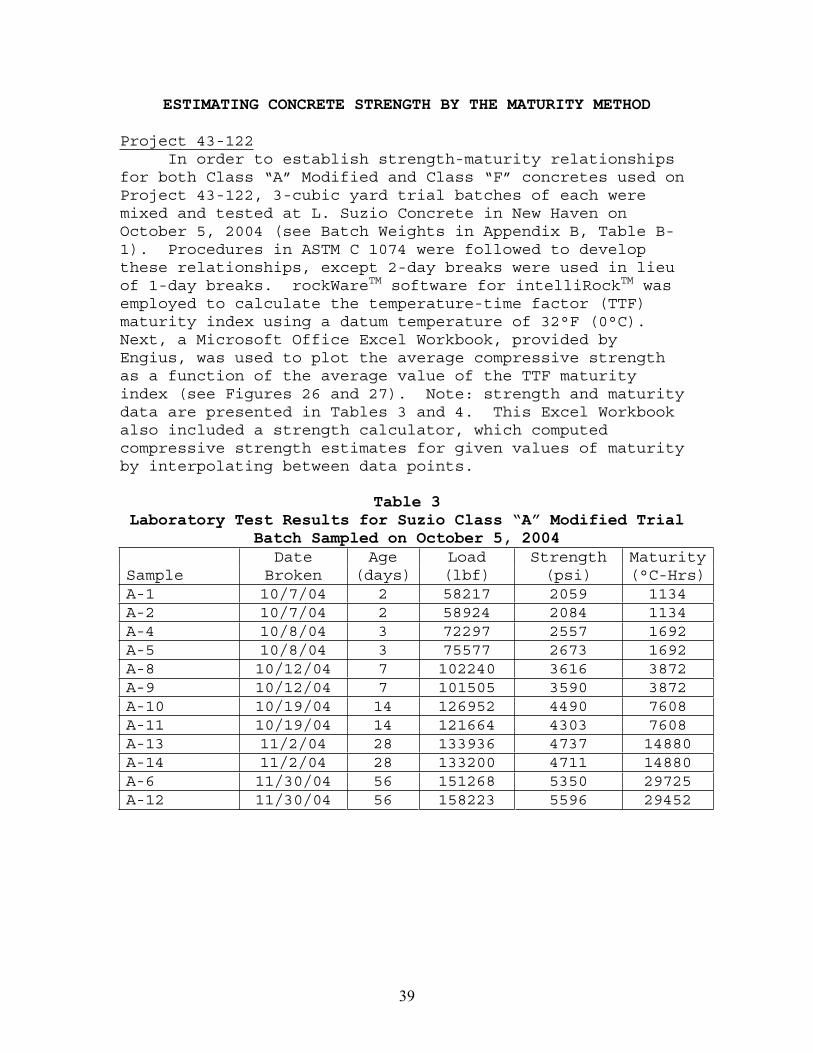
Project 43-122 In order to establish strength-maturity relationships for both Class “A” Modified and Class “F” concretes used on Project 43-122, 3-cubic yard trial batches of each were mixed and tested at L. Suzio Concrete in New Haven on October 5, 2004 (see Batch Weights in Appendix B, Table B-1). Procedures in ASTM C 1074 were followed to develop these relationships, except 2-day breaks were used in lieu of 1-day breaks. rockWareTM software for intelliRockTM was employed to calculate the temperature-time factor (TTF) maturity index using a datum temperature of 32°F (0°C).Next, a Microsoft Office Excel Workbook, provided by Engius, was used to plot the average compressive strength as a function of the average value of the TTF maturity index (see Figures 26 and 27). Note: strength and maturity data are presented in Tables 3 and 4. This Excel Workbook also included a strength calculator, which computed compressive strength estimates for given values of maturity by interpolating between data points.
Table 3 Laboratory Test Results for Suzio Class “A” Modified Trial
Batch Sampled on October 5, 2004
SampleDate
BrokenAge
(days)Load(lbf)
Strength(psi)
Maturity(°C-Hrs)
A-1 10/7/04 2 58217 2059 1134 A-2 10/7/04 2 58924 2084 1134 A-4 10/8/04 3 72297 2557 1692 A-5 10/8/04 3 75577 2673 1692 A-8 10/12/04 7 102240 3616 3872 A-9 10/12/04 7 101505 3590 3872 A-10 10/19/04 14 126952 4490 7608 A-11 10/19/04 14 121664 4303 7608 A-13 11/2/04 28 133936 4737 14880 A-14 11/2/04 28 133200 4711 14880 A-6 11/30/04 56 151268 5350 29725 A-12 11/30/04 56 158223 5596 29452
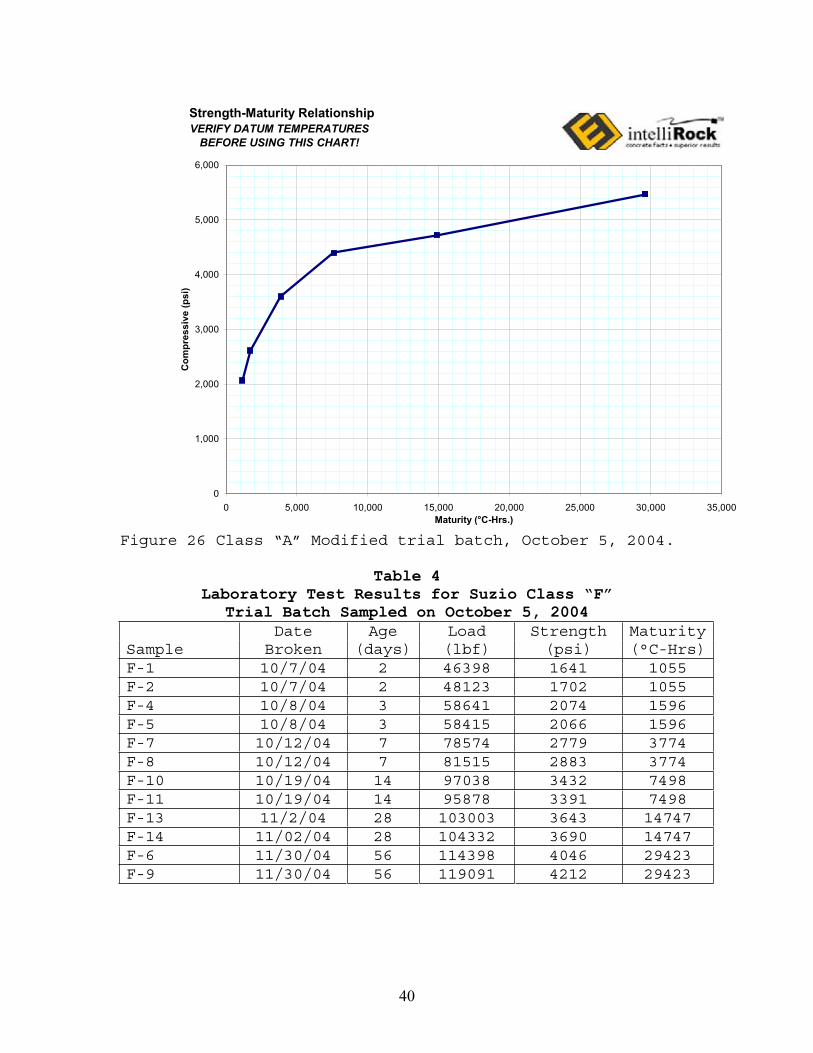
40
Strength-Maturity Relationship
0
1,000
2,000
3,000
4,000
5,000
6,000
0 5,000 10,000 15,000 20,000 25,000 30,000 35,000Maturity (°C-Hrs.)
Com
pres
sive
(psi
)
VERIFY DATUM TEMPERATURES BEFORE USING THIS CHART!
Figure 26 Class “A” Modified trial batch, October 5, 2004.
Table 4Laboratory Test Results for Suzio Class “F”
Trial Batch Sampled on October 5, 2004
SampleDate
BrokenAge
(days)Load(lbf)
Strength(psi)
Maturity(°C-Hrs)
F-1 10/7/04 2 46398 1641 1055 F-2 10/7/04 2 48123 1702 1055 F-4 10/8/04 3 58641 2074 1596 F-5 10/8/04 3 58415 2066 1596 F-7 10/12/04 7 78574 2779 3774 F-8 10/12/04 7 81515 2883 3774 F-10 10/19/04 14 97038 3432 7498 F-11 10/19/04 14 95878 3391 7498 F-13 11/2/04 28 103003 3643 14747 F-14 11/02/04 28 104332 3690 14747 F-6 11/30/04 56 114398 4046 29423 F-9 11/30/04 56 119091 4212 29423
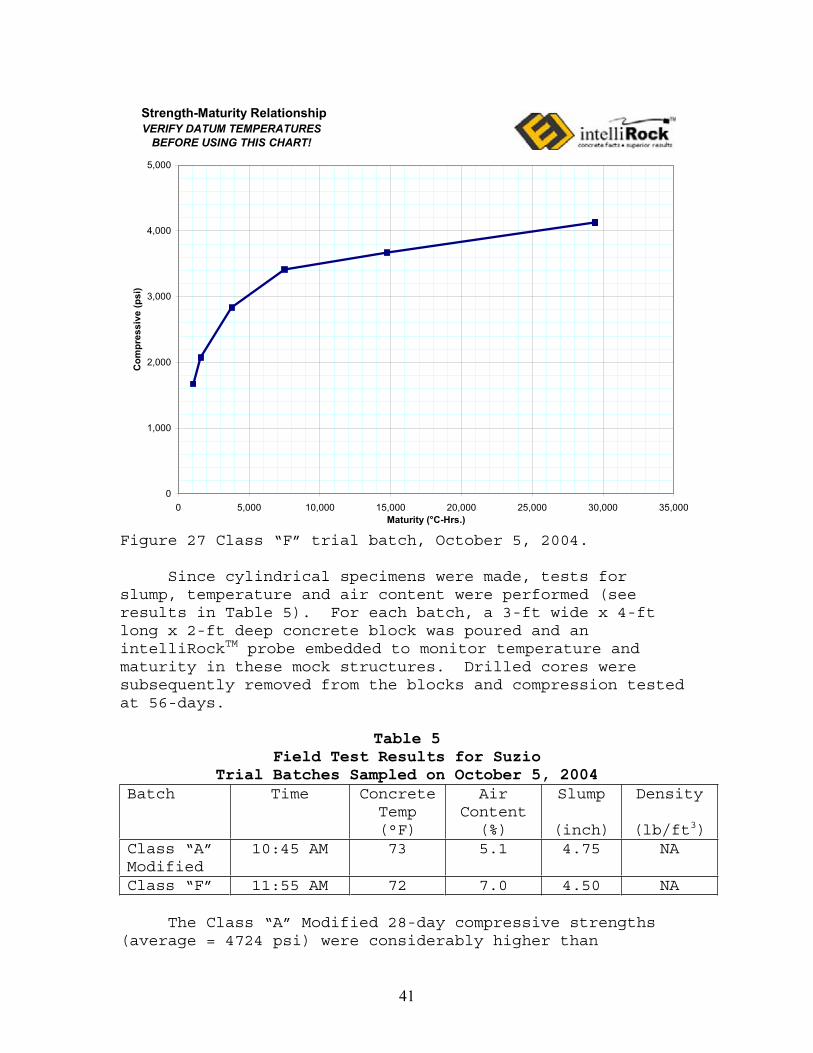
41
Strength-Maturity Relationship
0
1,000
2,000
3,000
4,000
5,000
0 5,000 10,000 15,000 20,000 25,000 30,000 35,000Maturity (°C-Hrs.)
Com
pres
sive
(psi
)VERIFY DATUM TEMPERATURES
BEFORE USING THIS CHART!
Figure 27 Class “F” trial batch, October 5, 2004.
Since cylindrical specimens were made, tests for slump, temperature and air content were performed (see results in Table 5). For each batch, a 3-ft wide x 4-ft long x 2-ft deep concrete block was poured and an intelliRockTM probe embedded to monitor temperature and maturity in these mock structures. Drilled cores were subsequently removed from the blocks and compression tested at 56-days.
Table 5Field Test Results for Suzio
Trial Batches Sampled on October 5, 2004Batch Time Concrete
Temp(°F)
AirContent
(%)
Slump
(inch)
Density
(lb/ft3)Class “A” Modified
10:45 AM 73 5.1 4.75 NA
Class “F” 11:55 AM 72 7.0 4.50 NA
The Class “A” Modified 28-day compressive strengths (average = 4724 psi) were considerably higher than
42
specified (f’c = 3000 psi). Since spare specimens were available, additional compressive strength tests were performed at 56-days. The average 56-day compressive strength was 5473 psi, which demonstrates that the concrete continued to gain strength even after 28-days. In this instance, researchers had reservations that the trial batch may have outperformed what was hoped to be a representative Class “A” Modified batch; however, in considering the amount of cement used per cubic yard (657 lbs), it was ultimately decided that these were reasonable strengths.Note: the minimum ConnDOT Class “F” cementitious material required is 658 lb/CY, while the minimum Class “A” requirement is 615 lb/CY; therefore, it is not surprising that the Class “A” Modified strength characteristics were more in keeping with a 4000 psi mix (Class “F”) than a 3000 psi mix (Class “A”). While Class “A” Modified strengths were much higher than specified, the Class “F” concrete failed to achieve its design strength of 4000 psi at 28-days, as the average 28-day compressive strength was only 3667 psi. Eventually, the Class “F” concrete strength achieved an average of 4129 psi at 56-days, but it was decided that another Class “F” trial batch should be mixed to develop a more representative strength-maturity relationship. This follow-up work was done on October 26, 2004. It is worth noting that Project 43-122 records showed a higher than usual rejection rate for smaller Class “F” concrete batches, such as the 3-CY trial batch used in this instance. So, the problem may have been inherent in the batch size, rather than the target mixture proportions. It is also worth mentioning that the air content was 7.0%, which is a little on the high side. This may at least partially explain low strengths. As stated previously, drilled cores were removed from the mock structures (blocks) and compression tested at 56-days. These in-place strength test results are presented in Table 6 with their corresponding maturities and estimated strengths based on the October 5th strength-maturity curves. The average Class “A” Modified in-place core strength was 4339 psi, while the estimated strength by the maturity method was 4883 psi. So, the core strength achieved was 89% of the estimated strength. The Class “F” results were similar (88% est.), as the average core strength was 3311 psi, compared to an estimated strength of 3770 psi.
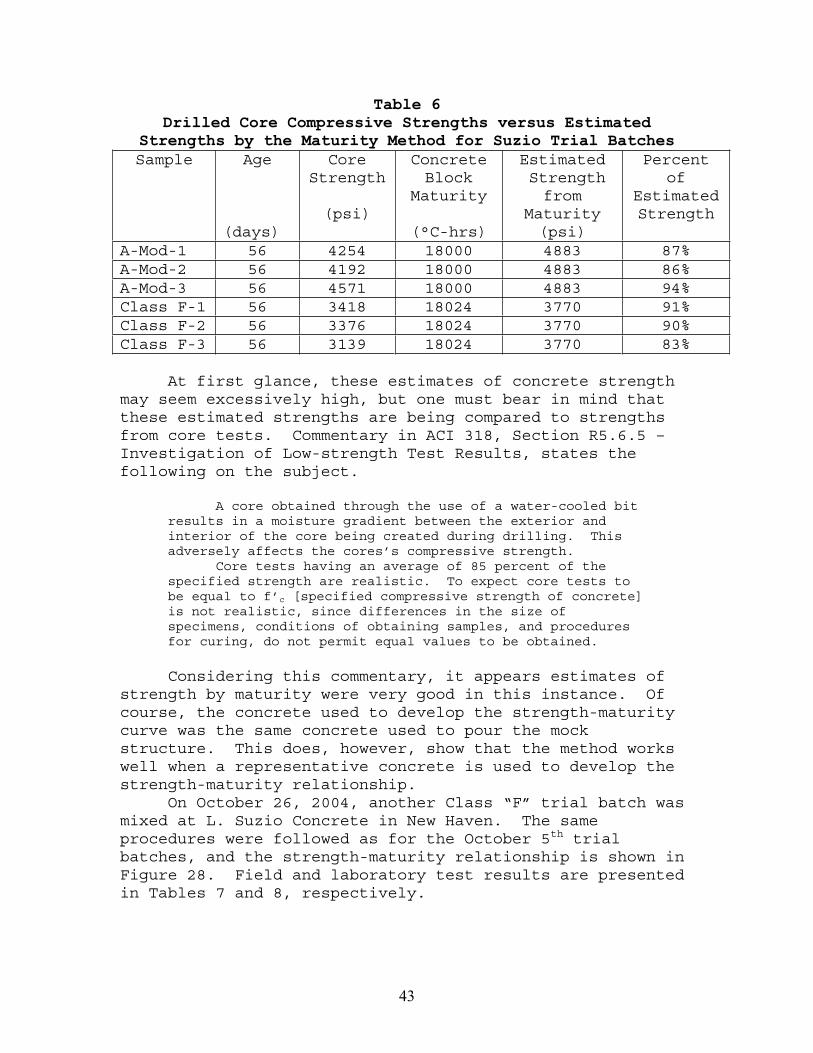
43
Table 6Drilled Core Compressive Strengths versus Estimated
Strengths by the Maturity Method for Suzio Trial Batches Sample Age
(days)
CoreStrength
(psi)
ConcreteBlock
Maturity
(°C-hrs)
Estimated Strength
fromMaturity(psi)
Percentof
EstimatedStrength
A-Mod-1 56 4254 18000 4883 87% A-Mod-2 56 4192 18000 4883 86% A-Mod-3 56 4571 18000 4883 94% Class F-1 56 3418 18024 3770 91% Class F-2 56 3376 18024 3770 90% Class F-3 56 3139 18024 3770 83%
At first glance, these estimates of concrete strength may seem excessively high, but one must bear in mind that these estimated strengths are being compared to strengths from core tests. Commentary in ACI 318, Section R5.6.5 – Investigation of Low-strength Test Results, states the following on the subject.
A core obtained through the use of a water-cooled bit results in a moisture gradient between the exterior and interior of the core being created during drilling. This adversely affects the cores’s compressive strength. Core tests having an average of 85 percent of the specified strength are realistic. To expect core tests to be equal to f’c [specified compressive strength of concrete] is not realistic, since differences in the size of specimens, conditions of obtaining samples, and procedures for curing, do not permit equal values to be obtained.
Considering this commentary, it appears estimates of strength by maturity were very good in this instance. Of course, the concrete used to develop the strength-maturity curve was the same concrete used to pour the mock structure. This does, however, show that the method works well when a representative concrete is used to develop the strength-maturity relationship. On October 26, 2004, another Class “F” trial batch was mixed at L. Suzio Concrete in New Haven. The same procedures were followed as for the October 5th trial batches, and the strength-maturity relationship is shown in Figure 28. Field and laboratory test results are presented in Tables 7 and 8, respectively.
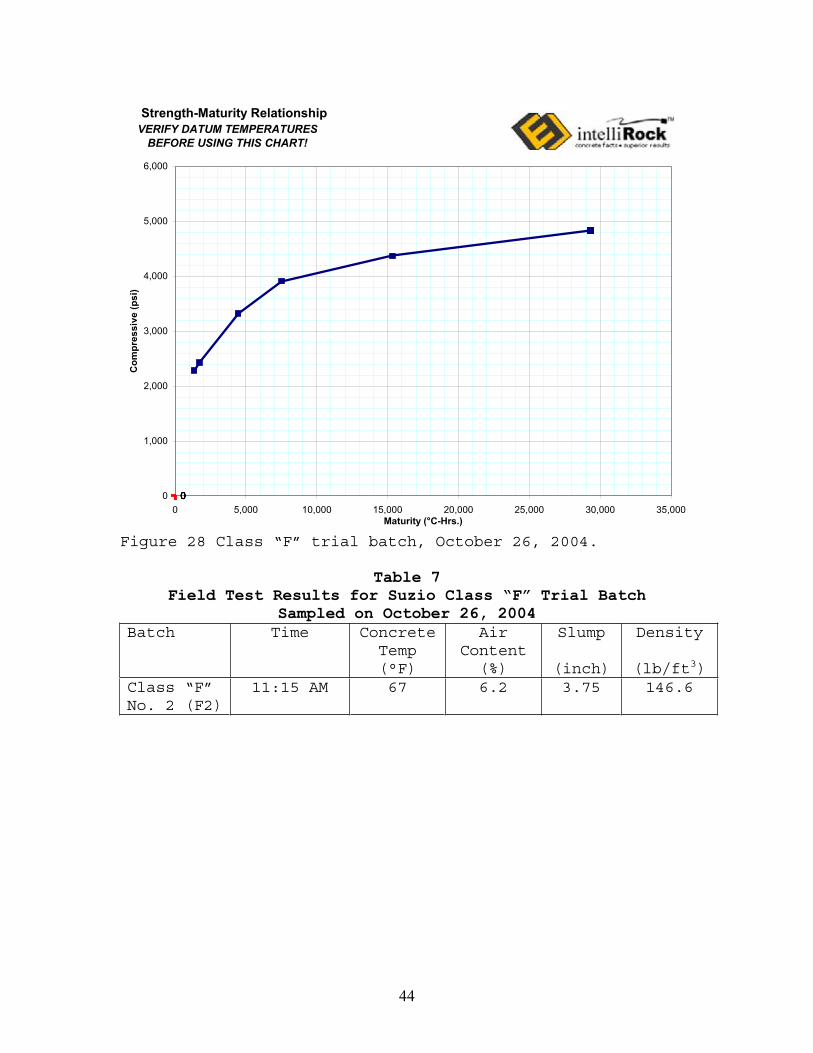
44
Strength-Maturity Relationship
000000000
1,000
2,000
3,000
4,000
5,000
6,000
0 5,000 10,000 15,000 20,000 25,000 30,000 35,000Maturity (°C-Hrs.)
Com
pres
sive
(psi
)VERIFY DATUM TEMPERATURES
BEFORE USING THIS CHART!
Figure 28 Class “F” trial batch, October 26, 2004.
Table 7Field Test Results for Suzio Class “F” Trial Batch
Sampled on October 26, 2004 Batch Time Concrete
Temp(°F)
AirContent
(%)
Slump
(inch)
Density
(lb/ft3)Class “F” No. 2 (F2)
11:15 AM 67 6.2 3.75 146.6
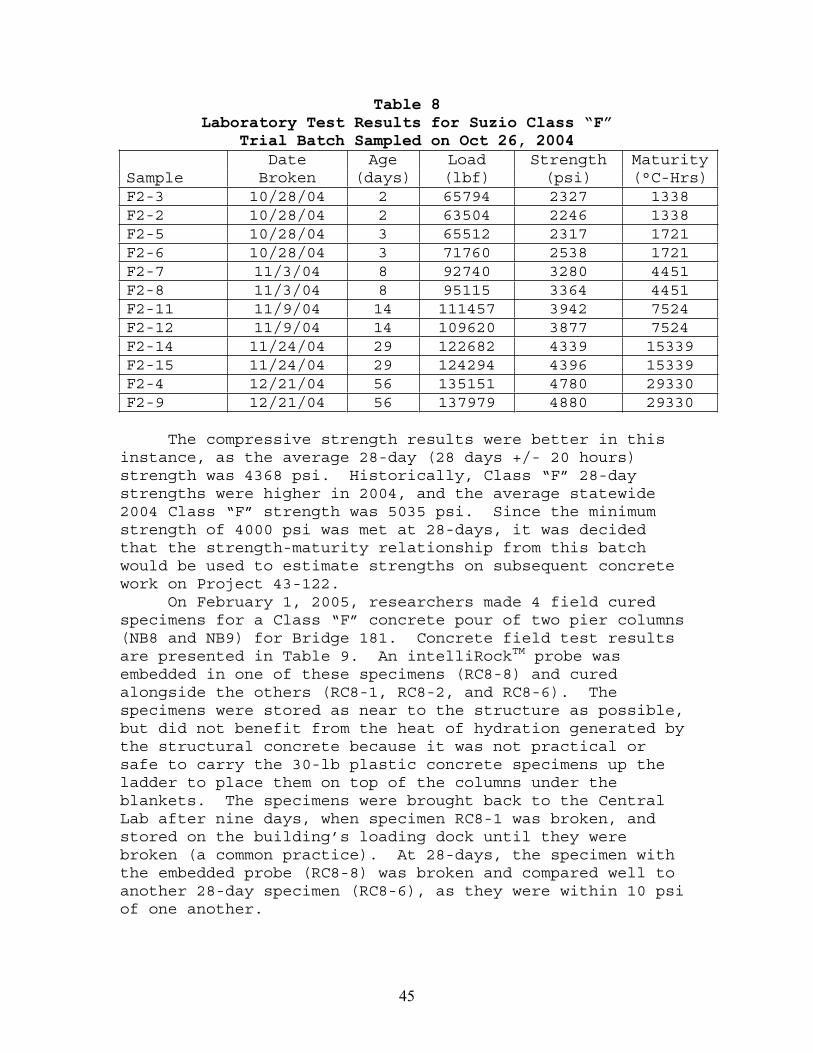
45
Table 8Laboratory Test Results for Suzio Class “F”
Trial Batch Sampled on Oct 26, 2004
SampleDate
BrokenAge
(days)Load(lbf)
Strength(psi)
Maturity(°C-Hrs)
F2-3 10/28/04 2 65794 2327 1338 F2-2 10/28/04 2 63504 2246 1338 F2-5 10/28/04 3 65512 2317 1721 F2-6 10/28/04 3 71760 2538 1721 F2-7 11/3/04 8 92740 3280 4451 F2-8 11/3/04 8 95115 3364 4451 F2-11 11/9/04 14 111457 3942 7524 F2-12 11/9/04 14 109620 3877 7524 F2-14 11/24/04 29 122682 4339 15339 F2-15 11/24/04 29 124294 4396 15339 F2-4 12/21/04 56 135151 4780 29330 F2-9 12/21/04 56 137979 4880 29330
The compressive strength results were better in this instance, as the average 28-day (28 days +/- 20 hours) strength was 4368 psi. Historically, Class “F” 28-day strengths were higher in 2004, and the average statewide 2004 Class “F” strength was 5035 psi. Since the minimum strength of 4000 psi was met at 28-days, it was decided that the strength-maturity relationship from this batch would be used to estimate strengths on subsequent concrete work on Project 43-122. On February 1, 2005, researchers made 4 field cured specimens for a Class “F” concrete pour of two pier columns (NB8 and NB9) for Bridge 181. Concrete field test results are presented in Table 9. An intelliRockTM probe was embedded in one of these specimens (RC8-8) and cured alongside the others (RC8-1, RC8-2, and RC8-6). The specimens were stored as near to the structure as possible, but did not benefit from the heat of hydration generated by the structural concrete because it was not practical or safe to carry the 30-lb plastic concrete specimens up the ladder to place them on top of the columns under the blankets. The specimens were brought back to the Central Lab after nine days, when specimen RC8-1 was broken, and stored on the building’s loading dock until they were broken (a common practice). At 28-days, the specimen with the embedded probe (RC8-8) was broken and compared well to another 28-day specimen (RC8-6), as they were within 10 psi of one another.
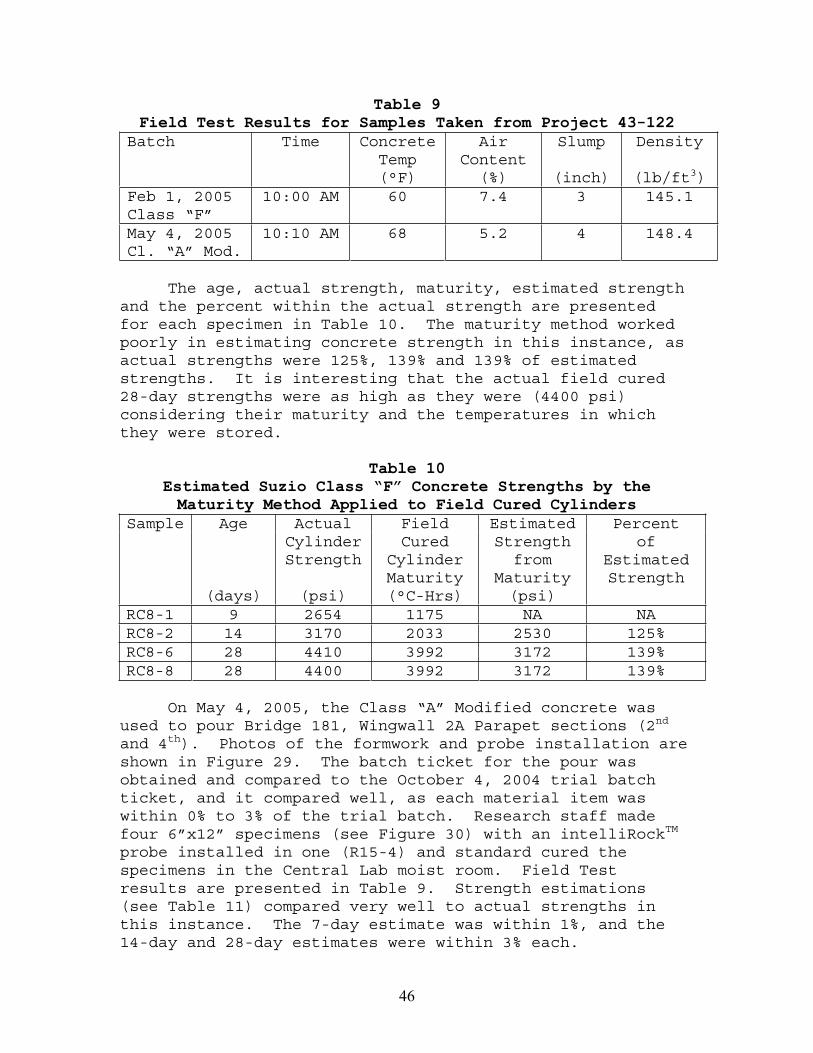
46
Table 9Field Test Results for Samples Taken from Project 43-122
Batch Time ConcreteTemp(°F)
AirContent
(%)
Slump
(inch)
Density
(lb/ft3)Feb 1, 2005 Class “F”
10:00 AM 60 7.4 3 145.1
May 4, 2005 Cl. “A” Mod.
10:10 AM 68 5.2 4 148.4
The age, actual strength, maturity, estimated strength and the percent within the actual strength are presented for each specimen in Table 10. The maturity method worked poorly in estimating concrete strength in this instance, as actual strengths were 125%, 139% and 139% of estimated strengths. It is interesting that the actual field cured 28-day strengths were as high as they were (4400 psi) considering their maturity and the temperatures in which they were stored.
Table 10Estimated Suzio Class “F” Concrete Strengths by the Maturity Method Applied to Field Cured Cylinders
PercentSample Age
(days)
ActualCylinderStrength
(psi)
FieldCured
CylinderMaturity(°C-Hrs)
EstimatedStrength
fromMaturity(psi)
ofEstimatedStrength
RC8-1 9 2654 1175 NA NA RC8-2 14 3170 2033 2530 125% RC8-6 28 4410 3992 3172 139% RC8-8 28 4400 3992 3172 139%
On May 4, 2005, the Class “A” Modified concrete was used to pour Bridge 181, Wingwall 2A Parapet sections (2nd
and 4th). Photos of the formwork and probe installation are shown in Figure 29. The batch ticket for the pour was obtained and compared to the October 4, 2004 trial batch ticket, and it compared well, as each material item was within 0% to 3% of the trial batch. Research staff made four 6”x12” specimens (see Figure 30) with an intelliRockTM
probe installed in one (R15-4) and standard cured the specimens in the Central Lab moist room. Field Test results are presented in Table 9. Strength estimations (see Table 11) compared very well to actual strengths in this instance. The 7-day estimate was within 1%, and the 14-day and 28-day estimates were within 3% each.
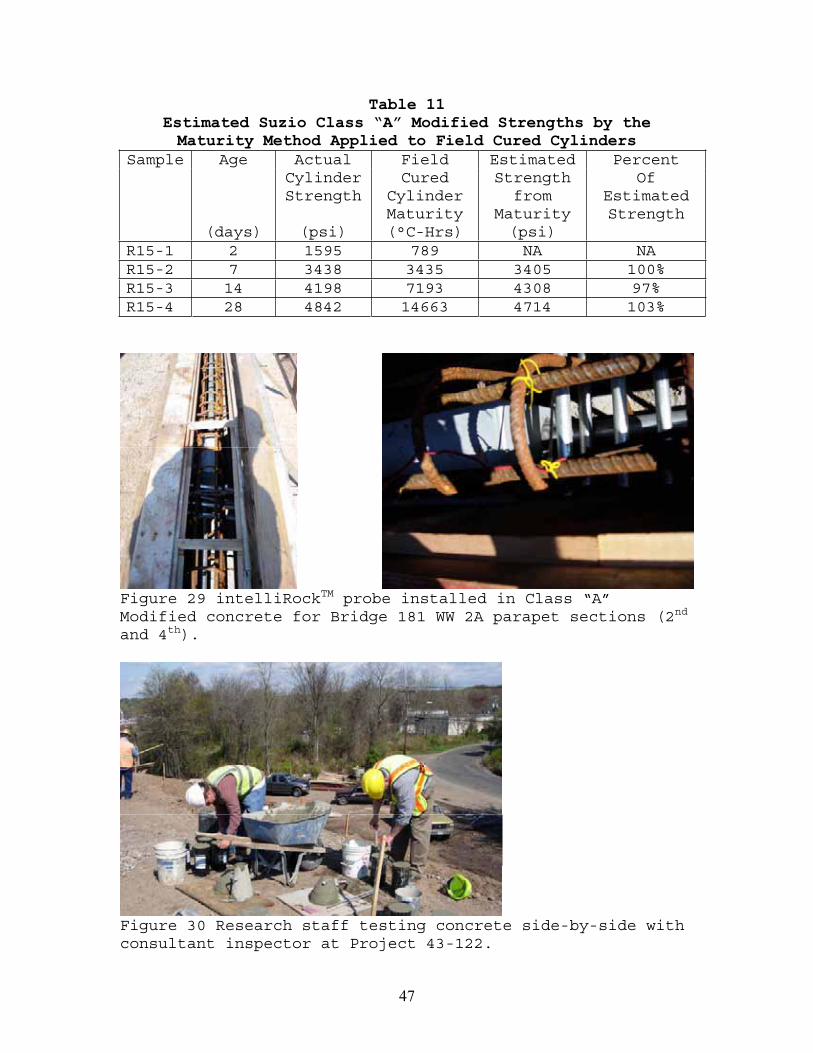
47
Table 11 Estimated Suzio Class “A” Modified Strengths by the Maturity Method Applied to Field Cured Cylinders
PercentSample Age
(days)
ActualCylinderStrength
(psi)
FieldCured
CylinderMaturity(°C-Hrs)
EstimatedStrength
fromMaturity(psi)
OfEstimatedStrength
R15-1 2 1595 789 NA NA R15-2 7 3438 3435 3405 100% R15-3 14 4198 7193 4308 97% R15-4 28 4842 14663 4714 103%
Figure 29 intelliRockTM probe installed in Class “A” Modified concrete for Bridge 181 WW 2A parapet sections (2nd
and 4th).
Figure 30 Research staff testing concrete side-by-side with consultant inspector at Project 43-122.
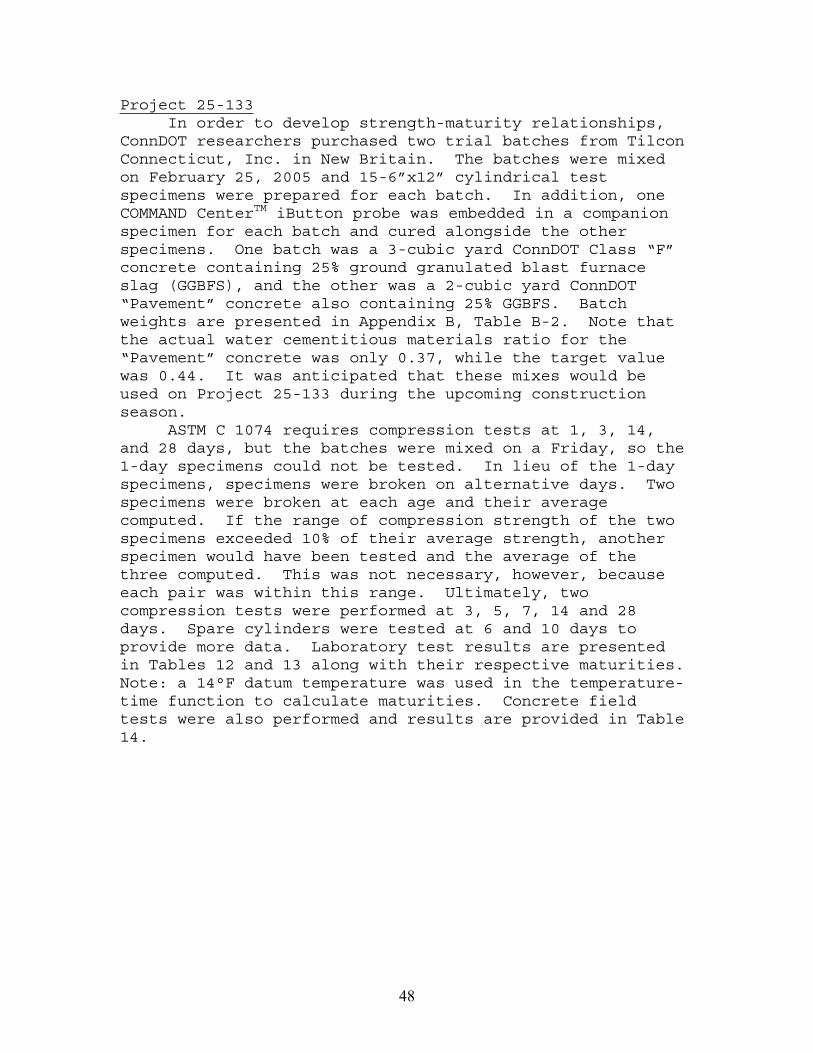
48
Project 25-133 In order to develop strength-maturity relationships, ConnDOT researchers purchased two trial batches from Tilcon Connecticut, Inc. in New Britain. The batches were mixed on February 25, 2005 and 15-6”x12” cylindrical test specimens were prepared for each batch. In addition, one COMMAND CenterTM iButton probe was embedded in a companion specimen for each batch and cured alongside the other specimens. One batch was a 3-cubic yard ConnDOT Class “F” concrete containing 25% ground granulated blast furnace slag (GGBFS), and the other was a 2-cubic yard ConnDOT “Pavement” concrete also containing 25% GGBFS. Batch weights are presented in Appendix B, Table B-2. Note that the actual water cementitious materials ratio for the “Pavement” concrete was only 0.37, while the target value was 0.44. It was anticipated that these mixes would be used on Project 25-133 during the upcoming construction season. ASTM C 1074 requires compression tests at 1, 3, 14, and 28 days, but the batches were mixed on a Friday, so the 1-day specimens could not be tested. In lieu of the 1-day specimens, specimens were broken on alternative days. Two specimens were broken at each age and their average computed. If the range of compression strength of the two specimens exceeded 10% of their average strength, another specimen would have been tested and the average of the three computed. This was not necessary, however, because each pair was within this range. Ultimately, two compression tests were performed at 3, 5, 7, 14 and 28 days. Spare cylinders were tested at 6 and 10 days to provide more data. Laboratory test results are presented in Tables 12 and 13 along with their respective maturities.Note: a 14°F datum temperature was used in the temperature-time function to calculate maturities. Concrete field tests were also performed and results are provided in Table 14.
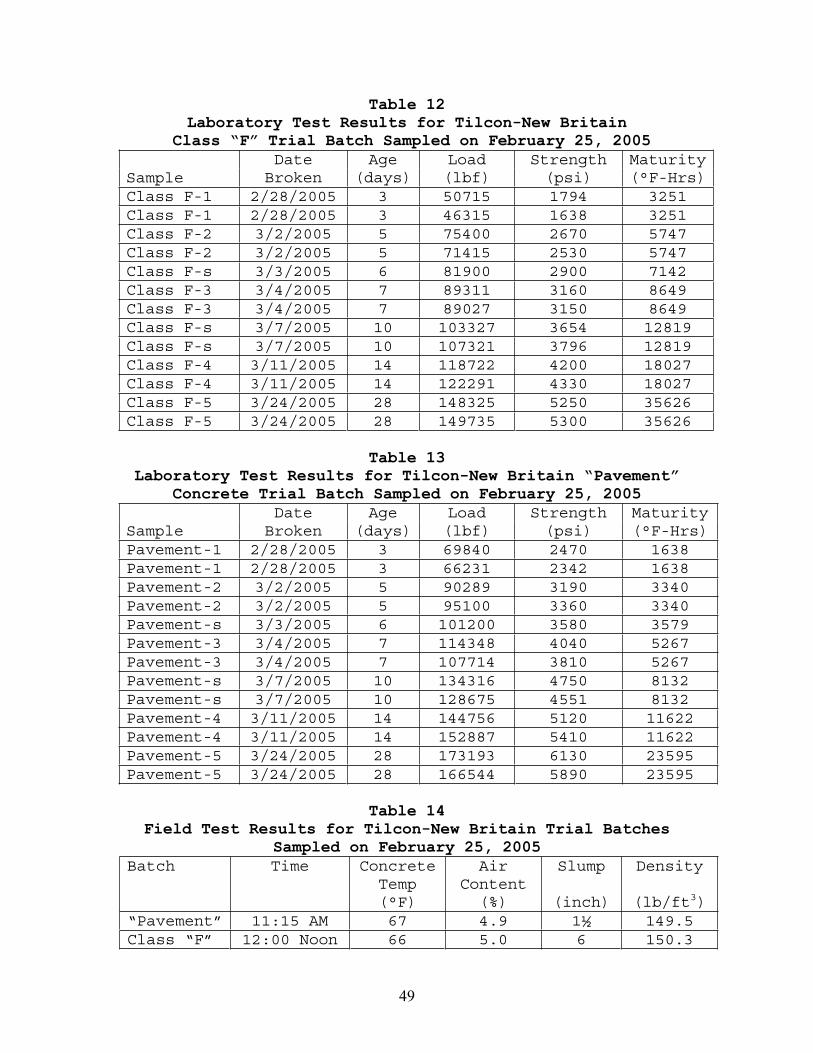
49
Table 12Laboratory Test Results for Tilcon-New Britain
Class “F” Trial Batch Sampled on February 25, 2005
SampleDate
BrokenAge
(days)Load(lbf)
Strength(psi)
Maturity(°F-Hrs)
Class F-1 2/28/2005 3 50715 1794 3251 Class F-1 2/28/2005 3 46315 1638 3251 Class F-2 3/2/2005 5 75400 2670 5747 Class F-2 3/2/2005 5 71415 2530 5747 Class F-s 3/3/2005 6 81900 2900 7142 Class F-3 3/4/2005 7 89311 3160 8649 Class F-3 3/4/2005 7 89027 3150 8649 Class F-s 3/7/2005 10 103327 3654 12819 Class F-s 3/7/2005 10 107321 3796 12819 Class F-4 3/11/2005 14 118722 4200 18027 Class F-4 3/11/2005 14 122291 4330 18027 Class F-5 3/24/2005 28 148325 5250 35626 Class F-5 3/24/2005 28 149735 5300 35626
Table 13Laboratory Test Results for Tilcon-New Britain “Pavement”
Concrete Trial Batch Sampled on February 25, 2005
SampleDate
BrokenAge
(days)Load(lbf)
Strength(psi)
Maturity(°F-Hrs)
Pavement-1 2/28/2005 3 69840 2470 1638 Pavement-1 2/28/2005 3 66231 2342 1638 Pavement-2 3/2/2005 5 90289 3190 3340 Pavement-2 3/2/2005 5 95100 3360 3340 Pavement-s 3/3/2005 6 101200 3580 3579 Pavement-3 3/4/2005 7 114348 4040 5267 Pavement-3 3/4/2005 7 107714 3810 5267 Pavement-s 3/7/2005 10 134316 4750 8132 Pavement-s 3/7/2005 10 128675 4551 8132 Pavement-4 3/11/2005 14 144756 5120 11622 Pavement-4 3/11/2005 14 152887 5410 11622 Pavement-5 3/24/2005 28 173193 6130 23595 Pavement-5 3/24/2005 28 166544 5890 23595
Table 14Field Test Results for Tilcon-New Britain Trial Batches
Sampled on February 25, 2005 Batch Time Concrete
Temp(°F)
AirContent
(%)
Slump
(inch)
Density
(lb/ft3)“Pavement” 11:15 AM 67 4.9 1½ 149.5 Class “F” 12:00 Noon 66 5.0 6 150.3
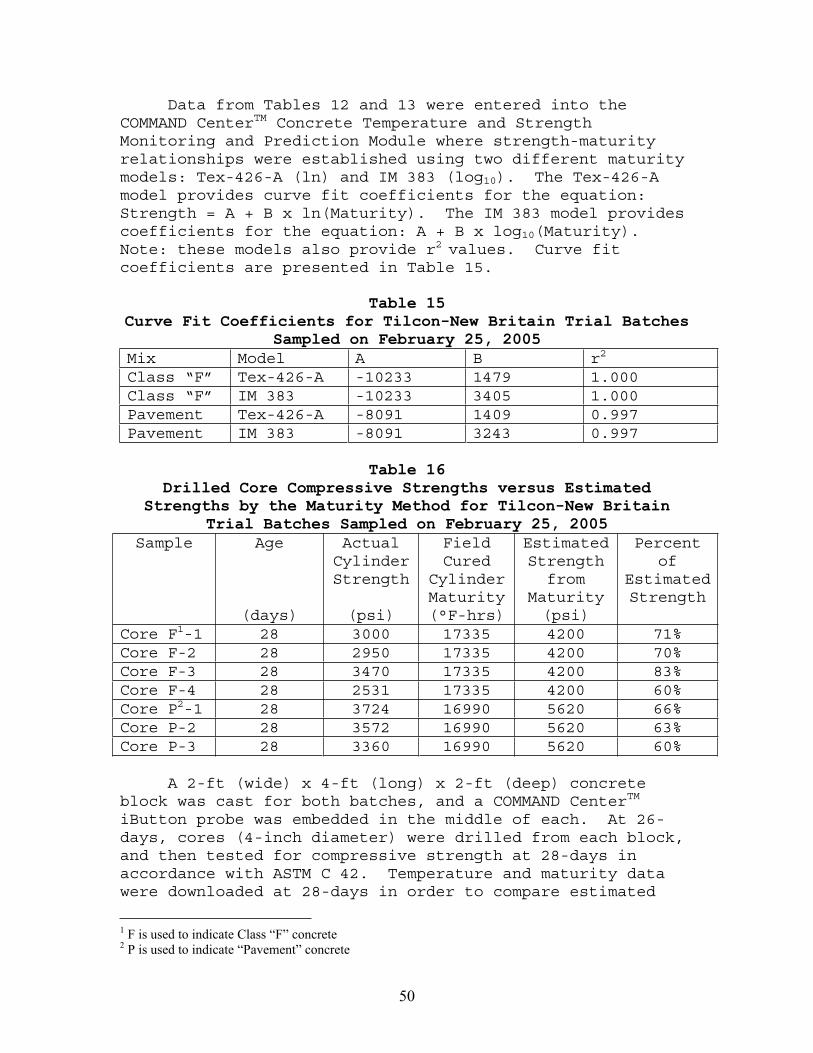
50
Data from Tables 12 and 13 were entered into the COMMAND CenterTM Concrete Temperature and Strength Monitoring and Prediction Module where strength-maturity relationships were established using two different maturity models: Tex-426-A (ln) and IM 383 (log10). The Tex-426-A model provides curve fit coefficients for the equation: Strength = A + B x ln(Maturity). The IM 383 model provides coefficients for the equation: A + B x log10(Maturity).Note: these models also provide r2 values. Curve fit coefficients are presented in Table 15.
Table 15Curve Fit Coefficients for Tilcon-New Britain Trial Batches
Sampled on February 25, 2005 Mix Model A B r2
Class “F” Tex-426-A -10233 1479 1.000 Class “F” IM 383 -10233 3405 1.000 Pavement Tex-426-A -8091 1409 0.997 Pavement IM 383 -8091 3243 0.997
Table 16Drilled Core Compressive Strengths versus Estimated
Strengths by the Maturity Method for Tilcon-New Britain Trial Batches Sampled on February 25, 2005
Sample Age
(days)
ActualCylinderStrength
(psi)
FieldCured
CylinderMaturity(°F-hrs)
EstimatedStrength
fromMaturity(psi)
Percentof
EstimatedStrength
Core F1-1 28 3000 17335 4200 71% Core F-2 28 2950 17335 4200 70% Core F-3 28 3470 17335 4200 83% Core F-4 28 2531 17335 4200 60% Core P2-1 28 3724 16990 5620 66% Core P-2 28 3572 16990 5620 63% Core P-3 28 3360 16990 5620 60%
A 2-ft (wide) x 4-ft (long) x 2-ft (deep) concrete block was cast for both batches, and a COMMAND CenterTM
iButton probe was embedded in the middle of each. At 26-days, cores (4-inch diameter) were drilled from each block, and then tested for compressive strength at 28-days in accordance with ASTM C 42. Temperature and maturity data were downloaded at 28-days in order to compare estimated
1 F is used to indicate Class “F” concrete 2 P is used to indicate “Pavement” concrete

51
strengths to in-place strengths determined by testing the drilled cores. These data are tabulated in Table 16. The average in-place compressive strength of the Class “F” block was 2990 psi, and it was 3552 psi for the “Pavement” block. These values were much lower than estimated with maturity, as their estimated strengths were 4200 psi and 5620 psi, for the Class “F” and “Pavement” concretes, respectively. Therefore, it appears strength estimations using maturity were poor in these instances; however, consideration should be given to the method of consolidation used when these blocks were poured.Vibrators were not available to properly consolidate the blocks, so they were manually rodded with 5/8” diameter x 24” long testing rods. It is possible that the in-place strengths were lower for this reason, but it is unlikely that it completely explains the extent to which they were lower. On April 6th, 7th and 20th, 2005, Research staff applied the maturity method to concrete work on Project 25-133. It was hoped that the “Pavement” concrete used for this work would be the same as the aforementioned “Pavement” concrete batched on February 25th, 2005. However, upon examination of batch tickets received, it was realized that the concrete for this work did not contain GGBFS. Again, the trial batch prepared on February 25th, for which a strength-maturity curve was plotted, contained 25% GGBFS. Also, remember that the actual water cementitious material ratio (0.37) was lower than the target (0.44) for “Pavement” concrete (see Appendix B, Table B-2). This may explain why the strengths were so much higher for the calibration concrete (see Table 13, 28-day strength = 6000 psi) than the minimum specified 28-day strength of 3500 psi. Target weights per cubic yard obtained from batch tickets for the April 6th and 7th concretes are presented for comparison to the February 25th calibration batch in Table B-3. The April 20th target weights were similar, except an accelerator was used in order that the pavement could be opened to construction traffic earlier. Accelerators can dramatically alter concrete strength-maturity relationships. The concrete was used for sections of I-84 being widened with a jointed reinforced concrete pavement to match existing pavement, which was subsequently overlaid with hot mix asphalt. The first sample tested was located at Station 14+600 WB, and the second sample was at Station 14+660 WB. Both of these samples were obtained on April 6, 2005. Consultant inspectors and research staff each made
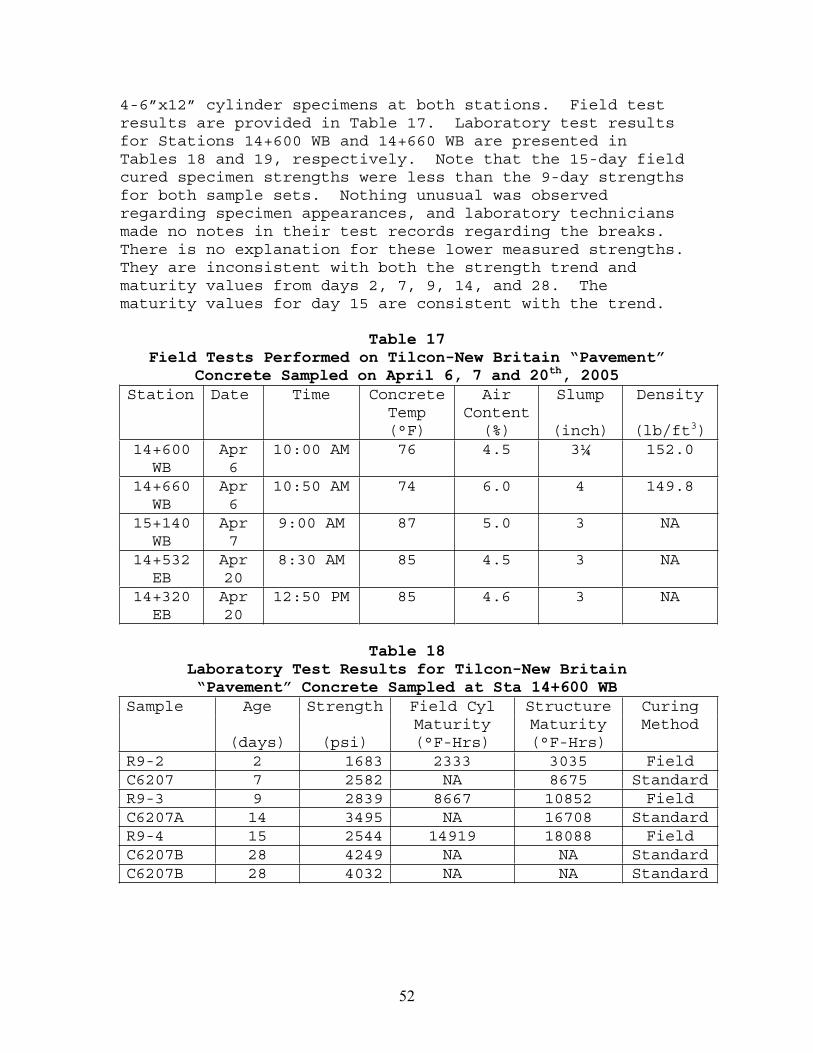
52
4-6”x12” cylinder specimens at both stations. Field test results are provided in Table 17. Laboratory test results for Stations 14+600 WB and 14+660 WB are presented in Tables 18 and 19, respectively. Note that the 15-day field cured specimen strengths were less than the 9-day strengths for both sample sets. Nothing unusual was observed regarding specimen appearances, and laboratory technicians made no notes in their test records regarding the breaks.There is no explanation for these lower measured strengths.They are inconsistent with both the strength trend and maturity values from days 2, 7, 9, 14, and 28. The maturity values for day 15 are consistent with the trend.
Table 17 Field Tests Performed on Tilcon-New Britain “Pavement”
Concrete Sampled on April 6, 7 and 20th, 2005 Station Date Time Concrete
Temp(°F)
AirContent
(%)
Slump
(inch)
Density
(lb/ft3)14+600
WBApr6
10:00 AM 76 4.5 3¼ 152.0
14+660WB
Apr6
10:50 AM 74 6.0 4 149.8
15+140WB
Apr7
9:00 AM 87 5.0 3 NA
14+532EB
Apr20
8:30 AM 85 4.5 3 NA
14+320EB
Apr20
12:50 PM 85 4.6 3 NA
Table 18 Laboratory Test Results for Tilcon-New Britain“Pavement” Concrete Sampled at Sta 14+600 WB
Sample Age
(days)
Strength
(psi)
Field Cyl Maturity(°F-Hrs)
StructureMaturity(°F-Hrs)
CuringMethod
R9-2 2 1683 2333 3035 Field C6207 7 2582 NA 8675 StandardR9-3 9 2839 8667 10852 Field C6207A 14 3495 NA 16708 StandardR9-4 15 2544 14919 18088 Field C6207B 28 4249 NA NA StandardC6207B 28 4032 NA NA Standard
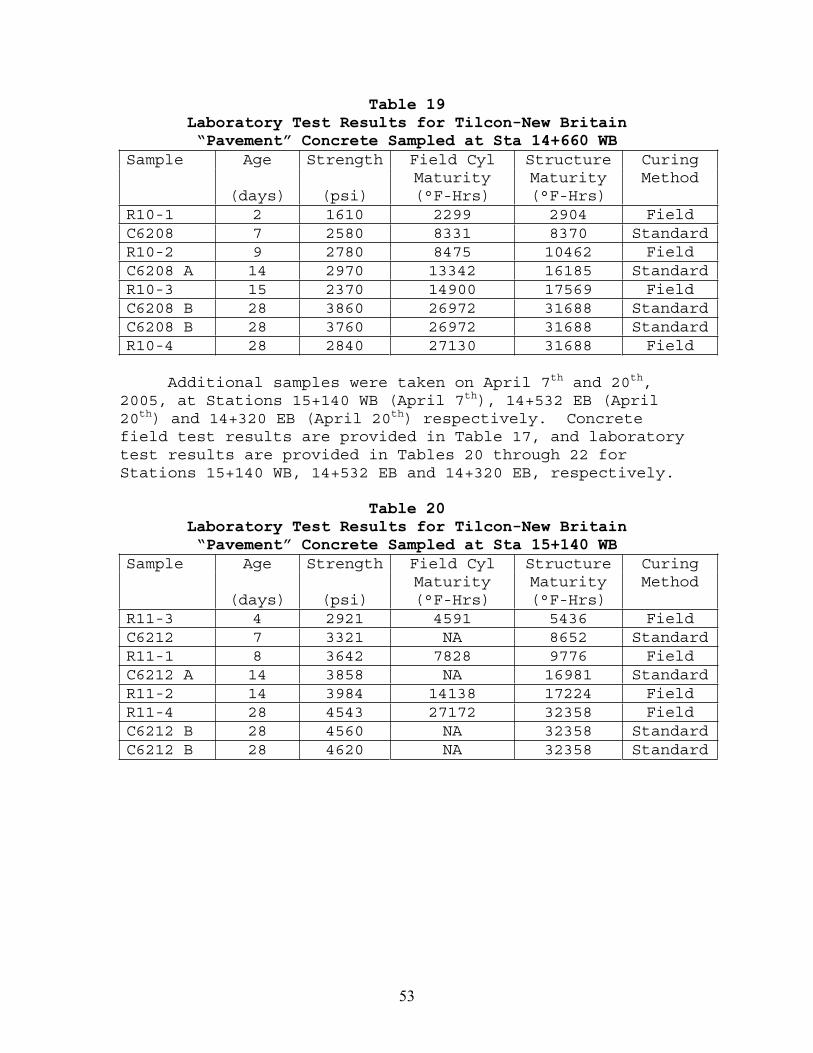
53
Table 19Laboratory Test Results for Tilcon-New Britain“Pavement” Concrete Sampled at Sta 14+660 WB
Sample Age
(days)
Strength
(psi)
Field Cyl Maturity(°F-Hrs)
StructureMaturity(°F-Hrs)
CuringMethod
R10-1 2 1610 2299 2904 Field C6208 7 2580 8331 8370 StandardR10-2 9 2780 8475 10462 Field C6208 A 14 2970 13342 16185 StandardR10-3 15 2370 14900 17569 Field C6208 B 28 3860 26972 31688 StandardC6208 B 28 3760 26972 31688 StandardR10-4 28 2840 27130 31688 Field
Additional samples were taken on April 7th and 20th,2005, at Stations 15+140 WB (April 7th), 14+532 EB (April 20th) and 14+320 EB (April 20th) respectively. Concrete field test results are provided in Table 17, and laboratory test results are provided in Tables 20 through 22 for Stations 15+140 WB, 14+532 EB and 14+320 EB, respectively.
Table 20Laboratory Test Results for Tilcon-New Britain“Pavement” Concrete Sampled at Sta 15+140 WB
Sample Age
(days)
Strength
(psi)
Field Cyl Maturity(°F-Hrs)
StructureMaturity(°F-Hrs)
CuringMethod
R11-3 4 2921 4591 5436 Field C6212 7 3321 NA 8652 StandardR11-1 8 3642 7828 9776 Field C6212 A 14 3858 NA 16981 StandardR11-2 14 3984 14138 17224 Field R11-4 28 4543 27172 32358 Field C6212 B 28 4560 NA 32358 StandardC6212 B 28 4620 NA 32358 Standard
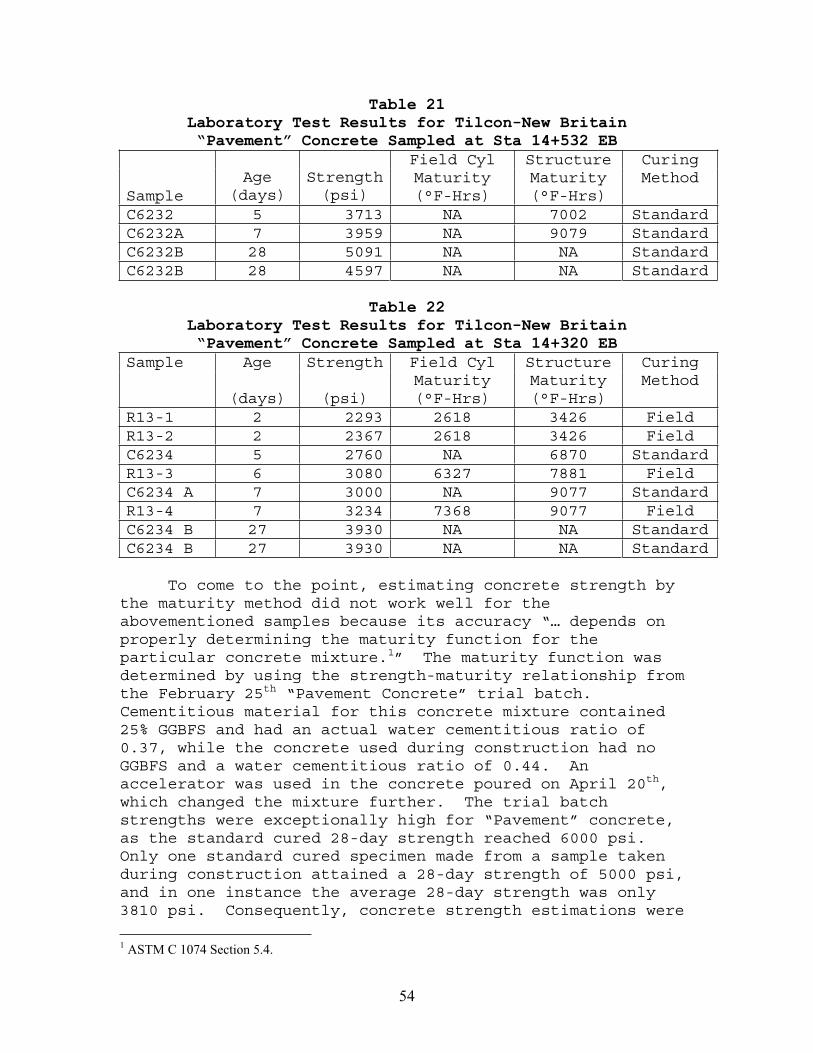
54
Table 21Laboratory Test Results for Tilcon-New Britain“Pavement” Concrete Sampled at Sta 14+532 EB
SampleAge
(days)Strength(psi)
Field Cyl Maturity(°F-Hrs)
StructureMaturity(°F-Hrs)
CuringMethod
C6232 5 3713 NA 7002 StandardC6232A 7 3959 NA 9079 StandardC6232B 28 5091 NA NA StandardC6232B 28 4597 NA NA Standard
Table 22Laboratory Test Results for Tilcon-New Britain“Pavement” Concrete Sampled at Sta 14+320 EB
Sample Age
(days)
Strength
(psi)
Field Cyl Maturity(°F-Hrs)
StructureMaturity(°F-Hrs)
CuringMethod
R13-1 2 2293 2618 3426 Field R13-2 2 2367 2618 3426 Field C6234 5 2760 NA 6870 StandardR13-3 6 3080 6327 7881 Field C6234 A 7 3000 NA 9077 StandardR13-4 7 3234 7368 9077 Field C6234 B 27 3930 NA NA StandardC6234 B 27 3930 NA NA Standard
To come to the point, estimating concrete strength by the maturity method did not work well for the abovementioned samples because its accuracy “… depends on properly determining the maturity function for the particular concrete mixture.1” The maturity function was determined by using the strength-maturity relationship from the February 25th “Pavement Concrete” trial batch.Cementitious material for this concrete mixture contained 25% GGBFS and had an actual water cementitious ratio of 0.37, while the concrete used during construction had no GGBFS and a water cementitious ratio of 0.44. An accelerator was used in the concrete poured on April 20th,which changed the mixture further. The trial batch strengths were exceptionally high for “Pavement” concrete, as the standard cured 28-day strength reached 6000 psi.Only one standard cured specimen made from a sample taken during construction attained a 28-day strength of 5000 psi, and in one instance the average 28-day strength was only 3810 psi. Consequently, concrete strength estimations were
1 ASTM C 1074 Section 5.4.
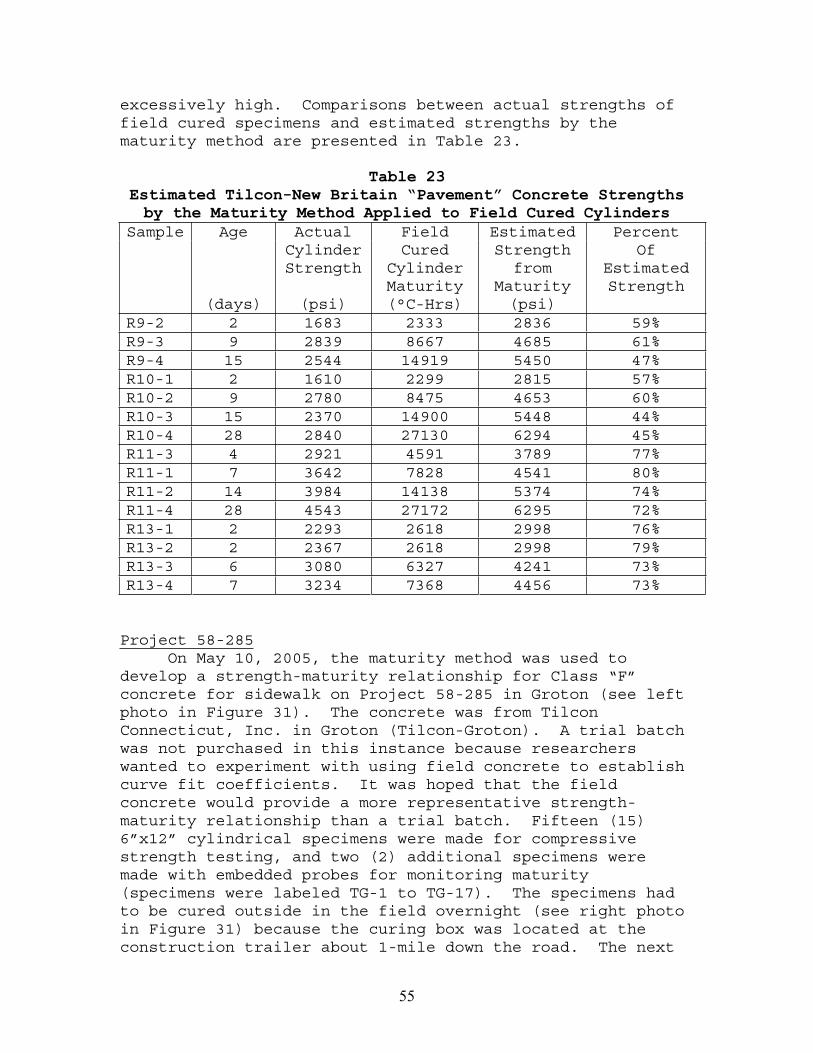
55
excessively high. Comparisons between actual strengths of field cured specimens and estimated strengths by the maturity method are presented in Table 23.
Table 23Estimated Tilcon-New Britain “Pavement” Concrete Strengths by the Maturity Method Applied to Field Cured Cylinders
PercentSample Age
(days)
ActualCylinderStrength
(psi)
FieldCured
CylinderMaturity(°C-Hrs)
EstimatedStrength
fromMaturity(psi)
OfEstimatedStrength
R9-2 2 1683 2333 2836 59% R9-3 9 2839 8667 4685 61% R9-4 15 2544 14919 5450 47% R10-1 2 1610 2299 2815 57% R10-2 9 2780 8475 4653 60% R10-3 15 2370 14900 5448 44% R10-4 28 2840 27130 6294 45% R11-3 4 2921 4591 3789 77% R11-1 7 3642 7828 4541 80% R11-2 14 3984 14138 5374 74% R11-4 28 4543 27172 6295 72% R13-1 2 2293 2618 2998 76% R13-2 2 2367 2618 2998 79% R13-3 6 3080 6327 4241 73% R13-4 7 3234 7368 4456 73%
Project 58-285 On May 10, 2005, the maturity method was used to develop a strength-maturity relationship for Class “F” concrete for sidewalk on Project 58-285 in Groton (see left photo in Figure 31). The concrete was from Tilcon Connecticut, Inc. in Groton (Tilcon-Groton). A trial batch was not purchased in this instance because researchers wanted to experiment with using field concrete to establish curve fit coefficients. It was hoped that the field concrete would provide a more representative strength-maturity relationship than a trial batch. Fifteen (15) 6”x12” cylindrical specimens were made for compressive strength testing, and two (2) additional specimens were made with embedded probes for monitoring maturity (specimens were labeled TG-1 to TG-17). The specimens had to be cured outside in the field overnight (see right photo in Figure 31) because the curing box was located at the construction trailer about 1-mile down the road. The next
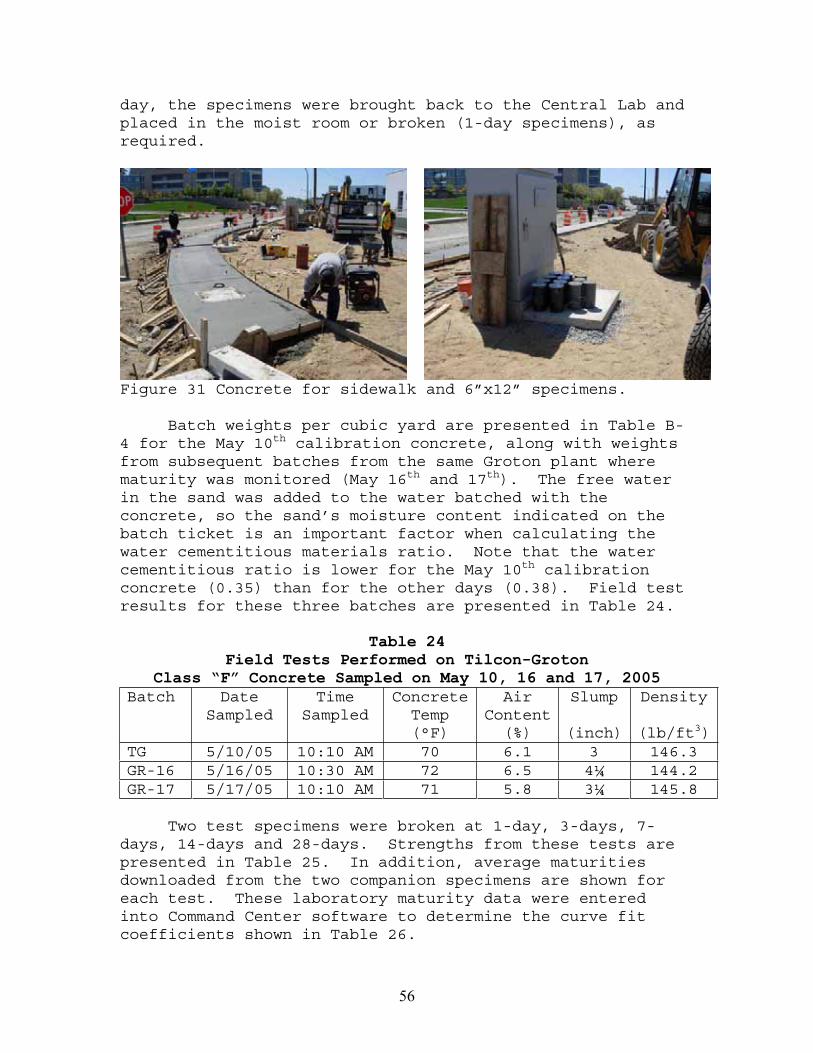
56
day, the specimens were brought back to the Central Lab and placed in the moist room or broken (1-day specimens), as required.
Figure 31 Concrete for sidewalk and 6”x12” specimens.
Batch weights per cubic yard are presented in Table B-4 for the May 10th calibration concrete, along with weights from subsequent batches from the same Groton plant where maturity was monitored (May 16th and 17th). The free water in the sand was added to the water batched with the concrete, so the sand’s moisture content indicated on the batch ticket is an important factor when calculating the water cementitious materials ratio. Note that the water cementitious ratio is lower for the May 10th calibration concrete (0.35) than for the other days (0.38). Field test results for these three batches are presented in Table 24.
Table 24Field Tests Performed on Tilcon-Groton
Class “F” Concrete Sampled on May 10, 16 and 17, 2005 Batch Date
SampledTime
SampledConcrete
Temp(°F)
AirContent
(%)
Slump
(inch)
Density
(lb/ft3)TG 5/10/05 10:10 AM 70 6.1 3 146.3 GR-16 5/16/05 10:30 AM 72 6.5 4¼ 144.2 GR-17 5/17/05 10:10 AM 71 5.8 3¼ 145.8
Two test specimens were broken at 1-day, 3-days, 7-days, 14-days and 28-days. Strengths from these tests are presented in Table 25. In addition, average maturities downloaded from the two companion specimens are shown for each test. These laboratory maturity data were entered into Command Center software to determine the curve fit coefficients shown in Table 26.
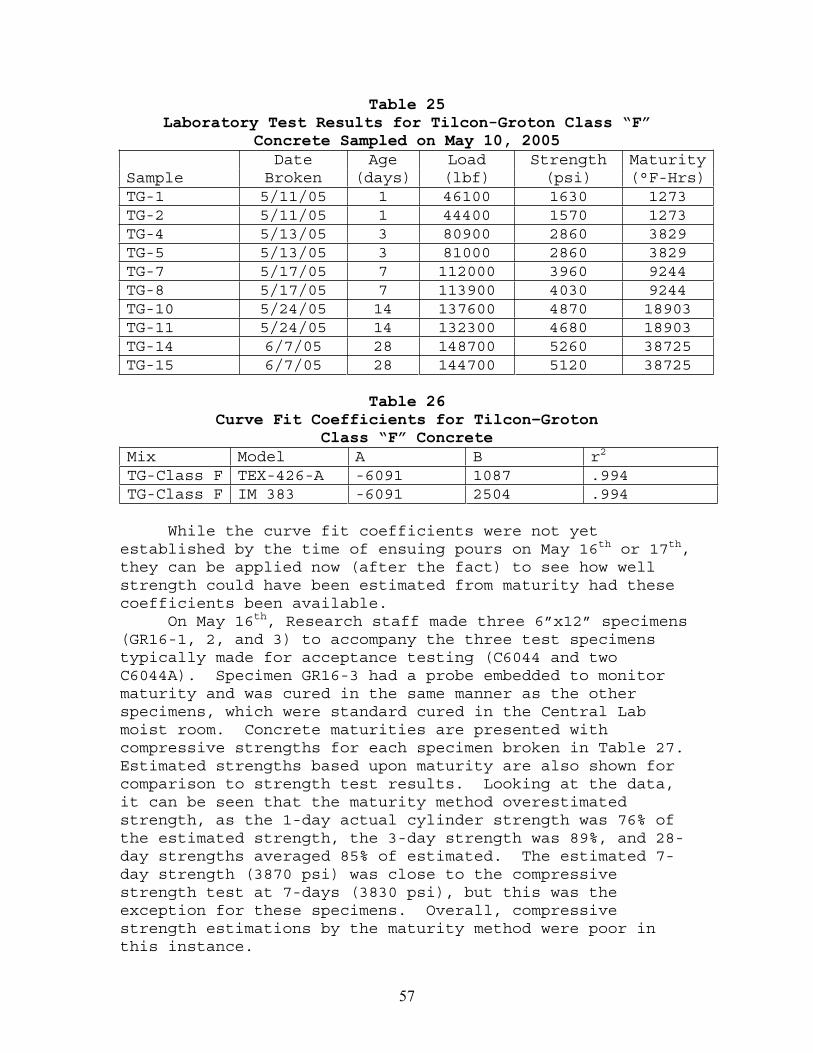
57
Table 25Laboratory Test Results for Tilcon-Groton Class “F”
Concrete Sampled on May 10, 2005
SampleDate
BrokenAge
(days)Load(lbf)
Strength(psi)
Maturity(°F-Hrs)
TG-1 5/11/05 1 46100 1630 1273 TG-2 5/11/05 1 44400 1570 1273 TG-4 5/13/05 3 80900 2860 3829 TG-5 5/13/05 3 81000 2860 3829 TG-7 5/17/05 7 112000 3960 9244 TG-8 5/17/05 7 113900 4030 9244 TG-10 5/24/05 14 137600 4870 18903 TG-11 5/24/05 14 132300 4680 18903 TG-14 6/7/05 28 148700 5260 38725 TG-15 6/7/05 28 144700 5120 38725
Table 26Curve Fit Coefficients for Tilcon–Groton
Class “F” Concrete Mix Model A B r2
TG-Class F TEX-426-A -6091 1087 .994 TG-Class F IM 383 -6091 2504 .994
While the curve fit coefficients were not yet established by the time of ensuing pours on May 16th or 17th,they can be applied now (after the fact) to see how well strength could have been estimated from maturity had these coefficients been available. On May 16th, Research staff made three 6”x12” specimens (GR16-1, 2, and 3) to accompany the three test specimens typically made for acceptance testing (C6044 and two C6044A). Specimen GR16-3 had a probe embedded to monitor maturity and was cured in the same manner as the other specimens, which were standard cured in the Central Lab moist room. Concrete maturities are presented with compressive strengths for each specimen broken in Table 27.Estimated strengths based upon maturity are also shown for comparison to strength test results. Looking at the data, it can be seen that the maturity method overestimated strength, as the 1-day actual cylinder strength was 76% of the estimated strength, the 3-day strength was 89%, and 28-day strengths averaged 85% of estimated. The estimated 7-day strength (3870 psi) was close to the compressive strength test at 7-days (3830 psi), but this was the exception for these specimens. Overall, compressive strength estimations by the maturity method were poor in this instance.
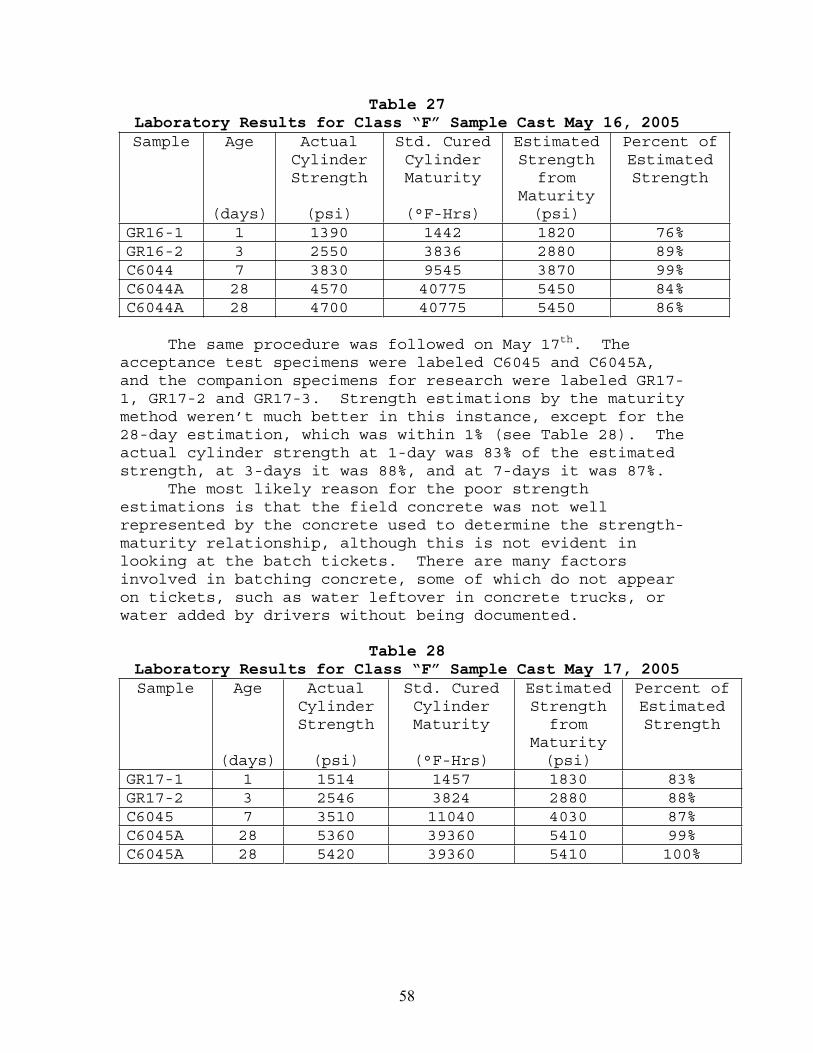
58
Table 27 Laboratory Results for Class “F” Sample Cast May 16, 2005 Sample Age
(days)
ActualCylinderStrength
(psi)
Std. Cured CylinderMaturity
(°F-Hrs)
EstimatedStrength
fromMaturity(psi)
Percent of EstimatedStrength
GR16-1 1 1390 1442 1820 76% GR16-2 3 2550 3836 2880 89% C6044 7 3830 9545 3870 99% C6044A 28 4570 40775 5450 84% C6044A 28 4700 40775 5450 86%
The same procedure was followed on May 17th. The acceptance test specimens were labeled C6045 and C6045A, and the companion specimens for research were labeled GR17-1, GR17-2 and GR17-3. Strength estimations by the maturity method weren’t much better in this instance, except for the 28-day estimation, which was within 1% (see Table 28). The actual cylinder strength at 1-day was 83% of the estimated strength, at 3-days it was 88%, and at 7-days it was 87%. The most likely reason for the poor strength estimations is that the field concrete was not well represented by the concrete used to determine the strength-maturity relationship, although this is not evident in looking at the batch tickets. There are many factors involved in batching concrete, some of which do not appear on tickets, such as water leftover in concrete trucks, or water added by drivers without being documented.
Table 28Laboratory Results for Class “F” Sample Cast May 17, 2005 Sample Age
(days)
ActualCylinderStrength
(psi)
Std. Cured CylinderMaturity
(°F-Hrs)
EstimatedStrength
fromMaturity(psi)
Percent of EstimatedStrength
GR17-1 1 1514 1457 1830 83% GR17-2 3 2546 3824 2880 88% C6045 7 3510 11040 4030 87% C6045A 28 5360 39360 5410 99% C6045A 28 5420 39360 5410 100%
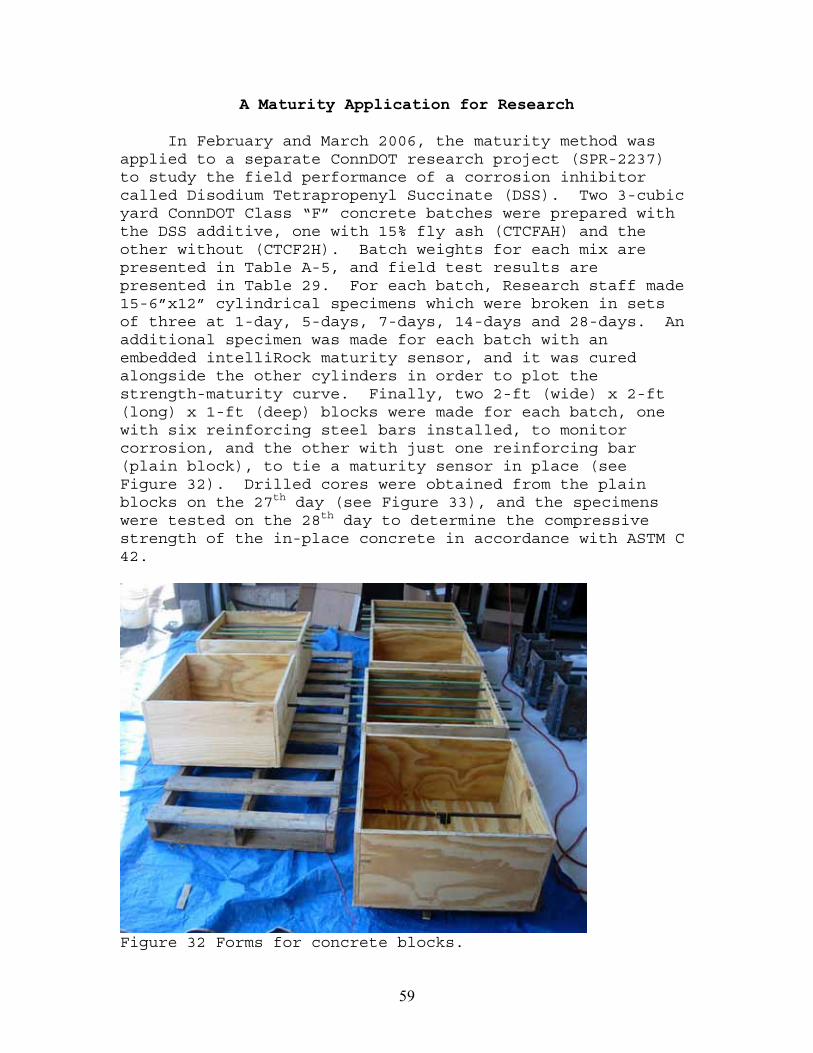
59
A Maturity Application for Research
In February and March 2006, the maturity method was applied to a separate ConnDOT research project (SPR-2237) to study the field performance of a corrosion inhibitor called Disodium Tetrapropenyl Succinate (DSS). Two 3-cubic yard ConnDOT Class “F” concrete batches were prepared with the DSS additive, one with 15% fly ash (CTCFAH) and the other without (CTCF2H). Batch weights for each mix are presented in Table A-5, and field test results are presented in Table 29. For each batch, Research staff made 15-6”x12” cylindrical specimens which were broken in sets of three at 1-day, 5-days, 7-days, 14-days and 28-days. An additional specimen was made for each batch with an embedded intelliRock maturity sensor, and it was cured alongside the other cylinders in order to plot the strength-maturity curve. Finally, two 2-ft (wide) x 2-ft (long) x 1-ft (deep) blocks were made for each batch, one with six reinforcing steel bars installed, to monitor corrosion, and the other with just one reinforcing bar (plain block), to tie a maturity sensor in place (see Figure 32). Drilled cores were obtained from the plain blocks on the 27th day (see Figure 33), and the specimens were tested on the 28th day to determine the compressive strength of the in-place concrete in accordance with ASTM C 42.
Figure 32 Forms for concrete blocks.
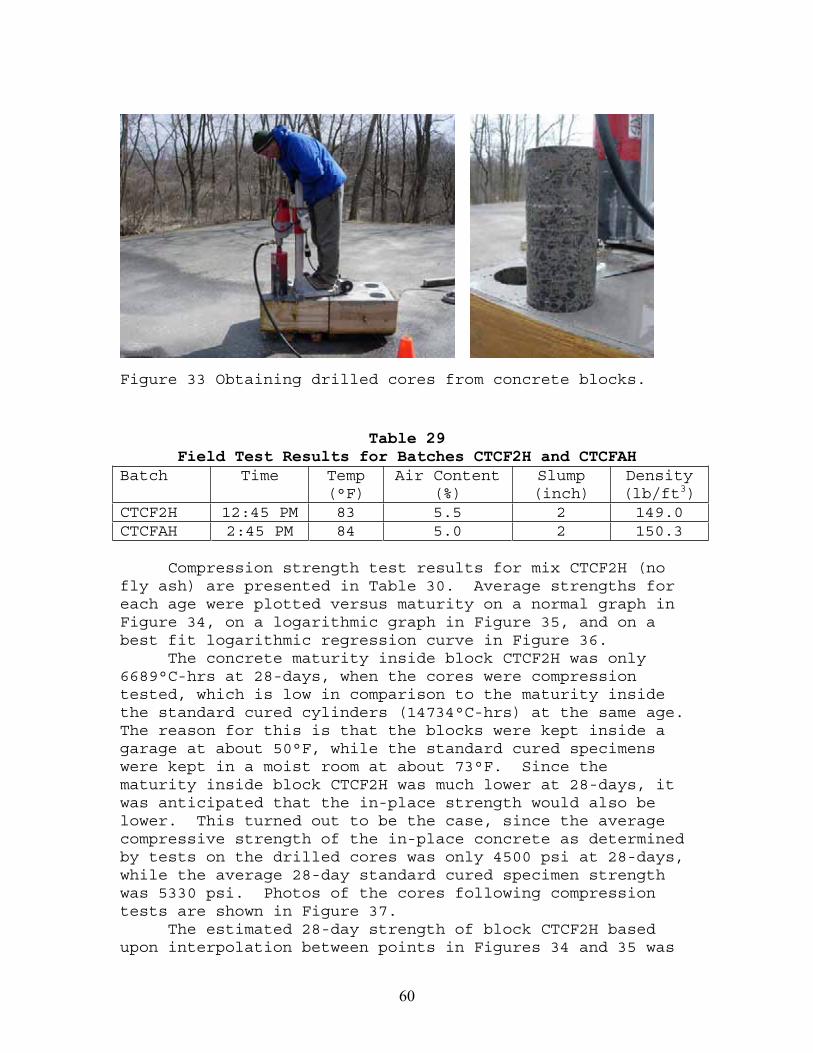
60
Figure 33 Obtaining drilled cores from concrete blocks.
Table 29Field Test Results for Batches CTCF2H and CTCFAH
Batch Time Temp (°F)
Air Content (%)
Slump(inch)
Density(lb/ft3)
CTCF2H 12:45 PM 83 5.5 2 149.0 CTCFAH 2:45 PM 84 5.0 2 150.3
Compression strength test results for mix CTCF2H (no fly ash) are presented in Table 30. Average strengths for each age were plotted versus maturity on a normal graph in Figure 34, on a logarithmic graph in Figure 35, and on a best fit logarithmic regression curve in Figure 36. The concrete maturity inside block CTCF2H was only 6689°C-hrs at 28-days, when the cores were compression tested, which is low in comparison to the maturity inside the standard cured cylinders (14734°C-hrs) at the same age.The reason for this is that the blocks were kept inside a garage at about 50°F, while the standard cured specimens were kept in a moist room at about 73°F. Since the maturity inside block CTCF2H was much lower at 28-days, it was anticipated that the in-place strength would also be lower. This turned out to be the case, since the average compressive strength of the in-place concrete as determined by tests on the drilled cores was only 4500 psi at 28-days, while the average 28-day standard cured specimen strength was 5330 psi. Photos of the cores following compression tests are shown in Figure 37. The estimated 28-day strength of block CTCF2H based upon interpolation between points in Figures 34 and 35 was
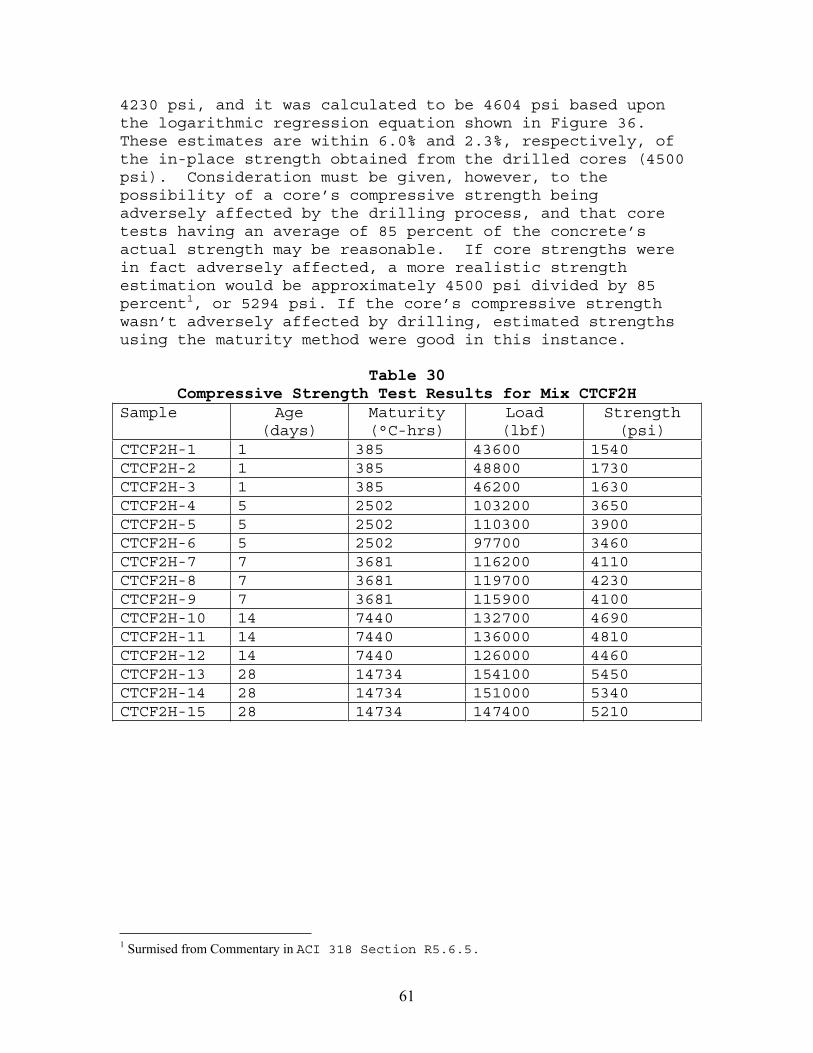
61
4230 psi, and it was calculated to be 4604 psi based upon the logarithmic regression equation shown in Figure 36.These estimates are within 6.0% and 2.3%, respectively, of the in-place strength obtained from the drilled cores (4500 psi). Consideration must be given, however, to the possibility of a core’s compressive strength being adversely affected by the drilling process, and that core tests having an average of 85 percent of the concrete’s actual strength may be reasonable. If core strengths were in fact adversely affected, a more realistic strength estimation would be approximately 4500 psi divided by 85 percent1, or 5294 psi. If the core’s compressive strength wasn’t adversely affected by drilling, estimated strengths using the maturity method were good in this instance.
Table 30Compressive Strength Test Results for Mix CTCF2H
Sample Age (days)
Maturity(°C-hrs)
Load(lbf)
Strength(psi)
CTCF2H-1 1 385 43600 1540 CTCF2H-2 1 385 48800 1730 CTCF2H-3 1 385 46200 1630 CTCF2H-4 5 2502 103200 3650 CTCF2H-5 5 2502 110300 3900 CTCF2H-6 5 2502 97700 3460 CTCF2H-7 7 3681 116200 4110 CTCF2H-8 7 3681 119700 4230 CTCF2H-9 7 3681 115900 4100 CTCF2H-10 14 7440 132700 4690 CTCF2H-11 14 7440 136000 4810 CTCF2H-12 14 7440 126000 4460 CTCF2H-13 28 14734 154100 5450 CTCF2H-14 28 14734 151000 5340 CTCF2H-15 28 14734 147400 5210
1 Surmised from Commentary in ACI 318 Section R5.6.5.
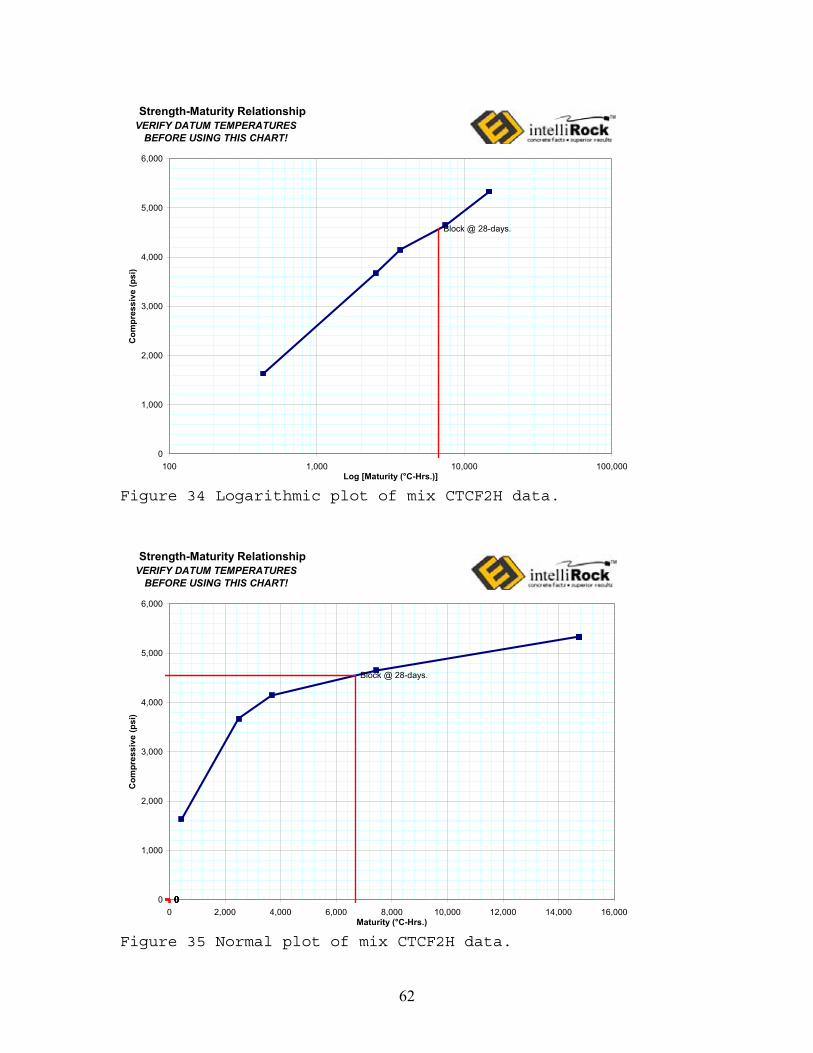
62
Strength-Maturity Relationship
Block @ 28-days.
0
1,000
2,000
3,000
4,000
5,000
6,000
100 1,000 10,000 100,000Log [Maturity (°C-Hrs.)]
Com
pres
sive
(psi
)VERIFY DATUM TEMPERATURES
BEFORE USING THIS CHART!
Figure 34 Logarithmic plot of mix CTCF2H data.
Strength-Maturity Relationship
Block @ 28-days.
00000000
1,000
2,000
3,000
4,000
5,000
6,000
0 2,000 4,000 6,000 8,000 10,000 12,000 14,000 16,000Maturity (°C-Hrs.)
Com
pres
sive
(psi
)
VERIFY DATUM TEMPERATURES BEFORE USING THIS CHART!
Figure 35 Normal plot of mix CTCF2H data.
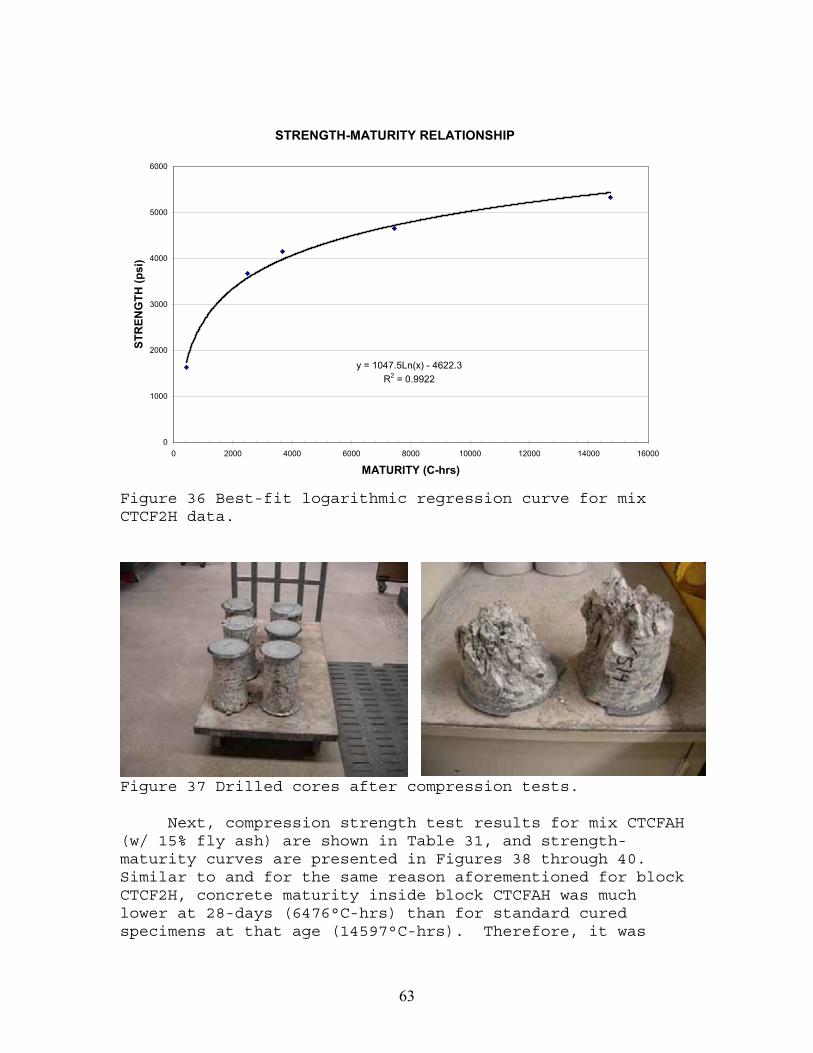
63
STRENGTH-MATURITY RELATIONSHIP
y = 1047.5Ln(x) - 4622.3R2 = 0.9922
0
1000
2000
3000
4000
5000
6000
0 2000 4000 6000 8000 10000 12000 14000 16000
MATURITY (C-hrs)
STR
ENG
TH (p
si)
Figure 36 Best-fit logarithmic regression curve for mix CTCF2H data.
Figure 37 Drilled cores after compression tests.
Next, compression strength test results for mix CTCFAH (w/ 15% fly ash) are shown in Table 31, and strength-maturity curves are presented in Figures 38 through 40.Similar to and for the same reason aforementioned for block CTCF2H, concrete maturity inside block CTCFAH was much lower at 28-days (6476°C-hrs) than for standard cured specimens at that age (14597°C-hrs). Therefore, it was
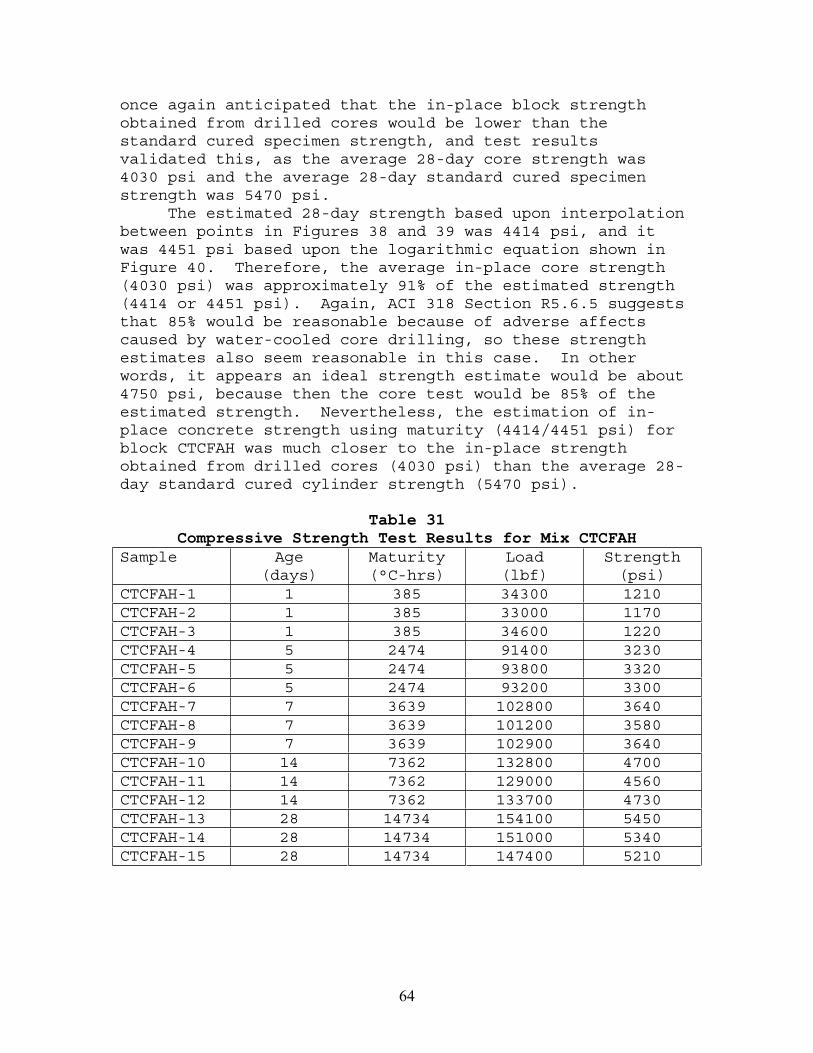
64
once again anticipated that the in-place block strength obtained from drilled cores would be lower than the standard cured specimen strength, and test results validated this, as the average 28-day core strength was 4030 psi and the average 28-day standard cured specimen strength was 5470 psi. The estimated 28-day strength based upon interpolation between points in Figures 38 and 39 was 4414 psi, and it was 4451 psi based upon the logarithmic equation shown in Figure 40. Therefore, the average in-place core strength (4030 psi) was approximately 91% of the estimated strength (4414 or 4451 psi). Again, ACI 318 Section R5.6.5 suggests that 85% would be reasonable because of adverse affects caused by water-cooled core drilling, so these strength estimates also seem reasonable in this case. In other words, it appears an ideal strength estimate would be about 4750 psi, because then the core test would be 85% of the estimated strength. Nevertheless, the estimation of in-place concrete strength using maturity (4414/4451 psi) for block CTCFAH was much closer to the in-place strength obtained from drilled cores (4030 psi) than the average 28-day standard cured cylinder strength (5470 psi).
Table 31Compressive Strength Test Results for Mix CTCFAH
Sample Age (days)
Maturity(°C-hrs)
Load(lbf)
Strength(psi)
CTCFAH-1 1 385 34300 1210 CTCFAH-2 1 385 33000 1170 CTCFAH-3 1 385 34600 1220 CTCFAH-4 5 2474 91400 3230 CTCFAH-5 5 2474 93800 3320 CTCFAH-6 5 2474 93200 3300 CTCFAH-7 7 3639 102800 3640 CTCFAH-8 7 3639 101200 3580 CTCFAH-9 7 3639 102900 3640 CTCFAH-10 14 7362 132800 4700 CTCFAH-11 14 7362 129000 4560 CTCFAH-12 14 7362 133700 4730 CTCFAH-13 28 14734 154100 5450 CTCFAH-14 28 14734 151000 5340 CTCFAH-15 28 14734 147400 5210
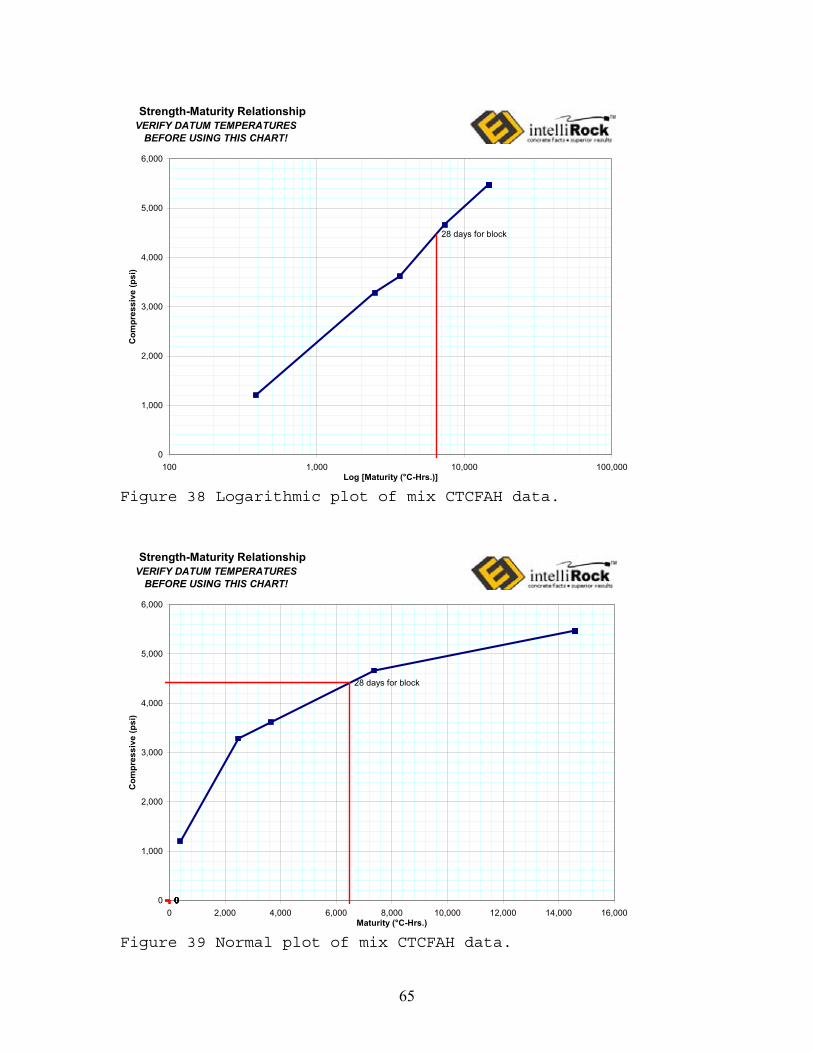
65
Strength-Maturity Relationship
28 days for block
0
1,000
2,000
3,000
4,000
5,000
6,000
100 1,000 10,000 100,000Log [Maturity (°C-Hrs.)]
Com
pres
sive
(psi
)VERIFY DATUM TEMPERATURES
BEFORE USING THIS CHART!
Figure 38 Logarithmic plot of mix CTCFAH data.
Strength-Maturity Relationship
28 days for block
00000000
1,000
2,000
3,000
4,000
5,000
6,000
0 2,000 4,000 6,000 8,000 10,000 12,000 14,000 16,000Maturity (°C-Hrs.)
Com
pres
sive
(psi
)
VERIFY DATUM TEMPERATURES BEFORE USING THIS CHART!
Figure 39 Normal plot of mix CTCFAH data.
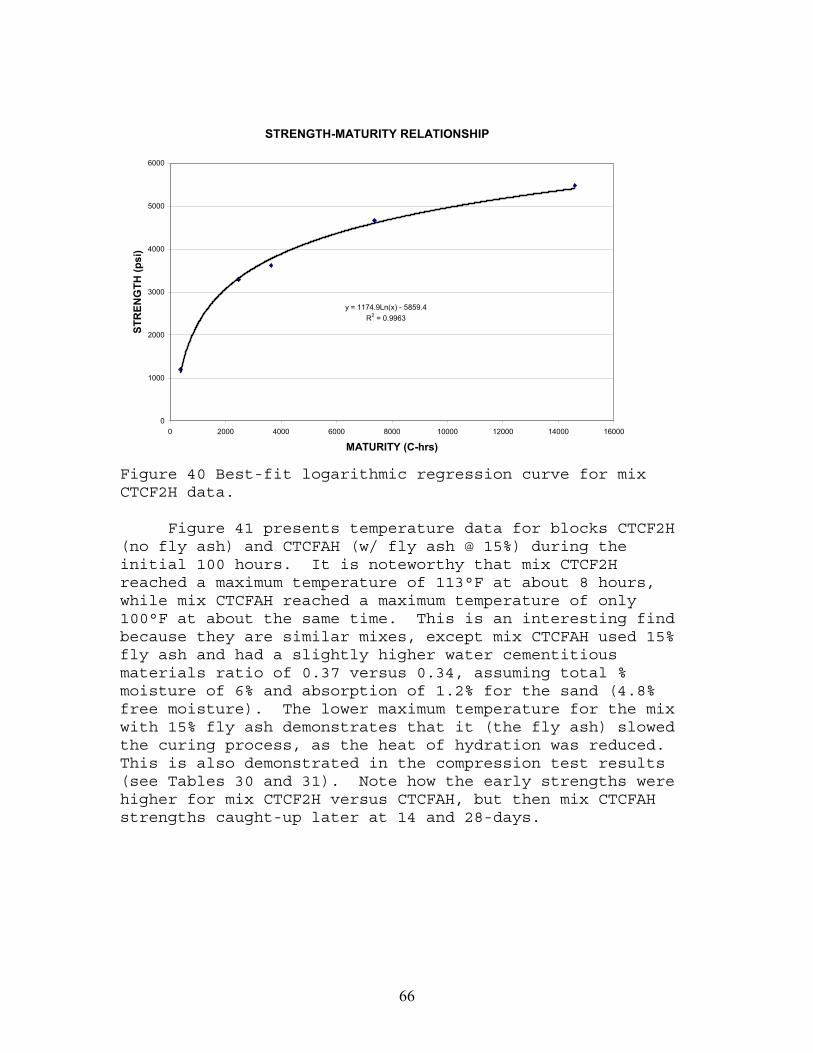
66
STRENGTH-MATURITY RELATIONSHIP
y = 1174.9Ln(x) - 5859.4R2 = 0.9963
0
1000
2000
3000
4000
5000
6000
0 2000 4000 6000 8000 10000 12000 14000 16000
MATURITY (C-hrs)
STR
ENG
TH (p
si)
Figure 40 Best-fit logarithmic regression curve for mix CTCF2H data.
Figure 41 presents temperature data for blocks CTCF2H (no fly ash) and CTCFAH (w/ fly ash @ 15%) during the initial 100 hours. It is noteworthy that mix CTCF2H reached a maximum temperature of 113°F at about 8 hours, while mix CTCFAH reached a maximum temperature of only 100°F at about the same time. This is an interesting find because they are similar mixes, except mix CTCFAH used 15% fly ash and had a slightly higher water cementitious materials ratio of 0.37 versus 0.34, assuming total % moisture of 6% and absorption of 1.2% for the sand (4.8% free moisture). The lower maximum temperature for the mix with 15% fly ash demonstrates that it (the fly ash) slowed the curing process, as the heat of hydration was reduced.This is also demonstrated in the compression test results (see Tables 30 and 31). Note how the early strengths were higher for mix CTCF2H versus CTCFAH, but then mix CTCFAH strengths caught-up later at 14 and 28-days.
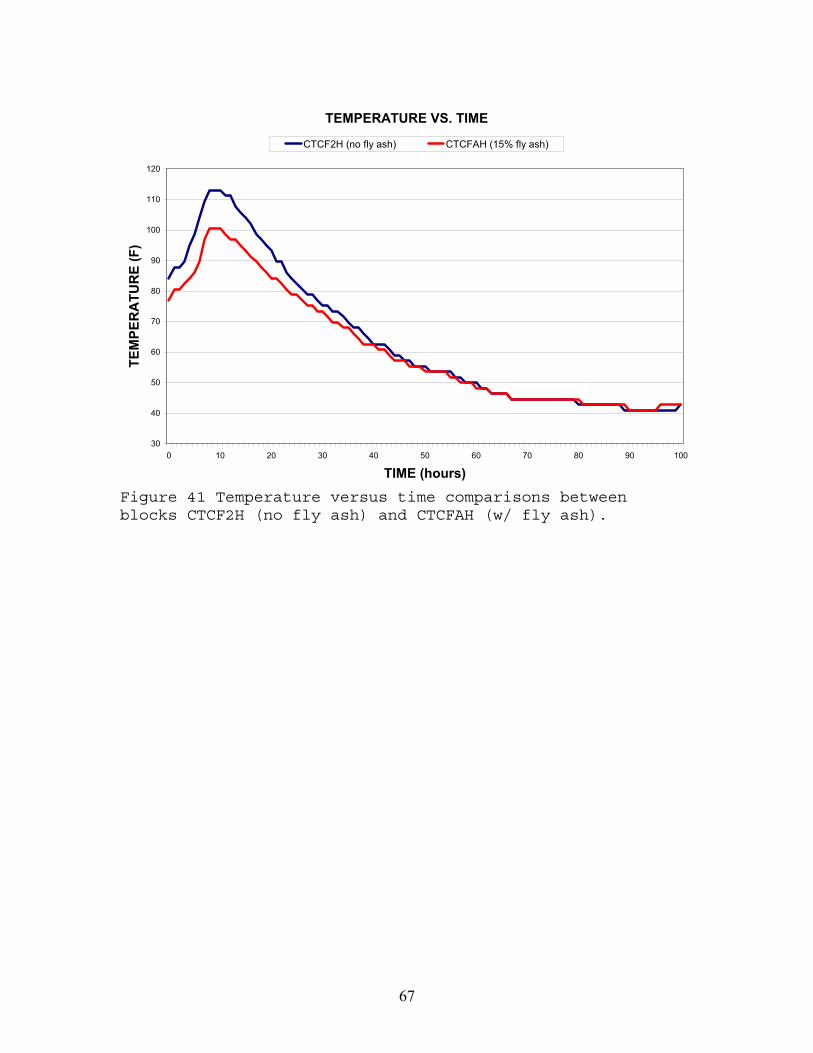
67
TEMPERATURE VS. TIME
30
40
50
60
70
80
90
100
110
120
0 10 20 30 40 50 60 70 80 90 100
TIME (hours)
TEM
PER
ATU
RE
(F)
CTCF2H (no fly ash) CTCFAH (15% fly ash)
Figure 41 Temperature versus time comparisons between blocks CTCF2H (no fly ash) and CTCFAH (w/ fly ash).

68
HOT-WEATHER CONCRETING
Figure 42 Hot-Weather Concreting at Project 63-595.
Project 63-579It was indicated in the study proposal that there have
been more rejections during the summer months, on a percentage basis, than at other times of year.Accordingly, hot-weather concreting was carefully investigated during this research study. Researchers worked side-by-side with consultants testing concrete, and they observed contractor construction methods. Maturity sensors were placed inside cylindrical samples and cured along with samples used for acceptance testing. Additional sensors were placed inside various structures to monitor their temperatures. Figure 43 shows temperature versus time for three sensors installed July 26, 2005 at Project 63-579 in Hartford. The high ambient temperature that day was 95°F, the low overnight was 72°F and it was sunny. Two sensors were installed inside a modified Class “A” parapet wall curb poured that day, and one was installed inside a cylindrical specimen stored alongside representative test specimens.
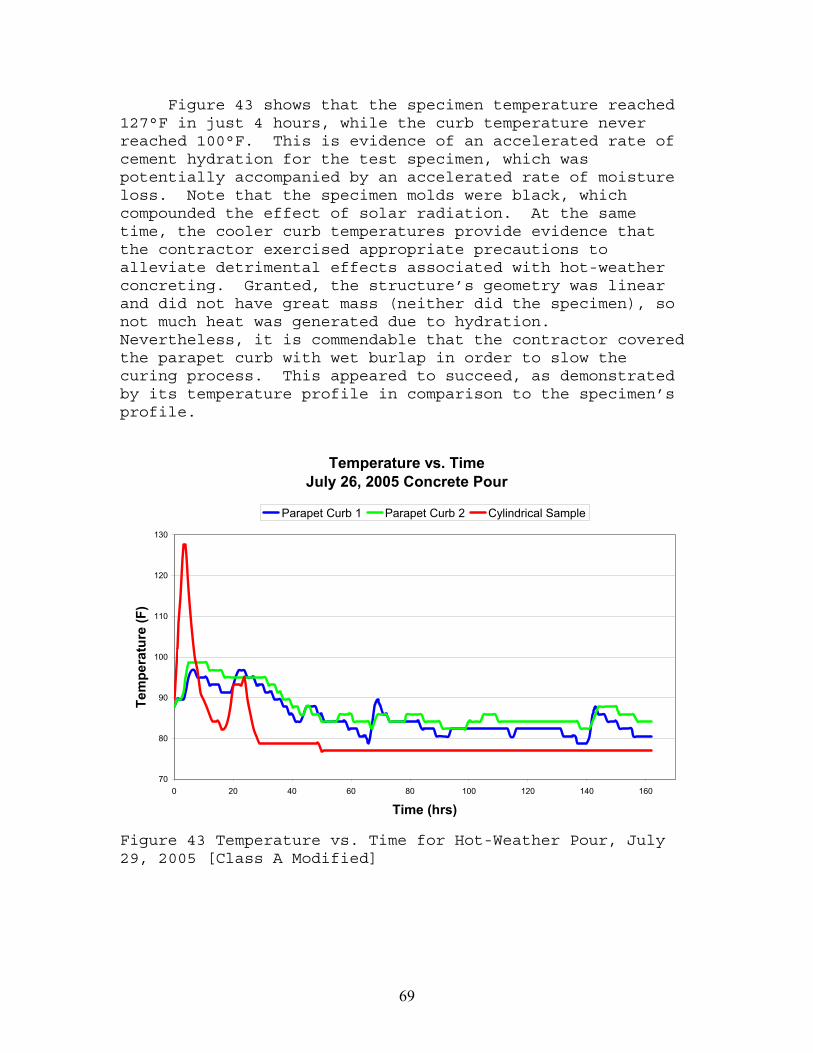
69
Figure 43 shows that the specimen temperature reached 127°F in just 4 hours, while the curb temperature never reached 100°F. This is evidence of an accelerated rate of cement hydration for the test specimen, which was potentially accompanied by an accelerated rate of moisture loss. Note that the specimen molds were black, which compounded the effect of solar radiation. At the same time, the cooler curb temperatures provide evidence that the contractor exercised appropriate precautions to alleviate detrimental effects associated with hot-weather concreting. Granted, the structure’s geometry was linear and did not have great mass (neither did the specimen), so not much heat was generated due to hydration.Nevertheless, it is commendable that the contractor covered the parapet curb with wet burlap in order to slow the curing process. This appeared to succeed, as demonstrated by its temperature profile in comparison to the specimen’s profile.
Temperature vs. TimeJuly 26, 2005 Concrete Pour
70
80
90
100
110
120
130
0 20 40 60 80 100 120 140 160
Time (hrs)
Tem
pera
ture
(F)
Parapet Curb 1 Parapet Curb 2 Cylindrical Sample
Figure 43 Temperature vs. Time for Hot-Weather Pour, July 29, 2005 [Class A Modified]
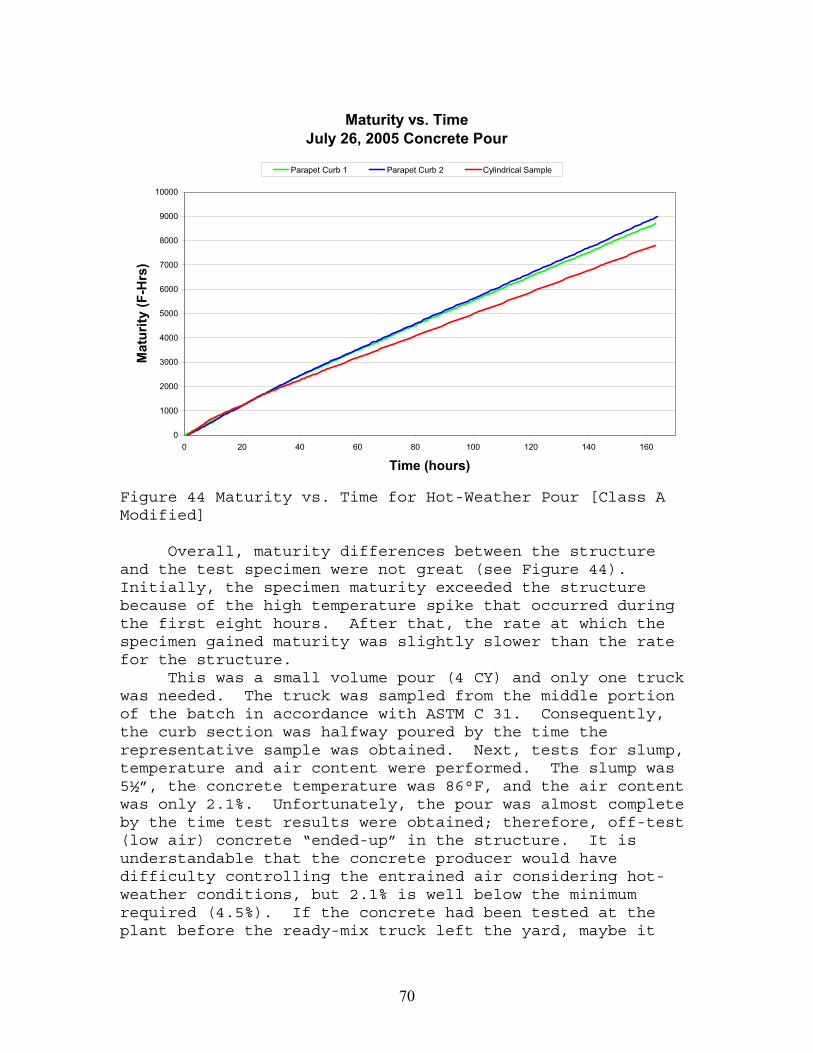
70
Maturity vs. TimeJuly 26, 2005 Concrete Pour
0
1000
2000
3000
4000
5000
6000
7000
8000
9000
10000
0 20 40 60 80 100 120 140 160
Time (hours)
Mat
urity
(F-H
rs)
Parapet Curb 1 Parapet Curb 2 Cylindrical Sample
Figure 44 Maturity vs. Time for Hot-Weather Pour [Class A Modified]
Overall, maturity differences between the structure and the test specimen were not great (see Figure 44).Initially, the specimen maturity exceeded the structure because of the high temperature spike that occurred during the first eight hours. After that, the rate at which the specimen gained maturity was slightly slower than the rate for the structure. This was a small volume pour (4 CY) and only one truck was needed. The truck was sampled from the middle portion of the batch in accordance with ASTM C 31. Consequently, the curb section was halfway poured by the time the representative sample was obtained. Next, tests for slump, temperature and air content were performed. The slump was 5½”, the concrete temperature was 86°F, and the air content was only 2.1%. Unfortunately, the pour was almost complete by the time test results were obtained; therefore, off-test (low air) concrete “ended-up” in the structure. It is understandable that the concrete producer would have difficulty controlling the entrained air considering hot-weather conditions, but 2.1% is well below the minimum required (4.5%). If the concrete had been tested at the plant before the ready-mix truck left the yard, maybe it
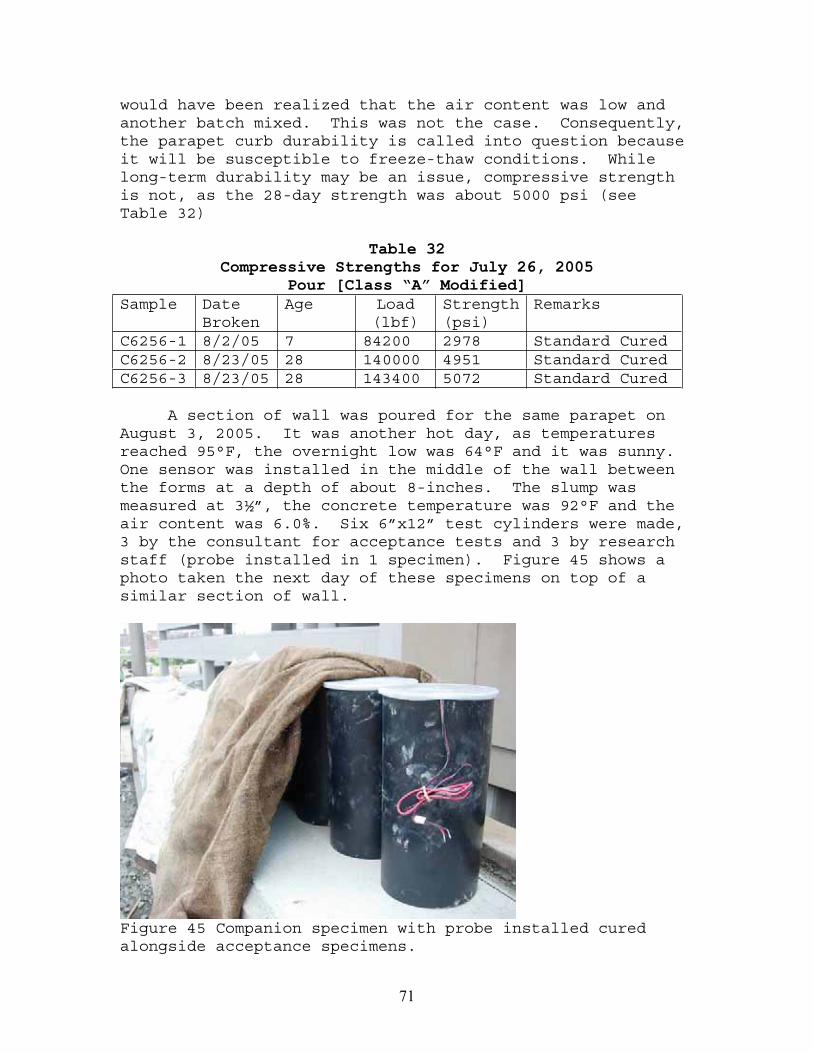
71
would have been realized that the air content was low and another batch mixed. This was not the case. Consequently, the parapet curb durability is called into question because it will be susceptible to freeze-thaw conditions. While long-term durability may be an issue, compressive strength is not, as the 28-day strength was about 5000 psi (see Table 32)
Table 32Compressive Strengths for July 26, 2005
Pour [Class “A” Modified] Sample Date
BrokenAge Load
(lbf)Strength(psi)
Remarks
C6256-1 8/2/05 7 84200 2978 Standard Cured C6256-2 8/23/05 28 140000 4951 Standard Cured C6256-3 8/23/05 28 143400 5072 Standard Cured
A section of wall was poured for the same parapet on August 3, 2005. It was another hot day, as temperatures reached 95°F, the overnight low was 64°F and it was sunny.One sensor was installed in the middle of the wall between the forms at a depth of about 8-inches. The slump was measured at 3½”, the concrete temperature was 92°F and the air content was 6.0%. Six 6”x12” test cylinders were made, 3 by the consultant for acceptance tests and 3 by research staff (probe installed in 1 specimen). Figure 45 shows a photo taken the next day of these specimens on top of a similar section of wall.
Figure 45 Companion specimen with probe installed cured alongside acceptance specimens.
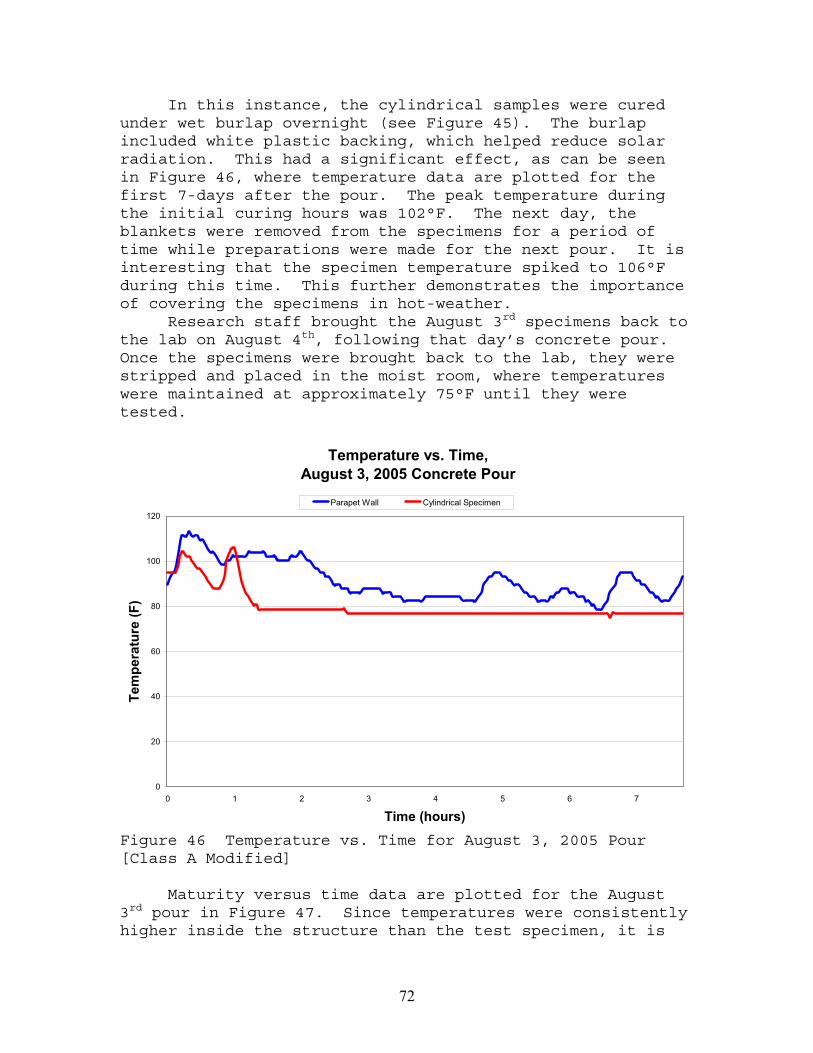
72
In this instance, the cylindrical samples were cured under wet burlap overnight (see Figure 45). The burlap included white plastic backing, which helped reduce solar radiation. This had a significant effect, as can be seen in Figure 46, where temperature data are plotted for the first 7-days after the pour. The peak temperature during the initial curing hours was 102°F. The next day, the blankets were removed from the specimens for a period of time while preparations were made for the next pour. It is interesting that the specimen temperature spiked to 106°F during this time. This further demonstrates the importance of covering the specimens in hot-weather. Research staff brought the August 3rd specimens back to the lab on August 4th, following that day’s concrete pour.Once the specimens were brought back to the lab, they were stripped and placed in the moist room, where temperatures were maintained at approximately 75°F until they were tested.
Temperature vs. Time, August 3, 2005 Concrete Pour
0
20
40
60
80
100
120
0 1 2 3 4 5 6 7
Time (hours)
Tem
pera
ture
(F)
Parapet Wall Cylindrical Specimen
Figure 46 Temperature vs. Time for August 3, 2005 Pour [Class A Modified]
Maturity versus time data are plotted for the August 3rd pour in Figure 47. Since temperatures were consistently higher inside the structure than the test specimen, it is
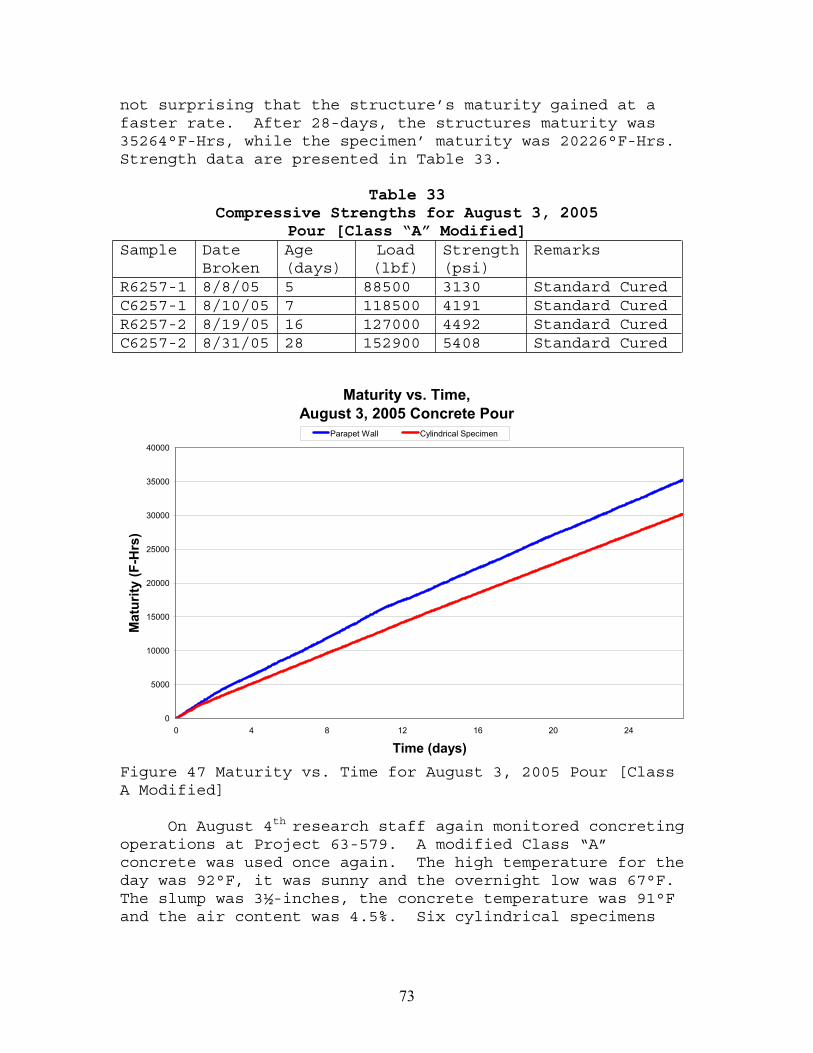
73
not surprising that the structure’s maturity gained at a faster rate. After 28-days, the structures maturity was 35264°F-Hrs, while the specimen’ maturity was 20226°F-Hrs.Strength data are presented in Table 33.
Table 33Compressive Strengths for August 3, 2005
Pour [Class “A” Modified] Sample Date
BrokenAge(days)
Load(lbf)
Strength(psi)
Remarks
R6257-1 8/8/05 5 88500 3130 Standard Cured C6257-1 8/10/05 7 118500 4191 Standard CuredR6257-2 8/19/05 16 127000 4492 Standard CuredC6257-2 8/31/05 28 152900 5408 Standard Cured
Maturity vs. Time,August 3, 2005 Concrete Pour
0
5000
10000
15000
20000
25000
30000
35000
40000
0 4 8 12 16 20 24
Time (days)
Mat
urity
(F-H
rs)
Parapet Wall Cylindrical Specimen
Figure 47 Maturity vs. Time for August 3, 2005 Pour [Class A Modified]
On August 4th research staff again monitored concreting operations at Project 63-579. A modified Class “A” concrete was used once again. The high temperature for the day was 92°F, it was sunny and the overnight low was 67°F. The slump was 3½-inches, the concrete temperature was 91°F and the air content was 4.5%. Six cylindrical specimens
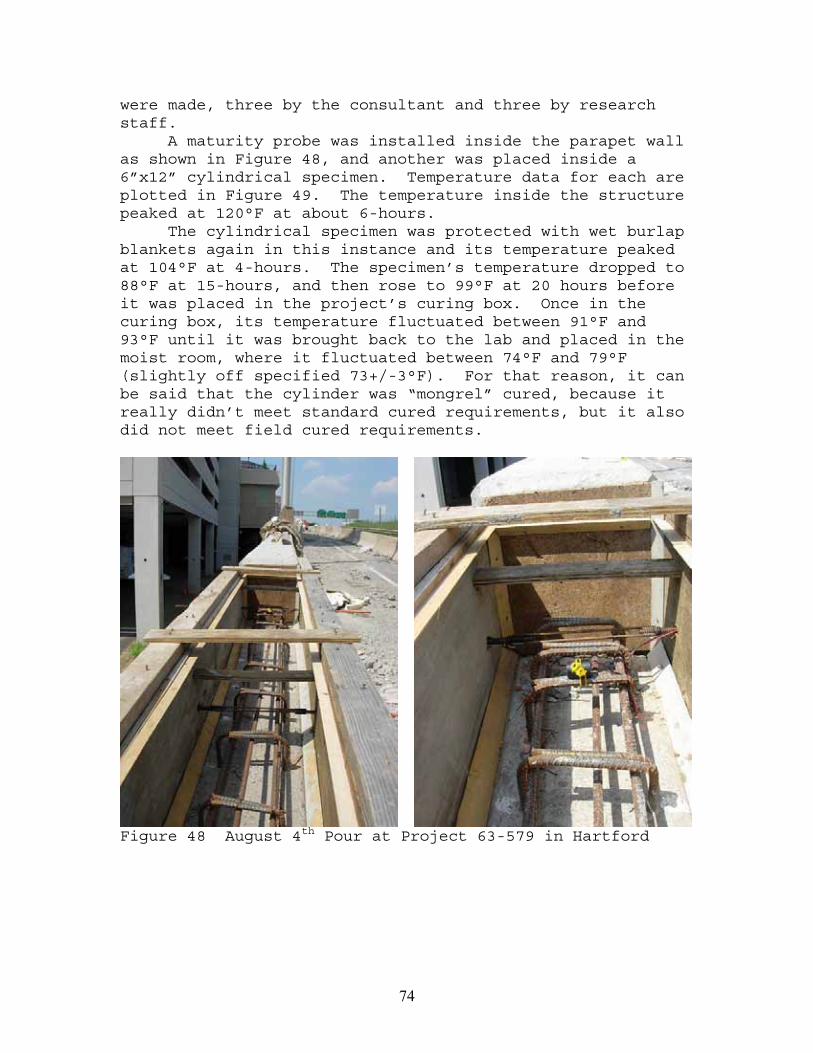
74
were made, three by the consultant and three by research staff. A maturity probe was installed inside the parapet wall as shown in Figure 48, and another was placed inside a 6”x12” cylindrical specimen. Temperature data for each are plotted in Figure 49. The temperature inside the structure peaked at 120°F at about 6-hours. The cylindrical specimen was protected with wet burlap blankets again in this instance and its temperature peaked at 104°F at 4-hours. The specimen’s temperature dropped to 88°F at 15-hours, and then rose to 99°F at 20 hours before it was placed in the project’s curing box. Once in the curing box, its temperature fluctuated between 91°F and 93°F until it was brought back to the lab and placed in the moist room, where it fluctuated between 74°F and 79°F (slightly off specified 73+/-3°F). For that reason, it can be said that the cylinder was “mongrel” cured, because it really didn’t meet standard cured requirements, but it also did not meet field cured requirements.
Figure 48 August 4th Pour at Project 63-579 in Hartford

75
Table 34Compressive Strengths for August 4, 2005
Pour [Class “A” Modified] Sample Date
BrokenAge
(days)Load(lbf)
Strength(psi)
Remarks
C6258-4 8/9/05 5 110400 3905 Mongrel Cured C6258-1 8/11/05 7 114511 4050 Mongrel Cured C6258-6 8/15/05 11 127700 4516 Mongrel Cured C6258-5 8/18/05 14 129700 4587 Mongrel Cured C6258-2 9/1/05 28 146100 5167 Mongrel Cured C6258-3 9/1/05 28 143400 5072 Mongrel Cured
Temperature vs. Time,August 4, 2005 Concrete Pour
60
70
80
90
100
110
120
130
0 3 6 9 12 15 18 21 25
Time (days)
Tem
pera
ture
(F)
Cylindrical Specimen Parapet Wall
Figure 49 Temperature vs. Time for August 4, 2005 Pour [Class A Modified]
In this case, the “mongrel” cure did not seem to be detrimental to the specimen’s strength. The 7-day strength was over 4000 psi and the 28-day strength was over 5000 psi (see Table 34).
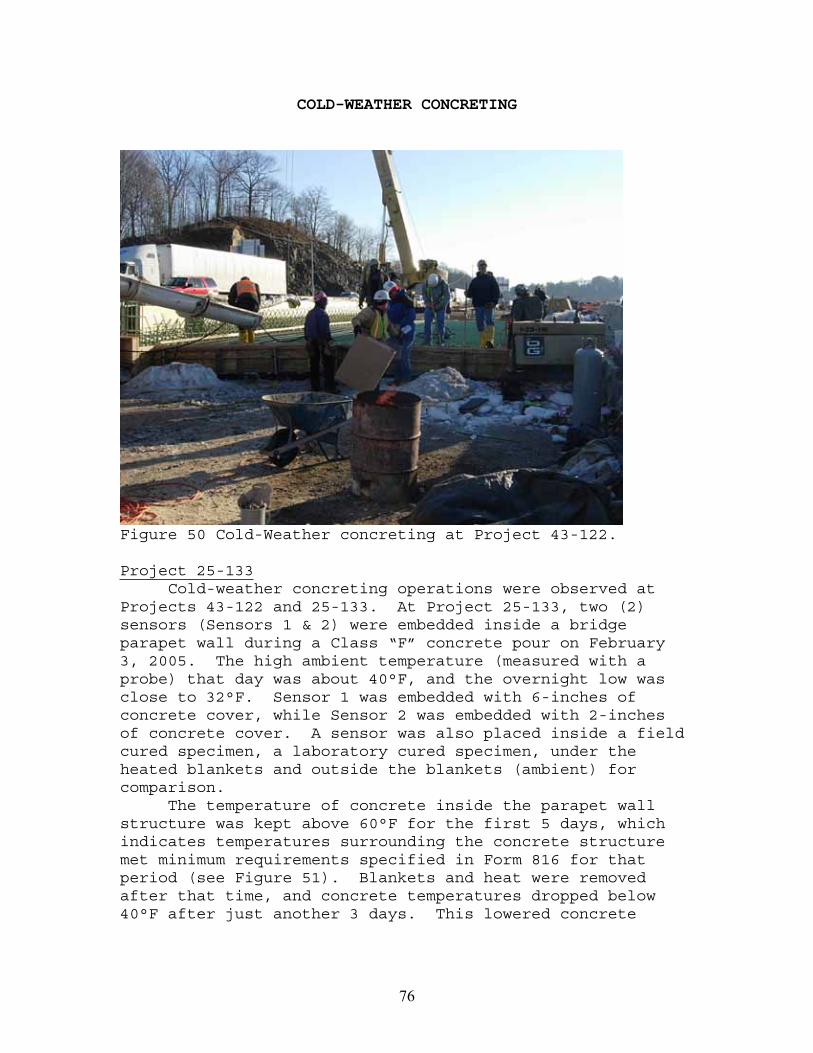
76
COLD-WEATHER CONCRETING
Figure 50 Cold-Weather concreting at Project 43-122.
Project 25-133Cold-weather concreting operations were observed at
Projects 43-122 and 25-133. At Project 25-133, two (2) sensors (Sensors 1 & 2) were embedded inside a bridge parapet wall during a Class “F” concrete pour on February 3, 2005. The high ambient temperature (measured with a probe) that day was about 40°F, and the overnight low was close to 32°F. Sensor 1 was embedded with 6-inches of concrete cover, while Sensor 2 was embedded with 2-inches of concrete cover. A sensor was also placed inside a field cured specimen, a laboratory cured specimen, under the heated blankets and outside the blankets (ambient) for comparison. The temperature of concrete inside the parapet wall structure was kept above 60°F for the first 5 days, which indicates temperatures surrounding the concrete structure met minimum requirements specified in Form 816 for that period (see Figure 51). Blankets and heat were removed after that time, and concrete temperatures dropped below 40°F after just another 3 days. This lowered concrete
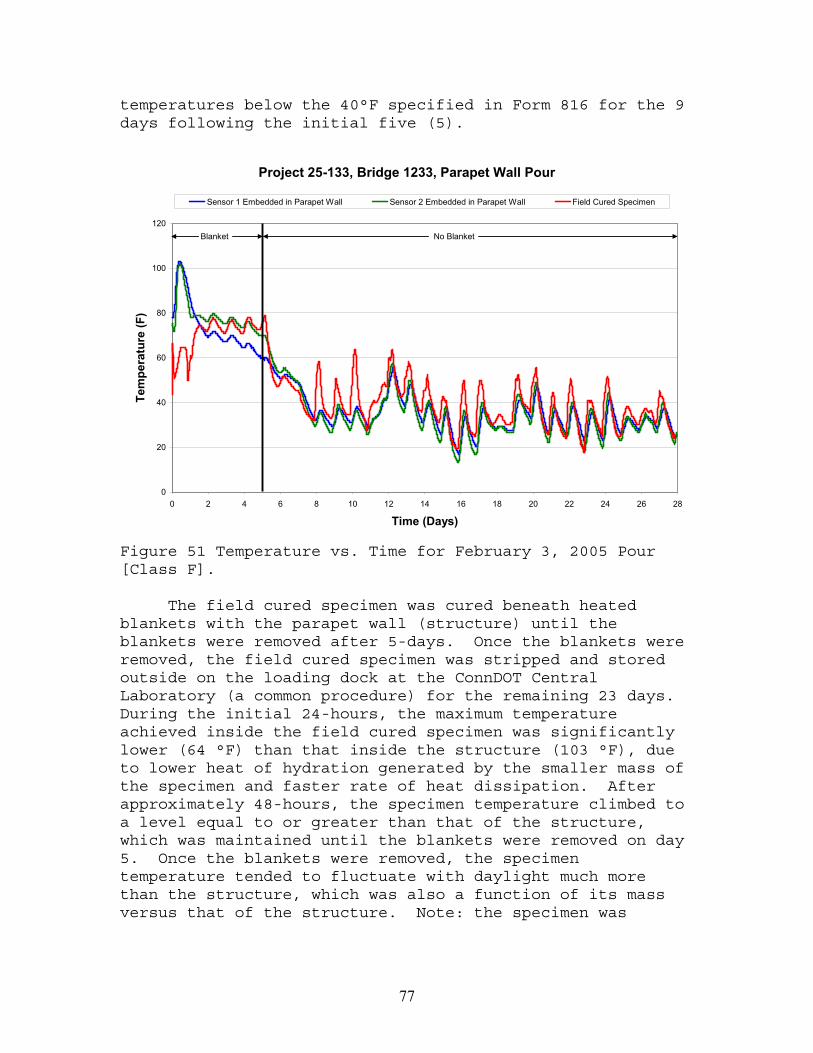
77
temperatures below the 40°F specified in Form 816 for the 9 days following the initial five (5).
Project 25-133, Bridge 1233, Parapet Wall Pour
0
20
40
60
80
100
120
0 2 4 6 8 10 12 14 16 18 20 22 24 26 28
Time (Days)
Tem
pera
ture
(F)
Sensor 1 Embedded in Parapet Wall Sensor 2 Embedded in Parapet Wall Field Cured Specimen
No BlanketBlanket
Figure 51 Temperature vs. Time for February 3, 2005 Pour [Class F].
The field cured specimen was cured beneath heated blankets with the parapet wall (structure) until the blankets were removed after 5-days. Once the blankets were removed, the field cured specimen was stripped and stored outside on the loading dock at the ConnDOT Central Laboratory (a common procedure) for the remaining 23 days.During the initial 24-hours, the maximum temperature achieved inside the field cured specimen was significantly lower (64 °F) than that inside the structure (103 °F), due to lower heat of hydration generated by the smaller mass of the specimen and faster rate of heat dissipation. After approximately 48-hours, the specimen temperature climbed to a level equal to or greater than that of the structure, which was maintained until the blankets were removed on day 5. Once the blankets were removed, the specimen temperature tended to fluctuate with daylight much more than the structure, which was also a function of its mass versus that of the structure. Note: the specimen was
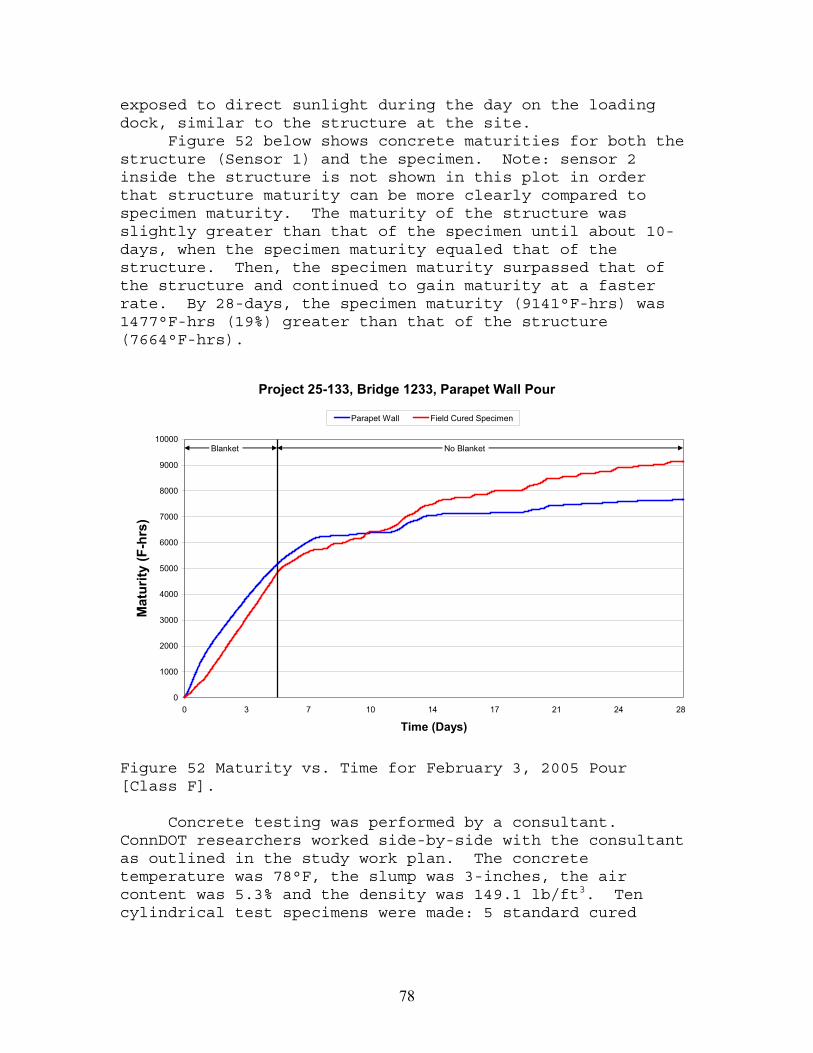
78
exposed to direct sunlight during the day on the loading dock, similar to the structure at the site. Figure 52 below shows concrete maturities for both the structure (Sensor 1) and the specimen. Note: sensor 2 inside the structure is not shown in this plot in order that structure maturity can be more clearly compared to specimen maturity. The maturity of the structure was slightly greater than that of the specimen until about 10-days, when the specimen maturity equaled that of the structure. Then, the specimen maturity surpassed that of the structure and continued to gain maturity at a faster rate. By 28-days, the specimen maturity (9141°F-hrs) was 1477°F-hrs (19%) greater than that of the structure (7664°F-hrs).
Project 25-133, Bridge 1233, Parapet Wall Pour
0
1000
2000
3000
4000
5000
6000
7000
8000
9000
10000
0 3 7 10 14 17 21 24 28
Time (Days)
Mat
urity
(F-h
rs)
Parapet Wall Field Cured Specimen
Blanket No Blanket
Figure 52 Maturity vs. Time for February 3, 2005 Pour [Class F].
Concrete testing was performed by a consultant.ConnDOT researchers worked side-by-side with the consultant as outlined in the study work plan. The concrete temperature was 78°F, the slump was 3-inches, the air content was 5.3% and the density was 149.1 lb/ft3. Ten cylindrical test specimens were made: 5 standard cured
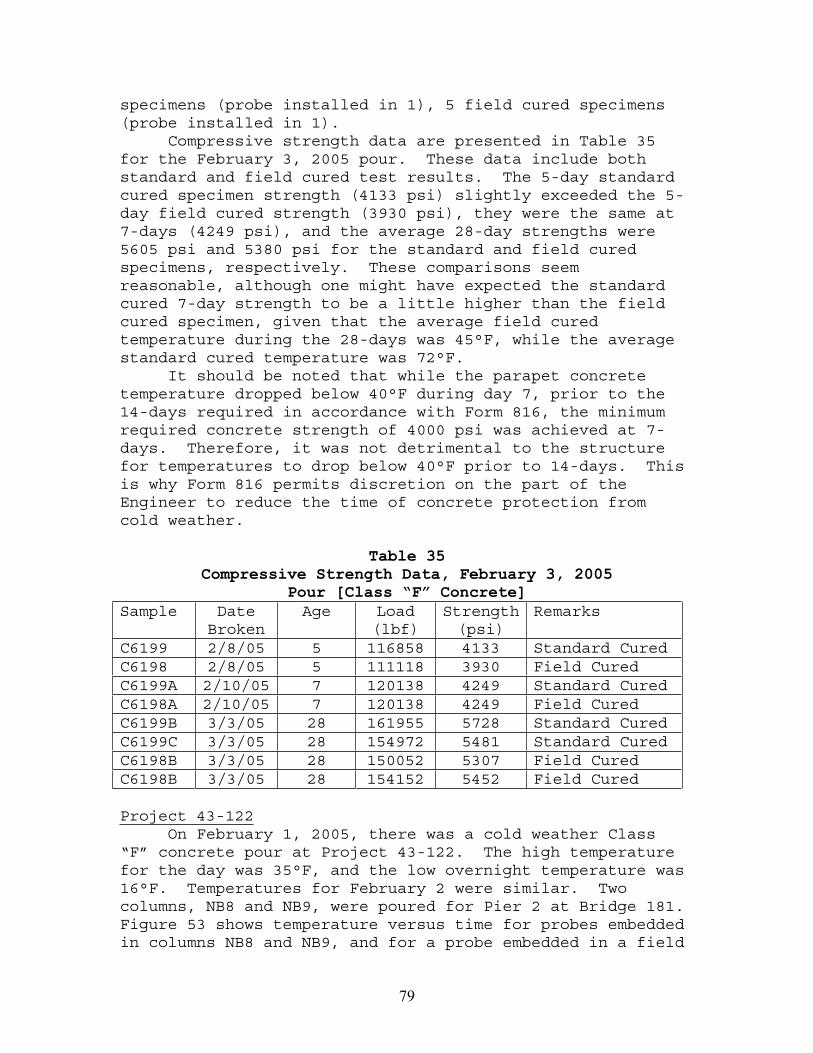
79
specimens (probe installed in 1), 5 field cured specimens (probe installed in 1).
Compressive strength data are presented in Table 35 for the February 3, 2005 pour. These data include both standard and field cured test results. The 5-day standard cured specimen strength (4133 psi) slightly exceeded the 5-day field cured strength (3930 psi), they were the same at 7-days (4249 psi), and the average 28-day strengths were 5605 psi and 5380 psi for the standard and field cured specimens, respectively. These comparisons seem reasonable, although one might have expected the standard cured 7-day strength to be a little higher than the field cured specimen, given that the average field cured temperature during the 28-days was 45°F, while the average standard cured temperature was 72°F.
It should be noted that while the parapet concrete temperature dropped below 40°F during day 7, prior to the 14-days required in accordance with Form 816, the minimum required concrete strength of 4000 psi was achieved at 7-days. Therefore, it was not detrimental to the structure for temperatures to drop below 40°F prior to 14-days. This is why Form 816 permits discretion on the part of the Engineer to reduce the time of concrete protection from cold weather.
Table 35Compressive Strength Data, February 3, 2005
Pour [Class “F” Concrete] Sample Date
BrokenAge Load
(lbf)Strength(psi)
Remarks
C6199 2/8/05 5 116858 4133 Standard Cured C6198 2/8/05 5 111118 3930 Field Cured C6199A 2/10/05 7 120138 4249 Standard CuredC6198A 2/10/05 7 120138 4249 Field Cured C6199B 3/3/05 28 161955 5728 Standard CuredC6199C 3/3/05 28 154972 5481 Standard CuredC6198B 3/3/05 28 150052 5307 Field Cured C6198B 3/3/05 28 154152 5452 Field Cured
Project 43-122On February 1, 2005, there was a cold weather Class
“F” concrete pour at Project 43-122. The high temperature for the day was 35°F, and the low overnight temperature was 16°F. Temperatures for February 2 were similar. Two columns, NB8 and NB9, were poured for Pier 2 at Bridge 181.Figure 53 shows temperature versus time for probes embedded in columns NB8 and NB9, and for a probe embedded in a field
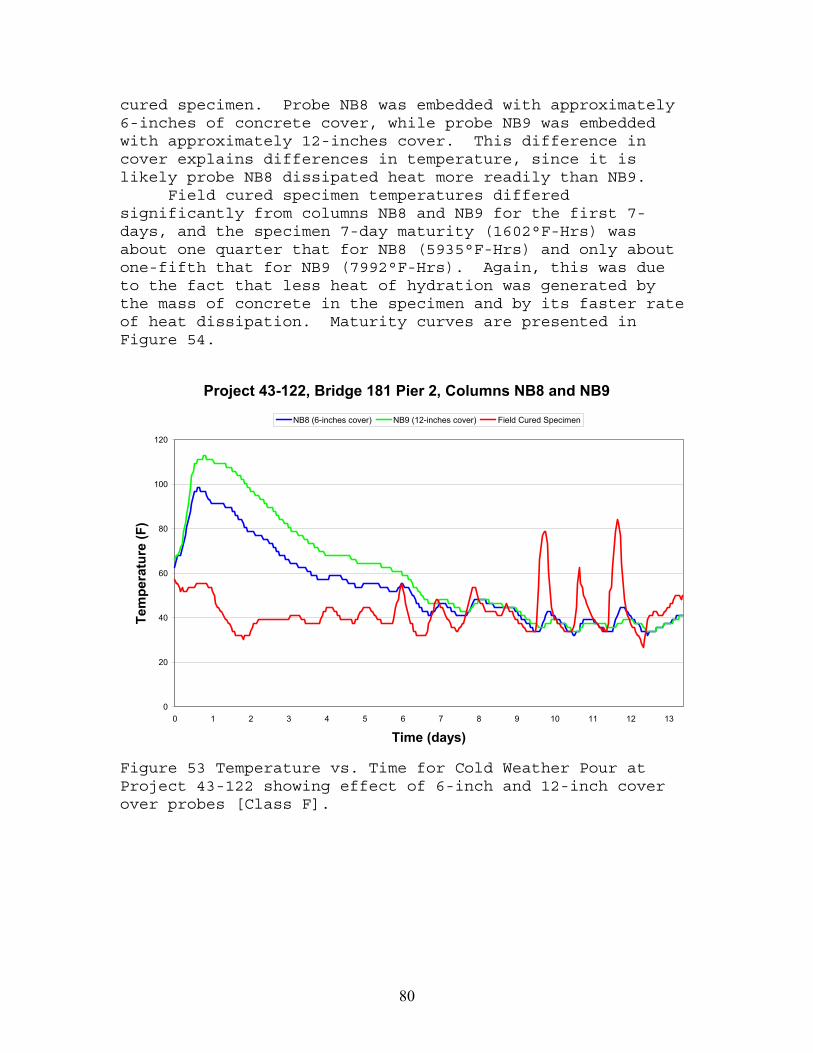
80
cured specimen. Probe NB8 was embedded with approximately 6-inches of concrete cover, while probe NB9 was embedded with approximately 12-inches cover. This difference in cover explains differences in temperature, since it is likely probe NB8 dissipated heat more readily than NB9. Field cured specimen temperatures differed significantly from columns NB8 and NB9 for the first 7-days, and the specimen 7-day maturity (1602°F-Hrs) was about one quarter that for NB8 (5935°F-Hrs) and only about one-fifth that for NB9 (7992°F-Hrs). Again, this was due to the fact that less heat of hydration was generated by the mass of concrete in the specimen and by its faster rate of heat dissipation. Maturity curves are presented in Figure 54.
Project 43-122, Bridge 181 Pier 2, Columns NB8 and NB9
0
20
40
60
80
100
120
0 1 2 3 4 5 6 7 8 9 10 11 12 13
Time (days)
Tem
pera
ture
(F)
NB8 (6-inches cover) NB9 (12-inches cover) Field Cured Specimen
Figure 53 Temperature vs. Time for Cold Weather Pour at Project 43-122 showing effect of 6-inch and 12-inch cover over probes [Class F].
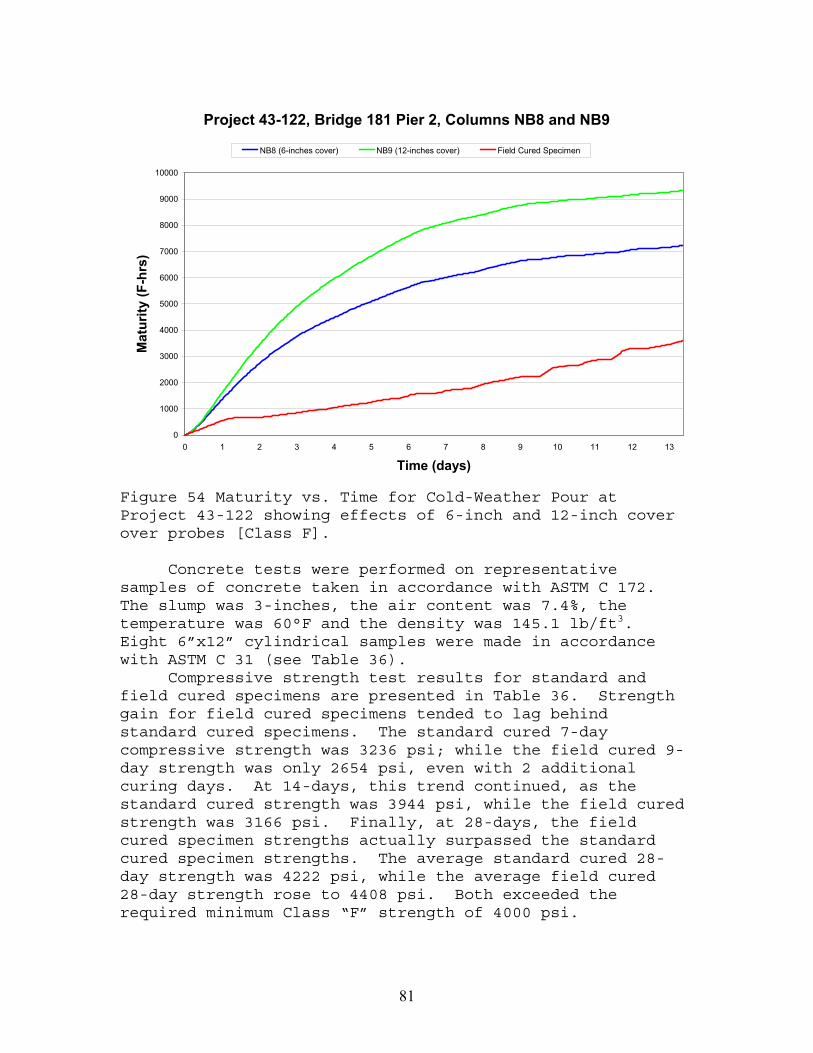
81
Project 43-122, Bridge 181 Pier 2, Columns NB8 and NB9
0
1000
2000
3000
4000
5000
6000
7000
8000
9000
10000
0 1 2 3 4 5 6 7 8 9 10 11 12 13
Time (days)
Mat
urity
(F-h
rs)
NB8 (6-inches cover) NB9 (12-inches cover) Field Cured Specimen
Figure 54 Maturity vs. Time for Cold-Weather Pour at Project 43-122 showing effects of 6-inch and 12-inch cover over probes [Class F].
Concrete tests were performed on representative samples of concrete taken in accordance with ASTM C 172.The slump was 3-inches, the air content was 7.4%, the temperature was 60°F and the density was 145.1 lb/ft3.Eight 6”x12” cylindrical samples were made in accordance with ASTM C 31 (see Table 36).
Compressive strength test results for standard and field cured specimens are presented in Table 36. Strength gain for field cured specimens tended to lag behind standard cured specimens. The standard cured 7-day compressive strength was 3236 psi; while the field cured 9-day strength was only 2654 psi, even with 2 additional curing days. At 14-days, this trend continued, as the standard cured strength was 3944 psi, while the field cured strength was 3166 psi. Finally, at 28-days, the field cured specimen strengths actually surpassed the standard cured specimen strengths. The average standard cured 28-day strength was 4222 psi, while the average field cured 28-day strength rose to 4408 psi. Both exceeded the required minimum Class “F” strength of 4000 psi.
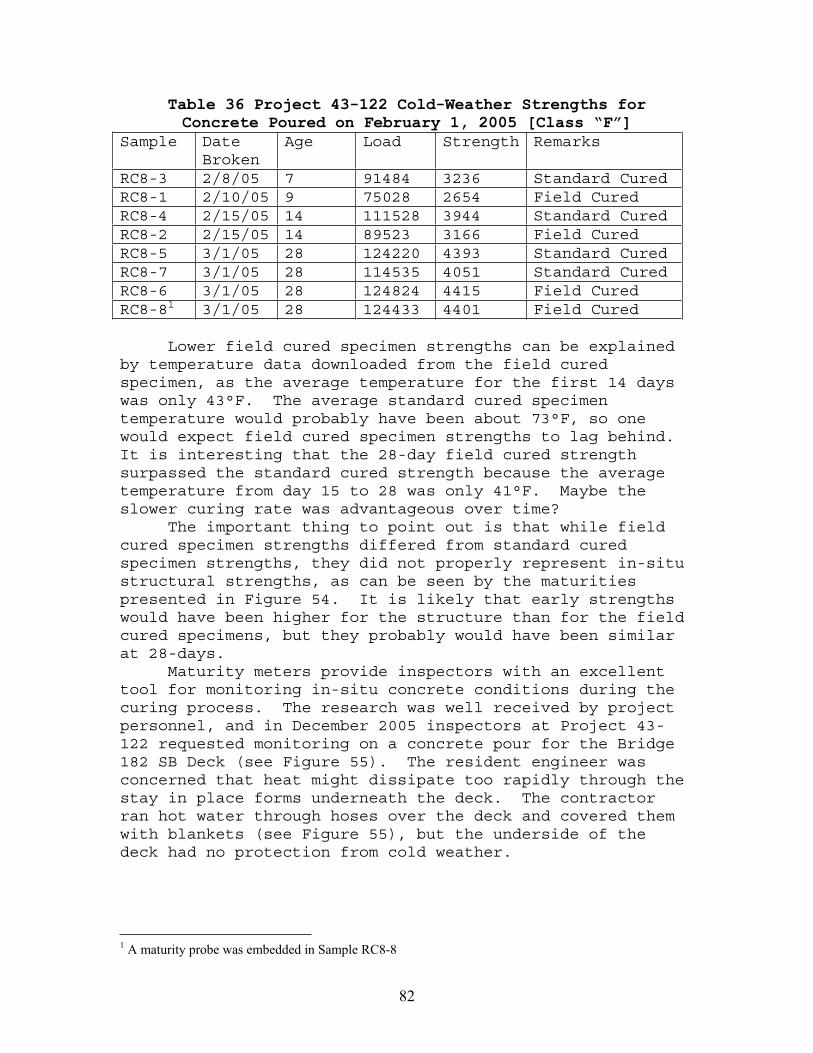
82
Table 36 Project 43-122 Cold-Weather Strengths forConcrete Poured on February 1, 2005 [Class “F”]
Sample Date Broken
Age Load Strength Remarks
RC8-3 2/8/05 7 91484 3236 Standard Cured RC8-1 2/10/05 9 75028 2654 Field Cured RC8-4 2/15/05 14 111528 3944 Standard Cured RC8-2 2/15/05 14 89523 3166 Field Cured RC8-5 3/1/05 28 124220 4393 Standard Cured RC8-7 3/1/05 28 114535 4051 Standard Cured RC8-6 3/1/05 28 124824 4415 Field Cured RC8-81 3/1/05 28 124433 4401 Field Cured
Lower field cured specimen strengths can be explained by temperature data downloaded from the field cured specimen, as the average temperature for the first 14 days was only 43°F. The average standard cured specimen temperature would probably have been about 73°F, so one would expect field cured specimen strengths to lag behind.It is interesting that the 28-day field cured strength surpassed the standard cured strength because the average temperature from day 15 to 28 was only 41°F. Maybe the slower curing rate was advantageous over time? The important thing to point out is that while field cured specimen strengths differed from standard cured specimen strengths, they did not properly represent in-situ structural strengths, as can be seen by the maturities presented in Figure 54. It is likely that early strengths would have been higher for the structure than for the field cured specimens, but they probably would have been similar at 28-days. Maturity meters provide inspectors with an excellent tool for monitoring in-situ concrete conditions during the curing process. The research was well received by project personnel, and in December 2005 inspectors at Project 43-122 requested monitoring on a concrete pour for the Bridge 182 SB Deck (see Figure 55). The resident engineer was concerned that heat might dissipate too rapidly through the stay in place forms underneath the deck. The contractor ran hot water through hoses over the deck and covered them with blankets (see Figure 55), but the underside of the deck had no protection from cold weather.
1 A maturity probe was embedded in Sample RC8-8
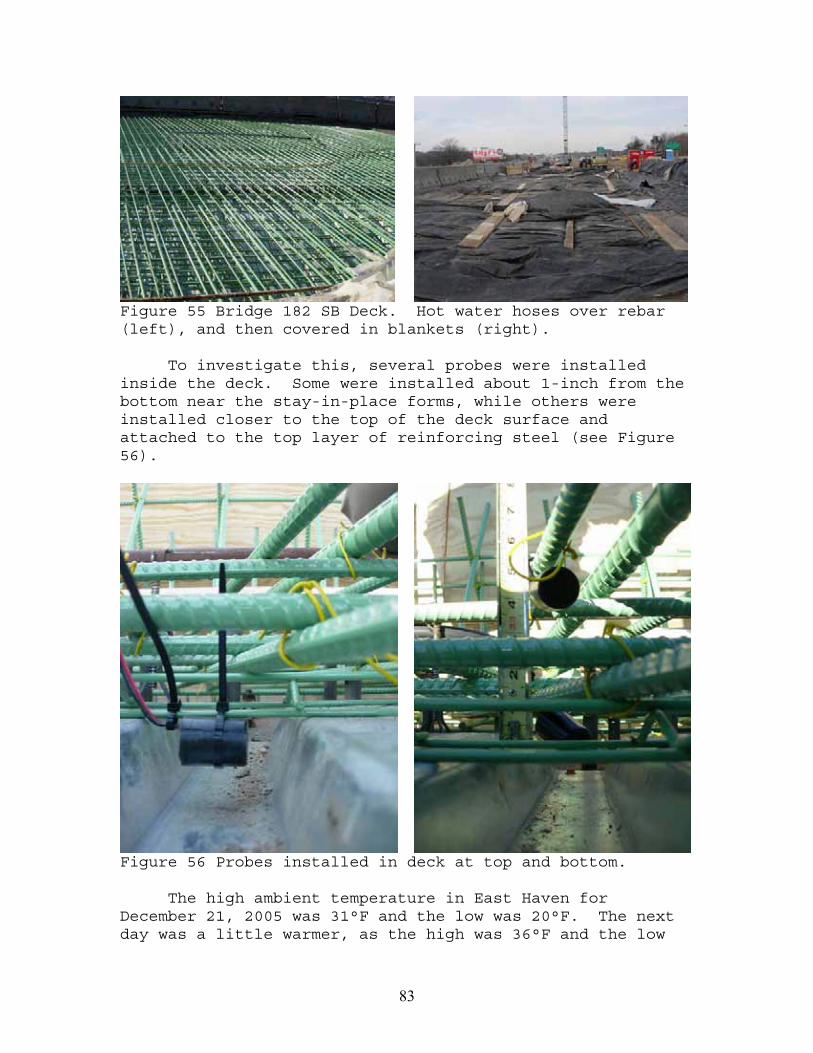
83
Figure 55 Bridge 182 SB Deck. Hot water hoses over rebar (left), and then covered in blankets (right).
To investigate this, several probes were installed inside the deck. Some were installed about 1-inch from the bottom near the stay-in-place forms, while others were installed closer to the top of the deck surface and attached to the top layer of reinforcing steel (see Figure 56).
Figure 56 Probes installed in deck at top and bottom.
The high ambient temperature in East Haven for December 21, 2005 was 31°F and the low was 20°F. The next day was a little warmer, as the high was 36°F and the low
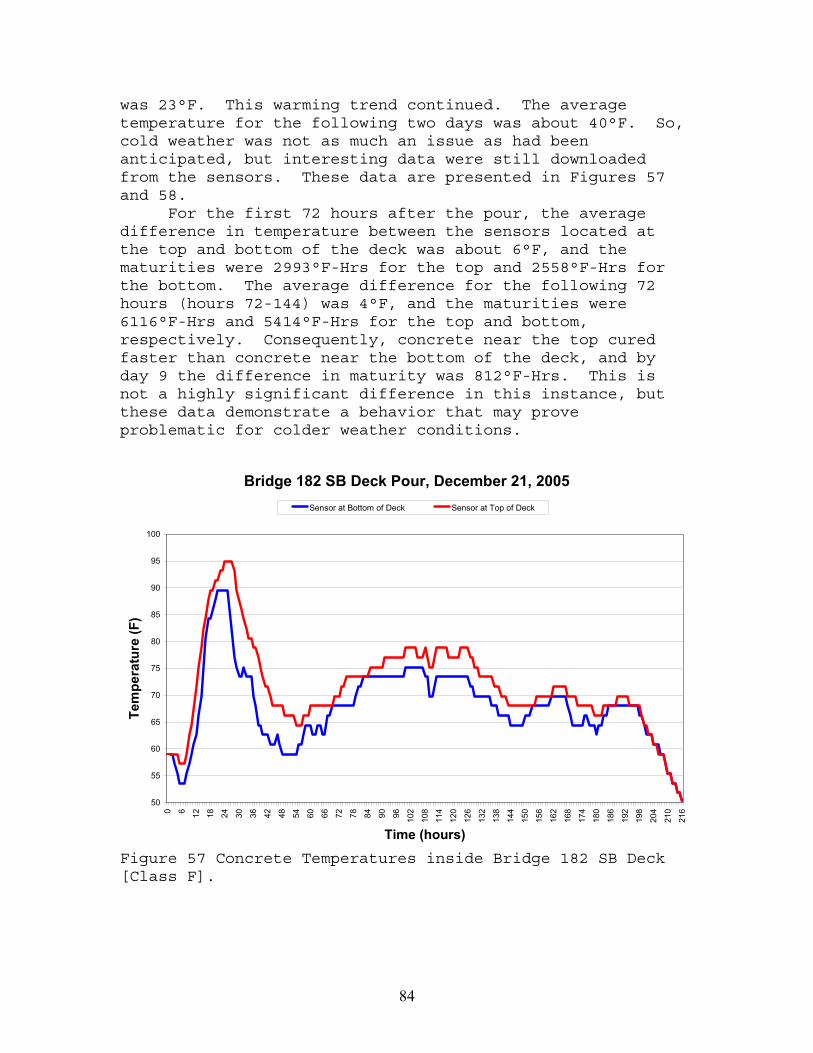
84
was 23°F. This warming trend continued. The average temperature for the following two days was about 40°F. So, cold weather was not as much an issue as had been anticipated, but interesting data were still downloaded from the sensors. These data are presented in Figures 57 and 58. For the first 72 hours after the pour, the average difference in temperature between the sensors located at the top and bottom of the deck was about 6°F, and the maturities were 2993°F-Hrs for the top and 2558°F-Hrs for the bottom. The average difference for the following 72 hours (hours 72-144) was 4°F, and the maturities were 6116°F-Hrs and 5414°F-Hrs for the top and bottom, respectively. Consequently, concrete near the top cured faster than concrete near the bottom of the deck, and by day 9 the difference in maturity was 812°F-Hrs. This is not a highly significant difference in this instance, but these data demonstrate a behavior that may prove problematic for colder weather conditions.
Bridge 182 SB Deck Pour, December 21, 2005
50
55
60
65
70
75
80
85
90
95
100
0 6 12 18 24 30 36 42 48 54 60 66 72 78 84 90 96 102
108
114
120
126
132
138
144
150
156
162
168
174
180
186
192
198
204
210
216
Time (hours)
Tem
pera
ture
(F)
Sensor at Bottom of Deck Sensor at Top of Deck
Figure 57 Concrete Temperatures inside Bridge 182 SB Deck [Class F].
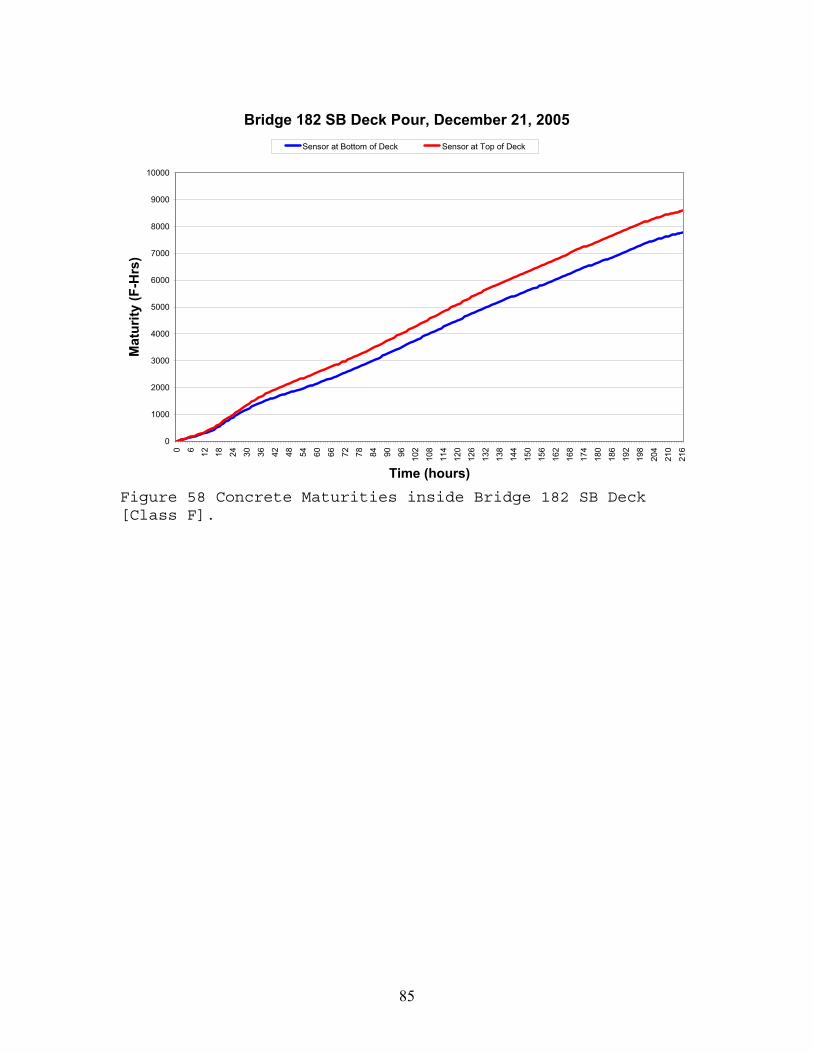
85
Bridge 182 SB Deck Pour, December 21, 2005
0
1000
2000
3000
4000
5000
6000
7000
8000
9000
100000 6 12 18 24 30 36 42 48 54 60 66 72 78 84 90 96 102
108
114
120
126
132
138
144
150
156
162
168
174
180
186
192
198
204
210
216
Time (hours)
Mat
urity
(F-H
rs)
Sensor at Bottom of Deck Sensor at Top of Deck
Figure 58 Concrete Maturities inside Bridge 182 SB Deck [Class F].
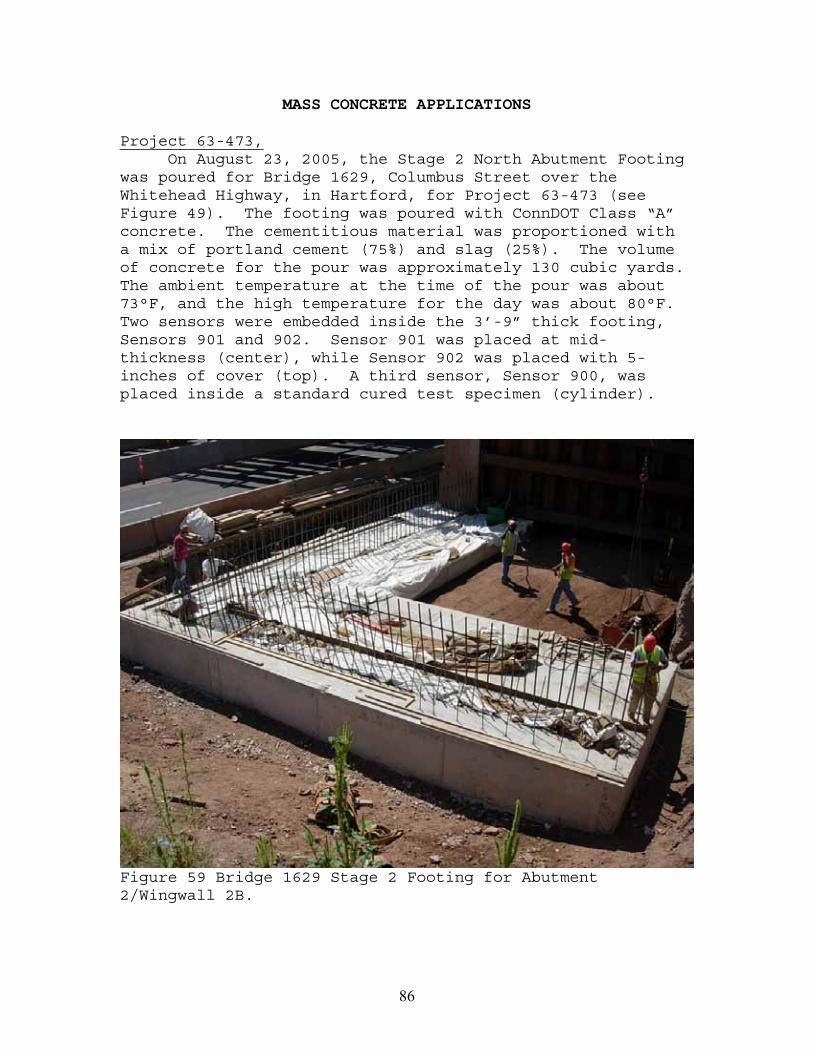
86
MASS CONCRETE APPLICATIONS
Project 63-473, On August 23, 2005, the Stage 2 North Abutment Footing was poured for Bridge 1629, Columbus Street over the Whitehead Highway, in Hartford, for Project 63-473 (see Figure 49). The footing was poured with ConnDOT Class “A” concrete. The cementitious material was proportioned with a mix of portland cement (75%) and slag (25%). The volume of concrete for the pour was approximately 130 cubic yards.The ambient temperature at the time of the pour was about 73°F, and the high temperature for the day was about 80°F.Two sensors were embedded inside the 3’-9” thick footing, Sensors 901 and 902. Sensor 901 was placed at mid-thickness (center), while Sensor 902 was placed with 5-inches of cover (top). A third sensor, Sensor 900, was placed inside a standard cured test specimen (cylinder).
Figure 59 Bridge 1629 Stage 2 Footing for Abutment 2/Wingwall 2B.
87
Note the temperature gradient between the center (Sensor 901) and top (Sensor 902) of the footing (see Figure 60). The center reached a maximum temperature of 150°F at about 33 hours, while the top (Sensor 902) reached a maximum temperature of 123°F at about the same time, which amounts to a 27°F temperature differential.Temperature differentials of this kind are typical for mass pours because the heat of hydration generated as the concrete cools cannot dissipate easily in the interior of the structure (8). Meanwhile, surface concrete temperatures dissipate more readily because of exposure to ambient temperatures. Evidence of this can be seen by comparing how smooth the Sensor 901 curve is in comparison to the Sensor 902 curve, because surface temperatures fluctuate much more with ambient temperatures as heat is absorbed and then dissipated. While 27°F is a rather large temperature differential, it is less than the maximum of 36°F suggested in various studies (8). These studies indicate that when temperature differentials are too great, tensile stresses develop as cooler concrete contracts, and then cracks develop at the surface. It is noteworthy that in this instance, cracks were not observed on the surface of the footing in the days following the concrete pour. As stated previously, the high temperature for the day of the pour was only 80°F. For the three days following the pour, high temperatures were 76°F, 80°F and 83°F. The concrete temperature measured during the pour was 85°F, which is within the specified ConnDOT limits of 60°F to 90°F. If this work was done during warmer weather, temperature related problems may have developed. August temperatures often exceed 90°F, and when ambient temperatures reach into to the 90s, concrete temperatures rise also, unless measures are taken to cool the concrete.It is not uncommon to see concrete temperatures as high as 95°F during New England summers. Larger temperature differentials may have occurred if ambient temperatures were higher. For instance, if the ambient temperature was 93°F and temperatures were elevated for several days prior to the pour, it is possible the concrete temperature would have been over 90°F also; consequently, temperature differentials greater than 36°F could develop.
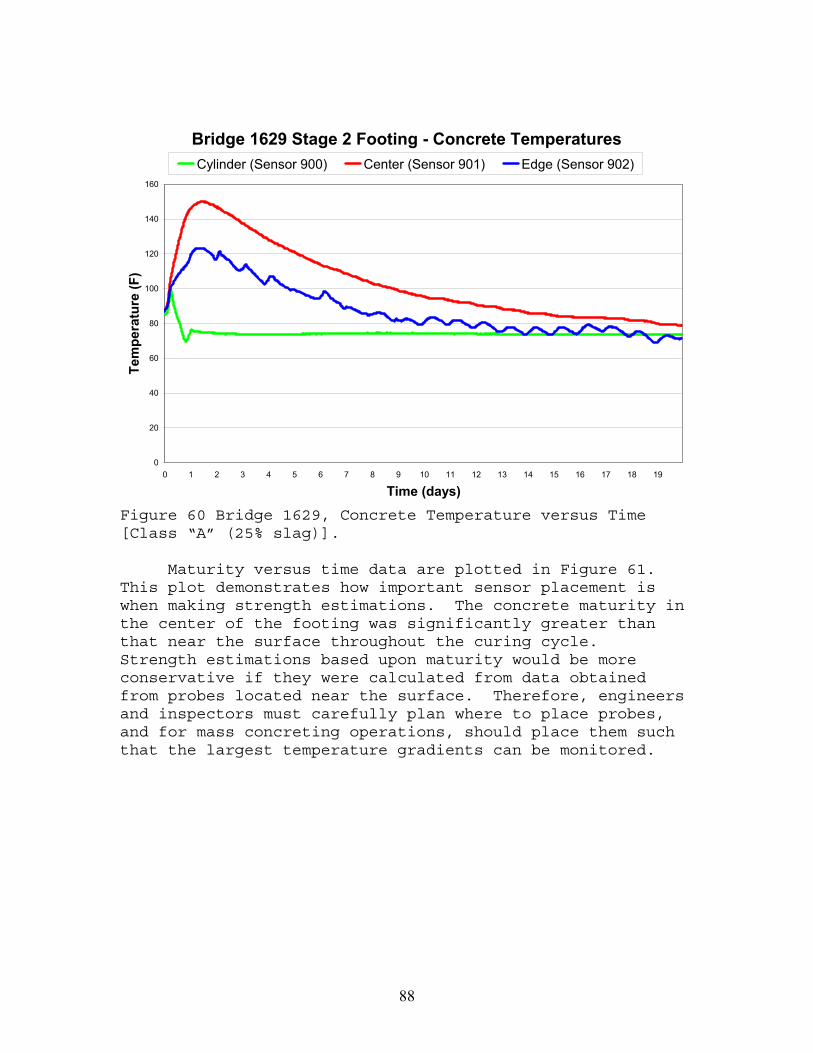
88
Bridge 1629 Stage 2 Footing - Concrete Temperatures
0
20
40
60
80
100
120
140
160
0 1 2 3 4 5 6 7 8 9 10 11 12 13 14 15 16 17 18 19
Time (days)
Tem
pera
ture
(F)
Cylinder (Sensor 900) Center (Sensor 901) Edge (Sensor 902)
Figure 60 Bridge 1629, Concrete Temperature versus Time [Class “A” (25% slag)].
Maturity versus time data are plotted in Figure 61.This plot demonstrates how important sensor placement is when making strength estimations. The concrete maturity in the center of the footing was significantly greater than that near the surface throughout the curing cycle.Strength estimations based upon maturity would be more conservative if they were calculated from data obtained from probes located near the surface. Therefore, engineers and inspectors must carefully plan where to place probes, and for mass concreting operations, should place them such that the largest temperature gradients can be monitored.
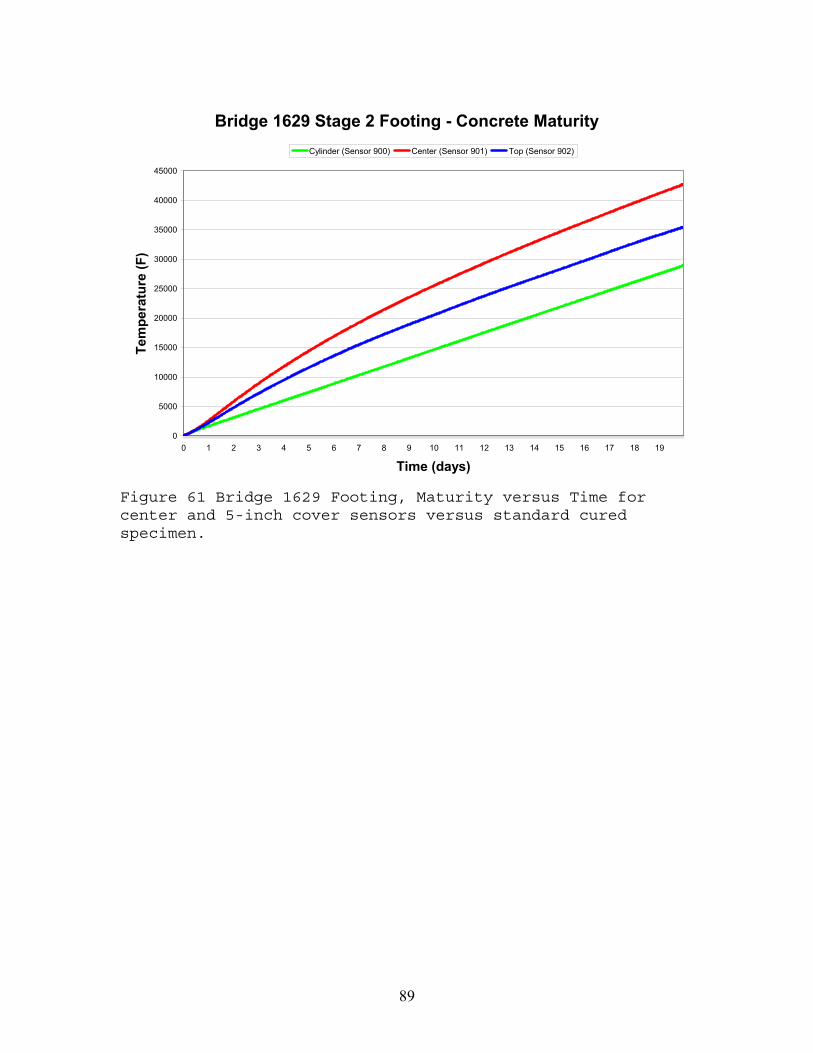
89
Bridge 1629 Stage 2 Footing - Concrete Maturity
0
5000
10000
15000
20000
25000
30000
35000
40000
45000
0 1 2 3 4 5 6 7 8 9 10 11 12 13 14 15 16 17 18 19
Time (days)
Tem
pera
ture
(F)
Cylinder (Sensor 900) Center (Sensor 901) Top (Sensor 902)
Figure 61 Bridge 1629 Footing, Maturity versus Time for center and 5-inch cover sensors versus standard cured specimen.
90
PCC FIELD TESTING ON CONNDOT PROJECTS
Researchers observed concreting operations on several projects and worked side-by-side with construction inspectors. Overall, the inspectors were well qualified, and in every instance, they were certified as ACI Concrete Field Testing Technicians – Grade I and NETTCP Concrete Inspectors. However, certain ASTM procedures make it impossible for them to know whether concrete from a truck is deficient (off-spec) until it’s too late because most of the truck’s contents are already poured and in the forms by the time they obtain their results. For example, ASTM C 172, Sampling Freshly Mixed Concrete, requires that samples be taken from the middle portion of the batch. When a truck arrives, pouring operations begin immediately and continue until about half of the truck’s contents are gone. Then, a sample is taken, the inspectors begin performing concrete tests, and pouring operations resume. Tests include slump, temperature and air content. Once these tests are finished, concrete test specimens (usu. 4) are made. It takes inspectors about 15 minutes to complete this work. By this time, the truck from which the sample was taken is empty and placement continues with the next truck, or, if it is a small job, placement is complete. This process becomes problematic when test results show that the concrete placed is off-spec, and researchers witnessed several instances where this happened, especially with air content. Project inspectors would generally notify the contractor and/or concrete truck driver that the concrete was off-spec and tell them to make adjustments, and then follow-up by testing subsequent loads. An instance of off-spec concrete being used occurred on a job where air contents were high. Air tests were performed on a sample taken for making test specimens. The specified air content was 6% +/- 1.5% (4.5% - 7.5%). The air content measured by the inspector prior to pumping (at the truck) was 6.2%, but the air content measured by researchers after pumping (at the pump) was 8.6%. Of course, the inspector’s tests were the official tests, and they were the tests of record, but red flags went up, especially considering that air contents after pumping are usually lower – not higher. The next truck was sampled, specifically for air content at both the end of the truck’s chute and at the end of the pump, for comparison. Air contents at both locations were 10% in this case, well over specification. The inspector took a sample from another
91
truck to make test specimens and measured the air content at 10.0%, which was the test of record for the sample.Still, no adjustments were made by the concrete producer.Researchers took another sample from yet another truck and measured the air content at 9.0%. Then, they sampled another truck and measured the air content at 8.2%. The inspector sampled a subsequent truck for making another set of test specimens and measured the air content at the truck’s chute to be 7.1%, which was within specification.Most of the concrete that ultimately ended up in the structure was off-spec. Note: this degree of testing is not typical. Excessively high air content can reduce concrete strength and increase permeability. Therefore, to follow-up on the above test results, compressive strengths were tracked. The average 28-day compressive strength for the first set of specimens, with an air content of 6.2% at the truck and 8.6% at the pump, was 3959 psi, which was accepted slightly less than the specified strength of 4000 psi. Despite the high air content (10.2%) for the second set of specimens, the average 28-day strength for these samples was 4191 psi. Finally, the average 28-day strength for the on-spec set of specimens, where the air content was 7.1%, was 4235 psi. High air content did not have a significantly detrimental effect on the concrete in this instance, although one sample was accepted slightly less than specified. Also, these 28-day strengths were much less than the Class “F” average for 2004 of 5035 psi. The potential for a more detrimental effect was there, and the end product would have been better if the air contents were on-spec, i.e. higher strengths/lower permeability.
Considering the discussion above, it appears the procedures used for sampling concrete, the timing for performing tests and then placing concrete need to be revised. These procedures should strive to increase the validity of test results, thereby improving the quality of concrete delivered to ConnDOT projects.
92
CONCLUSIONS
Assessing Concrete Testing MethodsThe overall rejection rate for PCC samples between
1997 and 2004 (inclusive) was 3.1%. Researchers confirmed that rejections occur most often, on a percentage basis, during the summer months of June (4.2%), July (4.8%) and August (4.3%). They confirmed that rejections occur least often in the winter months of December (2.0%), February (1.4%) and March (1.3%). Average monthly temperature data for the same years (1997-2004) were plotted versus rejection percentages for each month. The coefficient of determination (R2) was calculated to be 0.656, which demonstrates a relationship between rejections and ambient temperature. Therefore, high rates of rejections are linked to weather. Furthermore, the R2 value shows that other factors are involved; otherwise, the R2 value would be higher (closer to 1.0). Further signs of a seasonal (summer) downtrend in PCC compressive strengths were evident in 2004 data, as average Class “F” strengths for June (4956 psi), July (4785 psi), August (4375 psi) and September (4614 psi) were all less than the 2004 Class “F” mean strength of 5035 psi. The same trend was seen for Class “A” concrete in 2004, as average strengths for June (4320 psi), July (4298 psi), August (4244 psi) and September (4409 psi) were less than the 2004 Class “A” mean strength of 4548 psi. The annual mean strengths for these concretes were both well above their minimum required 28-day strengths.The Class “F” average compressive strength was 1035 psi greater than specified, while the Class “A” average was 1548 psi greater than specified. ACI 318 Table 5.3.2.2 requires average compressive strengths of trial batches used for proportioning concrete mixtures to be equal to the specified strength plus 1200 psi. Using that requirement as a guideline, it may be said that the Class “F” concrete slightly underperformed, while the Class “A” concrete over performed what is desirable. The seasonal downtrend likely is a result of how specimens were cured in hot weather conditions.Researchers witnessed firsthand how specimens in black plastic molds are often stored in the hot summer sun for their initial cure. In one instance, a temperature probe was embedded in a specimen stored in the sun alongside acceptance specimens, and the data showed that a peak temperature of 127°F was reached in just 4 hours, while the temperature of the concrete inside the forms never reached
93
100°F because the structure was protected with wet burlap blankets. This observation was corroborated in the literature review, as Hover (9) reported that he commonly observed specimens in black plastic molds sitting in the hot summer sun. He also indicated he had monitored cylinders stored on site and compared their temperatures to the in-place concrete. His data were remarkably similar to the abovementioned data, as he measured the temperature of the specimen at 124°F, while the temperature inside the forms was measured at about 100°F. Finally, Hover (9) pointed out that after about 3 days, “… the ‘hot cylinder’ will yield a strength that may be lower than the strength of the in-place concrete.” This author believes Hover’s statement is in-line with ConnDOT’s hot-weather concrete strength performance downtrend. ASTM C 31 requires that standard cured specimens be initial cured in a temperature range from 60°F to 80°F.This requirement for temperature may be unrealistic because of the linear nature of most ConnDOT construction projects.It would be cumbersome to move concrete curing boxes back and forth between pours along a given stretch of roadway, and if a cooling/heating element is required, it would be difficult to find electrical power to maintain temperatures between 60 and 80°F. Nevertheless, cylinders should be protected in wooden boxes and covered for storage overnight until they can be moved to curing boxes the next day.
Conclusion #1: Concrete rejections occur most often, on a percentage basis, during the summer months because cylinder specimens are not being initially cured in accordance with requirements for standard cured specimens in ASTM C 31.More specifically, they are not being stored in an environment that prevents moisture loss from the specimens in a temperature range from 60 and 80°F. This likely is the primary cause for low strength test results of PCC samples during ConnDOT construction projects.
A concrete taskforce was formed in response to some of the issues raised during this study. One issue had to do with taking specimens from initial to final curing, and transporting specimens to the ConnDOT Central Laboratory, as per standard curing procedures. While the taskforce agreed that the overall standard curing procedures are ideal, most considered them impractical for active construction projects. ConnDOT specifications need to be
94
revised to allow for a modified curing procedure that does not significantly impact test results.
Conclusion #2:Standard curing procedures as per ASTM C 31 may be ideal, but they are unrealistic for practical application on many ConnDOT projects. Alternative procedures are needed for instances when standard curing procedures cannot be achieved.
Regarding field curing specimens, ConnDOT inspectors are able to follow the procedures contained in ASTM C 31. However, this research and others found in literature indicates field cured specimens do not adequately represent the in-place concrete of the structure. This is because the mass of concrete inside a 6”x12” cylinder specimen differs greatly from the mass inside most structures.Therefore, it is incorrect to assume field cured cylinder results always represent in-place concrete. This was proven by comparing field cured specimens to in-place concrete temperatures and maturities. For many instances, their respective temperatures and maturities differed significantly.
Conclusion #3: Field cured specimens do not adequately represent in-place concrete.
Statistics for 1997 to 2004 showed that concrete rejection rates are related to mix types and their specified strengths. Class “A” and Class “C” concretes, which each have specified strengths of 3000 psi, had rejection rates of 0.9%, while Class “F” (4000 psi) and Pavement (3500 psi) concretes had rates of 3.7% and 3.6%, respectively. This amounts to a fourfold difference. It is also worth pointing out some 2004 statistical data regarding the margin of error for Class “A” concrete (3000 psi) versus Class “F” concrete (4000 psi). The lowest average monthly 28-day strength for the Class “A” concrete was 4244 psi (August 2004), which is 1244 psi greater than the specified minimum strength (3000 psi).Compare this to the Class “F” concrete (4000 psi), where the lowest average monthly 28-day strength was 4375 psi (August 2004), which is just slightly greater than the specified strength. So, there was a much larger margin for error for the Class “A” concrete (3000 psi) than for the Class “F” concrete (4000 psi).
95
Considering the minimum cementitious materials required per cubic yard of concrete for the Class “A” mix (615 lbs) and Class “C” mix (658 lbs), it is understandable that there weren’t many rejections, especially for the Class “C” mix. It is theorized that for these cement rich mixes, 28-day minimum compressive strengths of 3000 psi are very achievable. While less stringent requirements for water cementitious materials ratios may exist for these mixes (w/cm = 0.53), the use of water reducing admixtures have enabled concrete producers to add less water.Consequently, there haven’t been many rejections of these 3000 psi concrete specimens.
Conclusion #4: ConnDOT Class “A” and Class “C” concrete mix types (3000 psi) have been much less problematic than Class “F” (4000 psi) and Pavement (3500 psi) concrete mix types, because water reducing admixtures have enabled producers to lower water cementitious ratios to levels for which 3000 psi strengths are readily achieved.
Estimating Strength with Maturity ASTM C 1074 Section 5.4 states “the accuracy of the estimated strength depends on properly determining the maturity function for the particular concreting mixture.”Based upon this study, the above statement cannot be emphasized enough. The problem with the method, as it applies to ConnDOT applications, is that the mixes used vary from day-to-day or sometimes even load-to-load. For example, a strength-maturity relationship was developed for Pavement concrete that was expected to be used on Project 25-133. A trial batch was mixed which included 25% GGBFS and a 0.37 w/cm ratio. Procedures in ASTM C 1074 were followed and a strength-maturity curve was plotted. The strength was exceptionally high for the trial batch, as the 28-day breaks attained an average strength of 6000 psi, likely due to the low w/cm ratio. The actual concrete used during construction did not contain GGBFS, and the w/cm ratio was higher (0.44). Then, during one day’s pour, an accelerator was used in the mix, which further deviated from the calibration mix. Consequently, the accuracy of estimated strengths by the maturity method was poor.
Conclusion #5: The accuracy of estimated concrete compressive strengths by the maturity method strongly depended on properly
96
determining the maturity function for concrete mixtures actually used in the field.
Of course, another strength-maturity relationship could have been developed with another batch, but that would have taken another 28-days. On Project 43-122, this was done. A trial batch was used to develop a strength-maturity relationship for Class “F” concrete used on Project 43-122, but the 28-day strengths were lower than specified, so the maturity function had to be scrapped.Accordingly, another trial batch was mixed and a new maturity function determined. This took additional time and effort, and the whole process of determining the maturity function was found to be somewhat cumbersome, so it is not something that inspectors (field or DMT) will want to do repeatedly.
Conclusion #6: The procedure for developing strength-maturity relationships was found to be cumbersome, and if the maturity method is used on future projects, it is likely that the procedure will have to be done more than once because of concrete mixture variations.
The maturity method worked well in estimating the strength of the “mock” structures (blocks) for the aforementioned DSS research project (see “A Maturity Application for Research”). The estimated 28-day strengths by the maturity method represented the in-place concrete strength much better than standard cured specimens. This was proven by drilling cores from the blocks, which were cured in cooler temperatures than the standard cured specimens, and then testing them at 28-days. The research included two batches, one with fly ash and the other without. The estimated strength by the maturity method using a regression equation for the block without fly ash was 4604 psi, versus an in-place strength determined from the cores of 4500 psi. For the mix with fly ash, the estimated strength by the maturity method was 4451 psi, versus an in-place strength determined from the cores of 4030 psi. Consideration must be given to the fact that the in-place strength determined from drilled cores is not necessarily the ground truth because of adverse affects caused by water-cooled core drilling. This may explain why the in-place strength was determined to be only 4030 psi for the fly ash mix, which was only 91% of the estimated strength by maturity. If the core strength was, in fact,
97
affected by water-cooled drilling, 91% of the estimated strength would have been reasonable. The bottom line here is that the maturity method does provide reasonable in-place strength estimations when the maturity function is determined by representative concrete mixtures. Therefore, the method has its place in ConnDOT concrete construction, but its use should be limited to larger, more important structures.Consideration should be given to developing a protocol for using the maturity method for “special” structures, but it would be too cumbersome to develop a protocol for normal/everyday work. If ConnDOT built more PCC pavements, the method might have had a place there, but ConnDOT primarily uses HMA for pavements, so it would not be practical to develop a protocol for pavement applications either.
Conclusion #7: In-place concrete strength estimations by the maturity method are very good when the strength-maturity relationship is developed from the actual batch used to pour the structure being monitored.
Temperature Profiling with Maturity Kits The three maturity kits proved to be accurate tools for monitoring concrete temperatures, especially for cold weather, hot weather and mass concreting operations. Current ConnDOT cold-weather concreting practices, as per Form 816, include taking measures to ensure that the temperature surrounding the structure be kept above certain levels for certain periods of time. These practices do not include measures to ensure that the actual in-place concrete be kept above certain temperatures for specified periods of time. Form 816 should be revised to include such specifications, and the maturity kits should be promoted for use in monitoring temperatures. Since hot-weather concreting has been shown to be problematic, temperature profiling of concrete structures and test specimens should be conducted periodically during hot weather to ensure appropriate precautions are being taken. When standard curing procedures cannot be strictly followed and specimens are kept in makeshift boxes or left outside overnight, specimen temperatures should be monitored. Then, if 28-day strength results are low, this information can be used to see if excessively high curing temperatures were a factor.
98
Temperature profiling should be conducted in certain mass concreting operations, especially during hot weather, in order to ensure that excessively high temperature gradients do not develop in the structure. Probes should be placed in the center of the concrete mass and at the outside edge for comparison. If these gradients are large and cracks develop in the structure, engineers will know the cause and effect, so decisions can be made accordingly.
Conclusion #8:Concrete temperature profiling with maturity kits provides accurate data for monitoring the curing of in-place concrete, especially for concreting in hot/cold weather and for mass concreting operations.
In summary, concrete temperature profiling will provide engineers with more data from which informed decisions can be made. Inadequate construction and inspection practices can be more easily identified, so that adjustments can be made to correct deficiencies.Temperature profiling can be used to verify conformance to specifications. Finally, maturity kits, such as the three evaluated in this study, provide accurate tools for performing this work.
Maturity Kit Comparisons Three different maturity kits were evaluated during this study: Engius’ intelliRockTM II, Transtec Group’s Pocket Command CenterTM Kit, and International Road Dynamics’ (IRD) Concrete Maturity Monitor. A detailed discussion of each was already provided in this report.The following are closing remarks on the subject. The intelliRockTM II and Pocket Command CenterTM kits had comparable features, so the following discussion will include direct comparisons between them. The IRD kit will also be compared to the others, but in a more general manner because its features differ considerably from the others. The intelliRockTM II kit included a special ruggedized reader w/ download cable, while the Pocket COMMAND CenterTM
kit included a Pocket PC capable of being synchronized with a desktop PC. Note: the intelliRockTM II reader appeared to be ruggedized, but no data were actually provided by Engius to quantify this assertion. This apparent ruggedness may have been offset by the fact that it was more cumbersome to carry than the Pocket PC when climbing scaffolding or ladders. Each kit included 50 loggers/sensors. The

99
intelliRockTM loggers also appeared to be more ruggedized than the COMMAND CenterTM Button sensors (iButtons®), but no problems were encountered with either insofar as their ruggedness was concerned. Finally, the intelliRockTM II kit included a carrying case, while the Pocket COMMAND CenterTM
kit did not. Basic intelliRockTM II procedures, such as downloading from loggers to the reader, were extremely easy, and little or no computer experience was required. Once data were uploaded to a desktop PC, some computer proficiency was necessary, but the software was easy to use for experienced PC users. Downloading from iButtons® to the Pocket PC required users to have some degree of computer know-how and it was somewhat more complicated than the intelliRockTM II kit, but it was not especially difficult. Computer literate personnel could easily be trained to install iButtons® and download data within 15 minutes. Once data were downloaded to the Pocket PC, they were accessed on a desktop PC by synchronizing with the Pocket PC. Software for both kits worked well, but intelliRockTM’s RockwareTM
software was more intuitive and user friendly. The intelliRockTM II was appreciably more expensive than the Pocket COMMAND CenterTM kit, as they cost $4,389 and $2,370, respectively. The Pocket COMMAND CenterTM kit performed all the necessary functions and therefore provided the best value for the money. The biggest expense for the intelliRockTM II kit was its reader, which was $2,772. The loggers/sensors were similar in price (about $40), so once an initial investment is made to purchase the reader, its operational costs become more competitive. For less computer savvy inspectors, the additional cost for the intelliRockTM II may be worth the investment.
Conclusion #9: The Engius’ intelliRockTM II maturity kit was the best of the three kits evaluated, based primarily upon its overall ease of use.
Conclusion #10: Transtec Group’s Pocket Command CenterTM kit provided the best value for the money, as it cost substantially less than the intelliRockTM II kit and performed better than the IRD Concrete Maturity Monitor kit. It included all of the required elements for performing temperature and maturity monitoring.
100
The IRD Concrete Maturity Monitor provided wireless capabilities. For instances where climbing was required in order to connect wires, the wireless kit offered an alternative. The kit purchased for this study included 20 extension tags with probes. The tags were not sacrificial, so additional probes may be purchased and used with the tags in the future. Note that the probes do not include data storage capabilities, so they must be connected to tags in order to collect data. An advantage to this is that they are less expensive than the intelliRockTM II loggers or the iButtons®. The total cost for the IRD kit was $4,147, but its cost should not be compared to the other kits because it did not include a reader and it only included 20 extension tags. For this study, a laptop PC was used for reading and downloading tag data, but a Pocket PC could have also been used. Additionally, costs should not be compared because the IRD kit is more specialized than the others due to its wireless capabilities, so it is really a different item altogether. The IRD kit is not recommended for use in developing strength-maturity relationships from trial batches because its wireless features are not necessary for these instances as all the work is done in a laboratory. Furthermore, it was found during the study that the tags did not perform well in the lab’s moist room; in fact, they failed, as they could not be read after being in the moist room for several days. If the IRD kit is the only maturity kit available, it is recommended that specimens be standard cured with probes installed and their tags protected from moisture. In order to read tags in the field, a direct line of sight was needed between a tag and the antenna. This proved to be difficult in some instances because of obstructions, and researchers had to climb structures in order to get close enough to the tags. In these instances, a wired system would have worked just as well. When a direct line of sight was available, researchers were usually able to read the tags remotely. However, there were occasions when tags could not be read, even when a direct line of sight was available. For these cases, researchers had to climb ladders and get close to the tags (within a few feet). In view of these difficulties, wireless maturity kits are not recommended for jobs that do not require remote access. It is preferable to order longer wires or splice wire extensions to probe wires. If no other alternatives
101
are available, the IRD wireless kit can be considered for use in temperature/maturity monitoring.
Conclusion #11: The IRD Concrete Maturity Monitor kit provided a viable wireless solution for performing temperature and maturity monitoring. For certain specialized applications, this may be the best choice; however, for most construction work, wireless maturity and temperature monitoring is unnecessary and not recommended in light of observed limitations in performance of the wireless technology.
RECOMMENDATIONS
Concrete Testing Methods ConnDOT should continue using standard cured specimens for acceptance testing for specified strength. In-place concrete strength estimations using the maturity method should be used on larger, more important structures to supplement these tests. Additionally, field cured specimens should be made for more important structures, with a companion instrumented field-cured specimen for monitoring field-cured-specimen maturity. This will provide engineers with more data from which better decisions can be made. Since the maturity method will be used for informational purposes, not for expediting construction, an alternative concurrent protocol (to ASTM C 1074 Section 8) is recommended for developing a strength maturity relationship. While fewer cylinders would be required by this recommended alternative procedure, the tests would be performed on the actual concrete in the structure, not just similar concrete from a trial batch. Its intended use is to provide engineers with more information to make better decisions, especially when low compressive strength results occur. The following are recommended ConnDOT procedures to replace or modify ASTM C 1074, Section 8.
1. Instead of preparing the usual 4 standard cured cylindrical specimens for acceptance testing, prepare 7 specimens with a maturity probe installed in the center of one of them.
2. Standard cure the specimens in accordance with ASTM C 31, or as close to the procedures in ASTM C 31 as possible, being sure to protect the specimens from adverse weather conditions.
102
3. Perform one compression test at ages of 1, 3, 7 and 14 days, and perform two tests at 28 days, all in accordance with ASTM C 39. Note: do not break the instrumented specimen.
4. At each test age, record the average maturity index for the instrumented specimen.
5. Using the maturity kit’s software, develop a best-fit strength-maturity curve, which will be the strength-maturity relationship to be used for estimating in-place structural strengths.
Note that this procedure only requires that 3 additional specimens be made, because they also serve as acceptance specimens. For that reason, the procedure is not nearly as labor intensive as ASTM C 1074, Section 8, which requires that 17 specimens be prepared solely for the purpose of developing a strength-maturity relationship.Not only are the specimens used solely for this purpose, the batch is prepared exclusively for the same reason, so it is much more cumbersome. Accordingly, everyday use of the maturity method for estimating concrete strength is not recommended because it is too cumbersome to repeatedly develop strength-maturity relationships for ConnDOT concrete mixtures.
Quality Assurance Program As discussed in the PCC Field Testing section of this report, field test results are not typically known until a concrete truck’s contents have been placed. It would be helpful to know what the concrete slump, temperature and air content are prior to placement. The procedures used for sampling concrete, the timing for performing tests and then placing concrete need to be revised. These procedures should strive to increase the validity of test results, thereby improving the quality of concrete delivered to ConnDOT projects. At this time, DMT either recommends acceptance or rejection of concrete based primarily upon 28-day compressive strength test results. DMT personnel also have discretion to reject concrete on the basis of field test results, such as air content; however, it is the field inspector’s responsibility to turn away concrete trucks having off-spec concrete. Therefore, once the concrete is placed, the sole remaining basis for acceptance usually is meeting minimum compressive strength requirements. The 28-day compressive strength is determined by averaging two or three cylinder breaks, so the quality
103
measure currently used is averaging. A better quality measure might be to use percent within limits (PWL) for a project’s entire day’s production, which ties payment to a statistically valid measure of quality. A composite quality measure, including both strength and air content, could be used to provide incentives to contractors for producing quality concrete, while it provides disincentives for producing substandard concrete. Finally, ConnDOT’s quality measure for PCC is based on characteristics, such as air content, slump and compressive strength. These quality characteristics should be used in conjunction with a Quality Assurance Program (QAP), such as that described in NETTCP’s Concrete Technician Certification Manual (10). The elements of the QAP should include contractor or producer QC, agency acceptance and independent assurance. A Quality Assurance Program that includes both ConnDOT and industry responsibilities is recommended.
Alternative Curing of Standard Cured Specimens It is recommended that temporary storage boxes be purchased or constructed for instances when curing boxes are not available for overnight storage of test specimens.Appendix C provides plans for a 2’ x 2’ box constructed out of ¾” plywood (also see photo, Figure C-1). During hot weather, cylinders should also be covered with wet burlap with white plastic backing, which can be placed on top of the box in lieu of the ¾” plywood cover. The boxes should be located on level ground to within ¼-in. per ft along a horizontal plane. After at least 8 hours after final set (setting time may be measured by Test Method C 403), transport the specimens to the project’s curing box and strip them of their molds. Note: this 8 hour time requirement is usually met the next morning the day after the pour. The specimens should be stripped no more than 30 minutes prior to placing them in the projects curing box. The Concrete Taskforce recommended that ConnDOT Standard Specifications Form 816, Section 6.12 titled “Concrete Cylinder Curing Box” be amended to require contractors to submit a catalog cut listing detailed specifications of curing boxes and their operating instructions. A key recommendation was for curing boxes to include a heating and cooling device to maintain required temperatures. This recommendation was written into the July 2005 Supplemental Specification.
104
ASTM C 31 requires that specimens be transported for final curing within 52 hours after making them, including a maximum of 4 hours in transit. Considering that ConnDOT projects are located throughout the state and specimens must be brought to the Central Lab for final curing, it is often not practical to meet this criterion. Therefore, it is recommended that it be acceptable to take additional time to transport the specimens to the Central Lab when necessary, but it is not encouraged and should be avoided, if possible. Once the specimens are placed in the Central Lab’s moist room, standard curing procedures in accordance with ASTM C 31 are achievable and should resume.
105
REFERENCES
1. Building Code Requirements for Structural Concrete (ACI 318-02) and Commentary (ACI 318R-02), American Concrete Institute, Farmington Hills, 2003.
2. www.nettcp.com
3. www.concrete.org/certification
4. www.intellirock.com
5. www.tfhrc.gov/focus/oct02/01.htm
6. Tepke, D. and P.J. Tikalsky. Concrete Maturity Progress Survey of Departments of Transportation. In Transportation Research Record: Journal of the Transportation Research Board, No. 1775, TRB, National Research Council, Washington D.C., 2001, pp 125-131.
7. Tepke, D.G., P.J. Tikalsky and B.E. Scheetz. Concrete Maturity Field Studies for Highway Applications. In Transportation Research Record: Journal of the Transportation Research Board, No. 1893, TRB, National Research Council, Washington D.C., 2004, pp 26-36.
8. Kosmatka, S.H., B. Kerkhoff, and W.C. Panarese. Designand Control of Concrete Mixtures 14th Edition,Engineering Bulletin 001, Portland Cement Association, Skokie, Illinois, 2002.
9. K. Hover. Structure Magazine, July 2005, Understanding Hot Weather Concrete.
10. New England Transportation Technician Certification Program, Concrete Technician Certification Manual,Copyright NETTCP January 2005.

106
APPENDIX A
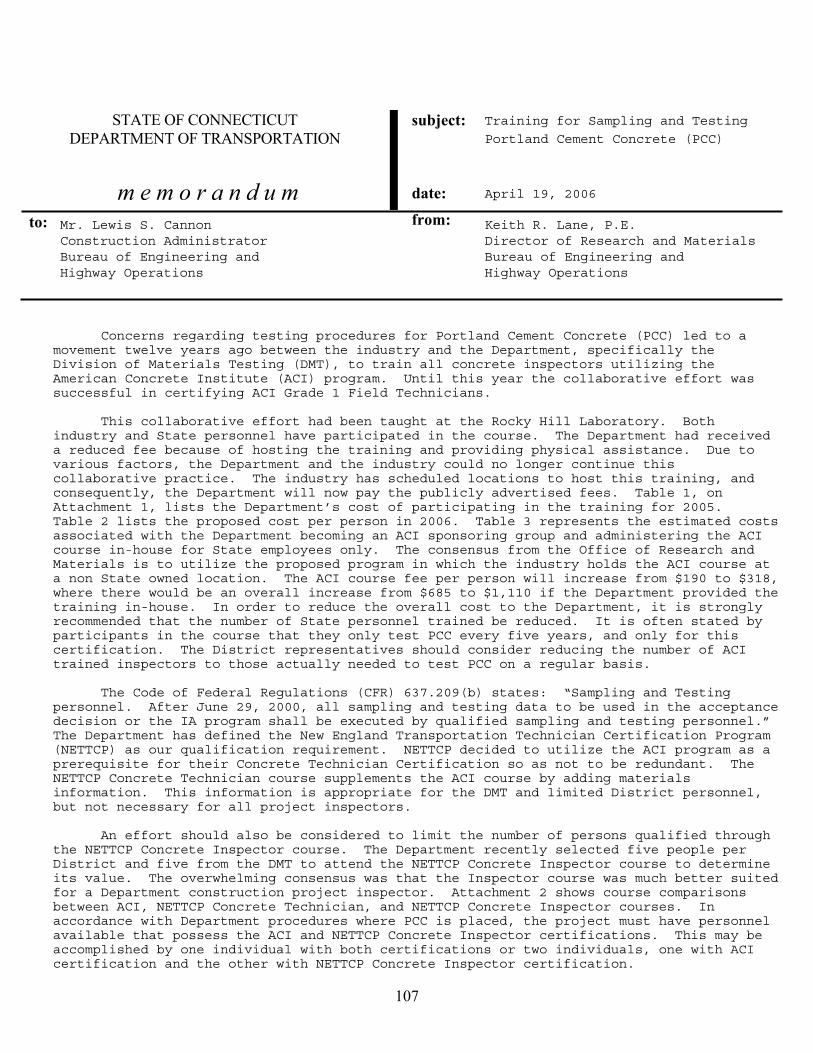
107
STATE OF CONNECTICUTDEPARTMENT OF TRANSPORTATION
subject: Training for Sampling and TestingPortland Cement Concrete (PCC)
m e m o r a n d u m date: April 19, 2006
to: Mr. Lewis S. Cannon from: Keith R. Lane, P.E. Construction Administrator Director of Research and Materials Bureau of Engineering and Bureau of Engineering and Highway Operations Highway Operations
Concerns regarding testing procedures for Portland Cement Concrete (PCC) led to a movement twelve years ago between the industry and the Department, specifically the Division of Materials Testing (DMT), to train all concrete inspectors utilizing the American Concrete Institute (ACI) program. Until this year the collaborative effort was successful in certifying ACI Grade 1 Field Technicians.
This collaborative effort had been taught at the Rocky Hill Laboratory. Both industry and State personnel have participated in the course. The Department had received a reduced fee because of hosting the training and providing physical assistance. Due to various factors, the Department and the industry could no longer continue this collaborative practice. The industry has scheduled locations to host this training, and consequently, the Department will now pay the publicly advertised fees. Table 1, on Attachment 1, lists the Department’s cost of participating in the training for 2005.Table 2 lists the proposed cost per person in 2006. Table 3 represents the estimated costs associated with the Department becoming an ACI sponsoring group and administering the ACI course in-house for State employees only. The consensus from the Office of Research and Materials is to utilize the proposed program in which the industry holds the ACI course at a non State owned location. The ACI course fee per person will increase from $190 to $318, where there would be an overall increase from $685 to $1,110 if the Department provided the training in-house. In order to reduce the overall cost to the Department, it is strongly recommended that the number of State personnel trained be reduced. It is often stated by participants in the course that they only test PCC every five years, and only for this certification. The District representatives should consider reducing the number of ACI trained inspectors to those actually needed to test PCC on a regular basis.
The Code of Federal Regulations (CFR) 637.209(b) states: “Sampling and Testing personnel. After June 29, 2000, all sampling and testing data to be used in the acceptance decision or the IA program shall be executed by qualified sampling and testing personnel.”The Department has defined the New England Transportation Technician Certification Program (NETTCP) as our qualification requirement. NETTCP decided to utilize the ACI program as a prerequisite for their Concrete Technician Certification so as not to be redundant. The NETTCP Concrete Technician course supplements the ACI course by adding materials information. This information is appropriate for the DMT and limited District personnel, but not necessary for all project inspectors.
An effort should also be considered to limit the number of persons qualified through the NETTCP Concrete Inspector course. The Department recently selected five people per District and five from the DMT to attend the NETTCP Concrete Inspector course to determine its value. The overwhelming consensus was that the Inspector course was much better suited for a Department construction project inspector. Attachment 2 shows course comparisons between ACI, NETTCP Concrete Technician, and NETTCP Concrete Inspector courses. In accordance with Department procedures where PCC is placed, the project must have personnel available that possess the ACI and NETTCP Concrete Inspector certifications. This may be accomplished by one individual with both certifications or two individuals, one with ACI certification and the other with NETTCP Concrete Inspector certification.
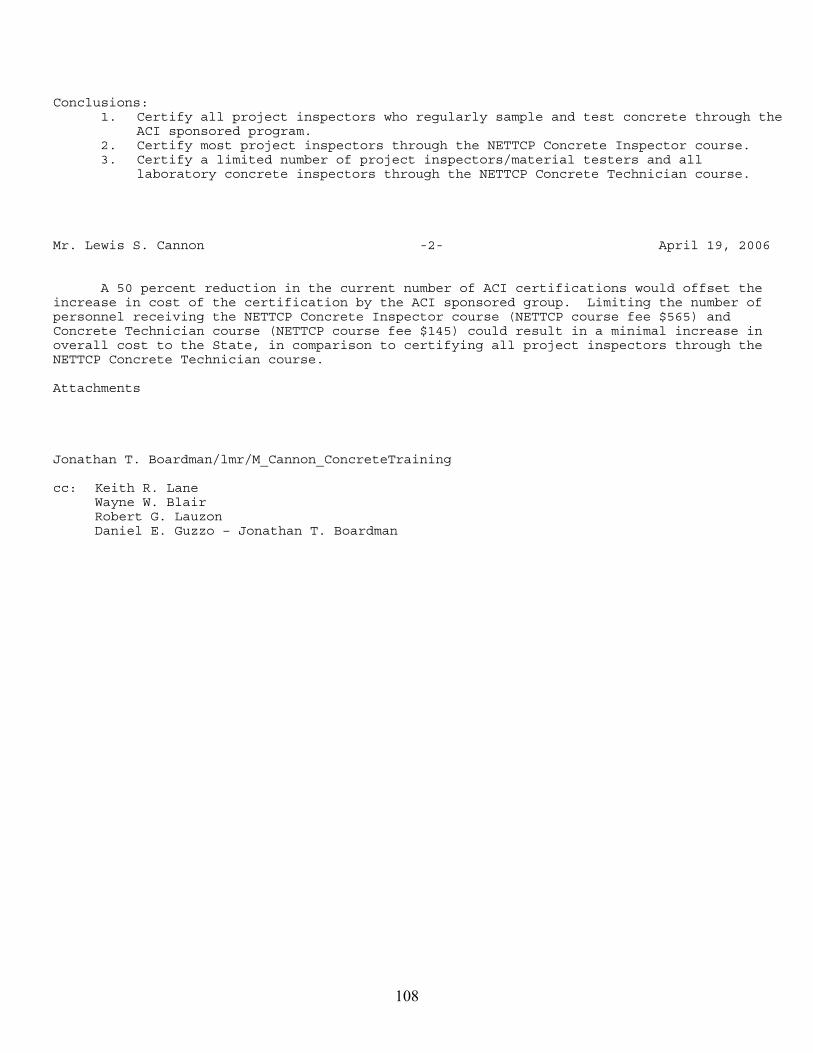
108
Conclusions:1. Certify all project inspectors who regularly sample and test concrete through the
ACI sponsored program. 2. Certify most project inspectors through the NETTCP Concrete Inspector course. 3. Certify a limited number of project inspectors/material testers and all
laboratory concrete inspectors through the NETTCP Concrete Technician course.
Mr. Lewis S. Cannon -2- April 19, 2006
A 50 percent reduction in the current number of ACI certifications would offset the increase in cost of the certification by the ACI sponsored group. Limiting the number of personnel receiving the NETTCP Concrete Inspector course (NETTCP course fee $565) and Concrete Technician course (NETTCP course fee $145) could result in a minimal increase in overall cost to the State, in comparison to certifying all project inspectors through the NETTCP Concrete Technician course.
Attachments
Jonathan T. Boardman/lmr/M_Cannon_ConcreteTraining
cc: Keith R. Lane Wayne W. Blair Robert G. Lauzon Daniel E. Guzzo – Jonathan T. Boardman
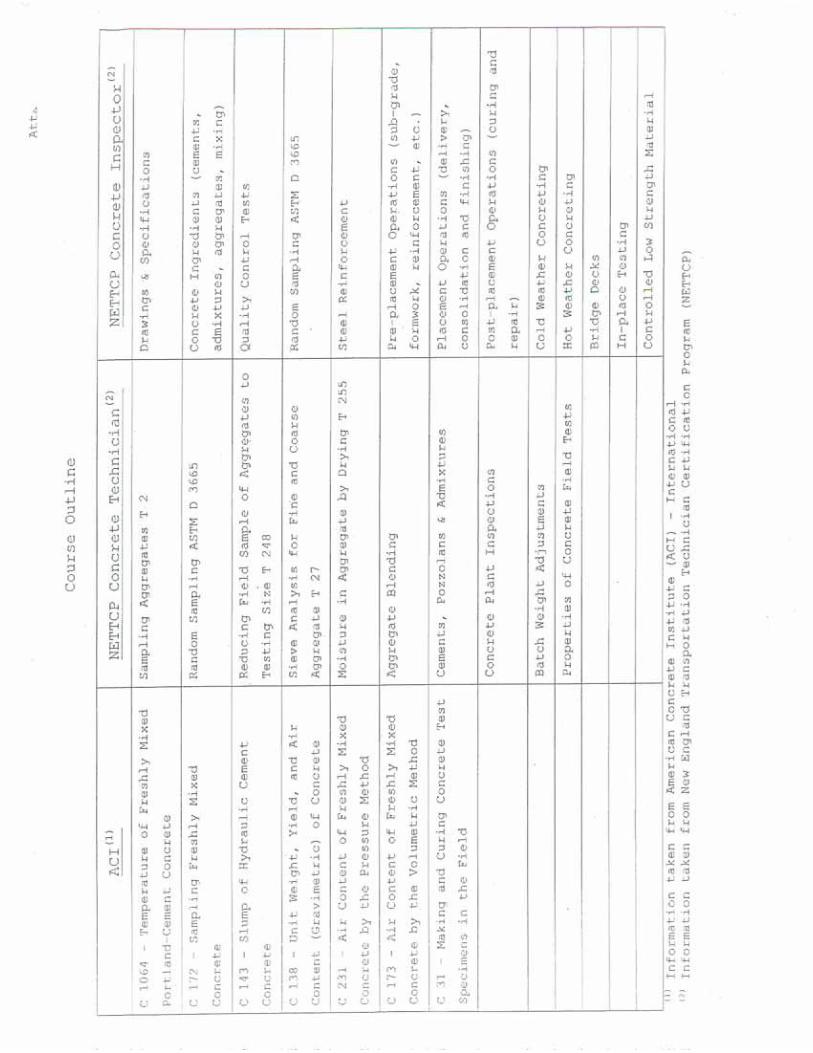
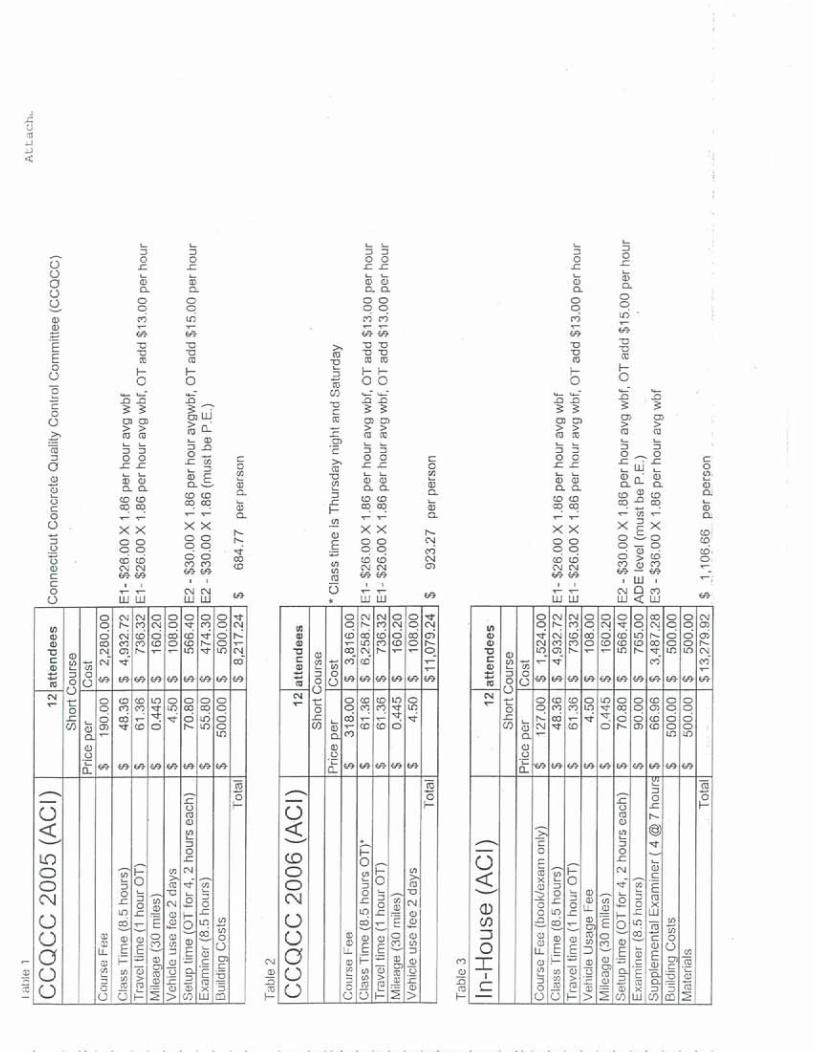
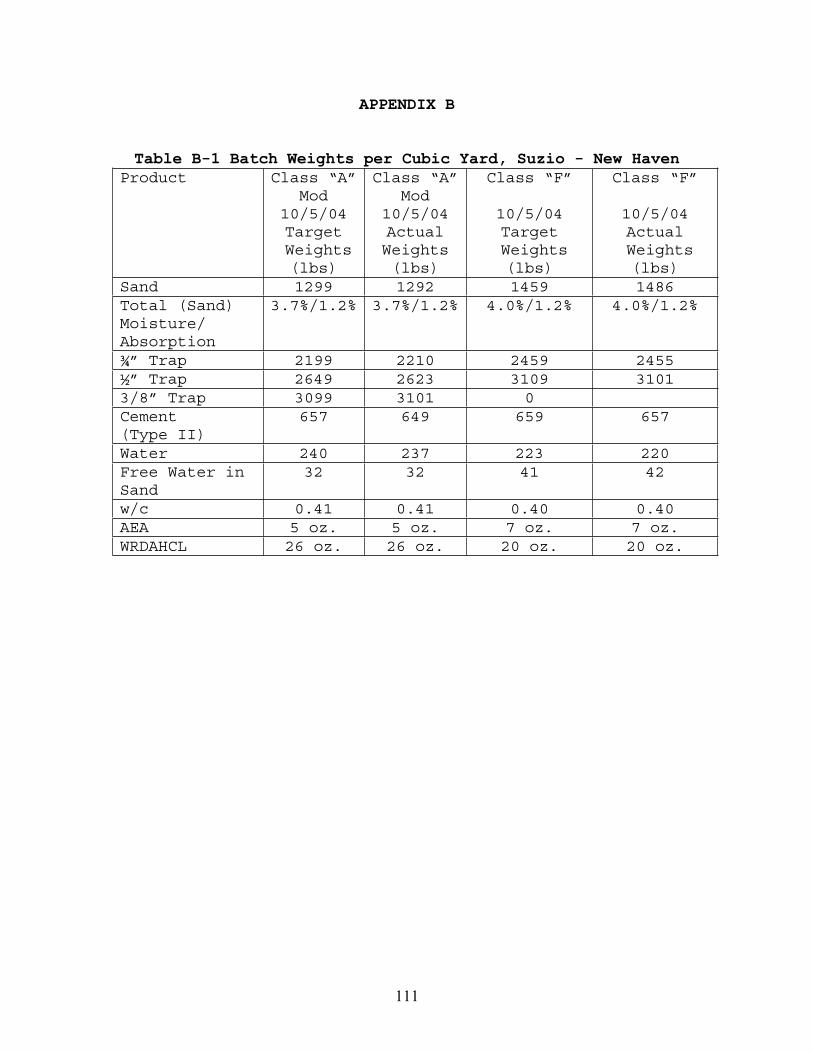
111
APPENDIX B
Table B-1 Batch Weights per Cubic Yard, Suzio - New Haven Product Class “A”
Mod10/5/04Target
Weights (lbs)
Class “A”Mod
10/5/04ActualWeights(lbs)
Class “F”
10/5/04Target
Weights (lbs)
Class “F”
10/5/04Actual
Weights (lbs)
Sand 1299 1292 1459 1486 Total (Sand) Moisture/Absorption
3.7%/1.2% 3.7%/1.2% 4.0%/1.2% 4.0%/1.2%
¾” Trap 2199 2210 2459 2455 ½” Trap 2649 2623 3109 3101 3/8” Trap 3099 3101 0 Cement(Type II)
657 649 659 657
Water 240 237 223 220 Free Water in Sand
32 32 41 42
w/c 0.41 0.41 0.40 0.40 AEA 5 oz. 5 oz. 7 oz. 7 oz. WRDAHCL 26 oz. 26 oz. 20 oz. 20 oz.
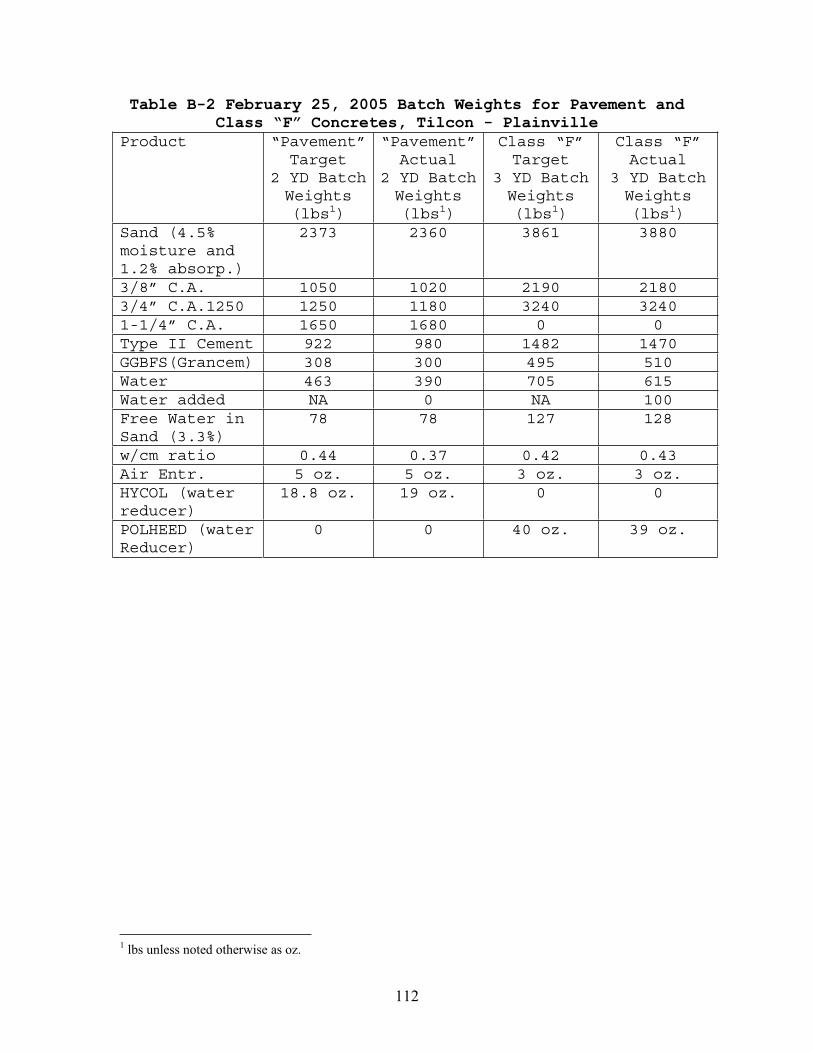
112
Table B-2 February 25, 2005 Batch Weights for Pavement and Class “F” Concretes, Tilcon - Plainville
Product “Pavement”Target
2 YD Batch Weights(lbs1)
“Pavement”Actual
2 YD Batch Weights(lbs1)
Class “F” Target
3 YD Batch Weights(lbs1)
Class “F” Actual
3 YD Batch Weights(lbs1)
Sand (4.5% moisture and 1.2% absorp.)
2373 2360 3861 3880
3/8” C.A. 1050 1020 2190 2180 3/4” C.A.1250 1250 1180 3240 3240 1-1/4” C.A. 1650 1680 0 0 Type II Cement 922 980 1482 1470 GGBFS(Grancem) 308 300 495 510 Water 463 390 705 615 Water added NA 0 NA 100 Free Water in Sand (3.3%)
78 78 127 128
w/cm ratio 0.44 0.37 0.42 0.43 Air Entr. 5 oz. 5 oz. 3 oz. 3 oz. HYCOL (water reducer)
18.8 oz. 19 oz. 0 0
POLHEED (water Reducer)
0 0 40 oz. 39 oz.
1 lbs unless noted otherwise as oz.
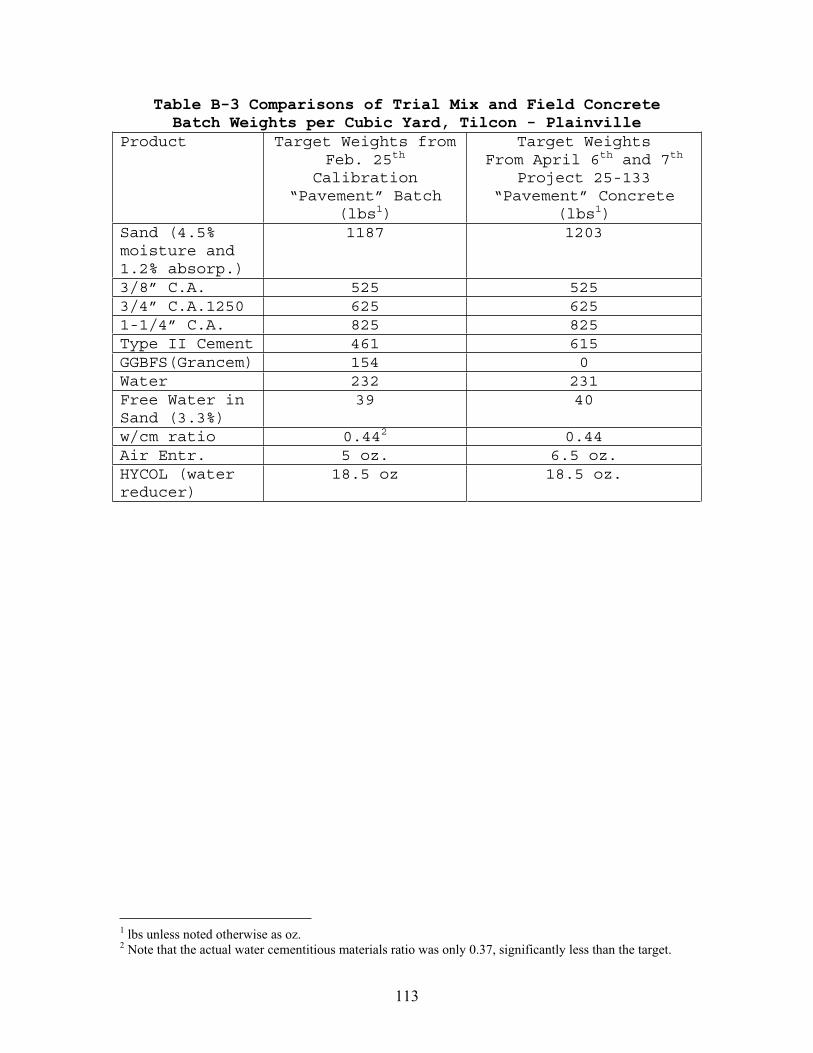
113
Table B-3 Comparisons of Trial Mix and Field Concrete Batch Weights per Cubic Yard, Tilcon - Plainville
Product Target Weights from Feb. 25th
Calibration“Pavement” Batch
(lbs1)
Target Weights From April 6th and 7th
Project 25-133 “Pavement” Concrete
(lbs1)Sand (4.5% moisture and 1.2% absorp.)
1187 1203
3/8” C.A. 525 525 3/4” C.A.1250 625 625 1-1/4” C.A. 825 825 Type II Cement 461 615 GGBFS(Grancem) 154 0 Water 232 231 Free Water in Sand (3.3%)
39 40
w/cm ratio 0.442 0.44 Air Entr. 5 oz. 6.5 oz. HYCOL (water reducer)
18.5 oz 18.5 oz.
1 lbs unless noted otherwise as oz. 2 Note that the actual water cementitious materials ratio was only 0.37, significantly less than the target.
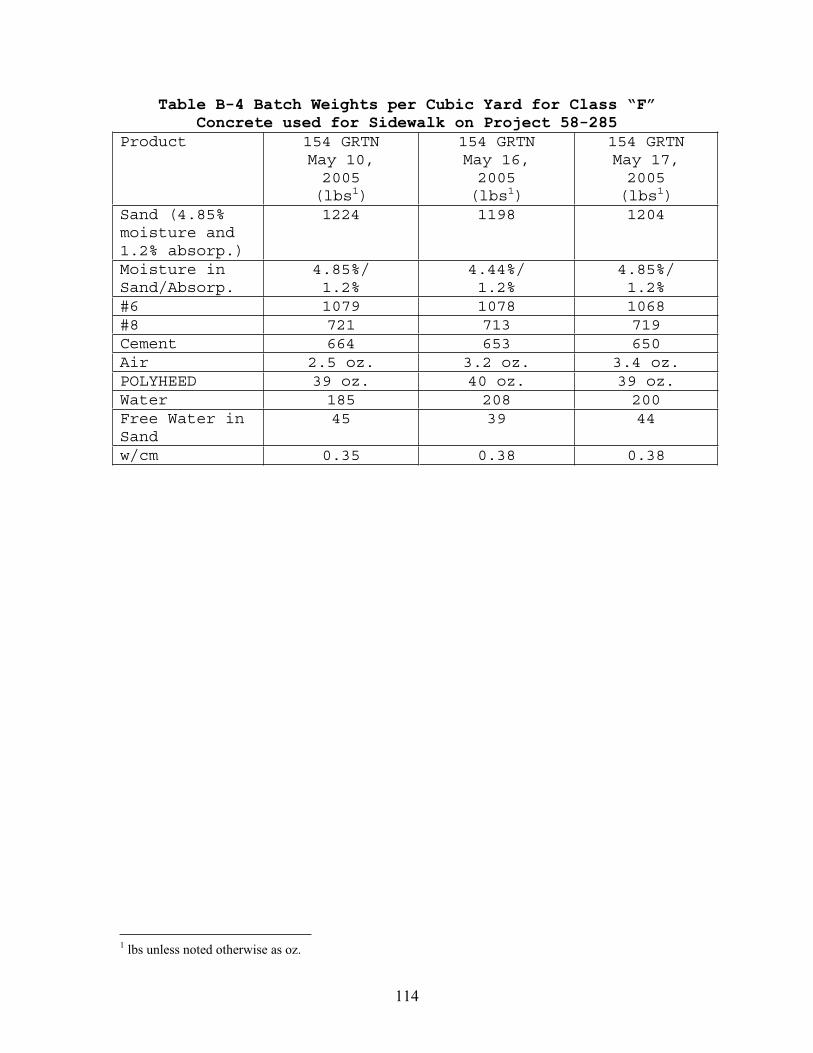
114
Table B-4 Batch Weights per Cubic Yard for Class “F” Concrete used for Sidewalk on Project 58-285
Product 154 GRTN May 10,2005(lbs1)
154 GRTN May 16, 2005(lbs1)
154 GRTN May 17,2005(lbs1)
Sand (4.85% moisture and 1.2% absorp.)
1224 1198 1204
Moisture in Sand/Absorp.
4.85%/1.2%
4.44%/1.2%
4.85%/1.2%
#6 1079 1078 1068 #8 721 713 719 Cement 664 653 650 Air 2.5 oz. 3.2 oz. 3.4 oz. POLYHEED 39 oz. 40 oz. 39 oz. Water 185 208 200 Free Water in Sand
45 39 44
w/cm 0.35 0.38 0.38
1 lbs unless noted otherwise as oz.
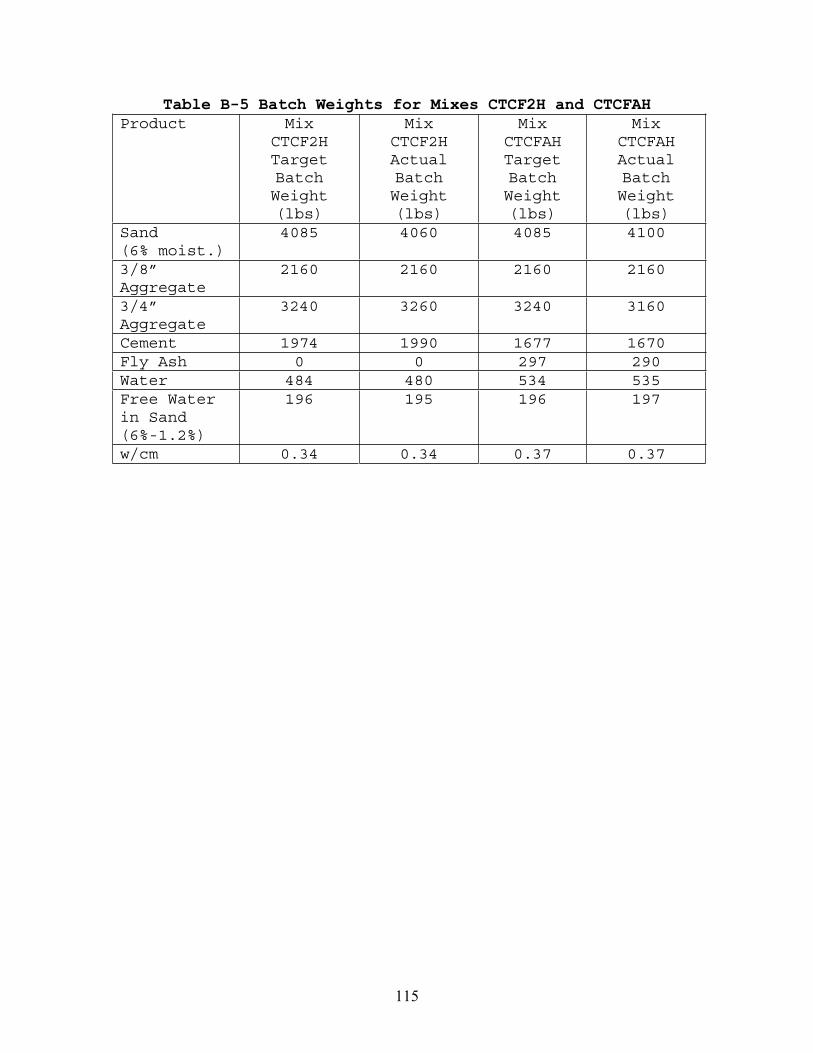
115
Table B-5 Batch Weights for Mixes CTCF2H and CTCFAH Product Mix
CTCF2H Target
BatchWeight(lbs)
MixCTCF2HActualBatchWeight(lbs)
MixCTCFAHTargetBatchWeight(lbs)
MixCTCFAHActualBatchWeight(lbs)
Sand(6% moist.)
4085 4060 4085 4100
3/8”Aggregate
2160 2160 2160 2160
3/4”Aggregate
3240 3260 3240 3160
Cement 1974 1990 1677 1670 Fly Ash 0 0 297 290 Water 484 480 534 535 Free Water in Sand (6%-1.2%)
196 195 196 197
w/cm 0.34 0.34 0.37 0.37

116
APPENDIX C
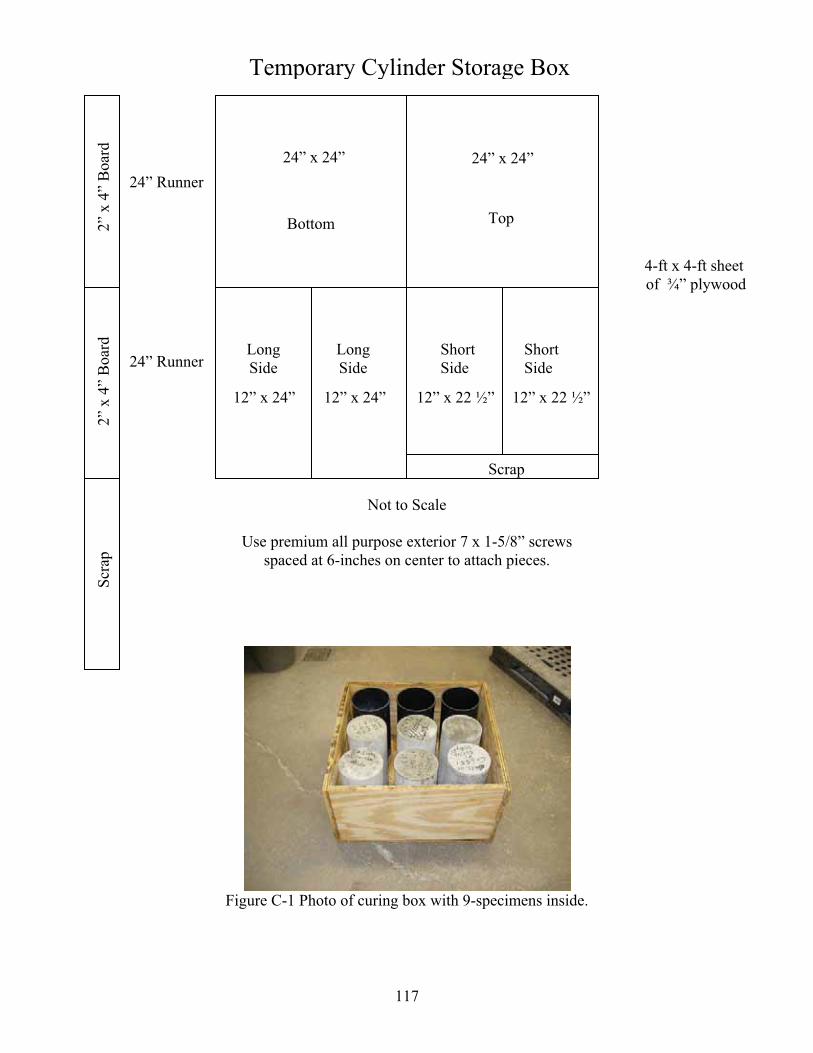
117
Figure C-1 Photo of curing box with 9-specimens inside.
Scrap
24” Runner
24” Runner
24”
Runner
24” x 24” 24” x 24”
Bottom Top
Temporary Cylinder Storage Box
LongSide
LongSide
ShortSide
ShortSide
12” x 22 ½” 12” x 22 ½”
Scra
p
4-ft x 4-ft sheet of ¾” plywood
Not to Scale
Use premium all purpose exterior 7 x 1-5/8” screws spaced at 6-inches on center to attach pieces.
12” x 24” 12” x 24”
2” x
4”
Boa
rd
2” x
4”
Boa
rd