assemblage time series reveal biodiversity change but not ... · 1 title: assemblage time series...
TRANSCRIPT

Loughborough UniversityInstitutional Repository
Assemblage time seriesreveal biodiversity changebut not systematic loss
This item was submitted to Loughborough University's Institutional Repositoryby the/an author.
Citation: DORNELAS, M., ... et al, 2014. Assemblage time series revealbiodiversity change but not systematic loss. Science, 344 (6181), pp. 296 - 299.
Additional Information:
• This is the author's version of the work. It is posted here by permissionof the AAAS for personal use, not for redistribution. The definitive ver-sion was published in Science, 344 (6181), pp. 296 - 299 on 18th April2014, doi: 10.1126/science.1248484. The definitive version is available at:http://dx.doi.org/10.1126/science.1248484.
Metadata Record: https://dspace.lboro.ac.uk/2134/21000
Version: Accepted for publication
Publisher: American Association for the Advancement of Science / c© TheAuthors
Please cite the published version.

1
Title: Assemblage time series reveal biodiversity change but not systematic
loss
Authors: Maria Dornelas1*
, Nicholas J. Gotelli2, Brian McGill
3, Hideyasu Shimadzu
1,4, Faye
Moyes1, Caya Sievers
1, Anne E. Magurran
1
Affiliations:
1. Centre for Biological Diversity and Scottish Oceans Institute, School of Biology, University of St Andrews, St Andrews, Fife, KY16
9TH, UK.
2. Department of Biology, University of Vermont, Burlington, Vermont 05405 USA.
3. School of Biology and Ecology, Sustainability Solutions Initiative, University of Maine, Orono ME 04469, USA.
4. Department of Mathematics, Keio University, 3-14-1 Hiyoshi Kohoku, Yokohama 223-8522, Japan.
*Correspondence to: [email protected]
Abstract: The extent to which biodiversity change in local assemblages contributes to global
biodiversity loss is poorly understood. Here, we analyse 100 time-series from biomes across the
Earth to ask how diversity within assemblages is changing through time. We quantified patterns
of temporal α diversity, measured as change in local diversity, and temporal β diversity,
measured as change in community composition. Contrary to our expectations, we do not detect
systematic loss of α diversity. However, community composition changed systematically through
time, in excess of predictions from null models. Heterogeneous rates of environmental change,
species range shifts associated with climate change, and biotic homogenization may explain the
different patterns of temporal α and β diversity. Monitoring and understanding change in species
composition should be a conservation priority.
One Sentence Summary: Time series reveal widespread change in the composition of
ecological assemblages rather than systematic biodiversity loss.
Main Text: Habitat destruction, pollution, and over-harvesting, as well as climate change and
invasive species, have led to conspicuous reductions in biological diversity (1). Globally,
increasing numbers of species are under threat (2), populations of vulnerable taxa are declining
(3), and ecosystem function is changing as a result (4). Although these large-scale patterns
emerge from processes that are based on local community structure, as yet there is no
comprehensive analysis of how temporal change in ecological assemblages contributes to this
global picture. Because the implementation of conservation and management decisions is
typically at the scale of local to regional ecosystems (5, 6), knowledge of biodiversity change
within assemblages is essential to inform policy. A comparative analysis of change across taxa,
biomes, and geographic regions also provides insights into the mechanisms involved. Here, we
use a definition of biodiversity that includes components of species richness, composition, and

2
relative abundance of species. We use standardized biodiversity monitoring of assemblages over
years and decades to assess global patterns of temporal change in species diversity.
We quantified change in biodiversity through time by two measures: temporal trends in α
diversity and temporal β diversity (7). Temporal α diversity is a measure of diversity within a
sample. It can be measured as species richness or with related diversity metrics that take species
abundances into account. To measure temporal change in α diversity, we calculated, for each
time series, the slope of the long-term relationship between diversity and time. Typically, β
diversity is used to compare the composition of different communities in space, but it can also be
used to compare the composition of a single community through time. Temporal β diversity
(temporal turnover) quantifies differences in species composition between two (or more) samples
separated in time. Temporal turnover can be measured with metrics of similarity to track changes
in species identities (and sometimes their abundances) through time, either by comparing
adjacent sampling periods, or with reference to a single baseline sample or time period. Because
turnover metrics incorporate shifts in species composition, they potentially provide a more
sensitive indicator of community change (8) than α diversity.
Given widespread evidence of habitat change (9), abnormally high extinction rates (10), and
documented declines of many species (2, 3), we predicted that most assemblages would exhibit a
decrease in α diversity through time, although the pattern and extent of change may differ among
taxonomic groups, climatic regions, and marine or terrestrial realms and with spatial scale (11).
For example, there is no evidence of consistent loss of biodiversity among terrestrial plants (12).
Similarly, as a consequence of long-term changes in species composition, we expected increases
in temporal β diversity measured relative to an early baseline sample.
To quantify biodiversity change, we gathered all datasets we could find that met a priori quality
criteria (details in (13)) for standardized, long-term quantitative sampling. This collection
includes over 6.1 million species occurrence records from 100 individual time series. There are
35,613 species represented, encompassing mammals, birds, fish, invertebrates, and plants. The
geographical distribution of study locations is global, and includes marine, freshwater and
terrestrial biomes, extending from the polar regions to the tropics in both hemispheres (Figure 1).
The collective time interval represented by these data is from 1874 to the present, although most
data series are concentrated in the past 40 years (Figure 2). A full description of the datasets used
in the analysis, including their sources and citation information, is included as table S1. We
measure temporal α diversity with 10 metrics including species richness, and temporal β
diversity with four metrics including the Jaccard similarity index. A strength of our analysis is
that we calculate all metrics from the original data, rather than relying on published summary
statistics, and thus are able to standardize sampling effort within each time series. Details of
statistical standardization of data sets, choice of α diversity metrics, and null distributions for β
diversity metrics based on Markov Chain Monte Carlo (MCMC) methods and neutral model
analyses are described in 13.
Surprisingly, we do not detect a consistent negative trend in species richness (Figure 2A), or in
any of the other metrics of α diversity (Figure S1). The overall slope (estimated by allowing each
study to have a different intercept, but constraining all studies to have the same slope) is
statistically indistinguishable from zero (Figure 2). However, not all datasets have constant
species richness. In a mixed model in which both the slope and the intercept are allowed to vary
for each time series, slopes for species richness differ among assemblages, but do not exhibit
systematic deviations. The variation cancels out because there are approximately equal numbers

3
of negative and positive slopes (41 and 59 respectively), and the distribution of slopes is centered
around zero, with the majority of slopes being statistically very close to zero (65 out of 100 time
series Figure 3 A). This pattern is also observed for short-term changes rather than long-term
linear trends: out of 1557 measurements of species richness in two consecutive times, 629 (40%)
increase, 624 (40%) decrease, and 304 (20%) do not change (Figure S2). Collectively, these
analyses reveal local variation in temporal α diversity, but no evidence for a consistent or even
an average negative trend.
The variability in slopes of α diversity could be explained by spatial, temporal, and biological
attributes of each of the time series. However, for all measures of α diversity, slope is not a
significant function of total species richness, extent of the spatial distribution of samples, starting
date, or duration of the time series (Figures S3 and S4). Average slopes estimated for the marine
and terrestrial time series are not significantly different from zero (Figure S5). Time series for
terrestrial plants exhibit, on average, a positive slope for species richness, in contrast to (12),
who found no consistent change. There are no significant patterns for other taxonomic groups.
An analysis of slopes by climatic regions reveals that temperate time series have a significantly
positive trend, and time series sampled at a global scale show a significantly negative trend
(Figure S5). Tropical time-series also have a negative slope, but it is not significantly different
from zero.
In contrast to species richness and other measures of α diversity, species temporal turnover as
measured by the Jaccard similarity index and other measures of β diversity (Figure S6) exhibit
consistent long-term changes (Figure 2 B and 3 B). Specifically, community similarity measured
as Jaccard’s index between an ensuing year and the first year of sampling (the time-series
baseline) decreases in 79 out of 100 the time series with a slope of -0.01 on average. Because
Jaccard’s similarity is bounded between 0 and 1, a 0.01 slope means change in community
composition per decade of 10% of the species (Figure 2 B). This result is robust if the last census
point is used as the baseline (Figure S7). A model with constant overall slope and different
intercept for each time series (and with the time axis re-scaled relative to each time series
baseline) is also negative. Turnover slopes are, therefore, almost uniformly negative, which is
indicative of systematic change in community composition since the initial census point.
Even in a stochastic time series, some degree of turnover is to be expected because of temporal
autocorrelation. However, the patterns of turnover in these time series are more pronounced and
negative than what would be expected from simple temporal autocorrelation. Specifically,
MCMC simulations of species-specific extinction and colonization produce slopes in turnover of
-0.000013 on average, with confidence intervals straddling zero, and an approximately 50-50
distribution of positive and negative slopes (13 and Figure S8). Similarly, neutral model
simulations incorporating species abundance show change in similarity two orders of magnitude
lower than we observe (13 and Figure S9). The decrease in community similarity observed in our
analysis is therefore not a simple consequence of drift and autocorrelation caused by a
colonization-extinction Markov model or by a model of neutral dynamics.
These time series collectively exhibit no systematic change in temporal α diversity, although
temperate assemblages show, on average, a positive trend in α diversity, whereas at the global
scale we detect a negative trend. Moreover, across all climatic regions, realms, and taxonomic
groups, temporal β diversity is increasing relative to the baseline (initial) sample. There are
several reasons why α diversity may remain constant while temporal β diversity is consistently
increasing.

4
One potential driver is that intensification of trade and transport, combined with the rapid
increase in invasions of exotic taxa, is leading to the homogenization of species composition at
local scales (14). Although homogenization may lead to a global loss of species, α diversity at
local scales may stay constant or even increase as invaders replace residents and β diversity
changes through time (11). This was the mechanism that Elton highlighted when he first voiced
concerns about global biodiversity loss (15). Additional forces that might contribute to these
contrasting patterns of α and β diversity include poleward shifts in geographic ranges as species
respond to climate change (16). Moreover, contemporary habitat destruction and species loss is
higher in tropical versus temperate regions (9), which is consistent with assessments of change in
temporal α diversity in terrestrial plants (12) and population trends of vertebrates (17).
Our results suggest that local and regional assemblages are experiencing a substitution of their
taxa, rather than systematic loss. This outcome may in part reflect the fact that most of the
available data are from the last 40 years, which highlights concerns over the problem of a
“shifting baseline” in diversity monitoring (18). Nevertheless, we show that at these temporal
and spatial scales there is no evidence of consistent or accelerating loss of α diversity. Most
importantly, changes in species composition usually do not result in a substitution of like with
like, and can lead to the development of novel ecosystems (19). For example, disturbed coral
reefs can be replaced by assemblages dominated by macroalgae (20) or different coral species
(21); these novel marine assemblages may not necessarily deliver the same ecosystem services
such as fisheries, tourism and coastal protection that were provided by the original coral reef
(22).
Our core result— that assemblages are undergoing biodiversity change, but not
systematic biodiversity loss (Figures 2 and 3)— does not negate previous findings that many taxa
are at risk, or that key habitats and ecosystems are under grave threat. Neither is it inconsistent
with an unfolding mass extinction, which occurs at a global scale, and over a much longer
temporal scale. The changing composition of communities that we document may be driven by
many factors, including ongoing climate change and the expanding distributions of invasive and
anthrophilic species. The absence of systematic change in temporal α diversity we report here is
not a cause for complacency, but rather highlights the need to address changes in assemblage
composition, which have been widespread over at least the past 40 years. Robust analyses that
acknowledge the complexity and heterogeneity of outcomes at different locations and scales
provide the strongest case for policy action. There is need to expand the focus of research and
planning from biodiversity loss to biodiversity change.

5
References and Notes:
1. Millennium Ecosystem Assessment, “Millennium Ecosystem Assessment Synthesis Reports.” (2006)
(Available at http://www.millenniumassessment.org/documents/document.356.aspx.pdf).
2. S. H. M. Butchart et al., Using Red List Indices to measure progress towards the 2010 target and beyond.
Philosophical Transactions of the Royal Society B-Biological Sciences 360, 255 (2005).
3. J. Loh et al., The Living Planet Index: using species population time series to track trends in biodiversity.
Philosophical Transactions B 360, 289 (2005).
4. B. J. Cardinale et al., Biodiversity loss and its impact on humanity. Nature 486, 59 (2012).
5. B. F. Erasmus, S. Freitag, K. J. Gaston, B. H. Erasmus, A. S. van Jaarsveld, Scale and conservation
planning in the real world. Proceedings of the Royal Society of London. Series B: Biological Sciences 266,
315 (1999).
6. S. Ferrier et al., Mapping more of terrestrial biodiversity for global conservation assessment. BioScience
54, 1101 (2004).
7. R. H. Whittaker, Vegetation of the Siskiyou Mountains, Oregon and California. Ecological Monographs 30,
279 (1960).
8. A. E. Magurran, P. A. Henderson, Temporal turnover and the maintenance of diversity in ecological
assemblages. Philosophical Transactions of the Royal Society B-Biological Sciences 365, 1558 (2010).
9. E. C. Ellis et al., Used planet: A global history. Proceedings of the National Academy of Sciences 110,
7978 (2013).
10. A. D. Barnosky et al., Has the Earth's sixth mass extinction already arrived? Nature 471, 51 (2011).
11. D. F. Sax, S. D. Gaines, Species diversity: from global decreases to local increases. Trends in Ecology &
Evolution 18, 561 (2003).
12. M. Vellend et al., Global meta-analysis reveals no net change in local-scale plant biodiversity over time.
Proceedings of the National Academy of Sciences 110, 48, (2013).
13. See Supplementary Material at Science Online.
14. F. J. Rahel, Homogenization of freshwater faunas. Annual Review of Ecology and Systematics, 33, 291
(2002).
15. C. S. Elton, The ecology of Invasion by Animals and Plants. (Chicago University Press, Chicago, IL,
1958).
16. C. Parmesan, Ecological and Evolutionary Responses to Recent Climate Change Annual Review of
Ecology Evolution and Systematics 37, 637. (2006)
17. B. Collen et al., Monitoring Change in Vertebrate Abundance: the Living Planet Index. Conservation
Biology 23, 317 (2009).
18. D. Pauly, Anecdotes and the shifting baseline syndrome of fisheries. Trends in Ecology & Evolution 10,
430 (1995).
19. R. J. Hobbs et al., Novel ecosystems: theoretical and management aspects of the new ecological world
order. Global Ecology and Biogeography 15, 1 (2006).
20. T. P. Hughes, Catastrophes, phase shifts, and large-scale degradation of a Caribbean Coral Reef. Science
265, 1547 (1994).
21. J. M. Pandolfi, S. R. Connolly, D. J. Marshall, A. L. Cohen, Projecting Coral Reef Futures Under Global
Warming and Ocean Acidification. Science 333, 418 (2011).
22. N. A. J. Graham, J. E. Cinner, A. V. Norström, M. Nyström, Coral reefs as novel ecosystems: embracing
new futures. Current Opinion in Environmental Sustainability 7, 9 (2014).

6
23. J. E. Fauth et al., Simplyfying the jargon of community ecology: a conceptual approach. American
Naturalist 147, 282 (1996).
24. B. J. McGill, in Biological Diversity: frontiers in measurement and assessment, A. E. Magurran, B. J.
McGill, Eds. (Oxford University Press, Oxford, 2011), pp. 105-122.
25. S. H. Hurlbert, The nonconcept of species diversity: a critique and alternative parameters. Ecology 52, 577
(1971).
26. M. O. Hill, Diversity and evenness: a unifying notation and its consequences. Ecology 54, 427 (1973).
27. A. Chao, Estimating the population size for capture-recapture data with unequal catchability. Biometrics,
43, 4 (1987).
28. J. Oksanen et al., http://CRAN.R-project.org/package=vegan, Ed. (2013).
29. Harvey, A. C. (1982), Spectral Analysis and Time Series, M. B. Priestly. Two volumes, 890 pages plus
preface, indexes, references and appendices, London: Academic Press, 1981
30. M. E. Gilpin, J. M. Diamond, Immigration and extinction probabilities for individual species: relation to
incidence functions and species colonization curves. Proceedings of the National Academy of Sciences 78,
392 (1981).
31. R. H. MacArthur, E. O. Wilson, The Theory of Island Biogeography. (Princeton University Press,
Princeton, 1967), pp. 203.
32. D. Simberloff, When is an island community in equilibrium? Science 220, 1275 (1983).
33. S. P. Hubbell, The Unified Neutral Theory of Biodiversity and Biogeography. Princeton University Press,
Princeton, 2001), pp. 375.
34. B. J. McGill, A test of the unified neutral theory of biodiversity. Nature 422, 881 (2003).
35. E. Woehler, "Seabirds of the Southern and South Indian Ocean - Australian Antarctic Data Centre".
(Available at http://www.iobis.org, accessed 2012).
36. P. N. Halpin, A. J. Read, E. Fujioka, B. D. Best, B. Donnelly, L. J. Hazen, C. Kot, K. Urian, E. LaBrecque,
A. Dimatteo, J. Cleary, C. Good, L. B. Crowder, K. D. Hyrenbach, OBIS-SEAMAP: The world data center
for marine mammal, sea bird, and sea turtle distributions. Oceanography 22, 2(2009).
37. R. G. B. Brown, D.N. Nettleship, P. Germain, C.E. Tull, T. Davis, Atlas of eastern Canadian seabirds.
Canadian Wildlife Service, Ottawa. (1975)
38. A. W. Diamond, A. J. Gaston, R. G. B. Brown, Converting PIROP counts of seabirds at sea to absolute
densities. Progress Notes. No. 164. 21 pp. (1986).
39. F. Huettmann, An ecological GIS research application for the northern Atlantic - The PIROP database
software, environmental data sets and the role of the internet/WWW. W.-F. Riekert and K. Tochtermann
(Eds.) Hypermedia im Umweltschutz Proceedings of Deutsche Gesellschaft für Informatik (GI) and
Forschungsinstitut für anwendungsorientierte Wissensverarbeitung (FAW) Ulm. Umwelt-Informatik
aktuell; Bd.17, Metropolis Verlag. 213-217 (1998).
40. "PIROP Northwest Atlantic 1965-1992 - OBIS SEAMAP". (Available at http://www.iobis.org, accessed
2012).
41. A. J. Read, P. N. Halpin, L. B. Crowder, B. D. Best, E. Fujioka (Editors) "OBIS-SEAMAP: mapping
marine mammals, birds and turtles" (2011). (Available at http://seamap.env.duke.edu, accessed 2012).
42. P. Pugh, "Discovery Collections Midwater Database". National Oceanography Centre, Southampton, UK
(2000). (Available at http://noc.ac.uk/data/discovery-collections/, accessed 2012).
43. J. W. Wacasey, E. G. Atkinson, L. Derick, I. Weinstein, "Zoobenthos data from the Southern Beaufort Sea,
1971-1975". (Available at http://www.iobis.org, accessed 2012).
44. J. W. Wacasey, E.G. Atkinson, L. Derick, I. Weinstein, "Zoobenthos data from the Southern Beaufort Sea,
1971-1975". Fisheries and Environment Canada. Fisheries and Marine Service Data report 41, Arctic

7
Biological Station fisheries and Marine Service Department of Fisheries and the Environment; Arctic
Ocean Diversity, University of Alaska Fairbanks, Fairbanks (1977).
45. D. A. Scott, T. S. English, "Arctic copepod Zooplankton Ice Island T3". (Available at
http://www.arcodiv.org/Database/Plankton_datasets, accessed 2012).
46. D. A. Scott, T. S. English, "Copepoda collected from Fletcher's Ice Island (T-3) in the Canadian Basin of
the Arctic Ocean". Technical Report No. 240, Reference M69-62, University of Washington and Arctic
Ocean Diversity, University of Alaska Fairbanks, Fairbanks.
47. C. G. Pautzke, "Arctic Copepods T3 & AIDJEX Ice Islands". (Available at
http://www.arcodiv.org/Database/Plankton_datasets, accessed 2012).
48. C. G. Pautzke, "Copepoda collected from the Canada Basin Arctic Ocean; Fletcher's Ice Island (T-3) 1970-
1972 and AIDJEX, 1975". Phytoplankton Primary Production Below Arctic Ocean Pack Ice: An
Ecosystems Analysis. PhD Thesis University of Washington; Arctic Ocean Diversity, University of Alaska
Fairbanks, Fairbanks.
49. G. E. Hopky, M. J. Lawrence, D. B. Chiperzak, "Beaufort Sea NOGAP1 Zooplankton - NOGAP B1,
Zooplankton Data from the Canadian Beaufort Sea Shelf, 1984-1985". Arctic Ocean Diversity, University
of Alaska Fairbanks, Fairbanks. (Available at http://www.arcodiv.org/Database/Plankton_datasets,
accessed 2012).
50. G. E. Hopky, M. J. Lawrence, D. B. Chiperzak, "Beaufort Sea NOGAP2 Zooplankton - NOGAP B2,
Zooplankton Data from the Canadian Beaufort Sea Shelf, 1987-88". Central and Arctic Region,
Department of Fisheries and Oceans, Winnipeg, Manitoba; Arctic Ocean Diversity, University of Alaska
Fairbanks, Fairbanks. (Available at http://www.arcodiv.org/Database/Plankton_datasets, accessed 2012).
51. G. E. Hopky, M. J. Lawrence, D. B. Chiperzak, "Beaufort Sea NOGAP3 Zooplankton - NOGAP B3, 1986
Beaufort Sea NOGAP3 Zooplankton". Central and Arctic Region, Department of Fisheries and Oceans,
Winnipeg, Manitoba; Arctic Ocean Diversity, University of Alaska Fairbanks, Fairbanks. (Available at
http://www.arcodiv.org/Database/Plankton_datasets, accessed 2012).
52. H. J. Hirche et al., Structure and function of contemporary food webs on Arctic shelves: A panarctic
comparison: The pelagic system of the Kara Sea–Communities and components of carbon flow. Progress in
Oceanography 71, 288 (2006).
53. H. J. Hirche, K. N. Kosobokova, B. Gaye-Haake, I. Harms, "Structure and function of contemporary food
webs on Arctic shelves: A panarctic comparison. The pelagic system of the Kara Sea-communities and
components of carbon flow". Originator: B. Meon and E.-M. Nöthig (2006). (Available at
http://www.iobis.org, accessed 2013).
54. A. Naumov, "Benthos of the White Sea. A database". White Sea Biological Station, Zoological Institute
RAS. (Available at http://www.emodnet-biology.eu/component/imis/?module=dataset&dasid=2769,
accessed 2012).
55. "East Coast North America Strategic Assessment Project, Groundfish Atlas for the East Coast of North
America". (Available at http://www.iobis.org, accessed 2012).
56. "Whale Catches in Southern Ocean", OBIS - Australian Antarctic Data Centre. (Available at
http://www.iobis.org, accessed 2013).
57. T. Siferd, "Central and Arctic Multi-Species Stock Assessment Surveys. OBIS Canada Digital Collections
(2010)". Bedford Institute of Oceanography, Dartmouth, Nova Scotia, Canada (OBIS Canada). (Available
at http://www.iobis.org, accessed 2012).
58. K. Kosobokova, "White Sea Zooplankton". Shirshov Institute of Oceanology, Moscow; Arctic Ocean
Diversity, University of Alaska Fairbanks, Fairbanks. (Available at
http://www.arcodiv.org/Database/Plankton_datasets, accessed 2012).
59. E. L. Markhaseva, A. A. Golikov, T. A. Agapova, A. A. Beig, "Archives of the Arctic Seas Zooplankton 1"
(1985). (Available at http://www.iobis.org, accessed 2012).

8
60. T. N. Ratkova, "Phytoplankton of the White Sea, Barents Sea, Amundsen & Nansen Basins". Institute of
Oceanology, Academy of Sciences of Russia, Moscow, Russia; Arctic Ocean Diversity, University of
Alaska Fairbanks, Fairbanks. (Available at http://www.arcodiv.org/Database/Plankton_datasets, accessed
2012).
61. M. Machete, R. S. Santos, Azores Fisheries Observer Program (POPA): A case study of the
multidisciplinary use of observer data. Proceedings of the 5th International Fisheries Observer Conference,
Victoria, Canada. T. A. McVea, S. J. Kennelly (Ed) 114-116 (2007).
62. T. Morato, D. A. Varkey, C. Damaso, M. Machete, M. Santos, R. Prieto, R. S. Santos, T. J. Pitcher,
Evidence of a seamount effect on aggregating visitors. Marine Ecology Progress Series, 357: 23-32 (2008).
63. P. Amorim, M. Figueiredo, M. Machete, T. Morato, A. Martins, R. S. Santos, Spatial variability of seabird
distribution associated with environmental factors: a case study of marine Important Bird Areas in the
Azores. ICES Journal of Marine Science, 66: 29-40 (2009).
64. "POPA cetacean, seabird, and sea turtle sightings in the Azores area 1998-2009 - OBIS SEAMAP".
(Available at http://www.iobis.org, accessed 2012).
65. E. J. Wade, "Snow crab research trawl survey database (Southern Gulf of St. Lawrence, Gulf region,
Canada) from 1988 to 2010". OBIS Canada, Bedford Institute of Oceanography, Dartmouth, Nova Scotia,
Canada (2011). (Available at http://www.iobis.org, accessed 2012).
66. H. Rees, M. Pendle, R. Waldock, D. Limpenny, S. Boyd, A comparison of benthic biodiversity in the North
Sea, English Channel, and Celtic Seas. ICES Journal of Marine Science: Journal du Conseil 56, 228 (1999).
67. H. Rees, M. Pendle, R. Waldock, D. Limpenny, S. Boyd, "A comparison of benthic biodiversity in the
North Sea, English Channel and Celtic Seas - Epifauna". Centre for Environment, Fisheries and
Aquaculture Science; Burnham Laboratory, UK. (Available at http://www.emodnet-
biology.eu/component/imis/?module=dataset&dasid=505, accessed 2012).
68. R. Ostler, "Marine Nature Conservation Review (MNCR) and associated benthic marine data held and
managed by JNCC - EurOBIS". Joint Nature Conservation Committee, Centre for Ecology and hydrology,
Aberdeenshire, UK. (Available at http://www.emodnet-biology.eu/data-
catalog/??module=dataset&dasid=621, accessed 2012).
69. J. J. Moore, C. M. Howson, “Survey of the rocky shores in the region of Sullom Voe, Shetland, A report to
SOTEAG from Aquatic Survey & Monitoring Ltd”, Cosheston, Pembrokeshire. 29 pp. (Available at
http://www.soteag.org.uk, accessed 2013).
70. M. L. Zettler, "Macrozoobenthos baltic sea (1980-2005) as part of the IOW-Monitoring". Institut für
Ostseeforschung Warnemünde, Germany (2005). "IOW Macrozoobenthos monitoring Baltic Sea (1980-
2005) (EurOBIS)". (Available at http://www.iobis.org, accessed 2012).
71. "The Observer Program database", accessed through the OBIS-USA North Pacific Groundfish Observer
(North Pacific Research Board). (Available at http://www.iobis.org, accessed 2012).
72. "Baltic Seabirds Transect Surveys", Institute of Ecology of Vilnius University - OBIS-SEAMAP.
(Available at http://www.emodnet-biology.eu/component/imis/?module=dataset&dasid=1971, accessed
2012).
73. P. Yen, W. Sydeman, S. Bograd, K. Hyrenbach, Spring-time distributions of migratory marine birds in the
southern California Current: Oceanic eddy associations and coastal habitat hotspots over 17 years. Deep
Sea Research Part II: Topical Studies in Oceanography 53, 399 (2006).
74. J. Jahncke, C. Rintoul, "CalCOFI and NMFS Seabird and Marine Mammal Observation Data, 1987-2006".
California Cooperative Oceanic Fisheries Investigations (CalCOFI) and National Marine Fisheries Service
(NMFS) cruises, 1987-2006 - OBIS SEAMAP (2006). (Available at http://www.iobis.org, accessed 2012).
75. C. Rintoul, B. Schlagenhauf-Langabeer, K. D. Hyrenbach, K. H. Morgan, W. J. Sydeman, Atlas of
California Current Marine Birds and Mammals: Version 1. Unpublished report, PRBO Conservation
Science, Petaluma, California (2006).

9
76. P. P. Yen, W. J. Sydeman, K. D. Hyrenbach, Marine bird and cetacean associations with bathymetric
habitats and shallow-water topographies: implications for trophic transfer and conservation. Journal of
Marine Systems 50, 79 (2004).
77. P. I. Mitchell, S. F. Newton, N. Ratcliffe, T. E. Dunn, "Seabird 2000". Eurobis Joint Nature Conservation
Committee, Peterborough, UK. (Available at http://www.iobis.org/, accessed 2012)
78. "MEDITS seabird surveys 1999 / 2000 / 2002", Mediterranean Institute for Advanced Studies (IMEDEA)
(2011). In: OBIS-SEAMAP. (Available at http://www.emodnet-
biology.eu/component/imis/?module=dataset&dasid=1979, accessed 2012).
79. E. Stanley, "NTLFI02 North Temperate Lakes LTER: Fish Abundance 1981 - current", North Temperate
Lakes Long Term Ecological Research program, NSF. Center for Limnology, University of Wisconsin-
Madison. (Available at https://lter.limnology.wisc.edu/dataset/north-temperate-lakes-lter-fish-abundance-
1981-current, accessed 2012).
80. P. Henderson, The long-term study of the fish and crustacean community of the Bristol Channel. (Available
at http://www.pisces-conservation.com/, accessed 2013).
81. D. Clark, B. Branton, "DFO Maritimes Research Vessel Trawl Surveys, OBIS Canada Digital Collections".
Bedford Institute of Oceanography, Dartmouth, Nova Scotia, Canada, OBIS Canada (2007). (Available at
http://www.iobis.org, accessed 2012 ).
82. M. Reichert, "MARMAP Chevron Trap Survey 1990-2009". SCDNR/NOAA MARMAP Program,
SCDNR MARMAP Aggregate Data Surveys, The Marine Resources Monitoring, Assessment, and
Prediction (MARMAP) Program, Marine Resources Research Institute, South Carolina Department of
Natural Resources U.S.A. (2009). (Available at http://www.usgs.gov/obis-
usa/data_search_and_access/participants.html, accessed 2012).
83. M. Reichert, "MARMAP Neuston Nets 1990-2009, SCDNR/NOAA MARMAP Program, SCDNR
MARMAP Aggregate data surveys, The Marine Resources Monitoring, Assessment, and Prediction
(MARMAP) Program, Marine Resources Research Institute, South Carolina Department of Natural
Resources U.S.A. (2010). (Available at http://www.usgs.gov/obis-
usa/data_search_and_access/participants.html, accessed 2012).
84. M. Reichert, "MARMAP Florida Antillean Trap Survey 1990-2009, SCDNR/NOAA MARMAP Program,
SCDNR MARMAP Aggregate Data Surveys, The Marine Resources Monitoring, Assessment, and
Prediction (MARMAP) Program, Marine Resources Research Institute, South Carolina Department of
Natural Resources U.S.A. (2009). (Available at http://www.usgs.gov/obis-
usa/data_search_and_access/participants.html, accessed 2012).
85. "Scottish West Coast Survey For Commercial Fish Species 1985-2013". (Available at https://datras.ices.dk,
accessed 2013).
86. "ICES Baltic International Trawl Survey For Commercial Fish Species (1991 - 2013)". (Available at
https://datras.ices.dk, accessed 2013).
87. S. Sherman, "Maine Department of Marine Resources Inshore Trawl Survey, 2000 – 2009". Maine
Department of Marine Resources, Maine (2010). (Available at http://www.usgs.gov/obis-
usa/data_search_and_access/datasets.html, accessed 2012).
88. J. A. Boutillier, "Pacific Shrimp Trawl Survey". In: ShrimpTrawl Bio database, Fisheries and Oceans
Canada PBS Shellfish Data Unit. OBIS Canada Digital Collections, Bedford Institute of Oceanography,
Dartmouth, Nova Scotia, Canada (2007). (Available at http://www.iobis.org, accessed 2012).
89. K. Robinson, "CRRU (Cetacean Research and Rescue Unit) Cetacean sighting in Scotland waters (2010)".
(Available at http://www.emodnet-biology.eu/component/imis/?module=dataset&dasid=2819, accessed
2012).
90. "South Western Pacific Regional OBIS Data Bryozoan Subset", accessed through South Western Pacific
OBIS. (Available at http://www.iobis.org, accessed 2012).

10
91. "Marine and Coastal Management - Copepod Surveys - AfrOBIS". (Available at http://www.iobis.org/,
accessed 2012).
92. W. Addinck, M. de Kluijver, "North Sea observations of Crustacea, Polychaeta, Echinodermata, Mollusca
and some other groups between 1986 and 2003". Expert Centre for Taxonomic Idenditification (ETI), the
Netherlands (2003). (Available at http://www.emodnet-
biology.eu/component/imis/?module=dataset&dasid=1037, accessed 2012).
93. J. M. Tremblay, B. Branton, "DFO Maritimes Research Vessel Trawl Surveys Invertebrates". OBIS Canada
Digital Collections, Bedford Institute of Oceanography, Dartmouth, Nova Scotia, Canada (2007).
(Available at http://www.iobis.org, accessed 2012).
94. "NEFSC Benthic Database (OBIS-USA)", Northeast Fisheries Science Center, National Marine Fisheries
Service, NOAA, U.S. Department of Commerce (2010). (Available at http://www.iobis.org, accessed
2012).
95. F. B. Sumner, R. C. Osborn, L. J. Cole, B. M. Davis. A biological survey of the waters of Woods Hole and
vicinity. Bulletin of the U.S. Bureau of Fisheries. 31, 1 (1911).
96. F. B. Sumner, R. C. Osborn, L. J. Cole, B. M. Davis. "A biological survey of the waters of Woods Hole and
vicinity". (Available at http://www.iobis.org, accessed 2012).
97. G. M. Ruiz, P. W. Fofonoff, B. Steves, T. Huber, K. Larson, L. McCann, N. G. Hitchcock, A. H. Hines, J.
T. Carlton, "North American Sessile Marine Invertebrate Survey" (2005). (Available at
http://www.iobis.org, accessed 2012).
98. "South Western Pacific Regional OBIS Data Asteroid Subset", NIWA (National Institute of Water and
Atmospheric Research - New Zealand) MBIS (Marine Biodata Information System) accessed through
South Western Pacific OBIS. (Available at http://www.iobis.org, accessed 2012).
99. "Zooplankton in the Bay of Biscay (1995-2004, yearly DEPM surveys)". (Available at
http://www.emodnet-biology.eu/component/imis/?module=dataset&dasid=2774, accessed 2012).
100. L. Madin, E. Horgan, "Zooplankton Sampled with 10m2MOCNESS Net in Georges Bank 1995-1999."
Woods Hole Oceanographic Institution, USA: U.S. GLOBEC Data Management Office (2006). (Available
at http://www.usgs.gov/obis-usa/data_search_and_access/participants.html, accessed 2012).
101. "CMarZ (Census of Marine Zooplankton)-Asia Database". Accessed through OBIS- SCAR-MarBIN.
(Available at http://www.scarmarbin.be, accessed 2012).
102. M. K. Kennedy, J. A. Spry, "Atlantic Zone Monitoring Program Maritimes Region plankton datasets". In:
Fisheries and Oceans Canada - BioChem archive. OBIS Canada, Bedford Institute of Oceanography,
Dartmouth, Nova Scotia, Canada (2011). (Available at http://www.iobis.org, accessed 2012).
103. N. A. Milchakova, V. G. Ryabogina, E. B. Chernyshova, "Macroalgae of the Crimean coastal zone (the
Black Sea, 1967-2007)". Sevastopol, IBSS (2011). (Available at http://www.emodnet-
biology.eu/component/imis/?module=dataset&dasid=2690, accessed 2012).
104. C. E. Widdicombe, D. Eloire, D. Harbour, R. P. Harris, P. J. Somerfield, Long-term phytoplankton
community dynamics in the Western English Channel. Journal of Plankton Research 32, 643 (2010).
105. N. Derezuyk, "Phytoplankton of the Ukrainian Black Sea shelf (1985-2005)". (Available at
http://www.emodnet-biology.eu/component/imis/?module=dataset&dasid=2694, accessed 2012).
106. C. Bakker, P. Herman, M. Vink, A New Trend in the Development of the Phytoplankton in the
Oosterschelde (SW Netherlands) during and after the Construction of a Storm-Surge Barrier.
Hydrobiologia 283, 1 (1994).
107. K. Bakker, P. Herman, "Phytoplankton in the Oosterschelde before, during and after the storm-surge barrier
(1982-1990)". Netherlands Institute of Ecology; Centre for Estuarine and Marine Ecology, Netherlands.
EurOBIS Data (1990). (Available at http://www.emodnet-
biology.eu/component/imis/?module=dataset&dasid=1646, accessed 2013).

11
108. "EPA'S EMAP Database". U.S. Environmental Protection Agency through its Environmental Monitoring
and Assessment Program (EMAP). (Available at http://www.iobis.org, accessed 2012).
109. "National Benthic Infaunal Database (NBID)", NOAA/NOS/NCCOS/CCEHBR/Coastal Ecology Program.
NOAA's Ocean Service, National Centers for Coastal Ocean Science (NCCOS) (2003). (Available at
https://data.noaa.gov/dataset/national-benthic-infaunal-database-nbid, accessed 2012).
110. "Great Barrier Reef Seabed Biodiversity Study 2003-2006" (CMAR_ANACC), accessed through OBIS-
Australia. (Available at http://www.iobis.org, accessed 2012).
111. "CSIRO Marine Data Warehouse - OBIS Australia", CSIRO Division of Marine and Atmospheric Research
(CMAR), Australia. (Available at http://www.iobis.org, accessed 2012).
112. R. A. Bernardes, C. L. D. B. Rossi-Wongtschowski, R. Wahrlich, R. C. Vieira, A. P. Santos, A. R.
Rodrigues, Prospecção pesqueira de recursos demersais com aramadilhas e pargueiras na Zona Econômica
Exclusiva da Região Sudeste-Sul do Brasil. (São Paulo: Instituto Oceanográfico da USP - Série
Documentos Revizee: Score Sul, 2005). 112 p. ISBN 85-98729-13-2.
113. R. A. Bernardes, J. L. Figueiredo, A. R. Rodrigues, L. G. Fischer, C. M. Vooren, M. Haimovic, C. L. B.
Rossi-Wongtschowski, Peixes da Zona Econômica Exclusiva da Região Sudeste-Sul do Brasil:
levantamento com aramadilhas, pargueiras e rede de arrasto de fundo. (São Paulo: Editora da Universidade
de São Paulo, 2005.). 295p. ISBN 85-314-0890-3.
114. "REVIZEE South Score / Pelagic and Demersal Fish Database II". (Available at http://www.iobis.org,
accessed 2012).
115. "South Western Pacific Regional OBIS Data provider for the NIWA Marine Biodata In formation System",
NIWA (National Institute of Water and Atmospheric Research - New Zealand) MBIS (Marine Biodata
Information System) accessed through South Western Pacific OBIS. (Available at http://www.iobis.org,
accessed 2012).
116. "Previous_fisheries_REVIZEE_Program", accessed through Tropical and Subtropical Western South
Pacific OBIS. (Available at http://www.iobis.org, accessed 2012 ).
117. "Southeast Fisheries Science Center, National Oceanic and Atmospheric Administration. NOAA Southeast
Fishery Science Center (SEFSC) Fisheries Log Book System (FLS) Commercial Pelagic Logbook Data".
(Available at http://www.iobis.org, accessed 2012).
118. "CRED Towed-Diver Fish Biomass Surveys in the Pacific Ocean 2000-2010". Coral Reef Ecosystem
Division (CRED), Pacific Island Fisheries Sciences Center, National Marine Fisheries Service (2011).
(Available at http://www.usgs.gov/obis-usa/data_search_and_access/datasets.html, accessed 2012).
119. "Bahamas Marine Mammal Research Organisation Opportunistic Sightings - OBIS SEAMAP". (Available
at http://www.iobis.org, accessed 2012).
120. F. L. Silveira, R. M. Lopes, "On the Marine Free-Living Copepods off Brazil -WSAOBIS". Western South
Atlantic OBIS, São Paulo (2008). (Available at http://www.iobis.org, accessed 2012).
121. P. Hidalgo et al., Patterns of copepod diversity in the Chilean coastal upwelling system. Deep Sea Research
Part II: Topical Studies in Oceanography 57, 2089 (2010).
122. R. Escribano, K. Manríquez, F. Godoy, "Copepoda-COPAS Center (COPAS_CPD1) - Planktonic copepods
from the Chilean Humboldt Current System - Eastern South Pacific Regional Node of OBIS (ESPOBIS)"
(2006). (Available at http://www.iobis.org, accessed 2012).
123. "CRED Rapid Ecological Assessments of Coral Population in the Pacific Ocean 2007-2010". Coral Reef
Ecosystem Division (CRED), Pacific Island Fisheries Sciences Center, National Marine Fisheries Service
(2011). (Available at http://www.usgs.gov/obis-usa/data_search_and_access/datasets.html, accessed 2012).
124. "South TX Outer Continental Shelf and MI, AL, and FL Outer Continental Shelf benthic organism
sampling 1974-1978". US National Oceanographic Data Center, Silver Spring, Maryland, USA (2011).
(Available at http://www.usgs.gov/obis-usa/data_search_and_access/participants.html, accessed 2012).

12
125. J. Sicinski, M. Blazewicz-Paszkowycz, "Admiralty Bay Benthos Diversity Data Base (ABBED). Cumacea"
(2008). (Available at site http://www.scarmarbin.be, accessed 2012).
126. J. Sicinski, R. Bamber, "Admiralty Bay Benthos Diversity Data Base (ABBED). Pycnogonida" (2008).
(Available at http://www.scarmarbin.be, accessed 2012).
127. J. Sicinski, M. Blazewicz-Paszkowycz, "Admiralty Bay Benthos Diversity Data Base (ABBED).
Tanaidacea" (2008). (Available at http://www.scarmarbin.be, accessed 2012)..
128. B. Danis, A. Van de Putte, N. Youdjou, H. Segers (Editors), The Antarctic Biodiversity Information
Facility. (Available at http://www.biodiversity.aq, accessed 2013).
129. "Marine Biological Sample Database, JAMSTEC" (OBIS_JAPAN). (Available at
http://www.godac.jamstec.go.jp/bio-sample/index_e.html, accessed 2012).
130. "CRED REA Algal Quadrate Images in the Pacific Ocean 2002-2008". Coral Reef Ecosystem Division
(CRED), Pacific Island Fisheries Sciences Center, National Marine Fisheries Service (2011). (Available at
http://www.usgs.gov/obis-usa/data_search_and_access/datasets.html, accessed 2012).
131. "St. John, USVI Fish Assessment and Monitoring Data (2002 - Present)", Silver Spring, MD Publisher:
NOAAs Ocean Service, National Centers for Coastal Ocean Science (NCCOS). National Oceanic and
Atmospheric Association (NOAA)-National Ocean Service (NOS)-National Centers for Coastal Ocean
Science (NCCOS)-Center for Coastal Monitoring and Assessment (CCMA)-Biogeography Team (2007).
(Available at http://www.iobis.org, accessed 2012).
132. "St. Croix, USVI Fish Assessment and Monitoring Data (2002 - Present)", Silver Spring, MDPublisher:
NOAAs Ocean Service, National Centers for Coastal Ocean Science (NCCOS). National Oceanic and
Atmospheric Association (NOAA)-National Ocean Service (NOS)-National Centers for Coastal Ocean
Science (NCCOS)-Center for Coastal Monitoring and Assessment (CCMA)-Biogeography Team (2007).
(Available at http://www.iobis.org, accessed 2012).
133. K. T. Shao, J. Lin, C-H Wu, H-M Yeh, T-Y Cheng, "A dataset from bottom trawl survey around Taiwan"
(2012). (Available at http://www.iobis.org, accessed 2013).
134. A. Brooks, "MCR LTER: Coral Reef: Long-term Population and Community Dynamics: Fishes". Moorea
Coral Reef (available at http://mcr.lternet.edu/cgi-bin/showDataset.cgi?docid=knb-lter-mcr.6, accessed
2012).
135. A. Brooks, "MCR LTER: Coral Reef: Long-term Population and Community Dynamics: Fishes". Moorea
Coral Reef LTER; Long Term Ecological Research Network. (available at
http://dx.doi.org/10.6073/pasta/85e08a1ea6548ac2eaf808a70ce3eeb2, accessed 2012).
136. E. Pulliainen, A transect survey of small land carnivore and red fox populations on a subarctic fell in
Finnish Forest Labland over 13 winters. Ann. Zool. Fennici, 18, 270-278 (1981).
137. "A transect survey of small land carnivore and red fox populations on a subarctic fell in Finnish forest
Lapland over 13 winters". NERC Centre for Population Biology, Imperial College, The Global Population
Dynamics Database v2.0. (Available at http://www3.imperial.ac.uk/cpb/databases/gpdd, accessed 2012).
138. R. T. Holmes, T. W. Sherry, F. W. Sturges, Bird Community Dynamics in a Temperate Deciduous Forest:
Long-Term Trends at Hubbard Brook. Ecological Monographs 56, 201 (1986).
139. F. W. Preston, Time and Space and the Variation of Species. Ecology 41, 612 (1960).
140. K. J. Gaston, T. M. Blackburn, Pattern and process in macroecology. (Wiley-Blackwell, Oxford, England,
2000).
141. D. W. Gibbons, J. B. Reid, R. A. Chapman, The New Atlas of Breeding Birds in Britain and Ireland: 1988-
1991. (1994).
142. P. Lack, The atlas of wintering birds in Britain and Ireland. (A&C Black, London, England, 2010).
143. P. Standley, A. Swash, R. Gillmor, The birds of Berkshire. (Berkshire Atlas Group, Berkshire, England,
1996).

13
144. B. Stone et al., Population estimates of birds in Britain and in the United Kingdom. British Birds 90, 1
(1997).
145. M. Williamson, Are communities ever stable? Colonization, succession and stability. AJ Gray, MJ
Crawley & PJ Edwards (Eds.), Blackwell Scientific Publications, Oxford, (1987) pp 353 .
146. G. Beven, Changes in breeding bird populations of an oak-wood on Bookham Common, Surrey, over
twenty-seven years. London Naturalist 55, 23 (1976).
147. M. Williamson, The Land-Bird Community of Skokholm: Ordination and Turnover. Oikos 41, 378 (1983).
148. USGS Patuxent Wildlife Research Center. North American Breeding Bird Survey ftp data set, version
2014.0. (Available at ftp://ftpext.usgs.gov/pub/er/md/laurel/BBS/DataFiles/, accessed 2013).
149. W. L. Vickery, T. D. Nudds, Detection of Density-Dependent Effects in Annual Duck Censuses. Ecology
65, 96 (1984).
150. H. Linden, P. Rajala, Fluctuations and long-term trends in the relative densities of tetraonid populations in
Finland 1964-1977. Riistabieteellisia Julkaisuja, 39, 13-34.
151. "Fluctuations and long-term in the relative densities of tetraonid populations in Finland, 1964-77". NERC
Centre for Population Biology, Imperial College, The Global Population Dynamics Database v2.0.
(Available at http://www3.imperial.ac.uk/cpb/databases/gpdd, accessed 2012).
152. "Animal Demography Unit - Coordinated Waterbird Counts (CWAC) - AfrOBIS". (Available at
http://www.iobis.org/, accessed 2012).
153. S. K. M. Ernest, T. J. Valone, J. H. Brown, Long-term monitoring and experimental manipulation of a
Chihuahuan Desert ecosystem near Portal, Arizona, USA. Ecology 90, 1708 (2009).
154. P. Grant, An 11-year study of small mammal populations at Mont St. Hilaire, Quebec. Canadian Journal of
Zoology 54, 2156 (1976).
155. P. R. Grant, "An 11-year study of small mammal populations at Mont St. Hilaire, Quebec". NERC Centre
for Population Biology, Imperial College (1976). The Global Population Dynamics Database v2.0.
(Available at http://www3.imperial.ac.uk/cpb/databases/gpdd, accessed 2012).
156. M. Friggens, "Sevilleta LTER Small Mammal Population Data", Albuquerque, NM: Sevilleta Long Term
Ecological Research Site Database: SEV008 (2008). (Available at http://sev.lternet.edu/data/sev-8,
accessed 2012).
157. B. Vanholder, "Belgian Migrating Lepidoptera (1997)". (Available at http://www.club.innet.be/~pub00644,
accessed 2012).
158. "Belgian Migrating Lepidoptera". NERC Centre for Population Biology, Imperial College, The Global
Population Dynamics Database v2.0. (Available at http://www3.imperial.ac.uk/cpb/databases/gpdd,
accessed 2012).
159. N. Moore, The development of dragonfly communities and the consequences of territorial behaviour: A 27
year study on small ponds at Woodwalton Fen, Cambridgeshire, United Kingdom. Odonatologica 20, 203
(1991).
160. N. W. Moore, "The development of dragonfly communities and the consequences of territorial behaviour:
A 27-year study on small ponds at Woodwalton Fen, Cambridgeshire, United Kingdom". NERC Centre for
Population Biology, Imperial College (1991) The Global Population Dynamics Database Version 2.0.
(Available at http://www3.imperial.ac.uk/cpb/databases/gpdd, accessed 2012).
161. J. Jones, J. Miller, "Spatial and temporal distribution and abundance of moths in the Andrews Experimental
Forest, 1994 to 2008". H. J. Andrews Experimental Forest. Forest Science Data Bank, Corvallis. (Available
at http://andrewsforest.oregonstate.edu/data/abstract.cfm?dbcode=SA015, accessed 2013).
162. C. B. Halpern, J. A. Lutz. (2013) Data from: Canopy closure exerts weak controls on understory dynamics:
a 30-year study of overstory–understory interactions. Dryad DigitalRepository doi:10.5061/dryad.1q88j

14
163. C. B. Halpern, J. A. Lutz, Canopy closure exerts weak controls on understory dynamics: a 30-year study of
overstory–understory interactions. Ecological Monographs 83, 221 (2013).
164. C. Halpern, C. Dyrness, "Plant succession and biomass dynamics following logging and burning in the
Andrews Experimental Forest Watersheds 1 and 3, 1962-Present". Long-Term Ecological Research. Forest
Science Data Bank, Corvallis (2010). (Available:
http://andrewsforest.oregonstate.edu/data/abstract.cfm?dbcode=TP073, accessed 2012).
165. L. Zachmann, C. Moffet, P. Adler, Mapped quadrats in sagebrush steppe: long-term data for analyzing
demographic rates and plant–plant interactions. Ecology 91, 3427 (2010).
166. S. L. Webb, S. E. Scanga, Windstorm Disturbance without Patch Dynamics: Twelve Years of Change in a
Minnesota Forest. Ecology 82, 893 (2001).
167. R. B. Waide, "Bird abundance - point counts, El Verde Field Station, Puerto Rico: Luquillo Long Term
Ecological Research Site Database: Data Set 23". (Available at http:/luq.lternet.edu/data/luqmetadata23,
accessed 2012).
168. C. P. Bloch, M. Willig, "Community Ecology of Land Snails Survey Dataset. San Juan, Puerto Rico:
Luquillo Long Term Ecological Research Site Database: El Verde Grid Invertebrate data LTER
DBAS107" (2007). (Available at http://luq.lternet.edu/data/luqmetadata107/7427, accessed 2012).
169. C. Fletcher, A. R. Kassim, "Pasoh Forest Dynamics Plot Data". (Available at
http://www.ctfs.si.edu/site/Pasoh/, accessed 2013).
170. R. Sukumar, "Mudumalai Forest Dynamics Plot Data". (Available at
http://www.ctfs.si.edu/site/Mudumalai/, accessed 2013).
171. S. P. Hubbell, R. Condit, R., R. B. Foster, "Barro Colorado Forest Census Plot Data (2005)". (Available at
https://ctfs.arnarb.harvard.edu/webatlas/datasets/bci, accessed 2012).
172. R. Condit, Tropical Forest Census Plots. (Springer-Verlag and R. G. Landes Company, Berlin, Germany,
and Georgetown, Texas, 1998).
173. R. Condit et al., The importance of demographic niches to tree diversity. Science 313, 98 (2006).
174. S. P. Hubbell et al., Light-gap disturbances, recruitment limitation, and tree diversity in a neotropical forest.
Science 283, 554 (1999).

15
Acknowledgments: This work was funded by the ERC (BioTIME 250189). MD is grateful for
support from the Scottish Funding Council (MASTS -grant reference HR09011) and
AEM from the Royal Society. We are grateful to all the data providers for making data
publicly available and to their funders: Belspo (Belgian Science Policy), U.S.National
Science Foundation, U.S. NOAA Marine Fisheries Service under Grant Number
NA11NMF4540174, Fisheries and Oceans Canada, Government of Nunavut, Nunavut
Wildlife Management Board, Nunavut Tunngavik Incorporated, Nunavut Emerging
Fisheries Fund, Makivik Corporation, Smithsonian Institution, Atherton Seidell Grant
Program, grants BSR-8811902, DEB 9411973, DEB 0080538, DEB 0218039, DEB
0620910 and DEB 0963447 from NSF to the Institute for Tropical Ecosystem Studies,
University of Puerto Rico, and to the International Institute of Tropical Forestry USDA
Forest Service, as part of the Luquillo Long-Term Ecological Research Program, the U.S.
Forest Service (Dept. of Agriculture), University of Puerto Rico, the US National Science
Foundation's Long-term Ecological Research program and Fishery Administration
Agency, Council of Agriculture, Taiwan, Azores Fisheries Observer Program and the
Center of the Institute of Marine Research (IMAR) of the University of the Azores. In
addition data were provided by the HJ Andrews Experimental Forest research program,
funded by the National Science Foundation's Long-Term Ecological Research Program
(DEB 08-23380), US Forest Service Pacific Northwest Research Station, and Oregon
State University. Cruise data were collected through the logistical efforts of the
Australian Antarctic Division (AAD) and approved by the Australian Antarctic Research
Advisory Committee (Projects 2208 and 2953), the Australian Antarctic Data Centre of
the Australian Antarctic Division, Tasmania. We thank Peter Henderson from Pisces
Conservation. We are also grateful to the databases that compile these data namely OBIS,
Ecological Data Wiki, DATRAS and LTER. Finally, we are grateful to Olivia Mendivil-
Ramos for advice on database design and Miguel Barbosa and three anonymous referees
for comments on earlier versions of the manuscript. The rarefied time series used in our
analysis are included as Supplementary Files S1 and S2.

16
Fig. 1 – Distribution of the survey sites included in our analysis. Datasets are color-coded to
reflect their climatic region: pink corresponds to global, royal blue to polar, turquoise to polar-
temperate, green to temperate, dark yellow to temperate tropical and red to tropical. Details and
citation information about the datasets are included in table S1.
Fig. 2 – Temporal change in species richness (A) and species composition (B) as measured by
Jaccard similarity between each sample and the first sample in the time series. Data points are
represented by grey circles and models fitted by solid lines. The black line corresponds to a
model where a single slope, but different intercepts, were fitted to all the time series, and is
represented here with the mean intercept. The colored lines correspond to a model where each
time series had a different slope and intercept. Color-coding corresponds to climatic regions as
per in figure legend. Figure S10 presents a similar analysis for a different approach to
rarefaction.
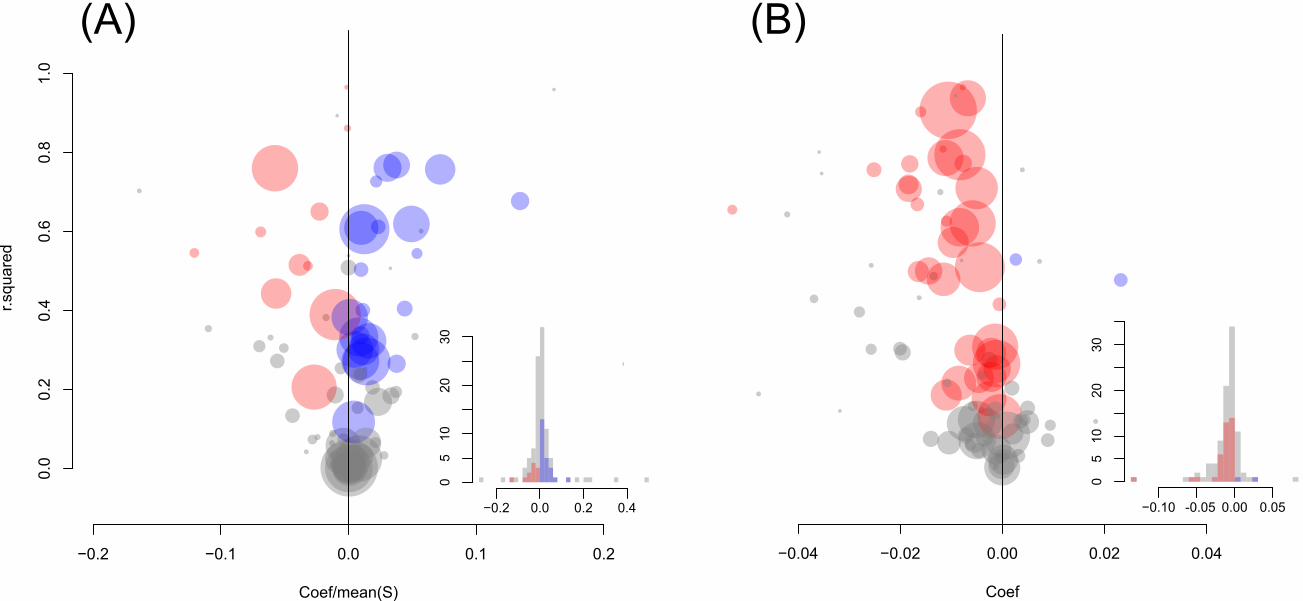
Fig. 3 – Slope estimate distributions for species richness (A) and Jaccard similarity (B). Slope
estimates (horizontal axis), r2 (vertical axis) and number of data points in time series (bubble
size) for each of the datasets. Bubbles are color coded as blue (positive slope), red (negative
slope) and grey (non-significantly different from 0, see 13).


0 20 40 60 80
0.0
0.2
0.4
0.6
0.8
1.0
durationG(year)Ja
ccar
d
(A) (B)
1900 1920 1940 1960 1980 2000
0
2
4
6
8
Year
log(
S)
CommonGtrendGlobalPolarPolar/TemperateTemperateTemperate/TropicalTropical
−0.04 −0.02 0.00 0.02 0.04
(A) (B)
Coef
Estimate
Frequency
−0.10 0.00 0.05
0510
2030
-0.05
−0.2 −0.1 0.0 0.1 0.2
0.0
0.2
0.4
0.6
0.8
1.0
Coef/mean(S)
r.squared
Estimate/aveY
Frequency
−0.2 0.0 0.2 0.4
05
1020
30