aspects on image quality in radiologic evaluation of the urinary...
TRANSCRIPT
Linköping University Medical Dissertations No. 1298
Aspects on Image Quality
in Radiologic Evaluation of the Urinary Tract
Margareta Lundin
Department of Medicine and Care,
Linköping University Sweden
Linköping 2012
1

This work has been conducted in collaboration with the Center for medical Image Science and Visualization (CMIV, hhtp/:www.cmiv.liu.se) at Linköping University, Sweden. CMIV is acknowledged for provision of access to leading edge research infrastructure.
Cover: To the left, the preliminary radiograph and to the right, photon spectra in the dual-energy computed tomography, below, virtual non-contrast image in axial projection of the abdomen in investigation of the urinary tract. Printed by: UniTryck, Linköping, Sweden. Distributed by: Center for Medical Image Science and Visualization (CMIV) Linköping University SE-581 85 Linköping, Sweden ISBN 978-91-7519-943-6 ISSN 0345-0082 Copyright © 2012 Margareta Lundin No part of this publication may be reproduced, stored in retrieval system, or transmitted, in any form or by means, electronic, mechanical, photocopying, recording or otherwise, without prior permission of the author.
2

To my parents
3

4

Abstract The focus of this document is on image quality as one of the factors fundamental for the
diagnostic process. With the rising number of procedures and the trend towards more
complicated examinations, urinary tract investigations was chosen in this work as a good clinical
model for evaluation of the factors influencing image quality and of the ways of evaluating
image quality.
In paper I, a method is described for optimisation during the introduction of a new imaging
system, with a focus on the maintenance of image quality relative to the older already optimised
system. Image quality was assessed using the image criteria of the European guidelines for IVU
with visual grading analysis. Equivalent image quality in image pairs was achieved at 30% of the
dose. The CDRAD contrast-detail phantom makes it possible to find dose levels that give equal
image quality using different imaging systems.
In paper II, the influence of bowel purgation on image quality in urography is questioned. The
aim of this study was to compare bowel purgation and two other preparation methods; dietary
restrictions and no preparation at all. Image quality was assessed according to European
Commission criteria for excretory urography. The effectiveness of bowel purgation and the
amount of residual gas were scored separately. The results of our study show that the preparation
methods are of equal value and further use of bowel purgation before excretory urography
cannot be justified.
In paper III, the image quality of the non-enhanced series is compared to a virtual non-contrast
series (VNC) obtained using two generations of dual-energy CT (DECT) scanners and taking CT
of the urinary tract as a model. The image quality of the VNC images was rated inferior to the
single-energy variant for both scanners, the OR range being 11.5–67.3 for the first generation of
DECT scanner (Definition) and 2.1–2.8 for the new generation DECT (Definition Flash). Visual
noise and overall quality were regarded as better with Flash than with Definition. Image quality
of VNC images obtained with the new generation of DECT is still slightly inferior compared to
native images.
5

In paper IV, the accuracy of measurement of renal calculi in a dual-energy, virtual, non-
enhanced-image series is compared to actual stone size and a single-energy image series in the
phantom study. This study shows that detection of small stones is not reliable, despite better
image quality, with the new DECT and that small stones will be missed with VNC imaging.
With larger stones, the inherent measurement error with CT is magnified with VNC imaging.
6

List of publications
This thesis is based on the following four papers, referred to in the text by their roman numerals: I. Jansson M, Geijer H, Persliden J, Andersson T
Reducing dose in urography while maintaining image quality – a comparison of storage
phosphor plates and a flat-panel detector.
Eur Radiol. 2006 Jan;16(1):221–6. Epub 2005 Apr 27.
DOI: 10.1007/s00330-005-2772-3.
II. Jansson M, Geijer H, Andersson T
Bowel preparation for excretory urography is not necessary: a randomized trial.
Br J Radiol. 2007 Aug;80(956):617–24. Epub 2007 Aug 6.
DOI: 10.1259/bjr/78311002.
III. Lundin M, Lidén M, Magnuson A, Abdulilah Mohammed A, Geijer H, Andersson T,
Persson A
Virtual non-contrast dual-energy CT compared to single-energy CT of the urinary tract – a
prospective study.
Accepted for publication in Acta Radiologica.
IV. Lundin M, Magnuson A, Geijer H, Andersson T, Persson A
Accuracy of stone-size measurement using dual-energy virtual non-contrast enhanced CT images
– a phantom study.
In manuscript
Papers reprinted with permission
7

8

Contents
.Fel!Bokmärket är inte definierat. 1. Introduction .................................................................................................................................1
1.1. Background .......................................................................................................................1 1.2. Imaging of the urinary tract...............................................................................................3
1.2.1. Intravenous urography................................................................................................3 1.2.1.1. Preparation techniques ........................................................................................3 1.2.1.2. The preliminary radiograph.................................................................................3 1.2.1.3. Intravenous urography.........................................................................................3
1.2.2. Computed tomography urography .............................................................................4 1.2.2.1. Evaluation of urolithiasis ....................................................................................4 1.2.2.2. Evaluation of haematuria ....................................................................................5 1.2.2.3. Dual-Energy Computed Tomography.................................................................5
1.3. Image quality.....................................................................................................................7 1.4. Imaging modalities ............................................................................................................9
1.4.1. Digital radiography ....................................................................................................9 1.4.2. Dual-energy computed tomography...........................................................................9
2. Aims .......................................................................................................................................13 3. Material and Methods.............................................................................................................15
3.1. Evaluated systems ...........................................................................................................15 3.1.1. Studies I and II .........................................................................................................15 3.1.2. Studies III and IV .....................................................................................................15
3.2. Study design and intervention .........................................................................................16 3.2.1. Study I ......................................................................................................................16 3.2.2. Study II .....................................................................................................................18
3.2.2.1. Intervention .......................................................................................................18 3.2.2.2. Objectives and sample size ...............................................................................19 3.2.2.3. Randomisation...................................................................................................20
3.2.3. Study III....................................................................................................................22 3.2.3.1. Study design ......................................................................................................22 3.2.3.2. Patient selection.................................................................................................23 3.2.3.3. Imaging techniques ...........................................................................................23
3.2.4. Study IV ...................................................................................................................24 3.2.4.1. Study design ......................................................................................................24
3.2.5. Image-quality assessment.........................................................................................26 3.2.6. Statistical methods....................................................................................................32
4. Results ....................................................................................................................................35 5. Discussion ..............................................................................................................................53
5.1. Image quality evaluation methods in digital radiography...............................................53 5.2. Flat-panel radiography ....................................................................................................57 5.3. Dual-energy computed tomography................................................................................58
6. Conclusions ............................................................................................................................63 7. Acknowledgements ................................................................................................................64 8. References ..............................................................................................................................65
9
Abbreviations ANOVA Analysis of Variance
CI Confidence Intervals
CNR Contrast to Noise Ratio
CT Computed Tomography
CTDI Computed Tomography Dose Index
DECT Dual-Energy Computed Tomography
DLP Dose–Length Product
DQE Detective Quantum Efficiency
EC European Commission
FOV Field of View
HU Hounsfield Units
ICC Intra-Class Correlation Coefficient
ICS Image Criteria Score
IQF Image Quality Figure
ITT Intention to Treat
IVU Intravenous Urography
MTF Modulation Transfer Function
OR Odds Ratio
ROC Receiver Operating Characteristics
ROI Region of Interest
SPP Storage Phosphor Plates
UNSCEAR The United Nations Scientific Committee on Effects of Atomic Radiation
VGA Visual Grading Analysis
VGAS Visual Grading Analysis Score
VGC Visual Grading Characteristics
VNC Virtual Non-Contrast
10
1
1. Introduction
1.1. Background The number of radiological examinations is increasing worldwide. The United Nations Scientific
Committee on Effects of Atomic Radiation (1) estimates that nearly 3.6 billion X-ray
examinations are performed worldwide every year. Many patients benefit greatly from technical
achievements in radiology but each X-ray examination imparts energy with ionising capability to
the tissues of the body. Ionising radiation is powerful enough to break molecular bonds and can
be harmful to humans. Because there is evidence that ionising radiation can cause these changes
in the human body, it is important that it is used efficiently. In the diagnostic radiographic
process, if the use of ionising radiation is to be efficient, three conditions must all be met: the
correct examination must be chosen, an appropriate image quality must be selected to provide an
answer to the clinical issue and the radiologist must be able to recognise pathology. Furthermore,
the benefit for the patient from the examination must far outweigh the risks.
Since 1984, the European Commission (EC) on Radiological Protection has
progressively developed the Quality Criteria for Diagnostic Radiographic Images to link
radiation dose to the patient to the required image quality and performance of the radiographic
procedure (2-4). The aim of these documents was to achieve uniform image-quality demands
throughout Europe to reasonably low radiation dose per examination and provide the basis for
accurate radiological interpretation. With the rising number of procedures and the trend towards
more complicated examinations, urinary tract investigation has been chosen as a good clinical
model for the evaluation in this dissertation of the factors that influence image quality. For many
decades urography was the only way to investigate the urinary tract for the presence of calculi,
hydronephrosis or tumours. Although intravenous urography still plays an important role in
uroradiology (5), in the past decades computed tomography has nearly replaced urography in
evaluation of patients with acute ureterolithiasis (6). The method is sufficient for evaluation of
ureterolithiasis in patients with acute flank pain (7-9). Ureterolithiasis, renal or urothelial
tumours and inflammatory conditions of the urinary tract may cause haematuria. When
haematuria is the main reason for investigation there needs to be intravenous administration of
contrast agent and sampling of image series in several phases or during dual phase of IV contrast
administration (10-12). Introduction of Dual-Energy Computed Tomography (DECT) brings
new possibilities to the evaluation of patients with haematuria. DECT allows information to be
collected from two rotating X-ray tubes set at different energies (140kV and 80kV) (13). The
11

2
difference in the dissemination and absorption of the photons with different energy in different
tissue types can be displayed as differences in the grayscale of the images obtained from the
various X-ray tubes. Measurement and analysis of these small differences can contribute to
chemical differentiation of different tissue types. This makes it possible to produce non-
enhanced image series virtually and avoid unnecessary radiation dose to the patient. However we
don’t know if the image quality of virtual created images is sufficient for the diagnosis and
measurement of urinary calculi. The focus of the present thesis is on image quality as one of the
factors fundamental for the diagnostic process. In paper I a method is described for optimisation
during the introduction of a new imaging system, with a focus on the maintenance of image
quality relative to the older already optimised system. In paper II the influence of bowel
purgation on image quality in urography is questioned. In paper III the image quality of the non-
enhanced series is compared to a virtual non-contrast series obtained with two generations of
dual-energy CT scanners using CT of the urinary tract as a model. In paper IV the accuracy of
measurement of renal calculi in a dual-energy virtual non-enhanced image series is compared to
actual stone size and a single-energy image series in the phantom study.
The project was conducted at Örebro University Hospital in the Department of Radiology and at
the Center for Medical Image Science and Visualization, Linköping University.
12

3
1.2. Imaging of the urinary tract
1.2.1. Intravenous urography
1.2.1.1. Preparation techniques Despite the growing evidence (14-18) questioning the value of prior bowel purgation, this
procedure remains prevalent in many radiological departments. In fact it is one of the preparation
standards, next to dietary restrictions and no preparation at all. Among authors of radiological
and urological textbooks there is disagreement about preparation recommendations. Whereas
some of them have abandoned bowel purgation (19, 20) others still recommend bowel purgation
as a routine, in case of unavailable tomography or to visualise small or faintly calcified stones
(21). Paper II describes the impact of bowel purgation on image quality in intravenous
urography.
1.2.1.2. The preliminary radiograph The main indication for the preliminary radiograph is primary investigation or follow-up of
patients with urinary tract calcifications (21). The preliminary radiograph should extend from the
upper poles of the kidneys to the symphysis pubis. The use of oblique scout images or
tomograms may be indicated for distinguishing renal from extrarenal calcifications.
1.2.1.3. Intravenous urography The indications for intravenous urography (IVU) continue to diminish now that computed
tomography (CT) and CT urography have nearly replaced IVU as the method of choice in
investigation of urinary tract pathology (5). The remaining textbook (21) indications for IVU in
adults include suspected postoperative obstruction or urinary leak and the follow-up of patients
with urothelial tumours. However, research from later years indicates that CT urography is more
accurate than IVU in the detection and localisation of upper urinary tract urothelial carcinoma
(22).
IVU consists of the preliminary radiograph (as described above), early nephrogram images,
tomography and excretion images. The nephrogram is most dense 30 seconds to 1 minute after
the injection of contrast medium. Because the rate of excretion of the contrast medium is related
to the plasma concentration of the contrast medium, an immediate post-injection view of the
kidneys or tomogram of the kidneys is the best way to depict the renal parenchyma. The use of
linear tomography allows artefacts from overlying structures to be avoided and improves
evaluation of the collecting system. For tomographic evaluation of the renal parenchyma and the
13

4
collecting system, the tomograms should be delayed several minutes after the injection of
contrast medium. Abdominal compression applied at the level of the pelvis compresses the distal
portion of the ureters and distends the calyces and proximal portion of the ureters. IVU
comprises two or three images of the whole abdomen, obtained between 5 and 15 minutes after
the injection of intravenous contrast medium. Those images alone are required to provide data
sufficient to allow evaluation of the entire collecting system, the ureters and the bladder and
supply information about contrast-filling defects, and dislocations or obstructions of the urinary
tract. The number of images can vary depending of the radiology unit. At our department twelve
images were generally taken in total.
1.2.2. Computed tomography urography
1.2.2.1. Evaluation of urolithiasis In recent decades computed tomography (CT) urography has become the primary imaging
technique for diagnosing many urinary tract diseases and been responsible for the decline in the
use of IVU. CT urography is considered a better alternative to IVU because of its greater
sensitivity in detecting urinary stones, its better visualisation of the renal parenchyma and its
ability to show other abdominal abnormalities (23). The advantages of modern CT over IVU
include high speed, ease of access for examination and the possibility of angiographic
evaluation. CT without the administration of intravenous contrast media is sufficient in
evaluation of ureterolithiasis in patients with acute flank pain (7). The results of earlier studies
show that compared to IVU unenhanced CT was more accurate and much quicker to carry out,
and it eliminated the need for contrast media (24). Investigation for signs of obstruction could be
carried out with unenhanced CT with urethral dilatation and perinephric and periureteral fat
stranding (9). The repeated use of CT and consequent increasing radiation risks to – in most
cases – young, potentially healthy patients with urolithiasis have recently caused concern among
radiologists (25), and research has paid attention to the need for a low-dose protocol that could
serve as a reliable tool for the urologist to follow paediatric and adult stone-formers (26-28).
Zilberman et al. (29) have shown that a low-dose protocol is useful for the follow-up of patients
with urolithiasis. However, there can be difficulties in interpreting findings in the pelvis and in
obese patients.
14
5
1.2.2.2. Evaluation of haematuria When haematuria is the main reason for investigation intravenous contrast agent needs to be
administered and sampling will be necessary of image series in several phases or during dual
phase of IV contrast administration. In this case, CT is able to characterise the renal mass, show
contra-lateral morphology and assess veins, lymph nodes, adrenal glands and the liver. With the
use of multidetector CT, studies may be tailored to the specific clinical question. Typically, a
urinary tract examination consists of an unenhanced image series of the entire abdomen, a renal
series acquired in the corticomedullary phase (15–30 seconds after IV contrast medium
injection), in the nephrographic phase (60–90 seconds after injection) and in the excretory phase
(180–300 seconds after injection) (30). A power injector is used for intravascular contrast media
administration. To minimise irradiation, a “split bolus” technique is recommended, in which a
second bolus is given 90 seconds before excretory-phase imaging to take advantage of
nephrographic and excretory phases in the same image series (10). Oral or intravenous hydration
is recommended to induce diuresis and improve filling of the collecting system. Oral contrast is
not necessary for evaluation of urinary tract diseases but is sometimes used in cases when
malignancy is suspected to avoid confusion of bowel loops with masses and other anatomical
structures.
1.2.2.3. Dual-Energy Computed Tomography The recent introduction of dual-energy CT has brought new diagnostic possibilities and had a
great impact on abdominal imaging. Collecting information simultaneously from two x-ray
sources at different voltages allows the differentiation of materials and tissues by applying
different x-ray spectra. By obtaining CT data at different photon energies, differences in material
composition can be detected (13). The differences of iodine attenuation at different energies
enable iodine-specific patterns to be detected, thus making it possible for iodinated contrast to be
removed from enhanced CT images. Urinary stones can be detected retrospectively by removing
the contrast from an image series. Graser et al. pointed out the possibility of single-scan
evaluation of haematuria by combining virtual non-contrast (VNC) imaging and the split-bolus
CT urographic technique (31). However, the results of recent studies suggest that the success rate
of detecting small stones in this way is inferior to that of unenhanced image series (32, 33). The
accuracy of stone-size assessment with the new technique is still unclear. Another application of
virtual non-contrast imaging is the possibility of the colour-coding of iodine in images. This
creates iodine overlay images and allows assessment of the amount of iodine in an evaluated
lesion without the need to compare Hounsfield (HU) attenuation on unenhanced images with
15

6
enhanced image series (34, 35). Material decomposition can help in the characterisation of
urinary stones in dual-energy imaging. Dual-energy CT can identify uric acid stones and, using a
colour-code, differentiate them from other stone types to guide therapy (36). Monochromatic
imaging, allowing a significant reduction in beam-hardening artefacts, would be useful in
patients with a prosthetic device (37).
16

7
1.3. Image quality Image quality must be adequate for reproducing pathology. This means that the efforts put into
optimisation, the changes in examination methodology and the introduction of the new
technology must not jeopardise the diagnostic outcome of the procedure. But, the examination
should be performed according to the ALARA principle (radiation dose as low as reasonably
achievable), with the image quality adjusted to the referral question, not to getting the best image
quality possible (38).
There are two important steps in the process of creating an informative x-ray image: (a) data
acquisition and image formation and (b) processing and display. In the screen-film system the
two steps were coupled: the x-ray film was both image detector and display medium for the
image. In digital radiography the two steps can be studied and described separately, since data-
acquisition and image formation, and processing and display, are uncoupled. According to
Fryback and Thornbury (39, 40), the evaluation of radiological quality can be categorised at six
levels:
Level 1 Technical quality of images
Level 2 Diagnostic accuracy
Level 3 Impact on diagnostic thinking
Level 4 Effects on patient management
Level 5 Patient outcome
Level 6 Societal costs and benefits
There are different strategies for image quality assessment. Technical quality can be assessed in
several ways:
a. By physical methods (level 1), such as contrast, spatial resolution and noise,
as detective quantum efficiency (DQE). DQE incorporates modulation transfer function
(MTF), noise and exposure level. DQE describes the performance of the digital
radiographic system but is difficult to measure in clinical practice. However, the physical
parameters determine the possible image quality as assessed by the human observer. For
computed tomography, the dose–length product (DLP), computed tomography dose
index (CTDI), contrast to noise ratio (CNR) and noise index image quality can all be
described.
b. With psychophysical measurements, using a contrast-detail phantom as a more image-
based way of assessing image quality. The observer reports the absence or presence of
test objects in a phantom of different size or contrast. The assessment of human observers
has the disadvantage of bringing intra- and inter-observer variability to the assessment,
17

8
but on the other hand more reliable imitate situation of the clinical images assessment.
Calculation of image quality figure (IQF) with CDRAD-Phantom, as we did in the first
study, is an example of such a measurement.
c. With observer/diagnostic performance methods, as a contribution to studies on level 2–3.
Simple preference studies, the Image Criteria Score (ICS) used in the second study and
Visual Grading Analysis (VGA), which was the evaluation of image quality in the third
study, would be included here.
Studies where the focus is on levels 3–6 are rare in the radiologic literature.
Anthropomorphic phantoms play an important role in the assessment of the image quality of the
CT image series. These phantoms permit unlimited repetitions of scans demonstrating the effects
of changing technical factors. A phantom contains anatomical details that imitate human body
conditions or anatomical details of an anatomical system being studied. More objective methods
can be used with anthropomorphic phantoms, for example, Visual Grading Analysis (VGA).
Image Criteria Score (ICS) follows the European Union quality criteria and represents the
method, which is useful in the assessment of clinical images. This makes the results of phantom
and clinical-image quality studies more comparable. However the very advantages of the easily
controlled environment present a disadvantage because of the limited extent to which it is
possible to implement the phantom study results in humans – their anatomical details are not
predictable and constant. However, most anthropomorphic phantoms are constructed for
positioning radiography or for radiation therapy, with no or limited possibility to control studied
pathological condition.
18
9
1.4. Imaging modalities
1.4.1. Digital radiography In digital image detection systems, an x-ray beam is converted into an electrical signal. This
electrical signal is then digitised, displayed and archived in digital form. Besides eliminating
chemicals from radiology departments, digitalising of radiographic images has made archiving
simple, much less costly than film and easy to share for viewing in different locations. Storage
phosphor plates (SPP) were the first type of system widely used in computed radiography.
Because of their wider dynamic range compared to screen–film systems it is possible to reduce
dosage, even though the detective quantum efficiency (DQE) of SPP is not much better than that
of screen–film systems. The higher DQE of the next generation of flat-panel systems, the direct
digital system, allowed further dose reduction and image-quality improvement. Paper I describes
a possible way of introducing a new imaging system with a focus on maintained image quality.
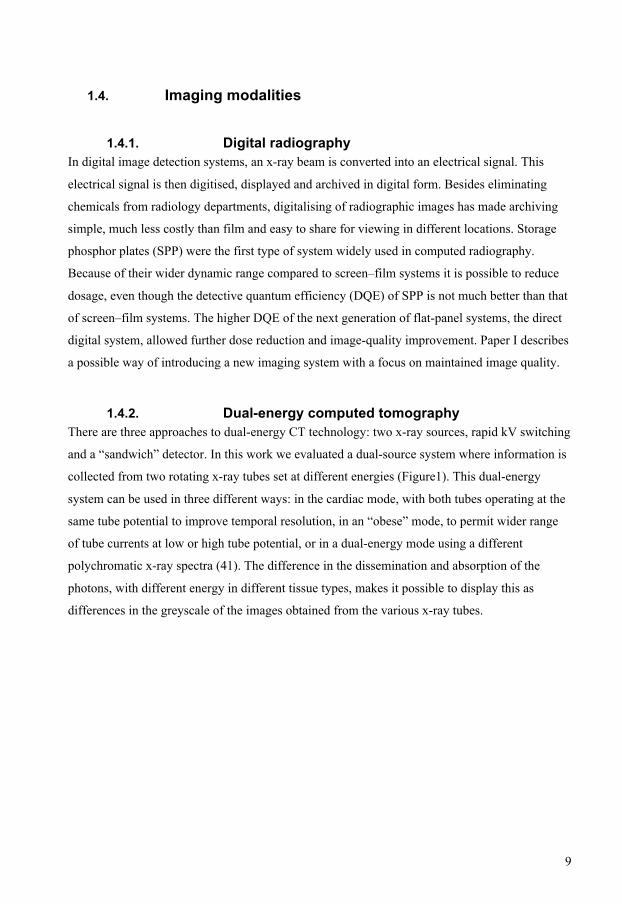
1.4.2. Dual-energy computed tomography There are three approaches to dual-energy CT technology: two x-ray sources, rapid kV switching
and a “sandwich” detector. In this work we evaluated a dual-source system where information is
collected from two rotating x-ray tubes set at different energies (Figure1). This dual-energy
system can be used in three different ways: in the cardiac mode, with both tubes operating at the
same tube potential to improve temporal resolution, in an “obese” mode, to permit wider range
of tube currents at low or high tube potential, or in a dual-energy mode using a different
polychromatic x-ray spectra (41). The difference in the dissemination and absorption of the
photons, with different energy in different tissue types, makes it possible to display this as
differences in the greyscale of the images obtained from the various x-ray tubes.
19
10
(a) (b)
Figure1. X-ray tubes, detectors and field of view in an older system of dual-energy computed
tomography (a) and a new system of dual-energy computed tomography (b) with a wider field of
view thanks to wider detector B.
Measurement and analysis of these small differences can contribute to chemical differentiation
of tissue types. Because of the photoelectric effect, this works especially well in tissues and
materials with large atomic numbers; iodine and calcium are two of these. Dual-energy CT has
been shown to be useful for subtracting bone or calcium at CT, allowing a virtual, non-contrast-
enhanced image to be produced from a sequence where contrast agents have been given
intravenously. It makes it possible to avoid one extra CT series without intravenous contrast
agents, and instead produces this virtually, saving the patient the radiation dose from one series.
The recent introduction of a next generation of dual-energy computed tomography (Somatom
Definition Flash, Siemens Medical Systems, Forchheim, Germany) opens up the possibility of
obtaining images with lower dosage compared to what was possible with previous generations of
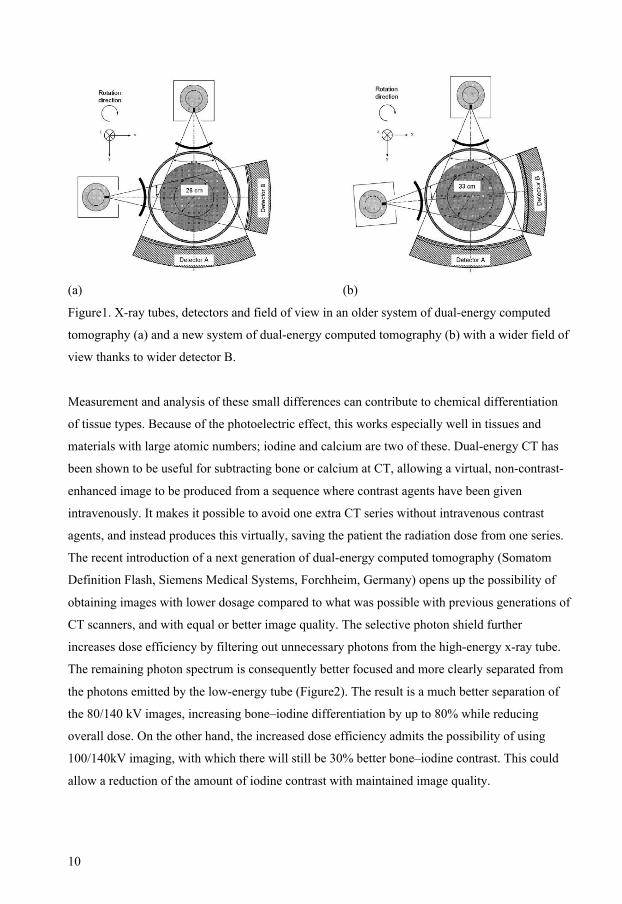
CT scanners, and with equal or better image quality. The selective photon shield further
increases dose efficiency by filtering out unnecessary photons from the high-energy x-ray tube.
The remaining photon spectrum is consequently better focused and more clearly separated from
the photons emitted by the low-energy tube (Figure2). The result is a much better separation of
the 80/140 kV images, increasing bone–iodine differentiation by up to 80% while reducing
overall dose. On the other hand, the increased dose efficiency admits the possibility of using
100/140kV imaging, with which there will still be 30% better bone–iodine contrast. This could
allow a reduction of the amount of iodine contrast with maintained image quality.
20
11
(a) (b)
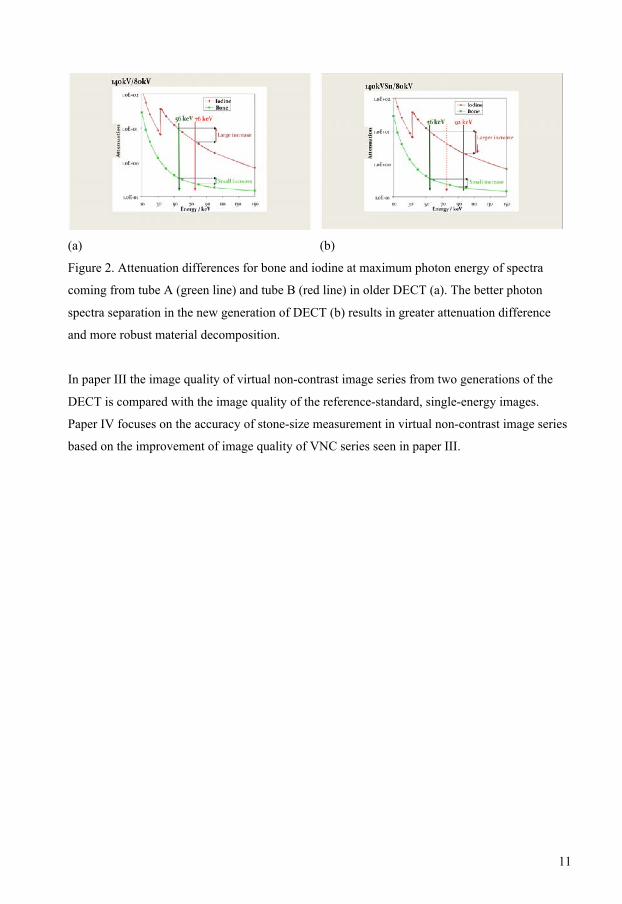
Figure 2. Attenuation differences for bone and iodine at maximum photon energy of spectra
coming from tube A (green line) and tube B (red line) in older DECT (a). The better photon
spectra separation in the new generation of DECT (b) results in greater attenuation difference
and more robust material decomposition.
In paper III the image quality of virtual non-contrast image series from two generations of the
DECT is compared with the image quality of the reference-standard, single-energy images.
Paper IV focuses on the accuracy of stone-size measurement in virtual non-contrast image series
based on the improvement of image quality of VNC series seen in paper III.
21

12
22
13
2. Aims The general purpose of this thesis was to study how image quality can be measured during the
introduction of a new technology in diagnostic radiology using observer/diagnostic performance
methods, and how measured image quality influences diagnostic accuracy and examination
methods.
The specific aims of each paper were:
I. to evaluate the image quality of a flat-panel detector compared to storage phosphor
plates in IVU. The dose was set to give equivalent image quality as ascertained using
a contrast-detail phantom.
II. to compare three methods of preparation for excretory urography: bowel purgation
together with dietary restrictions – a method used as standard at many hospitals in
Sweden, dietary restriction alone and no preparation at all. The image quality
assessed according to European Commission criteria for excretory urography was our
primary outcome. As quality parameters of administered bowel purgation and/or of
the patient’s compliance, we assessed the amounts of residual faeces plus gas, which
was the secondary outcome of this study.
III. to compare the image quality of the non-enhanced series with a virtual non-contrast
series obtained with a dual-energy CT scanner. This comparison was performed with
images from two generations of DECT scanners. CT of the urinary tract was used as a
model.
IV. to assess the accuracy of measurement of renal calculi in dual-energy virtual non-
enhanced image series compare to actual stone size and single-energy image series in
the phantom study.
23

14
24
15
3. Material and Methods
3.1. Evaluated systems
3.1.1. Studies I and II The system to be evaluated is a flat-panel detector (Trixell 4600, Thales Electron Devices,
Vélizy, France) mounted on a Bucky table (Digital Diagnost, Philips Medical Systems,
Eindhoven, The Netherlands) and integrated into a picture-archiving communication system
(Sectra IMTEC AB, Linköping, Sweden). The scintillator material is CsI/Tl with a thickness of
550 µm. In the case of our 43 x 43 cm2 detector, the pixel size is 143 µm, resulting in a matrix of
3000 x 3000 pixels.
The image quality obtained with storage phosphor plates (PCR, Philips Medical Systems) was
used as a reference. The image format was 35 × 43 cm, with a matrix of 1,760 × 2,140 pixels,
equivalent to a pixel size of 200 µm. The storage phosphor system was set at an exposure level
equivalent to a 200-speed system, which was the clinical setting. In the study images were
obtained before administration of intravenous contrast medium and using standard settings for
IVU: 110 cm-focus detector distance, filtration 4.5-mm Al, x-ray field 35 × 43 cm and tube
potential 70 kV using storage phosphor plates.
3.1.2. Studies III and IV Dual-energy computed tomography (Somatom Definition, Siemens Medical Systems,
Forchheim, Germany) was evaluated in the first part of study III. In the second part of study III
and in study IV a new generation of the dual-source CT systems (Somatom Definition Flash,
Siemens Medical Systems, Forchheim, Germany) was evaluated. The standard protocol used in
both systems at the time of study III is listed in table1. The vendor recommended all tube
potential settings. Automatic tube current modulation was active (CARE Dose, Siemens) during
examinations.
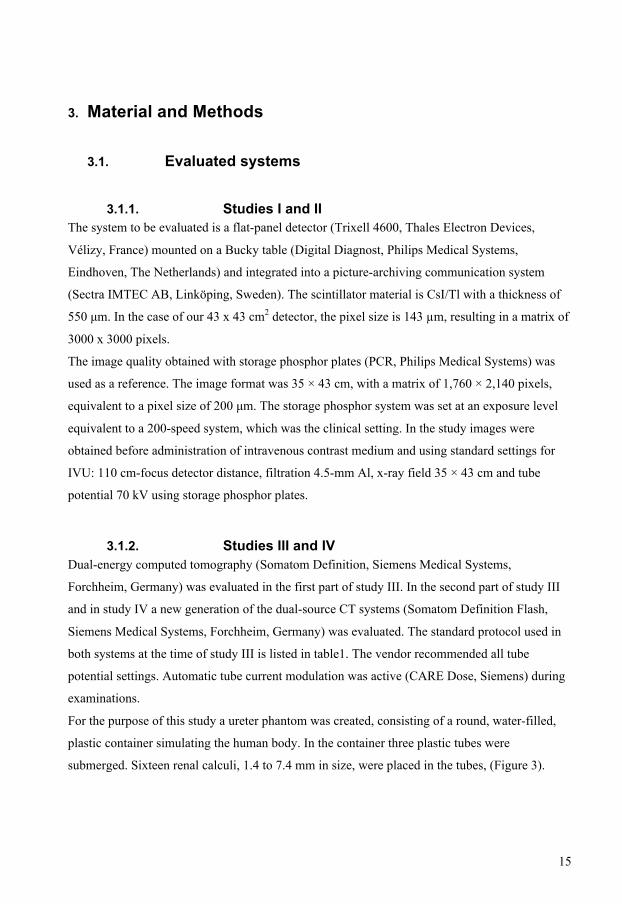
For the purpose of this study a ureter phantom was created, consisting of a round, water-filled,
plastic container simulating the human body. In the container three plastic tubes were
submerged. Sixteen renal calculi, 1.4 to 7.4 mm in size, were placed in the tubes, (Figure 3).
25
16
Figure 3. The ureter phantom.
All stones larger than 2 mm were measured manually in all three dimensions. The orientation of
the callipers was adjusted until the largest stone dimension was determined (length). Then width
and depth were measured for all stones larger than 2 mm. Only one dimension could be
measured for smaller calculi. The size of the calculi was measured with electronic digital
callipers, the display being reset to zero between measurements. The position of the stones in the
plastic tubes was fixed with a piece of sponge either side of each calculus. The sponge was
invisible on the computed tomography images. The ureter phantom tubes containing calculi were
placed eccentric in the water-filled phantom to avoid artefacts.
In study IV the phantom was scanned with dual-energy CT (Somatom Definition Flash, Siemens
Medical Systems, Forchheim, Germany) at three different radiation-dose settings with single and
dual energy.
3.2. Study design and intervention The local ethics committee approved studies I–III. According to Swedish law, the approval by
the ethics committee of study IV as a phantom study was not necessary.
3.2.1. Study I This study consists of two parts.
In the first part of our study were able to ascertain that we could achieve a 70% dose reduction
and equal image quality with a flat-panel system.
26

17
We did this by first producing a reference image of CDRAD phantom, using the storage
phosphor plate system with automatic exposure control and standard settings for IVU, and
several images obtained using a flat-panel system and varying tube charge (mAs). We then made
a calculation of the image quality figure (IQF) for these images.
(a) Image of CDRAD phantom (b) IQF graph
Figure 4. The observer has to indicate in which corner of the square the hole is located (a). From
this data a graph (b) can be drawn of the just visible objects and a numerical value, the image
quality figure (IQF), can be calculated. A lower IQF indicates better image quality.
In the second part of the study thirty patients were examined using the storage phosphor plate
system and automatic exposure for IVU. The tube charge was noted and used as a reference for
70% reduction of tube charge when obtaining the identical overview image with a flat-panel
system (Figure 5.) The image quality of the image pairs was assessed by three radiologists
according to the image criteria of the European Guidelines for IVU before administration of
intravenous contrast media.
27
18
Figure 5. To the left a storage phosphor plate reference image, to the right a flat-panel detector
image of the same patient.
3.2.2. Study II The study comprised consecutive ambulatory patients older than 15 years who were referred for
excretory urography. Exclusion criteria were contraindications to laxatives, such as small bowel
stoma, colostomy and previous colon resection.
All patients who gave their informed consent were randomly assigned to one of three preparation
methods.
3.2.2.1. Intervention The first group (group 1) received our standard preparation, consisting of 2 litres polyethylene
glycol electrolyte solution (Laxabon®, Astra-Zeneca, Mölndal, Sweden). The patients were
instructed to fast for four hours before starting the laxative treatment and to drink the laxative
solution in the afternoon the day before the examination. The second group (group 2) was
instructed to fast for twelve hours before the examination, and group 3 had no preparation at all.
Irrespective of preparation all patients underwent the same examination procedure. The
examining radiographer was unaware of the patients’ preparation group.
Initial survey images of the abdomen were obtained, after which the contrast medium iohexol
300 mg/ml (Omnipaque, GE Healthcare) was administered intravenously. The dose was 40 ml in
all patients weighing under 80 kg and 50 ml in those weighing above 80 kg. Standard
nephrographic and pyelographic effect images were then obtained, first with and then without
urethral compression. The exact examination technique is described in Table 1.
28
19
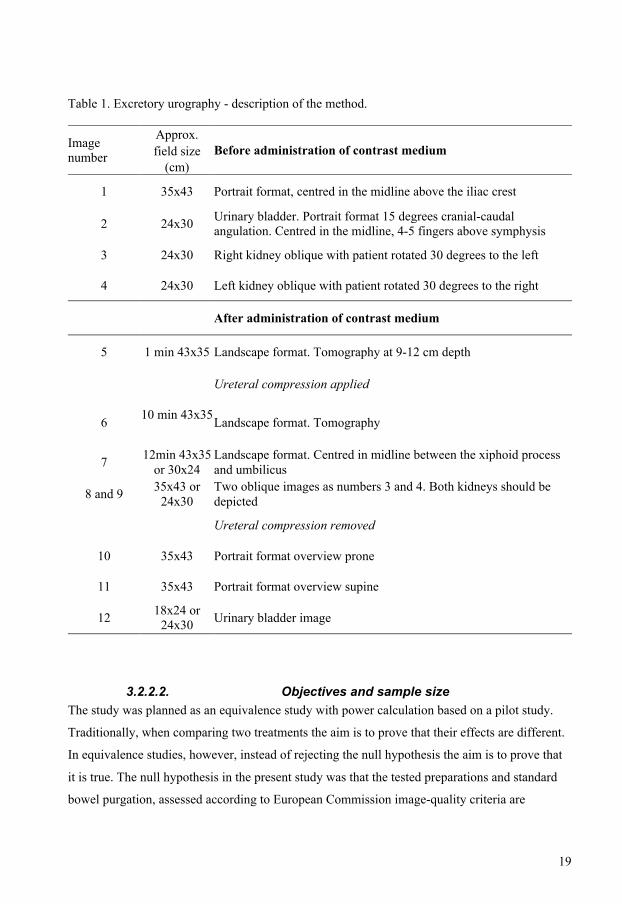
Table 1. Excretory urography - description of the method.
Approx. field size Image
number (cm)
Before administration of contrast medium
1 35x43 Portrait format, centred in the midline above the iliac crest
2 24x30 Urinary bladder. Portrait format 15 degrees cranial-caudal angulation. Centred in the midline, 4-5 fingers above symphysis
3 24x30 Right kidney oblique with patient rotated 30 degrees to the left
4 24x30 Left kidney oblique with patient rotated 30 degrees to the right
After administration of contrast medium
5 1 min 43x35 Landscape format. Tomography at 9-12 cm depth
Ureteral compression applied
10 min 43x35 6
Landscape format. Tomography
7 12min 43x35 or 30x24
Landscape format. Centred in midline between the xiphoid process and umbilicus
8 and 9 35x43 or 24x30
Two oblique images as numbers 3 and 4. Both kidneys should be depicted
Ureteral compression removed
10 35x43 Portrait format overview prone
11 35x43 Portrait format overview supine
12 18x24 or 24x30 Urinary bladder image
3.2.2.2. Objectives and sample size The study was planned as an equivalence study with power calculation based on a pilot study.
Traditionally, when comparing two treatments the aim is to prove that their effects are different.
In equivalence studies, however, instead of rejecting the null hypothesis the aim is to prove that
it is true. The null hypothesis in the present study was that the tested preparations and standard
bowel purgation, assessed according to European Commission image-quality criteria are
29

20
equivalent. Equivalency was defined as a difference not larger than 0.5 points in European
Commission score where the maximum score was 9. The sample size was based on power
analysis with the power set to 90% at a 5% significance level. This resulted in 44 participants per
group, a total of approximately 150 patients.
3.2.2.3. Randomisation Blocked randomisation was used, with 30 patients per block. An even allocation ratio was
obtained using the computer random-number generator. The various preparation descriptions
were concealed in sequentially numbered, sealed, opaque envelopes and kept by our appointment
staff.
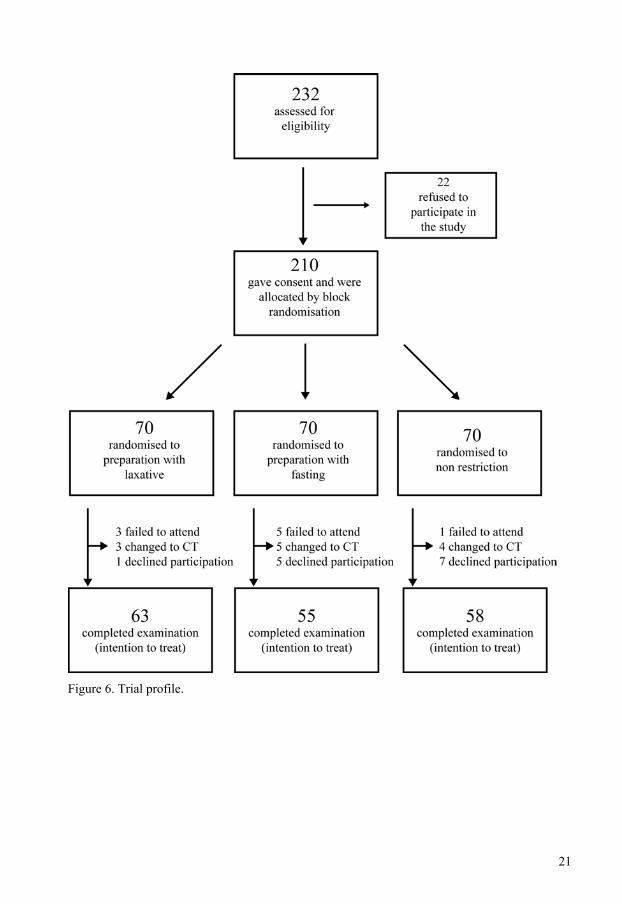
A letter with information about this study was sent to 232 consecutive outpatients admitted for
excretory urography. All patients were asked to telephone our department to schedule the
examination and to give consent to inclusion in the study. None of the patients received
information about an allocation group on the telephone. The appointment staff assigned the
randomisation envelopes in sequential order, opened them, filled in the numbered randomisation
protocol and finally mailed the preparation instructions to the patients. They kept the
randomisation protocol until the study was completed. Figure 6 describes the trial profile.
Patients who declined to participate in the study received the departments standard bowel
preparation, which at that time consisted of bowel purgation and dietary restriction. Patients who
chose to participate in the study received a letter with confirmation of the examination time and
preparation instructions
30
21
Figure 6. Trial profile.
31
22
3.2.3. Study III
3.2.3.1. Study design The study population consists of two groups of adult patients referred for CT of the urinary tract
as an evaluation of haematuria. The mean age in the first group was 55.7 years (n = 30, range
27–80), and in the second group 54.6 years (n = 30, range 20–87). The mean anteroposterior
diameter of the body in the umbilicus level was 23 cm in the first group, and 25 cm in the second
group.
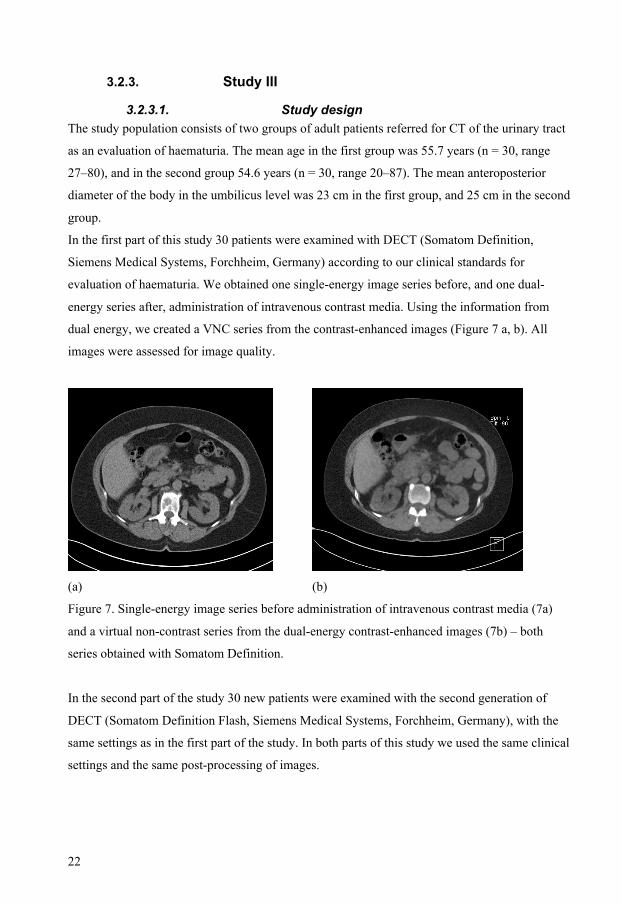
In the first part of this study 30 patients were examined with DECT (Somatom Definition,
Siemens Medical Systems, Forchheim, Germany) according to our clinical standards for
evaluation of haematuria. We obtained one single-energy image series before, and one dual-
energy series after, administration of intravenous contrast media. Using the information from
dual energy, we created a VNC series from the contrast-enhanced images (Figure 7 a, b). All
images were assessed for image quality.
(a) (b)
Figure 7. Single-energy image series before administration of intravenous contrast media (7a)
and a virtual non-contrast series from the dual-energy contrast-enhanced images (7b) – both
series obtained with Somatom Definition.
In the second part of the study 30 new patients were examined with the second generation of
DECT (Somatom Definition Flash, Siemens Medical Systems, Forchheim, Germany), with the
same settings as in the first part of the study. In both parts of this study we used the same clinical
settings and the same post-processing of images.
32
23
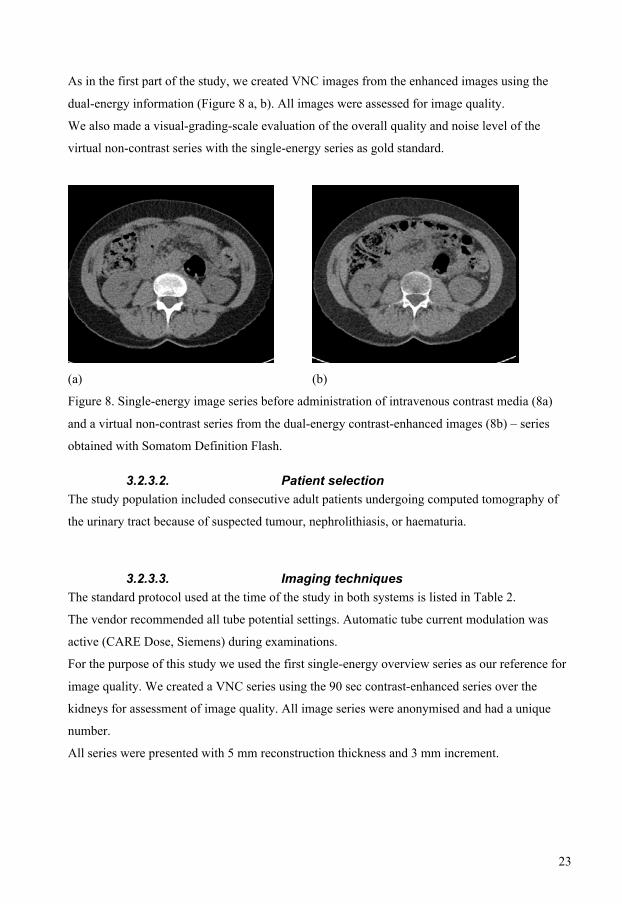
As in the first part of the study, we created VNC images from the enhanced images using the
dual-energy information (Figure 8 a, b). All images were assessed for image quality.
We also made a visual-grading-scale evaluation of the overall quality and noise level of the
virtual non-contrast series with the single-energy series as gold standard.
(a) (b)
Figure 8. Single-energy image series before administration of intravenous contrast media (8a)
and a virtual non-contrast series from the dual-energy contrast-enhanced images (8b) – series
obtained with Somatom Definition Flash.
3.2.3.2. Patient selection The study population included consecutive adult patients undergoing computed tomography of
the urinary tract because of suspected tumour, nephrolithiasis, or haematuria.
3.2.3.3. Imaging techniques The standard protocol used at the time of the study in both systems is listed in Table 2.
The vendor recommended all tube potential settings. Automatic tube current modulation was
active (CARE Dose, Siemens) during examinations.
For the purpose of this study we used the first single-energy overview series as our reference for
image quality. We created a VNC series using the 90 sec contrast-enhanced series over the
kidneys for assessment of image quality. All image series were anonymised and had a unique
number.
All series were presented with 5 mm reconstruction thickness and 3 mm increment.
33

24
Table 2. Imaging protocols for dual-energy CT urography for adults. Series 1 and 4 were not
used in the study.
Definition Flash kV tube kV tube kV tube kV tube Series
number Series description A B A B
1 Scout view 120 120
2 Urinary tract overview before administration of i.v. contrast medium
120 120
3 Dual-energy kidneys 90 sec after administration of i.v. contrast medium
80 140 100 140
4
Dual-energy urinary tract overview 10 min after administration of i.v. contrast medium
80 140 100 140
3.2.4. Study IV
3.2.4.1. Study design The study consisted of two parts.
In the first part of the study the phantom tubes containing calculi were filled with water. All air
bubbles were carefully removed.
The phantom was scanned with dual-energy CT (Somatom Definition Flash, Siemens Medical
Systems, Forchheim, Germany) at three different radiation-dose settings with single and dual
energy. The single-energy image series were obtained with 120 kV. The highest tube-charge
setting with 200 mAs corresponds to the standard tube current in the evaluation of haematuria.
Two lower settings, 60 mAs and 20 mAs, were also used to simulate conditions in larger
patients. The 60 mAs setting also corresponds to our clinical standard for evaluation of urinary
calculi. The dual-energy image series were obtained with 80/140 kV and 100/140 kV. At each
energy level CDTI were set equal for single and dual-energy. Further details about the settings
are given in Table 3.
In the second part of the study, the water in the tubes was replaced with intravenous contrast-
medium solution (Omnipaque 300 mg/ml, GE Healthcare, Stockholm, Sweden); the
34

25
concentration was chosen to give an attenuation close to that seen in human ureters. The dual-
energy image series were obtained with 80/140 kV and 100/140 kV. At each energy setting
CDTI values were kept constant compared to the CTDI of the single-energy series.
Table 3. Details about the energy, tube current and CDTI values in three image series. The
reference mAs value with the single energy, written in bold, and corresponding mAs values in
dual energy with two different tube energies to keep constant CDTI. Field of view, scan length
and table speed are constant.
Image series 1 High dose level kV tube mAs CDTI
Single-energy 120 A 200 6.43 80 A 467 Dual-energy 140 B 180 6.43
100 A 207 Dual-energy 140/Sn B 160 6.43
Image series 2 Medium dose level kV tube mAs CDTI
Single energy 120 A 60 1.57 80 A 98 Dual-energy 140 B 38 1.57
100 A 44 Dual-energy 140/Sn B 34 1.57
Image series 3 Low dose level kV tube mAs CDTI
Single energy 120 A 20 0.71 80 A 38 Dual-energy 140 B 15 0.71
100 A 11 Dual-energy 140/Sn B 9 0.71
We created a VNC series using the contrast-enhanced series for assessment of detectability and
size of the calculi. All series were reviewed with 3 mm reconstruction thickness and 1.5 mm
increment. Sagittal reformatted images were obtained with 3 mm increment. All information
about settings was removed from images. Each series had a unique number. In total, 15 image
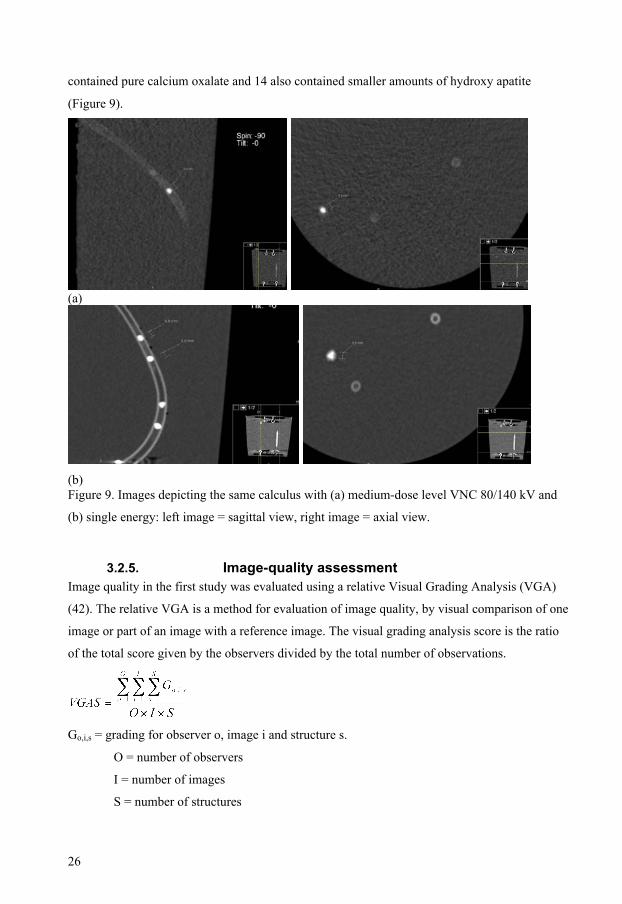
series were assessed for stone visibility and size. When calculations were completed a chemical
analysis of the calculi was performed. All calculi contained calcium oxalate; two calculi
35
26
contained pure calcium oxalate and 14 also contained smaller amounts of hydroxy apatite
(Figure 9).
(a)
(b) Figure 9. Images depicting the same calculus with (a) medium-dose level VNC 80/140 kV and
(b) single energy: left image = sagittal view, right image = axial view.
3.2.5. Image-quality assessment Image quality in the first study was evaluated using a relative Visual Grading Analysis (VGA)
(42). The relative VGA is a method for evaluation of image quality, by visual comparison of one
image or part of an image with a reference image. The visual grading analysis score is the ratio
of the total score given by the observers divided by the total number of observations.
Go,i,s = grading for observer o, image i and structure s.
O = number of observers
I = number of images
S = number of structures
36

27
We evaluated abdominal overview images (before administration of IV contrast medium and
without ureteral compression). All images were evaluated on the same calibrated monitor
(MultiSync LCD1880SX, NEC, Tokyo, Japan) to avoid variations between different monitors.
Zooming and alteration of the greyscale was allowed. The comparison was performed according
to the image criteria of the European Guidelines for IV urography before contrast medium
administration (1) and two additional criteria for the evaluation of lumbar-spine images. The
criteria that we used are listed in Table 4.
Table 4. The criteria used for image-quality assessment of clinical images. Criterion number Description
1 Reproduction of the area of the whole urinary tract from the upper pole of the kidney to the base of the bladder
2 Reproduction of the kidneys outlines 3 Visualisation of the psoas outlines 4 Visually sharp reproduction of the bones 5 Visually sharp reproduction, as a single line, of the upper plate surfaces in the centred beam area
6 Visually sharp reproduction of the cortex and the trabecular structures
7 Noise 8 Overall quality
Each structure was independently scored on a five-level scale. Taking 0 as the score for an image
equal to the reference image, −1 was worse and −2 much worse, while 1 was better and 2 much
better. The overall quality of the image was evaluated in the same way. We added “noise” to the
EU criteria as an assessment of the level of noise that was accepted by the radiologists. A score
of −2 was assessed as much more noise compared to the reference image, −1 as more, 0 as equal,
1 as less noise and 2 as much less noise. As an objective comparison of noise level in the image
pairs, we also measured the noise as the standard deviation of the pixel values within a circular
region of interest (ROI) placed in the images in an area where the anatomical noise was spatially
invariant. ROI size and placement was identical within the image pair but could vary between
image pairs.
In the second study, Image Criteria Score (ICS) was used for evaluation of the image quality
according to the European Commission criteria for excretory urography (2). The criteria are
listed in Table 5.
37
28
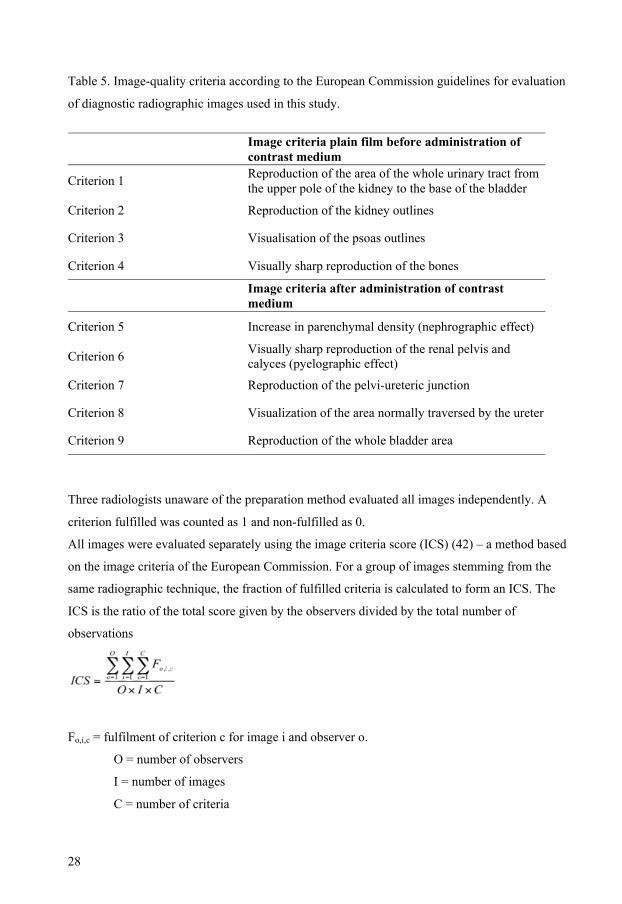
Table 5. Image-quality criteria according to the European Commission guidelines for evaluation
of diagnostic radiographic images used in this study.
Image criteria plain film before administration of contrast medium
Criterion 1 Reproduction of the area of the whole urinary tract from the upper pole of the kidney to the base of the bladder
Criterion 2 Reproduction of the kidney outlines
Criterion 3 Visualisation of the psoas outlines
Criterion 4 Visually sharp reproduction of the bones
Image criteria after administration of contrast medium
Criterion 5 Increase in parenchymal density (nephrographic effect)
Criterion 6 Visually sharp reproduction of the renal pelvis and calyces (pyelographic effect)
Criterion 7 Reproduction of the pelvi-ureteric junction
Criterion 8 Visualization of the area normally traversed by the ureter
Criterion 9 Reproduction of the whole bladder area
Three radiologists unaware of the preparation method evaluated all images independently. A
criterion fulfilled was counted as 1 and non-fulfilled as 0.
All images were evaluated separately using the image criteria score (ICS) (42) – a method based
on the image criteria of the European Commission. For a group of images stemming from the
same radiographic technique, the fraction of fulfilled criteria is calculated to form an ICS. The
ICS is the ratio of the total score given by the observers divided by the total number of
observations
Fo,i,c = fulfilment of criterion c for image i and observer o.
O = number of observers
I = number of images
C = number of criteria
38
29
The definition implies that the ICS can be used as a score for individual images, criteria and
observers.
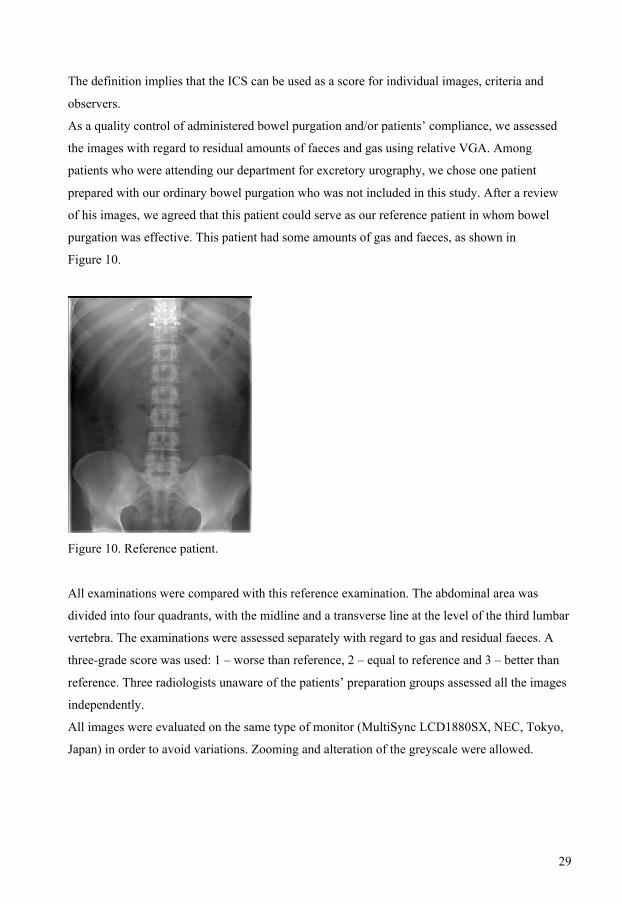
As a quality control of administered bowel purgation and/or patients’ compliance, we assessed
the images with regard to residual amounts of faeces and gas using relative VGA. Among
patients who were attending our department for excretory urography, we chose one patient
prepared with our ordinary bowel purgation who was not included in this study. After a review
of his images, we agreed that this patient could serve as our reference patient in whom bowel
purgation was effective. This patient had some amounts of gas and faeces, as shown in
Figure 10.
Figure 10. Reference patient.
All examinations were compared with this reference examination. The abdominal area was
divided into four quadrants, with the midline and a transverse line at the level of the third lumbar
vertebra. The examinations were assessed separately with regard to gas and residual faeces. A
three-grade score was used: 1 – worse than reference, 2 – equal to reference and 3 – better than
reference. Three radiologists unaware of the patients’ preparation groups assessed all the images
independently.
All images were evaluated on the same type of monitor (MultiSync LCD1880SX, NEC, Tokyo,
Japan) in order to avoid variations. Zooming and alteration of the greyscale were allowed.
39
30
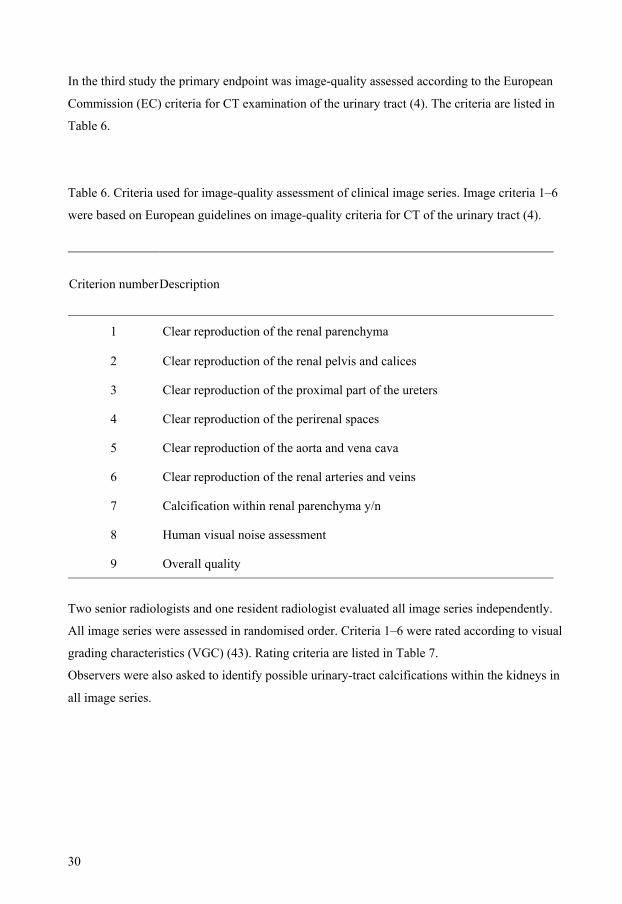
In the third study the primary endpoint was image-quality assessed according to the European
Commission (EC) criteria for CT examination of the urinary tract (4). The criteria are listed in
Table 6.
Table 6. Criteria used for image-quality assessment of clinical image series. Image criteria 1–6
were based on European guidelines on image-quality criteria for CT of the urinary tract (4).
Criterion number Description
1 Clear reproduction of the renal parenchyma
2 Clear reproduction of the renal pelvis and calices
3 Clear reproduction of the proximal part of the ureters
4 Clear reproduction of the perirenal spaces
5 Clear reproduction of the aorta and vena cava
6 Clear reproduction of the renal arteries and veins
7 Calcification within renal parenchyma y/n
8 Human visual noise assessment
9 Overall quality
Two senior radiologists and one resident radiologist evaluated all image series independently.
All image series were assessed in randomised order. Criteria 1–6 were rated according to visual
grading characteristics (VGC) (43). Rating criteria are listed in Table 7.
Observers were also asked to identify possible urinary-tract calcifications within the kidneys in
all image series.
40

31
Table 7. Rating criteria for assessment of image quality criteria 1- 6. The criteria are listed in
Table 6.
Description
1 - Confident that the criterion is not fulfilled
2 - Somewhat confident that the criterion is not fulfilled
3 - Indecisive as to whether the criterion is fulfilled or not
4 - Somewhat confident that the criterion is fulfilled
5 - Confident that the criterion is fulfilled
Together with the EC quality criteria, we added “noise” as an assessment of the level of noise
that was accepted by the radiologists and “overall quality of the image series” as a subjective
judgment of the suitability of the image series for clinical diagnosis. In this part of the study the
VNC image series were compared in pairs with the accompanying single-energy series obtained
before administration of contrast media. In the noise evaluation a score of −2 was assessed as
much more noise compared with the reference image series, −1 as more, 0 as equal, 1 as less
noise, and 2 as much less noise.
41
32
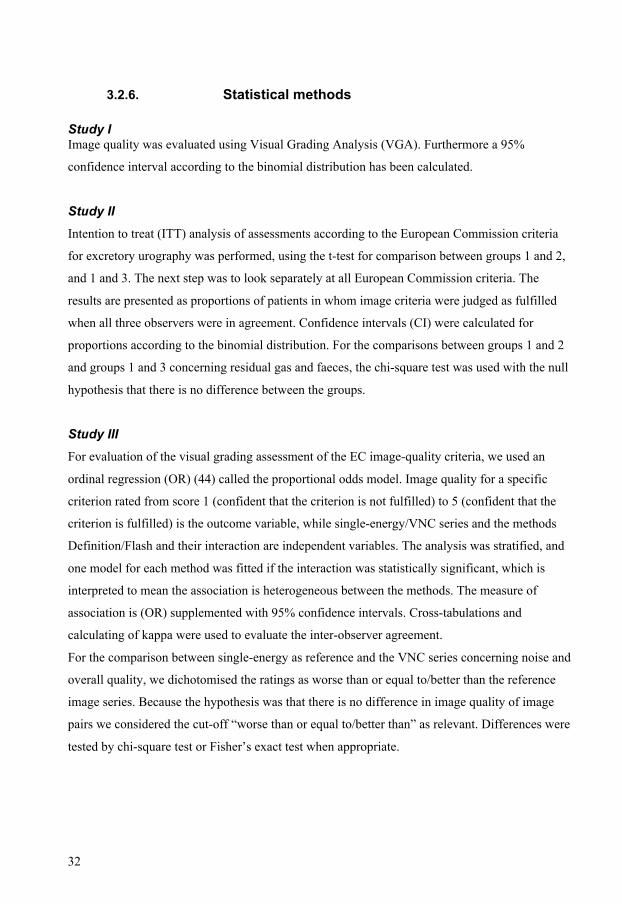
3.2.6. Statistical methods Study I Image quality was evaluated using Visual Grading Analysis (VGA). Furthermore a 95%
confidence interval according to the binomial distribution has been calculated.
Study II Intention to treat (ITT) analysis of assessments according to the European Commission criteria
for excretory urography was performed, using the t-test for comparison between groups 1 and 2,
and 1 and 3. The next step was to look separately at all European Commission criteria. The
results are presented as proportions of patients in whom image criteria were judged as fulfilled
when all three observers were in agreement. Confidence intervals (CI) were calculated for
proportions according to the binomial distribution. For the comparisons between groups 1 and 2
and groups 1 and 3 concerning residual gas and faeces, the chi-square test was used with the null
hypothesis that there is no difference between the groups.
Study III For evaluation of the visual grading assessment of the EC image-quality criteria, we used an
ordinal regression (OR) (44) called the proportional odds model. Image quality for a specific
criterion rated from score 1 (confident that the criterion is not fulfilled) to 5 (confident that the
criterion is fulfilled) is the outcome variable, while single-energy/VNC series and the methods
Definition/Flash and their interaction are independent variables. The analysis was stratified, and
one model for each method was fitted if the interaction was statistically significant, which is
interpreted to mean the association is heterogeneous between the methods. The measure of
association is (OR) supplemented with 95% confidence intervals. Cross-tabulations and
calculating of kappa were used to evaluate the inter-observer agreement.
For the comparison between single-energy as reference and the VNC series concerning noise and
overall quality, we dichotomised the ratings as worse than or equal to/better than the reference
image series. Because the hypothesis was that there is no difference in image quality of image
pairs we considered the cut-off “worse than or equal to/better than” as relevant. Differences were
tested by chi-square test or Fisher’s exact test when appropriate.
42
33
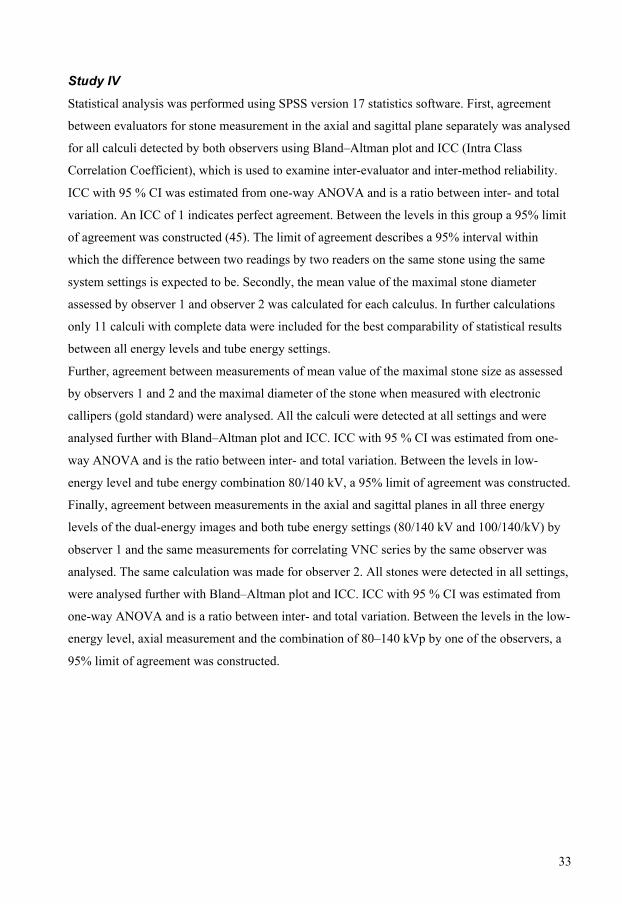
Study IV
Statistical analysis was performed using SPSS version 17 statistics software. First, agreement
between evaluators for stone measurement in the axial and sagittal plane separately was analysed
for all calculi detected by both observers using Bland–Altman plot and ICC (Intra Class
Correlation Coefficient), which is used to examine inter-evaluator and inter-method reliability.
ICC with 95 % CI was estimated from one-way ANOVA and is a ratio between inter- and total
variation. An ICC of 1 indicates perfect agreement. Between the levels in this group a 95% limit
of agreement was constructed (45). The limit of agreement describes a 95% interval within
which the difference between two readings by two readers on the same stone using the same
system settings is expected to be. Secondly, the mean value of the maximal stone diameter
assessed by observer 1 and observer 2 was calculated for each calculus. In further calculations
only 11 calculi with complete data were included for the best comparability of statistical results
between all energy levels and tube energy settings.
Further, agreement between measurements of mean value of the maximal stone size as assessed
by observers 1 and 2 and the maximal diameter of the stone when measured with electronic
callipers (gold standard) were analysed. All the calculi were detected at all settings and were
analysed further with Bland–Altman plot and ICC. ICC with 95 % CI was estimated from one-
way ANOVA and is the ratio between inter- and total variation. Between the levels in low-
energy level and tube energy combination 80/140 kV, a 95% limit of agreement was constructed.
Finally, agreement between measurements in the axial and sagittal planes in all three energy
levels of the dual-energy images and both tube energy settings (80/140 kV and 100/140/kV) by
observer 1 and the same measurements for correlating VNC series by the same observer was
analysed. The same calculation was made for observer 2. All stones were detected in all settings,
were analysed further with Bland–Altman plot and ICC. ICC with 95 % CI was estimated from
one-way ANOVA and is a ratio between inter- and total variation. Between the levels in the low-
energy level, axial measurement and the combination of 80–140 kVp by one of the observers, a
95% limit of agreement was constructed.
43

34
44

35
4. Results Study I In the phantom study equivalent image quality for the flat-panel system was reached at 12.5
mAs, that is, at 25 % of the dose for storage phosphor plates. Table 8 shows the tube charge
(mAs) values, corresponding entrance surface dose and resulting IQF values for automatic
exposure with storage phosphor plates and with different settings for the flat-panel system – a
lower IQF indicates better image quality.
Table 8. Exposure values, entrance surface dose and image quality for the evaluated
systems for CDRAD phantom images.
Imaging system
Tube charge mAs
Entrance surface dose
(ESD) mGy
% of ESD Image quality
figure (IQF)
Inter observer SD
Storage phosphor
plates 54.5 2.09 100 43 2.0
40 1.64 78 29 0.6
25 1.04 50 37 1.7
20 0.83 39 37 1.5
16 0.66 32 39 2.5
12.5 0.52 25 41 3.2
10 0.41 20 48 5.5
6.3 0.26 12 69 7.6
Flat-panel detector
4 0.17 8 81 9.5
The results of the visual grading analysis in the clinical study showed that flat-panel images,
when compared with the reference storage phosphor image, had almost equal image quality for
all six European guidelines criteria, VGAS >0 (VGAS= 0.03). Furthermore 95% CI according to
the binomial distribution has been calculated. The results of the assessment of all criteria
separately are shown in Table 9.
45
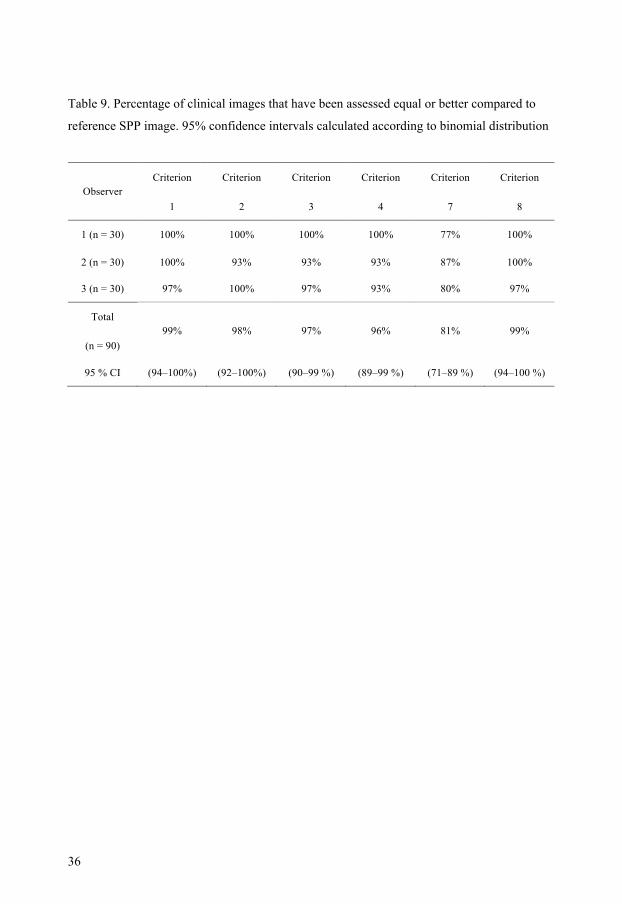
36
Table 9. Percentage of clinical images that have been assessed equal or better compared to
reference SPP image. 95% confidence intervals calculated according to binomial distribution
Criterion Criterion Criterion Criterion Criterion Criterion Observer
1 2 3 4 7 8
1 (n = 30) 100% 100% 100% 100% 77% 100%
2 (n = 30) 100% 93% 93% 93% 87% 100%
3 (n = 30) 97% 100% 97% 93% 80% 97%
Total
(n = 90) 99% 98% 97% 96% 81% 99%
95 % CI (94–100%) (92–100%) (90–99 %) (89–99 %) (71–89 %) (94–100 %)
46
37
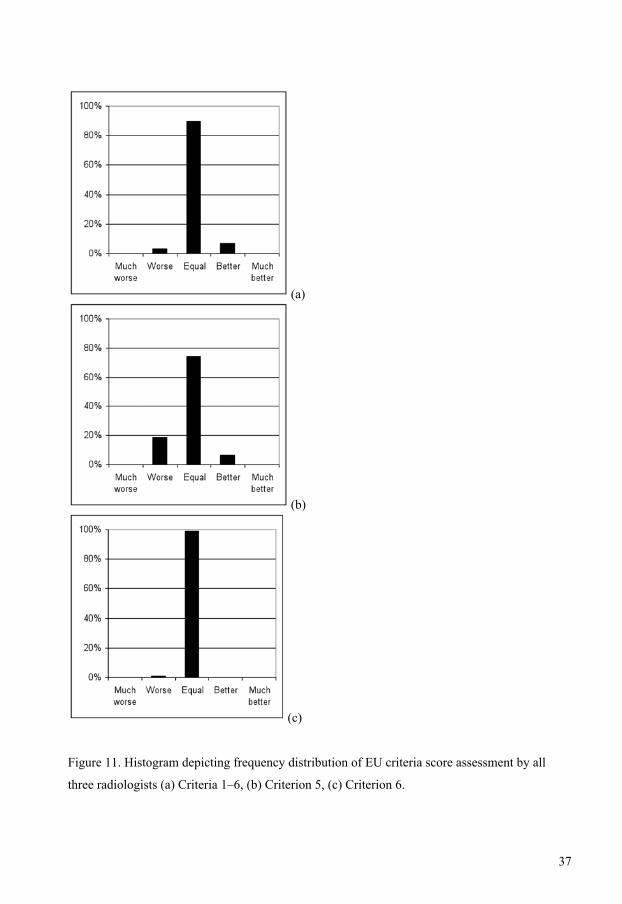
(a)
(b)
(c)
Figure 11. Histogram depicting frequency distribution of EU criteria score assessment by all
three radiologists (a) Criteria 1–6, (b) Criterion 5, (c) Criterion 6.
47

38
Study II
The intention-to-treat analysis of image-quality criteria using the t-test showed that the
difference between groups 1 and 3 is 0.00 (95% CI −0.19 to 0.19; p=0.99) and between groups 1
and 3 −0.04 (CI −0.24 to 0.15; p=0.66). In the power analysis, equivalence was defined as a
difference between population means not larger than 0.5 points. The confidence intervals were in
between those values.
The analysis of all European Commission criteria separately showed no statistically significant
difference between groups (Table 10).
Table 10. The result of the assessment of examinations in all three preparation groups according
to the European Guidelines for image-quality criteria. The percentages are the proportions of
patients in whom the criterion was considered to be fulfilled by all three observers. A 95%
confidence interval was calculated according to binomial distribution for comparison between
preparation groups 1 and 2, and between preparation groups 1 and 3.
Preparation Preparation Preparation
group 1 group 2 group 3 Criterion number
(n = 63) (n = 55) (n = 58)
Group1-Group2 (95% CI)
Group1-Group3 (95% CI)
−3 % −3 % 1 95% 98% 98% (−9% to 3%) (−9% to 3%)
6 % −7 % 2 43% 36% 50% (−11% to24%) (−2% to 11%) 1 % −1 % 3 92% 91% 93% (−9% to 11%) (−10% to 8%) 2 % 2 % 4 100% 98% 98% (−2% to 5%) (−2% to 5%) −1 % −4 % 5 92% 93% 97% (−10% to 9%) (−12% to 4%) −2 % 1 % 6 90% 93% 90% (−12% to 8%) (−10% to11%) −4 % −3 % 7 92% 96% 95% (−13% to 4%) (−12% to 6%) −2 % 0 % 8 98% 100% 98% (−5% to 1%) (−4% to 5%) 0 % −2 % 9 98% 98% 100% (−4% to 5%) (−5% to 1%)
48

39
A criterion was considered to be fulfilled only when all three observers were in agreement.
Criterion number 2, that is, kidney outlines before intravenous contrast administration, had the
lowest score in all three groups, without any significant differences between the three groups.
These results are supported by the ICS assessment, in which no significant difference was found
between the evaluated groups (Table 11).
Table 11. The result of assessment of examinations in all three preparation groups using the
image criteria score ICS (a – before contrast administration, b – after IV contrast administration).
ICS is the total score given by the observers divided by the total number of observations. The
95% confidence interval was calculated according to the binomial distribution for comparison
between preparation groups 1 and 2, and preparation groups 1 and 3.
Preparation Preparation Preparation
group 1 group 2 group 3
(n = 63) (n = 55) (n = 58)
Group1-Group2 (95% CI)
Group1-Group3 (95% CI)
7 % −9 % ICS- a 41% 34% 50%
(−11% to 24%) (−26% to 9%)
−6 % −5 % ICS- b 81% 87% 86%
(−19% to 7%) (−18% to 8%)
The results of purgation assessment concerning the amount of gas and faeces are shown in
Figures 12 and 13 respectively. Figure 12 shows that there is no difference between the groups
concerning residual gas. Concerning residual faeces (Figure 13) the standard bowel preparation
showed its effectiveness in the area of the right and left flexure. Significantly more patients in
group 1 than in the other two groups were assessed as equal to or better than those in the
reference examination (right flexure – group 1 vs. group 2 p < 0.001; group 1 vs. group 3 p <
0.002. In the area of the left flexure: group 1 vs. group 2 p = 0.01; group 1 vs. group 3, p = 0.05).
Figure 3 shows the equality of proportions in the areas of right and left lower quadrant. Baseline
characteristics of the patient groups are shown in Table 12.
49
40
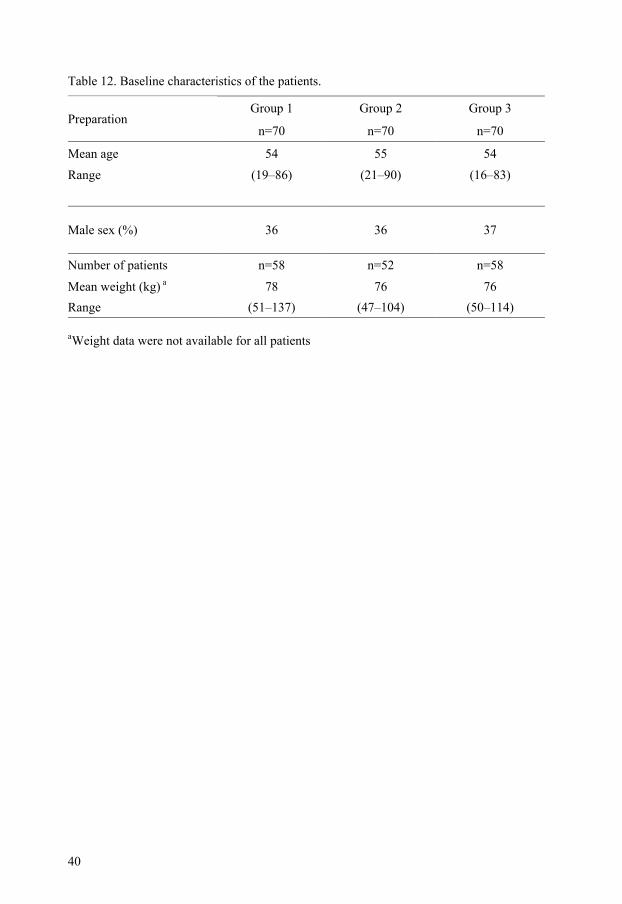
Table 12. Baseline characteristics of the patients.
Group 1 Group 2 Group 3 Preparation
n=70 n=70 n=70
Mean age 54 55 54 Range (19–86) (21–90) (16–83)
Male sex (%) 36 36 37
Number of patients n=58 n=52 n=58
Mean weight (kg) a 78 76 76 Range (51–137) (47–104) (50–114)
aWeight data were not available for all patients
50
41
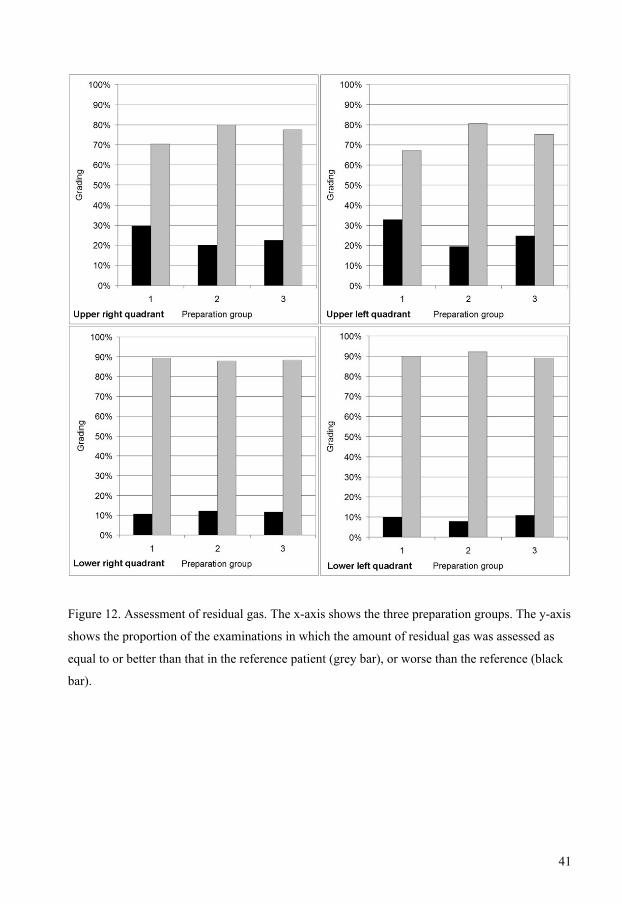
Figure 12. Assessment of residual gas. The x-axis shows the three preparation groups. The y-axis
shows the proportion of the examinations in which the amount of residual gas was assessed as
equal to or better than that in the reference patient (grey bar), or worse than the reference (black
bar).
51

42
Figure 13. Assessment of residual faeces. The y-axis shows the proportion of the examinations in
which the amount of residual faeces was assessed as equal to or better than that in the reference
patient (grey bar), or worse than the reference (black bar).
52
43
Study III
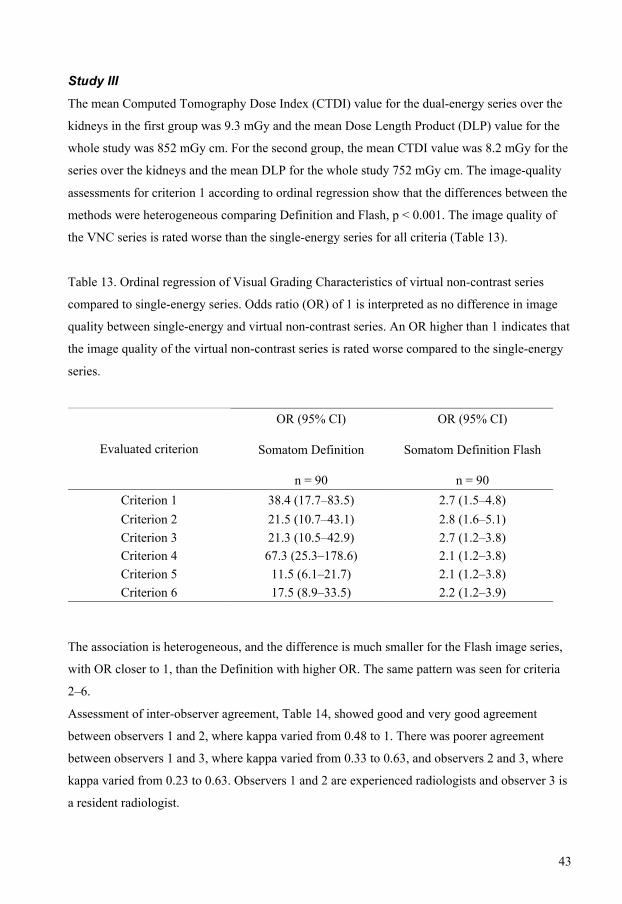
The mean Computed Tomography Dose Index (CTDI) value for the dual-energy series over the
kidneys in the first group was 9.3 mGy and the mean Dose Length Product (DLP) value for the
whole study was 852 mGy cm. For the second group, the mean CTDI value was 8.2 mGy for the
series over the kidneys and the mean DLP for the whole study 752 mGy cm. The image-quality
assessments for criterion 1 according to ordinal regression show that the differences between the
methods were heterogeneous comparing Definition and Flash, p < 0.001. The image quality of
the VNC series is rated worse than the single-energy series for all criteria (Table 13).
Table 13. Ordinal regression of Visual Grading Characteristics of virtual non-contrast series
compared to single-energy series. Odds ratio (OR) of 1 is interpreted as no difference in image
quality between single-energy and virtual non-contrast series. An OR higher than 1 indicates that
the image quality of the virtual non-contrast series is rated worse compared to the single-energy
series.
OR (95% CI) OR (95% CI)
Somatom Definition Somatom Definition Flash Evaluated criterion
n = 90 n = 90 Criterion 1 38.4 (17.7–83.5) 2.7 (1.5–4.8) Criterion 2 21.5 (10.7–43.1) 2.8 (1.6–5.1) Criterion 3 21.3 (10.5–42.9) 2.7 (1.2–3.8) Criterion 4 67.3 (25.3–178.6) 2.1 (1.2–3.8) Criterion 5 11.5 (6.1–21.7) 2.1 (1.2–3.8) Criterion 6 17.5 (8.9–33.5) 2.2 (1.2–3.9)
The association is heterogeneous, and the difference is much smaller for the Flash image series,
with OR closer to 1, than the Definition with higher OR. The same pattern was seen for criteria
2–6.
Assessment of inter-observer agreement, Table 14, showed good and very good agreement
between observers 1 and 2, where kappa varied from 0.48 to 1. There was poorer agreement
between observers 1 and 3, where kappa varied from 0.33 to 0.63, and observers 2 and 3, where
kappa varied from 0.23 to 0.63. Observers 1 and 2 are experienced radiologists and observer 3 is
a resident radiologist.
53

44
Table 14. Results of inter-observer agreement on the image quality criteria 1–6 for image series
obtained with the Definition and the Flash.
Observers Observers Observers 1 and 2 1 and 3 2 and 3 kappa kappa kappa
Criterion number
(95% CI) (95% CI) (95% CI)
Definition Flash Definition Flash Definition Flash
0.78 0.76 0.48 0.36 0.63 0.60 1 (0.49–1.07) (0.60–0.93) (0.15–0.8) (0.12–0.60) (0.33–0.92) (0.39–0.80)
1.00 0.83 0.63 0.43 0.63 0.53 2 (0.75–1.25) (0.69–0.97) (0.33–0.92) (0.20–0.66) (0.33–0.92) (0.32–0.76) 0.63 0.66 0.40 0.33 0.44 0.39 3
(0.33–0.92) (0.48–0.85) (0.90–0.71) (0.09–0.57) (0.13–0.75) (0.16–0.63) 0.74 0.48 0.48 0.36 0.52 0.51 4 (0.46–1.01) (0.29–0.68) (0.17–0.79) (0.15–0.56) (0.22–0.83) (0.30–0.72) 0.63 0.70 0.64 0.38 0.56 0.23 5
(0.33–0.92) (0.52–0.88) (0.38–0.9) (0.13–0.60) (0.27–0.85) (0.17–0.63) 0.63 0.73 0.40 0.39 0.40 0.53 6 (0.33–0.92) (0.56–0.90) (0.90–0.71) (0.17–0.63) (0.90–0.71) (0.31–0.74)
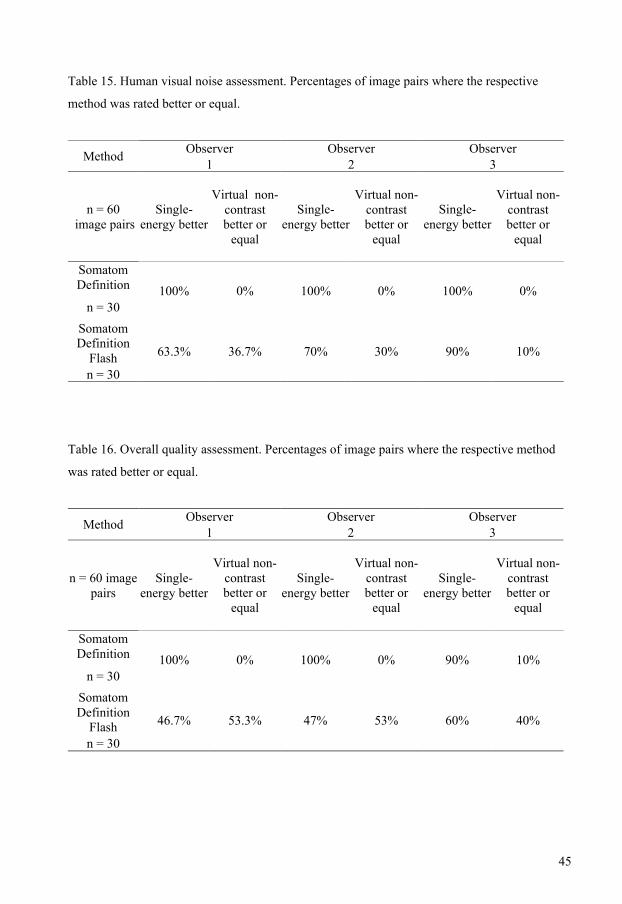
In the noise assessment, the difference between single-energy and VNC was lower with Flash
than with Definition (Table 15). For Definition, observer 1 considered all 30 single-energy series
to be better than the virtual VNC series. In comparison with Flash only 63% of the 30 image
pairs were better, p<0.001. The same pattern was seen for observers 2 and 3, also with
statistically significant differences between the two methods.
The difference in overall quality between single-energy and VNC was significantly lower with
Flash than with Definition (Table 16). For Definition, observer 1 considered all 30 single-energy
series to be better than the VNC series. By comparison, with Flash only 47% of the 30 image
pairs were better, p<0.001. The same pattern was seen for observer 2s and 3, also with
significant differences between the two methods.
54
45
Table 15. Human visual noise assessment. Percentages of image pairs where the respective
method was rated better or equal.
Observer Observer Observer Method 1 2 3
n = 60 image pairs
Single- energy better
Virtual non-contrast better or
equal
Single-energy better
Virtual non-contrast better or
equal
Single-energy better
Virtual non-contrast better or
equal
Somatom Definition
n = 30 100% 0% 100% 0% 100% 0%
Somatom Definition
Flash n = 30
63.3% 36.7% 70% 30% 90% 10%
Table 16. Overall quality assessment. Percentages of image pairs where the respective method
was rated better or equal.
Observer Observer Observer Method 1 2 3
n = 60 image pairs
Single-energy better
Virtual non-contrast better or
equal
Single-energy better
Virtual non-contrast better or
equal
Single-energy better
Virtual non-contrast better or
equal
Somatom Definition
n = 30 100% 0% 100% 0% 90% 10%
Somatom Definition
Flash n = 30
46.7% 53.3% 47% 53% 60% 40%
55
46
In the first group of patients, who were examined with Definition, we found five patients with
urinary tract calcifications, with altogether nine calculi. The size of the calcifications varied from
approximately 1 mm to 3 mm. All observers correctly pointed out the calculi on the single-
energy images. Only three calculi were found on the virtual non-contrast image series by all
observers. Only one 3 mm large calculus was pointed out by all observers. Senior radiologists
found two other 2 mm calculi, while a resident radiologist reported another 2 mm large calculus.
In the second group of patients, who were examined with Flash, we found eight patients with
fourteen calculi. The sizes varied from 1 mm to 9 mm in the single-energy series. Both senior
radiologists correctly reported all of the calculi on the single-energy image series, while the
resident radiologist missed one 2 mm calculus. The first senior radiologist missed five of the
calculi on the VNC series. Two of those were 2 mm and three 1 mm. The second senior
radiologist missed another 2 mm calculus. The resident radiologist missed the previously
mentioned calculus, and additionally two 2 mm calculi and a large 3 mm calculus.
Study IV All 16 calculi were detected in single-energy images and dual-energy images with water in
phantom tubes in all energy levels by both observers. With the VNC image series all the calculi
were correctly depicted by only one of the observers in high-dose level and with the combination
80–140kVp. The second observer missed one 1.42 mm stone in this setting. In other dose levels
both evaluators missed calculi in size range 1.42 – 2.02 mm. The percentage of detected calculi
and the stone size of missed calculi in all the dose levels investigated and at all tube energy
settings are shown in Table 17.
56

47
Table 17. Percentage of visible stones at different dose levels and size range of the missed stones
at corresponding dose levels calculated for observations by both readers for virtual non-contrast
images.
Dose level Percentage of visible stones
Size range of missed stones in mm
Low dose level 80/140 VNC 78% 1.42–2.02
Low dose level 100/140 VNC 81% 1.42–2.00
Medium dose level 80/140 VNC 94% 1.42–1.50
Medium dose level 100/140 VNC 81% 1.42–2.00
High dose level 80/140 VNC 97% 1.42
High dose level 100/140 VNC 87% 1.42–1.5
Results of inter-observer variability in all 15 investigated dose levels shows very good
agreement between assessments of stone size by both evaluators, with correlation coefficient
variability from 0.97 (95% CI 0.91–0.99) to 1.0 (95% CI 0.99–1.0). An example of very good
agreement is depicted in Figure 14.
57
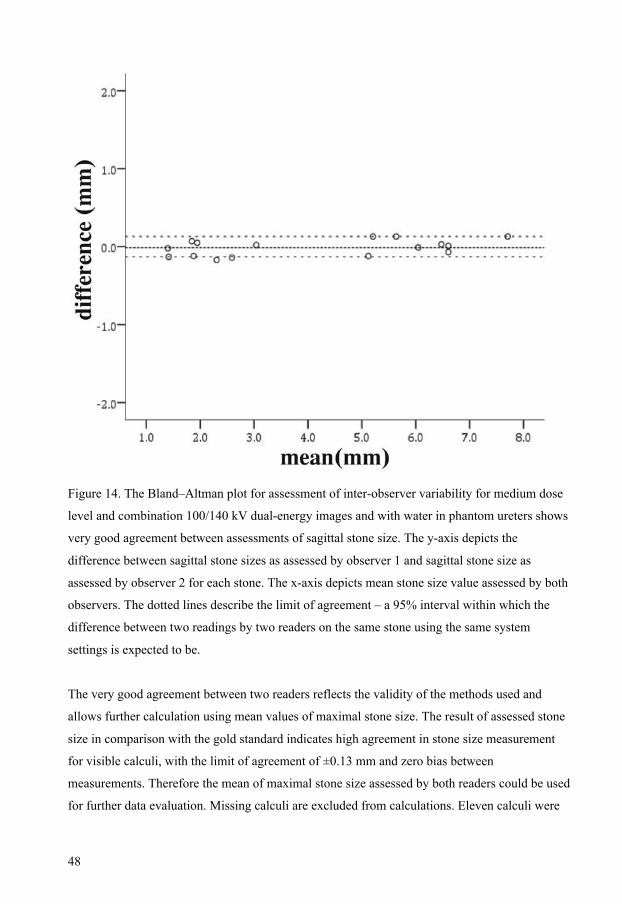
48
Figure 14. The Bland–Altman plot for assessment of inter-observer variability for medium dose
level and combination 100/140 kV dual-energy images and with water in phantom ureters shows
very good agreement between assessments of sagittal stone size. The y-axis depicts the
difference between sagittal stone sizes as assessed by observer 1 and sagittal stone size as
assessed by observer 2 for each stone. The x-axis depicts mean stone size value assessed by both
observers. The dotted lines describe the limit of agreement – a 95% interval within which the
difference between two readings by two readers on the same stone using the same system
settings is expected to be.
The very good agreement between two readers reflects the validity of the methods used and
allows further calculation using mean values of maximal stone size. The result of assessed stone
size in comparison with the gold standard indicates high agreement in stone size measurement
for visible calculi, with the limit of agreement of ±0.13 mm and zero bias between
measurements. Therefore the mean of maximal stone size assessed by both readers could be used
for further data evaluation. Missing calculi are excluded from calculations. Eleven calculi were
58

49
included in further calculations for the best comparability of statistical results between all dose
levels and tube energy settings. The results of correlation tests between the mean of assessed
maximal stone size and maximal stone size measured with electronic callipers show good
agreement, with correlation coefficient variability from 0.93 (95% CI 0.76–0.98) to 0.99 (95%
CI 0.96–0.99). The lowest value of correlation coefficient was assessed for low dose level and
tube potential combination 80/140 kV. Distribution of measurements for this dose level is shown
in Figure 15.
Figure 15. The Bland–Altman plot for assessment of the correlation coefficient for differences
between mean values of the maximal stone size assessed by observers 1 and 2 (y-axis) and
reference stone size (x-axis). Figure depict distribution of measurement for medium dose level
and combination 80/140 kV where correlation coefficient has lowest value.
The intra-class correlation coefficient (ICC) measures the strength of agreement between
repeated measurements by assessing the ratio of between-methods actual stone-size variance to
the total variance, which comprises the sum of variation of assessed stone size and actual stone
size. If, as in this case, the actual size of the detected calculi varies from 2.3 mm to 7.5 mm the
59
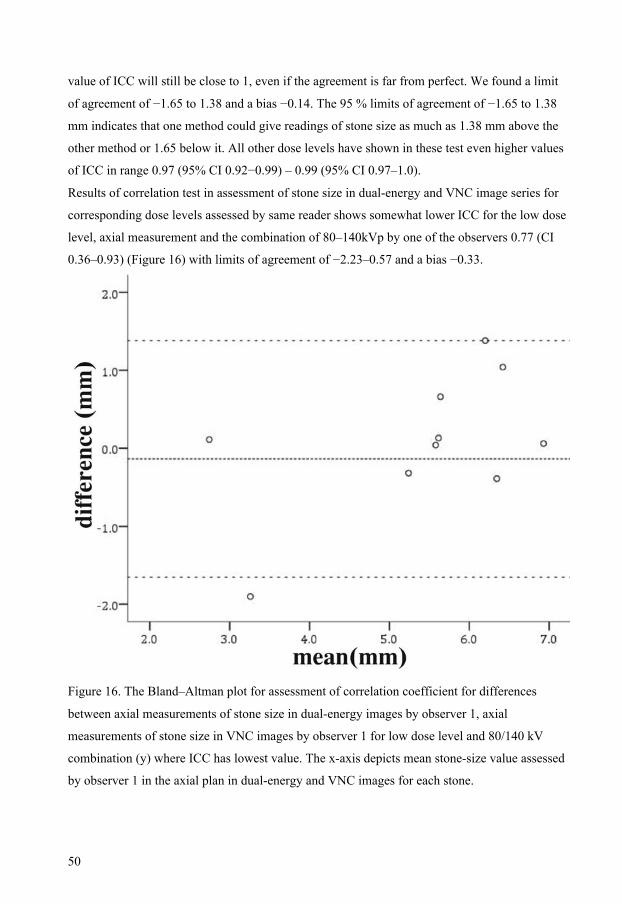
50
value of ICC will still be close to 1, even if the agreement is far from perfect. We found a limit
of agreement of −1.65 to 1.38 and a bias −0.14. The 95 % limits of agreement of −1.65 to 1.38
mm indicates that one method could give readings of stone size as much as 1.38 mm above the
other method or 1.65 below it. All other dose levels have shown in these test even higher values
of ICC in range 0.97 (95% CI 0.92−0.99) – 0.99 (95% CI 0.97–1.0).
Results of correlation test in assessment of stone size in dual-energy and VNC image series for
corresponding dose levels assessed by same reader shows somewhat lower ICC for the low dose
level, axial measurement and the combination of 80–140kVp by one of the observers 0.77 (CI
0.36–0.93) (Figure 16) with limits of agreement of −2.23–0.57 and a bias −0.33.
Figure 16. The Bland–Altman plot for assessment of correlation coefficient for differences
between axial measurements of stone size in dual-energy images by observer 1, axial
measurements of stone size in VNC images by observer 1 for low dose level and 80/140 kV
combination (y) where ICC has lowest value. The x-axis depicts mean stone-size value assessed
by observer 1 in the axial plan in dual-energy and VNC images for each stone.
60

51
Correlation test in assessment of stone size in dual-energy and VNC image series in all other
dose levels showed good correlation for observer 1 (Table 18) and for observer 2, with
somewhat higher values for sagittal measurements (Table 19).
Table 18. Correlation test in assessment of stone size in dual-energy and VNC image series for
corresponding dose levels assessed by observer 1.
axial measurement sagittal measurement Dose level
ICC 95%CI ICC 95%CI Low dose level 80/140kV 0.77 0.36-0.93 0.93 0.79-0.99 Low dose level 100/140kV 0.93 0.79-0.98 0.97 0.89-0.99 Medium dose level 80/140kV 0.90 0.69-0.97 0.98 0.93-0.99 Medium dose level 100/140kV 0.96 0.85-0.99 0.97 0.91-0.99 High dose level 80/140kV 0.93 0.77-0.98 0.96 0.86-0.97 High dose level 100/140kV 0.92 0.74-0.98 1.00 0.88-0.99
Table 19. Correlation test in assessments of stone size in dual-energy and VNC image series for
corresponding dose levels assessed by observer 2.
axial measurement sagittal measurement Dose level
ICC 95%CI ICC 95%CI Low dose level 80/140kV 0.91 0.70-0.97 0.96 0.85-0.99 Low dose level 100/140kV 0.97 0.89-0.99 0.97 0.90-0.99 Medium dose level 80/140kV 0.92 0.75-0.98 0.98 0.92-0.99 Medium dose level 100/140kV 0.95 0.85-0.99 0.98 0.95-1.00 High dose level 80/140kV 0.97 0.90-0.99 0.99 0.98-1.00 High dose level 100/140kV 0.95 0.84-0.99 0.98 0.95-1.00
61

52
62
53
5. Discussion
In introducing a new technology in radiology we need to be sure that it will provide sufficient
information for correct diagnosis at reasonable cost and with minimum radiation dose to the
patient. Assessment of image quality is crucial to assure that the new technology has achieved
optimum performance. Methods to assess the image quality often focus on the physical and
technical aspects of the image (46), which are more straightforward and objective. Clinical
assessment of image quality is less straightforward. As long as a human observer is required for
image evaluation we need to deal with the subjectivity of image-quality assessment. In doing this
the first step is to define the requirements of the clinical information provided by the image. The
Commission of the European Communities has contributed to the establishment of Quality
Criteria for diagnostic radiographic images and computed tomography (2, 4). The image quality
demanded will vary: to ensure that the patient receives the minimum radiation dose the quality
should be no more than adequate for the clinical question. Techniques for measuring image
quality can be divided into those evaluating test objects and those assessing clinical images. In
this thesis papers I and II have focused on evaluating the image quality of clinical images while
introducing a new flat-panel detector in excretory urography. Image quality is evaluated in the
CDRAD-phantom and the results of this assessment are implemented in the clinical part of the
first study, where Visual Grading Analysis is used as one of the methods for evaluating image
quality. In paper II the Image Criteria Score is used as a method for the evaluation of clinical
images for comparison of the impact of the examination preparation. In the paper III the Visual
Grading Criteria method is used for image-quality evaluation and comparison in image series
coming from two different dual-energy tomography techniques. Paper IV investigates the
diagnostic impact of the image-quality level established in study III as the accuracy of stone-size
measurement using dual-energy computed tomography of the new generation.
5.1. Image quality evaluation methods in digital radiography Contrast-detail phantom: The assessment of image quality using a contrast-detail phantom
CDRAD, as in the first study, represents a link between assessment of physical image-quality
parameters and methods based on diagnostic performance (42). The CDRAD phantom allows an
evaluation of the whole imaging chain, including the observer. The contrast-detail phantom is
easy to use, allowing multiple irradiations with different radiation-dose parameters and
excluding potentially harmful radiation to patients. To evaluate the quality of a phantom image,
63
54
radiologists are traditionally required to manually indicate the location of the holes in each
square in the image of the phantom. The image-quality figure (IQF) of the phantom image can
then be calculated. With experienced observers, even small differences in image quality can be
shown. However, one of the drawbacks is the difference in performance between observers, as
was shown in the previous study (47). To deal with this problem we use an average value of IQF
for the three observers and each image. Probably an even better way to deal with inter-observer
variability would be to calculate the IQF mean from multiple evaluations by each observer for
each phantom image to decrease variability, as was done in the previously mentioned study (47).
This pinpoints one of major limitations of CDRAD phantom evaluation: evaluation by the
human eye is time-consuming. Research in recent years has resulted in the creation of software
for automatically analysing CDRAD phantom images and computing their IQFs (48). At the
time of the present study no computed evaluation of phantom images was available. The
CDRAD phantom is useful for making comparisons of image quality and system settings
between the screen-film system and (49) digital radiography systems, and (50) different flat-
panel systems. Previous studies have shown good correlation between phantom and clinical
studies (51). However, the results from the CDRAD-phantom readings – IQF values, must be
judged with caution as results of previous studies indicate that adding anatomic structures
“anatomical noise” in the background can hide the phantom details resulting in a different IQF-
value (52-54).
The CDRAD phantom has been widely used for evaluation of the impact of system settings on
image quality, with correlation to clinical images for chest (49) and abdomen (55) digital
radiography. This agrees with the results of our study showing that the CDRAD contrast-detail
phantom is a powerful tool in the process of dose reduction when introducing flat-panel
detectors, allowing the achievement of images with equal image quality using different systems.
If the previously used digital system has already been optimised, as it was in the case of our
department, the CDRAD-phantom helps to find the level of irradiation that yields an image
quality equal to that of the optimised system.
Visual grading: Three methods of diagnostic performance-based image-quality evaluation were
used in the present work: fulfilment of image criteria (IC), visual grading analysis (VGA) and
visual grading characteristics (VGC) analysis.
The establishment of image criteria by the European Commission was an important step in
defining what good clinical image quality means. The criteria are based on the visibility of
important anatomical structures and represent a statement about the level of reproduction needed
with these structures. The observer is asked to state whether or not a criterion is fulfilled in the
64

55
image (56). An image criteria score is then calculated as the proportion of criteria fulfilled (57).
The advantage of IC is that no mathematical or statistical errors are made in the calculation of
ICS because the use of parametric statistics is appropriate in this case. The proportion of fulfilled
criteria is the mean of the variable that can take the value of either zero or unity. IC based on
image criteria of the European commission as a method of image-quality evaluation was used in
the previous studies. IC was widely used in studies evaluating image quality while optimising
technical parameters using screen-film system. Almén et al. (58) showed that significant
differences in image quality could be detected between different radiographic technique groups
in evaluation of lumbar spine radiographs. Sandborg et al. showed the value of IC in detecting
that it was possible to predict clinical image quality from physical measures (59). In our study
we use this method for evaluating the impact of preparation methods on image quality in digital
radiography in patient groups. No manipulation has been made with system settings. Image
criteria are used in their original form and the ratings are absolute, which means that ICS
corresponding to a clinically acceptable level of image quality can be stated. However, the
drawback in this study is that there is only two levels of criteria fulfilment, which makes it
difficult to assess how far from the decision threshold the reproduction is. As with other visual
grading methods, it is very important to make allowance for inter-observer variability because all
methods rely on subjective assessment. In our study the high score in the assessment of visibility
also means a high degree of inter-observer agreement, as the criteria were considered to be
fulfilled only when there was 100 % agreement between all three readers.
As ICS is a mean of all criteria scores it will be influenced by the lower score for visibility of the
kidney outlines before administration of contrast medium and it gives a somewhat lower score
compared with European Commission criteria assessment. However, there was still no
significant difference between the three preparation groups. To our knowledge this is the only
study planned and carried out as an equivalence study able to demonstrate the equality of
evaluated preparations. The design of the study follows the recommendations for randomised
trials (60) and the methods of subjective assessment of imaging systems proposed by Martin et
al.(61).
Another approach to visual grading is to implement different steps in the visualisation of
important anatomical structures, as it is in Visual Grading Analysis. VGA can be performed
using one or several images as a reference, as was done in the first study in this thesis, or with
absolute grading using no references (42). In the relative VGA studies, a 5-point scale is used for
comparison of the evaluated images with the reference where −2 means much worse compared
to reference, 0, equal to reference and +2, much better than reference. Then, when a Visual
65

56
Grading Analysis score is calculated it is defined as simply the mean value of all ratings when
numerical representations of the scale steps are used (59). However, numbers and means belong
to the ordinal scale, and statistical calculations based on the VGAS lack validity. The scale steps
should be treated as an ordered qualitative variable. This is why, as well as the “statistically
incorrect” VGAS calculation, we have shown the result of the study simply as a percentage
distribution of the image assessment. By doing this we have avoided the incorrect treatment of
qualitative data criticised in previous studies (62). This could be a simple way to show variability
between the readers. One of the drawbacks of this study was the need to obtain a reference image
identical except in tube settings to the evaluated flat-panel image, and this made it impossible to
randomise the study. Visual Grading provided a sharper distinction than Image Criteria between
the different radiographic technique groups while evaluating lumbar spine radiograph in the
screen-film system (58). In spite of the fact that the usefulness of the method was emphasised in
many studies (42, 57-59), the criticism about its incorrect treatment of qualitative data resulted in
a non-parametric rank-invariant statistical method for image quality evaluation: Visual Grading
Characteristics analysis. VGC is a method based on concepts developed for Receiver Operating
Characteristics (ROC) analysis. In the VGC study the observer is asked to state his opinion about
the confidence of the criteria fulfilment in the gradual transition from confidence that the
criterion is fulfilled until confidence that the criterion is not fulfilled. In recent research visual
grading regression has been suggested as a method of analysing data from a visual grading
experiment (44) which was used in the third study in this thesis. The limitations of IC with a
two-step rating scale have been overcome with multiple steps in VGC grading scale.
Furthermore there is a possibility of modifications of the original image-quality criteria proposed
for chest radiography (57) and lumbar spine radiography (63). In our study we focused on the
differences in image quality between image series coming from two different generations of
dual-energy computed tomography and not on the absolute image quality of either of them. It is
important to use as much of the grading scale as possible. Use of the original image-quality
criteria, focusing on “reproduction” of the anatomical criteria, could result in the observer’s
judging a criterion as being fulfilled at very low threshold. Using the words “clear” or “optimal”
to indicate better reproduction of the anatomical structure allows contrast, spatial resolution and
noise to be taken into consideration, and probably results in a wider range of steps in the
assessment scale being used. One of the strength of this method is that it is possible to change
the criteria or the judgment scale depending on evaluation in question (43). In our study we used
ordinal regression as a statistical model for analysing our data as was suggested by Smedby (44)
as a further development of the original method.
66
57
5.2. Flat-panel radiography The flat-panel detector was shown to have the potential for dose reduction without loss of image
quality compared to storage phosphor plates. In study I the result of our phantom study indicated
the possibility of a dose reduction of approximately 70 % when switching from a storage
phosphor system to a flat-panel system, with no loss of image quality. This has been proved in
our clinical study using the same equipment and the same settings. The results of this part of the
study showed that despite the dose reduction, flat-panel detector radiography allowed equivalent
detection of different anatomical structures in the abdomen. At our institution 200-speed
phosphor storage plates have been used clinically. The same high dose reduction would not be
achieved with a 400-speed system. In order to ensure the best comparability between the
reference image and flat–panel image, we decided to evaluate abdominal overview images
(before administration of IV contrast medium and without compression). Two skeletal criteria
have been added to the EU criteria for urography images before IV contrast administration to
improve assessment of high–contrast details.
The need to obtain a reference image identical to the evaluated flat-panel image except for tube
settings makes the randomisation of this study impossible. There was another potential source of
bias in our experiment: the appearance of the storage phosphor plate images was sufficiently
different from images obtained with the flat-panel detector to allow a reader to distinguish the
images from the two imaging techniques. However, an evaluation of images on hard copies, as
Zähringer et al. did in a recently published study (64), did not exploit the full benefit of the flat-
panel system. Previous studies have reported significantly better detectability of low-contrast
objects with flat-panel images compared to storage phosphor images at equal dose levels (50).
Even the comparison of indirect type flat-panel detectors, such as the one used in our study, with
film-screen radiography has shown similar results. This is possible due to the wider dynamic
range and better signal-to-noise-ratio of the flat-panel detectors, and also to the image post-
processing capabilities in a digital system. The image-viewing tools on a workstation, such as
window and level settings and zoom functions, and the possibility of increasing edge
enhancement may influence even better representation of low-contrast objects such as kidneys
and psoas outlines.
All radiologists have rated criterion number seven, noise, as significantly worse than the
reference image. However, measurement of noise in a ROI in the image pairs, showed no
difference between paired images. The flat-panel detector’s higher DQE and its smaller pixel
size of 143 µm results in increased spatial resolution and better contrast-detail resolution
compared to SPP. The detectability of small, both high- and low-contrast structures is increased
67

58
and assessed rather as an “information noise”. This fact might be an explanation for difference in
rating of noise compared to a lack of difference in noise measurements. The “overall quality”
was assessed as equal, with a high degree of agreement between observers. Okamura et al. (65)
showed that the image quality of digital radiography using a flat-panel detector in abdominal
imaging was superior to that of film-screen or computed radiography systems, with dose
reduction of approximately 50 %. Those results have been confirmed by Zähringer et al. (66):
except for the psoas margin stripe, no significant difference was found between the two imaging
techniques. In their study the insignificant difference in depiction of psoas margin has been
explained by the superposition of bowel gas, mucosal folds, or faecal material. By choosing
identical image pairs we were able to avoid this problem and assess the image-quality difference
despite disturbing factors decreasing visualisation of the region of interest. Our second study,
performed on flat-panel detectors, showed equality of three preparation methods using a standard
investigation protocol with urethral compression and tomography. Flat-panel digital detectors
offer improvements over conventional analogue imaging systems and allow more effective use
of radiation and more efficient work practice without loss of image quality. Because of the wide
and linear dynamic range of the flat-panel digital detector, there is an ability to view and adjust
image settings directly at a workstation, and this is one of its major advantages. The image-
viewing tools at a workstation, such as window and level settings and zoom functions, takes
advantage of the wide dynamic range of the system and may give even better representation of
low-contrast objects such as the kidney and psoas outlines. This contributes to equality of image-
quality despite preparation method.
5.3. Dual-energy computed tomography Previous studies have shown that the noise level of virtual non-enhanced series obtained with the
first generation of DECT (Definition) was a well-known problem (13, 35). The results of study
III show that the image quality of virtual non-enhanced images obtained with the new generation
of DECT (Flash) is still inferior compared to single-energy imaging. However, the difference in
image quality according to the EC criteria was much smaller with Flash than with the older
Definition system. The image quality of VNC images for the newer scanner shows a clear
improvement compared to the old system. In the new generation of DECT the manufacturers
filter out unnecessary photons of the high-energy x-ray tube by inserting different filters for each
x-ray tube. The spectrum is therefore better focused and separated from the photons emitted by
the low-energy tube, without unnecessary overlap of photon spectra. This contributes effectively
68

59
to the improvement of image quality of dual-energy images. Despite somewhat larger patients
and higher kV at the low-energy tube, the mean radiation dose was lower with Flash than with
Definition. In the first generation of DECT overlap of the photon spectra contributes to the
higher radiation dose. Visual human rating of noise still shows high noise levels for VNC series
obtained with Flash, even though there is a clear improvement compared to Definition. This also
seems to influence the results of the overall quality assessment.
There are some limitations in our study. Despite the anonymity of the image series, an observer
could still see which of the virtual non-contrast image series was coming from Definition
because of FOV limitation to 26 cm. The difference for VNC images coming from Flash was not
that obvious, especially for smaller patients, because the dual-energy FOV is as large as 33 cm.
There is thus a risk of bias. With that in mind, the outcome of the study would not change, but
the difference in perceived image quality would probably be smaller.
The primary outcome of study III was image quality, not detectability of different pathological
conditions. However, the image quality of single-energy non-enhanced image series is an
accepted standard set by previous research for best detectability of urinary tract diseases.
Detectability of renal masses does not seem to be a problem addressed to non-contrast-enhanced
series, because non-enhanced series are not usually used to detect a mass. They are needed,
however, for characterisation of detected tumours. But for what purposes is good image quality
important? During the past decade many researchers focused their efforts on best detectability of
tumours on contrast-enhanced series (30, 67). Graser et al. (36) showed good correlation of
attenuation between true non-enhanced images and VNC images in detection of contrast
enhancement in renal masses. Small papillary carcinomas with subtle enhancement can still be
misclassified on VNC series, as the non-contrast value is higher than the true value, masking the
low-level enhancement in these cancers. However, the great achievement of DECT is the ability
to identify the presence of iodine in tissues and the possibility of measuring its concentration
(34). Demands on image quality for virtual non-enhanced series are not that high, if the only
question is the presence of contrast-medium enhancement in the dual-energy images.
This seems to be different, if detectability of urinary tract calculi is the concern. In study IV
small calculi in the size range 1.42–2.02 mm were missed, probably due to a combination of the
material decomposition and the inferior image quality of the VNC series compared to single-
energy images. Although small ureteral calculi normally pass spontaneously (68) the detection of
small calculi is often clinically important as an explanation of patients’ flank pain or haematuria.
These results are in agreement with results of earlier studies performed with the older dual-
69
60
energy system. Visibility of small calculi with VNC images is still inferior compared to single
energy and dual-energy image series.
Previous studies in which detectability of urinary calculi was the primary outcome were
performed with the older generation of DECT (Definition). In a phantom study (32), more than
95% of 2–4 mm stones were detectable using the VNC technique. In a clinical study, 74.3% on a
per-stone basis were detected using VNC series created from the nephrographic phase (69).
Takahashi et al. showed that the VNC images generated at the pyelographic phase enabled the
detection of urinary calculi with moderate accuracy (33). The overall sensitivity for detecting
calculi was 63%: 29% for 1–2 mm calculi, 64% for 3–4 mm calculi, 83% for 5–6 mm calculi and
100% for calculi 7mm or larger. The results of the recently published retrospective study by
Moon et al, performed with the new generation of DECT (Flash), shows that of calculi
measuring ≤ 3.2mm 45% were missed on VNC image series created from the nephrographic
phase and 62% on VNC images created from the excretory phase (70). The visibility of small
renal calculi is a problem. The missed calculi in study III had a diameter of 1–3 mm. Review of
the images with missed calculi showed that calculi appear 1 mm smaller with VNC series. This
could explain why the visibility of small calculi is a problem. However, in the Bland–Altman
plots in study IV we could not see any evidence of systematic error as a sign of under- or over-
estimation of stone size. The important outcome of our study was the accuracy of stone-size
measurement using VNC images compared to actual stone size (gold standard). The 95% limit of
agreement of −1.65 to1.38 mm indicates the 95% interval within which the difference between
two readings by two readers on the same stone using the same system settings is expected to be.
Despite the high ICC value this difference in limit of agreement is clinically not acceptable if the
stone size is close to the decision threshold. In comparison of dual-energy and VNC image series
assessed by the same reader in detected calculi, we found even wider limits of agreement, which
indicates the possibility of a wide variation of measurements: −2.23–0.57 mm. A study by Lidén
et al. (71) stresses the influence of image post-processing on the measurement of renal calculi.
The selected 3 mm reconstruction thickness and 1.5 mm increment, with fixed window settings
and measurements in two planes, were chosen following recommendations from previous studies
for optimal visibility and accuracy of stone-size measurement (72-74). Since diverse ranges of
iodine concentrations in previous phantom studies do not significantly influence the visibility of
calculi except in extremely high concentrations, we chose the iodine concentration that is seen in
clinical studies of the human ureter. Both readers had previously participated in a study where
inter-reader variability in taking two measurements of 50 stones with an interval of a week
between was one of the outcomes. An intra-reader variability of ±0.5 mm was seen between the
70
61
two measurements by the same reader with one week’s interval (71). This gave us the idea of
performing intra-reader variability calculations for measurements by the same reader of image
series obtained with dual-energy and water in phantom tubes and VNC image series as a
measure of accuracy of material decomposition.
The appearance of calculi in VNC images is different compared to single-energy images. The
post processing brings some smoothing to the stone shape, which makes it more difficult to
decide where to position the callipers in the image (Figure 9). In the previous study the stone size
estimated by 11 observers varied with a 95% limit of agreement at ±1.3 mm with single-energy
images. Both observers in this study agreed in advance how to position the callipers in the VNC
images. This probably contributes to the good inter-observer agreement. The results both of our
study and of the study of Lidén et al. lay stress on the importance of the education needed to
improve the accuracy of stone-size measurements
The calculation of mean stone size as assessed by two readers brings the risk that reduction of
measuring errors will lead to underestimation of variability. In practice, with high values of ICC
in inter-observer variability, the influence of mean calculation on assessment is very small, with
a limit of agreements of −0.13 – 0.13 mm and bias equal to zero.
One of the study IV shortcomings is the small sample size. For the best comparability of
statistical calculations in all settings, we excluded all missing calculi from further calculations,
which resulted in a smaller sample size than expected. A new study with more calculi would
improve the validity of the study results. Another limitation of our study is the fact that nearly all
calculi have the same chemical composition. However, previous studies have shown that stone
composition does not influence visibility (32, 33). A common criticism of phantom studies is the
artificial environment in the phantom, with easily controlled and assessed anatomy. The more
complicated anatomy of the human body affects the results of clinical studies and makes the
implementation of phantom studies difficult.
Despite the improvement in image quality of the VNC images obtained with the new generation
of DECT, the image quality is still inferior compared to native images, and developments in
technology are not sufficient so far to meet clinical needs in the evaluation of patients with
haematuria. Detection of small stones is not reliable despite better image quality with the new
DECT and that means that small stones will be missed with VNC imaging. With larger stones,
the inherent measurement error with CT is magnified with VNC imaging. Our evaluation of
image quality was restricted and focused on observer/diagnostic performance methods as an
assessment of the image quality of images obtained with a new system or using a new method of
71
62
examination. The objective methods for assessing image quality as contrast to noise ratio (CNR)
was not directly studied in this work. The detection of small high-contrast lesions (calculi) is
generally related to spatial resolution, while detection of large low-contrast lesions is associated
with a high CNR (75). In the study image quality was compared to an existing gold standard.
This is a tool that allows us to compare the image quality of a new system with the accepted
standard. It is useful if the previously used system has already been optimised. It gives a starting
point for further work on fine-tuning the new system to meet clinical demands for the
detectability of pathological conditions. Because of the rising number of procedures and the
trend towards more complicated examinations, radiologists are forced to adjust image quality to
the referral question. It means that image quality should be no better than necessary for to
making a correct diagnosis. The image quality requirements will vary with referral question and
the evaluated part of the body. The complicated anatomy of the abdomen with small low-
contrast soft-tissue structures requires higher tube voltages of 120-140 kV compared to those for
bone and iodine imaging of 80-100 kV(76). The new technologies help us to find new ways of
optimisation. Results of phantom and clinical studies suggest that 100 kV abdominal protocols
with iterative reconstruction algorithms increase the image quality and maintain the diagnostic
accuracy compared to 120 kV protocols (77, 78). Further investigations are needed with a focus
on image quality and the detectability of pathological conditions.
72
63
6. Conclusions The CDRAD contrast-detail phantom can be used as a tool in the process of dose-reduction
when introducing flat-panel detectors. The image quality figure (IQF) can probably serve as a
uniform way of expressing image-quality demands in positioning radiography and can be used
by any radiology department.
Using ICS as an image-quality evaluation method we showed that fulfilment of European
Commission criteria was equivalent in the three preparation groups. This contributes to the
growing evidence that bowel preparation before excretory urography is unnecessary. The results
of this study have contributed to changing the practice at our department and the discontinuation
of bowel preparation before intravenous urography.
Despite the improvement of image quality of VNC images obtained with the new generation of
DECT, the image quality is still inferior compared to native images, and developments in
technology are not sufficient so far to meet clinical needs in the evaluation of patients with
haematuria
The inferior quality of the images obtained with the new generation of DECT compared to the
existing single-energy standard results in the detection of small stones not being reliable. This is
the case in spite of the improvement in image quality with the new DECT and the fact that small
stones will be missed with VNC imaging. In larger stones, the inherent measurement error with
CT is magnified with VNC imaging
73

64
7. Acknowledgements I wish to express my sincere gratitude to those who, in different ways, have contributed to this thesis. First of all my supervisors:
Anders Persson for making this possible, and for your endless enthusiasm and support
Torbjörn Andersson for your constant encouragement for better or for worse, for guidance,
wisdom, friendship and support
Håkan Geijer for your feeling for details and for all your good ideas
Anders Magnuson for your statistical support. I have never been closer to understanding.
Jan Persliden, the king of the medical physics jungle, for his friendship, support and sense of
humour.
I would like to thank my colleagues at the Department of Radiology at the University Hospital in
Örebro, headed by Lisa Bjärmark, for being friendly and understanding, especially during the
last months of intense work.
Sture Hennerdal and Birger Persson, my workmates and friends, for being supportive and
encouraging. I am infinitely grateful for our hours of talking about everything: life and “devices
with the wire”.
Petter Quick and Lilian Henriksson at CMIV and Martin Gustavsson and Jonas Borg at
University Hospital in Örebro for your imaging assistance
Finally, I would like to thank my husband Harry for being there for me, and our wonderful girls,
Carina, Marie, Tanja and Linda, for reminding me each second what is really important in life.
74

65
8. References 1. Nations U. Sources and Effects of Ionizing Radiation, UNSCEAR 2008 Report: Sources
- Report to the General Assembly Scientific Annexes A and B. 2010. 2. CEC. European guidelines on quality criteria for diagnostic radiographic images. Report
EUR 16260 EN 1996. 3. CEC. European guidelines on quality criteria for diagnostic radiographic images in
paediatrics. . Report EUR 16261 EN 1996; Luxembourg: Office for Official Publications of the European Communities 1996.
4. CEC. European guidelines on quality criteria for computed tomography. Report EUR 16262 EN 1999; Luxembourg: Office for Official Publications of the European Communities.
5. Dalla Palma L. What is left of i.v. urography? Eur Radiol 2001; 11:931-939.
6. Fielding JR, Silverman SG, Samuel S, Zou KH, Loughlin KR. Unenhanced helical CT of ureteral stones: a replacement for excretory urography in planning treatment. AJR Am J Roentgenol 1998; 171:1051-1053.
7. Smith RC, Levine J, Dalrymple NC, Barish M, Rosenfield AT. Acute flank pain: a modern approach to diagnosis and management. Semin Ultrasound CT MR 1999; 20:108-135.
8. Smith RC, Verga M, McCarthy S, Rosenfield AT. Diagnosis of acute flank pain: value of unenhanced helical CT. AJR Am J Roentgenol 1996; 166:97-101.
9. Sourtzis S, Thibeau JF, Damry N, Raslan A, Vandendris M, Bellemans M. Radiologic investigation of renal colic: unenhanced helical CT compared with excretory urography. AJR Am J Roentgenol 1999; 172:1491-1494.
10. Chow LC, Kwan SW, Olcott EW, Sommer G. Split-bolus MDCT urography with synchronous nephrographic and excretory phase enhancement. AJR Am J Roentgenol 2007; 189:314-322.
11. Joffe SA, Servaes S, Okon S, Horowitz M. Multi-detector row CT urography in the evaluation of hematuria. Radiographics 2003; 23:1441-1455; discussion 1455-1446.
12. Van Der Molen AJ, Cowan NC, Mueller-Lisse UG, Nolte-Ernsting CC, Takahashi S, Cohan RH. CT urography: definition, indications and techniques. A guideline for clinical practice. Eur Radiol 2008; 18:4-17.
13. Johnson TR, Krauss B, Sedlmair M, et al. Material differentiation by dual energy CT: initial experience. Eur Radiol 2007; 17:1510-1517.
14. Bailey SR, Tyrrell PN, Hale M. A trial to assess the effectiveness of bowel preparation prior to intravenous urography. Clin Radiol 1991; 44:335-337.
15. Bradley AJ, Taylor PM. Does bowel preparation improve the quality of intravenous urography? Br J Radiol 1996; 69:906-909.
16. George CD, Vinnicombe SJ, Balkissoon AR, Heron CW. Bowel preparation before intravenous urography: is it necessary? Br J Radiol 1993; 66:17-19.
17. Roberge-Wade AP, Hoskin DH, MacEwan DW, Ramsey EW. The excretory urogram bowel preparation - is it necessary? J Urol 1988; 140:1473-1474.
75
66
18. Schuster GA, Nazos D, Lewis GA. Preparation of outpatients for excretory urography: is bowel preparation with laxatives and dietary restrictions necessary? AJR Am J Roentgenol 1995; 164:1425-1428.
19. Resnik MI, Older RA. Diagnosis of genitourinary disease. Stuttgart New York: Thieme Medical Publishers 1997.
20. Sutton D. Textbook of Radiology and Imaging. Edinburgh: Churchill Livingstone 2002. 21. Reed Dunnick CMS, Jeffrey H, Newhouse MD, Stephen E, Amis MD. Textbook of
Uroradiology. Philadelphia: Lippincott Williams & Wilkins 2001. 22. Jinzaki M, Matsumoto K, Kikuchi E, et al. Comparison of CT urography and excretory
urography in the detection and localization of urothelial carcinoma of the upper urinary tract. AJR Am J Roentgenol 2011; 196:1102-1109.
23. Townsend BA, Silverman SG, Mortele KJ, Tuncali K, Cohan RH. Current use of computed tomographic urography: survey of the society of uroradiology. J Comput Assist Tomogr 2009; 33:96-100.
24. Smith RC, Rosenfield AT, Choe KA, et al. Acute flank pain: comparison of non-contrast-enhanced CT and intravenous urography. Radiology 1995; 194:789-794.
25. Brenner DJ, Hall EJ. Computed tomography--an increasing source of radiation exposure. N Engl J Med 2007; 357:2277-2284.
26. Jellison FC, Smith JC, Heldt JP, et al. Effect of low dose radiation computerized tomography protocols on distal ureteral calculus detection. J Urol 2009; 182:2762-2767.
27. Kalra MK, Maher MM, Blake MA, et al. Detection and characterization of lesions on low-radiation-dose abdominal CT images postprocessed with noise reduction filters. Radiology 2004; 232:791-797.
28. Karmazyn B, Frush DP, Applegate KE, Maxfield C, Cohen MD, Jones RP. CT with a computer-simulated dose reduction technique for detection of pediatric nephroureterolithiasis: comparison of standard and reduced radiation doses. AJR Am J Roentgenol 2009; 192:143-149.
29. Zilberman DE, Tsivian M, Lipkin ME, et al. Low dose computerized tomography for detection of urolithiasis--its effectiveness in the setting of the urology clinic. J Urol; 185:910-914.
30. Israel GM, Bosniak MA. How I do it: evaluating renal masses. Radiology 2005; 236:441-450.
31. Graser A, Johnson TR, Chandarana H, Macari M. Dual energy CT: preliminary observations and potential clinical applications in the abdomen. Eur Radiol 2009; 19:13-23.
32. Takahashi N, Hartman RP, Vrtiska TJ, et al. Dual-energy CT iodine-subtraction virtual unenhanced technique to detect urinary stones in an iodine-filled collecting system: a phantom study. AJR Am J Roentgenol 2008; 190:1169-1173.
33. Takahashi N, Vrtiska TJ, Kawashima A, et al. Detectability of urinary stones on virtual nonenhanced images generated at pyelographic-phase dual-energy CT. Radiology 2010; 256:184-190.
76
67
34. Brown CL, Hartman RP, Dzyubak OP, et al. Dual-energy CT iodine overlay technique for characterization of renal masses as cyst or solid: a phantom feasibility study. Eur Radiol 2009; 19:1289-1295.
35. Hartman RP, Kawashima A. Radiologic evaluation of suspected renovascular hypertension. Am Fam Physician 2009; 80:273-279.
36. Graser A, Johnson TR, Hecht EM, et al. Dual-energy CT in patients suspected of having renal masses: can virtual nonenhanced images replace true nonenhanced images? Radiology 2009; 252:433-440.
37. Vrtiska TJ, Takahashi N, Fletcher JG, Hartman RP, Yu L, Kawashima A. Genitourinary applications of dual-energy CT. AJR Am J Roentgenol; 194:1434-1442.
38. The Council of the European Union. Council Directive 97 / 43 / Euratom. Official Journal of the European Communities 1997; L (180):22-7.
39. Fryback DG, Thornbury JR. The efficacy of diagnostic imaging. Med Decis Making 1991; 11:88-94.
40. Thornbury JR, Kido DK, Mushlin AI, Phelps CE, Mooney C, Fryback DG. Increasing the scientific quality of clinical efficacy studies of magnetic resonance imaging. Invest Radiol 1991; 26:829-835.
41. Flohr TG, McCollough CH, Bruder H, et al. First performance evaluation of a dual-source CT (DSCT) system. Eur Radiol 2006; 16:256-268.
42. Månsson LG. Methods for the evaluation of image quality. a review. Radiation protection dosimetry 2000; 90:89-99.
43. Båth M, Månsson LG. Visual grading characteristics (VGC) analysis: a non-parametric rank-invariant statistical method for image quality evaluation. Br J Radiol 2007; 80:169-176.
44. Smedby Ö, Fredrikson M. Visual grading regression: analysing data from visual grading experiments with regression models. Br J Radiol 2010; 83:767-775.
45. Bland JM, Altman DG. Statistical methods for assessing agreement between two methods of clinical measurement. Lancet 1986; 1:307-310.
46. International Commision on Radiation Units. Medical imaging- the assessment of image quality. ICRU Report 54. Bethesda; MD: ICRU Publications, 1995.
47. Geijer H, Beckman K-W, Andersson T, Persliden J. Image quality vs radiation dose for a flat-panel amorphous silicon detector: a phantom study. European Radiology 2001; 11:1704-1709.
48. Norrman E, Gardestig M, Persliden J, Geijer H. A clinical evaluation of the image quality computer program, CoCIQ. J Digit Imaging 2005; 18:138-144.
49. Honey ID, Mackenzie A, Evans DS. Investigation of optimum energies for chest imaging using film-screen and computed radiography. Br J Radiol 2005; 78:422-427.
50. Peer S, Neitzel U, Giacomuzzi SM, et al. Comparison of low-contrast detail perception on storage phosphor radiographs and digital flat panel detector images. IEEE Trans Med Imaging 2001; 20:239-242.
51. Vano E, Guibelalde E, Morillo A, Alvarez-Pedrosa CS, Fernandez JM. Evaluation of the European image quality criteria for chest examinations. Br J Radiol 1995; 68:1349-1355.
77

68
52. Båth M, Håkansson M, Börjesson S, et al. Nodule detection in digital chest radiography: effect of anatomical noise. Radiat Prot Dosimetry 2005; 114:109-113.
53. Båth M, Håkansson M, Börjesson S, et al. Nodule detection in digital chest radiography: part of image background acting as pure noise. Radiat Prot Dosimetry 2005; 114:102-108.
54. Håkansson M, Båth M, Börjesson S, Kheddache S, Johnsson AA, Månsson LG. Nodule detection in digital chest radiography: effect of system noise. Radiat Prot Dosimetry 2005; 114:97-101.
55. Berner K, Båth M, Jonasson P, Cappelen-Smith J, Fogelstam P, Söderberg J. Dose optimisation of double-contrast barium enema examinations. Radiat Prot Dosimetry 2010; 139:388-392.
56. Tingberg A. Quantifyng the quality of medical X-ray images. An evaluation based on normal anatomy for lumbal spine and chest images. (Thesis) 2000; Lund.
57. Lanhede B, Bath M, Kheddache S, et al. The influence of different technique factors on image quality of chest radiographs as evaluated by modified CEC image quality criteria. Br J Radiol 2002; 75:38-49.
58. Almén A, Tingberg A, Mattsson S, et al. The influence of different technique factors on image quality of lumbar spine radiographs as evaluated by established CEC image criteria. Br J Radiol 2000; 73:1192-1199.
59. Sandborg M, Tingberg A, Dance DR, et al. Demonstration of correlations between clinical and physical image quality measures in chest and lumbar spine screen-film radiography. Br J Radiol 2001; 74:520-528.
60. Moher D, Schulz KF, Altman DG. The CONSORT statement: revised recommendations for improving the quality of reports of parallel-group randomised trials. Lancet 2001; 357:1191-1194.
61. Martin CJ, Sharp PF, Sutton DG. Measurement of image quality in diagnostic radiology. Appl Radiat Isot 1999; 50:21-38.
62. Geijer H, Beckman K, Jonsson B, Andersson T, Persliden J. Digital radiography of scoliosis with a scanning method: initial evaluation. Radiology 2001; 218:402-410.
63. Almén A, Tingberg A, Besjakov J, Mattsson S. The use of reference image criteria in X-ray diagnostics: an application for the optimisation of lumbar spine radiographs. Eur Radiol 2004; 14:1561-1567.
64. Zähringer M, Hesselmann V, Schulte O, et al. Reducing the radiation dose during excretory urography: flat-panel silicon x-ray detector versus computed radiography. AJR Am J Roentgenol 2003; 181:931-937.
65. Okamura T, Tanaka S, Koyama K, et al. Clinical evaluation of digital radiography based on a large-area cesium iodide-amorphous silicon flat-panel detector compared with screen-film radiography for skeletal system and abdomen. Eur Radiol 2002; 12:1741-1747.
66. Zähringer M Kamm KF, Krug B, Braun W, Coburger S, Winnekendonk G, Kruger K, Haupt G, Lackner K. Vergleich der digitalen Flachdetektorradiographie bei Urogrammen. Röfo Fortschr Geb Rontgenstr Neuen Bildgeb Verfahr 2002; 174:625-630.
78

69
67. Birnbaum BA Jacobs JE, Ramchandani P. Multiphasic renal CT: comparison of renal mass enhancement during the corticomedullary and nephrographic phases. Radiology 1996; 200:753-758.
68. Preminger GM, Tiselius HG, Assimos DG, et al. 2007 guideline for the management of ureteral calculi. J Urol 2007; 178:2418-2434.
69. Scheffel H Stoltzmann P, Frauenfelder T, et al. Dual-energy contrast-enhanced computed tomograpgy for the detection of urinary stone disease. Invest Radiol 2007; 42:823-829.
70. Moon JW, Park BK, Kim CK, Park SY. Evaluation of virtual unenhanced CT obtained from dual-energy CT urography for detecting urinary stones. Br J Radiol 2011.
71. Lidén M, Andersson T, Geijer H. Making renal stones change size-impact of CT image post processing and reader variability. Eur Radiol 2011; 21:2218-2225.
72. Berkovitz N, Simanovsky N, Katz R, Salama S, Hiller N. Coronal reconstruction of unenhanced abdominal CT for correct ureteral stone size classification. Eur Radiol; 20:1047-1051.
73. Eisner BH, Kambadakone A, Monga M, et al. Computerized tomography magnified bone windows are superior to standard soft tissue windows for accurate measurement of stone size: an in vitro and clinical study. J Urol 2009; 181:1710-1715.
74. Nadler RB, Stern JA, Kimm S, Hoff F, Rademaker AW. Coronal imaging to assess urinary tract stone size. J Urol 2004; 172:962-964.
75. Huda W, Scalzetti EM, Levin G. Technique factors and image quality as functions of patient weight at abdominal CT. Radiology 2000; 217:430-435.
76. Kalender WA, Deak P, Kellermeier M, van Straten M, Vollmar SV. Application- and patient size-dependent optimization of x-ray spectra for CT. Med Phys 2009; 36:993-1007.
77. Marin D, Nelson RC, Schindera ST, et al. Low-tube-voltage, high-tube-current multidetector abdominal CT: improved image quality and decreased radiation dose with adaptive statistical iterative reconstruction algorithm--initial clinical experience. Radiology; 2010; 254:145-153.
78. Schindera ST, Diedrichsen L, Muller HC, et al. Iterative reconstruction algorithm for abdominal multidetector CT at different tube voltages: assessment of diagnostic accuracy, image quality, and radiation dose in a phantom study. Radiology; 2011; 260:454-462.
79