asimpleclassificationsystem(the tree flowchart
TRANSCRIPT
BREAST
A simple classification system (the Tree flowchart) for breast MRIcan reduce the number of unnecessary biopsies in MRI-onlylesions
Ramona Woitek1& Claudio Spick1
& Melanie Schernthaner1 & Margaretha Rudas2 &
Panagiotis Kapetas1 & Maria Bernathova1 & Julia Furtner1 & Katja Pinker1 &
Thomas H. Helbich1& Pascal A. T. Baltzer1
Received: 2 November 2016 /Revised: 9 January 2017 /Accepted: 19 January 2017 /Published online: 8 March 2017# The Author(s) 2017. This article is published with open access at Springerlink.com
AbstractObjectives To assess whether using the Tree flowchart obvi-ates unnecessary magnetic resonance imaging (MRI)-guidedbiopsies in breast lesions only visible on MRI.Methods This retrospective IRB-approved study evaluatedconsecutive suspicious (BI-RADS 4) breast lesions only vis-ible on MRI that were referred to our institution for MRI-guided biopsy. All lesions were evaluated according to theTree flowchart for breast MRI by experienced readers. TheTree flowchart is a decision rule that assigns levels of suspi-cion to specific combinations of diagnostic criteria. Receiveroperating characteristic (ROC) curve analysis was used toevaluate diagnostic accuracy. To assess reproducibility bykappa statistics, a second reader rated a subset of 82 patients.Results There were 454 patients with 469 histopathologicallyverified lesions included (98 malignant, 371 benign lesions).The area under the curve (AUC) of the Tree flowchart was0.873 (95%CI: 0.839–0.901). The inter-reader agreement wasalmost perfect (kappa: 0.944; 95% CI 0.889–0.998). ROCanalysis revealed exclusively benign lesions if the Tree nodewas ≤2, potentially avoiding unnecessary biopsies in 103cases (27.8%).
Conclusions Using the Tree flowchart in breast lesions onlyvisible on MRI, more than 25% of biopsies could be avoidedwithout missing any breast cancer.Key Points• The Tree flowchart may obviate >25% of unnecessary MRI-guided breast biopsies.
• This decrease in MRI-guided biopsies does not cause anyfalse-negative cases.
• The Tree flowchart predicts 30.6% of malignancies with>98% specificity.
• The Tree’s high specificity aids in decision-making after be-nign biopsy results.
Keywords Magnetic resonance imaging . Breast cancer .
Scoring system . Image-guided biopsy . ROC curve
Abbreviations-LR Negative likelihood ratio+LR Positive likelihood ratioACR BI-RADS American College of Radiology
Breast Imaging and ReportingData System
ADC Apparent diffusion coefficientAUC Area under the curveben BenignCI Confidence intervalDCIS Ductal carcinoma in situDWI Diffusion-weighted imagingEUSOMA European Society of
Breast Cancer SpecialistsFA Flip angleFFE Fast field echoFLASH Fast low angle shot
Electronic supplementary material The online version of this article(doi:10.1007/s00330-017-4755-6) contains supplementary material,which is available to authorized users.
* Pascal A. T. [email protected]
1 Department of Biomedical Imaging and Image-Guided Therapy,Medical University of Vienna, Vienna, Austria
2 Clinical Institute of Pathology, Medical University of Vienna,Vienna, Austria
Eur Radiol (2017) 27:3799–3809DOI 10.1007/s00330-017-4755-6
FOV Field of viewFS Fat saturationhigh-risk High-risk lesionmal Malignantmm MillimetreMRI Magnetic resonance imagingms Millisecondn NumberNPV Negative predictive valueROC Receiver operating characteristic∑ SumSD, Standard deviationsens SensitivitySPAIR Spectral attenuated
inversion recoveryspec SpecificityST Slice thicknessSTIR Short tau inversion recoveryT TeslaTE Echo timeTI Inversion timeTIRM Turbo inversion recovery
magnitudeTR Repetition timeVABB Vacuum-assisted
breast biopsy
Introduction
Breast lesions rated as suspicious for cancer according to theAmerican College of Radiology Breast Imaging andReporting Data System (ACR BI-RADS) (e.g. assigned anACR BI-RADS ≥ 4 category) that were detected on breastmagnetic resonance imaging (MRI) require tissue samplingand histopathological workup [1–3]. Unless these lesions arevisible on other imaging modalities, they require dedicatedMRI-guided, vacuum-assisted breast biopsy (VABB) to pro-vide representative tissue sampling [1, 2, 4]. As reflected bypositive predictive values of MRI-guided biopsies below 50%in the literature [5–8], a relevant number of benign lesionsvisible on MRI undergo unnecessary VABBs that can poten-tially be avoided. MR-guided VABB is a safe and accurateprocedure in the diagnostic workup, but its application is lim-ited by availability, relatively high costs compared to otherbiopsy techniques, and the necessity to administergadolinium-containing contrast agent intravenously [9].Although minimally invasive, MR-guided biopsies carry alow risk for complications, such as infection or bleeding [9].There is general consent that unnecessary biopsies should beavoided [10] by ruling out malignancy based on imaging fea-tures. Numerous efforts have been made to decrease the num-ber of false-positive results in standard breast MRI using ad-ditional imaging techniques, such as diffusion-weighted
imaging (DWI), MR spectroscopy (MRS) and positron emis-sion tomography (PET), or sophisticated evaluation of dy-namic contrast-enhanced MRI [11–17]. Although these ap-proaches may increase specificity, there are several issues re-garding standardization, as well as time and cost effectiveness.It would be thus desirable if such an increase in specificitycould be achieved using standard breast MRI sequences only.
To report imaging features and indicate suspicion for ma-lignancy, ACR BI-RADS is the most widely used standard. Itfacilitates communication among physicians with its struc-tured common language and standardized terminology for im-age interpretation and reporting. However, it lacks preciserules according to which to assign imaging features (i.e. lesionmorphology and functional contrast enhancement kinetics) todiagnostic categories. Therefore, using ACR BI-RADS, theinter-reader agreement remains moderate, diagnostic accuracyis variable, a relevant number of unnecessary biopsies areperformed in benign lesions, the inter-reader agreement re-mains moderate, and diagnostic accuracy is variable [18–22].
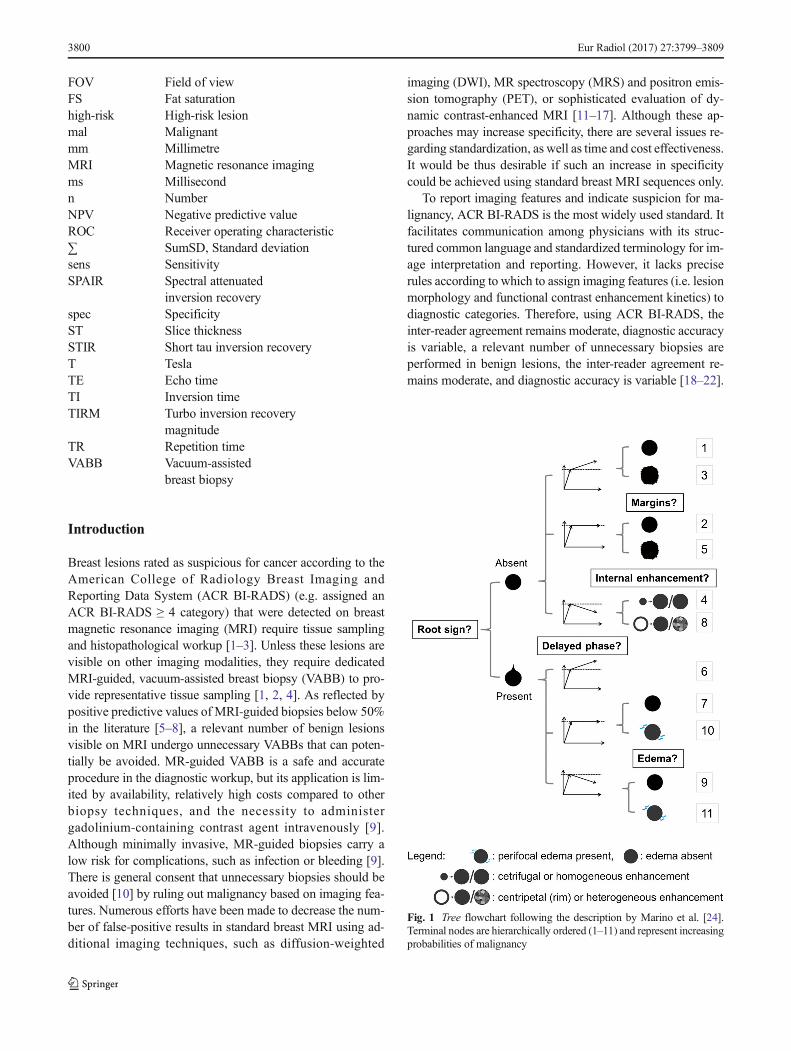
Fig. 1 Tree flowchart following the description by Marino et al. [24].Terminal nodes are hierarchically ordered (1–11) and represent increasingprobabilities of malignancy
3800 Eur Radiol (2017) 27:3799–3809
To complement the ACR BI-RADS lexicon and to increasespecificity, Baltzer et al. proposed a simple classification sys-tem (the Tree flowchart) for breast MRI to differentiate benignand malignant lesions on breast MRI [23].The Tree flowchartcombines five diagnostic criteria (the root sign, enhancementkinetics, lesion margins, internal enhancement pattern and ip-silateral oedema; Fig. 1, Table 1) to assign a diagnostic scoreto each lesion, indicating the likelihood of malignancy. Thesefive criteria were selected from a larger pool of 17 criteria,
based on their representation of possibly malignant lesion fea-tures [25–28] and their non-redundancy [23]. Neither the ini-tial exploratory evaluation of the Tree flowchart [23] nor thesubsequent independent validation study [24] specifically ad-dressed a defined clinical setting where the Tree could im-prove clinical management.
Thus, the aim of this study was to assess whether using theTree flowchart obviates unnecessary MRI-guided biopsies inMRI-only breast lesions.
Table 1 The morphological and kinetic criteria included in the Tree flowchart
Root sign The 'root sign' is characterized by a root-liketip at the lesion margin, that is surrounded on both sides by concave margin segments (red). The ´root´ sign can vary from a singletip to multiple spiculations. The root sign issuspicious for malignancy
Persistentenhancement
Progressive rise in the enhancement curve on early and delayed phase T1-weightedimages is considered not suspicious.
Plateauenhancement
No further rise of signal intensity occurs on delayed phase T1-weighted images afterearly signal increase is consideredequivocal.
Washout Decline in signal intensity on delayed images after early signal increase isconsidered suspicious.
Margins General characteristic of the margin of a lesion: smooth (not suspicious) or irregular(suspicious). Note that in a generallysmoothly bordered lesion the root sign can be present.
Internal enhancement pattern
The general pattern of enhancement of a lesion is dichotomized into suspicious (centripetal/rim enhancement orinhomogeneous) or not suspicious(centrifugal or homogeneousenhancement).
Ipsilateral edema
High water-like signal on T2-weightedimages not caused by ductectasia surrounding a lesion or diffusely distributedin the breast harbouring a lesion issuggestive of breast cancer. Entirely absentor bilateral diffuse edema is rated negative.
Eur Radiol (2017) 27:3799–3809 3801
Materials and methods
Study design
This cross-sectional, retrospective, single-centre study wasapproved by our institutional review board (IRB). The neces-sity for informed consent was waived. There were 454 con-secutive patients (mean age 52±13 years) with 469 breastlesions visible only on MRI undergoing MRI-guided VABBand/or surgical biopsy at our institution from January 2006 toDecember 2013 who were included. There was a partial over-lap of the data analysed in this study with two prior publica-tions [11, 22]. However, study rationale and results differedbetween the studies.
Imaging and MRI-guided biopsies
Based on our ethical review board-approved study protocol,a database was populated with the results obtained duringretrospective readings of diagnostic breast MRI scans. MRI
scans were performed in accordance with the EUSOMA(European Society of Breast Cancer Specialists) recommen-dations [2] at different referring institutions, on 1.5- and 3-Tesla (T) units of different vendors, using dedicated breastcoils: seven patients (0.2%) were scanned at 1.0-T, 422patients (93%) at 1.5-T and 25 patients (5.5%) at 3.0-T.There were 383 examinations (84.4%) acquired usingSiemens MAGNETOM scanners (Erlangen, Germany):Avanto (261 patients, 57.5%), Symphony (50 patients,11%), Essenza (21 patients, 4.6%), Espree (18 patients,4%), Trio (17 patients, 37.4%), Harmony (seven patients,1.5%), Verio (three patients, 0.7%), Aera (three patients,0.7%), Skyra (one patient, 0.2%) and Vision (one patient,0.2%). Seventy-one examinations (15.6%) were acquiredon Philips Scanners (Philips Medical Systems, Best,The Netherlands): Intera (61 patients, 13.4%), Achieva(seven patients, 1.5%) and Ingenia (four patients, 0.9%).The following contrast agents were applied intravenouslyat dosages of 0.1 mmol gadolinium/kg body weight:Dotarem (gadoterate meglumine/Guerbet, Villepinte,
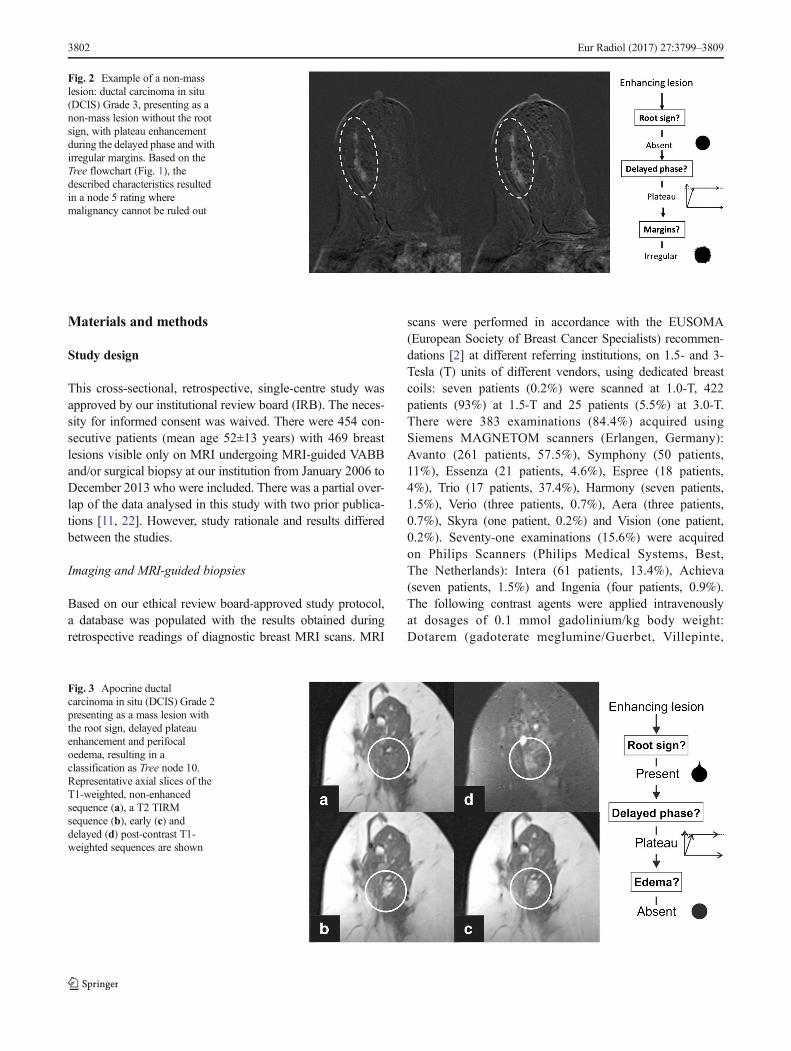
Fig. 3 Apocrine ductalcarcinoma in situ (DCIS) Grade 2presenting as a mass lesion withthe root sign, delayed plateauenhancement and perifocaloedema, resulting in aclassification as Tree node 10.Representative axial slices of theT1-weighted, non-enhancedsequence (a), a T2 TIRMsequence (b), early (c) anddelayed (d) post-contrast T1-weighted sequences are shown
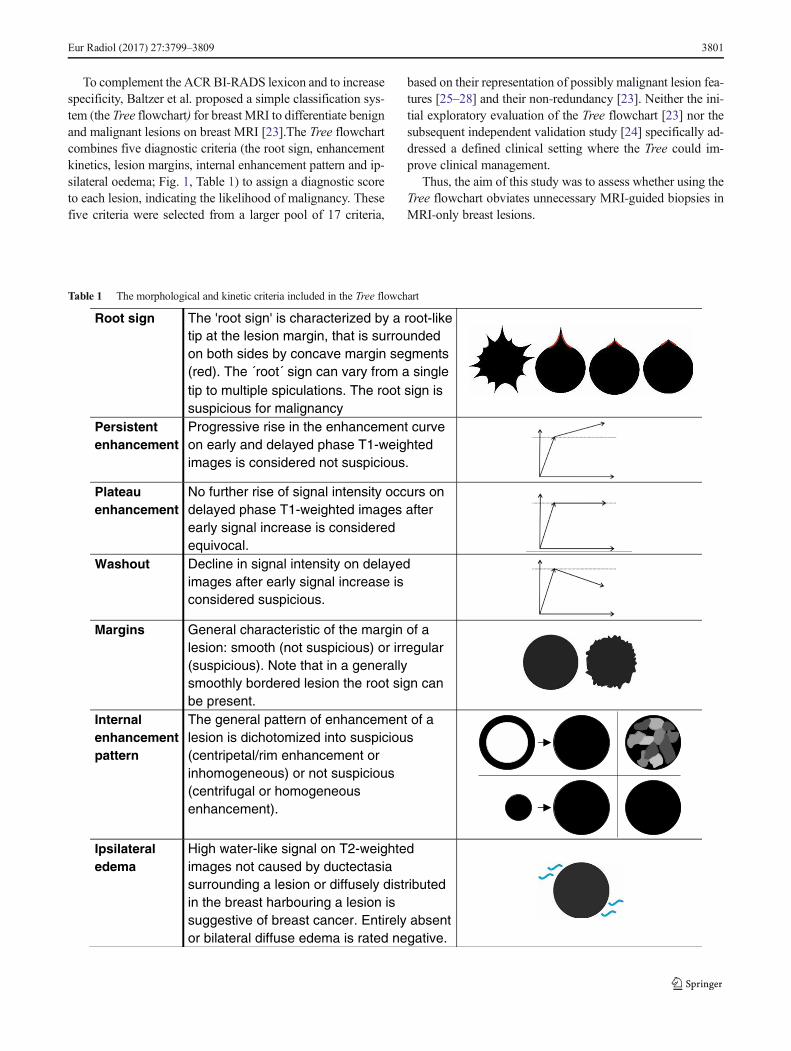
Fig. 2 Example of a non-masslesion: ductal carcinoma in situ(DCIS) Grade 3, presenting as anon-mass lesion without the rootsign, with plateau enhancementduring the delayed phase and withirregular margins. Based on theTree flowchart (Fig. 1), thedescribed characteristics resultedin a node 5 rating wheremalignancy cannot be ruled out
3802 Eur Radiol (2017) 27:3799–3809
France), Multihance (gadobenate dimeglumine/BraccoDiagnostics, Princeton, NJ, USA), Gadovist (gadobutrol/Bayer Pharmaceuticals, Berlin, Germany), Prohance(gadoteridol/Bracco Diagnostics, Princeton, NJ, USA) andOmniscan (gadodiamide/ GE Healthcare, Princeton, NJ,USA). The detailed sequence parameters of the T2-weighted and the dynamic T1-weighted sequences areshown in ESM 1.
All lesions classified as BI-RADS 4 (suspicious) werebiopsied under MRI-guidance at our institution on a 1.5-Tsystem (Avanto, Siemens) using a dedicated double breastimaging and intervention coil (InVivo, Philips).
Written informed consent for the MRI-guided VABB wasobtained from all patients in advance.
MRI-guided VABBs were performed as previously de-scribed [22]. For lesion localization, a shortened imagingprotocol was acquired: before and after the application ofintravenous (IV) contrast agent, dynamic, contrast-en-hanced, T1-weighted gradient echo sequences were ac-quired and subtraction images were obtained. The T1-weighted sequence was repeated to verify needle position-ing during the biopsy. After VABB, the biopsy sites weremarked with MRI-compatible radiopaque clip markers. Anexperienced board-certified breast pathologist (M.R.) per-formed histopathological tissue analyses and applied the Bclassification for diagnosis [29]. Histopathological resultsand the MRI were compared in interdisciplinary consen-sus. In cases of discrepancy between imaging results andhistopathology, and in lesions with uncertain malignantpotential (B3), surgical biopsy was performed, after wirelocalization, by board-certified, experienced breast sur-geons. In case of a benign finding at histopathology, thepatients were followed up with breast MRI for at least 12months.
Data analysis
All examinations were analysed by an experienced breast im-aging radiologist (P.A.B, >10 years of breast MRI experi-ence), and 82 consecutive cases were read by a second readerindependently (C.S., radiology resident) to assess inter-reader
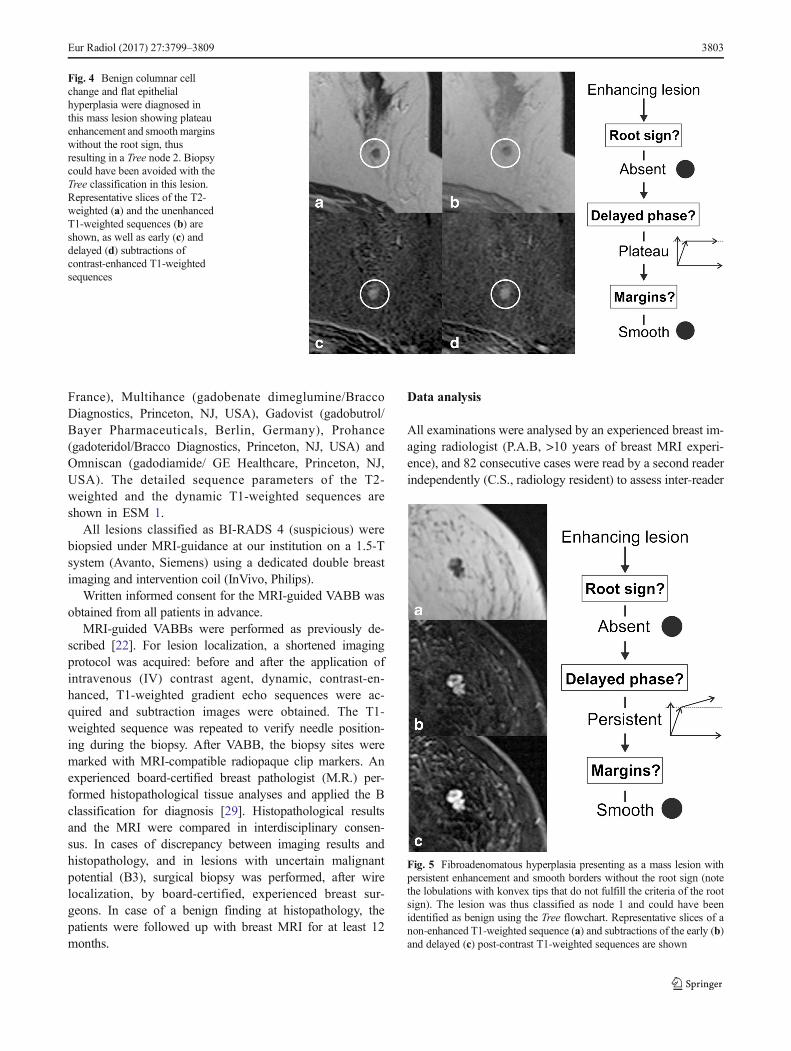
Fig. 4 Benign columnar cellchange and flat epithelialhyperplasia were diagnosed inthis mass lesion showing plateauenhancement and smoothmarginswithout the root sign, thusresulting in a Tree node 2. Biopsycould have been avoided with theTree classification in this lesion.Representative slices of the T2-weighted (a) and the unenhancedT1-weighted sequences (b) areshown, as well as early (c) anddelayed (d) subtractions ofcontrast-enhanced T1-weightedsequences
Fig. 5 Fibroadenomatous hyperplasia presenting as a mass lesion withpersistent enhancement and smooth borders without the root sign (notethe lobulations with konvex tips that do not fulfill the criteria of the rootsign). The lesion was thus classified as node 1 and could have beenidentified as benign using the Tree flowchart. Representative slices of anon-enhanced T1-weighted sequence (a) and subtractions of the early (b)and delayed (c) post-contrast T1-weighted sequences are shown
Eur Radiol (2017) 27:3799–3809 3803

agreement. Both readers were blinded to the final histopatho-logical diagnosis and previous reading results, if available.
The readers were asked to classify all identified lesionsfollowing the Tree flowchart. This simple classification sys-tem is based on five morphological and kinetic criteria (rootsign, contrast enhancement kinetics, lesion margins, internalenhancement patterns and oedema; Table 1 and Fig. 1) evalu-ated on T2-weighted sequences and dynamic, contrast-en-hanced, T1-weighted sequences. The Tree flowchart contains11 assignment categories that correspond to an increasingprobability of malignancy (1 = lowest, cancer very unlikely,to 11 = highest, cancer very likely; Fig. 1) [23, 24]. Examplesof lesions are given in Figs. 2, 3, 4 and 5. A diagnostic cate-gory was chosen for each lesion by following the Tree flow-chart and was noted in a spreadsheet (Fig. 1).
Statistical analyses
SPSS 23.0 (SPSS, IBM, Chicago, IL, USA) and MedCalc 15(MedCalc software bvba, Ostend, Belgium) were used for sta-tistical analyses. Inter-reader agreement in the assigned Treecategories was assessed using kappa statistics. A receiver oper-ating characteristic (ROC) analysis was performed and the areaunder the ROC curve was measured to determine overall diag-nostic performance. Sensitivity, specificity and likelihood ratioswere calculated at different cut-off values. P-values ≤0.05 wereconsidered statistically significant. Two cut-off values, to ruleout and rule in malignancy, were selected according to thecalculated sensitivities, specificities and numbers of false-positive and false-negative results (low cut-off value withhighest sensitivity and lowest false-positive results; high cut-off value with high specificity and low false-negative results).
Results
Patients and lesions
Ninety-eight of the included 469 breast lesions (20.9%) werehistopathologically diagnosed as malignant, and 371 (79.1%)lesions as benign.
There were 270 lesions (57.6%) that presented as masses,whereas 199 (42.4%) were non-mass lesions. Of all 270 masslesions, 68 (25.2%) were malignant and 202 (74.8%) benign.Of the 199 non-mass lesions, 30 (15.1%) were malignant and169 (84.9%) benign. Detailed size descriptions and descrip-tive statistics of histopathological diagnoses are given inTables 2 and 3.
ROC curve analyses
Using the Tree flowchart for all lesions, the overall accu-racy represented by the area under the ROC curve (AUC)
Table 2 Size distributions in mass and non-mass lesions stratified by histopathological results
Lesion type n Mean diameter (mm) Histology n Mean diameter (mm)
Mass lesions 270 9±5 (SD) Malignant 68 11±6 (SD)
Benign 202 9±5 (SD)
Non-mass lesions 199 26±15 (SD) Malignant 30 35±16 (SD)
Benign 169 24±14 (SD)
Total 469 16±13 (SD) Malignant 98 18±15 (SD)
Benign 371 16±12 (SD)
SD standard deviation, n number
Table 3 Descriptive statistics for histopathological diagnoses amongall lesions stratified by Tree nodes
Node Benign High-risk DCIS Invasive cancer Total
1 n 69 8 0 0 77
% 89.6 10.4 0.0 0.0
2 n 23 3 0 0 26
% 88.5 11.5 0.0 0.0
3 n 154 45 9 9 209
% 73.7 21.5 4.3 4.3
4 n 11 1 0 1 13
% 84.6 7.7 0.0 7.7
5 n 31 9 10 8 58
% 53.4 15.5 17.2 13.8
7 n 10 4 5 9 28
% 35.7 14.3 17.9 32.1
8 n 10 6 6 2 24
% 41.7 25.0 25.0 8.3
9 n 4 1 1 11 17
% 23.5 5.9 5.9 64.7
10 n 3 0 2 5 10
% 30.0 0.0 20.0 50.0
11 n 1 0 0 6 7
% 14.3 0.0 0.0 85.7
∑ n 316 77 31 45 469
% 67.4 16.4 6.6 9.6 100.0
n number, ductal carcinoma in situ, High-risk high-risk lesion
3804 Eur Radiol (2017) 27:3799–3809
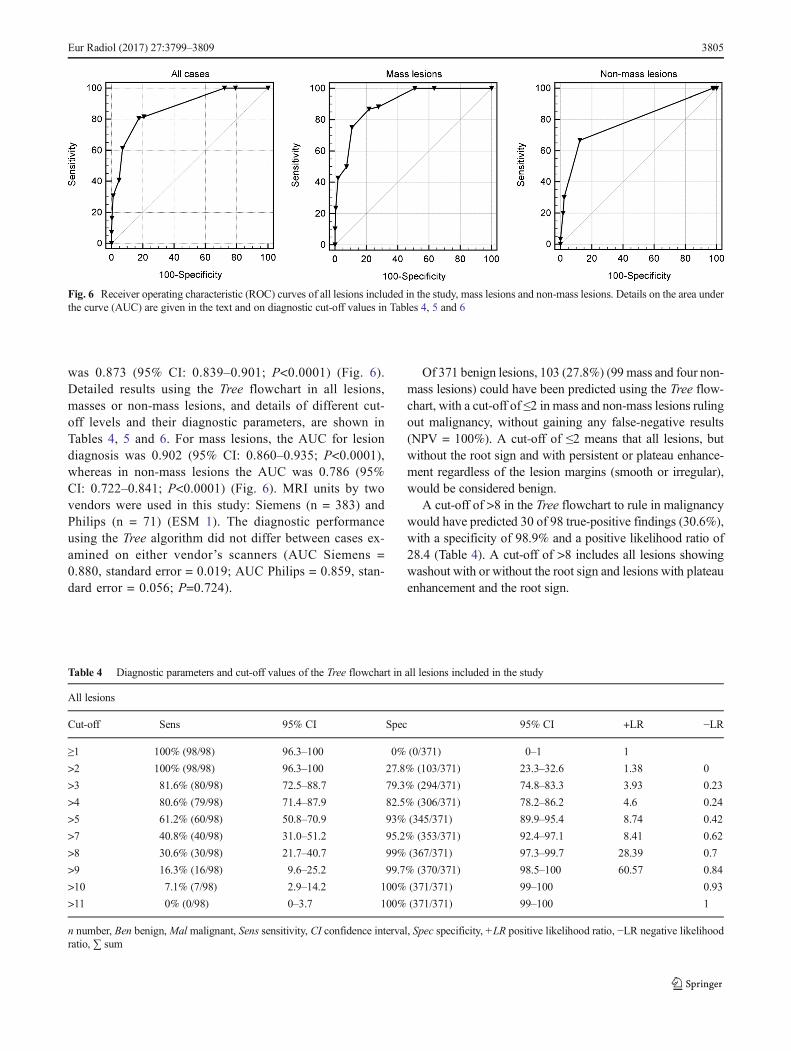
was 0.873 (95% CI: 0.839–0.901; P<0.0001) (Fig. 6).Detailed results using the Tree flowchart in all lesions,masses or non-mass lesions, and details of different cut-off levels and their diagnostic parameters, are shown inTables 4, 5 and 6. For mass lesions, the AUC for lesiondiagnosis was 0.902 (95% CI: 0.860–0.935; P<0.0001),whereas in non-mass lesions the AUC was 0.786 (95%CI: 0.722–0.841; P<0.0001) (Fig. 6). MRI units by twovendors were used in this study: Siemens (n = 383) andPhilips (n = 71) (ESM 1). The diagnostic performanceusing the Tree algorithm did not differ between cases ex-amined on either vendor’s scanners (AUC Siemens =0.880, standard error = 0.019; AUC Philips = 0.859, stan-dard error = 0.056; P=0.724).
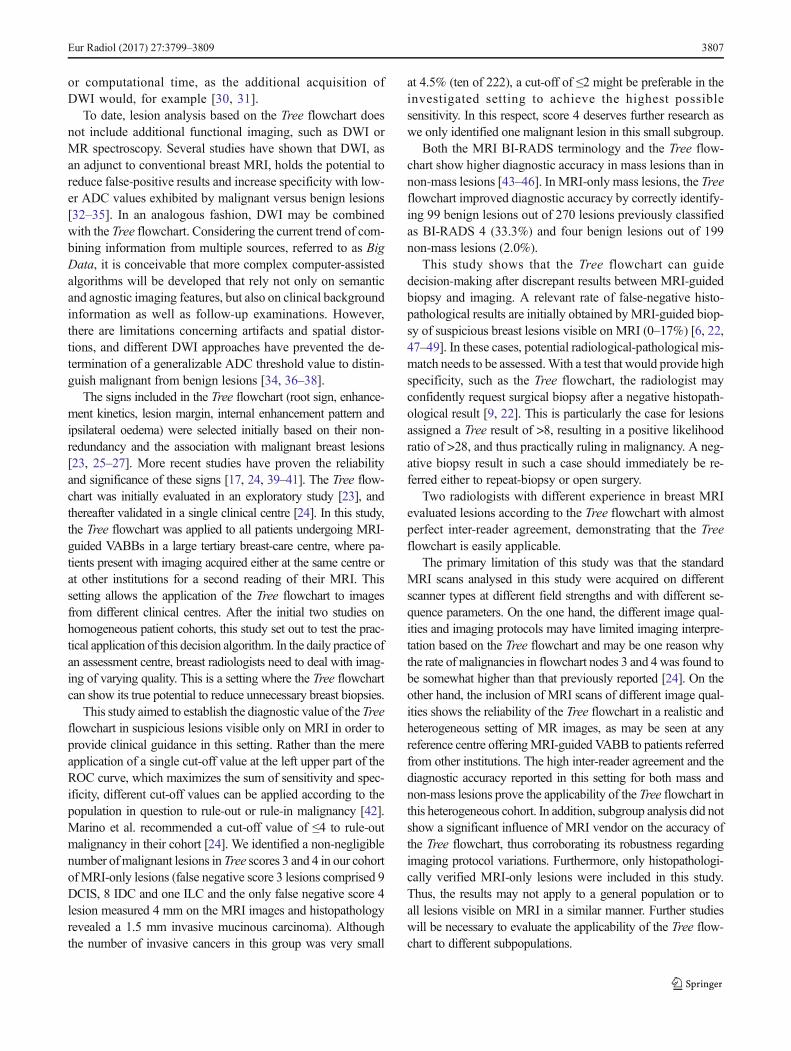
Of 371 benign lesions, 103 (27.8%) (99 mass and four non-mass lesions) could have been predicted using the Tree flow-chart, with a cut-off of ≤2 in mass and non-mass lesions rulingout malignancy, without gaining any false-negative results(NPV = 100%). A cut-off of ≤2 means that all lesions, butwithout the root sign and with persistent or plateau enhance-ment regardless of the lesion margins (smooth or irregular),would be considered benign.
A cut-off of >8 in the Tree flowchart to rule in malignancywould have predicted 30 of 98 true-positive findings (30.6%),with a specificity of 98.9% and a positive likelihood ratio of28.4 (Table 4). A cut-off of >8 includes all lesions showingwashout with or without the root sign and lesions with plateauenhancement and the root sign.
Table 4 Diagnostic parameters and cut-off values of the Tree flowchart in all lesions included in the study
All lesions
Cut-off Sens 95% CI Spec 95% CI +LR −LR
≥1 100% (98/98) 96.3–100 0% (0/371) 0–1 1
>2 100% (98/98) 96.3–100 27.8% (103/371) 23.3–32.6 1.38 0
>3 81.6% (80/98) 72.5–88.7 79.3% (294/371) 74.8–83.3 3.93 0.23
>4 80.6% (79/98) 71.4–87.9 82.5% (306/371) 78.2–86.2 4.6 0.24
>5 61.2% (60/98) 50.8–70.9 93% (345/371) 89.9–95.4 8.74 0.42
>7 40.8% (40/98) 31.0–51.2 95.2% (353/371) 92.4–97.1 8.41 0.62
>8 30.6% (30/98) 21.7–40.7 99% (367/371) 97.3–99.7 28.39 0.7
>9 16.3% (16/98) 9.6–25.2 99.7% (370/371) 98.5–100 60.57 0.84
>10 7.1% (7/98) 2.9–14.2 100% (371/371) 99–100 0.93
>11 0% (0/98) 0–3.7 100% (371/371) 99–100 1
n number, Ben benign,Mal malignant, Sens sensitivity, CI confidence interval, Spec specificity, +LR positive likelihood ratio, −LR negative likelihoodratio, ∑ sum
Fig. 6 Receiver operating characteristic (ROC) curves of all lesions included in the study, mass lesions and non-mass lesions. Details on the area underthe curve (AUC) are given in the text and on diagnostic cut-off values in Tables 4, 5 and 6
Eur Radiol (2017) 27:3799–3809 3805

Inter-reader agreement
Two readers independently read 82 consecutive cases. Thekappa agreement among the two readers for the characteriza-tion of breast lesions according to the Tree flowchart wasalmost perfect (k =0.944 [95% CI: 0.889–0.998]).
Discussion
Our study shows that using a simple classification system (theTree flowchart), malignancy can be excluded in 27.8% ofMRI-only lesions previously classified as BI-RADS 4, with-out resulting in any false-negative findings, thus leading to asubstantial decrease in unnecessary biopsies. Therefore, theTree flowchart holds the potential to reduce the number of
costly and time-consuming MRI-guided biopsies, and there-fore to decrease healthcare costs, patient discomfort and therisk of possible adverse effects due to the invasive procedure.The Tree flowchart is intuitive and suitable for readers ofdifferent levels of experience, and it is easily applicable inthe routine clinical setting, as it requires standard breast MRIsequences only.
As the Tree flowchart is based on T2-weighted se-quences and dynamic, contrast-enhanced, T1-weighted se-quences that are generally recommended for every breastMRI, it does not require any additional imaging [2]. Ofnote, short tau inversion recovery (STIR) sequences are assuitable as T2-weighted TSE sequences for the assess-ment of oedema [28]. Furthermore, the Tree flowchart isbased on simple dynamic and morphological features.Thus, its application does not require any extra reading
Table 5 Diagnostic parameters and cut-off values of the Tree flowchart in mass lesions
Mass lesions
Cut-off Sens 95% CI Spec 95% CI +LR −LR
≥1 100% (68/68) 94. 7–100 0% (0/202) 0–1.8 1
>2 100% (68/68) 94.7–100 49% (99/202) 41.9–56.1 1.96 0
>3 88.2% (60/68) 78.1–94.8 72.3% (146/202) 65.6–78.3 3.18 0.16
>4 86.8% (59/68) 76.4–93.8 78.2% (158/202) 71.9–83.7 3.98 0.17
>5 75% (51/68) 63–84.7 89.1% (180/202) 84–93 6.89 0.28
>7 50% (34/68) 37.6–62.4 92.6% (187/202) 88–95.8 6.73 0.54
>8 42.7% (29/68) 30.7–55.2 98% (198/202) 95–99.5 21.54 0.59
>9 23.5% (16/68 14.1–35.4 99.5% (201/202) 97.3–100 47.53 0.77
>10 10.3% (7/68) 4.2–20.1 100% (202/202) 98.2–100 0.9
>11 0% (0/68) 0–5.3 100% (202/202) 98.2–100 1
n number, Ben benign,Mal malignant, Sens sensitivity, CI confidence interval, Spec specificity, +LR positive likelihood ratio, −LR negative likelihoodratio, ∑ sum
Table 6 Diagnostic parameters and cut-off values of the Tree flowchart in non-mass lesions.
Non-mass lesions
Cut-off Sens 95% CI Spec 95% CI +LR -LR
≥1 100% (30/30) 88.4–100 0% 0–2.2 1
>2 100% (30/30) 88.4–100 2.37% (4/169) 0.6–5.9 1.02 0
>3 66.67% (20/30) 47.2–82.7 87.57% (148/169) 81.6–92.1 5.37 0.38
>5 30% (9/30) 14.7–49.4 97.63% (165/169) 94.1–99.4 12.67 0.72
>7 20% (6/30) 7.7–38.6 98.22% (166/169) 94.9–99.6 11.27 0.81
>8 3.33% (1/30) 0.1–17.2 100% (169/169) 97.8–100 0.97
>9 0% (0/30) 0–11.6 100% (169/169) 97.8–100 1
n number, Ben benign,Mal malignant, Sens sensitivity, CI confidence interval, Spec specificity, +LR positive likelihood ratio, −LR negative likelihoodratio, ∑ sum
3806 Eur Radiol (2017) 27:3799–3809
or computational time, as the additional acquisition ofDWI would, for example [30, 31].
To date, lesion analysis based on the Tree flowchart doesnot include additional functional imaging, such as DWI orMR spectroscopy. Several studies have shown that DWI, asan adjunct to conventional breast MRI, holds the potential toreduce false-positive results and increase specificity with low-er ADC values exhibited by malignant versus benign lesions[32–35]. In an analogous fashion, DWI may be combinedwith the Tree flowchart. Considering the current trend of com-bining information from multiple sources, referred to as BigData, it is conceivable that more complex computer-assistedalgorithms will be developed that rely not only on semanticand agnostic imaging features, but also on clinical backgroundinformation as well as follow-up examinations. However,there are limitations concerning artifacts and spatial distor-tions, and different DWI approaches have prevented the de-termination of a generalizable ADC threshold value to distin-guish malignant from benign lesions [34, 36–38].
The signs included in the Tree flowchart (root sign, enhance-ment kinetics, lesion margin, internal enhancement pattern andipsilateral oedema) were selected initially based on their non-redundancy and the association with malignant breast lesions[23, 25–27]. More recent studies have proven the reliabilityand significance of these signs [17, 24, 39–41]. The Tree flow-chart was initially evaluated in an exploratory study [23], andthereafter validated in a single clinical centre [24]. In this study,the Tree flowchart was applied to all patients undergoing MRI-guided VABBs in a large tertiary breast-care centre, where pa-tients present with imaging acquired either at the same centre orat other institutions for a second reading of their MRI. Thissetting allows the application of the Tree flowchart to imagesfrom different clinical centres. After the initial two studies onhomogeneous patient cohorts, this study set out to test the prac-tical application of this decision algorithm. In the daily practice ofan assessment centre, breast radiologists need to deal with imag-ing of varying quality. This is a setting where the Tree flowchartcan show its true potential to reduce unnecessary breast biopsies.
This study aimed to establish the diagnostic value of the Treeflowchart in suspicious lesions visible only on MRI in order toprovide clinical guidance in this setting. Rather than the mereapplication of a single cut-off value at the left upper part of theROC curve, which maximizes the sum of sensitivity and spec-ificity, different cut-off values can be applied according to thepopulation in question to rule-out or rule-in malignancy [42].Marino et al. recommended a cut-off value of ≤4 to rule-outmalignancy in their cohort [24]. We identified a non-negligiblenumber ofmalignant lesions in Tree scores 3 and 4 in our cohortof MRI-only lesions (false negative score 3 lesions comprised 9DCIS, 8 IDC and one ILC and the only false negative score 4lesion measured 4 mm on the MRI images and histopathologyrevealed a 1.5 mm invasive mucinous carcinoma). Althoughthe number of invasive cancers in this group was very small
at 4.5% (ten of 222), a cut-off of ≤2 might be preferable in theinvestigated setting to achieve the highest possiblesensitivity. In this respect, score 4 deserves further research aswe only identified one malignant lesion in this small subgroup.
Both the MRI BI-RADS terminology and the Tree flow-chart show higher diagnostic accuracy in mass lesions than innon-mass lesions [43–46]. In MRI-only mass lesions, the Treeflowchart improved diagnostic accuracy by correctly identify-ing 99 benign lesions out of 270 lesions previously classifiedas BI-RADS 4 (33.3%) and four benign lesions out of 199non-mass lesions (2.0%).
This study shows that the Tree flowchart can guidedecision-making after discrepant results between MRI-guidedbiopsy and imaging. A relevant rate of false-negative histo-pathological results are initially obtained byMRI-guided biop-sy of suspicious breast lesions visible on MRI (0–17%) [6, 22,47–49]. In these cases, potential radiological-pathological mis-match needs to be assessed.With a test that would provide highspecificity, such as the Tree flowchart, the radiologist mayconfidently request surgical biopsy after a negative histopath-ological result [9, 22]. This is particularly the case for lesionsassigned a Tree result of >8, resulting in a positive likelihoodratio of >28, and thus practically ruling in malignancy. A neg-ative biopsy result in such a case should immediately be re-ferred either to repeat-biopsy or open surgery.
Two radiologists with different experience in breast MRIevaluated lesions according to the Tree flowchart with almostperfect inter-reader agreement, demonstrating that the Treeflowchart is easily applicable.
The primary limitation of this study was that the standardMRI scans analysed in this study were acquired on differentscanner types at different field strengths and with different se-quence parameters. On the one hand, the different image qual-ities and imaging protocols may have limited imaging interpre-tation based on the Tree flowchart and may be one reason whythe rate of malignancies in flowchart nodes 3 and 4 was found tobe somewhat higher than that previously reported [24]. On theother hand, the inclusion of MRI scans of different image qual-ities shows the reliability of the Tree flowchart in a realistic andheterogeneous setting of MR images, as may be seen at anyreference centre offeringMRI-guided VABB to patients referredfrom other institutions. The high inter-reader agreement and thediagnostic accuracy reported in this setting for both mass andnon-mass lesions prove the applicability of the Tree flowchart inthis heterogeneous cohort. In addition, subgroup analysis did notshow a significant influence of MRI vendor on the accuracy ofthe Tree flowchart, thus corroborating its robustness regardingimaging protocol variations. Furthermore, only histopathologi-cally verified MRI-only lesions were included in this study.Thus, the results may not apply to a general population or toall lesions visible on MRI in a similar manner. Further studieswill be necessary to evaluate the applicability of the Tree flow-chart to different subpopulations.
Eur Radiol (2017) 27:3799–3809 3807

In conclusion, this study showed that the Tree flowchart,with a cut-off value of ≤2, can reduce the number of biopsiesin MRI-only lesions by as much as 27.8%, with no false-negative cases, thus potentially decreasing healthcare costsand patient discomfort.
Acknowledgements Open access funding provided by MedicalUniversity of Vienna.
Compliance with ethical standards
Guarantor The scientific guarantor of this publication is Pascal A.T.Baltzer
Conflict of interest The authors of this manuscript declare no relation-ships with any companies, whose products or services may be related tothe subject matter of the article.
Statistics and biometry One of the authors has significant statisticalexpertise. No complex statistical methods were necessary for this paper.
Ethical approval Institutional Review Board approval was obtained.
Informed consent Written informed consent was waived by theInstitutional Review Board.
Study subjects or cohorts overlap Some study subjects or cohortshave been previously reported in:
Spick C, SchernthanerM, Pinker K, et al. (2016)MR-guided vacuum-assisted breast biopsy of MRI-only lesions: a single center experience.Eur Radiol. doi: 10.1007/s00330-016-4267-9, and Spick C, Pinker-Domenig K, Rudas M, et al. (2014) MRI-only lesions: application ofdiffusion-weighted imaging obviates unnecessary MR-guided breast bi-opsies. Eur Radiol 24:1204–10. doi: 10.1007/s00330-014-3153-6
Methodology • retrospective• diagnostic study• performed at one institution
Open Access This article is distributed under the terms of the CreativeCommons At t r ibut ion 4 .0 In te rna t ional License (h t tp : / /creativecommons.org/licenses/by/4.0/), which permits unrestricted use,distribution, and reproduction in any medium, provided you giveappropriate credit to the original author(s) and the source, provide a linkto the Creative Commons license, and indicate if changes were made.
References
1. Mann RM, Kuhl CK, Kinkel K, Boetes C (2008) Breast MRI:guidelines from the European Society of Breast Imaging. EurRadiol 18:1307–1318
2. Sardanelli F, Boetes C, Borisch B et al (2010) Magnetic resonanceimaging of the breast: recommendations from the EUSOMAwork-ing group. Eur J Cancer 46:1296–1316
3. Reston VA (2013) The American College of Radiology (ACR)(2013) Breast Imaging Reporting and Data System Atlas (BI-RADS® Atlas)
4. Spick C, Baltzer PAT (2014) Diagnostic utility of second-look USfor breast lesions identified at MR imaging: systematic review andmeta-analysis. Radiology 273:401–409
5. Perlet C, Heywang-Kobrunner SH, Heinig A et al (2006) Magneticresonance-guided, vacuum-assisted breast biopsy: results from aEuropean multicenter study of 538 lesions. Cancer 106:982–990
6. Schrading S, Simon B, Braun M et al (2010) MRI-guided breastbiopsy: influence of choice of vacuum biopsy system on the modeof biopsy of MRI-only suspicious breast lesions. AJR Am JRoentgenol 194:1650–1657
7. Crystal P, Sadaf A, Bukhanov K et al (2011) High-risk lesionsdiagnosed at MRI-guided vacuum-assisted breast biopsy: can un-derestimation be predicted? Eur Radiol 21:582–589
8. Fischer U, Schwethelm L, Baum FT et al (2009) Effort, accuracyand histology of MR-guided vacuum biopsy of suspicious breastlesions–retrospective evaluation after 389 interventions. RöFoFortschritte auf dem Gebiete der Röntgenstrahlen und der Nukl181:774–781
9. Floery D, Helbich TH (2006) MRI-Guided percutaneous biopsy ofbreast lesions: materials, techniques, success rates, and manage-ment in patients with suspected radiologic-pathologic mismatch.Magn Reson Imaging Clin N Am 14:411–25
10. Lee CI, BensinkME, Berry K et al (2016) Performance goals for anadjunct diagnostic test to reduce unnecessary biopsies after screen-ing mammography: analysis of costs, benefits, and consequences. JAm Coll Radiol 13:R81–R88
11. Spick C, Pinker-Domenig K, Rudas M et al (2014) MRI-only lesions: application of diffusion-weighted imaging obvi-ates unnecessary MR-guided breast biopsies. Eur Radiol 24:1204–1210
12. Pinker K, BognerW, Baltzer P et al (2014) Improved differentiationof benign and malignant breast tumors with multiparametric18fluorodeoxyglucose positron emission tomographymagnetic res-onance imaging: a feasibility study. Clin Cancer Res 20:3540–3549
13. Pinker K, Bogner W, Baltzer P et al (2014) Improved diagnosticaccuracy with multiparametric magnetic resonance imaging of thebreast using dynamic contrast-enhanced magnetic resonance imag-ing, diffusion-weighted imaging, and 3-dimensional proton mag-netic resonance spectroscopic imaging. Invest Radiol 49:421–430
14. Montemezzi S, Cavedon C, Camera L et al (2016) 1H-MR spec-troscopy of suspicious breast mass lesions at 3T: a clinical experi-ence. Radiol Med. doi:10.1007/s11547-016-0713-7
15. Magometschnigg HF, Baltzer PA, Fueger B et al (2015) Diagnosticaccuracy of 18F-FDG PET/CT compared with that of contrast-enhanced MRI of the breast at 3 T. Eur J Nucl Med Mol Imaging42:1656–1665
16. Pinker K, Helbich TH, Morris EA (2017) The potential ofmultiparametric MRI of the breast. Br J Radiol 90:20160715
17. Kim SG, FreedM, Leite APK et al (2016) Separation of benign andmalignant breast lesions using dynamic contrast enhancedMRI in abiopsy cohort. J Magn Reson Imaging. doi:10.1002/jmri.25501
18. Ikeda DM, Hylton NM, Kinkel K et al (2001) Development, stan-dardization, and testing of a lexicon for reporting contrast-enhancedbreast magnetic resonance imaging studies. J Magn Reson Imaging13:889–895
19. Kim SJ, Morris EA, Liberman L et al (2001) Observer variabilityand applicability of BI-RADS terminology for breast MR imaging:invasive carcinomas as focal masses. AJR Am J Roentgenol 177:551–557
20. Kinkel K, Helbich TH, Esserman LJ et al (2000) Dynamic high-spatial-resolution MR imaging of suspicious breast lesions: diag-nostic criteria and interobserver variability. AJR Am J Roentgenol175:35–43
21. Riedl CC, Luft N, Bernhart C et al (2015) Triple-modality screeningtrial for familial breast cancer underlines the importance of magnet-ic resonance imaging and questions the role of mammography andultrasound regardless of patient mutation status, age, and breastdensity. J Clin Oncol 33:1128–1135
3808 Eur Radiol (2017) 27:3799–3809
22. Spick C, Schernthaner M, Pinker K et al (2016) MR-guided vacu-um-assisted breast biopsy of MRI-only lesions: a single center ex-perience. Eur Radiol. doi:10.1007/s00330-016-4267-9
23. Baltzer PAT, Dietzel M, Kaiser WA (2013) A simple and robustclassification tree for differentiation between benign and malignantlesions in MR-mammography. Eur Radiol 23:2051–2060
24. Marino MA, Clauser P, Woitek R et al (2015) A simple scoringsystem for breast MRI interpretation: does it compensate for readerexperience? Eur Radiol. doi:10.1007/s00330-015-4075-7
25. KaiserWA, Zeitler E (1989)MR imaging of the breast: fast imagingsequences with and without Gd-DTPA. preliminary observations.Radiology 170:681–686
26. Dietzel M, Baltzer PA, Vag T et al (2010) Differential diagnosis ofbreast lesions 5 mm or less. J Comput Assist Tomogr 34:456–464
27. Malich A, Fischer DR, Wurdinger S et al (2005) Potential MRIinterpretation model: differentiation of benign from malignantbreast masses. AJR Am J Roentgenol 185:964–970
28. Baltzer PAT, Gajda DM (2011) A systematic comparison of twopulse sequences for edema assessment inMR-mammography. Eur JRadiol. doi:10.1016/j.ejrad.2011.03.001
29. European Breast Cancer Network (EBCN) (2006) Quality assur-ance guidelines for pathology. In: Perry N, Broeders M, de WolfC, et al (eds) Eur. Guidel. Qual. Assur. breast cancer Screen. diag-nosis, 4th ed. pp 219–255
30. Bickel H, Pinker-Domenig K, Bogner W et al (2015) Quantitativeapparent diffusion coefficient as a noninvasive imaging biomarkerfor the differentiation of invasive breast cancer and ductal carcino-ma in situ. Invest Radiol 50:95–100
31. Pinker K, Bickel H, Helbich TH et al (2013) Combined contrast-enhanced magnetic resonance and diffusion-weighted imagingreading adapted to the "Breast Imaging Reporting and DataSystem" for multiparametric 3-T imaging of breast lesions.Eur Radiol 23:1791–1802
32. Zhang L, Tang M, Min Z et al (2016) Accuracy of combined dy-namic contrast-enhanced magnetic resonance imaging anddiffusion-weighted imaging for breast cancer detection: a meta-analysis. Acta Radiol 57:651–660
33. Chen X, Li W, Zhang Y et al (2010) Meta-analysis of quantitativediffusion-weighted MR imaging in the differential diagnosis ofbreast lesions. BMC Cancer 10:693
34. Partridge SC, Nissan N, Rahbar H (2016) Diffusion-weightedbreast MRI: Clinical applications and emerging techniques. JMagn Reson Imaging. doi:10.1002/jmri.25479
35. Baltzer A, Dietzel M, Kaiser CG, Baltzer PA (2016) Combinedreading of contrast enhanced and diffusion weighted magnetic res-onance imaging by using a simple sum score. Eur Radiol 26:884–891
36. Peters NHGM, Vincken KL, van den Bosch MAAJ et al (2010)Quantitative diffusion weighted imaging for differentiation of be-nign and malignant breast lesions: the influence of the choice of b-values. J Magn Reson Imaging 31:1100–1105
37. Le Bihan D, Poupon C, Amadon A, Lethimonnier F (2006)Artifacts and pitfalls in diffusion MRI. J Magn Reson Imaging24:478–488
38. Partridge SC, DeMartini WB, Kurland BF et al (2009) Quantitativediffusion-weighted imaging as an adjunct to conventional breastMRI for improved positive predictive value. AJR Am JRoentgenol 193:1716–1722
39. Abe H, Mori N, Tsuchiya K et al (2016) Kinetic analysis of benignand malignant breast lesions with ultrafast dynamic contrast-enhanced MRI: comparison with standard kinetic assessment. AmJ Roentgenol 207:1159–1166
40. Kaiser CG, Herold M, Baltzer PAT et al (2015) Is ‘PrepectoralEdema’ a morphologic sign for malignant breast tumors? AcadRadiol 22:684–689
41. Wang L, Du J, Li F-H et al (2013) Diagnostic efficacy of contrast-enhanced sonography by combined qualitative and quantitativeanalysis in breast lesions: a comparative study with magnetic reso-nance imaging. J Ultrasound Med 32:1805–1814
42. Altman DG, Bland JM (1994) Diagnostic tests 3: receiver operatingcharacteristic plots. BMJ 309:188
43. Gutierrez RL, DeMartiniWB, Eby PR et al (2009) BI-RADS lesioncharacteristics predict likelihood of malignancy in breast MRI formasses but not for nonmasslike enhancement. AJR Am JRoentgenol 193:994–1000
44. Benndorf M, Baltzer PAT, Kaiser WA (2011) Assessing the degreeof collinearity among the lesion features of the MRI BI-RADSlexicon. Eur J Radiol 80:e322–e324
45. Jansen SA, Shimauchi A, Zak L et al (2011) The diverse pathologyand kinetics of mass, nonmass, and focus enhancement on MRimaging of the breast. J Magn Reson Imaging 33:1382–1389
46. Baltzer PAT, Benndorf M, Dietzel M et al (2010) False-positivefindings at contrast-enhanced breast MRI: a BI-RADS descriptorstudy. AJR Am J Roentgenol 194:1658–1663
47. Rauch GM, Dogan BE, Smith TB et al (2012) Outcome analysis of9-gauge MRI-guided vacuum-assisted core needle breast biopsies.AJR Am J Roentgenol 198:292–299
48. Imschweiler T, Haueisen H, Kampmann G et al (2014)MRI-guidedvacuum-assisted breast biopsy: comparison with stereotacticallyguided and ultrasound-guided techniques. Eur Radiol 24:128–135
49. Liberman L, Bracero N, Morris E et al (2005) MRI-guided 9-gaugevacuum-assisted breast biopsy: initial clinical experience. AJR AmJ Roentgenol 185:183–193
Eur Radiol (2017) 27:3799–3809 3809