7. flowchart - dl.icdst.org · flowchart is to write the sequence of steps and logic of solving a...
TRANSCRIPT
90
Aim: In this lesson, you will learn: To use spreadsheet to enter data. Do simple calculations like sum, percentage and average on the given data.
7. Flowchart
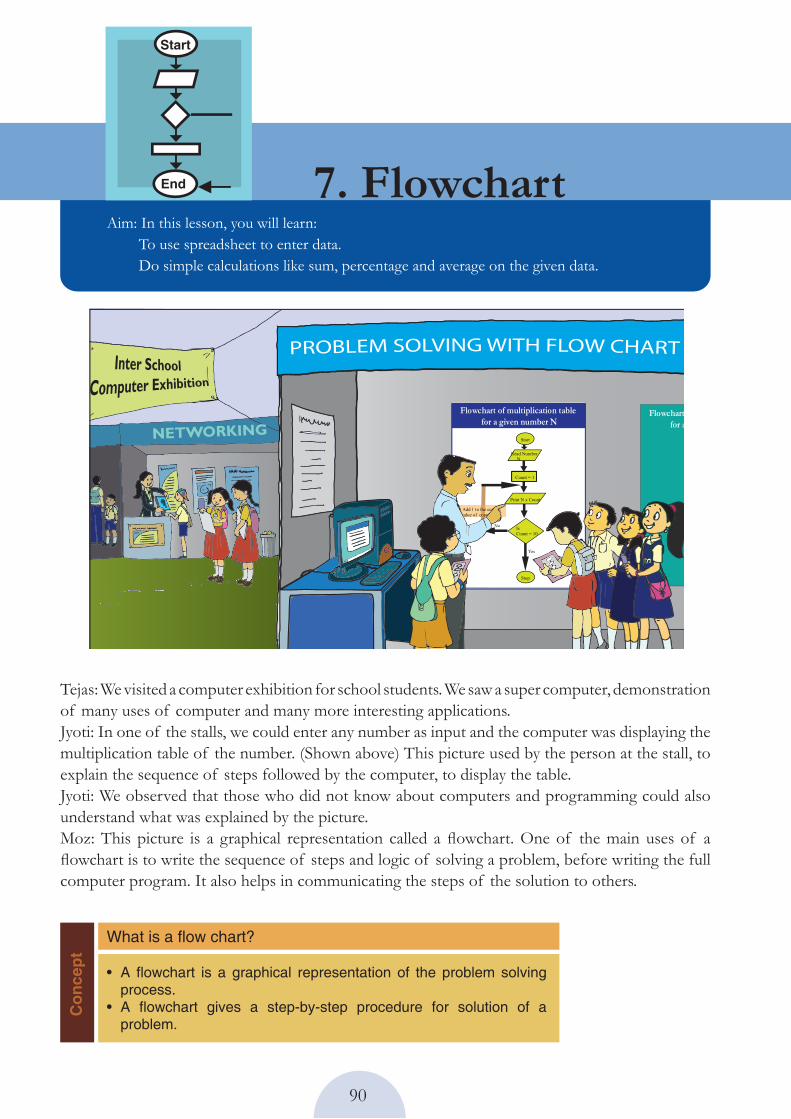
Tejas: We visited a computer exhibition for school students. We saw a super computer, demonstration of many uses of computer and many more interesting applications. Jyoti: In one of the stalls, we could enter any number as input and the computer was displaying the multiplication table of the number. (Shown above) This picture used by the person at the stall, to explain the sequence of steps followed by the computer, to display the table. Jyoti: We observed that those who did not know about computers and programming could also understand what was explained by the picture. Moz: This picture is a graphical representation called a flowchart. One of the main uses of a flowchart is to write the sequence of steps and logic of solving a problem, before writing the full computer program. It also helps in communicating the steps of the solution to others.
What is a flow chart?
Con
cept
A flowchart is a graphical representation of the problem solving • process. A flowchart gives a step-by-step procedure for solution of a • problem.
NETWORKING
Add 1 to the current value of count
Start
Read Number N
Count = 1
Print N x Count
Yes
Stop
Is Count = 10
No
Flowchart of multiplication table for a given number N
Flowchartfor a
Start
End
91
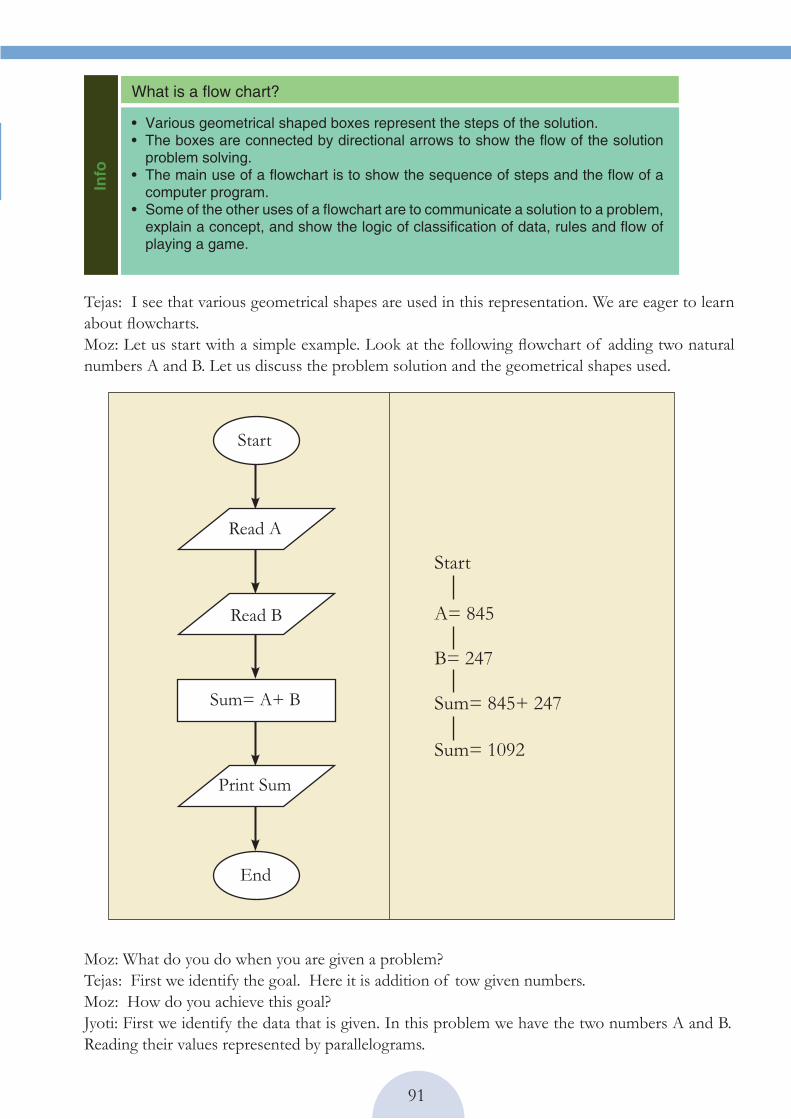
Tejas: I see that various geometrical shapes are used in this representation. We are eager to learn about flowcharts.Moz: Let us start with a simple example. Look at the following flowchart of adding two natural numbers A and B. Let us discuss the problem solution and the geometrical shapes used.
Moz: What do you do when you are given a problem?Tejas: First we identify the goal. Here it is addition of tow given numbers. Moz: How do you achieve this goal?Jyoti: First we identify the data that is given. In this problem we have the two numbers A and B. Reading their values represented by parallelograms.
Various geometrical shaped boxes represent the steps of the solution. • The boxes are connected by directional arrows to show the flow of the solution • problem solving. The main use of a flowchart is to show the sequence of steps and the flow of a • computer program.Some of the other uses of a flowchart are to communicate a solution to a problem, • explain a concept, and show the logic of classification of data, rules and flow of playing a game.
Info
What is a flow chart?
Start
A= 845
B= 247
Sum= 845+ 247
Sum= 1092
Start
Read A
Read B
Sum= A+ B
Print Sum
End

92
Tejas: An arrow points from one step to the next step in the flowchart. Moz: In a flowchart arrows are used not only to connect the steps in a sequence but also to show a clear flow of the problem solving process. Jyoti: Start and also end of the flowchart are shown with an ellipse.Moz: A flowchart should give a clear indication as to where the problem solving flow starts and where it ends. The start of a problem solving process and the end are indicated using the ellipse.Jyoti: This is just like using ‘step-wise thinking’ lesson step by step to solve a problem.Moz: Yes. The step by step method of solving the problem is specified using a flowchart. This helps you to be clear about the input, procedure and output. It also helps you to communicate the solution.
Moz: Now consider the following problem and draw the flowchart for its solution. Savani bought a toy for Rs. 325 and sold the same for Rs. 458. Explain how we can find if Savani has made a profit or a loss. Tejas: In this problem the goal is to find whether Savani makes a profit or loss.Jyoti: We know the Cost Price and the Selling Price. We can read them as input, so they are represented as parallelograms.Tejas: Next we have to compare Selling Price and Cost Price to find which price is more. This will tell us whether Savani has made profit or loss. How do we show comparison in a flowchart?
Uses of flowchart
Con
cept
To specify the method of solving a problem.• To plan the sequence of a computer program.• Communicate ideas, solutions. •
Follow step-by-step thinking and logical reasoning of solving a problem.• Identify the goal or the solution to be found. • Think of the sequence of steps for working out the solution to the problem.•
Identify start, input, process, output and end. oUse appropriate symbol to represent each step in the sequence. • Use directional arrows to show the flow of the sequence of steps. • Check that the flow of the solution is clearly communicated through the • flowchart.
Gui
delin
es
Drawing of a flowchart
Moz: Right. What would you call this in computer terms?Jyoti: Input. Moz: The data or information that is available, (which is called input) is represented using a parallelogram in the flowchart. Moz: What is the next step?Tejas: The next step is to add the numbers, which is called processing in computers. We learned this term in “Inside computer” lesson. Moz: Correct. The details of processing of data is represented in a rectangle. Jyoti: The next step is to write the result of the addition which is output in computer terms. This is also specified in a parallelogram.Moz: Right. A parallelogram is used to specify both input and output in a flowchart. What else do you notice in the flowchart?

93
Moz: Can you phrase this step as a question with the two possible answers?Tejas: We can ask a question “Is selling price more than cost price?”. The answer to this question can be “Yes” or “No”. If, answer is “Yes” we have to calculate profit and if, answer is “no” we have to calculate loss.Moz: Right. In this step you have two alternate actions that can be taken. The decision of which action has to be taken is decided by the answer to the question. The answer can be “Yes” or “No”. This decision taking step is represented as follows in a flowchart.
Ouestiton? Next Step to be taken when the answer is yes.
Yes
No
Next Step to be taken when the answer is no.
Jyoti: If the answer is “Yes”, it means that selling price is more than the cost price and Savani has made profit. Profit is calculated as, Selling price – cost price If the answer is “No” it means that cost price is less than selling price and Savani has made loss. Loss is calculated as Cost price – Selling price.Moz: Good. You have used logical reasoning to solve this problem. Now draw the flowchart.
Flowchart - How to find profit or loss.For given example
IS SP>CP Yes
No
1. ReadCP=325SP= 458
2. ConditionSP is grater than CP
3. ProcessingProfit= 458-325 = 133
4. OutputSavani made profit of Rs. 133
Start
Stop
Read Cost price (CP)Read Selling price (SP)
Profit= SP-CP
Loss= CP-SP
Print Loss
Print Profit
94
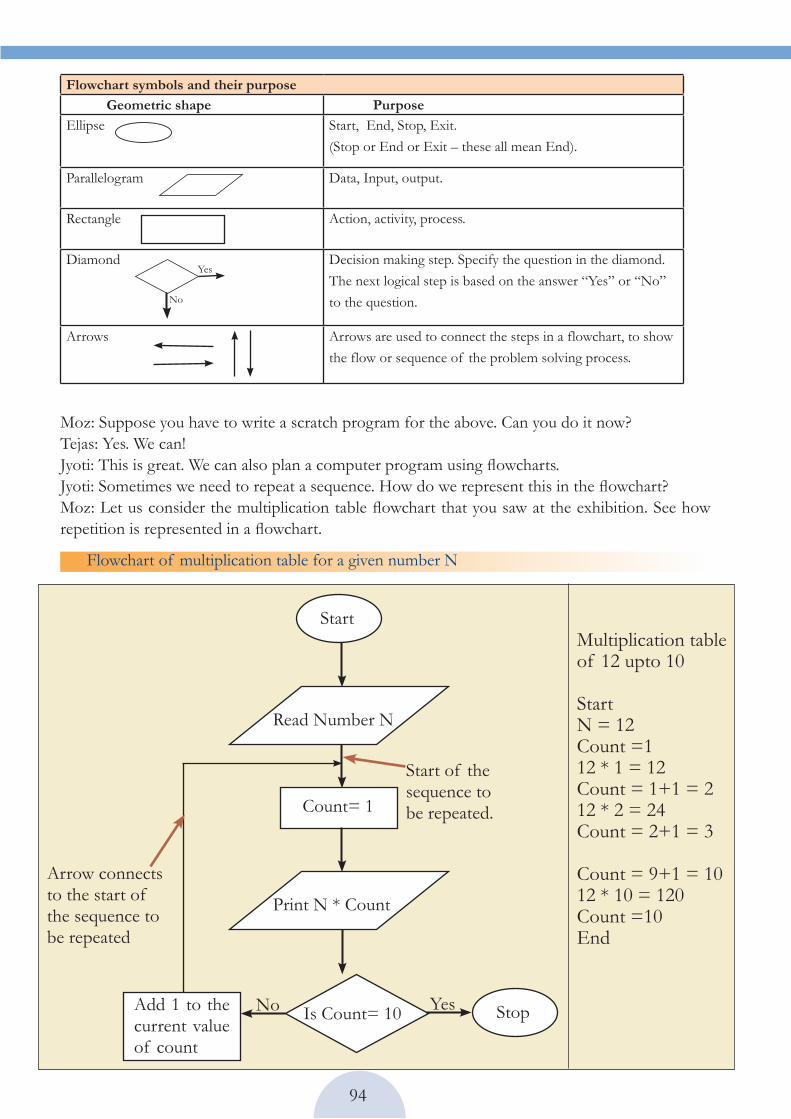
Moz: Suppose you have to write a scratch program for the above. Can you do it now?Tejas: Yes. We can!Jyoti: This is great. We can also plan a computer program using flowcharts. Jyoti: Sometimes we need to repeat a sequence. How do we represent this in the flowchart?Moz: Let us consider the multiplication table flowchart that you saw at the exhibition. See how repetition is represented in a flowchart.
Multiplication table of 12 upto 10
Start N = 12Count =112 * 1 = 12 Count = 1+1 = 212 * 2 = 24 Count = 2+1 = 3
Count = 9+1 = 1012 * 10 = 120 Count =10End
Flowchart of multiplication table for a given number N
Is Count= 10 YesNo
Start
Stop
Read Number N
Print N * Count
Start of the sequence to be repeated.
Arrow connects to the start of the sequence to be repeated
Add 1 to the current value of count
Count= 1
Flowchart symbols and their purpose Geometric shape PurposeEllipse Start, End, Stop, Exit.
(Stop or End or Exit – these all mean End).
Parallelogram Data, Input, output.
Rectangle Action, activity, process.
Diamond Decision making step. Specify the question in the diamond. The next logical step is based on the answer “Yes” or “No” to the question.
Arrows Arrows are used to connect the steps in a flowchart, to show the flow or sequence of the problem solving process.
Yes
No

95
Tejas: The repetition sequence stops when count =10. So here a decision structure has been used to start and stop the repetition.
Moz: Try out another problem to see how you can use such an assignment.Tejas: Let us draw a flowchart to find the factorial of a number. Moz: How do you find the factorial of a number?Jyoti: Suppose the number is 10. Then factorial of ten is calculated as 10! = 1*2*3*4*5*6*7*8*9*10
Moz: Good. Draw the flowchart.
StartN = 10M = 1F = 1F = 1 * 1 = 1; M<10; M = 1 +1 = 2F = 1 * 2 = 2; M<10; M = 2 +1 = 3F = 2 * 3 = 6; M<10; M = 3 + 1= 4F = 6 * 4 = 24;M<10; M = 4 +1 = 5
M<10; M = 9 + 1 = 10F = 362880 * 10 = 3628800 M = N = 10Factorial of 10 = 3628800End
Find factorial of N
Is M=N?
Start
End
Read N
Set M= 1Set F= 1
New value of F=Current value of F multiplied by M
Add 1 to the Current value of M
Print Loss

96
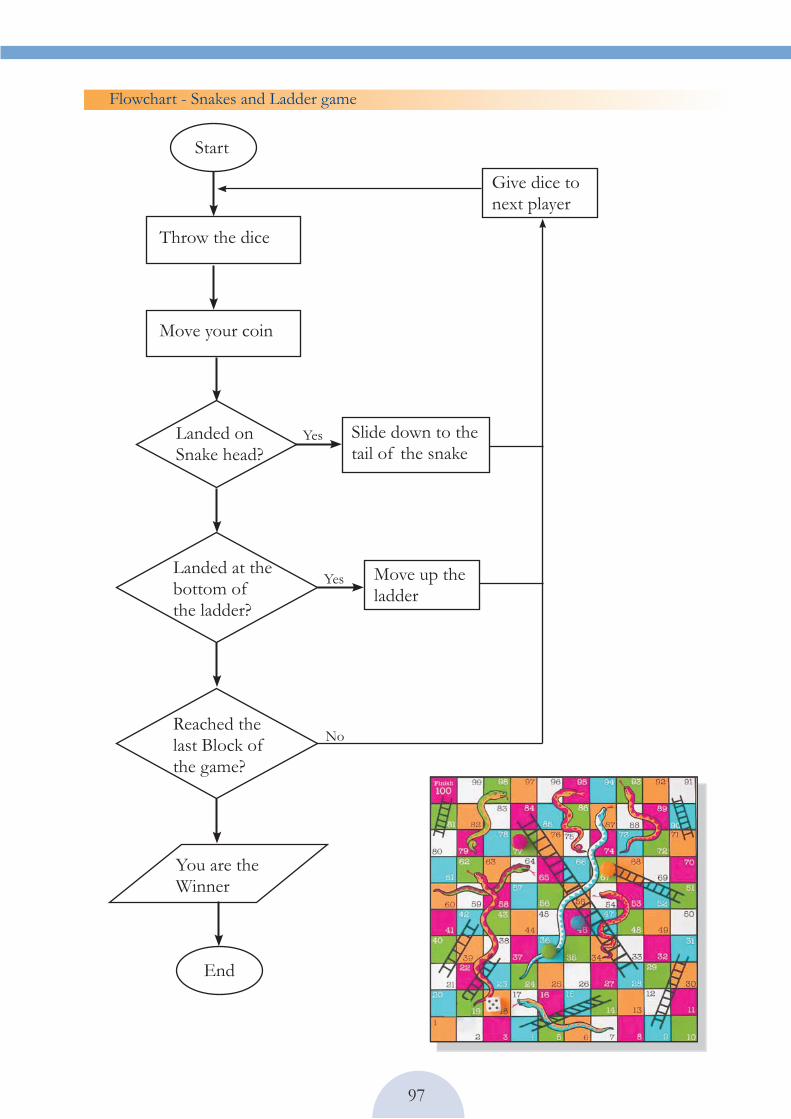
Moz: Good. Now let us consider a game. Do you know the game of snakes and ladders?Tejas: Yes. Moz: Ok. Draw a flowchart to show how the game is played.
SequenceSequence of steps are represented by symbols that follow each other top to bottom or left to right.
SelectionA condition or a question is specified in the Decision box. Based on the evaluation of the condition one of the logical steps is taken next.The next logical step can be a process, decision, or end of the flowchart.
Repetition
Either the processing repeats or the control leaves the structure.
Process
Process
Process
Process
Process
Process
Ouestiton?
Ouestiton?
Yes
Yes
No
No
Moz: Good. From the examples that you have seen, can you summarize what are all the basic structures of representation?Tejas: In the addition of numbers example, we saw how to show a sequence of processing steps. Jyoti: In the finding profit and loss example, we saw how alternate sequences can be specified using a decision box.
Tejas: In the multiplication table and factorial examples, we saw how to show repetition of a sequence. Jyoti: Flowcharts can be drawn for a problem solving process using these three basic structures.
97
Flowchart - Snakes and Ladder game
Landed on Snake head?
Landed at the bottom of the ladder?
Reached the last Block of the game?
Start
End
You are the Winner
Throw the dice
Move your coin
Slide down to the tail of the snake
Move up the ladder
Give dice to next player
Yes
Yes
No

98
Tejas: The flowchart itself can be put into the box of the game so that those who want to play know the rules of the game and can easily understand how they win.Moz: We have seen some examples where flowcharts are used. There are many more uses of flowcharts and they can be used whenever you feel that you can communicate better with this graphical representation.
Tejas: We are eager to learn another programming language. Moz: Sure. Next you will be learning BASIC where you can use some of the flowcharts that you have drawn in this lesson. Chin Chinaki...
Classification of.....• To teach and also to learn.• Communicating ideas•
Other uses of flowchart
Info
OutlineMain Points
Presentation
ImpressSlides
Create
At the end of the lesson, you will be able to:
Write an outline for a given topic.• Enter content into the • presentation application.Check content for consistency • (font, grammar, spellings) and use design options.Follow guidelines for creating • presentations.
Lesson Outcome
99
WORKSHEETSLevel VI Lesson
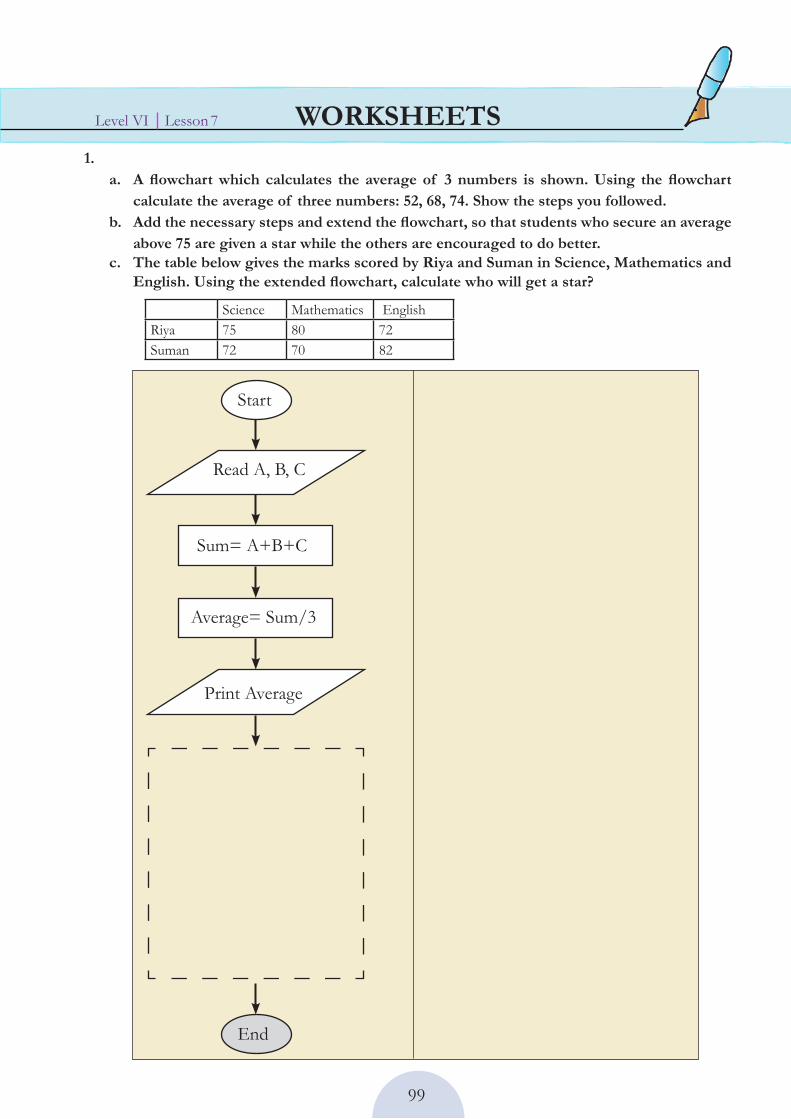
1. A flowchart which calculates the average of 3 numbers is shown. Using the flowchart a. calculate the average of three numbers: 52, 68, 74. Show the steps you followed.Add the necessary steps and extend the flowchart, so that students who secure an average b. above 75 are given a star while the others are encouraged to do better.The table below gives the marks scored by Riya and Suman in Science, Mathematics and c. English. Using the extended flowchart, calculate who will get a star?
Science Mathematics EnglishRiya 75 80 72Suman 72 70 82
Start
End
Read A, B, C
Print Average
Sum= A+B+C
Average= Sum/3
7
100
WORKSHEETSLevel VI Lesson
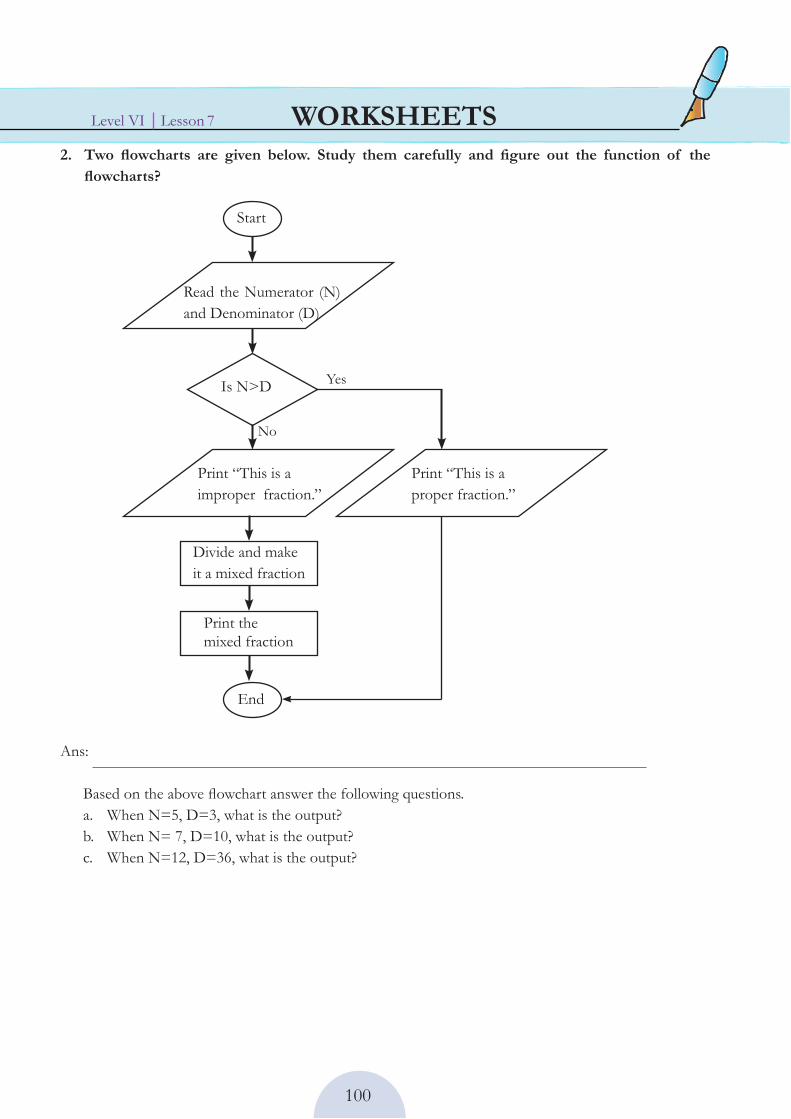
Two flowcharts are given below. Study them carefully and figure out the function of the 2. flowcharts?
Ans:
Based on the above flowchart answer the following questions.When N=5, D=3, what is the output?a. When N= 7, D=10, what is the output?b. When N=12, D=36, what is the output?c.
Is N>D
Start
End
Read the Numerator (N) and Denominator (D)
Print “This is a improper fraction.”
Divide and make it a mixed fraction
Print the mixed fraction
Print “This is a proper fraction.”
Yes
No
7

101
WORKSHEETSLevel VI Lesson
Ans:
StartSUM = 0N = 0Inside the loop:N = 0+1=1, SUM = 0+1=1; N not equal to 10N = 1+1=2, SUM = 1+2=3; N not equal to 10N = , SUM = ; NN = , SUM = ; NN = , SUM = ; NN = , SUM = ; NN = , SUM = ; NN = , SUM = ; NN = , SUM = ; NN = , SUM = ; N
PrintEnd
Is N=10
Start
End
Print sum
Sum= 0
N= 0
Add 1 to the current value of N
Sum= Sum + N
Yes
No
7
102
WORKSHEETSLevel VI Lesson
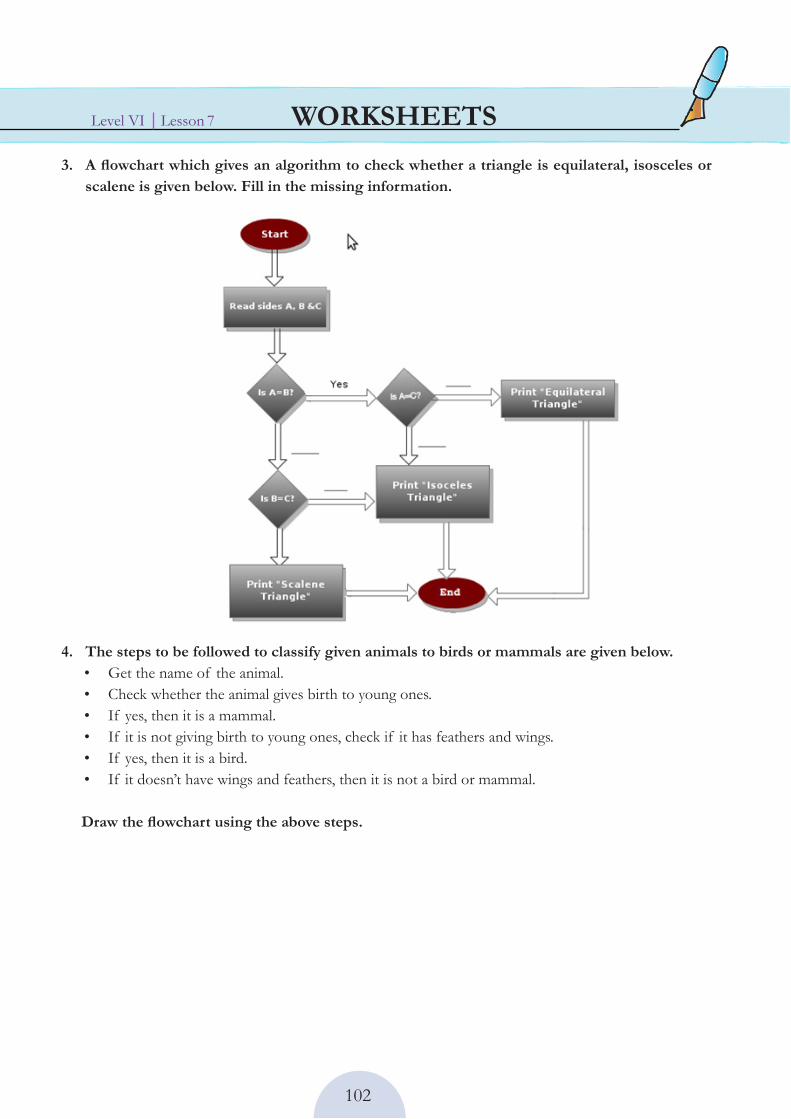
A flowchart which gives an algorithm to check whether a triangle is equilateral, isosceles or 3. scalene is given below. Fill in the missing information.
The steps to be followed to classify given animals to birds or mammals are given below.4. Get the name of the animal.• Check whether the animal gives birth to young ones.• If yes, then it is a mammal. • If it is not giving birth to young ones, check if it has feathers and wings.• If yes, then it is a bird.• If it doesn’t have wings and feathers, then it is not a bird or mammal.•
Draw the flowchart using the above steps.
7

103
WORKSHEETSLevel VI Lesson
A flowchart which gives information about mixtures is given below.5.
Based on the flow chart answer the questions (T/F): a. i. An element is a pure substance ii. A compound can be separated into simpler substancesiii. If matter is uniform throughout , it is called homogeneousiv. If homogeneous matter does not have a variable composition, it is called a pure substance.
Based on the passage given below, extend the above flowchart. b. Particle size distinguishes homogeneous solutions from heterogeneous mixtures. A suspension is a heterogeneous mixture of larger particles. These particles are visible with our naked eyes and will settle out on standing. Muddy water and tomato juice are examples of suspensions. A colloid is a homogeneous solution with intermediate particle size between a solution and a suspension. An example of colloid is milk.
7

104
WORKSHEETSLevel VI Lesson
Frame a question( Hint: Try to make a question, which will have the answer given below)6. For example: The answer given is: Some of the boxes of different shapes used in a flowchart are
The question can be: Name some of the symbols used in a flowchart?Now try these:a. The answer given is : In a flowchart, to represent a process we use a rectangular box. The question can be: ?
b. The answer given is : In a repetition structure, the process is repeated till the condition is satisfied. Once the condition is satisfied control comes out of the structure. The question can be: ?
a. A flowchart which gives the steps to be followed while saving a document.
Reasons:
Label the various structures in the following flowcharts as selection, sequence or repetition. 7. Justify your answer.
7

105
WORKSHEETSLevel VI Lesson
Reasons:
Reasons:
b. Flowchart which classify animals as herbivore or carnivore.
c. A flowchart which calculates the sum and print the total bill amount for the things purchased in a shop.
7

106
WORKSHEETSLevel VI Lesson
Which is not true about the arrows used in a flowchart?8. Direction of arrow shows the flow in a flowchart.• Arrows are used show the sequence of the problem solving.• Arrows are used to connect boxes in a flowchart.• Arrows can be used to represent an input.•
The following empty flowchart gives the steps to be followed while seeking admission to 9. new school. The phrases to be filled in the boxes are also given. Fill in the flowchart and complete it.
Search for a school1. Prepare for the admission test and 2. write the test.Did you pass the exam?3. Submit necessary documents and 4. get admission.End5. Are seats available?6. Start7. Is there an admission test?8.
7

107
WORKSHEETSLevel VI Lesson
The following flowchart gives the steps followed while taking attendance in a class. Find out 10. what is wrong in the following flowchart and correct flowchart.
7

108
WORKSHEETSLevel VI Lesson
Draw a flowchart for the following situation: 11. There are four types of fruits: Apples, Oranges, Bananas and Grapes. Each one of you must pick two types of fruits. Note the following conditions:
If you pick apple you cannot pick orange.If you pick orange you cannot pick banana.If you pick grapes you cannot pick apple.
7

109
WORKSHEETSLevel VI Lesson
Complete the crossword puzzle. 12.
AcrossI am a rectangle in a flowchart. What do I represent? iii. You can use me to communicate ideas, graphically represent a problem solving process.v. When you want to show a decision making step, you can use this box.vi.
DownIn the flowchart, I represent data or information that is available. i. In a flowchart if the problem solving is flowing straight from top to bottom, what structure am I?iv. I connect two geometrical boxes in a flowchart.v.
1
2
3
4
5
6
7

110
Level VI LessonACTIVITY
Select one of the games from GCompris and draw a flowchart to explain its rules.1.
Use one of the following applications - open office draw/ Kivio (available for Linux)/ Diagram Ring 2. (available for windows) --- to draw a flow chart for the above on the computer.
Group ActivityPlay Computer Class: Divide the class into four teams - INPUT DATA, DECISION, and OUTPUT. 3. Nominate one person from input and output team to play the role of start and end box respectively. Each group has a set task to perform based on instructions given to them by another team. You can give the following situations for students to work through the process of flow chart. i. Switch on the computer and open and application. (Hint: Include the name of hardware/software involved along with their functions). Choose one from the list below: ii. Visit to health clinic iii. Admission to a school. iv. Receive calls on landline telephone
Some of the steps involved in three of the above activities are given below. Add more steps as required. Example (ii) – Visit to health clinic a. Take an appointment on the telephone to check availability of doctor. b. Visit the hospital. c. Stand in queue for your turn to talk to the assistant/clerk. d. If you are already registered, your record will be retrieved, else fill a form for new patient. e. Make the payment. f. Go and meet the doctor.
Example (iii) - Admission process in school a. Check availability of seats in a school. b. If seats are available, find the procedure for admission. c. If there are entrance exams, prepare and write for exams and check for results. d. If you clear the entrance, submit the form along with performance record of entrance and report card of earlier class. e. For schools that do not have entrance exams, submit the form along with report card of earlier class. f. Wait for list of students to put up. g. You name figures in the list, pay admission fees to the school. (Hint: What if your name does not appear in the list?)
Expl reExpl re
7

111
Level VI LessonACTIVITY Example (iv) - Receive calls on landline telephone a. Telephone rings. b. Pick up the phone c. Wish hello and find out who is calling and wants to talk to whom. d. Check availability of person for whom the call is addressed. e. If the person to whom the call is addressed is available at home handover the telephone to him/her. f. If the person is not available, take the message and later convey it. (Hint: note the phone number to call back).
ProjectIn the four boxes given below some words and phrases are given under four categories:4.
Resources Contents Conditions Decisions The list is not an exhaustive one. Go ahead add more words and phrases.
Now recall the posters for SMART(Rules for safe Internet usage) and AWARE (copyright sensitisation) and draw 2 flowcharts on these rules, by taking at least one term from each of these boxes.
Resources Contents Conditions Decisions
TextbookInternetLibraryParents Friends
GamesWorksheetsPersonal informationStoriesPicturesInformationPop upChat
Is it authentic?Did you ask permission?Is it free or licensed under CC?Is there a copyright?Does it need permission?Can you trust?Can it be used?
Can use itCannot meet strangersGet permission Cannot use itAcknowledge and use it.Get approval
Expl reExpl re E1.
7

112
Teacher’sCorner
Book V
Lesson 6Level VI
Lesson 7