asian pacific journal of tropical disease - oajioaji.net/articles/2017/3556-1484624681.pdf · of...
TRANSCRIPT
88
Infectious disease research https://doi.org/10.12980/apjtd.7.2017D6-330 ©2017 by the Asian Pacific Journal of Tropical Disease. All rights reserved.
Effect of temperature, rainfall and relative density of rodent reservoir hosts on zoonotic cutaneous leishmaniasis incidence in Central Tunisia
Hedia Bellali1,2,3*, Khouloud Talmoudi1, Nissaf Ben Alaya3,4, Madiha Mahfoudhi3,5, Samir Ennigrou3, Mohamed Kouni Chahed1,2,3
1Epidemiology and Statistics Department, Abderrahmen Mami Hospital, Ariana, Tunisia
2Research Unit "Analysis of the Efects of Environmental and Climate Change on Health", Department of Epidemiology and Statistics, Abderrahmen Mami Hospital, Ariana, Tunisia.
3Epidemiology and Public Health Department, Medical Faculty of Tunis, Tunis El Manar Uversity, Tunis, Tunisia
4National Observatory of New and Emerging Disease, Ministry of Health, Tunisia
5Internal Medicine Department A, Charles Nicolle Hospital, Tunis, Tunisia
Asian Pac J Trop Dis 2017; 7(2): 88-96
Asian Pacific Journal of Tropical Disease
journal homepage: http://www.apjtcm.com
*Corresponding author: Hedia Bellali, Epidemiology and statistics department, Abderrahmen Mami hospital, Ariana, Tunisia. Tel: +216 70 160 349 Fax: +216 70 160 361 E-mail: [email protected] The study protocol was performed according to the Helsinki declaration and approved by Pasteur Institute of Tunis Ethic Committee. Informed oral consent was obtained from adults and from parents for children. Foundation project: Supported by the International Development Research Center, Canada (Grant No. IDRC 105509_44). The journal implements double-blind peer review practiced by specially invited international editorial board members.
1. Introduction
Human health consequences of climate change are diverse and
wide-ranging, resulting also in severe outbreaks of vector-borne
infectious diseases and their likely geographic expansion, which
pose a serious threat to vulnerable populations[1,2]. The pathways
between climate change and the health outcomes are often complex
and indirect. Indirect health impacts of changes in ecosystems or
species consist on mediate zoonotic or vector-borne infectious
diseases such as malaria, dengue fever, Hanta viruses, leishmaniasis,
Lyme disease, schistosomiasis, Henipahvirus, etc. Climate changes
including rainfall patterns, increase in temperature and humidity
levels and also extreme events such as heatwaves, storms, cyclones,
fires and floods constitute favorable conditions for the development
and change in the distribution of mosquitoes and some other vectors
leading to new disease patterns mainly in tropical and subtropical
regionsin Africa[3]. Temperature affects insect’s reproduction rate,
biting behaviour and survival. Moreover, warmer temperatures tend
to shorten the incubation period of pathogens inside vectors[1].
The world’s most vulnerable populations, including children,
pregnant women, elderly people, nomads, poor rural populations,
refugees and people living in post-conflict settings are the most
threatened by the already-high impact of changing climatic
conditions on vector-borne diseases[4].
ARTICLE INFO ABSTRACT
Objective: To study the effect of climate variability and rodent density on the incidence of zoonotic cutaneous leishmaniasis (ZCL) in humans.Methods: We collected monthly ZCL human cases in primary health care facilities, in schools and in the community. We collected monthly climate parameters such as temperature, humidity, rainfall, wind direction and wind speed, and rodent density. We investigated the relationship between ZCL incidence and climate and environmental variables by univariate and different multivariable analysis (multiple linear regression, negative binomial regression and autoregressive integrated moving average).Results: The ZCL number peaked in October and November. In univariate analysis, positive associations were found for the maximum, mean and minimum temperatures lagged for three and six months, with higher correlation coefficient for the mean temperature lagged for six months (r = 0.837, P < 0.01). All multivariate analyses showed positive association between monthly ZCL incidence and the six months moving average temperature with higher correlation coefficients and very small significant level, whereas negative association was observed for the cumulative rainfall of the last year. Conclusions: This work showed a significant association between ZCL incidence and climate variables suggesting that ecological early warning system could be applied for ZCL.
Article history:Received 18 Sep 2016Received in revised form 26 Sep, 2nd revised form 8 Oct, 3rd revised form 14 Oct 2016Accepted 21 Nov 2016Available online 20 Dec 2016
Keywords:IncidenceRodent densityRainfallTemperatureTunisiaZoonotic cutaneous leishmaniasis
Hedia Bellali et al./Asian Pac J Trop Dis 2017; 7(2): 88-96 89
Tunisia is one of the identified nations of regional climate change
hotspots[5]. As arid and semi-arid regions are among the most
sensitive ecosystems to climate change[6,7], the poor rural population
of Sidi Bouzid is the most threatened group by climate change
impact including vector-borne diseases.
The transmission cycle of zoonotic cutaneous leishmaniasis (ZCL)
is complex resulting from interactions between the Leishmania
major, Psammomys obesus and Meriones shawi rodent reservoirs,
accidental human hosts, and Phlebetomus papatasi and fly
vectors. Favorable climate and environmental conditions influence
all these implicated actors in the cycle and increase the risk of
transmission[8,9].
ZCL caused by Leishmania major is the most common form of
leishmaniasis in Tunisia. It is emerging and endemic in the centre
and south of Tunisia since 1982–1983, and there is a periodicity of
outbreaks of each 5–8 year intervals[10-14]. The emergence of ZCL
coincides with the extension of land farming and water forage and
exploitation in this area since the 1970s and the settlement of human
population around irrigated fields[15] at the edges of the salt pan
“Garaat Njila”. Previous studies showed high endemicity in districts
which are close to this salt pan with agricultural activities as mainly
occupation such as Hichria, Bir Bader and Zefzef[16]. The most
common halolphytic plant in the salt pan “Garaat Njila” is chenopods
which constitute the food of rodent reservoirs. Higher rainfall levels
would increase the density of chenopods and consequently the
reservoir density increases and affect ZCL transmission.
Currently, the biomedical model failed to control the spread of
the diseases and to prevent epidemics. The used drug (meglumine
antimoniate, glucantime) in the endemic areas is not always
available, is expensive, and is not effective against the scar[17].
Vaccine prevention of leishmaniasis is not possible because there is
no available vaccine to use.
Thus, the prevention of the disease is highly important mainly for
the prediction of the epidemic and the implementation of control
measure. Prediction needs the application of statistical models to
understand the extent to which climate variability and climate change
are affecting vector-borne infectious diseases burden, particularly
modeling exposure-response relationships and the development of
early warning systems (EWS) to develop useful models, which can
be integrated by decision-makers in managing health risks[18].
The objective of this study was to investigate the relationship
between climate and environmental factors and ZCL transmission
on monthly observation in order to study the possibilities of EWS
implementation based on climatic and environmental conditions, so
as to predict epidemics well in advance and then implement control
measures to limit the magnitude and the spread of the epidemics.
2. Materials and methods
2.1. Study area
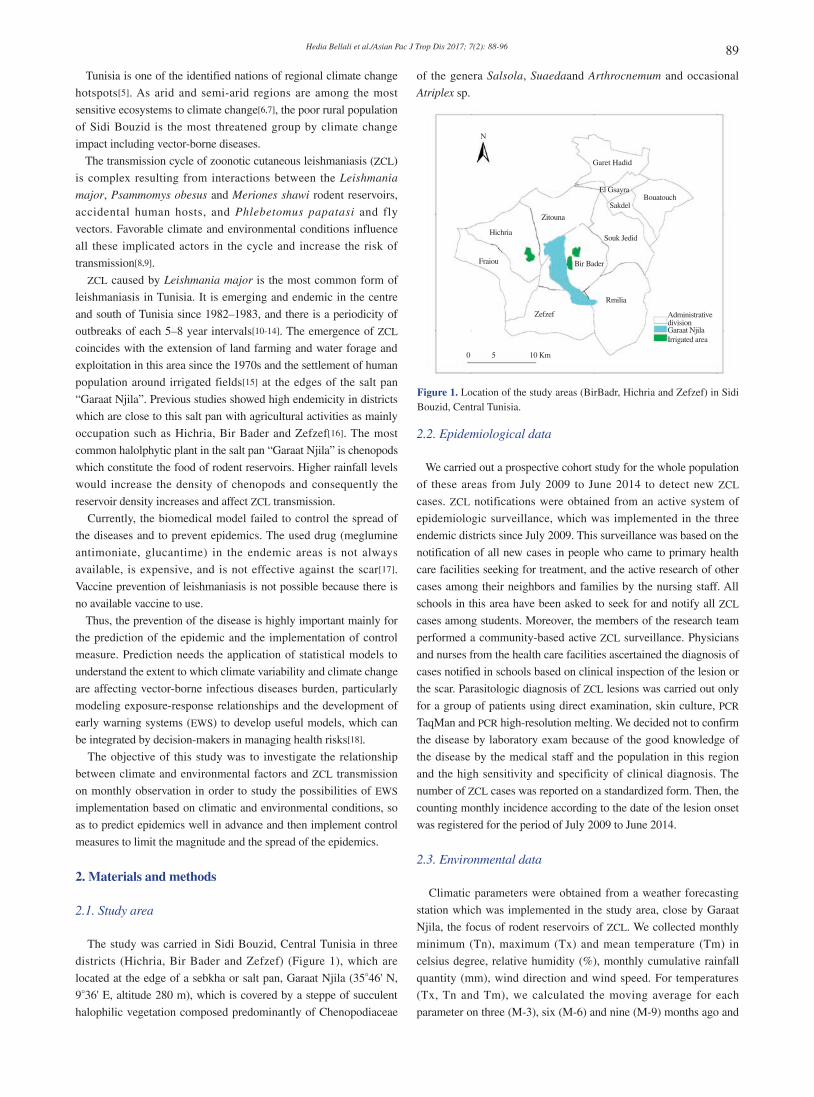
The study was carried in Sidi Bouzid, Central Tunisia in three
districts (Hichria, Bir Bader and Zefzef) (Figure 1), which are
located at the edge of a sebkha or salt pan, Garaat Njila (35°46' N,
9°36' E, altitude 280 m), which is covered by a steppe of succulent
halophilic vegetation composed predominantly of Chenopodiaceae
of the genera Salsola, Suaedaand Arthrocnemum and occasional
Atriplex sp.
N
Garet Hadid
El GsayraBouatouch
Souk Jedid
Bir Bader
Rmilia
Administrative divisionGaraat NjilaIrrigated area
0 5 10 Km
Zefzef
Zitouna
Hichria
Fraiou
Sakdel
Figure 1. Location of the study areas (BirBadr, Hichria and Zefzef) in Sidi Bouzid, Central Tunisia.
2.2. Epidemiological data
We carried out a prospective cohort study for the whole population
of these areas from July 2009 to June 2014 to detect new ZCL
cases. ZCL notifications were obtained from an active system of
epidemiologic surveillance, which was implemented in the three
endemic districts since July 2009. This surveillance was based on the
notification of all new cases in people who came to primary health
care facilities seeking for treatment, and the active research of other
cases among their neighbors and families by the nursing staff. All
schools in this area have been asked to seek for and notify all ZCL
cases among students. Moreover, the members of the research team
performed a community-based active ZCL surveillance. Physicians
and nurses from the health care facilities ascertained the diagnosis of
cases notified in schools based on clinical inspection of the lesion or
the scar. Parasitologic diagnosis of ZCL lesions was carried out only
for a group of patients using direct examination, skin culture, PCR
TaqMan and PCR high-resolution melting. We decided not to confirm
the disease by laboratory exam because of the good knowledge of
the disease by the medical staff and the population in this region
and the high sensitivity and specificity of clinical diagnosis. The
number of ZCL cases was reported on a standardized form. Then, the
counting monthly incidence according to the date of the lesion onset
was registered for the period of July 2009 to June 2014.
2.3. Environmental data
Climatic parameters were obtained from a weather forecasting
station which was implemented in the study area, close by Garaat
Njila, the focus of rodent reservoirs of ZCL. We collected monthly
minimum (Tn), maximum (Tx) and mean temperature (Tm) in
celsius degree, relative humidity (%), monthly cumulative rainfall
quantity (mm), wind direction and wind speed. For temperatures
(Tx, Tn and Tm), we calculated the moving average for each
parameter on three (M-3), six (M-6) and nine (M-9) months ago and

Hedia Bellali et al./Asian Pac J Trop Dis 2017; 7(2): 88-9690
one (Y-1), two (Y-2), three (Y-3), four (Y-4) and five (Y-5) years
ago. Cumulative rainfall quantity was also calculated for the same
periods. Monthly rodent density was estimated from the count of
active burrows on three consecutive days.
2.4. Rodent density
The density of rodents in the habitat represented by Garaat Njila
(sebkha) was estimated monthly using a defined protocol. Indeed,
we randomly selected three plots of one hectare surface area spread
over the different edges of the sebkha. Each plot was divided into
10 sectors, and within each sector, we counted active burrows for
each month and each parcel separately as follows: the first day we
counted the number of open rodent burrows and we closed them; the
second day we counted the number of re-opened burrows and we
closed them again; on the third day, we just counted the number of
re-opened burrows. The monthly density of rodents in three parcels
was calculated through this equation:
Rodent density = × 100Number of burrows reopened at the 3rd day
Number of burrows opened the first day The monthly average density was the average of rodent densities
in the three plots. This variable was calculated monthly and included
in the data. We calculated also for each month, the density moving
average for three, six and nine months ago.
We configured a monthly ecologic data. The dependent variable
was the monthly incidence of ZCL and minimum, maximum and
mean temperatures, relative humidity, rainfall and the average rodent
density were the explanatory variables.
2.5. Statistical analyses
Seasonality of ZCL incidence and climatic variables was assessed
by box plot representation. The relationship between ZCL occurrence
and climate and environmental variables was investigated by
different methods. First, we drew graphics for the dependent variable
with all explanatory ones to explore possible fitness between ZCL
number per month and climatic parameters, we also checked for
graphic correlation between rainfall and rodent density. Then, we
conducted a bivariate correlation analysis using the Spearman test
between the dependent variable, monthly number of ZCL, and all
climatic and environmental parameters.
We used three methods of multivariable analysis in order to
identify strong and steady relationships between ZCL incidence and
one or some of the climatic variables so that we could further use to
study possibilities to implement EWS to predict ZCL epidemics.
Multivariate analysis was treated by multiple linear regressions
using the incidence rate as dependent variable, as well as all the
explanatory variables was quantitative and continuous. Backward
stepwise elimination was used to generate the parsimonious model.
We used R2, also known as coefficient of determination, and the
Durbin-Waston test to evaluate the model fit, the most appropriate
linear model that fit well with observed data expected to have higher
R2 and a Durbin-Waston test value close to one.
The negative binomial regression with log link in generalized
linear models was used instead of the Poisson regression, since the
number of ZCL cases had a Poisson distribution, but the application
condition of Poisson regression was not satisfied because the
esperance of the number of ZCL cases was not equal to its variance.
All significant independent parameters and those with a P value less
than 0.20 were incorporated in the initial model, then many iterations
were performed and compared through likelihood ratio until the final
model with all statistically significant regression coefficients (at the
5% level) for each independent variable .
Finally, monthly ZCL number was estimated using an optimal form
of an autoregressive integrated moving average (ARIMA) model
with square root transfer function. The ARIMA transfer function
models produced the closest fit[19]. The log transfer function was
not possible because there were many months with zero ZCL cases.
Cross-correlation method was used to select significant independent
parameters and those with a P value less than 0.20. All possible
combinations of these parameters were incorporated in ARIMA
models using square transfer function for the dependent variable and
then evaluated for the quality of fit. The closest fit ARIMA models
were expected to exhibit a low normalized Bayesian criterion
(BIC), a low mean absolute error (MAE), a large coefficient of
determination (R2) and statistically significant regression coefficients
for each climatic parameter and ARIMA components [constant,
autoregression (AR), moving average (MA)]. The quality of fit was
further confirmed through autocorrelation and partial correlation
functions analyses of model residuals.
The ARIMA model plots was used to predict the occurrence of
epidemics by estimating the expected number of cases for each
month from the observed data.
All statistical analyses and model developments were conducted
using SPSS 19.0 at the two-tailed significance level of P < 0.05 (or
the confidence level of 95%).
3. Results
From July 2009 to June 2014, a total of 859 (51.1% male, 48.9%
female) new ZCL cases were registered in the three districts, with
393 (46%) cases between July 2013 and June 2014, only 80 cases
for the season 2012–2013, 122 cases for the period 2011–2012, 206
ZCL cases in 2010–2011 and only 58 human ZCL cases between
July 2009 and June 2010. The median age was 11 years (inter
quartile range: 7–28), ranging from 2 months to 87 years and
most of the patients were assigned to the 0–9 and 10–19 years age
groups with approximately 40% and 30% of the total recorded ZCL
cases respectively for each group. The analysis of the occurrence
of cases over time showed that the number of ZCL cases started to
increase from September. The ZCL number peaked in October, with
an average number of ZCL of 50 and a total of 249 cases over the
period, and November which cumulated 112 cases of ZCL with an
average of 46. The monthly Tn and Tx reached their maximum in
July, and high quantity of rainfall was observed during the warm
season with a peak in September (Figure 2).
The peaks in the number of human cases of ZCL coincided
exactly with those of the six months moving average of the mean
temperature [Tm (M-6)], and with the ones of the cumulative rainfall
of the previous three months [rainfall (M-3)], (Figures 3 and 4).
The emergence of a large number of human cases of ZCL was
often preceded by a relatively high and sustained average density

Hedia Bellali et al./Asian Pac J Trop Dis 2017; 7(2): 88-96 91
of rodents (Figure 5). The average density of rodents in the three
parcels was dependent on cumulative rainfall quantity a year earlier
[rainfall (Y-1)] (Figure 6).
Univariate analysis (Table 1) showed that there was a negative
correlation between the incidence of ZCL and the average density
of rodents and the average temperature during the same month [Tm
(M0)]. Tn (M-3), Tn (M-6), Tx (M-3), Tx (M-6) Tm (M-3) and Tm
(M-6) were highly correlated to the monthly number of human ZCL
cases. We didn’t find any significant association between ZCL cases
and both wind direction and wind speed.
The multiple linear regression showed a positive association of the
monthly incidence rate of ZCL with the Tm (M0) and the Tm (M-6),
and a negative association with the Tx (M-3) and rainfall (Y-1). Tm
(M-6) had the most important coefficient and a very small significant
level P. The regression parameters were: R2 = 0.720, Durbin-Waston
= 1.118 and the multiple linear regression equation was:
ZCL incidence = 0.831 Tm (M0) + 3.42 Tm (M-6) – 1.034 Tx (M-3)
– 0.228 rainfall (Y-1) – 489.33
The negative binomial regression (Table 2) showed that the
increase of Tm (M-6) and rainfall (M-3) increased the monthly ZCL
number and the increase of rainfall (Y-1) decreased ZCL incidence.Table 2Correlations between monthly ZCL cases and climate parameters, results from negative binomial regression.
Parameter β Exp β 95% confidence interval for Exp β PRainfall (M-3) 0.280 1.028 1.003–1.053 0.025Tm (M- 6) 0.403 1.497 1.367–1.639 0.000Rainfall (Y-1) -0.088 0.916 0.872–0.962 0.001Constant -5.291 - - 0.000
Table 1Univariate correlations between monthly ZCL incidence and seasonal climate variables 3 (M-3), 6 (M-6), 9 (M-9) months before, or during the same month (M0), and one year (Y-1), two years (Y-2), three years (Y-3), four years (Y-4) and five years (Y-5) before.
Variables M0 M-3 M-6 M-9 Y-1 Y-2 Y-3 Y-4 Y-5r P r P r P r P r P r P r P r P r P
ARD -0.362 0.004 0.133 NS 0.155 NS -0.148 NS - NS - NS - NS - NS - NSTx -0.216 0.097 0.583 < 0.000 0.705 < 0.000 0.298 0.210 - NS - NS - NS -0.187 0.152 -0.176 0.179Tn -0.187 0.153 0.636 < 0.000 0.826 < 0.000 0.222 0.088 - NS - NS - NS - NS -0.172 0.190Tm -0.292 0.023 0.579 < 0.000 0.837 < 0.000 0.142 NS - NS - NS - NS - NS - NSRainfall 0.289 0.148 0.219 0.093 0.041 NS -0.780 NS -0.168 0.20 - NS - NS - NS - NSRH (day) 0.152 NS - - - - - - - - - - - - - - - -RH (night) 0.174 0.184 - - - - - - - - - - - - - - - -
ARD: Average rodent density; RH: Relative humidity; r: Spearman coefficient; NS: Not significant.
Figure 2. Box plot of the seasonal pattern of ZCL incidence (A), monthly average Tx (B), monthly average Tn (C), and monthly cumulative rainfall (D).
Month
Month Month
Month
100
10
1
0
30.0
20.0
10.0
0.0
-10.0
120
100
80
60
40
20
0
50.00
40.00
30.00
20.00
10.00
Tota
l cas
esD
egre
e (°C)
Rai
nfal
l (m
m)
Deg
ree
(°C)
** * o
A B
C D
oo
o o
*
*
*
oo o
**
*
o
1 2 3 4 5 6 7 8 9 10 11 12 1 2 3 4 5 6 7 8 9 10 11 12
1 2 3 4 5 6 7 8 9 10 11 12 1 2 3 4 5 6 7 8 9 10 11 12

Hedia Bellali et al./Asian Pac J Trop Dis 2017; 7(2): 88-9692
Figure 3. Reported cases of ZCL per month and the six months moving average of Tm, July 2009–June 2014.
Jul 2
009
Aug
200
9Se
p 20
09O
ct 2
009
Nov
200
9D
ec 2
009
Jan
2010
Feb
2010
Mar
201
0A
pr 2
010
May
201
0Ju
n 20
10Ju
l 201
0A
ug 2
010
Sep
2010
Oct
201
0N
ov 2
010
Dec
201
0Ja
n 20
11Fe
b 20
11M
ar 2
011
Apr
201
1M
ay 2
011
Jun
2011
Jul 2
011
Aug
201
1Se
p 20
11O
ct 2
011
Nov
201
1D
ec 2
011
Jan
2012
Feb
2012
Mar
201
2A
pr 2
012
May
201
2Ju
n 20
12Ju
l 201
2A
ug 2
012
Sep
2012
Oct
201
2N
ov 2
012
Dec
201
2Ja
n 20
13Fe
b 20
13M
ar 2
013
Apr
201
3M
ay 2
013
Jun
2013
Jul 2
013
Aug
201
3Se
p 20
13O
ct 2
013
Nov
201
3D
ec 2
013
Jan
2014
Feb
2014
Mar
201
4A
pr 2
014
May
201
4Ju
n 20
14
ZCL total cases
Mon
thly
ZC
L n
umbe
r
Tm
(° C
)
Tm (M-6)
160
140
120
100
80
60
40
20
0
30
25
20
15
10
5
0
Figure 4. Monthly reported cases of ZCL and the cumulative rainfall of the three previous months, July 2009–June 2014.
Jul 2
009
Aug
200
9Se
p 20
09O
ct 2
009
Nov
200
9D
ec 2
009
Jan
2010
Feb
2010
Mar
201
0A
pr 2
010
May
201
0Ju
n 20
10Ju
l 201
0A
ug 2
010
Sep
2010
Oct
201
0N
ov 2
010
Dec
201
0Ja
n 20
11Fe
b 20
11M
ar 2
011
Apr
201
1M
ay 2
011
Jun
2011
Jul 2
011
Aug
201
1Se
p 20
11O
ct 2
011
Nov
201
1D
ec 2
011
Jan
2012
Feb
2012
Mar
201
2A
pr 2
012
May
201
2Ju
n 20
12Ju
l 201
2A
ug 2
012
Sep
2012
Oct
201
2N
ov 2
012
Dec
201
2Ja
n 20
13Fe
b 20
13M
ar 2
013
Apr
201
3M
ay 2
013
Jun
2013
Jul 2
013
Aug
201
3Se
p 20
13O
ct 2
013
Nov
201
3D
ec 2
013
Jan
2014
Feb
2014
Mar
201
4A
pr 2
014
May
201
4Ju
n 20
14
ZCL total cases Cumulative rainfall (M-3)
Mon
thly
ZC
L n
umbe
r
160
140
120
100
80
60
40
20
0
Rai
nfal
l (m
m)
60
50
40
30
20
10
0
Figure 5. Reported cases of ZCL and the average of rodent density, July 2009–June 2014.
Jul 2
009
Aug
200
9Se
p 20
09O
ct 2
009
Nov
200
9D
ec 2
009
Jan
2010
Feb
2010
Mar
201
0A
pr 2
010
May
201
0Ju
n 20
10Ju
l 201
0A
ug 2
010
Sep
2010
Oct
201
0N
ov 2
010
Dec
201
0Ja
n 20
11Fe
b 20
11M
ar 2
011
Apr
201
1M
ay 2
011
Jun
2011
Jul 2
011
Aug
201
1Se
p 20
11O
ct 2
011
Nov
201
1D
ec 2
011
Jan
2012
Feb
2012
Mar
201
2A
pr 2
012
May
201
2Ju
n 20
12Ju
l 201
2A
ug 2
012
Sep
2012
Oct
201
2N
ov 2
012
Dec
201
2Ja
n 20
13Fe
b 20
13M
ar 2
013
Apr
201
3M
ay 2
013
Jun
2013
Jul 2
013
Aug
201
3Se
p 20
13O
ct 2
013
Nov
201
3D
ec 2
013
Jan
2014
Feb
2014
Mar
201
4A
pr 2
014
May
201
4Ju
n 20
14
ZCL total cases Average density of rodents
Mon
thly
ZC
L n
umbe
r
160
140
120
100
80
60
40
20
0
Rod
ent d
ensi
ty (
%)
80
70
60
50
40
30
20
10
0

Hedia Bellali et al./Asian Pac J Trop Dis 2017; 7(2): 88-96 93
In time series analysis, predictors are fitted with an ARIMA, AR
(1) model using square root transfer function (168 total models
were realized and compared according to their normalized BIC,
MAE, R2, all significant regression coefficients and residuals).
The final model satisfied all performance expectations (lower
normalized BIC, lower MAE, larger R2, significant coefficients,
and the remaining residuals exhibited no significant trend or
autocorrelation (Figure 7).
1 3 5 7 9 11 13 15 17 19 21 23
Res
idua
l
1 3 5 7 9 11 13 15 17 19 21 23Lag
Residual ACF Residual PACF
1,0
0,5
0,0
-0,5
-1,0
Figure 7. Residual autocorrelation and partial autocorrelation functions from the final ARIMA AR(1) model.ACF: Autocorrelation function; PACF: Partial autocorrelation function.
The ARIMA AR(1) model showed a positive association between
the monthly incidence of ZCL and the Tm (M0), rainfall (M0),
rainfall (M-3) and Tm (M-6). The Tx (M0) and rainfall (Y-1) were
negatively associated with the monthly incidence of ZCL (Table 3).
The 2013–2014 season corresponded to an epidemic year over the
5 years period, and the number of observed cases exceeded the
upper limit of the confidence interval (Figure 8).
Table 3Correlations between monthly ZCL cases and climate parameters, results from times-series analysis with ARIMA AR(1) model.
Parameters Estimate Standard error PTm (M0) 0.102 0.046 0.030Tx (M0) -0.077 0.032 0.019Rainfall (M0) 0.014 0.006 0.025Rainfall (M-3) 0.076 0.070 0.000Tm (M-6) 0.509 0.070 0.000Rainfall (Y-1) -0.123 0.049 0.014Constant -6.608 2.130 0.003AR(1) 0.673 0.110 0.000
Model expectations: R2 = 0.864; MAE = 5.26; Normalized BIC = 5.41.
Jul 2
009
Sep
2009
Nov
200
9Ja
n 20
10
Jan
2011
Jan
2012
Jan
2013
Mar
201
0
Mar
201
1
Mar
201
2
Mar
201
3
May
201
0
May
201
1
May
201
2
May
201
3
Jul 2
010
Num
ber
of Z
CL
Jul 2
011
Jul 2
012
Jul 2
013
Sep
2010
Sep
2011
Sep
2012
Sep
2013
Nov
201
0
Nov
201
1
Nov
201
2
Nov
201
3Ja
n 20
14M
ar 2
014
May
201
4
Date
Observel data Upper Confidence Level Lower Confidence Level
150
100
50
0
Figure 8. Estimation of expected values (UCL, LCL) and prediction of the epidemic season by the ARIMA model plots.
Jul 2
009
Aug
200
9Se
p 20
09O
ct 2
009
Nov
200
9D
ec 2
009
Jan
2010
Feb
2010
Mar
201
0A
pr 2
010
May
201
0Ju
n 20
10Ju
l 201
0A
ug 2
010
Sep
2010
Oct
201
0N
ov 2
010
Dec
201
0Ja
n 20
11Fe
b 20
11M
ar 2
011
Apr
201
1M
ay 2
011
Jun
2011
Jul 2
011
Aug
201
1Se
p 20
11O
ct 2
011
Nov
201
1D
ec 2
011
Jan
2012
Feb
2012
Mar
201
2A
pr 2
012
May
201
2Ju
n 20
12Ju
l 201
2A
ug 2
012
Sep
2012
Oct
201
2N
ov 2
012
Dec
201
2Ja
n 20
13Fe
b 20
13M
ar 2
013
Apr
201
3M
ay 2
013
Jun
2013
Jul 2
013
Aug
201
3Se
p 20
13O
ct 2
013
Nov
201
3D
ec 2
013
Jan
2014
Feb
2014
Mar
201
4A
pr 2
014
May
201
4Ju
n 20
14
Average density of rodents
Rod
ent d
ensi
ty (
%)
Rai
nfal
l (m
m)
Cumulative rainfall (Y-1)
80
70
60
50
40
30
20
10
0
40
35
30
25
20
15
10
5
0
Figure 6. Average density of rodents and the cumulative rainfall during the last year, July 2009–June 2014.

Hedia Bellali et al./Asian Pac J Trop Dis 2017; 7(2): 88-9694
4. Discussion
ZCL is a vector-borne disease common in tropical and
subtropical regions including North Africa. In Tunisia, ZCL is
a major public health problem for the health care system, an
epidemic emerged in some central areas first and expanded
rapidly to the whole central and southern parts of the country
since 1982[11-14,20]. ZCL is not a severe disease, but it leaves
an indelible scar on the faces of patients, after the skin
lesions which lead to significant social consequences such as
stigmatization, mainly in girls and women.
In this study, we monitor simultaneously human new cases of
ZCL, climate parameters and rodent density over a period of five
years at a local scale. The aim was to investigate the relationship
between monthly ZCL incidence and temperatures, precipitation
and rodent density in order to assess the possibilities of the
establishment of an early warning system based on one or some
of these variables to detect epidemics seasons in advance and
implement control measure with the local population.
Our data suggested that ZCL is still highly endemic in Central
Tunisia areas and the 2013–2014 was an epidemic season over
the five years-period. The influence of meteorological factors
on ZCL transmission during 2009–2014 has been established
at monthly time scales throughout different statistical analyses
methods. Significant bivariate correlation between monthly ZCL
number and local climate parameters were identified. Positive
associations were found for the Tx, Tm and Tn lagged for three
and six months, whereas negative associations were observed
for the average rodent density and Tm during the same month.
All multivariate analyses showed positive association between
monthly ZCL incidence and the six months moving average
temperature (Tm (M-6)) with high correlation coefficients and
very small significant level, whereas negative association was
observed for the cumulative rainfall of the last year [rainfall
(Y-1)].
In this work, some limitations should be pointed out. ZCL
reported number could be incomplete since some cases should
be missed. However leishmaniasis occurs commonly in this area
so that it is not necessary for all cases to be reported and this
should not reduce the effectiveness of surveillance.
This work is interesting since it is the first study in Tunisia
which used data from ZCL active surveillance system and
climate variables monitored by private weather station that was
implemented in the study area giving more precision for these
parameters.
Simultaneous monitoring ZCL cases, meteorological
parameters and environmental conditions in the study area gave
us more real and precise data. These ecological data of sixty
observations allowed us to investigate relationship between ZCL
transmission and climate parameters using different statistical
methods and found consistent results. Multivariate autoregressive
models with square root transformation showed precision (high
R2) and skill (low MAE, low normalized BIC). As in previous
studies[19], the ARIMA transfer models in times-series analysis
produced the most appropriate fit in modeling transmission of
infectious diseases for early warning system implementation.
However, it needs time series sufficiently long for developing
and evaluating forecasting models.
Our study suggested that the epidemic curve displays peak
and inter-epidemic periodicity of 5 years as shown by Toumi
et al.[10] on a long series observation. Key factors driving
temporal dynamics of ZCL transmission in Tunisia are not well
studied. Based on our time series analysis, climate parameters
play a significant role in ZCL transmission. We showed for the
first time, that the average temperature six months ago is the
most important predictor for ZCL incidence. Toumi et al.[10]
demonstrated the relation between humidity and rainfall lagged
for 13–15 months and ZCL incidence in Sidi Bouzid, but the
temperature was not associated to ZCL incidence. However,
Toumi et al.[10] used different source of data and different
area for the study. They used the number of ZCL cases from
the routine passive detection and climate variables from the
Tunisian National Institute of Metrology. Data were collected
and analyzed for all the governorate of Sidi Bouzid. In our
study, we used data from an active monitoring system that was
implemented in a small area.
Although, it’s well known that the ambient temperature
determines insect’s reproduction rate, biting behaviour and
survival. Moreover, the incubation period of pathogens inside
vectors tends to be shorter at warmer temperatures. Previous
studies showed that temperature affects significantly the
density and dynamics of Phlebotomus papatasi[21-24]. The
work of Kassem et al.[25] in the Nile Delta revealed that sand
fly densities were strongly correlated to temperature but not
to relative humidity or wind velocity. However, the study of
Bounoua et al.[26] in Algeria demonstrated that the establishment
of new endemic foci in regions that were not previously endemic
was related to sufficient increase in minimum temperatures.
Cutaneous leishmaniasis in Brazil[27] has a marked seasonality
and is linked with dry and warm conditions of the following
season, which favor the vectors and fly development.
The increase of cumulative rainfall level for the previous
three months increases the ZCL incidence but, the decrease of
rainfall for the last year increases ZCL number. Higher rainfall
quantities in the previous three months would increase the
density of chenopods, a halophytic plant that constitute the main

Hedia Bellali et al./Asian Pac J Trop Dis 2017; 7(2): 88-96 95
source of rodent’s reservoirs feeding. Consequently the reservoir
density increases, and affects the ZCL transmission. The negative
association between rainfall lagged for 12 months and the
incidence of the disease could be explained by indirect factors
such as the exposition of the farmers and their family member’s
to the sand fly bites due to intensive and frequent irrigation
after a dry season. Also, very high levels of rainfall during the
previous 12 months would cause flooding which would reduce
the density of chenopods and thus the population of rodents.
Similar findings was observed in Golestan Province in Iran[28]
and in French Guiana[29] where ZCL incidences were negatively
correlated with rainfall, and the number of rainydays and
positively correlated with temperature. Gholamrezaei et al.[30],
found that mean annual temperature and seasonal precipitation
contribute to the potential distribution of main reservoir hosts of
ZCL in Iran.
CL incidence rates in Jordan, Syria, Iraq and SaudiArabia[31]
seem to have a positive relationship with precipitation and
negative relationship with temperature. Though, no relationship
was identified betweenthe disease incidence rates and the
humidity.
As there is no vaccine against ZCL and the treatment is not
effective for the scar, rapid case detection and treatment can’t
reduce the epidemic. Moreover, control measures against
rodents and vectors are also not effective and very harmful to
the environment[17]. Thus, predicting epidemics well in advance
and control measures implementation within the population such
as self protection from sandfly bites by reducing their exposure
outside and inside habitation could reduce the impact of the
epidemic mainly in most vulnerable people such as children and
women.
Prediction of epidemics through early warning systems is
a high research priority to improve the response of control
programs of ZCL. The present study established that early
warning systems based on climate parameters is a feasible
application for ZCL. However, some questions need to be
addressed when modeling ZCL transmission: first, a sustained
surveillance and monitoring efforts of ZCL and climate
and environmental factors is needed to provide time series
sufficiently long for developing and evaluating forecasting
models. A minimum of ten years period is needed to establish a
time series data, so that model can be developed in 70% of the
data and assessed and validate in the other 30%. Second, the
appropriate functional form to introduce also the dependent and
climate variables[32] and the appropriate approach for modeling
seasonality[33] should be further investigated. Finally, models
should be evaluated and compared for predictability with “out-
of-fit” data and not simply quality of fit[34-36] and for the
robustness of the relationship with covariates in the selected
model[37].
Conflict of interest statement
We declare that we have no conflict of interest.
Acknowledgments
The authors would like to thank Z. El Ahmadi, B. Zafouri
from the Regional Directorate of Publichealth of Sidi Bouzid,
Tunisia and T Jlali, from the Regional Directorate of Agriculture
of Sidi Bouzid, Tunisia. This study was carried out within
the framework of the project “Supporting community-based
response to Emerging Zoonotic Cutaneous Leishmaniasis (ZCL)
through EcoHealth approach” (Project IDRC 105509_44) which is
financially supported by the International Development Research
Center (IRDC-Canada).
References
[1] McMichael AJ, Lindgren E. Climate change: present and future risks
to health, and necessary responses. J Intern Med 2011; 270: 401-13.
[2] Dhimal M, Ahrens B, Kuch U. Climate change and spatiotemporal
distributions of vector-borne diseases in Nepal-a systematic
synthesis of literature. PLoS One 2015; 10(6): e0129869.
[3] Githeko AK, Lindsay SW, Confalonieri UE, Patz JA. Climate change
and vector-borne diseases: a regional analysis. Bull World Health
Organ 2000; 78(9): 1136-47.
[4] Kelly-Hope L, Thomson MC. Climate and infectious diseases. In:
Thomson MC, Garcia-Herrera R, Beniston M, editors. Seasonal
forecasts, climate change and human health. New York: Springer;
2008, p. 31.
[5] Diffenbaugh NS, Giorgi F, Raymond L, Bi X. Indicators of 21st
century socioclimatic exposure. Proc Natl Acad Sci U S A 2007;
104(51): 20195-8.
[6] Maestre FT, Salguero-Gomez R, Quero JL. It is getting hotter
in here: determining and projecting the impacts of global
environmental change on drylands. Philos Trans R Soc Lond B Biol
Sci 2012; 367: 3062-75.
[7] Vicente-Serrano SM, Zouber A, Lasanta T, Pueyo Y. Dryness is
accelerating degradation of vulnerable shrublands in semiarid
Mediterranean environments. Ecol Monogr 2012; 82: 407-28.
[8] Ready PD. Leishmaniasis emergence and climate change. Rev Sci
Tech 2008; 27: 399-412.
[9] Cardenas R, Sandoval CM, Rodríguez-Morales AJ, Franco-Paredes
C. Impact of climate variability in the occurrence of leishmaniasis in
northeastern Colombia. Am J Trop Med Hyg 2006; 75: 273-7.

Hedia Bellali et al./Asian Pac J Trop Dis 2017; 7(2): 88-9696
[10] Toumi A, Chlif S, Bettaieb J, Ben Alaya N, Boukthir A, Ahmadi
ZE, et al. Temporal dynamics and impact of climate factors on the
incidence of zoonotic cutaneous leishmaniasis in Central Tunisia.
PLoS Negl Trop Dis 2012; 6: e1633.
[11] Ben Ismail R, Gradoni L, Gramiccia M, Bettini S, Ben Rachid
MS, Garraoui A. Epidemic cutaneous leishmaniasis in Tunisia:
biochemical characterization of parasites. Trans R Soc Trop Med
Hyg 1986; 80: 669-70.
[12] Ben-Ismail R, Ben Rachid MS, Gradoni L, Gramiccia M, Helal H,
Bach-Hamba D. [Zoonotic cutaneous leishmaniasis in Tunisia: study
of the disease reservoir in the Douara area]. Ann Soc Belg Med Trop
1987; 67: 335-43. French.
[13] Ben Ismail R, Ben Rashid MS. Epidémiologie des leishmanioses en
Tunisie. Maladies tropicales transmissibles Ed AUPELF-UREE John
Libbey Eurotext Paris; 1989, p. 73-80.
[14] Salah AB, Kamarianakis Y, Chlif S, Alaya NB, Prastacos P.
Zoonotic cutaneous leishmaniasis in central Tunisia: spatio temporal
dynamics. Int J Epidemiol 2007; 36: 991-1000.
[15] Abaab A. Agricultural modernization and regional development in
Central Tunisia (as in Sidi Bouzid region). In: Jouve AM, ed. The
modernization of Mediterranean agriculture (in memory of Pierre
Coulomb). Montpellier: CIHEAM; 1997, p. 249-54. French.
[16] Bellali H, Ben Alaya N., Ahmadi Z, Ennigrou S, Chahed MK.
Eco-environmental, living conditions and farming issues linked to
zoonotic cutaneous leishmaniasis transmission in Central Tunisia: a
population based survey. Int J Trop Med Public Health 2015; 5(1):
1-7.
[17] World Health Organization. Control of the leishmaniases. Report
of a meeting of the WHO Expert Committee on the control of
leishmaniases. Geneva: World Health Organization; 2010. [Online]
Available from: http://apps.who.int/iris/bitstream/10665/44412/1/
WHO_TRS_949_eng.pdf [Accessed on 2rd September, 2016].
[18] Ebi KL, Rocklöv J. Climate change and health modeling: horses for
courses. Glob Health Action 2014; 7: 24154.
[19] Chaves LF, Pascual M. Comparing models for early warning
systems of neglected tropical diseases. PLoS Negl Trop Dis 2007; 1:
e33.
[20] Bettaieb J, Toumi A, Chlif S, Chelghaf B, Boukthir A, Gharbi A,
et al. Prevalence and determinants of leishmania major infection in
emerging and old foci in Tunisia. Parasit Vectors 2014; 7: 386-93.
[21] Benkova I, Volf P. Effect of temperature on metabolism of
Phlebotomus papatasi (Diptera: Psychodidae). J Med Entomol 2006;
44: 150-4.
[22] Kasap OE, Alten B. Comparative demography of the sand
fly Phlebotomus papatasi (Diptera: Psychodidae) at constant
temperatures. J Vector Ecol 2006; 31: 378-85.
[23] Almeida PS, Andrade AJ, Sciamarelli A, Raizer J, Menegatti JA,
Hermes SC, et al. Geographic distribution of phlebotomine sandfly
species (Diptera: Psychodidae) in Central-West Brazil. Mem Inst
Oswaldo Cruz 2015; 110(4): 551-9.
[24] Sangiorgi B, Miranda DN, Oliveira DF, Santos EP, Gomes FR,
Santos EO, et al. Natural breeding places for phlebotomine sand
flies (Diptera: Psychodidae) in a Semiarid Region of Bahia State,
Brazil. J Trop Med 2012; 2012: 124068.
[25] Kassem HA, El-Sayed YA, Baz MM, Kenawy MA, El Sawaf BM.
Climatic factors influencing the abundance of Phlebotomus papatasi
(Scopoli) (Diptera: Psychodidae) in the Nile Delta. J Egypt Soc
Parasitol 2009; 39: 305-16.
[26] Bounoua L, Kahime K, Houti L, Blakey T, Ebi KL, Zhang P, et al.
Linking climate to incidence of zoonotic cutaneous leishmaniasis (L.
major) in Pre-Saharan North Africa. Int J Environ Res Public Health
2013; 10: 3172-91.
[27] Ferreira de Souza RA, Andreoli RV, Toshie Kayano M, Lima
Carvalho A. American cutaneous leishmaniasis cases in the
metropolitan region of Manaus, Brazil: association with climate
variables over time. Geospatial Health 2015; 10: 314-21.
[28] Shirzadi MR, Mollalo A, Yaghoobi-Ershadi MR. Dynamic relations
between incidence of zoonotic cutaneous leishmaniasis and climatic
factors in Golestan Province, Iran. J Arthropod Borne Dis 2015;
9(2): 148-60.
[29] Roger A, Nacher M, Hanf M, Drogoul AS, Adenis A, Basurko C, et
al. Climate and leishmaniasis in French Guiana. Am J Trop Med Hyg
2013; 89(3): 56-9.
[30] Gholamrezaei M, Mohebali M, Hanafi-Bojd AA, Sedaghat MM,
Shirzadi MR. Ecological niche modeling of main reservoir hosts of
zoonotic cutaneous leishmaniasis in Iran. Acta Trop 2016; 160: 44-
52.
[31] Jaber SM, Ibbini JH, Hijjawi NS, Amdar NM, Huwail MJ, Al-Aboud
K. Exploring recent spatial patterns of cutaneous leishmaniasis and
their associations with climate in some countries of the Middle East
using geographical information systems. Geospatial Health 2013;
8(1): 143-58.
[32] Cazelles B, Hales S. Infectious diseases, climate influences and
nonstationarity. PLoS Med 2006; 3: e328.
[33] Altizer S, Dobson A, Hosseini P, Hudson P, Pascual M, Rohani P.
Seasonality and the dynamics of infectious diseases. Ecol Lett 2006;
9: 467-84.
[34] Chaves LF, Pascual M. Climate cycles and forecasts of cutaneous
leishmaniasis, a nonstationary vector-borne disease. PLoS Med
2006; 3: e295.
[35] Levins R. Strategies of abstraction. Biol Philos 2006; 21: 741-55.
[36] Selmane S. Dynamic relationship between climate factors and the
incidence of cutaneous leishmaniasis in Biskra Province in Algeria.
Ann Saudi Med 2015; 35(6): 445-9.
[37] Levins R. The strategy of model building in population biology. Am
Sci 1996; 54: 421-31.