asia polyester chain challenges
DESCRIPTION
DownstreamTRANSCRIPT

wwwiciscom
Asia Polyester Chain
Challenges amp Survival Strategies
Prepared amp Presented by Samuel Wong
ICIS Markets Editor
16 May 2014 APIC Pattaya 2014
ICIS has the expertise to support you ndash from the latest news and trading prices to long-term forecasts
Pricing information Reliable price assessments and analyses for the polyester chain including price history enabling you to understand price drivers and to settle your contract prices more confidently
Real-time news service Breaking news and analyses across the global polyester chain Be the first to find out about market-moving news including production updates plant capacities output and shutdowns
Supply and demand data Access data on supply and demand imports and exports as well as production capacity for the global markets over a 6-11 year time span Online interface is customisable enabling you to create a view of trade patterns according to your needs
In-depth market analysis Our expert insight delivers the information and data you need to understand short mid- and long-term trends (up until 2025) as well as informed commentary and analysis on the market outlook ndash all of which enables you to plan for the future with confidence
Request your free sample price report today gtgt
Request your free trial today gtgt
Read more about ICIS supply and demand data gtgt
Read more about our in-depth analysis services gtgt
wwwiciscom
Agenda
bull A look at historical prices in the polyester chain
Market Overview
bull Comparison between price spreads from Naphtha-PTA
bull Strategies adopted so far and its outcome
Spread amp Margins
bull A look at the Chinarsquos economy
bull Expansion plans
Looming Problems amp Results
bull Bearish outlook to continue
Market Outlook
wwwiciscom
Market Overview
wwwiciscom
When One Suffers A Chain Effect Begins
Crude oil Heavy naphtha Crude gasoline Mixed xylenes Para-xylene
Long-chained producers Medium-chained producers
Short-chained producers
Para-xylene 665 PTA 86 Polyester 34 MEG
Key End Use Markets ndash Consumer Goods
Food amp Beverage Personal Care amp Home Care
Apparel Home Textile Apparel Home Textile Electronics
wwwiciscom
Historical Polyester Prices
1200
1300
1400
1500
1600
1700
18000
1-J
an-1
2
01
-Fe
b-1
2
01
-Mar
-12
01
-Ap
r-1
2
01
-May
-12
01
-Ju
n-1
2
01
-Ju
l-1
2
01
-Au
g-1
2
01
-Se
p-1
2
01
-Oct
-12
01
-No
v-1
2
01
-De
c-1
2
01
-Jan
-13
01
-Fe
b-1
3
01
-Mar
-13
01
-Ap
r-1
3
01
-May
-13
01
-Ju
n-1
3
01
-Ju
l-1
3
01
-Au
g-1
3
01
-Se
p-1
3
01
-Oct
-13
01
-No
v-1
3
01
-De
c-1
3
01
-Jan
-14
01
-Fe
b-1
4
01
-Mar
-14
01
-Ap
r-1
4
USD
$t
on
ne
FOB
CM
P
POY
1000
1100
1200
1300
1400
1500
1600
1700
01
-Jan
-12
01
-Fe
b-1
2
01
-Mar
-12
01
-Ap
r-1
2
01
-May
-12
01
-Ju
n-1
2
01
-Ju
l-1
2
01
-Au
g-1
2
01
-Se
p-1
2
01
-Oct
-12
01
-No
v-1
2
01
-De
c-1
2
01
-Jan
-13
01
-Fe
b-1
3
01
-Mar
-13
01
-Ap
r-1
3
01
-May
-13
01
-Ju
n-1
3
01
-Ju
l-1
3
01
-Au
g-1
3
01
-Se
p-1
3
01
-Oct
-13
01
-No
v-1
3
01
-De
c-1
3
01
-Jan
-14
01
-Fe
b-1
4
01
-Mar
-14
01
-Ap
r-1
4
USD
$t
on
ne
FOB
CM
P
PET
wwwiciscom
Asia PX amp PTA Spot Prices in H2 2013 - Present
1410 1440
1470 1415
750
850
950
1050
1150
1250
1350
1450
1550
Jul13 Aug13 Sep13 Oct13 Nov13 Dec13 Jan14 Feb14 Mar14 Apr14
PX
amp P
TA S
po
t P
rice
s ($
to
nn
e C
FR C
MP
)
Period In Months
Asia PX amp PTA Market Overview
PX Prices PTA ACP
wwwiciscom
Where The Problem Lies In The Polyester Chain
0
50
100
150
200
250
300
PET Margins
PET Margins BREAKEVEN
050
100150200250300350400450
POY Margins
POY Margins BREAKEVEN
BREAKEVEN
BREAKEVEN
wwwiciscom
PTA Margins
0
20
40
60
80
100
120
0
200
400
600
800
1000
1200
1400
1600
Jul13 Aug13 Sep13 Oct13 Nov13 Dec13 Jan14 Feb14 Mar14 Apr14
$t
on
ne
(CFR
CM
P)
PTA-PX Spread
MARGINS PX PTA
bull Margins for PTA rebounded from lows of last year bull Margins insufficient to cover variable costs
wwwiciscom
PX
Ma
rgin
s
0
200
400
600
800
Jul13 Aug13 Sep13 Oct13 Nov13 Dec13 Jan14 Feb14 Mar14 Apr14
$t
on
ne
Naphtha-PX Spread
MARGINS Break Even
0
50
100
150
200
250
Jul13 Aug13 Sep13 Oct13 Nov13 Dec13 Jan14 Feb14 Mar14 Apr14
$t
on
ne
MX-PX Spread
MARGINS BREAKEVEN
BREAKEVEN
BREAKEVEN
0
50
100
150
200
250
300
Jul13 Aug13 Sep13 Oct13 Nov13 Dec13 Jan14 Feb14 Mar14 Apr14
$t
on
ne
TDP Margins Based On TolBZPX
TDP Margins BREAKEVEN
BREAKEVEN
wwwiciscom
Weak Polyester Demand PTA Cutbacks
80
72 68
55
68
63
0
10
20
30
40
50
60
70
80
90
0
500
1000
1500
2000
2500
3000
3500
Jan14 Feb14 Mar14 Apr14 EMay14 EJun14
Tho
usa
nd
to
nn
esm
on
th
Chinas PTA Operating Rates 2014
CA
PAC
ITY
CA
PAC
ITY
CA
PAC
ITY
CA
PAC
ITY
CA
PAC
ITY
CA
PAC
ITY
UTI
LIZA
TIO
N
UTI
LIZA
TIO
N
UTI
LIZA
TIO
N
UTI
LIZA
TIO
N
UTI
LIZA
TIO
N
UTI
LIZA
TIO
N
wwwiciscom
PX Makers Attempt To Balance Market
South Korearsquos makers have largely maintained high operating rates as downstream PTA makers were running at around 95 Several makers continue to operate TDP at full while cutting operating rates at PX site selling feedstock MX or pushing it for blending
0
200
400
600
800
1000
1200
1400
1600
1800
2000
60
65
70
75
80
85
90
95
100
105
Jan Feb Mar Apr
PX Operating Rates
China South Korea Japan China South Korea Japan
wwwiciscom
Why The Squeezed Margins In Q1 2014
76
82
74
80
72 68
0
10
20
30
40
50
60
70
80
90
0
200000
400000
600000
800000
1000000
1200000
1400000
1600000
January February March
Import PX Requirement Local Build Up PX OR PTA OR
bull Build up in stocks in China bull Weak downstream performance
wwwiciscom
Various Strategies By Companies
bull PX producers cut operating ratesshut plants sells feedstock purchase spot PX
bull Japanrsquos Teijin decides to dissolve PX business bull PTA Producers keeps term contract at average of 60-80 coverage
bull PTA Producers selling feedstock PX to maintain healthy inventories
bull PTA Producers operating higher rates to ldquoforcerdquo shut smaller companies
bull Polyester producers to maintain healthy PTAMEG inventories avoid build ups
wwwiciscom
Asian PTA producers in weaker pricing position a buyersrsquo
market
bull lt 10 of total import volume to link with PX price China
bull No polyester makers accepted PX-link contracts India
bull Cost portion mostly at 50-70 Middle East
bull Cost portion mostly at 50-70 Turkey
bull PTA producers push for PX-linked contract formula to enlarge spread
wwwiciscom
Looming Problems amp Results
wwwiciscom
Proportions In The Downstream Markets
PFY 67
PSF 15
PET 18
Chinas Polyester Production
PFY 50
PSF 21
PET 29
Indias Polyester Production
wwwiciscom
Why Are All Eyes On China
China 63
NE Asia 14
India 10
SE Asia 9
Middle East 19
Asia Polyester Market Shares by Region
-4
0
4
8
12
16
2011 2012 2013E 2014E 2015E 2016E
Polyester Growth Forecast by Regions
China India NE Asia SE Asia Middle East
wwwiciscom
0
2
4
6
8
10
12
0
10000
20000
30000
40000
50000
60000
2011 2012 2013 2014E 2015E 2016E
Asia Polyester Growth
China S Korea Taiwan
Japan India Thailand
Middle East Indonesia Others
Indias Polyester Growth Rate Chinas Polyester Growth Rate
Is downstream markets growth that strong
wwwiciscom
275 313
363 413
453 483
0
20
40
60
2010 2011 2012 2013 2014E 2015E
Unit million
tonnesyear
Chinas Polyester Capacity Expansion
16 11
16
51 56
62
78 86 89
0
3
6
9
2010 2011 2012 2013 2014E 2015E
Unit million
tonnesyear
Indias Polyester Capacity Expansion
19 15
10
End market continues expansion
wwwiciscom
Asia PTA market to remain oversupplied
bull Demand expected to grow 6-7year capacity growth to
accelerate again in 2014
Source Industry
3
12
25
12
20
12
5
145
73 62 65 71 67 68
0
5
10
15
20
25
30
2010 2011 2012 2013 2014E 2015E 2016E
Gro
wth
rate
Asia PTA Supply vs Demand Growth
Supply growth rate Demand growth rate
wwwiciscom
Asia PX capacity growth peaks in 2013-2015
Data source Industry sources
bull Asiarsquos PX demand growth is expected to remain at 5-6 annually
bull Capacity growth forecast at 14-17 annually in 2013-2015 to decline to 5
in 2016 Supply growth acceleration to keep up with downstream capacities
9
2
17 15
14
5 8
5
6 5 5 6
0
2
4
6
8
10
12
14
16
18
20
2011 2012 2013E 2014E 2015E 2016E
Gro
wth
rate
Asia PX Supply vs Demand Growth
Supply growth rate Demand growth rate
wwwiciscom
455
507
592
663
703 736
+12 +8 +7 +6 +6 +5
85
82
76
72 72
73
60
65
70
75
80
85
90
0
20
40
60
80
2010 2011 2012 2013 2014 2015
Operating rates
Unit million tonnesyear
Asia polyester capacity Asia polyester production Utilisation rates
Polyester operating rates to lower
wwwiciscom
Asia PTA plants to run at lower operating rates
Source Industry
bull PTA capacity reached 605m tonnesyear in 2013 up by
12 from 2012 after a 25 growth in 2012
bull Continued expansions will lower operating rates further
91
77 73
66 63
64
55
70
85
100
0
20
40
60
80
100
2010 2011 2012 2013 2014E 2015E
Op
erati
ng
rate
s
Un
it
millio
n t
on
nes
year
Asia and Middle East PTA Capacity Expansion
PTA capacity PTA operating rates
wwwiciscom
96 95 98
89
82 76 76
0
20
40
60
80
100
120
0
5
10
15
20
25
30
35
40
45
50
2010 2011 2012 2013 2014E 2015E 2016E
Op
erati
ng
rate
s
Un
it
millio
n t
on
nes
year
Asia PX Plants Operating Rate
Asia PX capacity Asia PX OR
To balance supplydemand conditions
wwwiciscom
A Fundamentally Short Market To Turn Long
0
5000
10000
15000
20000
25000
0
10000
20000
30000
40000
50000
60000
2013E 2014E 2015E 2016E
Bala
nce
Un
it
00
0 t
on
nes
year
Un
it
00
0 t
on
nes
year
Year
PX Effective Demand amp Supply In Asia
Effective PX supply Effective PX demand Balance
wwwiciscom
Challenges Ahead
China to continue to Be the driving force for Asia In 2013 East Asia and Pacific region marked a growth of 72 Overall growth in the region expected to stay flat at 72 in 2014 China expected to grow at 75 New PX capacities to lighten tight supply burden
Moderation of economic activity from Indonesia Malaysia and Thailand because of weak commodity revenues and policy tightening Credit tightening and banks in China restrict cash-flows Non-integrated facilities to face high costs pressure might be forced to shut
Tailwinds Headwinds
wwwiciscom
The Polyester Chain Expansions
wwwiciscom
PX capacity expansion to accelerate in Asia
Source Industry
wwwiciscom
PTA capacity expansion continues in Asia
Source Industry
wwwiciscom
Source Industry
Polyester capacity expansion continues in Asia
wwwiciscom
China Import PX Stats
0 500000 1000000 1500000 2000000 2500000 3000000
S Korea
Japan
Taiwan
SE Asia
Middle East
Others
India
2012 2013
wwwiciscom
CHINA Imp 2743
KOREA Exp 3941
JAPAN Exp 119
TAIWAN Exp 580
INDIA Imp 852
SE ASIA Imp 350
Exp 1100
MIDDLE EAST Imp560
EU (incl Turkey) Exp 650 Imp 370
Asia PTA 2013 Trade Flow
220kt 188kt
23kt
390kt
81kt
380kt
12kt
7kt 170kt
1800kt
wwwiciscom
0
20
40
60
80
100
0
1000
2000
3000
4000
5000
6000
7000
8000
2013 2014E 2015E 2016E 2017E
South Korea Expected Operating Rates
CAPACITY PRODUCTION DEMAND EXPORT OR
0 200 400 600 800 1000 1200 1400 1600 1800 2000
2013
2014E
2015E
2016E
2017E
South Korea Expected Exports
OTHERS TURKEY INDIA CHINA
Will South Korea Follow Taiwanrsquos Strategy
wwwiciscom
Market Outlook
wwwiciscom
End-users
Asia PX price trend outlook
PX 2014 Contract
bull In China term contracts were fixed mostly at flat to a premium of $3tonne based on a 50 ACP 50 CFR quotes formula
bull Contracts were largely fixed at a premium of $7-9tonne in 2013
bull Since the start of 2014 there have been 3 breaks in the PX ACP
PX Spot Prices
Supply and Demand
wwwiciscom
End-users
PX 2014 Contract
PX Spot Prices
bull NaphthaPX spread to be lowered from highs of $500tonne to estimates of $250-260tonne in 2014
bull MXPX spread to remain below the breakeven point estimated at $150-160tonne in 2014
bull Strong uptrend to be limited
Supply and Demand
Asia PX price trend outlook
wwwiciscom
End-users
PX 2014 Contract
PX Spot Prices
Supply and Demand
bull Market dynamics to shift from fundamentally short to balanced-to-long
bull China to remain key importer with imports per month expected to increased to around 800000-850000 tonnes
bull India to be in an export position following OMPL start-up
Asia PX price trend outlook
wwwiciscom
End-users
Asia PTA price trend outlook
PTA 2014 Term
bull PTA makers continue to push for PX-linked formula contracts to mitigate losses
PTA Spot Prices
Supply and Demand
wwwiciscom
End-users
PTA 2014 Term
PTA Spot Prices
bull Inventories to remain high in China
bull Despite huge influx of PX capacities PTA prices under pressure
bull PX-PTA margins estimated at $80-90tonne
Supply and Demand
Asia PTA price trend outlook
wwwiciscom
End-users
PTA 2014 Term
PTA Spot Prices
Supply and Demand
bull PTA expansion continues market to remain oversupplied
bull China PTA makers to push cargoes out from the country
bull Supply growth to continue to outstrip demand growth
Asia PTA price trend outlook
wwwiciscom
ICIS has the expertise to support you ndash from the latest news and trading prices to long-term forecasts
Pricing information Reliable price assessments and analyses for the polyester chain including price history enabling you to understand price drivers and to settle your contract prices more confidently
Real-time news service Breaking news and analyses across the global polyester chain Be the first to find out about market-moving news including production updates plant capacities output and shutdowns
Supply and demand data Access data on supply and demand imports and exports as well as production capacity for the global markets over a 6-11 year time span Online interface is customisable enabling you to create a view of trade patterns according to your needs
In-depth market analysis Our expert insight delivers the information and data you need to understand short mid- and long-term trends (up until 2025) as well as informed commentary and analysis on the market outlook ndash all of which enables you to plan for the future with confidence
Request your free sample price report today gtgt
Request your free trial today gtgt
Read more about ICIS supply and demand data gtgt
Read more about our in-depth analysis services gtgt
wwwiciscom
Agenda
bull A look at historical prices in the polyester chain
Market Overview
bull Comparison between price spreads from Naphtha-PTA
bull Strategies adopted so far and its outcome
Spread amp Margins
bull A look at the Chinarsquos economy
bull Expansion plans
Looming Problems amp Results
bull Bearish outlook to continue
Market Outlook
wwwiciscom
Market Overview
wwwiciscom
When One Suffers A Chain Effect Begins
Crude oil Heavy naphtha Crude gasoline Mixed xylenes Para-xylene
Long-chained producers Medium-chained producers
Short-chained producers
Para-xylene 665 PTA 86 Polyester 34 MEG
Key End Use Markets ndash Consumer Goods
Food amp Beverage Personal Care amp Home Care
Apparel Home Textile Apparel Home Textile Electronics
wwwiciscom
Historical Polyester Prices
1200
1300
1400
1500
1600
1700
18000
1-J
an-1
2
01
-Fe
b-1
2
01
-Mar
-12
01
-Ap
r-1
2
01
-May
-12
01
-Ju
n-1
2
01
-Ju
l-1
2
01
-Au
g-1
2
01
-Se
p-1
2
01
-Oct
-12
01
-No
v-1
2
01
-De
c-1
2
01
-Jan
-13
01
-Fe
b-1
3
01
-Mar
-13
01
-Ap
r-1
3
01
-May
-13
01
-Ju
n-1
3
01
-Ju
l-1
3
01
-Au
g-1
3
01
-Se
p-1
3
01
-Oct
-13
01
-No
v-1
3
01
-De
c-1
3
01
-Jan
-14
01
-Fe
b-1
4
01
-Mar
-14
01
-Ap
r-1
4
USD
$t
on
ne
FOB
CM
P
POY
1000
1100
1200
1300
1400
1500
1600
1700
01
-Jan
-12
01
-Fe
b-1
2
01
-Mar
-12
01
-Ap
r-1
2
01
-May
-12
01
-Ju
n-1
2
01
-Ju
l-1
2
01
-Au
g-1
2
01
-Se
p-1
2
01
-Oct
-12
01
-No
v-1
2
01
-De
c-1
2
01
-Jan
-13
01
-Fe
b-1
3
01
-Mar
-13
01
-Ap
r-1
3
01
-May
-13
01
-Ju
n-1
3
01
-Ju
l-1
3
01
-Au
g-1
3
01
-Se
p-1
3
01
-Oct
-13
01
-No
v-1
3
01
-De
c-1
3
01
-Jan
-14
01
-Fe
b-1
4
01
-Mar
-14
01
-Ap
r-1
4
USD
$t
on
ne
FOB
CM
P
PET
wwwiciscom
Asia PX amp PTA Spot Prices in H2 2013 - Present
1410 1440
1470 1415
750
850
950
1050
1150
1250
1350
1450
1550
Jul13 Aug13 Sep13 Oct13 Nov13 Dec13 Jan14 Feb14 Mar14 Apr14
PX
amp P
TA S
po
t P
rice
s ($
to
nn
e C
FR C
MP
)
Period In Months
Asia PX amp PTA Market Overview
PX Prices PTA ACP
wwwiciscom
Where The Problem Lies In The Polyester Chain
0
50
100
150
200
250
300
PET Margins
PET Margins BREAKEVEN
050
100150200250300350400450
POY Margins
POY Margins BREAKEVEN
BREAKEVEN
BREAKEVEN
wwwiciscom
PTA Margins
0
20
40
60
80
100
120
0
200
400
600
800
1000
1200
1400
1600
Jul13 Aug13 Sep13 Oct13 Nov13 Dec13 Jan14 Feb14 Mar14 Apr14
$t
on
ne
(CFR
CM
P)
PTA-PX Spread
MARGINS PX PTA
bull Margins for PTA rebounded from lows of last year bull Margins insufficient to cover variable costs
wwwiciscom
PX
Ma
rgin
s
0
200
400
600
800
Jul13 Aug13 Sep13 Oct13 Nov13 Dec13 Jan14 Feb14 Mar14 Apr14
$t
on
ne
Naphtha-PX Spread
MARGINS Break Even
0
50
100
150
200
250
Jul13 Aug13 Sep13 Oct13 Nov13 Dec13 Jan14 Feb14 Mar14 Apr14
$t
on
ne
MX-PX Spread
MARGINS BREAKEVEN
BREAKEVEN
BREAKEVEN
0
50
100
150
200
250
300
Jul13 Aug13 Sep13 Oct13 Nov13 Dec13 Jan14 Feb14 Mar14 Apr14
$t
on
ne
TDP Margins Based On TolBZPX
TDP Margins BREAKEVEN
BREAKEVEN
wwwiciscom
Weak Polyester Demand PTA Cutbacks
80
72 68
55
68
63
0
10
20
30
40
50
60
70
80
90
0
500
1000
1500
2000
2500
3000
3500
Jan14 Feb14 Mar14 Apr14 EMay14 EJun14
Tho
usa
nd
to
nn
esm
on
th
Chinas PTA Operating Rates 2014
CA
PAC
ITY
CA
PAC
ITY
CA
PAC
ITY
CA
PAC
ITY
CA
PAC
ITY
CA
PAC
ITY
UTI
LIZA
TIO
N
UTI
LIZA
TIO
N
UTI
LIZA
TIO
N
UTI
LIZA
TIO
N
UTI
LIZA
TIO
N
UTI
LIZA
TIO
N
wwwiciscom
PX Makers Attempt To Balance Market
South Korearsquos makers have largely maintained high operating rates as downstream PTA makers were running at around 95 Several makers continue to operate TDP at full while cutting operating rates at PX site selling feedstock MX or pushing it for blending
0
200
400
600
800
1000
1200
1400
1600
1800
2000
60
65
70
75
80
85
90
95
100
105
Jan Feb Mar Apr
PX Operating Rates
China South Korea Japan China South Korea Japan
wwwiciscom
Why The Squeezed Margins In Q1 2014
76
82
74
80
72 68
0
10
20
30
40
50
60
70
80
90
0
200000
400000
600000
800000
1000000
1200000
1400000
1600000
January February March
Import PX Requirement Local Build Up PX OR PTA OR
bull Build up in stocks in China bull Weak downstream performance
wwwiciscom
Various Strategies By Companies
bull PX producers cut operating ratesshut plants sells feedstock purchase spot PX
bull Japanrsquos Teijin decides to dissolve PX business bull PTA Producers keeps term contract at average of 60-80 coverage
bull PTA Producers selling feedstock PX to maintain healthy inventories
bull PTA Producers operating higher rates to ldquoforcerdquo shut smaller companies
bull Polyester producers to maintain healthy PTAMEG inventories avoid build ups
wwwiciscom
Asian PTA producers in weaker pricing position a buyersrsquo
market
bull lt 10 of total import volume to link with PX price China
bull No polyester makers accepted PX-link contracts India
bull Cost portion mostly at 50-70 Middle East
bull Cost portion mostly at 50-70 Turkey
bull PTA producers push for PX-linked contract formula to enlarge spread
wwwiciscom
Looming Problems amp Results
wwwiciscom
Proportions In The Downstream Markets
PFY 67
PSF 15
PET 18
Chinas Polyester Production
PFY 50
PSF 21
PET 29
Indias Polyester Production
wwwiciscom
Why Are All Eyes On China
China 63
NE Asia 14
India 10
SE Asia 9
Middle East 19
Asia Polyester Market Shares by Region
-4
0
4
8
12
16
2011 2012 2013E 2014E 2015E 2016E
Polyester Growth Forecast by Regions
China India NE Asia SE Asia Middle East
wwwiciscom
0
2
4
6
8
10
12
0
10000
20000
30000
40000
50000
60000
2011 2012 2013 2014E 2015E 2016E
Asia Polyester Growth
China S Korea Taiwan
Japan India Thailand
Middle East Indonesia Others
Indias Polyester Growth Rate Chinas Polyester Growth Rate
Is downstream markets growth that strong
wwwiciscom
275 313
363 413
453 483
0
20
40
60
2010 2011 2012 2013 2014E 2015E
Unit million
tonnesyear
Chinas Polyester Capacity Expansion
16 11
16
51 56
62
78 86 89
0
3
6
9
2010 2011 2012 2013 2014E 2015E
Unit million
tonnesyear
Indias Polyester Capacity Expansion
19 15
10
End market continues expansion
wwwiciscom
Asia PTA market to remain oversupplied
bull Demand expected to grow 6-7year capacity growth to
accelerate again in 2014
Source Industry
3
12
25
12
20
12
5
145
73 62 65 71 67 68
0
5
10
15
20
25
30
2010 2011 2012 2013 2014E 2015E 2016E
Gro
wth
rate
Asia PTA Supply vs Demand Growth
Supply growth rate Demand growth rate
wwwiciscom
Asia PX capacity growth peaks in 2013-2015
Data source Industry sources
bull Asiarsquos PX demand growth is expected to remain at 5-6 annually
bull Capacity growth forecast at 14-17 annually in 2013-2015 to decline to 5
in 2016 Supply growth acceleration to keep up with downstream capacities
9
2
17 15
14
5 8
5
6 5 5 6
0
2
4
6
8
10
12
14
16
18
20
2011 2012 2013E 2014E 2015E 2016E
Gro
wth
rate
Asia PX Supply vs Demand Growth
Supply growth rate Demand growth rate
wwwiciscom
455
507
592
663
703 736
+12 +8 +7 +6 +6 +5
85
82
76
72 72
73
60
65
70
75
80
85
90
0
20
40
60
80
2010 2011 2012 2013 2014 2015
Operating rates
Unit million tonnesyear
Asia polyester capacity Asia polyester production Utilisation rates
Polyester operating rates to lower
wwwiciscom
Asia PTA plants to run at lower operating rates
Source Industry
bull PTA capacity reached 605m tonnesyear in 2013 up by
12 from 2012 after a 25 growth in 2012
bull Continued expansions will lower operating rates further
91
77 73
66 63
64
55
70
85
100
0
20
40
60
80
100
2010 2011 2012 2013 2014E 2015E
Op
erati
ng
rate
s
Un
it
millio
n t
on
nes
year
Asia and Middle East PTA Capacity Expansion
PTA capacity PTA operating rates
wwwiciscom
96 95 98
89
82 76 76
0
20
40
60
80
100
120
0
5
10
15
20
25
30
35
40
45
50
2010 2011 2012 2013 2014E 2015E 2016E
Op
erati
ng
rate
s
Un
it
millio
n t
on
nes
year
Asia PX Plants Operating Rate
Asia PX capacity Asia PX OR
To balance supplydemand conditions
wwwiciscom
A Fundamentally Short Market To Turn Long
0
5000
10000
15000
20000
25000
0
10000
20000
30000
40000
50000
60000
2013E 2014E 2015E 2016E
Bala
nce
Un
it
00
0 t
on
nes
year
Un
it
00
0 t
on
nes
year
Year
PX Effective Demand amp Supply In Asia
Effective PX supply Effective PX demand Balance
wwwiciscom
Challenges Ahead
China to continue to Be the driving force for Asia In 2013 East Asia and Pacific region marked a growth of 72 Overall growth in the region expected to stay flat at 72 in 2014 China expected to grow at 75 New PX capacities to lighten tight supply burden
Moderation of economic activity from Indonesia Malaysia and Thailand because of weak commodity revenues and policy tightening Credit tightening and banks in China restrict cash-flows Non-integrated facilities to face high costs pressure might be forced to shut
Tailwinds Headwinds
wwwiciscom
The Polyester Chain Expansions
wwwiciscom
PX capacity expansion to accelerate in Asia
Source Industry
wwwiciscom
PTA capacity expansion continues in Asia
Source Industry
wwwiciscom
Source Industry
Polyester capacity expansion continues in Asia
wwwiciscom
China Import PX Stats
0 500000 1000000 1500000 2000000 2500000 3000000
S Korea
Japan
Taiwan
SE Asia
Middle East
Others
India
2012 2013
wwwiciscom
CHINA Imp 2743
KOREA Exp 3941
JAPAN Exp 119
TAIWAN Exp 580
INDIA Imp 852
SE ASIA Imp 350
Exp 1100
MIDDLE EAST Imp560
EU (incl Turkey) Exp 650 Imp 370
Asia PTA 2013 Trade Flow
220kt 188kt
23kt
390kt
81kt
380kt
12kt
7kt 170kt
1800kt
wwwiciscom
0
20
40
60
80
100
0
1000
2000
3000
4000
5000
6000
7000
8000
2013 2014E 2015E 2016E 2017E
South Korea Expected Operating Rates
CAPACITY PRODUCTION DEMAND EXPORT OR
0 200 400 600 800 1000 1200 1400 1600 1800 2000
2013
2014E
2015E
2016E
2017E
South Korea Expected Exports
OTHERS TURKEY INDIA CHINA
Will South Korea Follow Taiwanrsquos Strategy
wwwiciscom
Market Outlook
wwwiciscom
End-users
Asia PX price trend outlook
PX 2014 Contract
bull In China term contracts were fixed mostly at flat to a premium of $3tonne based on a 50 ACP 50 CFR quotes formula
bull Contracts were largely fixed at a premium of $7-9tonne in 2013
bull Since the start of 2014 there have been 3 breaks in the PX ACP
PX Spot Prices
Supply and Demand
wwwiciscom
End-users
PX 2014 Contract
PX Spot Prices
bull NaphthaPX spread to be lowered from highs of $500tonne to estimates of $250-260tonne in 2014
bull MXPX spread to remain below the breakeven point estimated at $150-160tonne in 2014
bull Strong uptrend to be limited
Supply and Demand
Asia PX price trend outlook
wwwiciscom
End-users
PX 2014 Contract
PX Spot Prices
Supply and Demand
bull Market dynamics to shift from fundamentally short to balanced-to-long
bull China to remain key importer with imports per month expected to increased to around 800000-850000 tonnes
bull India to be in an export position following OMPL start-up
Asia PX price trend outlook
wwwiciscom
End-users
Asia PTA price trend outlook
PTA 2014 Term
bull PTA makers continue to push for PX-linked formula contracts to mitigate losses
PTA Spot Prices
Supply and Demand
wwwiciscom
End-users
PTA 2014 Term
PTA Spot Prices
bull Inventories to remain high in China
bull Despite huge influx of PX capacities PTA prices under pressure
bull PX-PTA margins estimated at $80-90tonne
Supply and Demand
Asia PTA price trend outlook
wwwiciscom
End-users
PTA 2014 Term
PTA Spot Prices
Supply and Demand
bull PTA expansion continues market to remain oversupplied
bull China PTA makers to push cargoes out from the country
bull Supply growth to continue to outstrip demand growth
Asia PTA price trend outlook
wwwiciscom
ICIS has the expertise to support you ndash from the latest news and trading prices to long-term forecasts
Pricing information Reliable price assessments and analyses for the polyester chain including price history enabling you to understand price drivers and to settle your contract prices more confidently
Real-time news service Breaking news and analyses across the global polyester chain Be the first to find out about market-moving news including production updates plant capacities output and shutdowns
Supply and demand data Access data on supply and demand imports and exports as well as production capacity for the global markets over a 6-11 year time span Online interface is customisable enabling you to create a view of trade patterns according to your needs
In-depth market analysis Our expert insight delivers the information and data you need to understand short mid- and long-term trends (up until 2025) as well as informed commentary and analysis on the market outlook ndash all of which enables you to plan for the future with confidence
Request your free sample price report today gtgt
Request your free trial today gtgt
Read more about ICIS supply and demand data gtgt
Read more about our in-depth analysis services gtgt
wwwiciscom
Agenda
bull A look at historical prices in the polyester chain
Market Overview
bull Comparison between price spreads from Naphtha-PTA
bull Strategies adopted so far and its outcome
Spread amp Margins
bull A look at the Chinarsquos economy
bull Expansion plans
Looming Problems amp Results
bull Bearish outlook to continue
Market Outlook
wwwiciscom
Market Overview
wwwiciscom
When One Suffers A Chain Effect Begins
Crude oil Heavy naphtha Crude gasoline Mixed xylenes Para-xylene
Long-chained producers Medium-chained producers
Short-chained producers
Para-xylene 665 PTA 86 Polyester 34 MEG
Key End Use Markets ndash Consumer Goods
Food amp Beverage Personal Care amp Home Care
Apparel Home Textile Apparel Home Textile Electronics
wwwiciscom
Historical Polyester Prices
1200
1300
1400
1500
1600
1700
18000
1-J
an-1
2
01
-Fe
b-1
2
01
-Mar
-12
01
-Ap
r-1
2
01
-May
-12
01
-Ju
n-1
2
01
-Ju
l-1
2
01
-Au
g-1
2
01
-Se
p-1
2
01
-Oct
-12
01
-No
v-1
2
01
-De
c-1
2
01
-Jan
-13
01
-Fe
b-1
3
01
-Mar
-13
01
-Ap
r-1
3
01
-May
-13
01
-Ju
n-1
3
01
-Ju
l-1
3
01
-Au
g-1
3
01
-Se
p-1
3
01
-Oct
-13
01
-No
v-1
3
01
-De
c-1
3
01
-Jan
-14
01
-Fe
b-1
4
01
-Mar
-14
01
-Ap
r-1
4
USD
$t
on
ne
FOB
CM
P
POY
1000
1100
1200
1300
1400
1500
1600
1700
01
-Jan
-12
01
-Fe
b-1
2
01
-Mar
-12
01
-Ap
r-1
2
01
-May
-12
01
-Ju
n-1
2
01
-Ju
l-1
2
01
-Au
g-1
2
01
-Se
p-1
2
01
-Oct
-12
01
-No
v-1
2
01
-De
c-1
2
01
-Jan
-13
01
-Fe
b-1
3
01
-Mar
-13
01
-Ap
r-1
3
01
-May
-13
01
-Ju
n-1
3
01
-Ju
l-1
3
01
-Au
g-1
3
01
-Se
p-1
3
01
-Oct
-13
01
-No
v-1
3
01
-De
c-1
3
01
-Jan
-14
01
-Fe
b-1
4
01
-Mar
-14
01
-Ap
r-1
4
USD
$t
on
ne
FOB
CM
P
PET
wwwiciscom
Asia PX amp PTA Spot Prices in H2 2013 - Present
1410 1440
1470 1415
750
850
950
1050
1150
1250
1350
1450
1550
Jul13 Aug13 Sep13 Oct13 Nov13 Dec13 Jan14 Feb14 Mar14 Apr14
PX
amp P
TA S
po
t P
rice
s ($
to
nn
e C
FR C
MP
)
Period In Months
Asia PX amp PTA Market Overview
PX Prices PTA ACP
wwwiciscom
Where The Problem Lies In The Polyester Chain
0
50
100
150
200
250
300
PET Margins
PET Margins BREAKEVEN
050
100150200250300350400450
POY Margins
POY Margins BREAKEVEN
BREAKEVEN
BREAKEVEN
wwwiciscom
PTA Margins
0
20
40
60
80
100
120
0
200
400
600
800
1000
1200
1400
1600
Jul13 Aug13 Sep13 Oct13 Nov13 Dec13 Jan14 Feb14 Mar14 Apr14
$t
on
ne
(CFR
CM
P)
PTA-PX Spread
MARGINS PX PTA
bull Margins for PTA rebounded from lows of last year bull Margins insufficient to cover variable costs
wwwiciscom
PX
Ma
rgin
s
0
200
400
600
800
Jul13 Aug13 Sep13 Oct13 Nov13 Dec13 Jan14 Feb14 Mar14 Apr14
$t
on
ne
Naphtha-PX Spread
MARGINS Break Even
0
50
100
150
200
250
Jul13 Aug13 Sep13 Oct13 Nov13 Dec13 Jan14 Feb14 Mar14 Apr14
$t
on
ne
MX-PX Spread
MARGINS BREAKEVEN
BREAKEVEN
BREAKEVEN
0
50
100
150
200
250
300
Jul13 Aug13 Sep13 Oct13 Nov13 Dec13 Jan14 Feb14 Mar14 Apr14
$t
on
ne
TDP Margins Based On TolBZPX
TDP Margins BREAKEVEN
BREAKEVEN
wwwiciscom
Weak Polyester Demand PTA Cutbacks
80
72 68
55
68
63
0
10
20
30
40
50
60
70
80
90
0
500
1000
1500
2000
2500
3000
3500
Jan14 Feb14 Mar14 Apr14 EMay14 EJun14
Tho
usa
nd
to
nn
esm
on
th
Chinas PTA Operating Rates 2014
CA
PAC
ITY
CA
PAC
ITY
CA
PAC
ITY
CA
PAC
ITY
CA
PAC
ITY
CA
PAC
ITY
UTI
LIZA
TIO
N
UTI
LIZA
TIO
N
UTI
LIZA
TIO
N
UTI
LIZA
TIO
N
UTI
LIZA
TIO
N
UTI
LIZA
TIO
N
wwwiciscom
PX Makers Attempt To Balance Market
South Korearsquos makers have largely maintained high operating rates as downstream PTA makers were running at around 95 Several makers continue to operate TDP at full while cutting operating rates at PX site selling feedstock MX or pushing it for blending
0
200
400
600
800
1000
1200
1400
1600
1800
2000
60
65
70
75
80
85
90
95
100
105
Jan Feb Mar Apr
PX Operating Rates
China South Korea Japan China South Korea Japan
wwwiciscom
Why The Squeezed Margins In Q1 2014
76
82
74
80
72 68
0
10
20
30
40
50
60
70
80
90
0
200000
400000
600000
800000
1000000
1200000
1400000
1600000
January February March
Import PX Requirement Local Build Up PX OR PTA OR
bull Build up in stocks in China bull Weak downstream performance
wwwiciscom
Various Strategies By Companies
bull PX producers cut operating ratesshut plants sells feedstock purchase spot PX
bull Japanrsquos Teijin decides to dissolve PX business bull PTA Producers keeps term contract at average of 60-80 coverage
bull PTA Producers selling feedstock PX to maintain healthy inventories
bull PTA Producers operating higher rates to ldquoforcerdquo shut smaller companies
bull Polyester producers to maintain healthy PTAMEG inventories avoid build ups
wwwiciscom
Asian PTA producers in weaker pricing position a buyersrsquo
market
bull lt 10 of total import volume to link with PX price China
bull No polyester makers accepted PX-link contracts India
bull Cost portion mostly at 50-70 Middle East
bull Cost portion mostly at 50-70 Turkey
bull PTA producers push for PX-linked contract formula to enlarge spread
wwwiciscom
Looming Problems amp Results
wwwiciscom
Proportions In The Downstream Markets
PFY 67
PSF 15
PET 18
Chinas Polyester Production
PFY 50
PSF 21
PET 29
Indias Polyester Production
wwwiciscom
Why Are All Eyes On China
China 63
NE Asia 14
India 10
SE Asia 9
Middle East 19
Asia Polyester Market Shares by Region
-4
0
4
8
12
16
2011 2012 2013E 2014E 2015E 2016E
Polyester Growth Forecast by Regions
China India NE Asia SE Asia Middle East
wwwiciscom
0
2
4
6
8
10
12
0
10000
20000
30000
40000
50000
60000
2011 2012 2013 2014E 2015E 2016E
Asia Polyester Growth
China S Korea Taiwan
Japan India Thailand
Middle East Indonesia Others
Indias Polyester Growth Rate Chinas Polyester Growth Rate
Is downstream markets growth that strong
wwwiciscom
275 313
363 413
453 483
0
20
40
60
2010 2011 2012 2013 2014E 2015E
Unit million
tonnesyear
Chinas Polyester Capacity Expansion
16 11
16
51 56
62
78 86 89
0
3
6
9
2010 2011 2012 2013 2014E 2015E
Unit million
tonnesyear
Indias Polyester Capacity Expansion
19 15
10
End market continues expansion
wwwiciscom
Asia PTA market to remain oversupplied
bull Demand expected to grow 6-7year capacity growth to
accelerate again in 2014
Source Industry
3
12
25
12
20
12
5
145
73 62 65 71 67 68
0
5
10
15
20
25
30
2010 2011 2012 2013 2014E 2015E 2016E
Gro
wth
rate
Asia PTA Supply vs Demand Growth
Supply growth rate Demand growth rate
wwwiciscom
Asia PX capacity growth peaks in 2013-2015
Data source Industry sources
bull Asiarsquos PX demand growth is expected to remain at 5-6 annually
bull Capacity growth forecast at 14-17 annually in 2013-2015 to decline to 5
in 2016 Supply growth acceleration to keep up with downstream capacities
9
2
17 15
14
5 8
5
6 5 5 6
0
2
4
6
8
10
12
14
16
18
20
2011 2012 2013E 2014E 2015E 2016E
Gro
wth
rate
Asia PX Supply vs Demand Growth
Supply growth rate Demand growth rate
wwwiciscom
455
507
592
663
703 736
+12 +8 +7 +6 +6 +5
85
82
76
72 72
73
60
65
70
75
80
85
90
0
20
40
60
80
2010 2011 2012 2013 2014 2015
Operating rates
Unit million tonnesyear
Asia polyester capacity Asia polyester production Utilisation rates
Polyester operating rates to lower
wwwiciscom
Asia PTA plants to run at lower operating rates
Source Industry
bull PTA capacity reached 605m tonnesyear in 2013 up by
12 from 2012 after a 25 growth in 2012
bull Continued expansions will lower operating rates further
91
77 73
66 63
64
55
70
85
100
0
20
40
60
80
100
2010 2011 2012 2013 2014E 2015E
Op
erati
ng
rate
s
Un
it
millio
n t
on
nes
year
Asia and Middle East PTA Capacity Expansion
PTA capacity PTA operating rates
wwwiciscom
96 95 98
89
82 76 76
0
20
40
60
80
100
120
0
5
10
15
20
25
30
35
40
45
50
2010 2011 2012 2013 2014E 2015E 2016E
Op
erati
ng
rate
s
Un
it
millio
n t
on
nes
year
Asia PX Plants Operating Rate
Asia PX capacity Asia PX OR
To balance supplydemand conditions
wwwiciscom
A Fundamentally Short Market To Turn Long
0
5000
10000
15000
20000
25000
0
10000
20000
30000
40000
50000
60000
2013E 2014E 2015E 2016E
Bala
nce
Un
it
00
0 t
on
nes
year
Un
it
00
0 t
on
nes
year
Year
PX Effective Demand amp Supply In Asia
Effective PX supply Effective PX demand Balance
wwwiciscom
Challenges Ahead
China to continue to Be the driving force for Asia In 2013 East Asia and Pacific region marked a growth of 72 Overall growth in the region expected to stay flat at 72 in 2014 China expected to grow at 75 New PX capacities to lighten tight supply burden
Moderation of economic activity from Indonesia Malaysia and Thailand because of weak commodity revenues and policy tightening Credit tightening and banks in China restrict cash-flows Non-integrated facilities to face high costs pressure might be forced to shut
Tailwinds Headwinds
wwwiciscom
The Polyester Chain Expansions
wwwiciscom
PX capacity expansion to accelerate in Asia
Source Industry
wwwiciscom
PTA capacity expansion continues in Asia
Source Industry
wwwiciscom
Source Industry
Polyester capacity expansion continues in Asia
wwwiciscom
China Import PX Stats
0 500000 1000000 1500000 2000000 2500000 3000000
S Korea
Japan
Taiwan
SE Asia
Middle East
Others
India
2012 2013
wwwiciscom
CHINA Imp 2743
KOREA Exp 3941
JAPAN Exp 119
TAIWAN Exp 580
INDIA Imp 852
SE ASIA Imp 350
Exp 1100
MIDDLE EAST Imp560
EU (incl Turkey) Exp 650 Imp 370
Asia PTA 2013 Trade Flow
220kt 188kt
23kt
390kt
81kt
380kt
12kt
7kt 170kt
1800kt
wwwiciscom
0
20
40
60
80
100
0
1000
2000
3000
4000
5000
6000
7000
8000
2013 2014E 2015E 2016E 2017E
South Korea Expected Operating Rates
CAPACITY PRODUCTION DEMAND EXPORT OR
0 200 400 600 800 1000 1200 1400 1600 1800 2000
2013
2014E
2015E
2016E
2017E
South Korea Expected Exports
OTHERS TURKEY INDIA CHINA
Will South Korea Follow Taiwanrsquos Strategy
wwwiciscom
Market Outlook
wwwiciscom
End-users
Asia PX price trend outlook
PX 2014 Contract
bull In China term contracts were fixed mostly at flat to a premium of $3tonne based on a 50 ACP 50 CFR quotes formula
bull Contracts were largely fixed at a premium of $7-9tonne in 2013
bull Since the start of 2014 there have been 3 breaks in the PX ACP
PX Spot Prices
Supply and Demand
wwwiciscom
End-users
PX 2014 Contract
PX Spot Prices
bull NaphthaPX spread to be lowered from highs of $500tonne to estimates of $250-260tonne in 2014
bull MXPX spread to remain below the breakeven point estimated at $150-160tonne in 2014
bull Strong uptrend to be limited
Supply and Demand
Asia PX price trend outlook
wwwiciscom
End-users
PX 2014 Contract
PX Spot Prices
Supply and Demand
bull Market dynamics to shift from fundamentally short to balanced-to-long
bull China to remain key importer with imports per month expected to increased to around 800000-850000 tonnes
bull India to be in an export position following OMPL start-up
Asia PX price trend outlook
wwwiciscom
End-users
Asia PTA price trend outlook
PTA 2014 Term
bull PTA makers continue to push for PX-linked formula contracts to mitigate losses
PTA Spot Prices
Supply and Demand
wwwiciscom
End-users
PTA 2014 Term
PTA Spot Prices
bull Inventories to remain high in China
bull Despite huge influx of PX capacities PTA prices under pressure
bull PX-PTA margins estimated at $80-90tonne
Supply and Demand
Asia PTA price trend outlook
wwwiciscom
End-users
PTA 2014 Term
PTA Spot Prices
Supply and Demand
bull PTA expansion continues market to remain oversupplied
bull China PTA makers to push cargoes out from the country
bull Supply growth to continue to outstrip demand growth
Asia PTA price trend outlook
wwwiciscom
ICIS has the expertise to support you ndash from the latest news and trading prices to long-term forecasts
Pricing information Reliable price assessments and analyses for the polyester chain including price history enabling you to understand price drivers and to settle your contract prices more confidently
Real-time news service Breaking news and analyses across the global polyester chain Be the first to find out about market-moving news including production updates plant capacities output and shutdowns
Supply and demand data Access data on supply and demand imports and exports as well as production capacity for the global markets over a 6-11 year time span Online interface is customisable enabling you to create a view of trade patterns according to your needs
In-depth market analysis Our expert insight delivers the information and data you need to understand short mid- and long-term trends (up until 2025) as well as informed commentary and analysis on the market outlook ndash all of which enables you to plan for the future with confidence
Request your free sample price report today gtgt
Request your free trial today gtgt
Read more about ICIS supply and demand data gtgt
Read more about our in-depth analysis services gtgt

wwwiciscom
When One Suffers A Chain Effect Begins
Crude oil Heavy naphtha Crude gasoline Mixed xylenes Para-xylene
Long-chained producers Medium-chained producers
Short-chained producers
Para-xylene 665 PTA 86 Polyester 34 MEG
Key End Use Markets ndash Consumer Goods
Food amp Beverage Personal Care amp Home Care
Apparel Home Textile Apparel Home Textile Electronics
wwwiciscom
Historical Polyester Prices
1200
1300
1400
1500
1600
1700
18000
1-J
an-1
2
01
-Fe
b-1
2
01
-Mar
-12
01
-Ap
r-1
2
01
-May
-12
01
-Ju
n-1
2
01
-Ju
l-1
2
01
-Au
g-1
2
01
-Se
p-1
2
01
-Oct
-12
01
-No
v-1
2
01
-De
c-1
2
01
-Jan
-13
01
-Fe
b-1
3
01
-Mar
-13
01
-Ap
r-1
3
01
-May
-13
01
-Ju
n-1
3
01
-Ju
l-1
3
01
-Au
g-1
3
01
-Se
p-1
3
01
-Oct
-13
01
-No
v-1
3
01
-De
c-1
3
01
-Jan
-14
01
-Fe
b-1
4
01
-Mar
-14
01
-Ap
r-1
4
USD
$t
on
ne
FOB
CM
P
POY
1000
1100
1200
1300
1400
1500
1600
1700
01
-Jan
-12
01
-Fe
b-1
2
01
-Mar
-12
01
-Ap
r-1
2
01
-May
-12
01
-Ju
n-1
2
01
-Ju
l-1
2
01
-Au
g-1
2
01
-Se
p-1
2
01
-Oct
-12
01
-No
v-1
2
01
-De
c-1
2
01
-Jan
-13
01
-Fe
b-1
3
01
-Mar
-13
01
-Ap
r-1
3
01
-May
-13
01
-Ju
n-1
3
01
-Ju
l-1
3
01
-Au
g-1
3
01
-Se
p-1
3
01
-Oct
-13
01
-No
v-1
3
01
-De
c-1
3
01
-Jan
-14
01
-Fe
b-1
4
01
-Mar
-14
01
-Ap
r-1
4
USD
$t
on
ne
FOB
CM
P
PET
wwwiciscom
Asia PX amp PTA Spot Prices in H2 2013 - Present
1410 1440
1470 1415
750
850
950
1050
1150
1250
1350
1450
1550
Jul13 Aug13 Sep13 Oct13 Nov13 Dec13 Jan14 Feb14 Mar14 Apr14
PX
amp P
TA S
po
t P
rice
s ($
to
nn
e C
FR C
MP
)
Period In Months
Asia PX amp PTA Market Overview
PX Prices PTA ACP
wwwiciscom
Where The Problem Lies In The Polyester Chain
0
50
100
150
200
250
300
PET Margins
PET Margins BREAKEVEN
050
100150200250300350400450
POY Margins
POY Margins BREAKEVEN
BREAKEVEN
BREAKEVEN
wwwiciscom
PTA Margins
0
20
40
60
80
100
120
0
200
400
600
800
1000
1200
1400
1600
Jul13 Aug13 Sep13 Oct13 Nov13 Dec13 Jan14 Feb14 Mar14 Apr14
$t
on
ne
(CFR
CM
P)
PTA-PX Spread
MARGINS PX PTA
bull Margins for PTA rebounded from lows of last year bull Margins insufficient to cover variable costs
wwwiciscom
PX
Ma
rgin
s
0
200
400
600
800
Jul13 Aug13 Sep13 Oct13 Nov13 Dec13 Jan14 Feb14 Mar14 Apr14
$t
on
ne
Naphtha-PX Spread
MARGINS Break Even
0
50
100
150
200
250
Jul13 Aug13 Sep13 Oct13 Nov13 Dec13 Jan14 Feb14 Mar14 Apr14
$t
on
ne
MX-PX Spread
MARGINS BREAKEVEN
BREAKEVEN
BREAKEVEN
0
50
100
150
200
250
300
Jul13 Aug13 Sep13 Oct13 Nov13 Dec13 Jan14 Feb14 Mar14 Apr14
$t
on
ne
TDP Margins Based On TolBZPX
TDP Margins BREAKEVEN
BREAKEVEN
wwwiciscom
Weak Polyester Demand PTA Cutbacks
80
72 68
55
68
63
0
10
20
30
40
50
60
70
80
90
0
500
1000
1500
2000
2500
3000
3500
Jan14 Feb14 Mar14 Apr14 EMay14 EJun14
Tho
usa
nd
to
nn
esm
on
th
Chinas PTA Operating Rates 2014
CA
PAC
ITY
CA
PAC
ITY
CA
PAC
ITY
CA
PAC
ITY
CA
PAC
ITY
CA
PAC
ITY
UTI
LIZA
TIO
N
UTI
LIZA
TIO
N
UTI
LIZA
TIO
N
UTI
LIZA
TIO
N
UTI
LIZA
TIO
N
UTI
LIZA
TIO
N
wwwiciscom
PX Makers Attempt To Balance Market
South Korearsquos makers have largely maintained high operating rates as downstream PTA makers were running at around 95 Several makers continue to operate TDP at full while cutting operating rates at PX site selling feedstock MX or pushing it for blending
0
200
400
600
800
1000
1200
1400
1600
1800
2000
60
65
70
75
80
85
90
95
100
105
Jan Feb Mar Apr
PX Operating Rates
China South Korea Japan China South Korea Japan
wwwiciscom
Why The Squeezed Margins In Q1 2014
76
82
74
80
72 68
0
10
20
30
40
50
60
70
80
90
0
200000
400000
600000
800000
1000000
1200000
1400000
1600000
January February March
Import PX Requirement Local Build Up PX OR PTA OR
bull Build up in stocks in China bull Weak downstream performance
wwwiciscom
Various Strategies By Companies
bull PX producers cut operating ratesshut plants sells feedstock purchase spot PX
bull Japanrsquos Teijin decides to dissolve PX business bull PTA Producers keeps term contract at average of 60-80 coverage
bull PTA Producers selling feedstock PX to maintain healthy inventories
bull PTA Producers operating higher rates to ldquoforcerdquo shut smaller companies
bull Polyester producers to maintain healthy PTAMEG inventories avoid build ups
wwwiciscom
Asian PTA producers in weaker pricing position a buyersrsquo
market
bull lt 10 of total import volume to link with PX price China
bull No polyester makers accepted PX-link contracts India
bull Cost portion mostly at 50-70 Middle East
bull Cost portion mostly at 50-70 Turkey
bull PTA producers push for PX-linked contract formula to enlarge spread
wwwiciscom
Looming Problems amp Results
wwwiciscom
Proportions In The Downstream Markets
PFY 67
PSF 15
PET 18
Chinas Polyester Production
PFY 50
PSF 21
PET 29
Indias Polyester Production
wwwiciscom
Why Are All Eyes On China
China 63
NE Asia 14
India 10
SE Asia 9
Middle East 19
Asia Polyester Market Shares by Region
-4
0
4
8
12
16
2011 2012 2013E 2014E 2015E 2016E
Polyester Growth Forecast by Regions
China India NE Asia SE Asia Middle East
wwwiciscom
0
2
4
6
8
10
12
0
10000
20000
30000
40000
50000
60000
2011 2012 2013 2014E 2015E 2016E
Asia Polyester Growth
China S Korea Taiwan
Japan India Thailand
Middle East Indonesia Others
Indias Polyester Growth Rate Chinas Polyester Growth Rate
Is downstream markets growth that strong
wwwiciscom
275 313
363 413
453 483
0
20
40
60
2010 2011 2012 2013 2014E 2015E
Unit million
tonnesyear
Chinas Polyester Capacity Expansion
16 11
16
51 56
62
78 86 89
0
3
6
9
2010 2011 2012 2013 2014E 2015E
Unit million
tonnesyear
Indias Polyester Capacity Expansion
19 15
10
End market continues expansion
wwwiciscom
Asia PTA market to remain oversupplied
bull Demand expected to grow 6-7year capacity growth to
accelerate again in 2014
Source Industry
3
12
25
12
20
12
5
145
73 62 65 71 67 68
0
5
10
15
20
25
30
2010 2011 2012 2013 2014E 2015E 2016E
Gro
wth
rate
Asia PTA Supply vs Demand Growth
Supply growth rate Demand growth rate
wwwiciscom
Asia PX capacity growth peaks in 2013-2015
Data source Industry sources
bull Asiarsquos PX demand growth is expected to remain at 5-6 annually
bull Capacity growth forecast at 14-17 annually in 2013-2015 to decline to 5
in 2016 Supply growth acceleration to keep up with downstream capacities
9
2
17 15
14
5 8
5
6 5 5 6
0
2
4
6
8
10
12
14
16
18
20
2011 2012 2013E 2014E 2015E 2016E
Gro
wth
rate
Asia PX Supply vs Demand Growth
Supply growth rate Demand growth rate
wwwiciscom
455
507
592
663
703 736
+12 +8 +7 +6 +6 +5
85
82
76
72 72
73
60
65
70
75
80
85
90
0
20
40
60
80
2010 2011 2012 2013 2014 2015
Operating rates
Unit million tonnesyear
Asia polyester capacity Asia polyester production Utilisation rates
Polyester operating rates to lower
wwwiciscom
Asia PTA plants to run at lower operating rates
Source Industry
bull PTA capacity reached 605m tonnesyear in 2013 up by
12 from 2012 after a 25 growth in 2012
bull Continued expansions will lower operating rates further
91
77 73
66 63
64
55
70
85
100
0
20
40
60
80
100
2010 2011 2012 2013 2014E 2015E
Op
erati
ng
rate
s
Un
it
millio
n t
on
nes
year
Asia and Middle East PTA Capacity Expansion
PTA capacity PTA operating rates
wwwiciscom
96 95 98
89
82 76 76
0
20
40
60
80
100
120
0
5
10
15
20
25
30
35
40
45
50
2010 2011 2012 2013 2014E 2015E 2016E
Op
erati
ng
rate
s
Un
it
millio
n t
on
nes
year
Asia PX Plants Operating Rate
Asia PX capacity Asia PX OR
To balance supplydemand conditions
wwwiciscom
A Fundamentally Short Market To Turn Long
0
5000
10000
15000
20000
25000
0
10000
20000
30000
40000
50000
60000
2013E 2014E 2015E 2016E
Bala
nce
Un
it
00
0 t
on
nes
year
Un
it
00
0 t
on
nes
year
Year
PX Effective Demand amp Supply In Asia
Effective PX supply Effective PX demand Balance
wwwiciscom
Challenges Ahead
China to continue to Be the driving force for Asia In 2013 East Asia and Pacific region marked a growth of 72 Overall growth in the region expected to stay flat at 72 in 2014 China expected to grow at 75 New PX capacities to lighten tight supply burden
Moderation of economic activity from Indonesia Malaysia and Thailand because of weak commodity revenues and policy tightening Credit tightening and banks in China restrict cash-flows Non-integrated facilities to face high costs pressure might be forced to shut
Tailwinds Headwinds
wwwiciscom
The Polyester Chain Expansions
wwwiciscom
PX capacity expansion to accelerate in Asia
Source Industry
wwwiciscom
PTA capacity expansion continues in Asia
Source Industry
wwwiciscom
Source Industry
Polyester capacity expansion continues in Asia
wwwiciscom
China Import PX Stats
0 500000 1000000 1500000 2000000 2500000 3000000
S Korea
Japan
Taiwan
SE Asia
Middle East
Others
India
2012 2013
wwwiciscom
CHINA Imp 2743
KOREA Exp 3941
JAPAN Exp 119
TAIWAN Exp 580
INDIA Imp 852
SE ASIA Imp 350
Exp 1100
MIDDLE EAST Imp560
EU (incl Turkey) Exp 650 Imp 370
Asia PTA 2013 Trade Flow
220kt 188kt
23kt
390kt
81kt
380kt
12kt
7kt 170kt
1800kt
wwwiciscom
0
20
40
60
80
100
0
1000
2000
3000
4000
5000
6000
7000
8000
2013 2014E 2015E 2016E 2017E
South Korea Expected Operating Rates
CAPACITY PRODUCTION DEMAND EXPORT OR
0 200 400 600 800 1000 1200 1400 1600 1800 2000
2013
2014E
2015E
2016E
2017E
South Korea Expected Exports
OTHERS TURKEY INDIA CHINA
Will South Korea Follow Taiwanrsquos Strategy
wwwiciscom
Market Outlook
wwwiciscom
End-users
Asia PX price trend outlook
PX 2014 Contract
bull In China term contracts were fixed mostly at flat to a premium of $3tonne based on a 50 ACP 50 CFR quotes formula
bull Contracts were largely fixed at a premium of $7-9tonne in 2013
bull Since the start of 2014 there have been 3 breaks in the PX ACP
PX Spot Prices
Supply and Demand
wwwiciscom
End-users
PX 2014 Contract
PX Spot Prices
bull NaphthaPX spread to be lowered from highs of $500tonne to estimates of $250-260tonne in 2014
bull MXPX spread to remain below the breakeven point estimated at $150-160tonne in 2014
bull Strong uptrend to be limited
Supply and Demand
Asia PX price trend outlook
wwwiciscom
End-users
PX 2014 Contract
PX Spot Prices
Supply and Demand
bull Market dynamics to shift from fundamentally short to balanced-to-long
bull China to remain key importer with imports per month expected to increased to around 800000-850000 tonnes
bull India to be in an export position following OMPL start-up
Asia PX price trend outlook
wwwiciscom
End-users
Asia PTA price trend outlook
PTA 2014 Term
bull PTA makers continue to push for PX-linked formula contracts to mitigate losses
PTA Spot Prices
Supply and Demand
wwwiciscom
End-users
PTA 2014 Term
PTA Spot Prices
bull Inventories to remain high in China
bull Despite huge influx of PX capacities PTA prices under pressure
bull PX-PTA margins estimated at $80-90tonne
Supply and Demand
Asia PTA price trend outlook
wwwiciscom
End-users
PTA 2014 Term
PTA Spot Prices
Supply and Demand
bull PTA expansion continues market to remain oversupplied
bull China PTA makers to push cargoes out from the country
bull Supply growth to continue to outstrip demand growth
Asia PTA price trend outlook
wwwiciscom
ICIS has the expertise to support you ndash from the latest news and trading prices to long-term forecasts
Pricing information Reliable price assessments and analyses for the polyester chain including price history enabling you to understand price drivers and to settle your contract prices more confidently
Real-time news service Breaking news and analyses across the global polyester chain Be the first to find out about market-moving news including production updates plant capacities output and shutdowns
Supply and demand data Access data on supply and demand imports and exports as well as production capacity for the global markets over a 6-11 year time span Online interface is customisable enabling you to create a view of trade patterns according to your needs
In-depth market analysis Our expert insight delivers the information and data you need to understand short mid- and long-term trends (up until 2025) as well as informed commentary and analysis on the market outlook ndash all of which enables you to plan for the future with confidence
Request your free sample price report today gtgt
Request your free trial today gtgt
Read more about ICIS supply and demand data gtgt
Read more about our in-depth analysis services gtgt
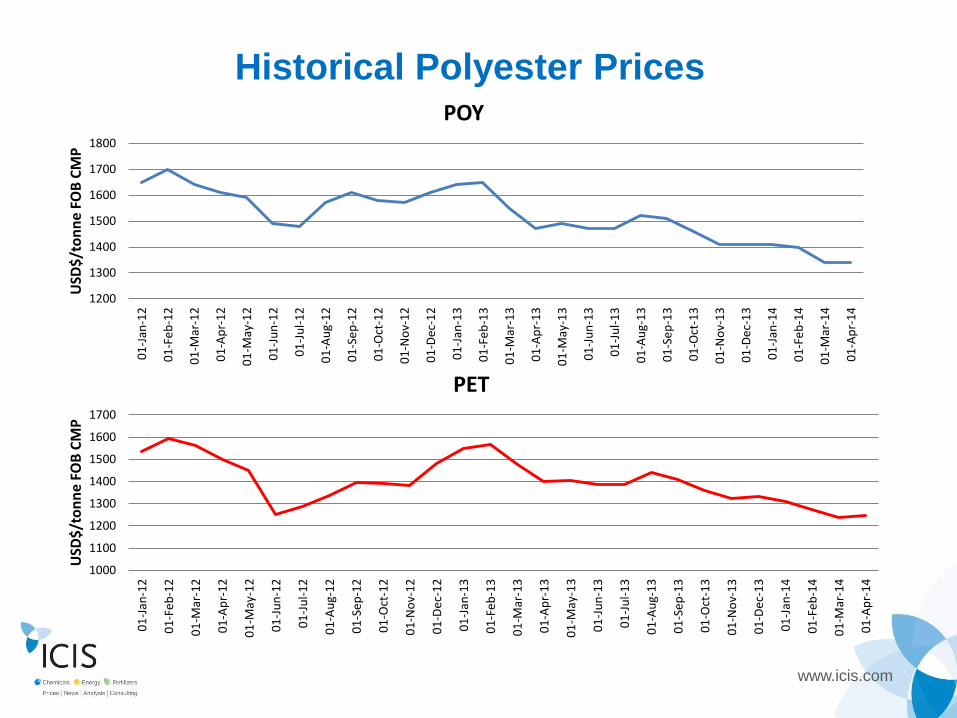
wwwiciscom
PX
Ma
rgin
s
0
200
400
600
800
Jul13 Aug13 Sep13 Oct13 Nov13 Dec13 Jan14 Feb14 Mar14 Apr14
$t
on
ne
Naphtha-PX Spread
MARGINS Break Even
0
50
100
150
200
250
Jul13 Aug13 Sep13 Oct13 Nov13 Dec13 Jan14 Feb14 Mar14 Apr14
$t
on
ne
MX-PX Spread
MARGINS BREAKEVEN
BREAKEVEN
BREAKEVEN
0
50
100
150
200
250
300
Jul13 Aug13 Sep13 Oct13 Nov13 Dec13 Jan14 Feb14 Mar14 Apr14
$t
on
ne
TDP Margins Based On TolBZPX
TDP Margins BREAKEVEN
BREAKEVEN
wwwiciscom
Weak Polyester Demand PTA Cutbacks
80
72 68
55
68
63
0
10
20
30
40
50
60
70
80
90
0
500
1000
1500
2000
2500
3000
3500
Jan14 Feb14 Mar14 Apr14 EMay14 EJun14
Tho
usa
nd
to
nn
esm
on
th
Chinas PTA Operating Rates 2014
CA
PAC
ITY
CA
PAC
ITY
CA
PAC
ITY
CA
PAC
ITY
CA
PAC
ITY
CA
PAC
ITY
UTI
LIZA
TIO
N
UTI
LIZA
TIO
N
UTI
LIZA
TIO
N
UTI
LIZA
TIO
N
UTI
LIZA
TIO
N
UTI
LIZA
TIO
N
wwwiciscom
PX Makers Attempt To Balance Market
South Korearsquos makers have largely maintained high operating rates as downstream PTA makers were running at around 95 Several makers continue to operate TDP at full while cutting operating rates at PX site selling feedstock MX or pushing it for blending
0
200
400
600
800
1000
1200
1400
1600
1800
2000
60
65
70
75
80
85
90
95
100
105
Jan Feb Mar Apr
PX Operating Rates
China South Korea Japan China South Korea Japan
wwwiciscom
Why The Squeezed Margins In Q1 2014
76
82
74
80
72 68
0
10
20
30
40
50
60
70
80
90
0
200000
400000
600000
800000
1000000
1200000
1400000
1600000
January February March
Import PX Requirement Local Build Up PX OR PTA OR
bull Build up in stocks in China bull Weak downstream performance
wwwiciscom
Various Strategies By Companies
bull PX producers cut operating ratesshut plants sells feedstock purchase spot PX
bull Japanrsquos Teijin decides to dissolve PX business bull PTA Producers keeps term contract at average of 60-80 coverage
bull PTA Producers selling feedstock PX to maintain healthy inventories
bull PTA Producers operating higher rates to ldquoforcerdquo shut smaller companies
bull Polyester producers to maintain healthy PTAMEG inventories avoid build ups
wwwiciscom
Asian PTA producers in weaker pricing position a buyersrsquo
market
bull lt 10 of total import volume to link with PX price China
bull No polyester makers accepted PX-link contracts India
bull Cost portion mostly at 50-70 Middle East
bull Cost portion mostly at 50-70 Turkey
bull PTA producers push for PX-linked contract formula to enlarge spread
wwwiciscom
Looming Problems amp Results
wwwiciscom
Proportions In The Downstream Markets
PFY 67
PSF 15
PET 18
Chinas Polyester Production
PFY 50
PSF 21
PET 29
Indias Polyester Production
wwwiciscom
Why Are All Eyes On China
China 63
NE Asia 14
India 10
SE Asia 9
Middle East 19
Asia Polyester Market Shares by Region
-4
0
4
8
12
16
2011 2012 2013E 2014E 2015E 2016E
Polyester Growth Forecast by Regions
China India NE Asia SE Asia Middle East
wwwiciscom
0
2
4
6
8
10
12
0
10000
20000
30000
40000
50000
60000
2011 2012 2013 2014E 2015E 2016E
Asia Polyester Growth
China S Korea Taiwan
Japan India Thailand
Middle East Indonesia Others
Indias Polyester Growth Rate Chinas Polyester Growth Rate
Is downstream markets growth that strong
wwwiciscom
275 313
363 413
453 483
0
20
40
60
2010 2011 2012 2013 2014E 2015E
Unit million
tonnesyear
Chinas Polyester Capacity Expansion
16 11
16
51 56
62
78 86 89
0
3
6
9
2010 2011 2012 2013 2014E 2015E
Unit million
tonnesyear
Indias Polyester Capacity Expansion
19 15
10
End market continues expansion
wwwiciscom
Asia PTA market to remain oversupplied
bull Demand expected to grow 6-7year capacity growth to
accelerate again in 2014
Source Industry
3
12
25
12
20
12
5
145
73 62 65 71 67 68
0
5
10
15
20
25
30
2010 2011 2012 2013 2014E 2015E 2016E
Gro
wth
rate
Asia PTA Supply vs Demand Growth
Supply growth rate Demand growth rate
wwwiciscom
Asia PX capacity growth peaks in 2013-2015
Data source Industry sources
bull Asiarsquos PX demand growth is expected to remain at 5-6 annually
bull Capacity growth forecast at 14-17 annually in 2013-2015 to decline to 5
in 2016 Supply growth acceleration to keep up with downstream capacities
9
2
17 15
14
5 8
5
6 5 5 6
0
2
4
6
8
10
12
14
16
18
20
2011 2012 2013E 2014E 2015E 2016E
Gro
wth
rate
Asia PX Supply vs Demand Growth
Supply growth rate Demand growth rate
wwwiciscom
455
507
592
663
703 736
+12 +8 +7 +6 +6 +5
85
82
76
72 72
73
60
65
70
75
80
85
90
0
20
40
60
80
2010 2011 2012 2013 2014 2015
Operating rates
Unit million tonnesyear
Asia polyester capacity Asia polyester production Utilisation rates
Polyester operating rates to lower
wwwiciscom
Asia PTA plants to run at lower operating rates
Source Industry
bull PTA capacity reached 605m tonnesyear in 2013 up by
12 from 2012 after a 25 growth in 2012
bull Continued expansions will lower operating rates further
91
77 73
66 63
64
55
70
85
100
0
20
40
60
80
100
2010 2011 2012 2013 2014E 2015E
Op
erati
ng
rate
s
Un
it
millio
n t
on
nes
year
Asia and Middle East PTA Capacity Expansion
PTA capacity PTA operating rates
wwwiciscom
96 95 98
89
82 76 76
0
20
40
60
80
100
120
0
5
10
15
20
25
30
35
40
45
50
2010 2011 2012 2013 2014E 2015E 2016E
Op
erati
ng
rate
s
Un
it
millio
n t
on
nes
year
Asia PX Plants Operating Rate
Asia PX capacity Asia PX OR
To balance supplydemand conditions
wwwiciscom
A Fundamentally Short Market To Turn Long
0
5000
10000
15000
20000
25000
0
10000
20000
30000
40000
50000
60000
2013E 2014E 2015E 2016E
Bala
nce
Un
it
00
0 t
on
nes
year
Un
it
00
0 t
on
nes
year
Year
PX Effective Demand amp Supply In Asia
Effective PX supply Effective PX demand Balance
wwwiciscom
Challenges Ahead
China to continue to Be the driving force for Asia In 2013 East Asia and Pacific region marked a growth of 72 Overall growth in the region expected to stay flat at 72 in 2014 China expected to grow at 75 New PX capacities to lighten tight supply burden
Moderation of economic activity from Indonesia Malaysia and Thailand because of weak commodity revenues and policy tightening Credit tightening and banks in China restrict cash-flows Non-integrated facilities to face high costs pressure might be forced to shut
Tailwinds Headwinds
wwwiciscom
The Polyester Chain Expansions
wwwiciscom
PX capacity expansion to accelerate in Asia
Source Industry
wwwiciscom
PTA capacity expansion continues in Asia
Source Industry
wwwiciscom
Source Industry
Polyester capacity expansion continues in Asia
wwwiciscom
China Import PX Stats
0 500000 1000000 1500000 2000000 2500000 3000000
S Korea
Japan
Taiwan
SE Asia
Middle East
Others
India
2012 2013
wwwiciscom
CHINA Imp 2743
KOREA Exp 3941
JAPAN Exp 119
TAIWAN Exp 580
INDIA Imp 852
SE ASIA Imp 350
Exp 1100
MIDDLE EAST Imp560
EU (incl Turkey) Exp 650 Imp 370
Asia PTA 2013 Trade Flow
220kt 188kt
23kt
390kt
81kt
380kt
12kt
7kt 170kt
1800kt
wwwiciscom
0
20
40
60
80
100
0
1000
2000
3000
4000
5000
6000
7000
8000
2013 2014E 2015E 2016E 2017E
South Korea Expected Operating Rates
CAPACITY PRODUCTION DEMAND EXPORT OR
0 200 400 600 800 1000 1200 1400 1600 1800 2000
2013
2014E
2015E
2016E
2017E
South Korea Expected Exports
OTHERS TURKEY INDIA CHINA
Will South Korea Follow Taiwanrsquos Strategy
wwwiciscom
Market Outlook
wwwiciscom
End-users
Asia PX price trend outlook
PX 2014 Contract
bull In China term contracts were fixed mostly at flat to a premium of $3tonne based on a 50 ACP 50 CFR quotes formula
bull Contracts were largely fixed at a premium of $7-9tonne in 2013
bull Since the start of 2014 there have been 3 breaks in the PX ACP
PX Spot Prices
Supply and Demand
wwwiciscom
End-users
PX 2014 Contract
PX Spot Prices
bull NaphthaPX spread to be lowered from highs of $500tonne to estimates of $250-260tonne in 2014
bull MXPX spread to remain below the breakeven point estimated at $150-160tonne in 2014
bull Strong uptrend to be limited
Supply and Demand
Asia PX price trend outlook
wwwiciscom
End-users
PX 2014 Contract
PX Spot Prices
Supply and Demand
bull Market dynamics to shift from fundamentally short to balanced-to-long
bull China to remain key importer with imports per month expected to increased to around 800000-850000 tonnes
bull India to be in an export position following OMPL start-up
Asia PX price trend outlook
wwwiciscom
End-users
Asia PTA price trend outlook
PTA 2014 Term
bull PTA makers continue to push for PX-linked formula contracts to mitigate losses
PTA Spot Prices
Supply and Demand
wwwiciscom
End-users
PTA 2014 Term
PTA Spot Prices
bull Inventories to remain high in China
bull Despite huge influx of PX capacities PTA prices under pressure
bull PX-PTA margins estimated at $80-90tonne
Supply and Demand
Asia PTA price trend outlook
wwwiciscom
End-users
PTA 2014 Term
PTA Spot Prices
Supply and Demand
bull PTA expansion continues market to remain oversupplied
bull China PTA makers to push cargoes out from the country
bull Supply growth to continue to outstrip demand growth
Asia PTA price trend outlook
wwwiciscom
ICIS has the expertise to support you ndash from the latest news and trading prices to long-term forecasts
Pricing information Reliable price assessments and analyses for the polyester chain including price history enabling you to understand price drivers and to settle your contract prices more confidently
Real-time news service Breaking news and analyses across the global polyester chain Be the first to find out about market-moving news including production updates plant capacities output and shutdowns
Supply and demand data Access data on supply and demand imports and exports as well as production capacity for the global markets over a 6-11 year time span Online interface is customisable enabling you to create a view of trade patterns according to your needs
In-depth market analysis Our expert insight delivers the information and data you need to understand short mid- and long-term trends (up until 2025) as well as informed commentary and analysis on the market outlook ndash all of which enables you to plan for the future with confidence
Request your free sample price report today gtgt
Request your free trial today gtgt
Read more about ICIS supply and demand data gtgt
Read more about our in-depth analysis services gtgt
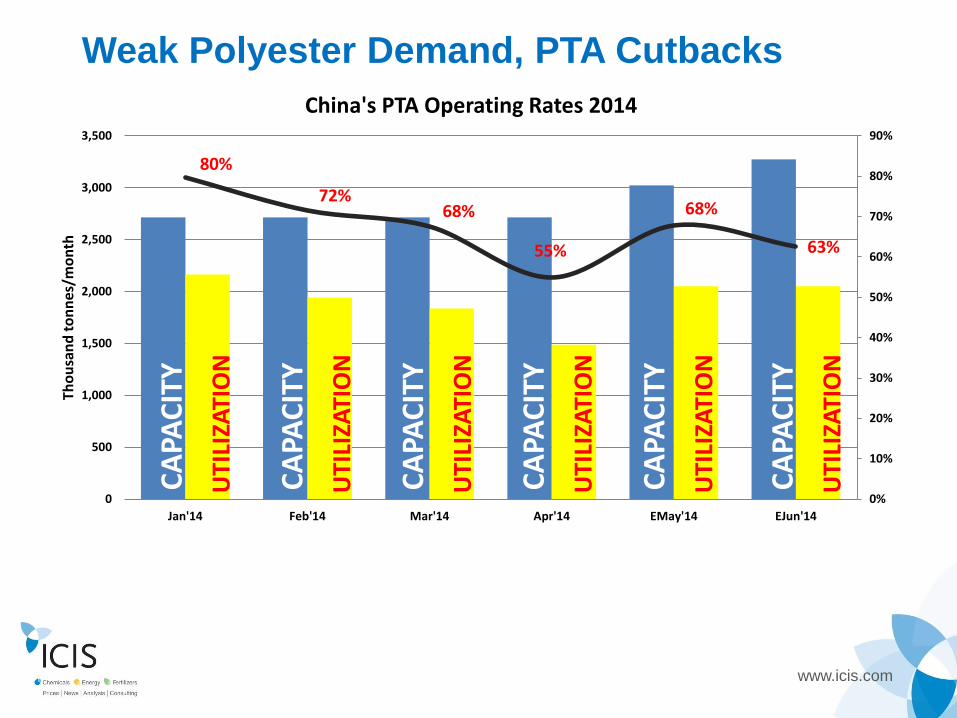
wwwiciscom
Various Strategies By Companies
bull PX producers cut operating ratesshut plants sells feedstock purchase spot PX
bull Japanrsquos Teijin decides to dissolve PX business bull PTA Producers keeps term contract at average of 60-80 coverage
bull PTA Producers selling feedstock PX to maintain healthy inventories
bull PTA Producers operating higher rates to ldquoforcerdquo shut smaller companies
bull Polyester producers to maintain healthy PTAMEG inventories avoid build ups
wwwiciscom
Asian PTA producers in weaker pricing position a buyersrsquo
market
bull lt 10 of total import volume to link with PX price China
bull No polyester makers accepted PX-link contracts India
bull Cost portion mostly at 50-70 Middle East
bull Cost portion mostly at 50-70 Turkey
bull PTA producers push for PX-linked contract formula to enlarge spread
wwwiciscom
Looming Problems amp Results
wwwiciscom
Proportions In The Downstream Markets
PFY 67
PSF 15
PET 18
Chinas Polyester Production
PFY 50
PSF 21
PET 29
Indias Polyester Production
wwwiciscom
Why Are All Eyes On China
China 63
NE Asia 14
India 10
SE Asia 9
Middle East 19
Asia Polyester Market Shares by Region
-4
0
4
8
12
16
2011 2012 2013E 2014E 2015E 2016E
Polyester Growth Forecast by Regions
China India NE Asia SE Asia Middle East
wwwiciscom
0
2
4
6
8
10
12
0
10000
20000
30000
40000
50000
60000
2011 2012 2013 2014E 2015E 2016E
Asia Polyester Growth
China S Korea Taiwan
Japan India Thailand
Middle East Indonesia Others
Indias Polyester Growth Rate Chinas Polyester Growth Rate
Is downstream markets growth that strong
wwwiciscom
275 313
363 413
453 483
0
20
40
60
2010 2011 2012 2013 2014E 2015E
Unit million
tonnesyear
Chinas Polyester Capacity Expansion
16 11
16
51 56
62
78 86 89
0
3
6
9
2010 2011 2012 2013 2014E 2015E
Unit million
tonnesyear
Indias Polyester Capacity Expansion
19 15
10
End market continues expansion
wwwiciscom
Asia PTA market to remain oversupplied
bull Demand expected to grow 6-7year capacity growth to
accelerate again in 2014
Source Industry
3
12
25
12
20
12
5
145
73 62 65 71 67 68
0
5
10
15
20
25
30
2010 2011 2012 2013 2014E 2015E 2016E
Gro
wth
rate
Asia PTA Supply vs Demand Growth
Supply growth rate Demand growth rate
wwwiciscom
Asia PX capacity growth peaks in 2013-2015
Data source Industry sources
bull Asiarsquos PX demand growth is expected to remain at 5-6 annually
bull Capacity growth forecast at 14-17 annually in 2013-2015 to decline to 5
in 2016 Supply growth acceleration to keep up with downstream capacities
9
2
17 15
14
5 8
5
6 5 5 6
0
2
4
6
8
10
12
14
16
18
20
2011 2012 2013E 2014E 2015E 2016E
Gro
wth
rate
Asia PX Supply vs Demand Growth
Supply growth rate Demand growth rate
wwwiciscom
455
507
592
663
703 736
+12 +8 +7 +6 +6 +5
85
82
76
72 72
73
60
65
70
75
80
85
90
0
20
40
60
80
2010 2011 2012 2013 2014 2015
Operating rates
Unit million tonnesyear
Asia polyester capacity Asia polyester production Utilisation rates
Polyester operating rates to lower
wwwiciscom
Asia PTA plants to run at lower operating rates
Source Industry
bull PTA capacity reached 605m tonnesyear in 2013 up by
12 from 2012 after a 25 growth in 2012
bull Continued expansions will lower operating rates further
91
77 73
66 63
64
55
70
85
100
0
20
40
60
80
100
2010 2011 2012 2013 2014E 2015E
Op
erati
ng
rate
s
Un
it
millio
n t
on
nes
year
Asia and Middle East PTA Capacity Expansion
PTA capacity PTA operating rates
wwwiciscom
96 95 98
89
82 76 76
0
20
40
60
80
100
120
0
5
10
15
20
25
30
35
40
45
50
2010 2011 2012 2013 2014E 2015E 2016E
Op
erati
ng
rate
s
Un
it
millio
n t
on
nes
year
Asia PX Plants Operating Rate
Asia PX capacity Asia PX OR
To balance supplydemand conditions
wwwiciscom
A Fundamentally Short Market To Turn Long
0
5000
10000
15000
20000
25000
0
10000
20000
30000
40000
50000
60000
2013E 2014E 2015E 2016E
Bala
nce
Un
it
00
0 t
on
nes
year
Un
it
00
0 t
on
nes
year
Year
PX Effective Demand amp Supply In Asia
Effective PX supply Effective PX demand Balance
wwwiciscom
Challenges Ahead
China to continue to Be the driving force for Asia In 2013 East Asia and Pacific region marked a growth of 72 Overall growth in the region expected to stay flat at 72 in 2014 China expected to grow at 75 New PX capacities to lighten tight supply burden
Moderation of economic activity from Indonesia Malaysia and Thailand because of weak commodity revenues and policy tightening Credit tightening and banks in China restrict cash-flows Non-integrated facilities to face high costs pressure might be forced to shut
Tailwinds Headwinds
wwwiciscom
The Polyester Chain Expansions
wwwiciscom
PX capacity expansion to accelerate in Asia
Source Industry
wwwiciscom
PTA capacity expansion continues in Asia
Source Industry
wwwiciscom
Source Industry
Polyester capacity expansion continues in Asia
wwwiciscom
China Import PX Stats
0 500000 1000000 1500000 2000000 2500000 3000000
S Korea
Japan
Taiwan
SE Asia
Middle East
Others
India
2012 2013
wwwiciscom
CHINA Imp 2743
KOREA Exp 3941
JAPAN Exp 119
TAIWAN Exp 580
INDIA Imp 852
SE ASIA Imp 350
Exp 1100
MIDDLE EAST Imp560
EU (incl Turkey) Exp 650 Imp 370
Asia PTA 2013 Trade Flow
220kt 188kt
23kt
390kt
81kt
380kt
12kt
7kt 170kt
1800kt
wwwiciscom
0
20
40
60
80
100
0
1000
2000
3000
4000
5000
6000
7000
8000
2013 2014E 2015E 2016E 2017E
South Korea Expected Operating Rates
CAPACITY PRODUCTION DEMAND EXPORT OR
0 200 400 600 800 1000 1200 1400 1600 1800 2000
2013
2014E
2015E
2016E
2017E
South Korea Expected Exports
OTHERS TURKEY INDIA CHINA
Will South Korea Follow Taiwanrsquos Strategy
wwwiciscom
Market Outlook
wwwiciscom
End-users
Asia PX price trend outlook
PX 2014 Contract
bull In China term contracts were fixed mostly at flat to a premium of $3tonne based on a 50 ACP 50 CFR quotes formula
bull Contracts were largely fixed at a premium of $7-9tonne in 2013
bull Since the start of 2014 there have been 3 breaks in the PX ACP
PX Spot Prices
Supply and Demand
wwwiciscom
End-users
PX 2014 Contract
PX Spot Prices
bull NaphthaPX spread to be lowered from highs of $500tonne to estimates of $250-260tonne in 2014
bull MXPX spread to remain below the breakeven point estimated at $150-160tonne in 2014
bull Strong uptrend to be limited
Supply and Demand
Asia PX price trend outlook
wwwiciscom
End-users
PX 2014 Contract
PX Spot Prices
Supply and Demand
bull Market dynamics to shift from fundamentally short to balanced-to-long
bull China to remain key importer with imports per month expected to increased to around 800000-850000 tonnes
bull India to be in an export position following OMPL start-up
Asia PX price trend outlook
wwwiciscom
End-users
Asia PTA price trend outlook
PTA 2014 Term
bull PTA makers continue to push for PX-linked formula contracts to mitigate losses
PTA Spot Prices
Supply and Demand
wwwiciscom
End-users
PTA 2014 Term
PTA Spot Prices
bull Inventories to remain high in China
bull Despite huge influx of PX capacities PTA prices under pressure
bull PX-PTA margins estimated at $80-90tonne
Supply and Demand
Asia PTA price trend outlook
wwwiciscom
End-users
PTA 2014 Term
PTA Spot Prices
Supply and Demand
bull PTA expansion continues market to remain oversupplied
bull China PTA makers to push cargoes out from the country
bull Supply growth to continue to outstrip demand growth
Asia PTA price trend outlook
wwwiciscom
ICIS has the expertise to support you ndash from the latest news and trading prices to long-term forecasts
Pricing information Reliable price assessments and analyses for the polyester chain including price history enabling you to understand price drivers and to settle your contract prices more confidently
Real-time news service Breaking news and analyses across the global polyester chain Be the first to find out about market-moving news including production updates plant capacities output and shutdowns
Supply and demand data Access data on supply and demand imports and exports as well as production capacity for the global markets over a 6-11 year time span Online interface is customisable enabling you to create a view of trade patterns according to your needs
In-depth market analysis Our expert insight delivers the information and data you need to understand short mid- and long-term trends (up until 2025) as well as informed commentary and analysis on the market outlook ndash all of which enables you to plan for the future with confidence
Request your free sample price report today gtgt
Request your free trial today gtgt
Read more about ICIS supply and demand data gtgt
Read more about our in-depth analysis services gtgt
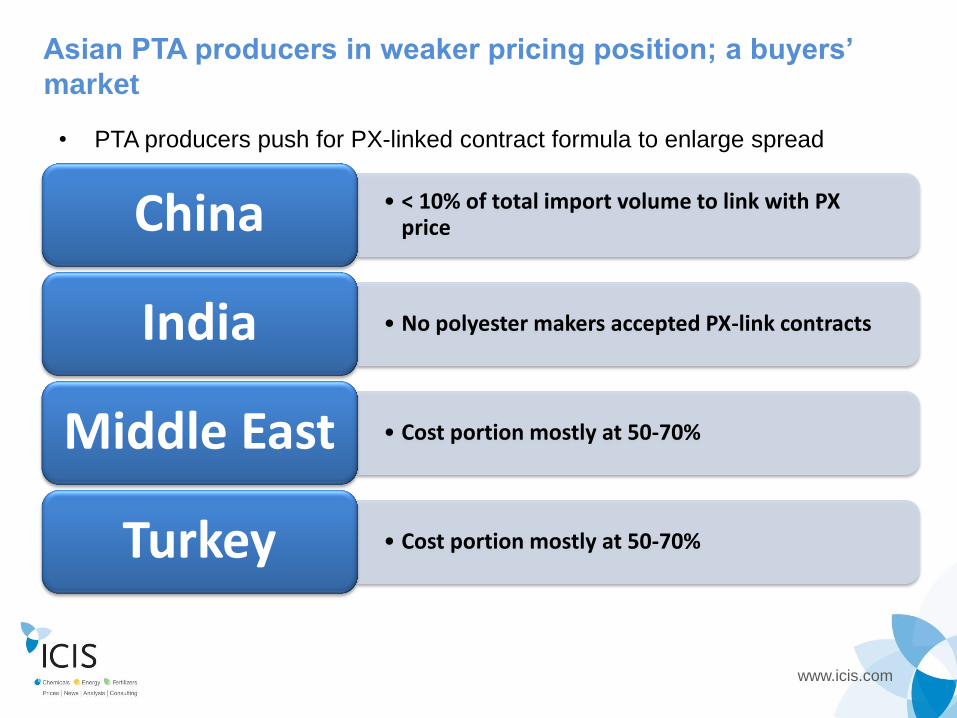
wwwiciscom
0
2
4
6
8
10
12
0
10000
20000
30000
40000
50000
60000
2011 2012 2013 2014E 2015E 2016E
Asia Polyester Growth
China S Korea Taiwan
Japan India Thailand
Middle East Indonesia Others
Indias Polyester Growth Rate Chinas Polyester Growth Rate
Is downstream markets growth that strong
wwwiciscom
275 313
363 413
453 483
0
20
40
60
2010 2011 2012 2013 2014E 2015E
Unit million
tonnesyear
Chinas Polyester Capacity Expansion
16 11
16
51 56
62
78 86 89
0
3
6
9
2010 2011 2012 2013 2014E 2015E
Unit million
tonnesyear
Indias Polyester Capacity Expansion
19 15
10
End market continues expansion
wwwiciscom
Asia PTA market to remain oversupplied
bull Demand expected to grow 6-7year capacity growth to
accelerate again in 2014
Source Industry
3
12
25
12
20
12
5
145
73 62 65 71 67 68
0
5
10
15
20
25
30
2010 2011 2012 2013 2014E 2015E 2016E
Gro
wth
rate
Asia PTA Supply vs Demand Growth
Supply growth rate Demand growth rate
wwwiciscom
Asia PX capacity growth peaks in 2013-2015
Data source Industry sources
bull Asiarsquos PX demand growth is expected to remain at 5-6 annually
bull Capacity growth forecast at 14-17 annually in 2013-2015 to decline to 5
in 2016 Supply growth acceleration to keep up with downstream capacities
9
2
17 15
14
5 8
5
6 5 5 6
0
2
4
6
8
10
12
14
16
18
20
2011 2012 2013E 2014E 2015E 2016E
Gro
wth
rate
Asia PX Supply vs Demand Growth
Supply growth rate Demand growth rate
wwwiciscom
455
507
592
663
703 736
+12 +8 +7 +6 +6 +5
85
82
76
72 72
73
60
65
70
75
80
85
90
0
20
40
60
80
2010 2011 2012 2013 2014 2015
Operating rates
Unit million tonnesyear
Asia polyester capacity Asia polyester production Utilisation rates
Polyester operating rates to lower
wwwiciscom
Asia PTA plants to run at lower operating rates
Source Industry
bull PTA capacity reached 605m tonnesyear in 2013 up by
12 from 2012 after a 25 growth in 2012
bull Continued expansions will lower operating rates further
91
77 73
66 63
64
55
70
85
100
0
20
40
60
80
100
2010 2011 2012 2013 2014E 2015E
Op
erati
ng
rate
s
Un
it
millio
n t
on
nes
year
Asia and Middle East PTA Capacity Expansion
PTA capacity PTA operating rates
wwwiciscom
96 95 98
89
82 76 76
0
20
40
60
80
100
120
0
5
10
15
20
25
30
35
40
45
50
2010 2011 2012 2013 2014E 2015E 2016E
Op
erati
ng
rate
s
Un
it
millio
n t
on
nes
year
Asia PX Plants Operating Rate
Asia PX capacity Asia PX OR
To balance supplydemand conditions
wwwiciscom
A Fundamentally Short Market To Turn Long
0
5000
10000
15000
20000
25000
0
10000
20000
30000
40000
50000
60000
2013E 2014E 2015E 2016E
Bala
nce
Un
it
00
0 t
on
nes
year
Un
it
00
0 t
on
nes
year
Year
PX Effective Demand amp Supply In Asia
Effective PX supply Effective PX demand Balance
wwwiciscom
Challenges Ahead
China to continue to Be the driving force for Asia In 2013 East Asia and Pacific region marked a growth of 72 Overall growth in the region expected to stay flat at 72 in 2014 China expected to grow at 75 New PX capacities to lighten tight supply burden
Moderation of economic activity from Indonesia Malaysia and Thailand because of weak commodity revenues and policy tightening Credit tightening and banks in China restrict cash-flows Non-integrated facilities to face high costs pressure might be forced to shut
Tailwinds Headwinds
wwwiciscom
The Polyester Chain Expansions
wwwiciscom
PX capacity expansion to accelerate in Asia
Source Industry
wwwiciscom
PTA capacity expansion continues in Asia
Source Industry
wwwiciscom
Source Industry
Polyester capacity expansion continues in Asia
wwwiciscom
China Import PX Stats
0 500000 1000000 1500000 2000000 2500000 3000000
S Korea
Japan
Taiwan
SE Asia
Middle East
Others
India
2012 2013
wwwiciscom
CHINA Imp 2743
KOREA Exp 3941
JAPAN Exp 119
TAIWAN Exp 580
INDIA Imp 852
SE ASIA Imp 350
Exp 1100
MIDDLE EAST Imp560
EU (incl Turkey) Exp 650 Imp 370
Asia PTA 2013 Trade Flow
220kt 188kt
23kt
390kt
81kt
380kt
12kt
7kt 170kt
1800kt
wwwiciscom
0
20
40
60
80
100
0
1000
2000
3000
4000
5000
6000
7000
8000
2013 2014E 2015E 2016E 2017E
South Korea Expected Operating Rates
CAPACITY PRODUCTION DEMAND EXPORT OR
0 200 400 600 800 1000 1200 1400 1600 1800 2000
2013
2014E
2015E
2016E
2017E
South Korea Expected Exports
OTHERS TURKEY INDIA CHINA
Will South Korea Follow Taiwanrsquos Strategy
wwwiciscom
Market Outlook
wwwiciscom
End-users
Asia PX price trend outlook
PX 2014 Contract
bull In China term contracts were fixed mostly at flat to a premium of $3tonne based on a 50 ACP 50 CFR quotes formula
bull Contracts were largely fixed at a premium of $7-9tonne in 2013
bull Since the start of 2014 there have been 3 breaks in the PX ACP
PX Spot Prices
Supply and Demand
wwwiciscom
End-users
PX 2014 Contract
PX Spot Prices
bull NaphthaPX spread to be lowered from highs of $500tonne to estimates of $250-260tonne in 2014
bull MXPX spread to remain below the breakeven point estimated at $150-160tonne in 2014
bull Strong uptrend to be limited
Supply and Demand
Asia PX price trend outlook
wwwiciscom
End-users
PX 2014 Contract
PX Spot Prices
Supply and Demand
bull Market dynamics to shift from fundamentally short to balanced-to-long
bull China to remain key importer with imports per month expected to increased to around 800000-850000 tonnes
bull India to be in an export position following OMPL start-up
Asia PX price trend outlook
wwwiciscom
End-users
Asia PTA price trend outlook
PTA 2014 Term
bull PTA makers continue to push for PX-linked formula contracts to mitigate losses
PTA Spot Prices
Supply and Demand
wwwiciscom
End-users
PTA 2014 Term
PTA Spot Prices
bull Inventories to remain high in China
bull Despite huge influx of PX capacities PTA prices under pressure
bull PX-PTA margins estimated at $80-90tonne
Supply and Demand
Asia PTA price trend outlook
wwwiciscom
End-users
PTA 2014 Term
PTA Spot Prices
Supply and Demand
bull PTA expansion continues market to remain oversupplied
bull China PTA makers to push cargoes out from the country
bull Supply growth to continue to outstrip demand growth
Asia PTA price trend outlook
wwwiciscom
ICIS has the expertise to support you ndash from the latest news and trading prices to long-term forecasts
Pricing information Reliable price assessments and analyses for the polyester chain including price history enabling you to understand price drivers and to settle your contract prices more confidently
Real-time news service Breaking news and analyses across the global polyester chain Be the first to find out about market-moving news including production updates plant capacities output and shutdowns
Supply and demand data Access data on supply and demand imports and exports as well as production capacity for the global markets over a 6-11 year time span Online interface is customisable enabling you to create a view of trade patterns according to your needs
In-depth market analysis Our expert insight delivers the information and data you need to understand short mid- and long-term trends (up until 2025) as well as informed commentary and analysis on the market outlook ndash all of which enables you to plan for the future with confidence
Request your free sample price report today gtgt
Request your free trial today gtgt
Read more about ICIS supply and demand data gtgt
Read more about our in-depth analysis services gtgt

wwwiciscom
Asia PX capacity growth peaks in 2013-2015
Data source Industry sources
bull Asiarsquos PX demand growth is expected to remain at 5-6 annually
bull Capacity growth forecast at 14-17 annually in 2013-2015 to decline to 5
in 2016 Supply growth acceleration to keep up with downstream capacities
9
2
17 15
14
5 8
5
6 5 5 6
0
2
4
6
8
10
12
14
16
18
20
2011 2012 2013E 2014E 2015E 2016E
Gro
wth
rate
Asia PX Supply vs Demand Growth
Supply growth rate Demand growth rate
wwwiciscom
455
507
592
663
703 736
+12 +8 +7 +6 +6 +5
85
82
76
72 72
73
60
65
70
75
80
85
90
0
20
40
60
80
2010 2011 2012 2013 2014 2015
Operating rates
Unit million tonnesyear
Asia polyester capacity Asia polyester production Utilisation rates
Polyester operating rates to lower
wwwiciscom
Asia PTA plants to run at lower operating rates
Source Industry
bull PTA capacity reached 605m tonnesyear in 2013 up by
12 from 2012 after a 25 growth in 2012
bull Continued expansions will lower operating rates further
91
77 73
66 63
64
55
70
85
100
0
20
40
60
80
100
2010 2011 2012 2013 2014E 2015E
Op
erati
ng
rate
s
Un
it
millio
n t
on
nes
year
Asia and Middle East PTA Capacity Expansion
PTA capacity PTA operating rates
wwwiciscom
96 95 98
89
82 76 76
0
20
40
60
80
100
120
0
5
10
15
20
25
30
35
40
45
50
2010 2011 2012 2013 2014E 2015E 2016E
Op
erati
ng
rate
s
Un
it
millio
n t
on
nes
year
Asia PX Plants Operating Rate
Asia PX capacity Asia PX OR
To balance supplydemand conditions
wwwiciscom
A Fundamentally Short Market To Turn Long
0
5000
10000
15000
20000
25000
0
10000
20000
30000
40000
50000
60000
2013E 2014E 2015E 2016E
Bala
nce
Un
it
00
0 t
on
nes
year
Un
it
00
0 t
on
nes
year
Year
PX Effective Demand amp Supply In Asia
Effective PX supply Effective PX demand Balance
wwwiciscom
Challenges Ahead
China to continue to Be the driving force for Asia In 2013 East Asia and Pacific region marked a growth of 72 Overall growth in the region expected to stay flat at 72 in 2014 China expected to grow at 75 New PX capacities to lighten tight supply burden
Moderation of economic activity from Indonesia Malaysia and Thailand because of weak commodity revenues and policy tightening Credit tightening and banks in China restrict cash-flows Non-integrated facilities to face high costs pressure might be forced to shut
Tailwinds Headwinds
wwwiciscom
The Polyester Chain Expansions
wwwiciscom
PX capacity expansion to accelerate in Asia
Source Industry
wwwiciscom
PTA capacity expansion continues in Asia
Source Industry
wwwiciscom
Source Industry
Polyester capacity expansion continues in Asia
wwwiciscom
China Import PX Stats
0 500000 1000000 1500000 2000000 2500000 3000000
S Korea
Japan
Taiwan
SE Asia
Middle East
Others
India
2012 2013
wwwiciscom
CHINA Imp 2743
KOREA Exp 3941
JAPAN Exp 119
TAIWAN Exp 580
INDIA Imp 852
SE ASIA Imp 350
Exp 1100
MIDDLE EAST Imp560
EU (incl Turkey) Exp 650 Imp 370
Asia PTA 2013 Trade Flow
220kt 188kt
23kt
390kt
81kt
380kt
12kt
7kt 170kt
1800kt
wwwiciscom
0
20
40
60
80
100
0
1000
2000
3000
4000
5000
6000
7000
8000
2013 2014E 2015E 2016E 2017E
South Korea Expected Operating Rates
CAPACITY PRODUCTION DEMAND EXPORT OR
0 200 400 600 800 1000 1200 1400 1600 1800 2000
2013
2014E
2015E
2016E
2017E
South Korea Expected Exports
OTHERS TURKEY INDIA CHINA
Will South Korea Follow Taiwanrsquos Strategy
wwwiciscom
Market Outlook
wwwiciscom
End-users
Asia PX price trend outlook
PX 2014 Contract
bull In China term contracts were fixed mostly at flat to a premium of $3tonne based on a 50 ACP 50 CFR quotes formula
bull Contracts were largely fixed at a premium of $7-9tonne in 2013
bull Since the start of 2014 there have been 3 breaks in the PX ACP
PX Spot Prices
Supply and Demand
wwwiciscom
End-users
PX 2014 Contract
PX Spot Prices
bull NaphthaPX spread to be lowered from highs of $500tonne to estimates of $250-260tonne in 2014
bull MXPX spread to remain below the breakeven point estimated at $150-160tonne in 2014
bull Strong uptrend to be limited
Supply and Demand
Asia PX price trend outlook
wwwiciscom
End-users
PX 2014 Contract
PX Spot Prices
Supply and Demand
bull Market dynamics to shift from fundamentally short to balanced-to-long
bull China to remain key importer with imports per month expected to increased to around 800000-850000 tonnes
bull India to be in an export position following OMPL start-up
Asia PX price trend outlook
wwwiciscom
End-users
Asia PTA price trend outlook
PTA 2014 Term
bull PTA makers continue to push for PX-linked formula contracts to mitigate losses
PTA Spot Prices
Supply and Demand
wwwiciscom
End-users
PTA 2014 Term
PTA Spot Prices
bull Inventories to remain high in China
bull Despite huge influx of PX capacities PTA prices under pressure
bull PX-PTA margins estimated at $80-90tonne
Supply and Demand
Asia PTA price trend outlook
wwwiciscom
End-users
PTA 2014 Term
PTA Spot Prices
Supply and Demand
bull PTA expansion continues market to remain oversupplied
bull China PTA makers to push cargoes out from the country
bull Supply growth to continue to outstrip demand growth
Asia PTA price trend outlook
wwwiciscom
ICIS has the expertise to support you ndash from the latest news and trading prices to long-term forecasts
Pricing information Reliable price assessments and analyses for the polyester chain including price history enabling you to understand price drivers and to settle your contract prices more confidently
Real-time news service Breaking news and analyses across the global polyester chain Be the first to find out about market-moving news including production updates plant capacities output and shutdowns
Supply and demand data Access data on supply and demand imports and exports as well as production capacity for the global markets over a 6-11 year time span Online interface is customisable enabling you to create a view of trade patterns according to your needs
In-depth market analysis Our expert insight delivers the information and data you need to understand short mid- and long-term trends (up until 2025) as well as informed commentary and analysis on the market outlook ndash all of which enables you to plan for the future with confidence
Request your free sample price report today gtgt
Request your free trial today gtgt
Read more about ICIS supply and demand data gtgt
Read more about our in-depth analysis services gtgt
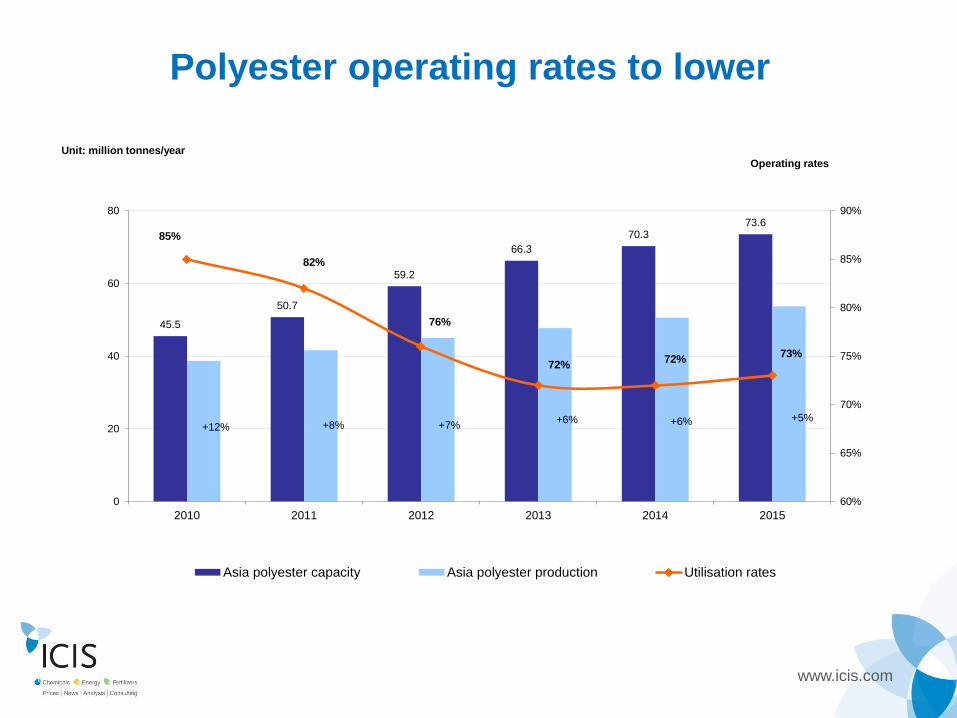
wwwiciscom
PX capacity expansion to accelerate in Asia
Source Industry
wwwiciscom
PTA capacity expansion continues in Asia
Source Industry
wwwiciscom
Source Industry
Polyester capacity expansion continues in Asia
wwwiciscom
China Import PX Stats
0 500000 1000000 1500000 2000000 2500000 3000000
S Korea
Japan
Taiwan
SE Asia
Middle East
Others
India
2012 2013
wwwiciscom
CHINA Imp 2743
KOREA Exp 3941
JAPAN Exp 119
TAIWAN Exp 580
INDIA Imp 852
SE ASIA Imp 350
Exp 1100
MIDDLE EAST Imp560
EU (incl Turkey) Exp 650 Imp 370
Asia PTA 2013 Trade Flow
220kt 188kt
23kt
390kt
81kt
380kt
12kt
7kt 170kt
1800kt
wwwiciscom
0
20
40
60
80
100
0
1000
2000
3000
4000
5000
6000
7000
8000
2013 2014E 2015E 2016E 2017E
South Korea Expected Operating Rates
CAPACITY PRODUCTION DEMAND EXPORT OR
0 200 400 600 800 1000 1200 1400 1600 1800 2000
2013
2014E
2015E
2016E
2017E
South Korea Expected Exports
OTHERS TURKEY INDIA CHINA
Will South Korea Follow Taiwanrsquos Strategy
wwwiciscom
Market Outlook
wwwiciscom
End-users
Asia PX price trend outlook
PX 2014 Contract
bull In China term contracts were fixed mostly at flat to a premium of $3tonne based on a 50 ACP 50 CFR quotes formula
bull Contracts were largely fixed at a premium of $7-9tonne in 2013
bull Since the start of 2014 there have been 3 breaks in the PX ACP
PX Spot Prices
Supply and Demand
wwwiciscom
End-users
PX 2014 Contract
PX Spot Prices
bull NaphthaPX spread to be lowered from highs of $500tonne to estimates of $250-260tonne in 2014
bull MXPX spread to remain below the breakeven point estimated at $150-160tonne in 2014
bull Strong uptrend to be limited
Supply and Demand
Asia PX price trend outlook
wwwiciscom
End-users
PX 2014 Contract
PX Spot Prices
Supply and Demand
bull Market dynamics to shift from fundamentally short to balanced-to-long
bull China to remain key importer with imports per month expected to increased to around 800000-850000 tonnes
bull India to be in an export position following OMPL start-up
Asia PX price trend outlook
wwwiciscom
End-users
Asia PTA price trend outlook
PTA 2014 Term
bull PTA makers continue to push for PX-linked formula contracts to mitigate losses
PTA Spot Prices
Supply and Demand
wwwiciscom
End-users
PTA 2014 Term
PTA Spot Prices
bull Inventories to remain high in China
bull Despite huge influx of PX capacities PTA prices under pressure
bull PX-PTA margins estimated at $80-90tonne
Supply and Demand
Asia PTA price trend outlook
wwwiciscom
End-users
PTA 2014 Term
PTA Spot Prices
Supply and Demand
bull PTA expansion continues market to remain oversupplied
bull China PTA makers to push cargoes out from the country
bull Supply growth to continue to outstrip demand growth
Asia PTA price trend outlook
wwwiciscom
ICIS has the expertise to support you ndash from the latest news and trading prices to long-term forecasts
Pricing information Reliable price assessments and analyses for the polyester chain including price history enabling you to understand price drivers and to settle your contract prices more confidently
Real-time news service Breaking news and analyses across the global polyester chain Be the first to find out about market-moving news including production updates plant capacities output and shutdowns
Supply and demand data Access data on supply and demand imports and exports as well as production capacity for the global markets over a 6-11 year time span Online interface is customisable enabling you to create a view of trade patterns according to your needs
In-depth market analysis Our expert insight delivers the information and data you need to understand short mid- and long-term trends (up until 2025) as well as informed commentary and analysis on the market outlook ndash all of which enables you to plan for the future with confidence
Request your free sample price report today gtgt
Request your free trial today gtgt
Read more about ICIS supply and demand data gtgt
Read more about our in-depth analysis services gtgt
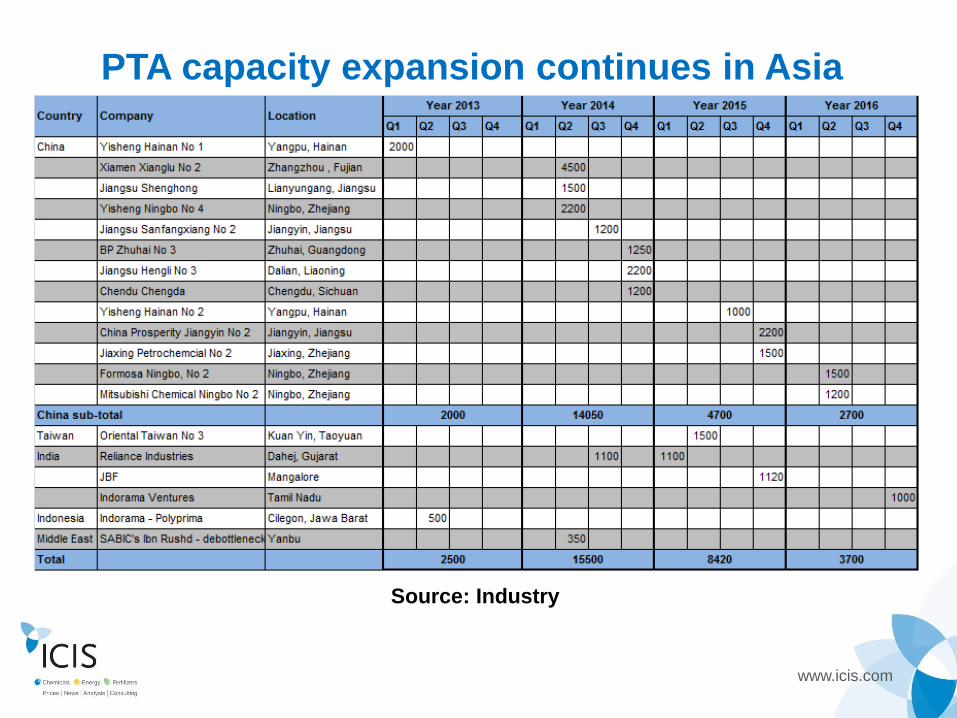
wwwiciscom
0
20
40
60
80
100
0
1000
2000
3000
4000
5000
6000
7000
8000
2013 2014E 2015E 2016E 2017E
South Korea Expected Operating Rates
CAPACITY PRODUCTION DEMAND EXPORT OR
0 200 400 600 800 1000 1200 1400 1600 1800 2000
2013
2014E
2015E
2016E
2017E
South Korea Expected Exports
OTHERS TURKEY INDIA CHINA
Will South Korea Follow Taiwanrsquos Strategy
wwwiciscom
Market Outlook
wwwiciscom
End-users
Asia PX price trend outlook
PX 2014 Contract
bull In China term contracts were fixed mostly at flat to a premium of $3tonne based on a 50 ACP 50 CFR quotes formula
bull Contracts were largely fixed at a premium of $7-9tonne in 2013
bull Since the start of 2014 there have been 3 breaks in the PX ACP
PX Spot Prices
Supply and Demand
wwwiciscom
End-users
PX 2014 Contract
PX Spot Prices
bull NaphthaPX spread to be lowered from highs of $500tonne to estimates of $250-260tonne in 2014
bull MXPX spread to remain below the breakeven point estimated at $150-160tonne in 2014
bull Strong uptrend to be limited
Supply and Demand
Asia PX price trend outlook
wwwiciscom
End-users
PX 2014 Contract
PX Spot Prices
Supply and Demand
bull Market dynamics to shift from fundamentally short to balanced-to-long
bull China to remain key importer with imports per month expected to increased to around 800000-850000 tonnes
bull India to be in an export position following OMPL start-up
Asia PX price trend outlook
wwwiciscom
End-users
Asia PTA price trend outlook
PTA 2014 Term
bull PTA makers continue to push for PX-linked formula contracts to mitigate losses
PTA Spot Prices
Supply and Demand
wwwiciscom
End-users
PTA 2014 Term
PTA Spot Prices
bull Inventories to remain high in China
bull Despite huge influx of PX capacities PTA prices under pressure
bull PX-PTA margins estimated at $80-90tonne
Supply and Demand
Asia PTA price trend outlook
wwwiciscom
End-users
PTA 2014 Term
PTA Spot Prices
Supply and Demand
bull PTA expansion continues market to remain oversupplied
bull China PTA makers to push cargoes out from the country
bull Supply growth to continue to outstrip demand growth
Asia PTA price trend outlook
wwwiciscom
ICIS has the expertise to support you ndash from the latest news and trading prices to long-term forecasts
Pricing information Reliable price assessments and analyses for the polyester chain including price history enabling you to understand price drivers and to settle your contract prices more confidently
Real-time news service Breaking news and analyses across the global polyester chain Be the first to find out about market-moving news including production updates plant capacities output and shutdowns
Supply and demand data Access data on supply and demand imports and exports as well as production capacity for the global markets over a 6-11 year time span Online interface is customisable enabling you to create a view of trade patterns according to your needs
In-depth market analysis Our expert insight delivers the information and data you need to understand short mid- and long-term trends (up until 2025) as well as informed commentary and analysis on the market outlook ndash all of which enables you to plan for the future with confidence
Request your free sample price report today gtgt
Request your free trial today gtgt
Read more about ICIS supply and demand data gtgt
Read more about our in-depth analysis services gtgt

wwwiciscom
End-users
Asia PX price trend outlook
PX 2014 Contract
bull In China term contracts were fixed mostly at flat to a premium of $3tonne based on a 50 ACP 50 CFR quotes formula
bull Contracts were largely fixed at a premium of $7-9tonne in 2013
bull Since the start of 2014 there have been 3 breaks in the PX ACP
PX Spot Prices
Supply and Demand
wwwiciscom
End-users
PX 2014 Contract
PX Spot Prices
bull NaphthaPX spread to be lowered from highs of $500tonne to estimates of $250-260tonne in 2014
bull MXPX spread to remain below the breakeven point estimated at $150-160tonne in 2014
bull Strong uptrend to be limited
Supply and Demand
Asia PX price trend outlook
wwwiciscom
End-users
PX 2014 Contract
PX Spot Prices
Supply and Demand
bull Market dynamics to shift from fundamentally short to balanced-to-long
bull China to remain key importer with imports per month expected to increased to around 800000-850000 tonnes
bull India to be in an export position following OMPL start-up
Asia PX price trend outlook
wwwiciscom
End-users
Asia PTA price trend outlook
PTA 2014 Term
bull PTA makers continue to push for PX-linked formula contracts to mitigate losses
PTA Spot Prices
Supply and Demand
wwwiciscom
End-users
PTA 2014 Term
PTA Spot Prices
bull Inventories to remain high in China
bull Despite huge influx of PX capacities PTA prices under pressure
bull PX-PTA margins estimated at $80-90tonne
Supply and Demand
Asia PTA price trend outlook
wwwiciscom
End-users
PTA 2014 Term
PTA Spot Prices
Supply and Demand
bull PTA expansion continues market to remain oversupplied
bull China PTA makers to push cargoes out from the country
bull Supply growth to continue to outstrip demand growth
Asia PTA price trend outlook
wwwiciscom
ICIS has the expertise to support you ndash from the latest news and trading prices to long-term forecasts
Pricing information Reliable price assessments and analyses for the polyester chain including price history enabling you to understand price drivers and to settle your contract prices more confidently
Real-time news service Breaking news and analyses across the global polyester chain Be the first to find out about market-moving news including production updates plant capacities output and shutdowns
Supply and demand data Access data on supply and demand imports and exports as well as production capacity for the global markets over a 6-11 year time span Online interface is customisable enabling you to create a view of trade patterns according to your needs
In-depth market analysis Our expert insight delivers the information and data you need to understand short mid- and long-term trends (up until 2025) as well as informed commentary and analysis on the market outlook ndash all of which enables you to plan for the future with confidence
Request your free sample price report today gtgt
Request your free trial today gtgt
Read more about ICIS supply and demand data gtgt
Read more about our in-depth analysis services gtgt

wwwiciscom
End-users
PX 2014 Contract
PX Spot Prices
Supply and Demand
bull Market dynamics to shift from fundamentally short to balanced-to-long
bull China to remain key importer with imports per month expected to increased to around 800000-850000 tonnes
bull India to be in an export position following OMPL start-up
Asia PX price trend outlook
wwwiciscom
End-users
Asia PTA price trend outlook
PTA 2014 Term
bull PTA makers continue to push for PX-linked formula contracts to mitigate losses
PTA Spot Prices
Supply and Demand
wwwiciscom
End-users
PTA 2014 Term
PTA Spot Prices
bull Inventories to remain high in China
bull Despite huge influx of PX capacities PTA prices under pressure
bull PX-PTA margins estimated at $80-90tonne
Supply and Demand
Asia PTA price trend outlook
wwwiciscom
End-users
PTA 2014 Term
PTA Spot Prices
Supply and Demand
bull PTA expansion continues market to remain oversupplied
bull China PTA makers to push cargoes out from the country
bull Supply growth to continue to outstrip demand growth
Asia PTA price trend outlook
wwwiciscom
ICIS has the expertise to support you ndash from the latest news and trading prices to long-term forecasts
Pricing information Reliable price assessments and analyses for the polyester chain including price history enabling you to understand price drivers and to settle your contract prices more confidently
Real-time news service Breaking news and analyses across the global polyester chain Be the first to find out about market-moving news including production updates plant capacities output and shutdowns
Supply and demand data Access data on supply and demand imports and exports as well as production capacity for the global markets over a 6-11 year time span Online interface is customisable enabling you to create a view of trade patterns according to your needs
In-depth market analysis Our expert insight delivers the information and data you need to understand short mid- and long-term trends (up until 2025) as well as informed commentary and analysis on the market outlook ndash all of which enables you to plan for the future with confidence
Request your free sample price report today gtgt
Request your free trial today gtgt
Read more about ICIS supply and demand data gtgt
Read more about our in-depth analysis services gtgt

wwwiciscom
End-users
Asia PTA price trend outlook
PTA 2014 Term
bull PTA makers continue to push for PX-linked formula contracts to mitigate losses
PTA Spot Prices
Supply and Demand
wwwiciscom
End-users
PTA 2014 Term
PTA Spot Prices
bull Inventories to remain high in China
bull Despite huge influx of PX capacities PTA prices under pressure
bull PX-PTA margins estimated at $80-90tonne
Supply and Demand
Asia PTA price trend outlook
wwwiciscom
End-users
PTA 2014 Term
PTA Spot Prices
Supply and Demand
bull PTA expansion continues market to remain oversupplied
bull China PTA makers to push cargoes out from the country
bull Supply growth to continue to outstrip demand growth
Asia PTA price trend outlook
wwwiciscom
ICIS has the expertise to support you ndash from the latest news and trading prices to long-term forecasts
Pricing information Reliable price assessments and analyses for the polyester chain including price history enabling you to understand price drivers and to settle your contract prices more confidently
Real-time news service Breaking news and analyses across the global polyester chain Be the first to find out about market-moving news including production updates plant capacities output and shutdowns
Supply and demand data Access data on supply and demand imports and exports as well as production capacity for the global markets over a 6-11 year time span Online interface is customisable enabling you to create a view of trade patterns according to your needs
In-depth market analysis Our expert insight delivers the information and data you need to understand short mid- and long-term trends (up until 2025) as well as informed commentary and analysis on the market outlook ndash all of which enables you to plan for the future with confidence
Request your free sample price report today gtgt
Request your free trial today gtgt
Read more about ICIS supply and demand data gtgt
Read more about our in-depth analysis services gtgt

wwwiciscom
End-users
PTA 2014 Term
PTA Spot Prices
Supply and Demand
bull PTA expansion continues market to remain oversupplied
bull China PTA makers to push cargoes out from the country
bull Supply growth to continue to outstrip demand growth
Asia PTA price trend outlook
wwwiciscom
ICIS has the expertise to support you ndash from the latest news and trading prices to long-term forecasts
Pricing information Reliable price assessments and analyses for the polyester chain including price history enabling you to understand price drivers and to settle your contract prices more confidently
Real-time news service Breaking news and analyses across the global polyester chain Be the first to find out about market-moving news including production updates plant capacities output and shutdowns
Supply and demand data Access data on supply and demand imports and exports as well as production capacity for the global markets over a 6-11 year time span Online interface is customisable enabling you to create a view of trade patterns according to your needs
In-depth market analysis Our expert insight delivers the information and data you need to understand short mid- and long-term trends (up until 2025) as well as informed commentary and analysis on the market outlook ndash all of which enables you to plan for the future with confidence
Request your free sample price report today gtgt
Request your free trial today gtgt
Read more about ICIS supply and demand data gtgt
Read more about our in-depth analysis services gtgt

wwwiciscom
ICIS has the expertise to support you ndash from the latest news and trading prices to long-term forecasts
Pricing information Reliable price assessments and analyses for the polyester chain including price history enabling you to understand price drivers and to settle your contract prices more confidently
Real-time news service Breaking news and analyses across the global polyester chain Be the first to find out about market-moving news including production updates plant capacities output and shutdowns
Supply and demand data Access data on supply and demand imports and exports as well as production capacity for the global markets over a 6-11 year time span Online interface is customisable enabling you to create a view of trade patterns according to your needs
In-depth market analysis Our expert insight delivers the information and data you need to understand short mid- and long-term trends (up until 2025) as well as informed commentary and analysis on the market outlook ndash all of which enables you to plan for the future with confidence
Request your free sample price report today gtgt
Request your free trial today gtgt
Read more about ICIS supply and demand data gtgt
Read more about our in-depth analysis services gtgt