asia pacific marine generator sets market - is the mature shipbuilding industry stagnating market...
TRANSCRIPT

Asia Pacific Marine Generator Sets Market - Is the Mature Shipbuilding Industry Stagnating
Market Growth?
Subha KrishnanResearch Analyst - Energy and Power Systems, Asia PacificSeptember 2011

2
Market Summary
• Customers prefer locally packaged generator sets. They prefer to buy engines of well known brands and choose cost-effective generator sets from local participants so as to reduce the overall purchase price of the unit
• Low-cost imports from China exerts severe pressure on the price trends of domestic manufacturers
• Original equipment manufacturers (OEMs) are likely to introduce hybrid generator sets (battery operated) by 2020
• Demand for multiple units of small power output capacity generator sets are likely to increase during the forecast period
• Sustainable demand from commercial vessel customer segment is guaranteed in Southeast Asia as its economy largely depends on imports and exports
• The demand pattern in the marine generator sets market varies significantly between the Asia Pacific countries as they are directly affected by the development of shipbuilding industry and the economic factors in the region
• Marine generator sets < 500 kW power output capacity dominate the market in terms of both volume and revenues and is likely to remain so during the forecast period

3
Southeast Asia Marine Generator Sets Market

4
Drivers and Restraints M
arke
t D
rive
rsM
arke
t R
estr
ain
ts
1-2 years
3-5 years
Growing needs of the shipbuilding industry
Demand from commercial segment drives demand for use of generator set
Competition from Chinese brands acts as a market entry barrier for local companies
Replacement market opportunities
Flat demand from pleasure vessels segment due to increase in price
Impact: High Medium Low
Marine Generator Sets Market: Key Market Drivers and Restraints, Southeast Asia, 2011-2015
Source: Frost & Sullivan analysis.

5
Note: All figures are rounded. The base year is 2010. Source: Frost & Sullivan analysis.
Marine Generator Sets Market Revenue Forecast
Marine Generator Sets Market Revenue Forecast,Southeast Asia, 2008-2015
CAGR = 4.9%
0
50
100
150
200
250
300
350
400
Year
Re
ve
nu
e ($
Mill
ion
)
(4.0)
(2.0)
0.0
2.0
4.0
6.0
8.0
Gro
wth
Ra
te (
%)
Revenue 268.0 264.0 266.1 274.4 285.1 298.7 315.8 337.2
Growth Rate
(1.5) 2.0 3.1 3.9 4.8 5.7 6.8
2008 2009 2010 2011 2012 2013 2014 2015

6
Marine Generator Set Market Revenue Forecast—By Power Output Type
Marine Generator Sets Market: Revenue Forecast by Power Output Type, Southeast Asia, 2010 and 2015
0%
20%
40%
60%
80%
100%
Year
Re
ve
nu
e (
%)
1,001-3,000 kW 26.6 32.0
501-1,000 kW 26.6 32.7
< 500 kW 212.8 273.1
2010 2015
CAGR 5.1 %
CAGR 4.2%
CAGR 3.8%
Note: All figures are rounded. The base year is 2010. Source: Frost & Sullivan analysis.

7
Marine Generator Sets Market Percent Revenue Split—By Customer Type
Marine Generator Sets Market: Percent Revenue Split by Customer Type, Southeast Asia, 2010
Defense Vessels1.0%
Commercial Vessels51.0%
Pleasure Vessels 48.0%
Note: All figures are rounded. The base year is 2010. Source: Frost & Sullivan analysis.

8
Competitive Analysis—Market Share
Percent of SalesMarine Generator Sets Market: Southeast Asia, 2010
Others*29.0%
YANMAR Co10.0% Cummins Inc
29.0%
Caterpillar32.0%
Note: All figures are rounded. Base year is 2010. Source: Frost & Sullivan analysis.
* Others: MTU Detriot Diesel, Westerbeke Corp, Fischer Panda Marine, Local Participants

9
North Asia Marine Generator Sets Market

10
Drivers and Restraints M
arke
t D
rive
rsM
arke
t R
estr
ain
ts
1-2 years 3-5 years
Increased collaboration between shipyards and local equipment manufacturers
Increase in material prices after nuclear disaster
Government support
Impact of recession on the forecast period
High market entry barriers for new company
Impact: High Medium Low
Marine Generator Sets Market: Key Market Drivers and Restraints, North Asia, 2011-2015
Source: Frost & Sullivan analysis.
11
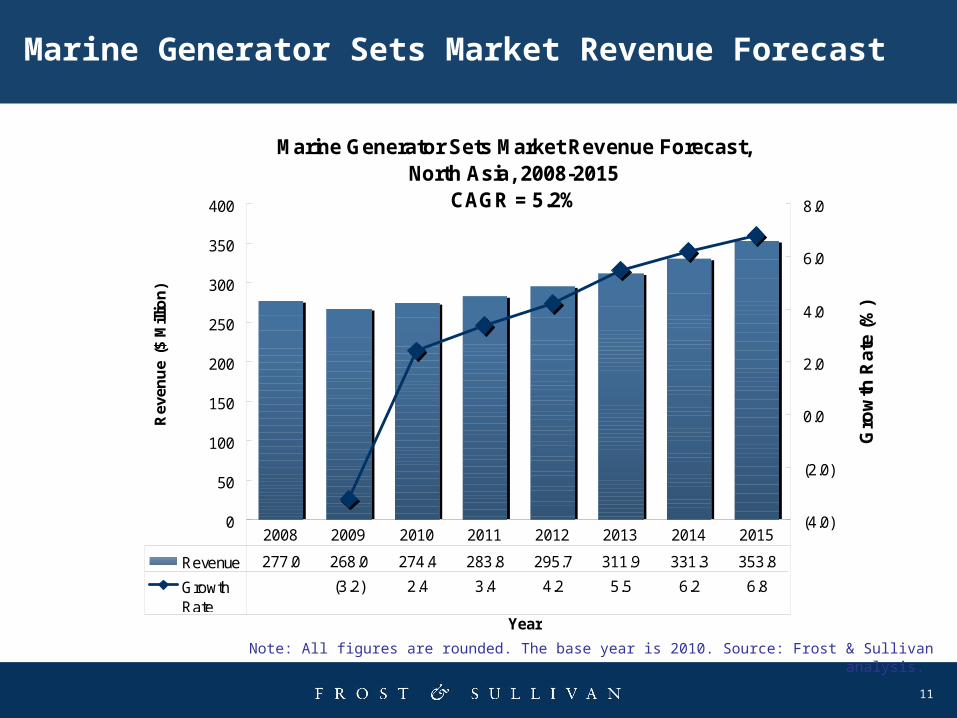
Note: All figures are rounded. The base year is 2010. Source: Frost & Sullivan analysis.
Marine Generator Sets Market Revenue Forecast
Marine Generator Sets Market Revenue Forecast,North Asia, 2008-2015
CAGR = 5.2%
0
50
100
150
200
250
300
350
400
Year
Rev
enu
e ($
Mill
ion
)
(4.0)
(2.0)
0.0
2.0
4.0
6.0
8.0
Gro
wth
Ra
te (
%)
Revenue 277.0 268.0 274.4 283.8 295.7 311.9 331.3 353.8
Growth Rate
(3.2) 2.4 3.4 4.2 5.5 6.2 6.8
2008 2009 2010 2011 2012 2013 2014 2015

12
Marine Generator Sets Market Revenue Forecast—By Power Output Type
Marine Generator Sets Market: Revenue Forecast by Power Output Type, North Asia, 2010 and 2015
0%
20%
40%
60%
80%
100%
Year
Re
ve
nu
e (
%)
1,001-3,000 kW 10.9 14.1
501-1,000 kW 27.4 37.1
< 500 kW 236.0 302.5
2010 2015
Note: All figures are rounded. The base year is 2010. Source: Frost & Sullivan analysis.
CAGR 5.1%
CAGR 5.1%
CAGR6.2%
CAGR6.2%
CAGR5.2%
CAGR5.2%

13
Marine Generator Set Market Percent Revenue Split—By Customer Type
Marine Generator Sets Market: Percent Revenue Split by Customer Type, North Asia, 2010
Defense Vessels8.0%
Commercial Vessels42.0%
Pleasure Vessels 50.0%
Note: All figures are rounded. The base year is 2010. Source: Frost & Sullivan analysis.
14
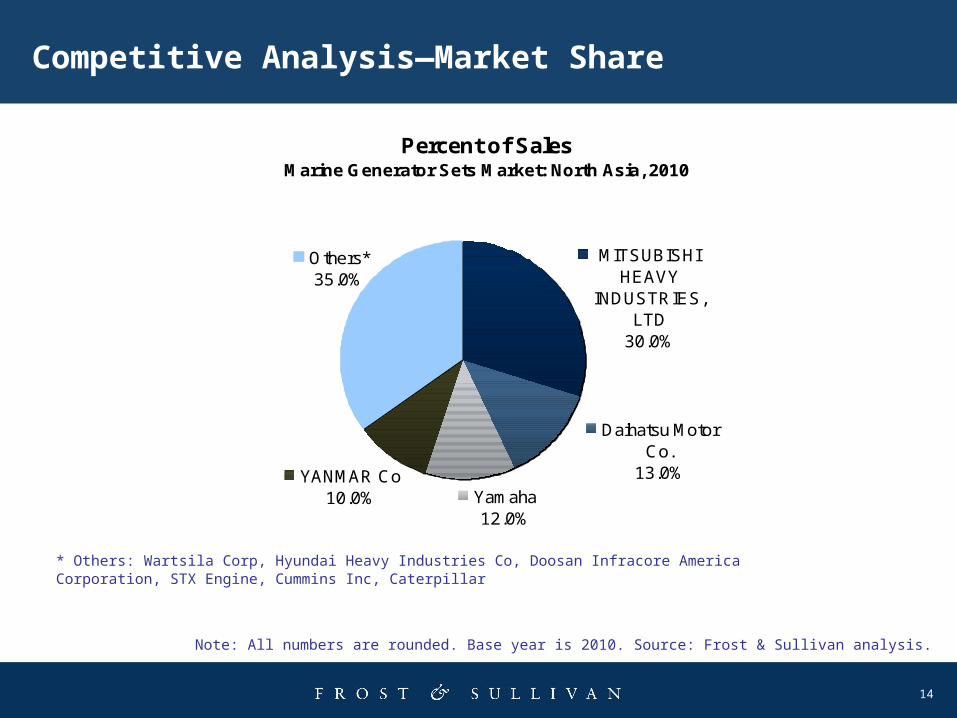
Competitive Analysis—Market Share
Percent of SalesMarine Generator Sets Market: North Asia, 2010
MITSUBISHI HEAVY
INDUSTRIES, LTD
30.0%
Daihatsu Motor Co.
13.0%
Others*35.0%
YANMAR Co10.0% Yamaha
12.0%
* Others: Wartsila Corp, Hyundai Heavy Industries Co, Doosan Infracore America Corporation, STX Engine, Cummins Inc, Caterpillar
Note: All numbers are rounded. Base year is 2010. Source: Frost & Sullivan analysis.

15
Australia/New Zealand Marine Generator Sets Market

16
Drivers and Restraints M
arke
t D
rive
rsM
arke
t R
estr
ain
ts
1-2 years 3-5 years
High replacement and after-sales demand
Weak shipbuilding industry
Impact: High Medium Low
Marine Generator Sets Market: Key Market Drivers and Restraints, ANZ, 2011-2015
Source: Frost & Sullivan analysis.
Demand from commercial vessel segment
Less demand from pleasure and defense vessel segments

17
Note: All figures are rounded. The base year is 2010. Source: Frost & Sullivan analysis.
Marine Generator Sets Market Revenue Forecast
Marine Generator Sets Market Revenue Forecast,ANZ, 2008-2015CAGR = 2.0%
0
2
4
6
8
10
12
14
16
Year
Re
ve
nu
e ($
Mill
ion
)
(4.0)
(2.0)
0.0
2.0
4.0
Gro
wth
Ra
te (
%)
Revenue 13.8 13.6 13.9 14.1 14.4 14.6 14.9 15.3
Growth Rate
(1.0) 1.4 1.8 1.8 1.9 2.1 2.2
2008 2009 2010 2011 2012 2013 2014 2015

18
Marine Generator Sets Market Revenue Forecast—By Power Output Type
Marine Generator Sets Market: Revenue Forecast by Power Output Type, ANZ, 2010 and 2015
0.0%
20.0%
40.0%
60.0%
80.0%
100.0%
Year
Re
ve
nu
e (
%)
501-1,000 kW 1.3 1.5
< 500 kW 12.4 13.7
2010 2015
Note: All figures are rounded. The base year is 2010. Source: Frost & Sullivan analysis.
CAGR 1.9%
CAGR 1.9%
CAGR 2.1%
CAGR 2.1%

19
Marine Generator Set Market Percent Revenue Split—By Customer Type
Marine Generator Sets Market: Percent Revenue Split by Customer Type, ANZ, 2010
Commercial Vessels42.0%
Pleasure Vessels58.0%
Note: All figures are rounded. The base year is 2010. Source: Frost & Sullivan analysis.

20
Competitive Analysis—Market Share
Percent of SalesMarine Generator Sets Market: ANZ, 2010
Kohler Power Systems25.0%
Cummins Inc25.0%
Others*30.0%
Caterpillar20.0%
* Others: Northern Lights, Inc, Westerbeke Corp, Lombardini Group, NanniDiesel, Fischer Panda Marine, Military And Vehicle Generators
Note: All figures are rounded. The base year is 2010. Source: Frost & Sullivan analysis.

21
http://twitter.com/frost_sullivan
Follow Frost & Sullivan on Facebook, LinkedIn, SlideShare, and Twitter
http://www.facebook.com/pages/Frost-Sullivan/249995031751?ref=ts
http://www.linkedin.com/companies/4506
http://www.slideshare.net/FrostandSullivan

22
For Additional Information
Donna JeremiahCorporate CommunicationsAsia Pacific+603 6204 [email protected]
Carrie LowCorporate CommunicationsAsia Pacific+603 6204 [email protected]
Subha Krishnan Research AnalystEnergy & Power [email protected]